the Creative Commons Attribution 4.0 License.
the Creative Commons Attribution 4.0 License.
 | 31 Jan 2025
Frequency anomalies and characteristics of extratropical cyclones during extremely wet, dry, windy, and calm seasons in the extratropics
Heini Wernli
Extreme meteorological seasons are highly relevant because of their severe impacts on many socioeconomic sectors. However, a global statistical characterisation of observed extreme seasons is challenging because at any specific location, very few such seasons occurred during the limited period with available reanalysis datasets. This study therefore uses 1050 years of present-day (1990–1999) climate simulations of the Community Earth System Model Large Ensemble (CESM-LE) and 71 years (1950–2020) of ERA5 reanalyses to systematically identify extremely wet, dry, windy, and calm seasons in the extratropics during winter and summer and to quantify the role of extratropical cyclones in their occurrence. Extreme seasons are defined as spatially coherent regions of extreme seasonal mean precipitation or near-surface wind. The results from the climate model and from ERA5 are mostly consistent, suggesting that the climate model captures the cyclone properties reasonably well. Compared to the climatology, extremely wet seasons are associated with positive anomalies in cyclone frequency in large parts of the extratropics. In the Southern Hemisphere (SH) storm track and at the downstream ends of the Northern Hemisphere (NH) storm tracks, cyclones contributing to wet winters are also anomalously intense and typically originate unusually far to the west and south, while in the subtropical North Atlantic and over the eastern Mediterranean, they are on average more stationary than in the climatology. Windy seasons are often associated with anomalously few but particularly intense cyclones, especially during winter. Positive anomalies in both cyclone frequency and intensity are found in the southern North Atlantic during winter, which suggests that windy winters in this region occur during southward shifts in the position of the main storm track. The patterns of dry and calm seasons mainly contrast with those of wet and windy seasons; i.e. they are often characterised by particularly few or weak cyclones or a combination thereof. In all four types of extreme seasons, there is remarkably large spatial and seasonal variability in the cyclone properties, especially over the continents. Overall, it can be concluded that (i) anomalies in the seasonal frequency and/or intensity distribution of extratropical cyclones are crucial for the occurrence of many extreme seasons in the extratropics and (ii) this link shows substantial geographical and seasonal variability.
- Article
(16165 KB) - Full-text XML
-
Supplement
(52415 KB) - BibTeX
- EndNote


Meteorological extreme events on the seasonal timescale can have severe social, environmental, and economic impacts. For instance, in the winter of 2013–2014, the United Kingdom (UK) and Ireland experienced extremely wet and windy conditions, which resulted in widespread flooding and damage to forests, infrastructure, transportation networks, and power supplies (Davies, 2015; Kendon and McCarthy, 2015). Another example is the dry and hot European summer of 2003, which was associated with increased mortality rates, reduced crop yields, forest damage, and increased prices for electricity (Fink et al., 2004). The integrated weather conditions over an entire season can negatively affect many socioeconomic sectors such as public health, agriculture, freshwater supply, energy production, tourism, and finance. Therefore, understanding the physical factors driving extreme meteorological seasons is of high relevance.
In contrast to seasonal extremes, isolated extreme events on timescales of a few minutes to several days have been studied extensively during the last decades. Single extreme precipitation events, for instance, have been shown to be related to a variety of weather systems, including extratropical cyclones (e.g. Kahana et al., 2002; Ulbrich et al., 2003; Kunkel et al., 2012; Grams et al., 2014), associated fronts (Catto and Pfahl, 2013) and warm conveyor belts (Browning, 1990; Pfahl et al., 2014); atmospheric rivers (Ralph et al., 2006; Lavers and Villarini, 2013); tropical moisture exports (Knippertz and Wernli, 2010; Knippertz et al., 2013); stratospheric potential vorticity streamers (e.g. Massacand et al., 1998; Martius et al., 2006) and cutoffs (e.g. Binder et al., 2021; Portmann et al., 2021; Röthlisberger et al., 2022); and mesoscale processes such as deep convection (Mohr et al., 2020; Rüdisühli et al., 2020) and orographic ascent (Rotunno and Houze, 2007; Colle et al., 2013). Often, extreme precipitation also results from the complex interplay between some of these weather systems. Among them, extratropical cyclones have been shown to be particularly important for generating extreme-weather conditions (e.g. Hawcroft et al., 2012; Pfahl and Wernli, 2012; Rüdisühli et al., 2020). In a climatological study based on reanalysis data, Pfahl and Wernli (2012) showed that a large fraction of 6-hourly extreme precipitation events coincides with extratropical cyclones in many regions of the world. Particularly high fractions were found in the storm track regions and in densely populated areas over the northeastern United States (US), the UK, and northern Europe; around the Mediterranean Sea; and in Japan. In addition, they showed that in the exit regions of the Northern Hemisphere (NH) storm tracks and in most of the Southern Hemisphere (SH) storm tracks, cyclones causing extreme precipitation events are slightly more intense than those that do not cause extreme precipitation. Over the ocean and flat terrain, extreme precipitation often occurs near the cyclone centre, where dynamical lifting is strong, while extreme precipitation close to topography is typically related to cyclones in more remote locations that direct the moist flow toward the mountains (Pfahl, 2014). Several studies also showed that multi-day precipitation extremes can be linked to a serial clustering of extratropical cyclones, in particular at the downstream end of the NH storm tracks (e.g. Moore et al., 2020; Röthlisberger et al., 2022).
Often, extratropical cyclones are also accompanied by extreme near-surface winds. Well-known examples are the Queen Elizabeth II storm in 1978 off the east coast of the US (Gyakum, 1983); the Great October Storm in the UK in 1987 (Hoskins and Berrisford, 1988); and the windstorms Anatol, Lothar, and Martin in December 1999 (Ulbrich et al., 2001; Wernli et al., 2002) in central Europe, whose intense winds all caused severe damage. High wind speeds can occur at different locations within extratropical cyclones (Parton et al., 2010; Dacre et al., 2012; Hewson and Neu, 2015; Earl et al., 2017; Raveh-Rubin, 2017; Eisenstein et al., 2023; Gentile and Gray, 2023): close to the cyclone centre in the cold conveyor belt; in the warm sector in the region of the warm conveyor belt; along the cold front co-located with convective precipitation; in the cold sector in the descending dry intrusion; and, in some cyclones, in sting jets, which are mesoscale descending airstreams at the tip of the cloud head of the bent-back front (Browning, 2004). In addition, strong near-surface winds can occur relatively far away from the cyclone centres in regions of pronounced surface pressure gradients, for instance between cyclones and blocking anticyclones (e.g. Pfahl, 2014) and over steep terrain related to orographic-flow phenomena (Zardi and Whiteman, 2012; Jackson et al., 2013).
So far, only a few studies have investigated the nature and meteorology of extremes on the seasonal timescale, with most of them focusing on single case studies (e.g. Namias, 1978; Fischer et al., 2007; Cattiaux et al., 2010; Dole et al., 2014; Davies, 2015). They highlighted the importance of both transient weather systems and longer-term climate variability to the occurrence of anomalous seasons. Chang et al. (2015) analysed California winter precipitation over 36 past winters and found strong correlations with extratropical cyclone activity over the eastern North Pacific. Recent extremely dry Californian winters were related to particularly low cyclone activity. In one of the first global climatological analyses, Flaounas et al. (2021) investigated extremely wet seasons in a 40-year period in ERA-Interim reanalyses and showed that they often occur due to an increased number of both wet days and daily precipitation extremes, with the number of wet days being particularly important in arid regions and the daily extremes being important in regions of frequent precipitation, such as the tropics. They showed that cyclones and warm conveyor belts are anomalously frequent during extremely wet seasons in many parts of the world but also that increased frequencies of tropical moisture exports and breaking Rossby waves can contribute to seasonal precipitation extremes in some areas. The frequency and the precipitation efficiency of different weather systems are both important for creating extreme seasonal precipitation (Zschenderlein and Wernli, 2022). Boettcher et al. (2023) applied a recently developed approach for detecting extreme seasons (Röthlisberger et al., 2021) to 70 years of ERA5 reanalyses in order to globally identify extremely windy and calm, hot and cold, and wet and dry seasons as spatially coherent regions with extreme seasonal mean values of near-surface wind, temperature, or precipitation. They investigated the top-50 extreme seasons of each type and for each of the four seasons in the extratropics and showed that extremely dry seasons are on average associated with relatively few and weak cyclones, while extremely wet seasons are associated with many but not particularly intense cyclones. Extremely calm seasons exhibit slightly negative cyclone frequency anomalies, but the cyclones are rather intense, while windy seasons are associated with positive anomalies in terms of frequency and especially intensity. However, the patterns become less robust when only considering the top-10 extreme seasons of each type, suggesting substantial case-by-case and regional variability. This indicates that further research is needed to understand the importance of cyclones and their characteristics on the occurrence of extreme seasons in different regions of the world. In particular, for statistically robust statements about the meteorology of extreme seasons everywhere in the extratropics, much longer datasets than those available from reanalyses are needed to yield a sufficiently large number of extreme seasonal values at any specific location.
In this study, we aim to systematically quantify the occurrence frequency and characteristics of extratropical cyclones during extremely wet, dry, windy, and calm seasons in the NH and SH extratropics in winter and summer. To this end, we apply a slightly adapted version of the approach by Röthlisberger et al. (2021) and Boettcher et al. (2023) to 1050 years of global climate model data from the Community Earth System Model Large Ensemble (CESM-LE; Kay et al., 2015) to identify a large number of extreme-season objects everywhere in the extratropics in the present-day climate. Based on a systematic analysis of extreme seasons in 1050 years of climate simulations and two case studies of past extreme seasons in reanalysis data, we address the following research questions:
-
Are extremely wet, dry, windy, and calm seasons in the extratropics associated with anomalies in the frequency, intensity, origin, lifetime, and stationarity of extratropical cyclones?
-
Are there any regional and seasonal differences in the cyclone characteristics during the different types of extreme seasons?
Several recent studies have shown that CESM is able to capture the geographical distribution, frequency, structure, and lifetime of extratropical cyclones and the associated precipitation-producing airstreams reasonably well (Raible et al., 2018; Dolores-Tesillos et al., 2022; Binder et al., 2023; Joos et al., 2023), which indicates that the model is well-suited to the purpose of the present study. The remainder of the paper is structured as follows. Section 2 describes the data used in the study, the method to identify extreme seasons, and the approach to attribute cyclone characteristics to extreme seasons. In Sect. 3, we investigate the cyclone characteristics during two exemplary past extreme seasons over the UK in reanalysis data: the wet winter of 2013–2014 and the windy winter of 1988–1989. Section 4 presents the results of the systematic analysis based on the climate simulations, showing the cyclone characteristics during wet, dry, windy, and calm winters and summers, for each location in the extratropics. The results are summarised and discussed in Sect. 5.
2.1 Identification of extreme seasons in climate simulations and reanalysis data
We use present-day climate simulations from an initial-condition ensemble of the Community Earth System Model (CESM), version 1.2 (Hurrell et al., 2013), which was created with restart files from the CESM Large Ensemble (CESM-LE; Kay et al., 2015), as described in Röthlisberger et al. (2020). Atmospheric fields are available every 6 h at a spatial resolution of 1.25° of longitude by ∼ 0.9° of latitude on 30 vertical levels. The simulations consist of three ensembles, each with 35 members. The first 35 members, referred to as the macro-ensemble, are direct reruns of the original 35 CESM-LE members, which were started on 1 January 1920 and re-simulated for the period from 1 January 1990 to 31 December 1999. The second and third sets of 35 members, the micro-ensembles, were constructed by adding tiny perturbations on the order of 10−13 K to the temperature fields of the original CESM-LE members one and two, respectively, on 1 January 1980. The model was then integrated forward for 20 years, but the first 10 years of the simulations are ignored to ensure that the spread in the atmospheric variables of the micro-ensemble members is similar to the one of the macro-ensemble members (see also Fischer et al., 2013). Thus, in total, 105 ensemble members cover the 10-year time period from 1990 to 1999, which yields 1050 years of CESM data for the present-day climate, allowing for the identification and statistical analysis of numerous extreme seasons.
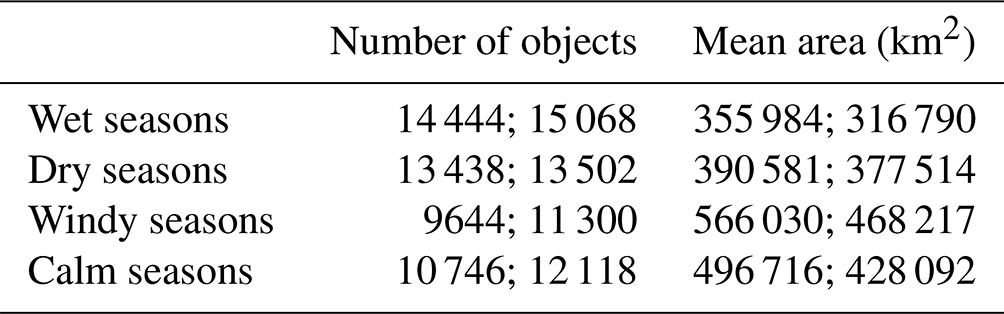
To identify extreme (i.e, locally rare) seasons globally, we adopt a method following the idea of Röthlisberger et al. (2021) and Boettcher et al. (2023). In the first step, we calculate the seasonal mean values of precipitation and of the 10 m wind speed at each grid point for all 1050 years for December to February (DJF) and for June to August (JJA). In the second step, the 25 seasons with the lowest and the 25 seasons with the highest seasonal mean values are selected at each grid point as extremely dry and wet or extremely calm and windy seasons, respectively. This corresponds to a local return period of 42 years. Finally, spatially coherent extreme-season objects are formed by connecting neighbouring grid points where the extreme values occur in the same season. To focus on significant events in the extratropics, we retain only objects with an area larger than 105 km2 whose centre of mass is located poleward of 30° N or 30° S. At many oceanic grid points in the extratropics, the number of extreme-season objects that overlap with the grid point remains close to 25, while over some mountainous regions, the objects are smaller, and the size filter reduces their number to about 10–15 events. The number of extreme-season objects identified globally for each type and season and the mean size of the objects are shown in Table 1. Dry and especially wet seasons are associated with many, typically rather small, objects, while wind extremes are associated with fewer but larger objects.
Table 1Total number of wet, dry, windy, and calm extreme-season objects and their mean area (km2) identified in CESM in DJF (first number) and JJA (second number).
To compare the findings from the climate simulations with real examples of past extreme seasons, we additionally use the extreme seasons identified by Boettcher et al. (2023) in ERA5 reanalysis data from the European Centre for Medium-Range Weather Forecasts (Hersbach et al., 2020) for the years 1950–2020. The data are based on hourly fields interpolated to a horizontal resolution of 0.5°. The approach to identify the extreme seasons is similar to the one described above for the CESM data, with two exceptions: (i) calm and windy seasons are identified based on seasonal mean values of 10 m wind gusts rather than 10 m wind speed and (ii) instead of choosing the events with the lowest and highest seasonal mean values, the distribution over the 71 seasonal mean values is estimated at each grid point based on statistical modelling, and the local return period is calculated. Seasons with anomalies from the climatological mean that have a local return period of at least 40 years are considered extreme. Spatially coherent objects are then formed by connecting grid points where the local return period exceeds 40 years in the same season (for details, see Boettcher et al., 2023). As in CESM, we only consider objects with an area larger than 105 km2 whose centre of mass is located poleward of 30° N or 30° S.
2.2 Cyclone characteristics during extreme seasons
Extratropical cyclones are identified and tracked using a slightly updated version of the method developed by Wernli and Schwierz (2006), which is described in Sprenger et al. (2017). This method first identifies cyclone centres as local minima in sea level pressure (SLP). For each local SLP minimum, it then searches for larger enclosing isobars at 0.5 hPa intervals. The area within the outermost closed contour is considered the surface cyclone. The maximum length of the outermost contour is restricted to 7500 km. For each SLP minimum, the tracking algorithm searches for the most probable continuation among the minima identified at the next time step, within a specific search area that takes into account the previous movement of the cyclone. Only cyclones with a minimum lifetime of 24 h are included in the analysis.
For each extreme-season object, cyclone frequencies and characteristics are computed during the extreme season and in the climatology. To this end, the cyclones are identified whose centres (defined as their SLP minima) moved over any part of the object area during the extreme season. For each extreme-season object, the same procedure is also done for all 1050 seasons in CESM and, for the ERA5 case studies, for all 71 seasons between 1950 and 2020 in order to obtain the climatology of cyclone characteristics for each extreme-season object. The number of cyclones is used as a measure of cyclone frequency. For each cyclone crossing an extreme-season object, several additional characteristics such as intensity, intensification rate, origin, lifetime, and stationarity are calculated. Intensity is measured by the minimum SLP along the track and the intensification rate as the latitude-adjusted maximum change in SLP within 24 h along the track in Bergeron units (Sanders and Gyakum, 1980). The minimum SLP and the maximum deepening rate are determined along the entire cyclone track, but the results are very similar if only the segment of the track that moved over the extreme-season object is considered. Cyclones with a deepening rate of more than 1 Bergeron (which corresponds to a 24 hPa drop in 24 h at 60° N) are considered to intensify explosively and are known as bomb cyclones, and their frequency is also examined during extreme seasons and the climatology. Stationarity is defined as the time during which the centre of a cyclone remained within the region of the extreme-season object. This duration depends on the speed and path of the cyclone but also on the size and shape of the extreme-season object. The measure is suitable for the purpose of our analysis, where we are interested in differences between extreme seasons and the climatology for the same object, but it should not be used to compare absolute time values among objects of different sizes. Finally, we investigate the genesis latitude and longitude and total lifetime of the cyclones.
By including all cyclones in the analysis whose centres moved over any part of the extreme-season object rather than just those that moved over a specific grid point, we take into account remote effects of cyclones and the fact that the entire cyclone area, as well as elongated fronts far away from the cyclone centre, can be associated with strong precipitation and wind gusts. Nevertheless, not all remote effects are included, as the approach ignores those cyclones where part of the area or a front but not the cyclone centre overlapped with the object, even if they may also have contributed to extreme weather in the object area. Although the method certainly ignores the contribution of important cyclones, it avoids the need to define an arbitrary and subjective threshold to decide how much overlap between the cyclone area and the object is necessary to include a cyclone in the analysis. And as we apply the same approach during extreme seasons and the climatology, the resulting differences provide meaningful information about cyclone anomalies during extreme seasons.
2.3 Anomaly maps of cyclone characteristics and statistical significance testing
Global maps of the differences in the various cyclone characteristics between extreme seasons and the climatology are produced by computing separately for the extreme seasons and for the climatology, for each grid point, the average characteristics over all N extreme-season objects that include the grid point (e.g. the average number of cyclones or the average minimum SLP of the cyclones). To detect statistically significant differences, a bootstrapping procedure is performed in CESM at each grid point and for each cyclone characteristic. Hereby, we assume that the specific characteristic, such as, for instance, the number of cyclones, does not differ between extreme seasons and the climatology, i.e. that it belongs to a common distribution. Under this null hypothesis, we randomly select 1000 times N seasons among the total number of 1050 seasons and calculate their mean cyclone characteristics each time. The mean value over the N extreme seasons is then ranked among the 1000 bootstrapped values, and the two-sided local p value is calculated. As the hypothesis test is applied to each grid point, the p values are adjusted to account for spatial correlation by controlling the false discovery rate at αFDR=0.1, following Benjamini and Hochberg (1995) and Wilks (2016). All p values smaller than αFDR are considered statistically significant and stippled in the figures in Sect. 4.
3.1 Two exemplary extreme seasons
3.1.1 The wet winter of 2013–2014 over the UK and Ireland
As mentioned in the introduction, during the winter of 2013–2014, Ireland, large parts of the UK, and the eastern North Atlantic experienced unusually strong precipitation that resulted in widespread ecological and economic damage (e.g. Kendon and McCarthy, 2015). The red contour in Fig. 1a outlines the region identified as an extremely wet winter in ERA5. Also shown are the tracks of the 58 cyclones whose centres crossed the extreme-season object during the winter of 2013–2014. The cyclones typically originated in the western North Atlantic and then moved northeastward along the storm track into the eastern North Atlantic, where they attained their minimum SLPs and eventually dissolved. Substantially more cyclones went through the extreme-season object in the winter of 2013–2014 than during most other seasons in the 1950–2020 climatology, with the number in 2013–2014 corresponding to approximately the 95th percentile of the historical data (Fig. 1b). Even more remarkable is the high frequency of explosively deepening cyclones (i.e. bomb cyclones) that occurred during the extreme winter, which exceeded the mean climatological frequency by more than a factor of 2 (Fig. 1c). Accordingly, the minimum SLP of most cyclones was also lower, and their deepening rate was higher (Fig. 1d, e). In addition, in the mean, the cyclones during the extreme season had a more southward and westward origin (Fig. 1f, g), a longer lifetime (Fig. 1h), and a larger number of time steps within the area of the extreme-season object; i.e. they were more stationary than usual (Fig. 1i). The results are consistent with Matthews et al. (2014), who found that the combination of both high cyclone frequency and high cyclone intensity resulted in the stormiest winter in a 66-year record over Ireland and the UK. As shown by Davies (2015), the high cyclone frequency was linked to an anomalously strong and persistent jet stream.
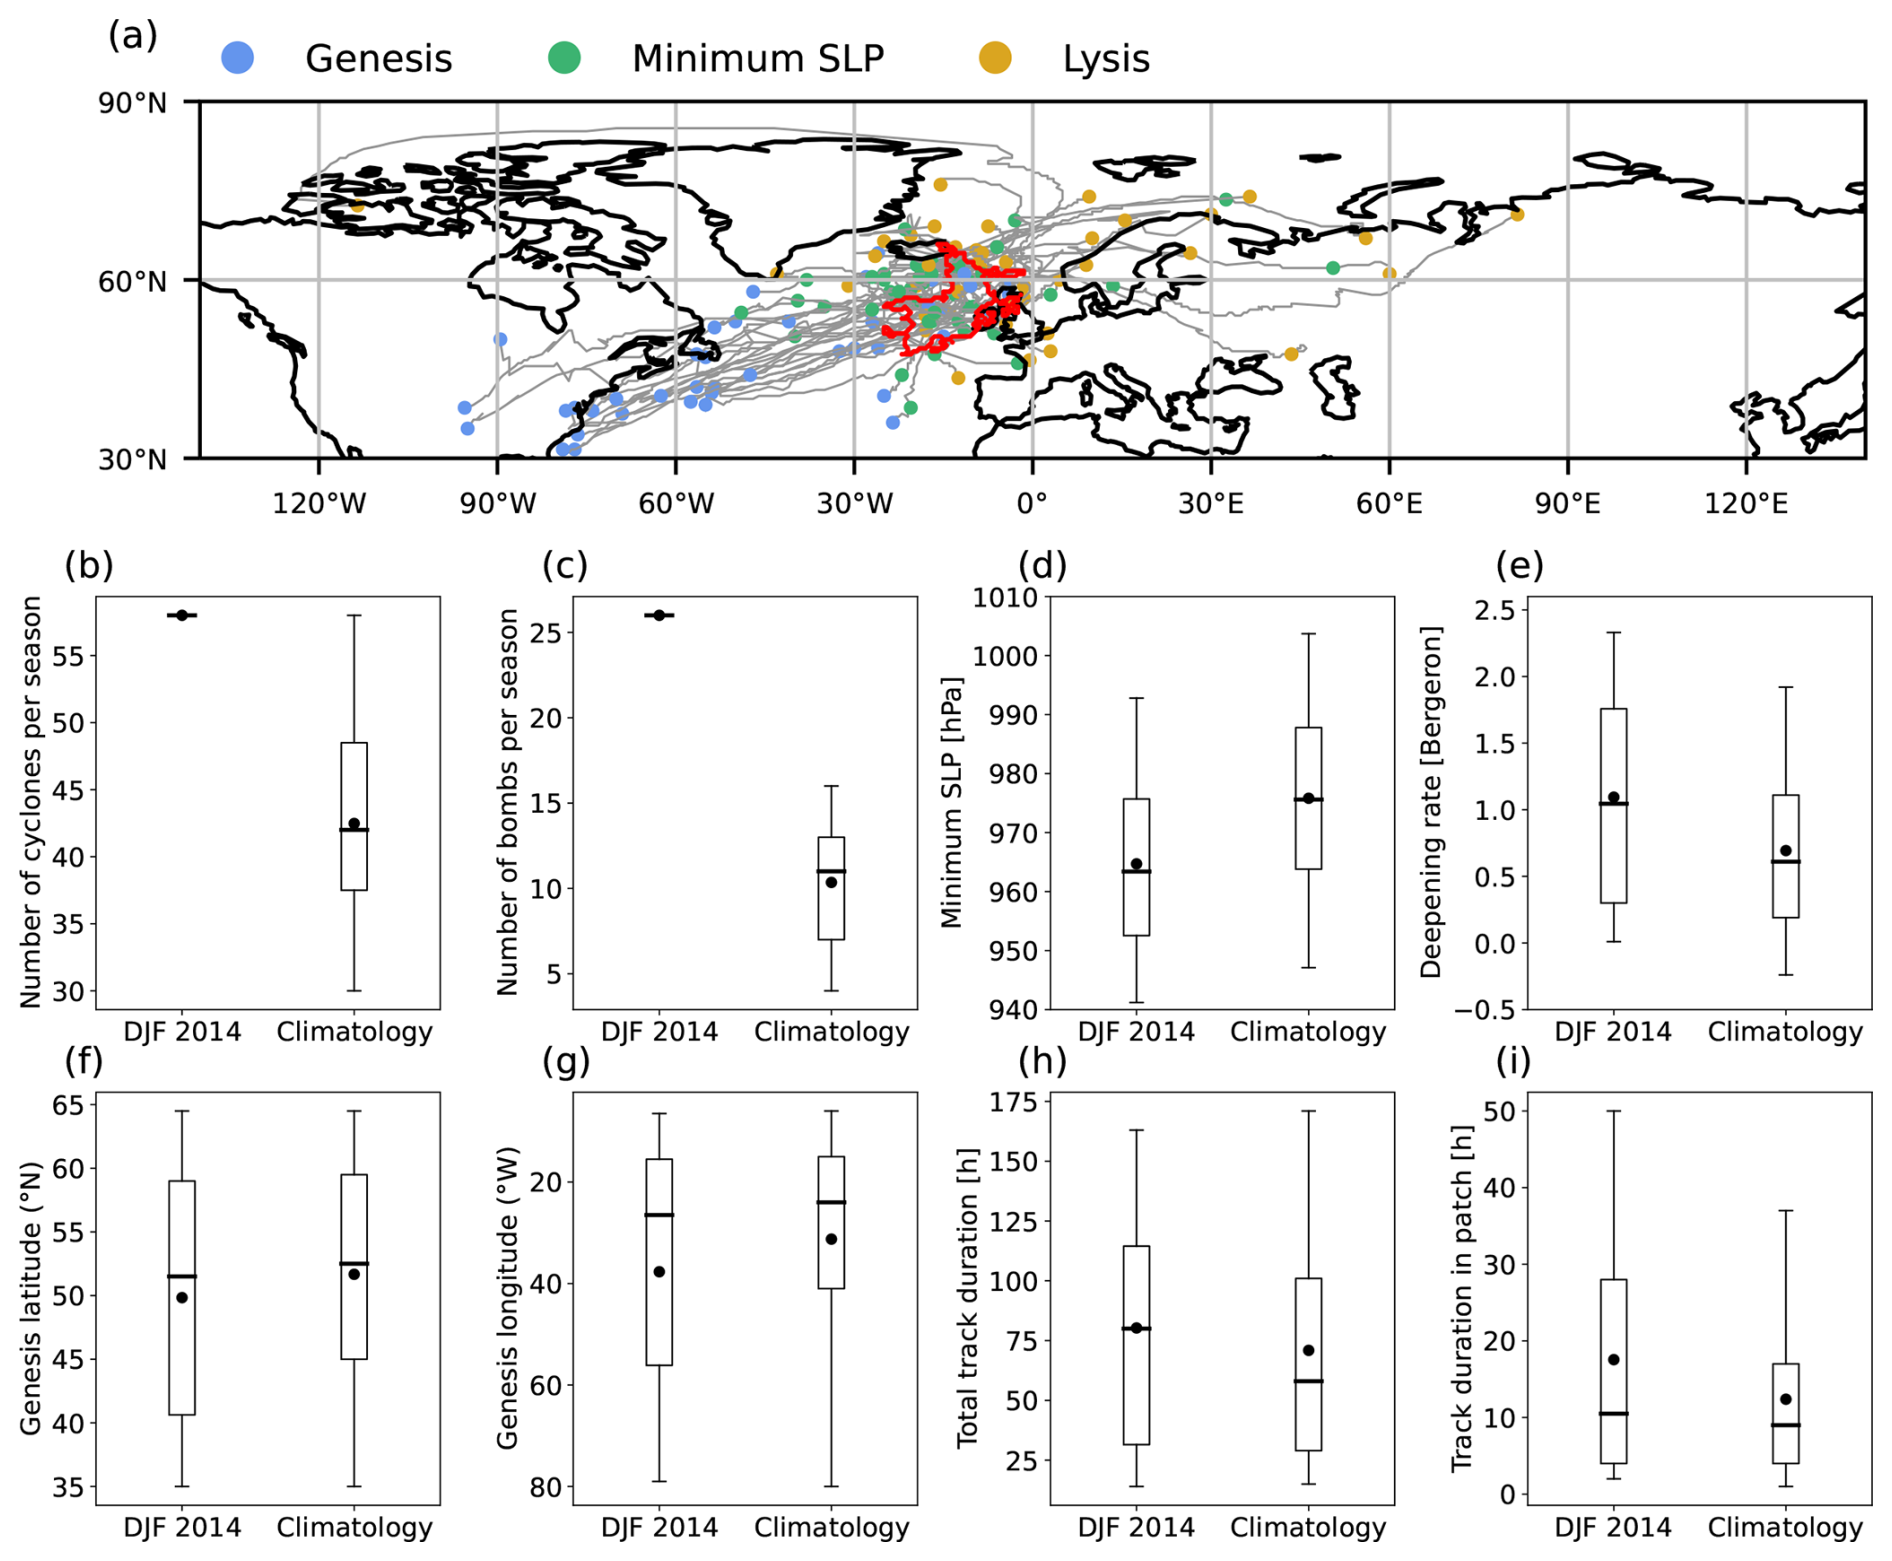
Figure 1(a) The extremely wet winter object in 2013–2014 (red contour) and associated cyclone tracks (grey lines). The blue and yellow dots mark the cyclogenesis and lysis positions, respectively, and the green dots mark the positions where the cyclones attained their minimum SLP. (b) Number of cyclones per season and (c) number of bombs per season whose centres crossed the object (red contour in a) in the winter of 2013–2014 and in the climatology (all winters in the period of 1950–2020). (d) The minimum SLP (hPa) of the cyclones, (e) the deepening rate (Bergeron), (f) the genesis latitude (° N), (g) the genesis longitude (° W), (h) the total duration of the cyclone tracks (h), and (i) stationarity (h). The boxes extend from the 25th to the 75th percentile and the whiskers from the 5th to the 95th percentile of the data. The line represents the median and the black dot the mean.
3.1.2 The windy winter of 1988–1989 over the UK and Scandinavia
The region over the eastern North Atlantic, the northern part of the UK, and large parts of Scandinavia, outlined in Fig. 2a, was identified in ERA5 as an extremely windy winter in 1988–1989. Particularly noteworthy for this winter is an intense cyclone that moved from the north of the UK toward Norway on 13 February 1989, causing widespread damage and record-strong wind gusts in Scotland (Burt, 2021; Met Office, 2024). The cyclone statistics over the entire season show that, in contrast to the wet winter discussed above, the number of cyclones in this windy winter was reduced compared to the climatology (Fig. 2b), and on average they were slightly less stationary in the region of the extreme-season object (Fig. 2i). Because this extreme-season object is larger than the one portrayed in Fig. 1, the climatological cyclone frequency is higher in Fig. 2b compared to Fig. 1b. On the other hand, like during the wet winter, the cyclones during this windy winter were substantially more intense than usual, with a higher number of bombs (Fig. 2c), a deeper minimum SLP (Fig. 2d), and a stronger intensification rate on average (Fig. 2e), and they typically originated further south and west (Fig. 2f, g) and had longer tracks than in the climatology (Fig. 2h). Thus, while during the wet winter of 2013–2014, the increases in both frequency and intensity were important, the windy winter of 1988–1989 was associated with relatively few but particularly intense cyclones, such as the one that hit Scotland on 13 February 1989.
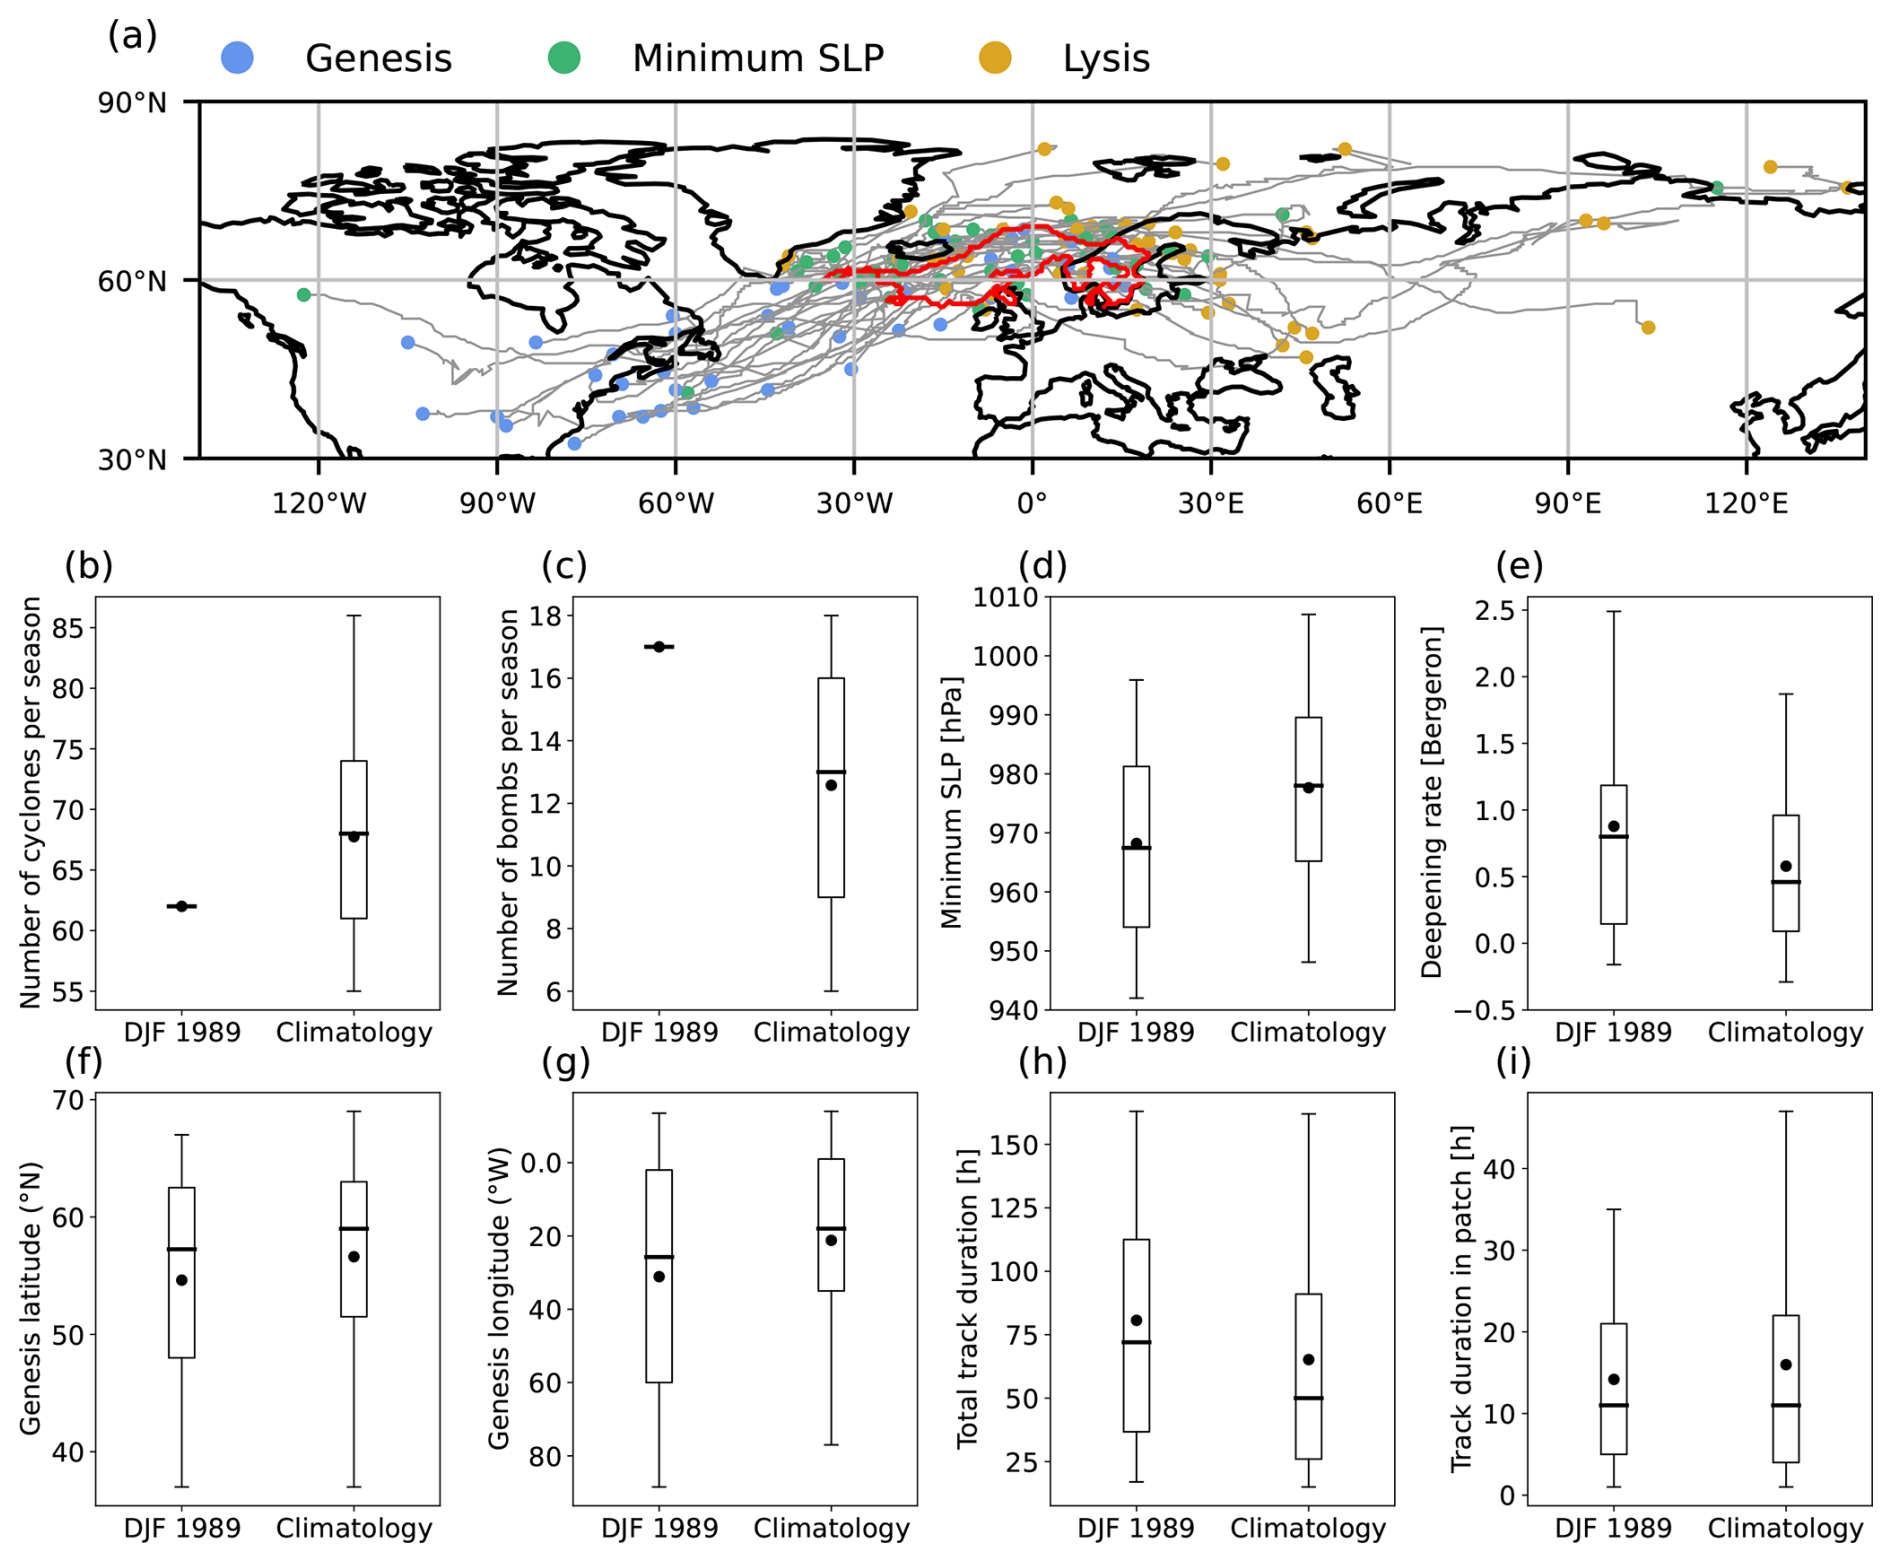
Figure 2As Fig. 1, but for the windy winter of 1988–1989.
3.2 Systematic analysis
The anomalies in cyclone frequencies and characteristics have also been calculated for all other extreme-season objects in ERA5 between 1950 and 2020. Global maps of the anomalies are shown in the Supplement for the 940 extremely wet, 874 extremely dry, 613 extremely windy, and 703 extremely calm DJF seasons located in the extratropics (Figs. S1–S4 in the Supplement). Each grid point includes between zero and three extreme-season objects. The fields look noisier than those based on CESM, which are discussed in detail in the following section, because of the much smaller number of extreme seasons in ERA5 than in the 1050-year CESM ensemble. However, the anomaly patterns qualitatively agree with those based on CESM, which provides confidence in the statistical findings from the climate simulations.
4.1 Extremely wet seasons
After looking at two exemplary ERA5-based extreme seasons that affected the UK, we investigate the cyclone characteristics of a large number of extreme seasons around the globe in 1050 years of present-day climate in the CESM dataset. In this section, extremely wet seasons are discussed. Figure 3 shows the anomaly in cyclone frequency and intensity in extremely wet seasons with respect to the climatology in DJF. As described in Sect. 2.3, at each grid point, the average cyclone characteristics are computed separately for the extreme seasons and for the climatology over all N extreme-season objects that contain the grid point. For instance, the grid point at 53° N, 7.5° W over Ireland overlaps with N=17 wet extreme-season objects during DJF. For each of these objects, the cyclones that crossed the object area are counted, and their characteristics are calculated in the same way as the two case studies discussed in the previous section. Averaged over all 17 objects, the mean number of cyclones that moved over the respective object area is 16.2 during the extremely wet seasons and 12.3 in the climatology (i.e. averaged over all 1050 seasons), and they were associated with a mean minimum SLP of 970 and 977 hPa, respectively. The differences between wet seasons and the climatology, i.e. +3.9 cyclones and −7 hPa, are shown in Fig. 3a and c at 53° N, 7.5° W. Also overlaid on Fig. 3a is the mean climatological cyclone frequency (i.e. 12.3 cyclones at the grid point over Ireland). As mentioned in Sect. 2.2, it is important to note that the centres of these cyclones did not necessarily move over this grid point – they could have moved over any part of the extreme-season objects. This takes into account the fact that the entire cyclone area and associated fronts can contribute to precipitation at a specific grid point. The cyclone numbers during the extreme seasons and in the climatology depend on the area of the extreme-season objects, with larger objects typically yielding larger numbers (see also examples in Sect. 3.1). The climatological cyclone frequency therefore differs between different types of extreme seasons (i.e. wet, dry, windy, and calm seasons) and between DJF and JJA.
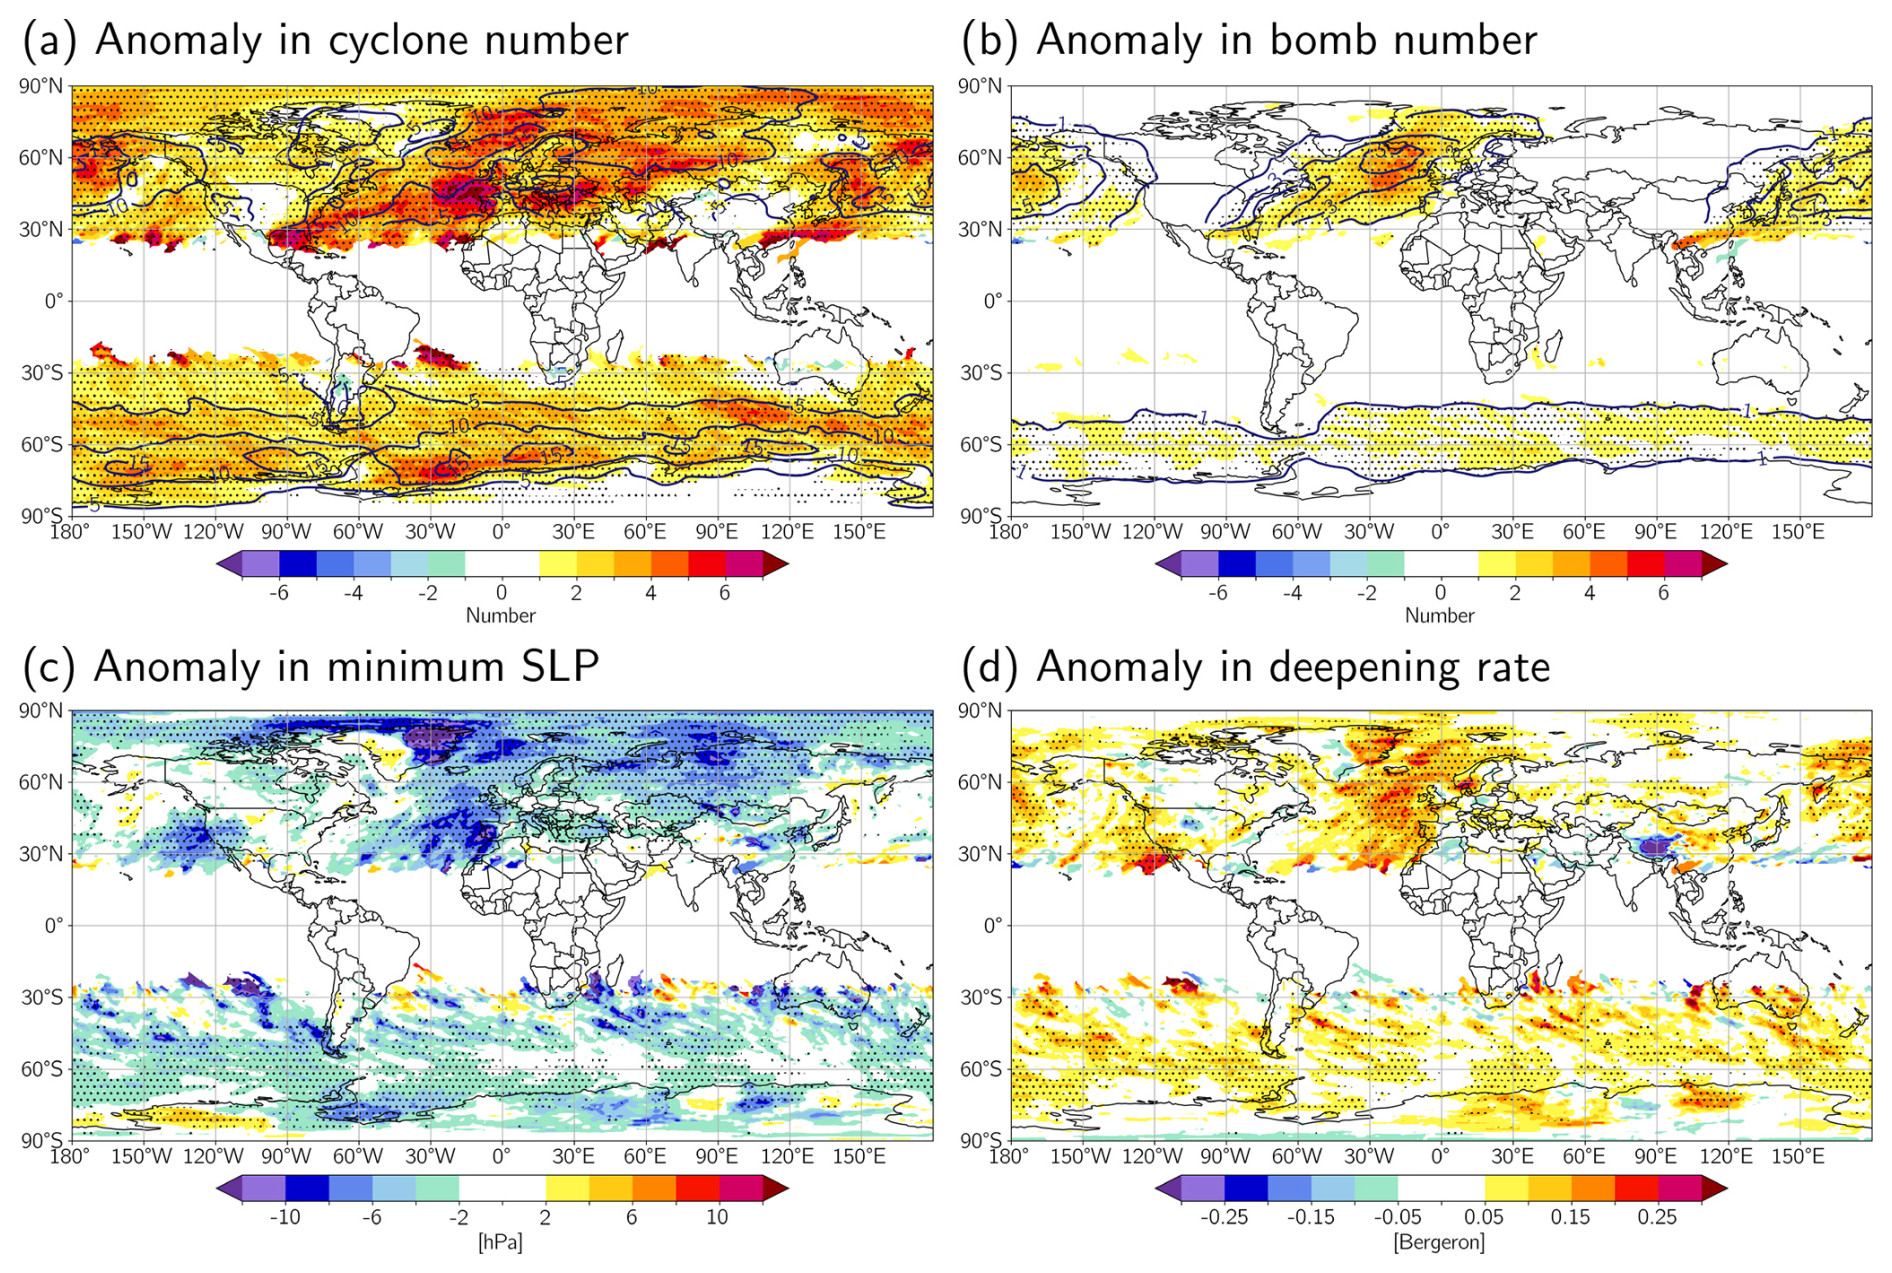
Figure 3Anomalies in cyclone characteristics during extremely wet DJF seasons with respect to the climatology in CESM-LE. The shading shows the seasonal anomalies in the (a) number of cyclones, (b) number of bomb cyclones, (c) mean minimum SLP of the cyclones (hPa), and (d) mean deepening rate of the cyclones (Bergeron). See text for details about how the anomalies are computed. In addition, the blue contours in (a) and (b) show the values for the climatology, i.e. the mean climatological number of (a) cyclones (contours at intervals of five cyclones) and (b) bombs (contours for 1, 3, 5, 7, 9, and 11 bombs) per season averaged over the extreme-season objects that contain the grid point. The values in (b) are only shown for regions where the mean climatological bomb frequency is larger than one bomb per season. Stippling denotes areas where the differences between extreme seasons and the climatology are considered statistically significant.
According to Fig. 3a, the anomalies in cyclone number during extremely wet seasons are positive in large parts of the extratropics, and the stippling indicates that the differences are statistically significant almost everywhere. Particularly large anomalies can be found over most ocean basins, especially in regions with high climatological cyclone frequencies (blue contour in Fig. 3a), and over southeastern Europe and parts of Russia. Exceptions with no or only weak anomalies occur over some continental regions such as the central US, China, and Antarctica, which are all regions with relatively low climatological cyclone frequencies, as well as parts of Greenland and southern Australia. Near the cyclone frequency maximum east of the Andes over Argentina, there is even a small region with negative anomalies in cyclone number.
Over the North Atlantic and North Pacific and in many coastal regions at the beginning and end of the storm tracks, extremely wet seasons in DJF are associated with not only anomalously many cyclones in general but also anomalously many explosively deepening cyclones (Fig. 3b). The same is true for the SH storm track, but there, the anomalies are smaller than in the NH, as the absolute numbers are also smaller in the SH during austral summer. Over the majority of the continents, bomb cyclones occur very rarely, and the anomalies are not shown.
Concomitant with the large bomb cyclone frequency, over the eastern parts of the NH ocean basins and the adjacent land areas, as well as over large parts of the Southern Ocean, the mean minimum SLP of the cyclones is lower (Fig. 3c), and the deepening rates are higher (Fig. 3d) during wet seasons than in the climatology. Anomalously deep cyclones during wet seasons also occur over the Arctic ocean, eastern Greenland, parts of the Mediterranean, southeastern Europe, and the majority of Russia (Fig. 3c). Thus, in these regions, extremely wet seasons are the result of a combination of anomalously many and anomalously intense cyclones, consistent with the findings for the wet winter of 2013–2014 over the UK and Ireland (Sect. 3.1.1). In contrast, over the western North Atlantic and North Pacific; over most of North America; in central Europe and eastern Russia; and, in the SH, in the latitudinal band between about 30 and 50° S, cyclones are not particularly intense during extremely wet seasons. Here, wet DJF seasons are the result of anomalously many but not especially deep cyclones.
Cyclones contributing to wet DJF seasons often originate a few degrees further equatorward than usual (Fig. 4a), in particular for extreme seasons in the western and central part of the NH ocean basins, and they originate a few degrees further west for extreme seasons in the central and eastern part of the basins (Fig. 4b). In terms of cyclone lifetime, in most regions of the world, there is no statistically significant signal, except for the southeastern North Atlantic, with positive anomalies (Fig. 4c). Cyclones are anomalously stationary in wet seasons along the US east coast; over the subtropical North Atlantic; and in the eastern Mediterranean, the western North Pacific, and parts of the Southern Ocean (Fig. 4d). Except for the US east coast, these are all regions with high climatological frequencies of potential vorticity cutoffs (Portmann et al., 2021). Cutoffs are often accompanied by surface cyclones and precipitation. They can be relatively long-lived and stationary and thereby result in the formation of long-lasting heavy precipitation events (e.g. Doswell et al., 1998; Grams et al., 2014; Röthlisberger et al., 2022). The positive anomalies in stationarity in Fig. 4d suggest that anomalously many stationary cutoff cyclones occur during wet seasons in these regions.
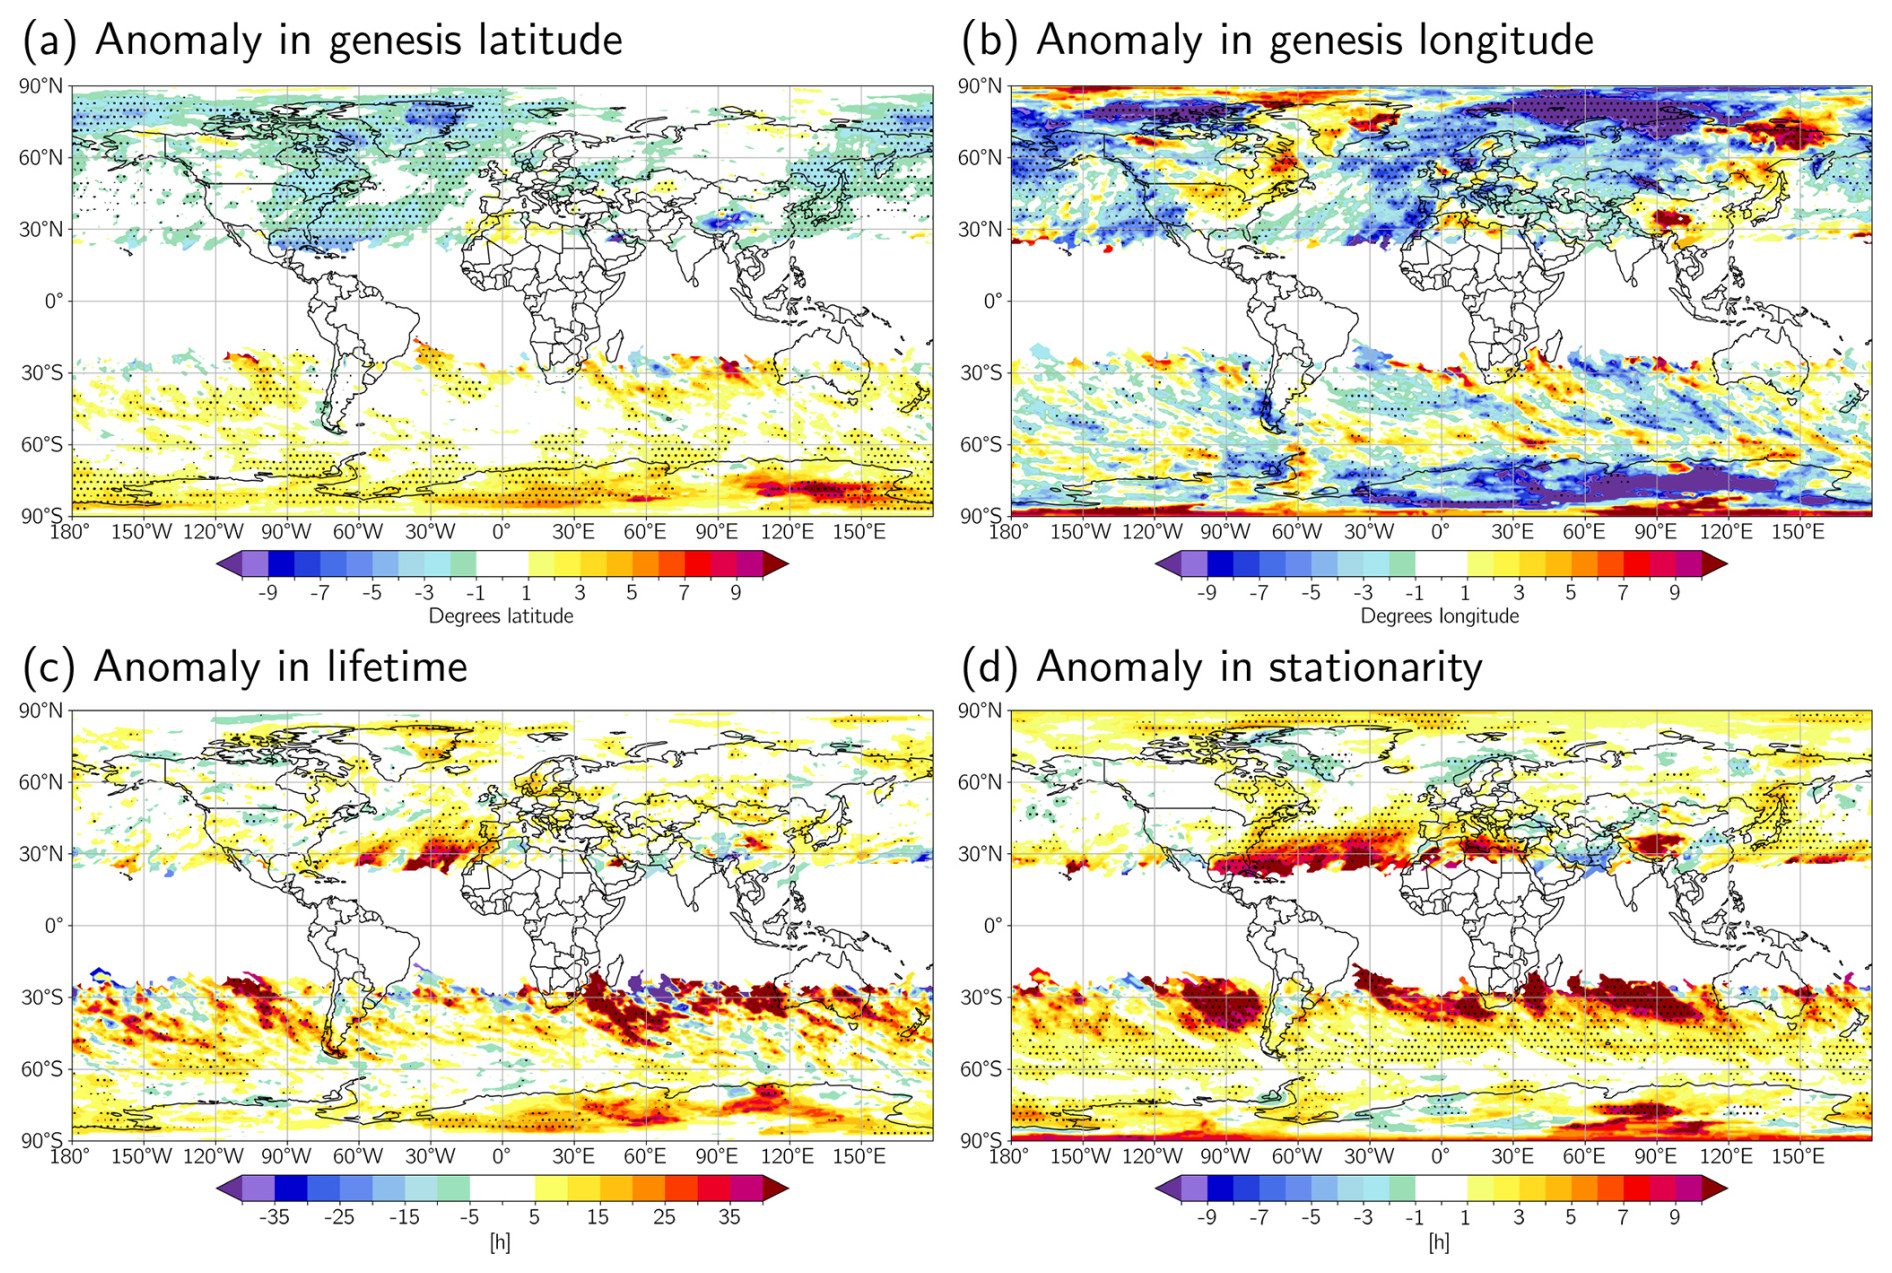
Figure 4As Fig. 3, but showing, again for extremely wet DJF seasons, anomalies in the cyclones' (a) genesis latitude (degrees), (b) genesis longitude (degrees), (c) lifetime (h), and (d) stationarity, measured by the number of time steps within the extreme-season object (h).
As mentioned above, some continental regions such as the central US, China, and western Greenland and large parts of Argentina, southern Australia, and Antarctica are not associated with anomalously high cyclone frequencies during extremely wet seasons (Fig. 3a). Also, they are not associated with particularly intense or stationary cyclones (Figs. 3c, 4d). The regions are all located close to topography, where precipitation is typically orographically induced. In addition, cyclones at more remote locations outside the extreme-season objects could contribute to heavy precipitation in these regions. As shown by Pfahl (2014), extreme precipitation over complex terrain in Europe is typically associated with cyclones that are located relatively far away from the location of the precipitation, whereby the cyclones are important for directing moist air toward the topography. Furthermore, the extreme precipitation might also be related to other weather systems such as atmospheric rivers and tropical moisture exports. Over Argentina and southern Australia, summertime deep convection most likely plays an important role in extreme seasonal precipitation during DJF, explaining the absent signals in cyclone characteristics.
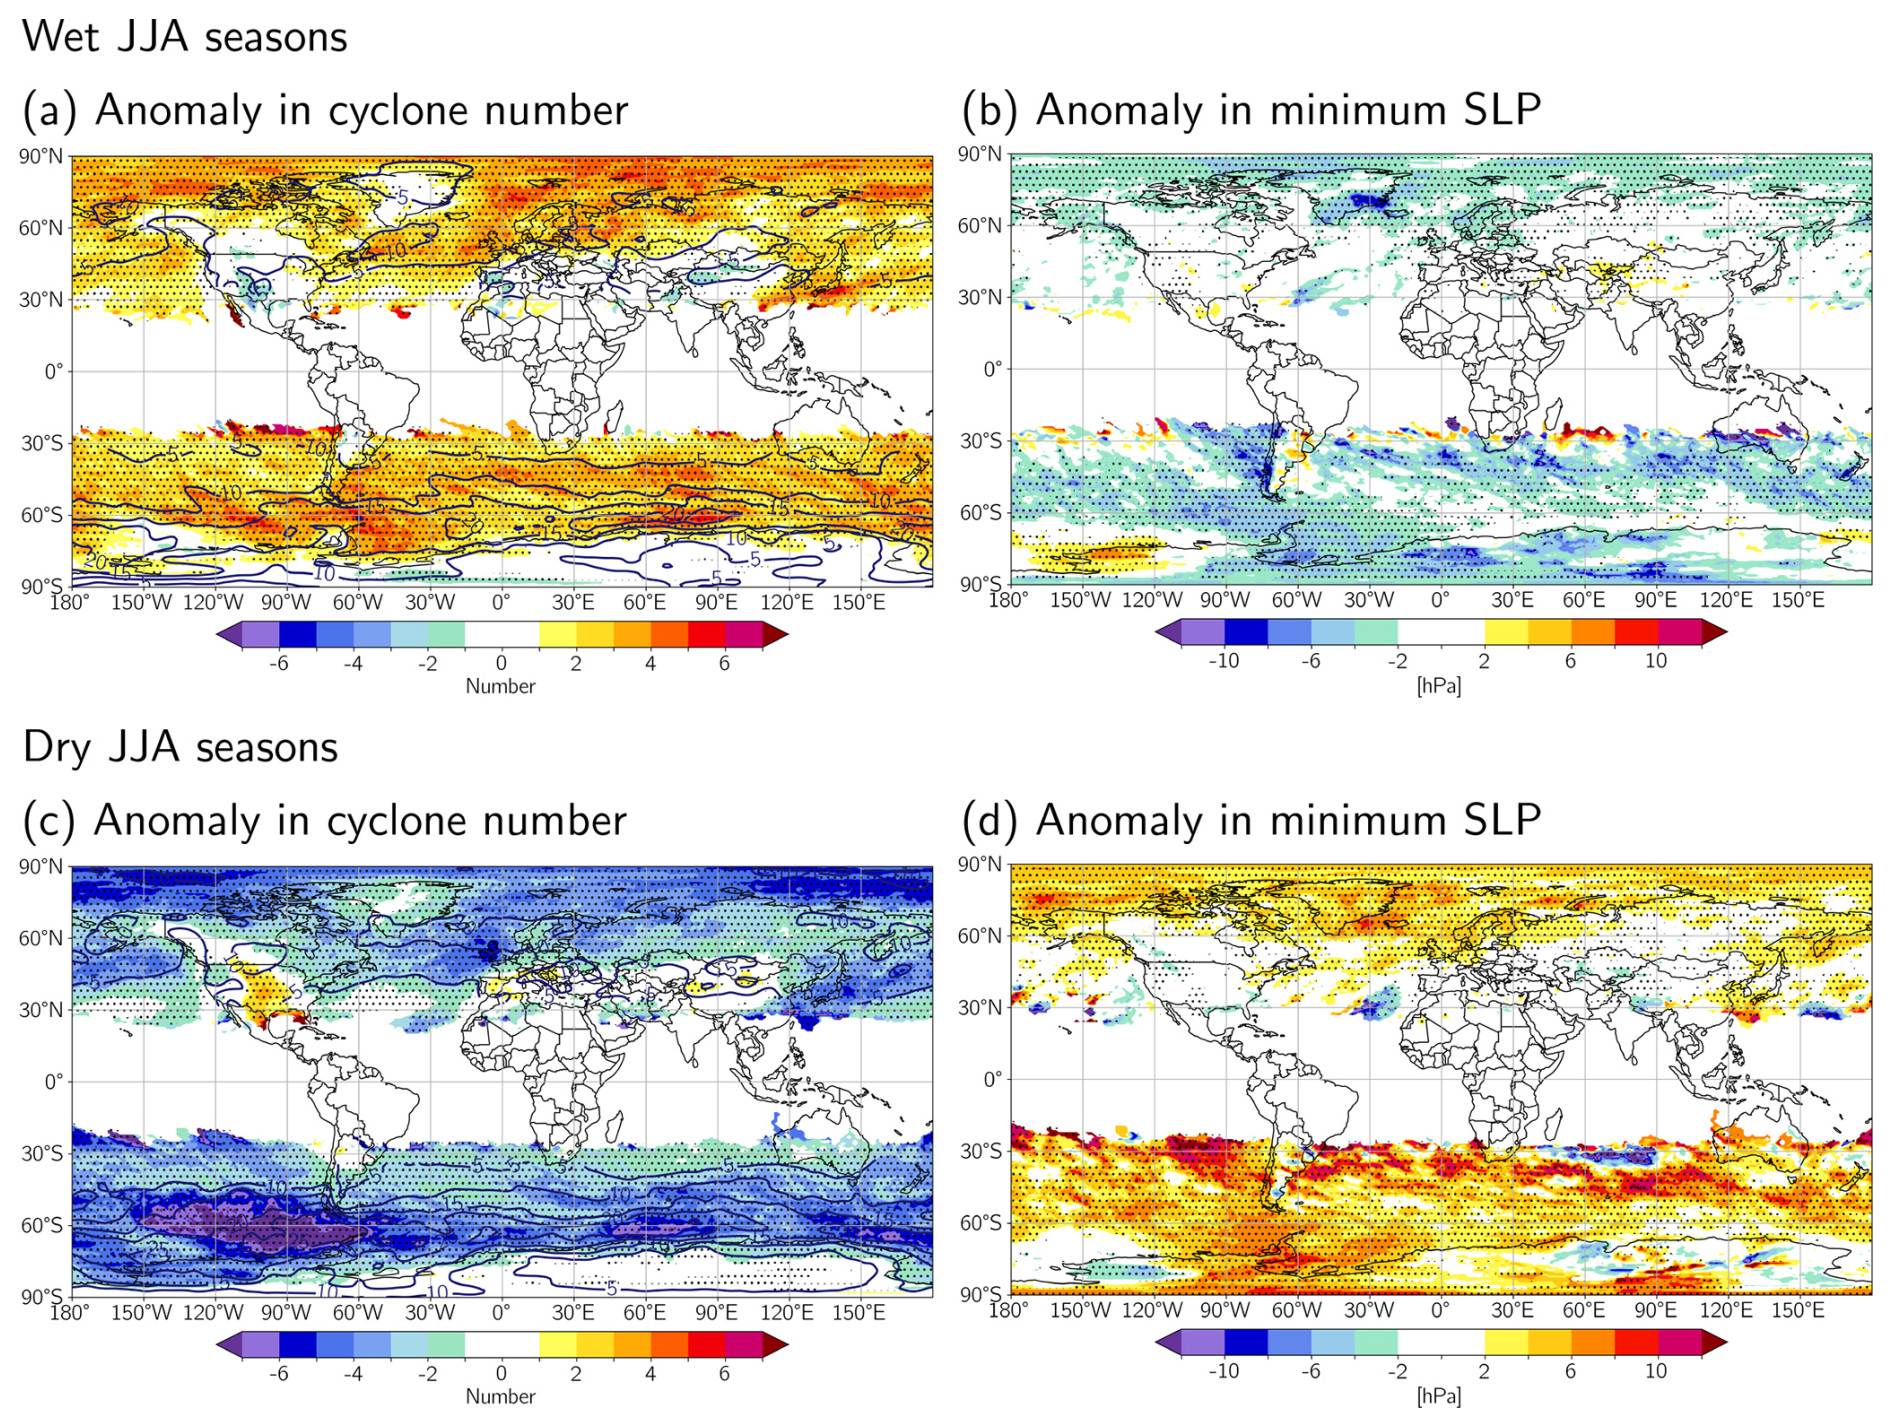
In JJA, extremely wet seasons in the SH exhibit relatively similar patterns to those in DJF, with slightly stronger anomalies in most regions in terms of cyclone number and intensity (Fig. 5a, b vs. Fig. 3a, c) and particularly in terms of the number of bomb cyclones (Fig. S7a). In the NH, the cyclone frequency anomalies during wet summers are also positive over most oceanic regions and over eastern Canada, northern Europe, most of Russia, eastern China, and Japan but weaker than in DJF. Negative cyclone frequency anomalies during summertime extreme seasons occur in some low-latitude orographic regions such as the central US, the Iberian Peninsula, and the Tibetan Plateau, and no anomalies are found over most other land areas and the Mediterranean Sea. As further discussed in Sect. 4.2, the regions with negative anomalies in Fig. 5a are climatologically characterised by relatively frequent heat lows, which can be strong enough to be identified by our algorithm. Heat lows are typically dry, which could explain their reduced frequency during extremely wet seasons. In contrast to DJF, there are no anomalies in cyclone intensity in most of the NH during wet summers except in subpolar and polar regions such as Alaska, Greenland, Scandinavia, and the Arctic Ocean. The absence of positive cyclone frequency and intensity anomalies during wet summers over most subtropical and midlatitude continental regions indicates the importance of other mechanisms for triggering extreme precipitation, such as summertime deep convection; orographic lifting; and, over south and east Asia, anomalies in the Asian monsoon. In addition, anomalously stationary cyclones contribute to extremely wet summers over the exit regions of the NH storm tracks and large parts of central, eastern, and southeastern Europe; the eastern Mediterranean; and Kazakhstan (Fig. S7f).
4.2 Extremely dry seasons
Extremely dry seasons mainly exhibit the opposite patterns of extremely wet seasons. In DJF, they are associated with anomalously low cyclone frequencies in most of the world and low frequencies of bomb cyclones in the storm track regions (Fig. 6a, b). Thus, in many areas, extremely dry seasons result from the absence of cyclones. In large parts of the extratropics, the cyclones that still occur in extremely dry seasons have anomalously weak intensities and intensification rates (Fig. 6c, d), and they often originate further poleward and eastward (or less far to the south and west) and have shorter lifetimes than in the climatology (Fig. S5a, b, c). In addition, cyclones contributing to dry seasons are less stationary than in the climatology in many parts of the extratropics, for instance over the Mediterranean and the adjacent land areas, over the entrance and exit regions of the NH storm tracks, over the Barents Sea, and in parts of the Southern Ocean, while they are more stationary than usually over Alaska and Siberia (Fig. S5d).
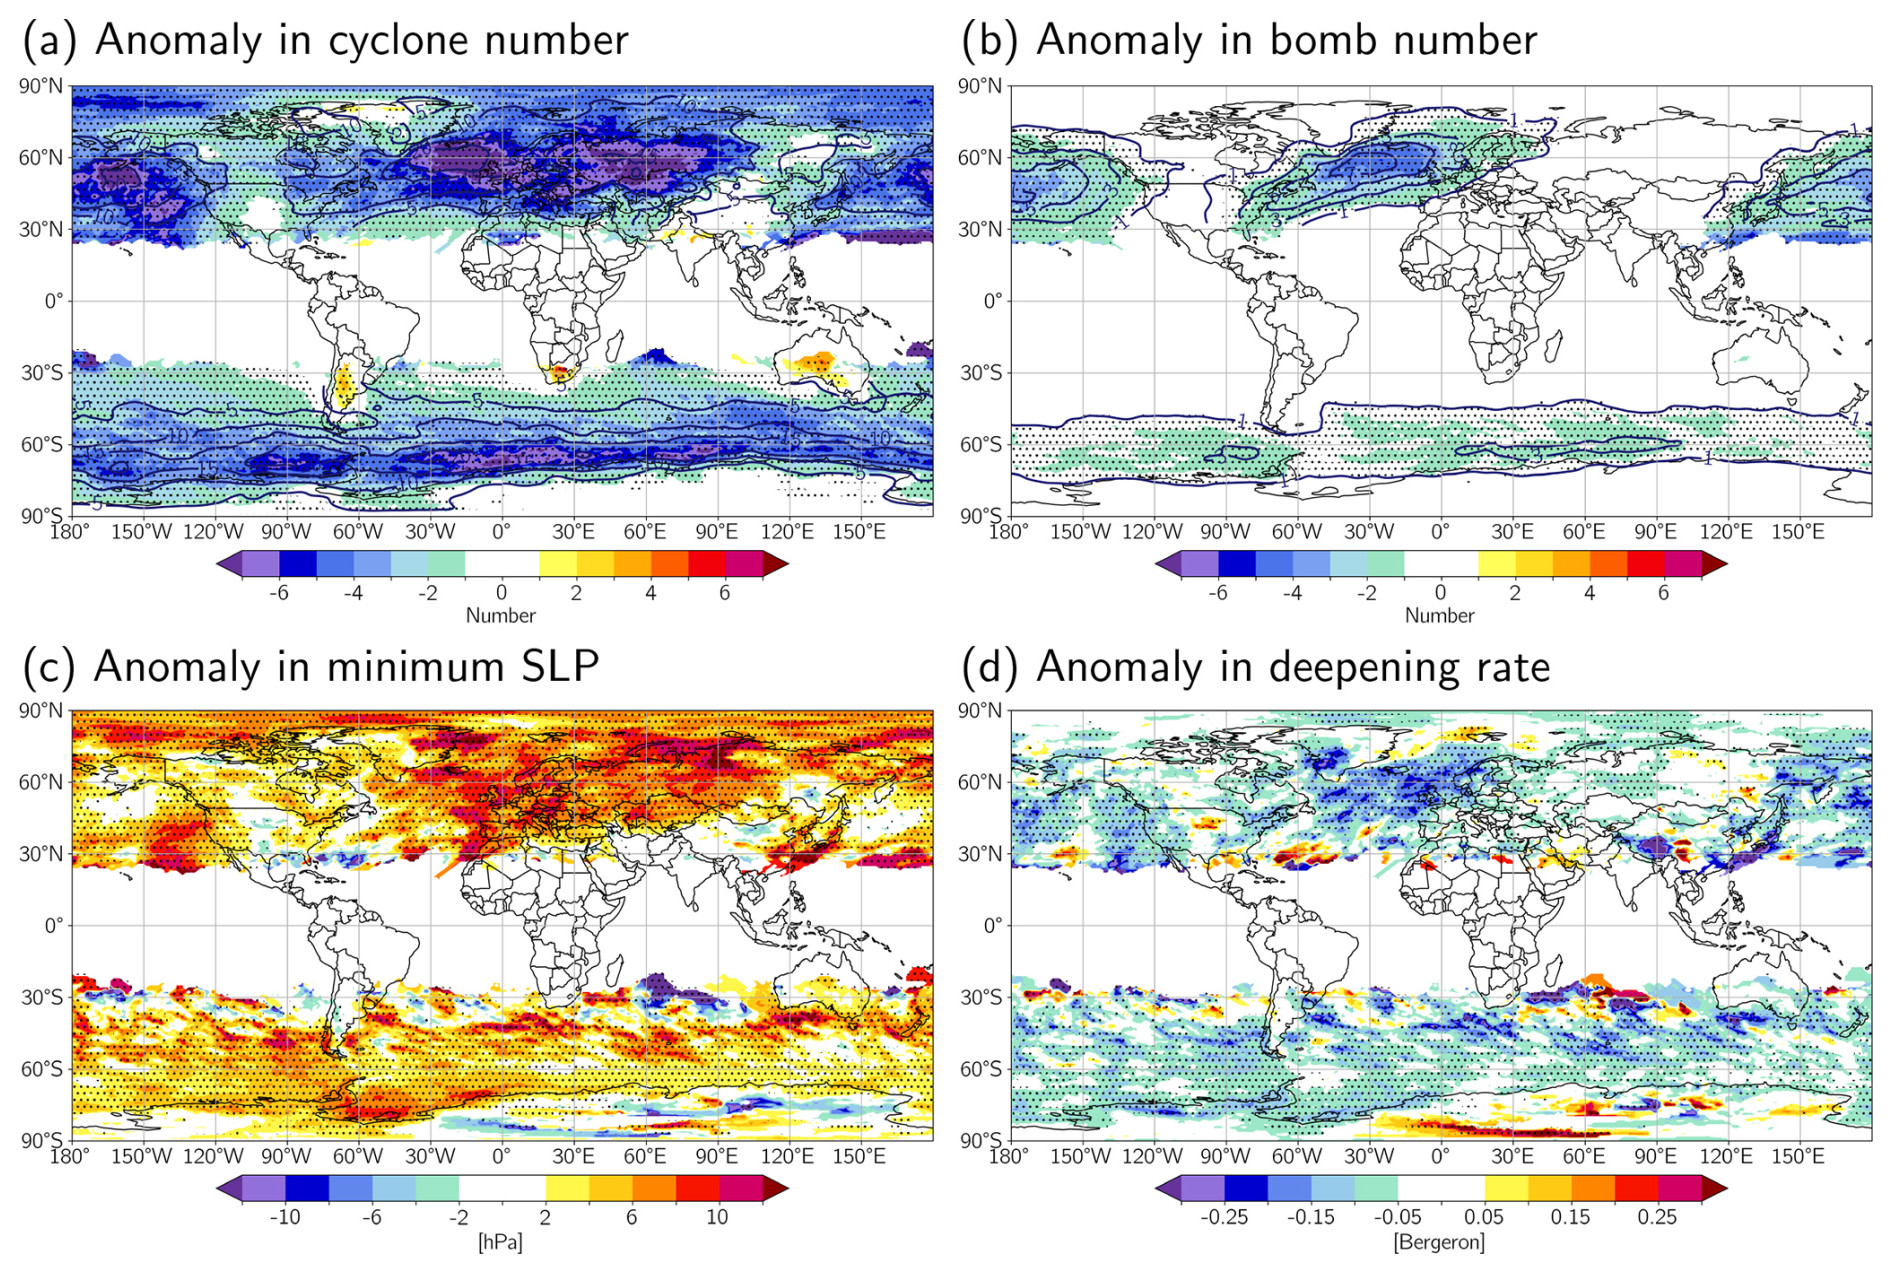
Figure 6As Fig. 3, but for extremely dry DJF seasons.
In JJA, extremely dry seasons are also associated with anomalously low cyclone frequencies over most NH and SH oceans, as well as over northern and eastern Canada, northern Europe, most of Russia, eastern China, and Japan, while the central US, the Mediterranean and the adjacent land areas, and south and east Asia are associated with no or even positive cyclone frequency anomalies (Fig. 5c). These positive anomalies (see also similar signals in Fig. 6a in the SH) might be an indication of heat lows. As heat lows are typically dry, their increased frequency might be conducive to the formation of an extremely dry season. This hypothesis is supported by the fact that the cyclones in these regions are anomalously stationary during dry seasons (Fig. S8f), a characteristic typical of heat lows. In the majority of the SH extratropics and in subpolar and polar regions in the NH, cyclones during dry JJA seasons have anomalously weak intensities, while no anomalies are found over most of the NH midlatitudes (Fig. 5d). As in DJF, cyclones are less stationary than usually in many parts of the extratropics, in particular over the exit regions of the NH storm tracks, and they often originate anomalously far poleward and eastward and have anomalously short lifetimes (Fig. S8c–f).
4.3 Extremely windy seasons
The anomalies in cyclone frequency and intensity of extremely windy DJF seasons with respect to the climatology are shown in Fig. 7. The climatological cyclone and bomb cyclone frequencies associated with the windy objects (blue contours in Fig. 7a, b) are higher than those associated with the wet objects (Fig. 3a, b), as the area of the windy objects is typically larger (Table 1). Windy seasons are associated with anomalously deep cyclones in almost all of the extratropics (Fig. 7c). In the NH storm tracks, they also coincide with anomalously many bomb cyclones (Fig. 7b) and, in both the NH and SH storm tracks, anomalously strong deepening rates (Fig. 7d). The cyclone frequency anomaly pattern of extremely windy seasons (Fig. 7a) looks different to the one of extremely wet seasons (Fig. 3a). In contrast to wet seasons, windy seasons in DJF are associated with anomalously few cyclones in many regions of the world, in particular in the main SH storm track between 40 and 70° S and in large parts of the North Pacific, the northeastern North Atlantic, the northern part of the UK, Scandinavia, western Russia, and the Barents–Kara Sea (Fig. 7a). Hence, windy DJF seasons are often the result of relatively few but particularly intense cyclones, consistent with the above-discussed windy winter of 1988–1989 over the UK and Scandinavia (Sect. 3.1.2). In contrast, positive cyclone frequency anomalies during windy seasons occur in the southern part of the North Atlantic storm track in a band extending from the Gulf of Mexico to the Mediterranean, along the US west coast, over Canada, and to the north and the south of the main storm track in the SH. In these regions, windy seasons result from the combination of unusually many and unusually deep cyclones. The positive cyclone frequency anomalies on the southern edge of the North Atlantic storm track suggest that windy seasons in these regions occur during anomalous equatorward deviations of the storm track and most likely also the upper-level jet. Similarly, windy seasons around 30 and 75° S are most likely linked to equatorward and poleward shifts, respectively, of the SH storm track. Some continental regions close to topography such as the central US, Alaska, Greenland, China, eastern Russia, and Antarctica are associated with neither more nor deeper cyclones during extremely windy seasons, a similar pattern to the one found for wet seasons (Fig. 3a, c). In these regions, strong winds are probably significantly influenced by mountain effects and orographic-flow systems such as, for instance, mountain waves, downslope windstorms, and mountain–valley winds (Zardi and Whiteman, 2012; Jackson et al., 2013). Although there are no anomalies in cyclone frequency and intensity in these regions, cyclones in remote locations outside of the extreme-season objects could also contribute to strong winds in these regions by directing the flow toward the topography, in the same way as for heavy precipitation.
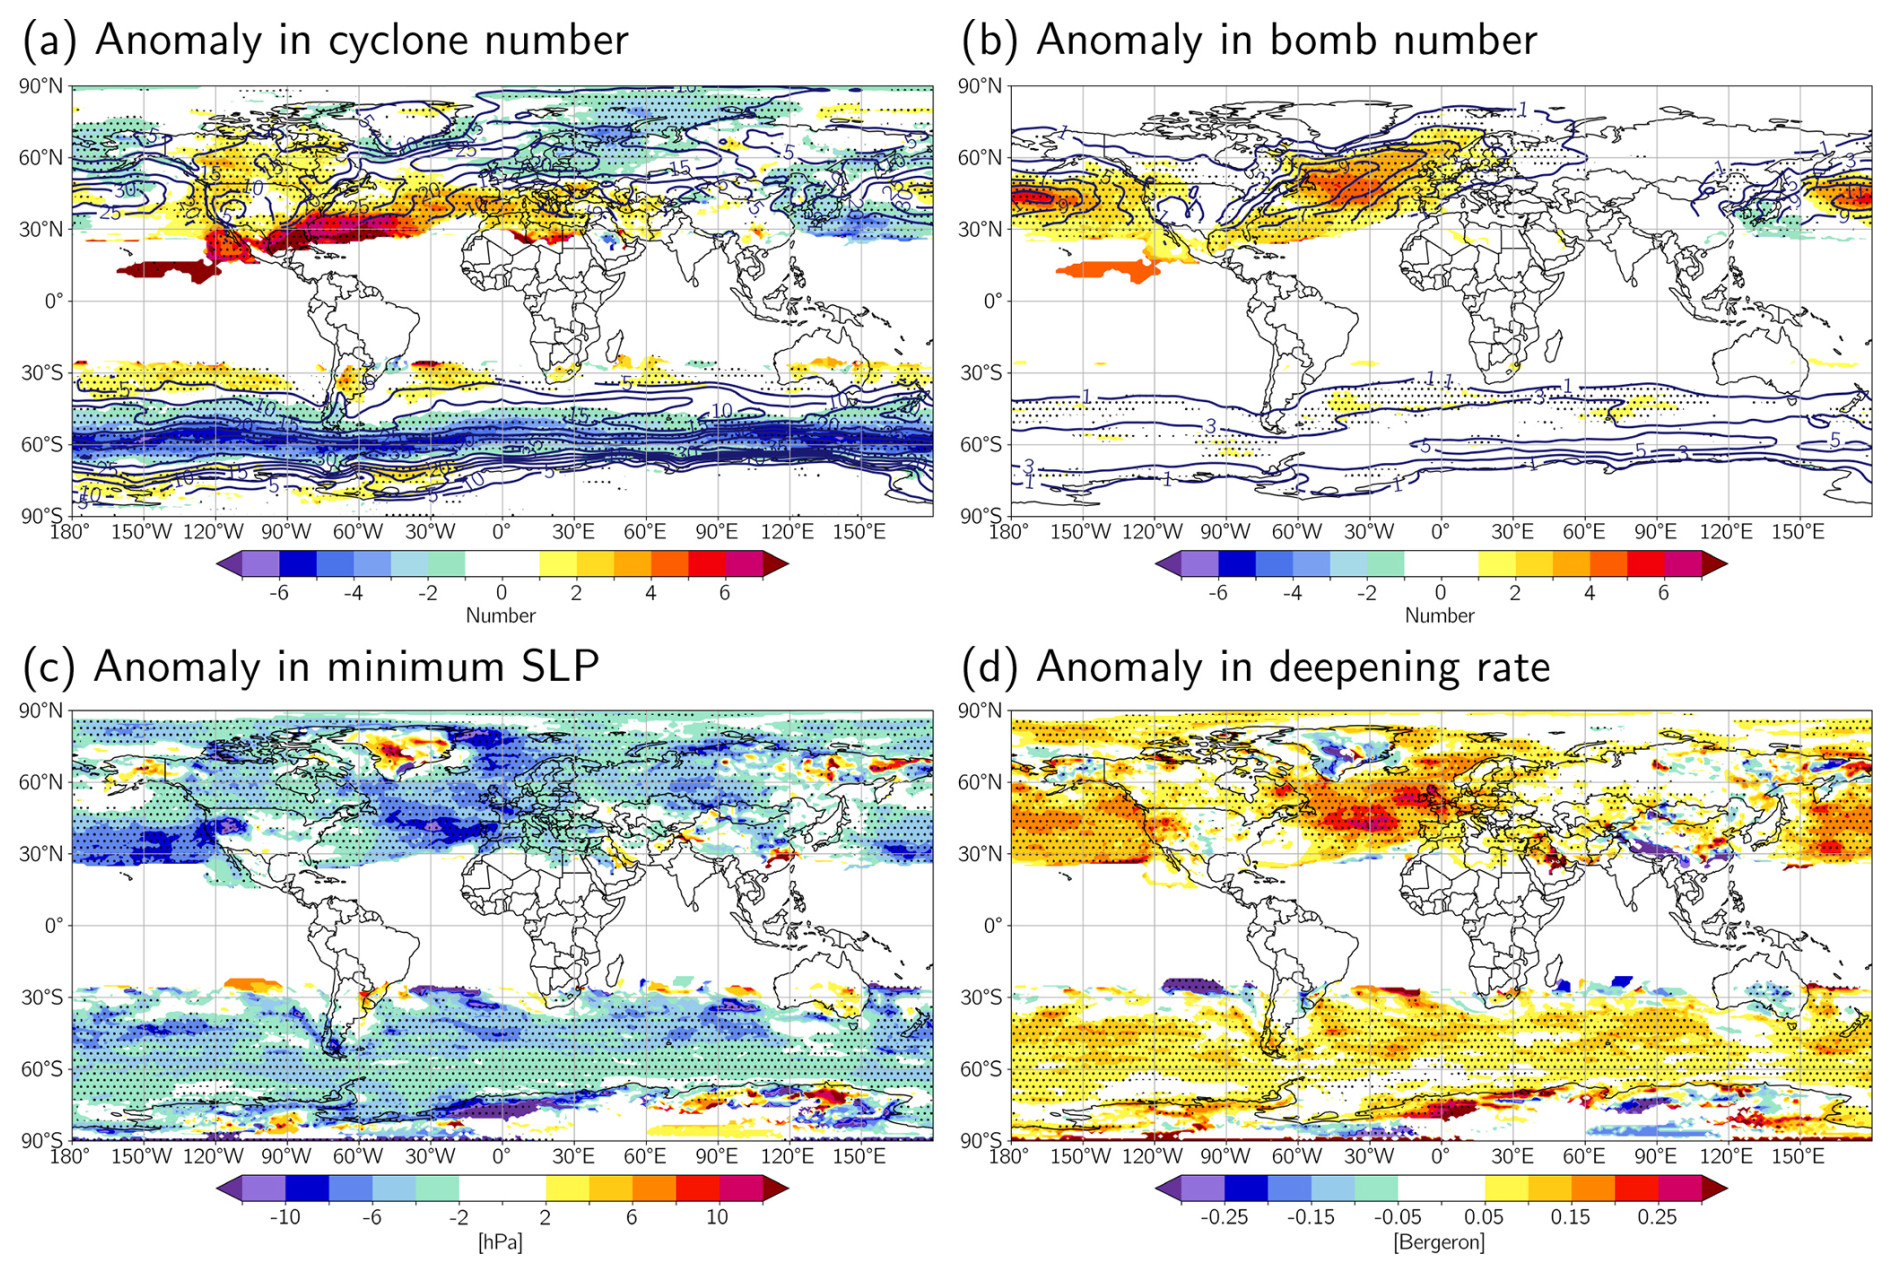
Figure 7As Fig. 3, but for extremely windy DJF seasons.
In many regions of the world (e.g. over the main ocean basins, the western US, and western Europe), cyclones originate some degrees further to the west than usual during windy DJF seasons (Fig. 8b), and, in particular over the NH ocean basins, they last about 5–15 h longer (Fig. 8c). The anomaly pattern in genesis latitude is less coherent but indicates negative anomalies (i.e. a more equatorward origin) at the entrance to the North Atlantic storm track and over the UK (Fig. 8a). Cyclones contributing to windy seasons are more stationary than usual in the western North Atlantic but less stationary in many other regions of the world such as the SH storm track, the central North Pacific, the northeastern North Atlantic, the Mediterranean, the Arctic Ocean, and central Europe (Fig. 8d). The fast motion is consistent with the high intensification of the cyclones (Fig. 7d).
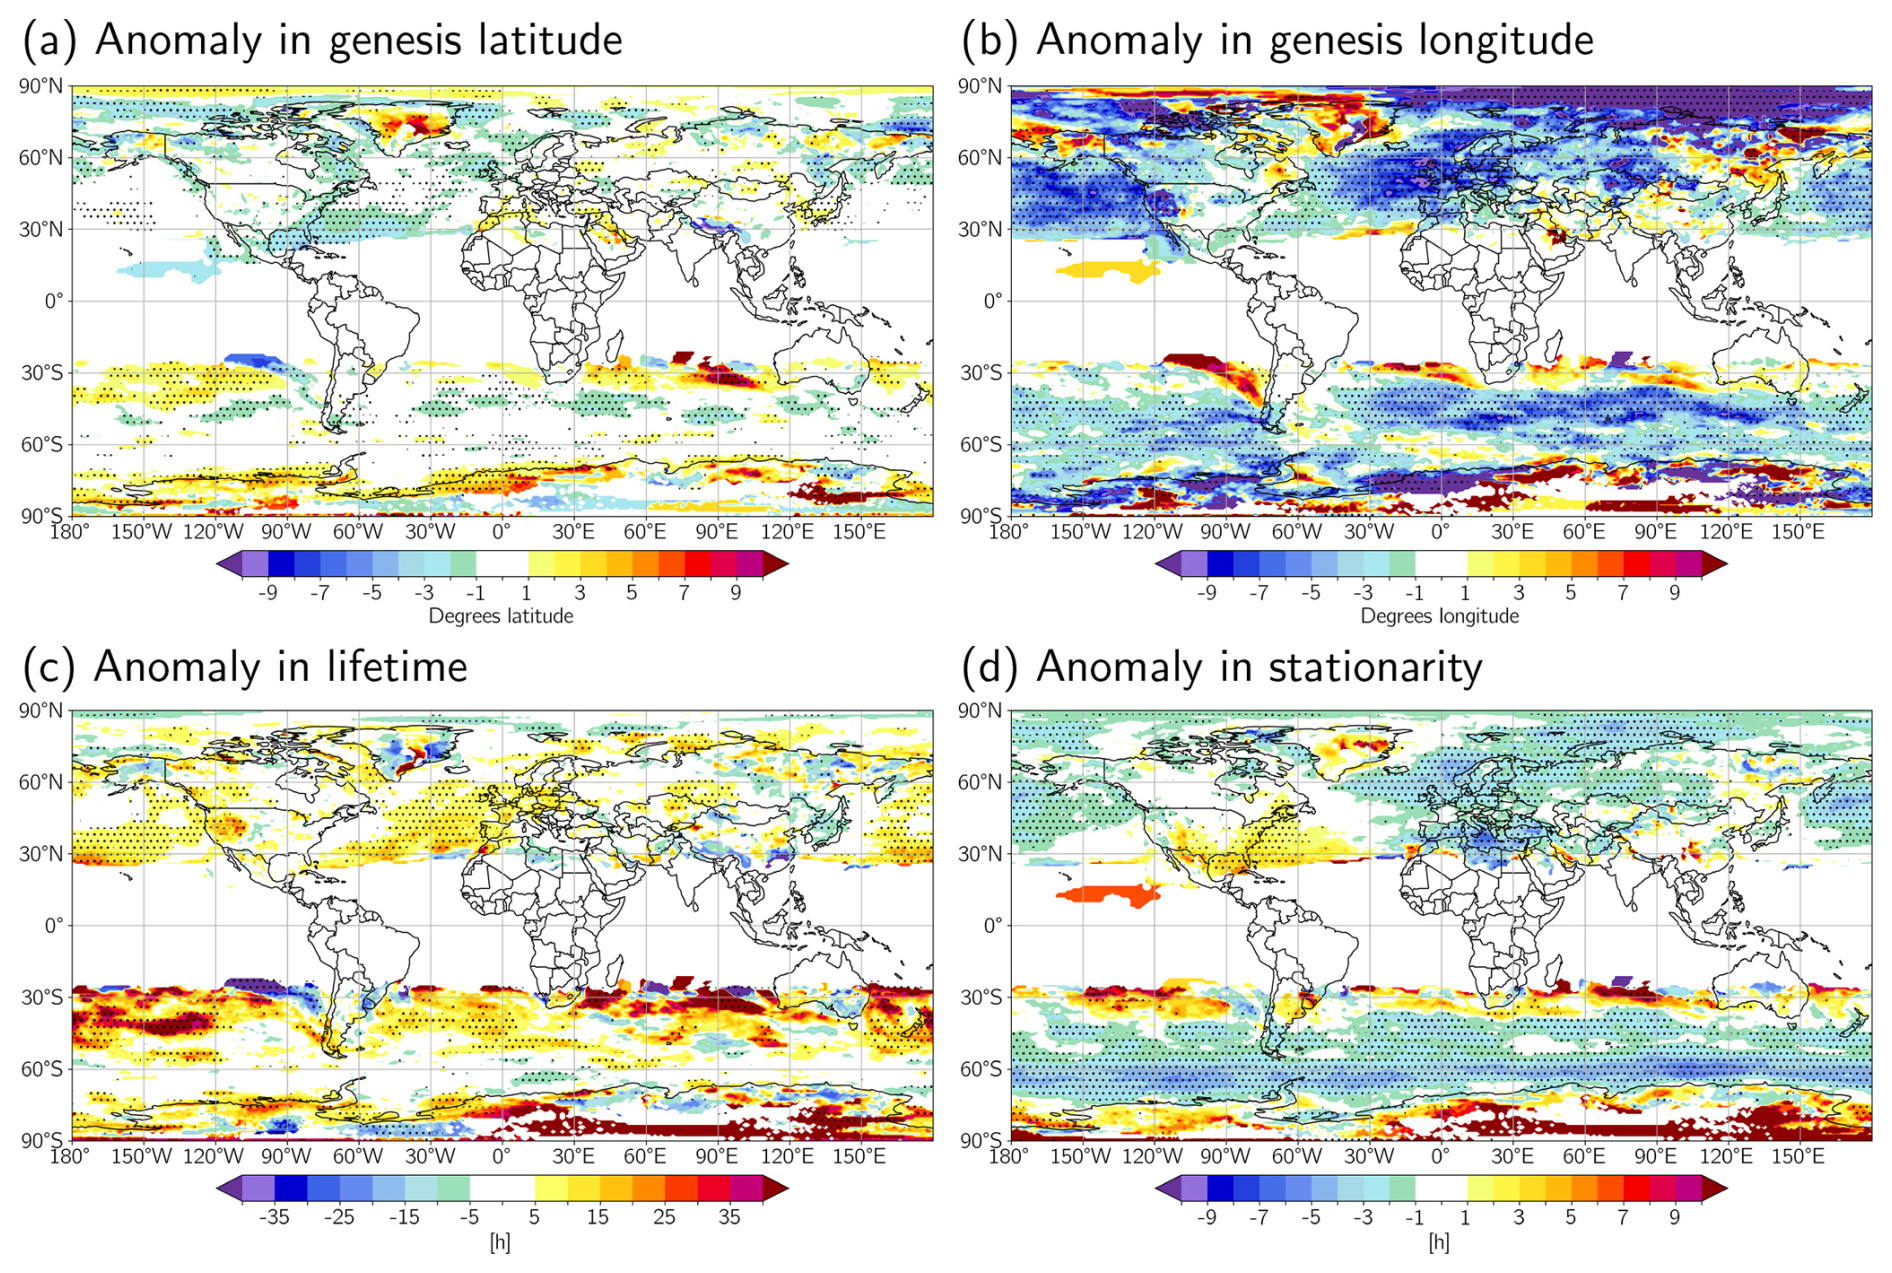
Figure 8As Fig. 4, but for extremely windy DJF seasons.
In JJA, windy seasons are associated with anomalously few but intense cyclones in almost the entire SH midlatitudes (Fig. 9a, b), and they originate further west and move faster than in the climatology (Fig. S9d, f). In the NH, fewer but more intense cyclones also occur over parts of the North Pacific. The North Atlantic, the Arctic Ocean, and Canada are associated with both more and deeper cyclones, while the central and eastern US and parts of Europe are associated with more but not deeper cyclones. Over most of Asia and in the western US, the Mediterranean, and Greenland, windy summers are associated with neither more nor deeper cyclones. In these regions, the windy seasons probably result from anomalies in the frequency and intensity of other mechanisms that can cause strong winds, such as heat lows (e.g. Rowson and Colucci, 1992; Rácz and Smith, 1999), summertime convection (e.g. Yang et al., 2017), and orographic effects (Zardi and Whiteman, 2012; Jackson et al., 2013), or they are related to cyclones at more remote locations (e.g. Pfahl, 2014).
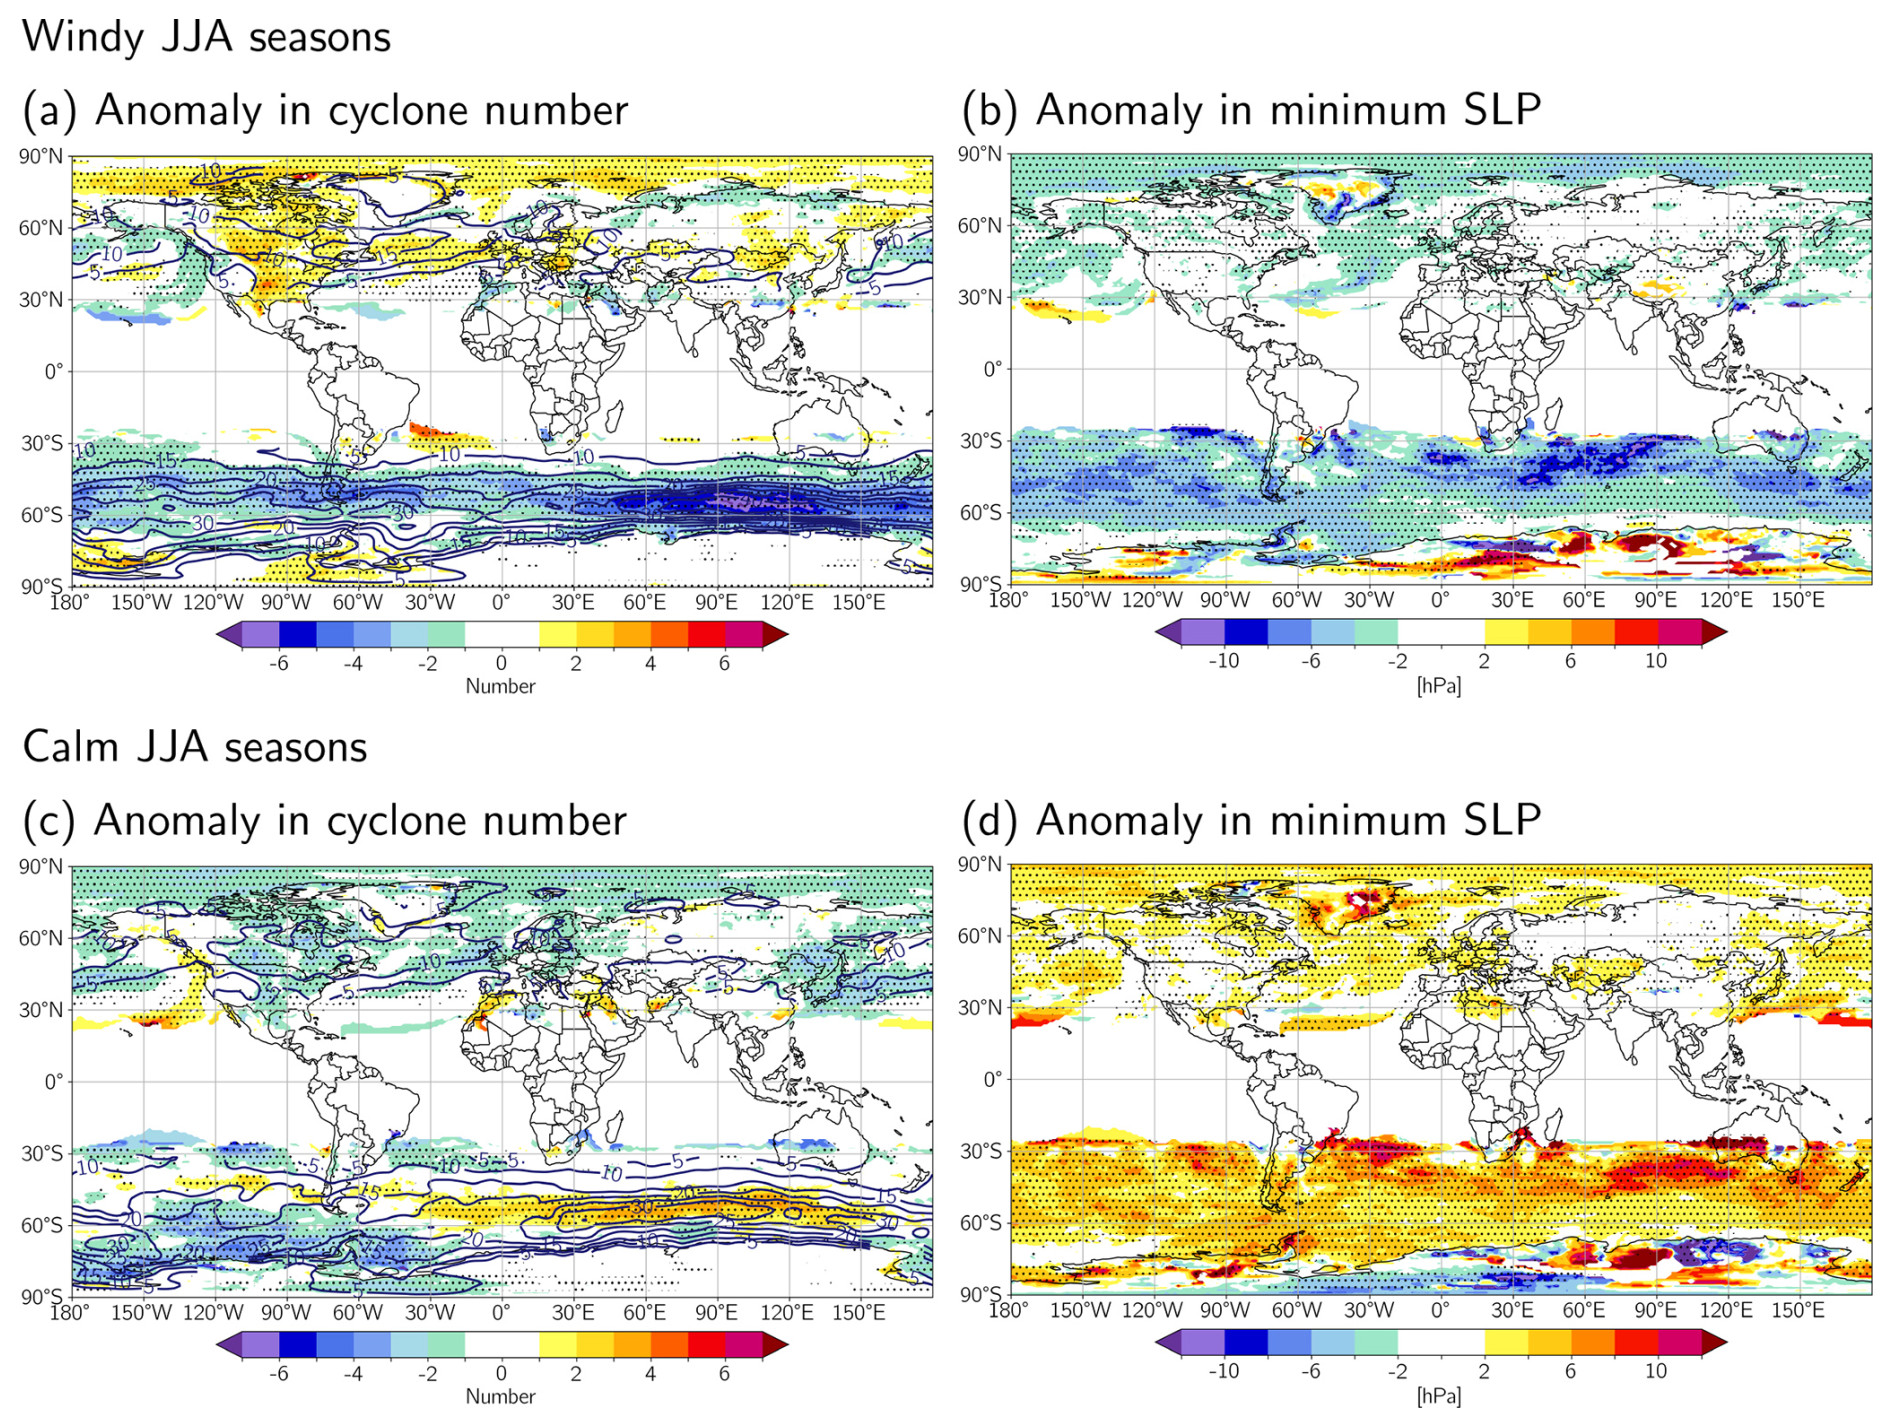
Figure 9As Fig. 5, but for extremely (a, b) windy and (c, d) calm JJA seasons.
4.4 Extremely calm seasons
Of the four different types of extreme seasons, calm seasons might appear to be the least impactful. However, particularly for the energy sector, which increasingly relies on renewable sources, seasons with minimum near-surface winds pose growing challenges. In extremely calm seasons, many of the anomaly patterns contrast with those observed during extremely windy seasons. In DJF, in most of the extratropics, the cyclones are less intense (Fig. 10c). Exceptions without any significant anomalies are again some continental regions close to topography such as the central US, Greenland, China, eastern Russia, and Antarctica. Cyclones typically have weaker intensification rates (Fig. 10d), and in the NH storm track regions, the number of bomb cyclones is strongly reduced (Fig. 10b). The cyclone frequency anomalies are negative in large parts of the NH extratropics and on the northern and southern flanks of the SH storm track (Fig. 10a). Thus, in these regions, calm seasons are typically the result of unusually few and weak cyclones. In contrast, positive cyclone frequency anomalies occur in the main SH storm track; i.e. more but weaker cyclones occur during calm seasons there.
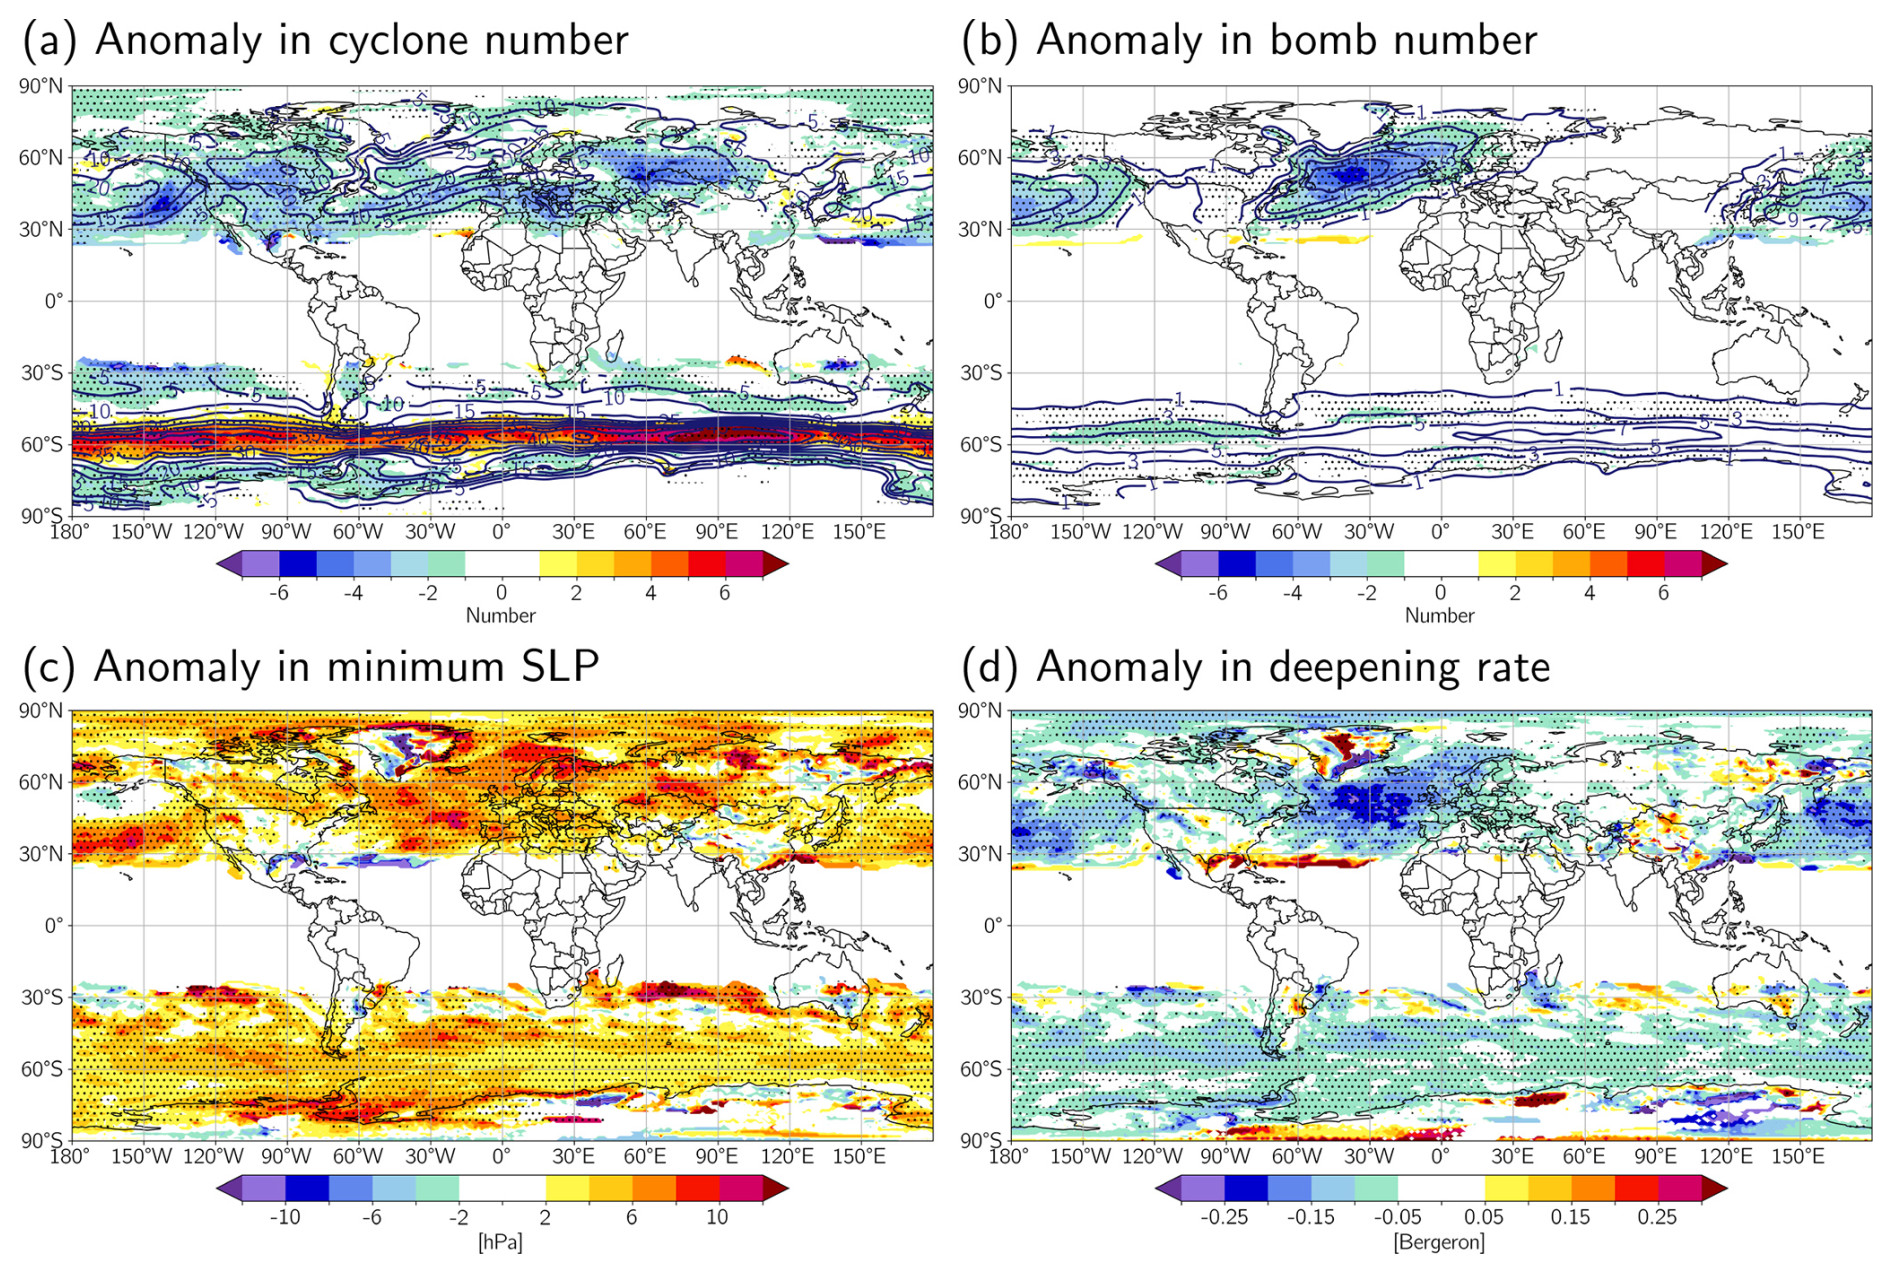
Figure 10As Fig. 3, but for extremely calm DJF seasons.
Calm JJA seasons are also associated with anomalously weak cyclones throughout the SH extratropics and in large parts of the NH ocean basins, Canada, and parts of Europe, but the anomalies in the NH are weaker in JJA than during DJF (Fig. 9d). The positive cyclone frequency anomalies in the SH storm track are weaker and extend over a smaller longitudinal area than in DJF, with negative anomalies in large parts of the SH extratropics (Fig. 9c). In the NH, negative cyclone frequency anomalies are found in many oceanic regions and over central and eastern North America, eastern Europe, and eastern China. Similar to windy summers, in many continental regions (e.g. large parts of Asia, the US west coast, and Greenland) and over the Mediterranean, calm summers are not associated with strong anomalies in either the frequency or the intensity of cyclones, which further corroborates the hypothesis that the presence or absence of strong winds in these regions is, in summer, mainly related to phenomena other than extratropical cyclones. In both seasons, in many parts of the world and in particular over the oceans, cyclones contributing to calm seasons originate further eastward, have shorter lifetimes, and are more stationary than in the climatology (Fig. S10).
In this study, we investigate the importance of extratropical cyclones and their characteristics to the occurrence of extremely wet, dry, windy, and calm seasons in the extratropics in 1050 years of present-day (1990–2000) climate simulations from the Community Earth System Model Large Ensemble (CESM-LE) and in 71 years from ERA5 reanalyses. Extreme seasons are defined as spatially coherent regions of extreme seasonal mean values of precipitation or near-surface wind, with a return period of about 40 years (Röthlisberger et al., 2021; Boettcher et al., 2023). For each extreme-season object, cyclones are identified that crossed the object area during the extreme season and during each other season in the climatology, and the characteristics of these cyclones, such as intensity, origin, lifetime, and stationarity, are compared. In CESM, each grid point overlaps with about 10–25 extreme-season objects, which allows for a detailed statistical analysis of the associated cyclone characteristics everywhere in the extratropics. The results based on CESM qualitatively agree with those based on ERA5. This indicates that the climate model captures the properties of extratropical cyclones reasonably well, which is in line with previous studies that investigated cyclones and their associated warm conveyor belts in CESM-LE simulations (Binder et al., 2023; Joos et al., 2023).
We now summarise and discuss the main findings for extremely wet and windy seasons. With a few exceptions mentioned in Sect. 4, extremely dry and calm seasons have reversed cyclone properties compared to wet and windy seasons and therefore do not require a separate discussion. The next paragraphs look at the main storm track regions (where cyclones are frequent) first, then at oceanic regions at the edge of the storm tracks, and finally at selected land regions.
In the main storm track regions, extremely wet winters (DJF for the NH and JJA for the SH) are associated with positive anomalies in cyclone and bomb cyclone frequencies. At the downstream ends of the NH storm tracks and in parts of the SH storm track, the cyclones are also anomalously intense and have a further westward origin than usual. In contrast to extremely wet winters, windy winters are associated with negative cyclone frequency anomalies in most of the main storm track regions. However, the cyclones are significantly more intense than in the climatology, with an anomalously high number of bomb cyclones, and they originate further to the west, move faster, and have longer lifetimes. Thus, a few exceptionally strong storms can result in extreme seasonal wind anomalies in the main storm track regions. In summer, extremely wet seasons are characterised by anomalously many cyclones and windy seasons by anomalously intense cyclones in most of the main storm track regions, but the anomalies are weaker than in winter. In oceanic regions at the equatorward edges of the storm tracks, anomalously many and stationary cyclones occur during extremely wet seasons in both winter and summer. Windy seasons in these regions are often characterised by anomalously many, deep, and long-lived cyclones, in particular at the southern edge of the North Atlantic storm track during winter and on the southern and northern edges of the SH storm track during winter and summer. They are most likely linked to latitudinal shifts in the positions of the storm track and the upper-level jet.
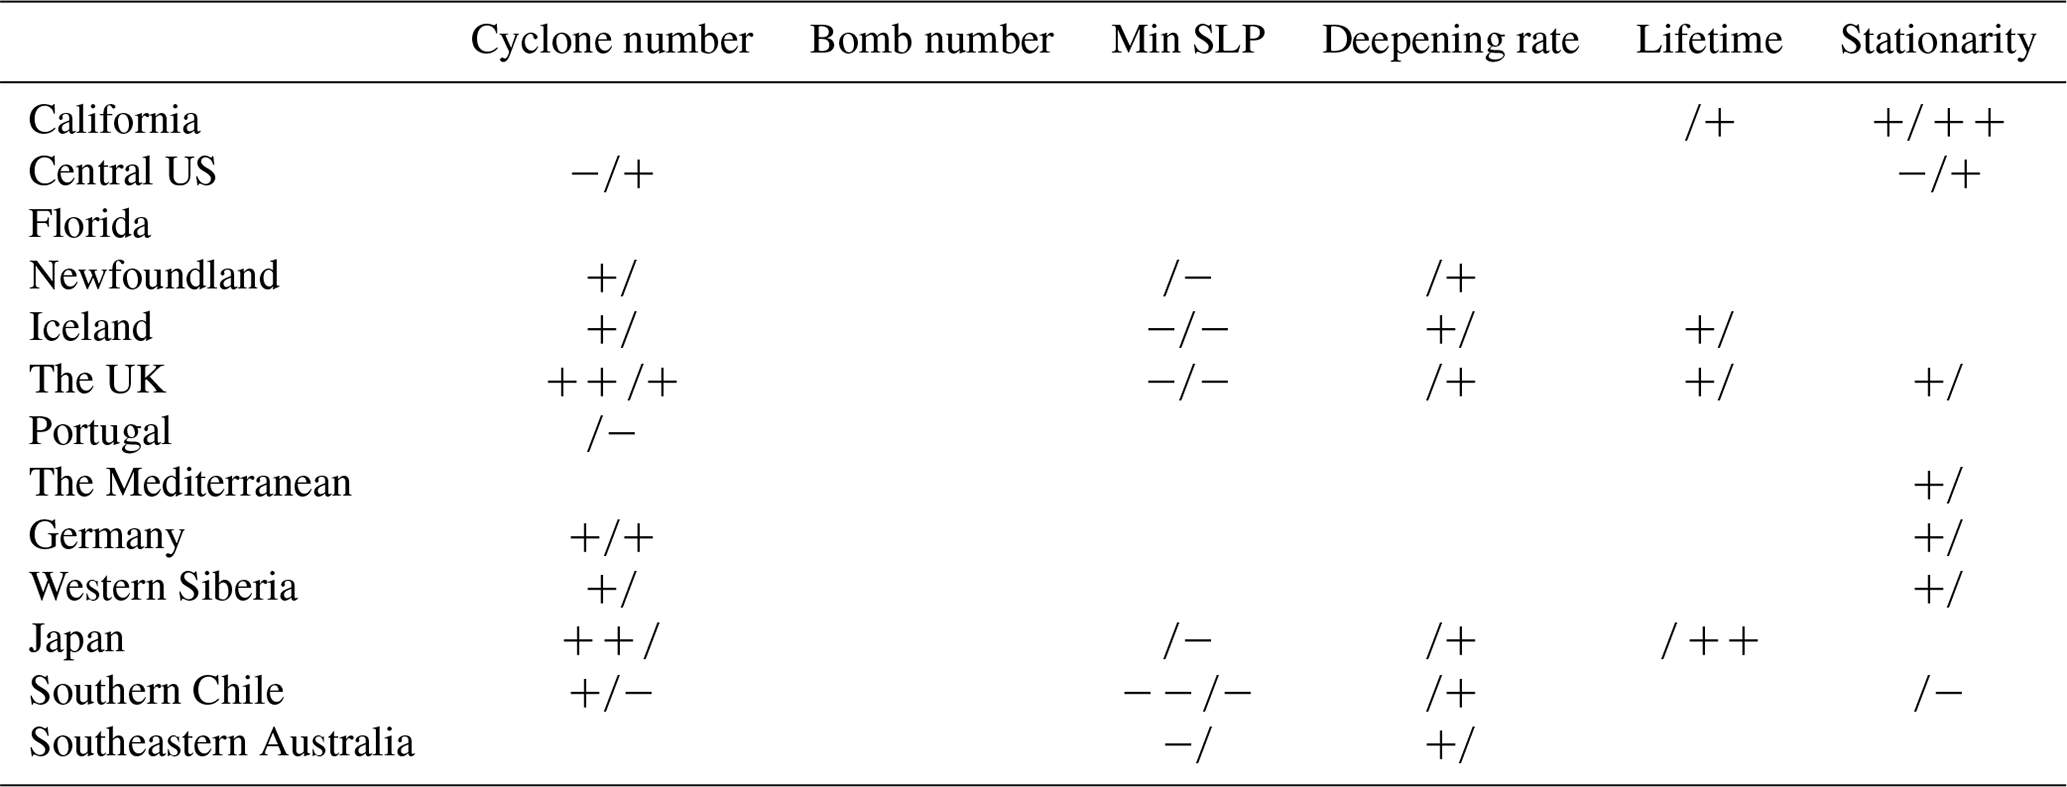
The cyclone anomaly patterns for selected land regions are summarised in Table 2 for local winter and Table 3 for local summer. They highlight strong differences between the regions, between winter and summer, and between wet and windy seasons. For instance, during extremely wet winters, California is associated with medium-strong positive anomalies in cyclone frequencies and deepening rates and strong negative anomalies in minimum SLP (i.e. particularly deep cyclones); the central US is not associated with significant anomalies in any of the cyclone characteristics considered, while Florida is associated with strong positive anomalies in cyclone frequencies and stationarity and medium-strong positive anomalies in the frequency of bomb cyclones. Wet winters over the UK are characterised by anomalously many and deep cyclones; over Portugal, they are characterised by anomalously many, deep, strongly deepening, and long-lived cyclones; and over the Mediterranean by anomalously many and stationary cyclones. During extremely wet summers, cyclones are anomalously frequent over Newfoundland, Iceland, Germany, western Siberia, southern Chile; and particularly the UK and Japan; anomalously rare over the central US; anomalously deep over Iceland, the UK, southern Chile, and southeastern Australia; anomalously long-lived over Iceland and the UK; and anomalously stationary over California, the UK, the Mediterranean, Germany, and western Siberia (Table 3). Extremely windy winters also exhibit strong spatial variability in the cyclone anomaly patterns that often differ from those of wet winters (Table 2). For instance, California is associated with positive anomalies in cyclone frequencies, bomb cyclone frequencies, and deepening rates and strong negative anomalies in minimum SLP, while Florida is associated with positive anomalies in cyclone frequencies, bomb cyclone frequencies, and stationarity. Windy winters over Iceland are characterised by anomalously few but deep and strongly deepening cyclones; over Portugal, they are characterised by anomalously many, deep, strongly deepening, and long-lived cyclones; over southeastern Australia by anomalously deep cyclones; and over Japan by anomalously few cyclones and bombs. During extremely windy summers, cyclones are anomalously frequent over the central US, the UK and Germany; anomalously rare over Portugal and southern Chile; anomalously deep over Newfoundland, Iceland, the UK, Japan and southern Chile; anomalously long-lived over California and Japan; anomalously stationary over California and the central US; and anomalously fast-moving over southern Chile (Table 3).
Table 2Cyclone characteristic anomalies of extreme seasons in specific regions during local winter (DJF, except for southern Chile and southeastern Australia, where it is JJA). The first entry in each column is for extremely wet seasons and the second for extremely windy seasons. symbols denote statistically significant anomalies; double symbols indicate that they are particularly large. Empty entries signify weak and/or not statistically significant anomalies.

Table 3As Table 2, but for extreme seasons during local summer.
Extremely dry and calm seasons also exhibit strong spatial variability in the cyclone frequencies and properties, but in many regions of the world, they are characterised by particularly few or weak cyclones that often originate further poleward and eastward (or less far to the south and west) and have shorter lifetimes than in the climatology. Thus, the absence of extratropical cyclones can also contribute to the formation of extreme seasons. In a future study, it would be interesting to investigate globally whether calm and dry seasons are systematically associated with increased occurrences of other weather systems such as, for instance, surface anticyclones and blockings, which have been shown to be conducive to persistent dry episodes (e.g. Röthlisberger and Martius, 2019) or even entire dry seasons (e.g. Black et al., 2004).
Our results show that the presence or absence of extratropical cyclones and their characteristics such as intensification and stationarity play a crucial role in the occurrence of extremely wet, dry, windy, and calm seasons around the globe. While the relationship between extratropical cyclones and short-term wind and precipitation extremes is well-known (e.g. Gyakum, 1983; Wernli et al., 2002; Ulbrich et al., 2003; Pfahl and Wernli, 2012), for extremes on seasonal timescales, the importance has thus far only been assessed for a small number of events (e.g. Davies, 2015; Flaounas et al., 2021; Boettcher et al., 2023). The systematic global analysis presented here provides unique insight into the cyclone characteristics during many different types of extreme seasons and highlights their seasonal and remarkably large regional variability (Tables 2 and 3). The results also indicate that changes in the number, geographical distribution, and properties of extratropical cyclones under global warming would significantly affect extreme seasons around the globe. An essential next step is to evaluate such changes and their impact on extreme seasons in future climate simulations.
As a caveat, we note that the study is based on output from a single climate model with a relatively low spatial and temporal resolution. The complex mesoscale substructures of surface precipitation and wind gusts are not adequately captured at this resolution. However, running CESM-LE at a higher spatial resolution would significantly increase the computational costs and limit the number of simulations. For the present study, we assume that the availability of large-ensemble simulations, which allow for statistically robust conclusions, is more valuable than a much smaller number of simulations with higher spatial resolutions.
While the presence or absence of extratropical cyclones is crucial to the formation of many extreme seasons, it is most likely not solely responsible for their occurrence. Case studies have shown that longer-term climate conditions such as anomalies in soil moisture, sea surface temperature, sea ice extent, and tropical convection can also contribute to their formation (Fischer et al., 2007; Dole et al., 2014; Hartmuth et al., 2022). This suggests that processes operating on different spatial and temporal scales are important for many extreme seasons around the globe. The exact interplay between short-term weather variability and longer-term climate conditions in creating extreme seasons remains to be investigated in future studies.
The ERA5 extreme-season objects (Boettcher et al., 2023) can be accessed through the extreme-season explorer (https://intexseas-explorer.ethz.ch, last access: 20 September 2024), and the ERA5 reanalyses (Hersbach et al., 2020) can be obtained from the Copernicus Climate Change Service, Climate Data Store (https://doi.org/10.24381/cds.adbb2d47). The code for the CESM model (Hurrell et al., 2013) that was used in the CESM-LE simulations is available from https://www.cesm.ucar.edu/models/cesm1.0/ (last access: 20 September 2024). The model outputs of the CESM-LE reruns, the CESM-LE extreme-season objects, and the cyclone data used in this study are available from the authors upon request.
The supplement related to this article is available online at: https://doi.org/10.5194/wcd-6-151-2025-supplement.
HB and HW designed the study. HB performed the study and wrote the paper, with feedback about the results and text from HW.
At least one of the (co-)authors is a member of the editorial board of Weather and Climate Dynamics. The peer-review process was guided by an independent editor, and the authors also have no other competing interests to declare.
Publisher’s note: Copernicus Publications remains neutral with regard to jurisdictional claims made in the text, published maps, institutional affiliations, or any other geographical representation in this paper. While Copernicus Publications makes every effort to include appropriate place names, the final responsibility lies with the authors.
We thank Urs Beyerle (ETH Zurich) for performing the CESM-LE reruns, Michael Sprenger (ETH Zurich) for performing the cyclone tracking, and MeteoSwiss and ECMWF for granting access to the ERA5 reanalyses. We are grateful to Katharina Hartmuth (ETH Zurich), Mauro Hermann, Matthias Röthlisberger (both formerly at ETH Zurich), and two anonymous reviewers for valuable comments and discussions.
This research has been supported by the Schweizerischer Nationalfonds zur Förderung der Wissenschaftlichen Forschung (grant no. 185049) and the EU H2020 European Research Council (grant no. 787652).
This paper was edited by Silvio Davolio and reviewed by two anonymous referees.
Benjamini, Y. and Hochberg, Y.: Controlling the false discovery rate: a practical and powerful approach to multiple testing, J. Roy. Stat. Soc., 57, 289–300, https://doi.org/10.1111/j.2517-6161.1995.tb02031.x, 1995. a
Binder, H., Rivière, G., Arbogast, P., Maynard, K., Bosser, P., Joly, B., and Labadie, C.: Dynamics of forecast-error growth along cut-off Sanchez and its consequence for the prediction of a high-impact weather event over southern France, Q. J. Roy. Meteor. Soc., 147, 3263–3285, https://doi.org/10.1002/qj.4127, 2021. a
Binder, H., Joos, H., Sprenger, M., and Wernli, H.: Warm conveyor belts in present-day and future climate simulations – Part 2: Role of potential vorticity production for cyclone intensification, Weather Clim. Dynam., 4, 19–37, https://doi.org/10.5194/wcd-4-19-2023, 2023. a, b
Black, E., Blackburn, M., Harrison, G., Hoskins, B., and Methven, J.: Factors contributing to the summer 2003 European heatwave, Weather, 59, 217–223, https://doi.org/10.1256/wea.74.04, 2004. a
Boettcher, M., Röthlisberger, M., Attinger, R., Rieder, J., and Wernli, H.: The ERA5 extreme seasons explorer as a basis for research at the weather and climate interface, B. Am. Meteorol. Soc., 104, E631–E644, https://doi.org/10.1175/BAMS-D-21-0348.1, 2023 (data available at: https://intexseas-explorer.ethz.ch, last access: 20 September 2024). a, b, c, d, e, f, g
Browning, K. A.: Organization of clouds and precipitation in extratropical cyclones, in: Extratropical Cyclones: The Erik Palmén Memorial Volume, edited by: Newton, C. W. and Holopainen, E. O., 129–153, Amer. Meteor. Soc., https://doi.org/10.1007/978-1-944970-33-8_8, 1990. a
Browning, K. A.: The sting at the end of the tail: Damaging winds associated with extratropical cyclones, Q. J. Roy. Meteor. Soc., 130, 375–399, https://doi.org/10.1256/qj.02.143, 2004. a
Burt, S. D.: The UK's highest low-level wind speed re-examined: the Fraserburgh gust of 13 February 1989, Weather, 76, 4–11, https://doi.org/10.1002/wea.3864, 2021. a
Cattiaux, J., Vautard, R., Cassou, C., Yiou, P., Masson-Delmotte, V., and Codron, F.: Winter 2010 in Europe: A cold extreme in a warming climate, Geophys. Res. Lett., 37, L20704, https://doi.org/10.1029/2010GL044613, 2010. a
Catto, J. L. and Pfahl, S.: The importance of fronts for extreme precipitation, J. Geophys. Res., 118, 10–791, https://doi.org/10.1002/jgrd.50852, 2013. a
Chang, E. K., Zheng, C., Lanigan, P., Yau, A. M., and Neelin, J. D.: Significant modulation of variability and projected change in California winter precipitation by extratropical cyclone activity, Geophys. Res. Lett., 42, 5983–5991, https://doi.org/10.1002/2015GL064424, 2015. a
Colle, B. A., Smith, R. B., and Wesley, D. A.: Theory, observations, and predictions of orographic precipitation, in: Mountain weather research and forecasting: Recent progress and current challenges, edited by: Chow, F. K., De Wekker, S. F., and Snyder, B. J., Springer, Dordrecht, the Netherlands, 291–344, https://doi.org/10.1007/978-94-007-4098-3_6, 2013. a
Dacre, H. F., Hawcroft, M. K., Stringer, M. A., and Hodges, K. I.: An extratropical cyclone atlas: A tool for illustrating cyclone structure and evolution characteristics, B. Am. Meteorol. Soc., 93, 1497–1502, https://doi.org/10.1175/BAMS-D-11-00164.1, 2012. a
Davies, H. C.: Weather chains during the 2013/2014 winter and their significance for seasonal prediction, Nat. Geosci., 8, 833–837, https://doi.org/10.1038/ngeo2561, 2015. a, b, c, d
Dole, R., Hoerling, M., Kumar, A., Eischeid, J., Perlwitz, J., Quan, X.-W., Kiladis, G., Webb, R., Murray, D., Chen, M., Wolter, K., and Zhang, T.: The making of an extreme event: putting the pieces together, B. Am. Meteorol. Soc., 95, 427–440, https://doi.org/10.1175/BAMS-D-12-00069.1, 2014. a, b
Dolores-Tesillos, E., Teubler, F., and Pfahl, S.: Future changes in North Atlantic winter cyclones in CESM-LE – Part 1: Cyclone intensity, potential vorticity anomalies, and horizontal wind speed, Weather Clim. Dynam., 3, 429–448, https://doi.org/10.5194/wcd-3-429-2022, 2022. a
Doswell, C. A., Ramis, C., Romero, R., and Alonso, S.: A diagnostic study of three heavy precipitation episodes in the western Mediterranean region, Weather Forecast., 13, 102–124, https://doi.org/10.1175/1520-0434(1998)013<0102:ADSOTH>2.0.CO;2, 1998. a
Earl, N., Dorling, S., Starks, M., and Finch, R.: Subsynoptic-scale features associated with extreme surface gusts in UK extratropical cyclone events, Geophys. Res. Lett., 44, 3932–3940, https://doi.org/10.1002/2017GL073124, 2017. a
Eisenstein, L., Schulz, B., Pinto, J. G., and Knippertz, P.: Identification of high-wind features within extratropical cyclones using a probabilistic random forest – Part 2: Climatology over Europe, Weather Clim. Dynam., 4, 981–999, https://doi.org/10.5194/wcd-4-981-2023, 2023. a
Fink, A. H., Brücher, T., Krüger, A., Leckebusch, G. C., Pinto, J. G., and Ulbrich, U.: The 2003 European summer heatwaves and drought-synoptic diagnosis and impacts, Weather, 59, 209–216, https://doi.org/10.1256/wea.73.04, 2004. a
Fischer, E. M., Seneviratne, S. I., Vidale, P. L., Lüthi, D., and Schär, C.: Soil moisture–atmosphere interactions during the 2003 European summer heat wave, J. Climate, 20, 5081–5099, https://doi.org/10.1175/JCLI4288.1, 2007. a, b
Fischer, E. M., Beyerle, U., and Knutti, R.: Robust spatially aggregated projections of climate extremes, Nat. Clim. Change, 3, 1033–1038, https://doi.org/10.1038/nclimate2051, 2013. a
Flaounas, E., Röthlisberger, M., Boettcher, M., Sprenger, M., and Wernli, H.: Extreme wet seasons – their definition and relationship with synoptic-scale weather systems, Weather Clim. Dynam., 2, 71–88, https://doi.org/10.5194/wcd-2-71-2021, 2021. a, b
Gentile, E. S. and Gray, S. L.: Attribution of observed extreme marine wind speeds and associated hazards to midlatitude cyclone conveyor belt jets near the British Isles, Int. J. Climatol., 43, 2735–2753, https://doi.org/10.1002/joc.7999, 2023. a
Grams, C. M., Binder, H., Pfahl, S., Piaget, N., and Wernli, H.: Atmospheric processes triggering the central European floods in June 2013, Nat. Hazards Earth Syst. Sci., 14, 1691–1702, https://doi.org/10.5194/nhess-14-1691-2014, 2014. a, b
Gyakum, J. R.: On the evolution of the QE II storm. I: Synoptic aspects, Mon. Weather Rev., 111, 1137–1155, https://doi.org/10.1175/1520-0493(1983)111<1137:OTEOTI>2.0.CO;2, 1983. a, b
Hartmuth, K., Boettcher, M., Wernli, H., and Papritz, L.: Identification, characteristics and dynamics of Arctic extreme seasons, Weather Clim. Dynam., 3, 89–111, https://doi.org/10.5194/wcd-3-89-2022, 2022. a
Hawcroft, M., Shaffrey, L., Hodges, K., and Dacre, H.: How much Northern Hemisphere precipitation is associated with extratropical cyclones?, Geophys. Res. Lett., 39, L24809, https://doi.org/10.1029/2012GL053866, 2012. a
Hersbach, H., Bell, B., Berrisford, P., Hirahara, S., Horányi, A., Muñoz-Sabater, J., Nicolas, J., Peubey, C., Radu, R., Schepers, D., Simmons, A., Soci, C., Abdalla, S., Abellan, X., Balsamo, G., Bechtold, P., Biavati, G., Bidlot, J., Bonavita, M., De Chiara, G., Dahlgren, P., Dee, D., Diamantakis, M., Dragani, R., Flemming, J., Forbes, R., Fuentes, M., Geer, A., Haimberger, L., Healy, S., Hogan, R. J., Hólm, E., Janisková, M., Keeley, S., Laloyaux, P., Lopez, P., Lupu, C., Radnoti, G., de Rosnay, P., Rozum, I., Vamborg, F., Villaume, S., and Thépaut, J.-N.: The ERA5 global reanalysis, Q. J. Roy. Meteor. Soc., 146, 1999–2049, https://doi.org/10.1002/qj.3803, 2020 (data available at: https://doi.org/10.24381/cds.adbb2d47). a
Hewson, T. D. and Neu, U.: Cyclones, windstorms and the IMILAST project, Tellus, 67, 27128, https://doi.org/10.3402/tellusa.v67.27128, 2015. a
Hoskins, B. and Berrisford, P.: A potential vorticity perspective of the storm of 15–16 October 1987, Weather, 43, 122–129, https://doi.org/10.1002/j.1477-8696.1988.tb03890.x, 1988. a
Hurrell, J. W., Holland, M. M., Gent, P. R., Ghan, S., Kay, J. E., Kushner, P. J., Lamarque, J.-F., Large, W. G., Lawrence, D., Lindsay, K., Lipscomb, W. H., Long, M. C., Mahowald, N., Marsh, D. R., Neale, R. B., Rasch, P., Vavrus, S., Vertenstein, M., Bader, D., Collins, W. D., Hack, J. J., Kiehl, J., and Marshall, S.: The Community Earth System Model: a framework for collaborative research, B. Am. Meteorol. Soc., 94, 1339–1360, https://doi.org/10.1175/BAMS-D-12-00121.1, 2013 (code available at: https://www.cesm.ucar.edu/models/cesm1.0/, last access: 20 September 2024). a
Jackson, P. L., Mayr, G., and Vosper, S.: Dynamically-driven winds, in: Mountain weather research and forecasting: Recent progress and current challenges, edited by: Chow, F. K., De Wekker, S. F., and Snyder, B. J., Springer, Dordrecht, the Netherlands, 121–218, https://doi.org/10.1007/978-94-007-4098-3_3, 2013. a, b, c
Joos, H., Sprenger, M., Binder, H., Beyerle, U., and Wernli, H.: Warm conveyor belts in present-day and future climate simulations – Part 1: Climatology and impacts, Weather Clim. Dynam., 4, 133–155, https://doi.org/10.5194/wcd-4-133-2023, 2023. a, b
Kahana, R., Ziv, B., Enzel, Y., and Dayan, U.: Synoptic climatology of major floods in the Negev Desert, Israel, Int. J. Climatol., 22, 867–882, https://doi.org/10.1002/joc.766, 2002. a
Kay, J. E., Deser, C., Phillips, A., Mai, A., Hannay, C., Strand, G., Arblaster, J. M., Bates, S., Danabasoglu, G., Edwards, J., Holland, M., Kushner, P., Lamarque, J.-F., Lawrence, D., Lindsay, K., Middleton, A., Munoz, E., Neale, R., Oleson, K., Polvani, L., and Vertenstein, M.: The Community Earth System Model (CESM) large ensemble project: A community resource for studying climate change in the presence of internal climate variability, B. Am. Meteorol. Soc., 96, 1333–1349, https://doi.org/10.1175/BAMS-D-13-00255.1, 2015. a, b
Kendon, M. and McCarthy, M.: The UK's wet and stormy winter of 2013/2014, Weather, 70, 40–47, https://doi.org/10.1002/wea.2465, 2015. a, b
Knippertz, P. and Wernli, H.: A Lagrangian climatology of tropical moisture exports to the Northern Hemispheric extratropics, J. Climate, 23, 987–1003, https://doi.org/10.1175/2009JCLI3333.1, 2010. a
Knippertz, P., Wernli, H., and Gläser, G.: A global climatology of tropical moisture exports, J. Climate, 26, 3031–3045, https://doi.org/10.1175/JCLI-D-12-00401.1, 2013. a
Kunkel, K. E., Easterling, D. R., Kristovich, D. A., Gleason, B., Stoecker, L., and Smith, R.: Meteorological causes of the secular variations in observed extreme precipitation events for the conterminous United States, J. Hydrometeorol., 13, 1131–1141, https://doi.org/10.1175/JHM-D-11-0108.1, 2012. a
Lavers, D. A. and Villarini, G.: The nexus between atmospheric rivers and extreme precipitation across Europe, Geophys. Res. Lett., 40, 3259–3264, https://doi.org/10.1002/grl.50636, 2013. a
Martius, O., Zenklusen, E., Schwierz, C., and Davies, H. C.: Episodes of Alpine heavy precipitation with an overlying elongated stratospheric intrusion: A climatology, Int. J. Climatol., 26, 1149–1164, https://doi.org/10.1002/joc.1295, 2006. a
Massacand, A. C., Wernli, H., and Davies, H. C.: Heavy precipitation on the Alpine southside: An upper-level precursor, Geophys. Res. Lett., 25, 1435–1438, https://doi.org/10.1029/98GL50869, 1998. a
Matthews, T., Murphy, C., Wilby, R. L., and Harrigan, S.: Stormiest winter on record for Ireland and UK, Nat. Clim. Change, 4, 738–740, https://doi.org/10.1038/nclimate2336, 2014. a
Met Office: UK climate extremes: Gust speeds, https://www.metoffice.gov.uk/research/climate/maps-and-data/uk-climate-extremes#?tab=climateExtremes (last access: 28 May 2024), 2024. a
Mohr, S., Wilhelm, J., Wandel, J., Kunz, M., Portmann, R., Punge, H. J., Schmidberger, M., Quinting, J. F., and Grams, C. M.: The role of large-scale dynamics in an exceptional sequence of severe thunderstorms in Europe May–June 2018, Weather Clim. Dynam., 1, 325–348, https://doi.org/10.5194/wcd-1-325-2020, 2020. a
Moore, B. J., White, A. B., Gottas, D. J., and Neiman, P. J.: Extreme precipitation events in Northern California during winter 2016–17: Multiscale analysis and climatological perspective, Mon. Weather Rev., 148, 1049–1074, https://doi.org/10.1175/MWR-D-19-0242.1, 2020. a
Namias, J.: Multiple causes of the North American abnormal winter 1976–77, Mon. Weather Rev., 106, 279–295, https://doi.org/10.1175/1520-0493(1978)106<0279:MCOTNA>2.0.CO;2, 1978. a
Parton, G., Dore, A., and Vaughan, G.: A climatology of mid-tropospheric mesoscale strong wind events as observed by the MST radar, Aberystwyth, Meteor. Appl., 17, 340–354, https://doi.org/10.1002/met.203, 2010. a
Pfahl, S.: Characterising the relationship between weather extremes in Europe and synoptic circulation features, Nat. Hazards Earth Syst. Sci., 14, 1461–1475, https://doi.org/10.5194/nhess-14-1461-2014, 2014. a, b, c, d
Pfahl, S. and Wernli, H.: Quantifying the relevance of cyclones for precipitation extremes, J. Climate, 25, 6770–6780, https://doi.org/10.1175/JCLI-D-11-00705.1, 2012. a, b, c
Pfahl, S., Madonna, E., Boettcher, M., Joos, H., and Wernli, H.: Warm conveyor belts in the ERA-Interim dataset (1979–2010). Part II: Moisture origin and relevance for precipitation, J. Climate, 27, 27–40, https://doi.org/10.1175/JCLI-D-13-00223.1, 2014. a
Portmann, R., Sprenger, M., and Wernli, H.: The three-dimensional life cycles of potential vorticity cutoffs: a global and selected regional climatologies in ERA-Interim (1979–2018), Weather Clim. Dynam., 2, 507–534, https://doi.org/10.5194/wcd-2-507-2021, 2021. a, b
Rácz, Z. and Smith, R. K.: The dynamics of heat lows, Q. J. Roy. Meteor. Soc., 125, 225–252, https://doi.org/10.1002/qj.49712555313, 1999. a
Raible, C. C., Messmer, M., Lehner, F., Stocker, T. F., and Blender, R.: Extratropical cyclone statistics during the last millennium and the 21st century, Clim. Past, 14, 1499–1514, https://doi.org/10.5194/cp-14-1499-2018, 2018. a
Ralph, F. M., Neiman, P. J., Wick, G. A., Gutman, S. I., Dettinger, M. D., Cayan, D. R., and White, A. B.: Flooding on California's Russian River: Role of atmospheric rivers, Geophys. Res. Lett., 33, L13801, https://doi.org/10.1029/2006GL026689, 2006. a
Raveh-Rubin, S.: Dry intrusions: Lagrangian climatology and dynamical impact on the planetary boundary layer, J. Climate, 30, 6661–6682, https://doi.org/10.1175/JCLI-D-16-0782.1, 2017. a
Röthlisberger, M. and Martius, O.: Quantifying the local effect of Northern Hemisphere atmospheric blocks on the persistence of summer hot and dry spells, Geophys. Res. Lett., 46, 10101–10111, https://doi.org/10.1029/2019GL083745, 2019. a
Röthlisberger, M., Sprenger, M., Flaounas, E., Beyerle, U., and Wernli, H.: The substructure of extremely hot summers in the Northern Hemisphere, Weather Clim. Dynam., 1, 45–62, https://doi.org/10.5194/wcd-1-45-2020, 2020. a
Röthlisberger, M., Hermann, M., Frei, C., Lehner, F., Fischer, E. M., Knutti, R., and Wernli, H.: A new framework for identifying and investigating seasonal climate extremes, J. Climate, 34, 7761–7782, https://doi.org/10.1175/JCLI-D-20-0953.1, 2021. a, b, c, d
Röthlisberger, M., Scherrer, B., de Vries, A. J., and Portmann, R.: The role of cyclones and potential vorticity cutoffs for the occurrence of unusually long wet spells in Europe, Weather Clim. Dynam., 3, 733–754, https://doi.org/10.5194/wcd-3-733-2022, 2022. a, b, c
Rotunno, R. and Houze, R. A.: Lessons on orographic precipitation from the Mesoscale Alpine Programme, Q. J. Roy. Meteor. Soc., 133, 811–830, https://doi.org/10.1002/qj.67, 2007. a
Rowson, D. R. and Colucci, S. J.: Synoptic climatology of thermal low-pressure systems over south-western North America, Int. J. Climatol., 12, 529–545, https://doi.org/10.1002/joc.3370120602, 1992. a
Rüdisühli, S., Sprenger, M., Leutwyler, D., Schär, C., and Wernli, H.: Attribution of precipitation to cyclones and fronts over Europe in a kilometer-scale regional climate simulation, Weather Clim. Dynam., 1, 675–699, https://doi.org/10.5194/wcd-1-675-2020, 2020. a, b
Sanders, F. and Gyakum, J. R.: Synoptic-dynamic climatology of the “bomb”, Mon. Weather Rev., 108, 1589–1606, https://doi.org/10.1175/1520-0493(1980)108<1589:SDCOT>2.0.CO;2, 1980. a
Sprenger, M., Fragkoulidis, G., Binder, H., Croci-Maspoli, M., Graf, P., Grams, C. M., Knippertz, P., Madonna, E., Schemm, S., Škerlak, B., and Wernli, H.: Global climatologies of Eulerian and Lagrangian flow features based on ERA-Interim, B. Am. Meteorol. Soc., 98, 1739–1748, https://doi.org/10.1175/BAMS-D-15-00299.1, 2017. a
Ulbrich, U., Fink, A. H., Klawa, M., and Pinto, J. G.: Three extreme storms over Europe in December 1999, Weather, 56, 70–80, https://doi.org/10.1002/j.1477-8696.2001.tb06540.x, 2001. a
Ulbrich, U., Brücher, T., Fink, A. H., Leckebusch, G. C., Krüger, A., and Pinto, J. G.: The central European floods of August 2002: Part 2-Synoptic causes and considerations with respect to climatic change, Weather, 58, 434–442, https://doi.org/10.1256/wea.61.03B, 2003. a, b
Wernli, H. and Schwierz, C.: Surface cyclones in the ERA-40 dataset (1958–2001). Part I: Novel identification method and global climatology, J. Atmos. Sci., 63, 2486–2507, https://doi.org/10.1175/JAS3766.1, 2006. a
Wernli, H., Dirren, S., Liniger, M. A., and Zillig, M.: Dynamical aspects of the life cycle of the winter storm “Lothar” (24–26 December 1999), Q. J. Roy. Meteor. Soc., 128, 405–429, https://doi.org/10.1256/003590002321042036, 2002. a, b
Wilks, D. S.: “The stippling shows statistically significant grid points”: How research results are routinely overstated and overinterpreted, and what to do about it, B. Am. Meteorol. Soc., 97, 2263–2273, https://doi.org/10.1175/BAMS-D-15-00267.1, 2016. a
Yang, X., Sun, J., and Zheng, Y.: A 5-yr climatology of severe convective wind events over China, Weather Forecast., 32, 1289–1299, https://doi.org/10.1175/WAF-D-16-0101.1, 2017. a
Zardi, D. and Whiteman, C. D.: Diurnal mountain wind systems, in: Mountain weather research and forecasting: Recent progress and current challenges, edited by: Chow, F. K., De Wekker, S. F., and Snyder, B. J., Springer, Dordrecht, the Netherlands, 35–119, https://doi.org/10.1007/978-94-007-4098-3_2, 2012. a, b, c
Zschenderlein, P. and Wernli, H.: How intense daily precipitation depends on temperature and the occurrence of specific weather systems – an investigation with ERA5 reanalyses in the extratropical Northern Hemisphere, Weather Clim. Dynam., 3, 391–411, https://doi.org/10.5194/wcd-3-391-2022, 2022. a