the Creative Commons Attribution 4.0 License.
the Creative Commons Attribution 4.0 License.
 | 24 Nov 2025
Dynamics, predictability, impacts and climate change considerations of the catastrophic Mediterranean Storm Daniel (2023)
Emmanouil Flaounas
Stavros Dafis
Silvio Davolio
Davide Faranda
Christian Ferrarin
Katharina Hartmuth
Assaf Hochman
Aristeidis Koutroulis
Samira Khodayar
Mario Marcello Miglietta
Florian Pantillon
Platon Patlakas
Michael Sprenger
Iris Thurnherr
In September 2023, Storm Daniel formed in the central Mediterranean Sea, causing significant socioeconomic impacts in Greece, including fatalities and severe damage to agricultural infrastructure. Within a few days, it evolved into a tropical-like storm (medicane) that made landfall in Libya, likely becoming, to our knowledge, the most catastrophic and lethal weather event ever documented in the region.
This study places Storm Daniel as a centerpiece of the disasters in Greece and Libya. We conducted a comprehensive analysis that links a cyclone system with hazardous weather conditions relevant to extreme precipitation, floods and significant sea wave activity. In addition, we examine Daniel's predictability in different development stages and draw connections with previous case studies. Given the climatologically extreme precipitation produced by Daniel, we examine the capacity of numerical weather prediction models to capture such extremes, and we finally investigate potential links to climate change.
Daniel initially developed like any other intense Mediterranean cyclone, including medicanes: due to upper-tropospheric forcing followed by Rossby wave breaking. At this stage, it produced significant socioeconomic impacts in Greece. As it intensified and attained tropical-like characteristics, it developed markedly just prior to landfall, reaching peak intensity over land. Considering the short lead times (around 4 d), the cyclone formation exhibited low predictability, whilst landfall in Libya was more predictable. Our analysis of impacts highlights that numerical weather prediction models can capture the extreme character of precipitation and flooding in both Greece and Libya, providing crucial information on the expected severity of imminent flood events.
We also examine moisture sources contributing to extreme precipitation. Our findings indicate that large-scale atmospheric circulation was the primary driver, drawing substantial water vapor from the eastern Mediterranean, the Black Sea and continental Europe. The intensification of Storm Daniel was likely driven by anomalously warm SST in the Mediterranean and Black Sea, enhancing evaporation and contributing to the extreme precipitation along the Libyan coast. Finally, our analysis supports the interpretation of its impacts as characteristic of human-driven climate change but also highlights the exceptionality of this cyclone, especially in its medicane phase, which complicates the comparison with other cyclones.
- Article
(11889 KB) - Full-text XML
- BibTeX
- EndNote


In early September 2023, a low-pressure system developed within the central Mediterranean Sea, close to Greece. Due to the expected severity of the event, on 4 September 2023, the Hellenic National Meteorological Service named the upcoming storm “Daniel”. Daniel evolved into a deep cyclone within a few days and began moving erratically southward. On 9 September, it shifted eastward and eventually made landfall along the coast of Libya as a powerful system (Fig. 1a). Daniel led to substantial, unprecedented socioeconomic impacts in the central–eastern Mediterranean from 4 to 11 September 2023.
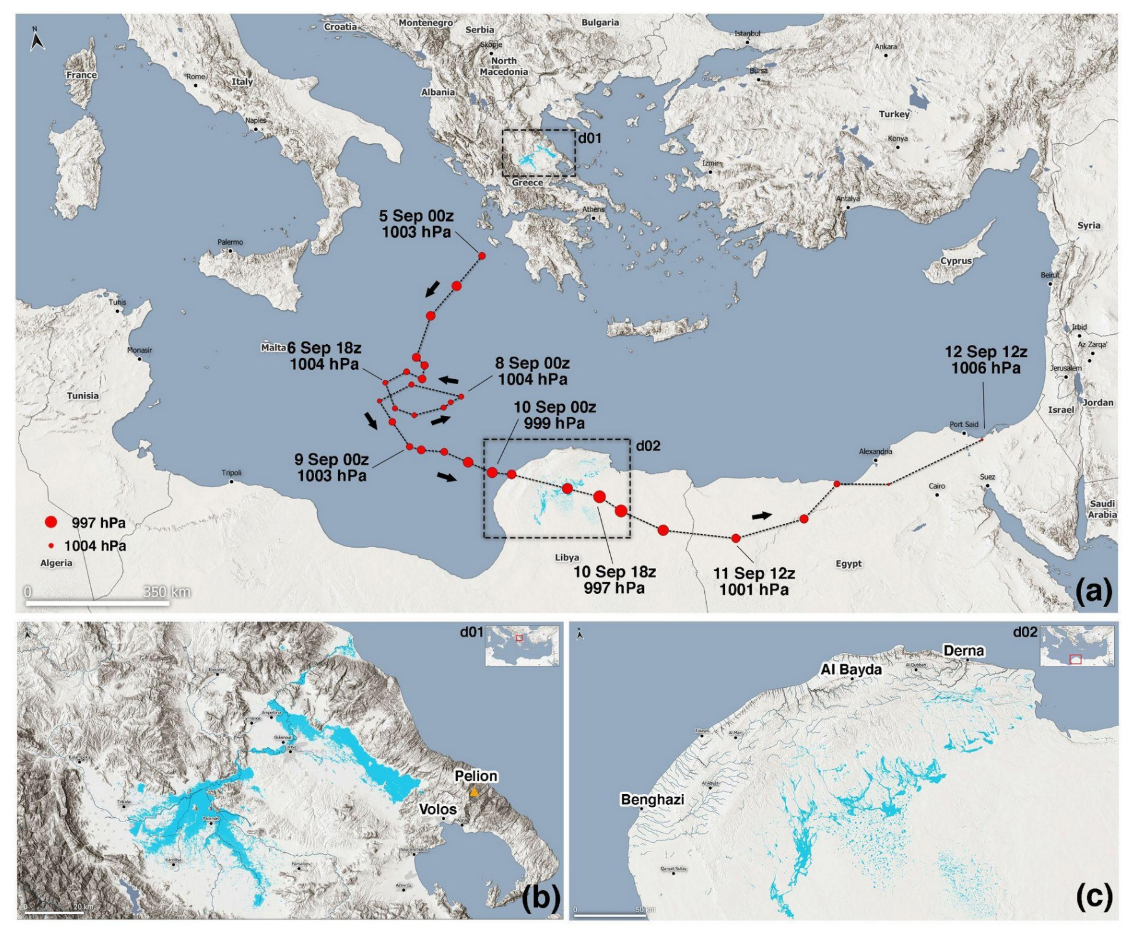
Figure 1(a) Track of Storm Daniel at 6 h intervals based on ECMWF analysis, where the size of the red dots is proportional to the cyclone depth in terms of minimum mean sea level pressure (MSLP). Flooded areas are shown in cyan and blue tones (acquired by one of the Copernicus Sentinel-2 satellites on 10 and 12 September 2023). Panels (b) and (c) zoom over central Greece and Libya (square boxes d01 and d02 in panel a).
In the cyclogenesis stage, on 5 September 2023, the weather station network of the National Observatory of Athens in Greece (NOAAN; Lagouvardos et al., 2017) measured more than 750 mm of accumulated daily rainfall in the eastern part of the Thessaly region (flooded areas are shown in cyan colors in Fig. 1b) and up to 1235 mm within 4 d. Thessaly experienced flooding that led to 17 fatalities, the loss of 25 % of Greece's annual agricultural production and the destruction of the local road network. About 5 d later, on 10 September 2023, the cyclone made landfall near Benghazi, Libya. As a result, northeastern Libya's population of 884 000 people has been affected directly in five governorates by the collapse of two dams. About 30 % of the city of Derna was flooded (Fig. 1c), and almost 900 buildings, roads and other infrastructures were destroyed in the area (OCHA, 2023). According to the digital terrain model (DTM) update (IOM, 2023), over 5000 people were presumed dead, 3922 deaths were registered in hospitals, 10 000 people were declared missing by the Libyan government and Red Crescent Society, and at least 30 000 people were recognized as internally displaced (UNICEF, 2023; IOM, 2023) in the Derna area. Extensive damage affected critical infrastructure such as hospitals and drinking water supply systems. Many roads were rendered impassable, making humanitarian aid and supplies difficult. A budget of at least USD 10 million was allocated from the UN Central Emergency Response Fund to scale up intervention in response to the Libya disaster, and almost USD 72 million was requested to cope with the most urgent needs of around 250 000 people (OCHA, 2023) just for the first 3 months after the flooding.
Daniel was an intense cyclone, preceded by Rossby wave breaking over the Atlantic Ocean, which led to the formation of an omega blocking pattern (Couto et al., 2024) and the subsequent intrusion of an upper-level trough in the Mediterranean. This scenario is commonly observed before the formation of intense Mediterranean cyclones, including medicanes (Raveh-Rubin and Flaounas, 2017). From the perspective of atmospheric dynamics, upper-tropospheric systems are often precursors of Mediterranean cyclogenesis. Such systems force ascent by advancing upper-level potential vorticity (PV) structures (Flaounas et al., 2022). While the formation of Mediterranean cyclones is almost entirely dependent on baroclinic instability, the development and intensification of a cyclone into a deep low-pressure system is also a function of diabatic processes. More precisely, latent heat release close to the cyclone center, mainly due to convection, is a source of positive PV anomalies at low levels, eventually translating into enhanced cyclonic circulation. Therefore, baroclinic instability and latent heat release are the main forcings. Both processes drive cyclones' intensification from the cyclogenesis stage until maturity, i.e., when the cyclone reaches its minimum pressure at the center. A complete review of Mediterranean cyclone dynamics is available by Flaounas et al. (2022), while Pantillon et al. (2024) provide a thorough analysis of the interplay and synergies between baroclinic and diabatic forcing for Medicane Ianos (2020).
As an environmental hazard, cyclones may produce heavy precipitation from the stage of genesis until their lysis close to their centers, but also in remote areas due to localized convective cells (Raveh-Rubin and Wernli, 2016), warm conveyor belts and frontal structures (Pfahl et al., 2014; Flaounas et al., 2018). Regardless of whether precipitation is stratiform or convective, the large-scale atmospheric circulation contributes by transporting water vapor toward the Mediterranean and thus “feeding” the cyclone-induced precipitation (Flaounas et al., 2019; Hochman et al., 2024). Indeed, the Mediterranean basin is composed of a relatively closed sea surrounded by continental areas. Consequently, Mediterranean cyclones have fewer water sources than their counterparts over the open oceans. In these regards, large-scale ventilation of water vapor from the Atlantic Ocean and other remote regions towards the Mediterranean has been shown in numerous cases to enhance heavy precipitation, together with local evaporation due to cyclone-induced high wind speeds (Duffourg and Ducrocq, 2011; Flaounas et al., 2019; Khodayar et al., 2021; Sioni et al., 2023). Hence, identifying and quantifying the contribution of water sources to heavy precipitation is a key step for improving our ability to forecast socioeconomic impacts in the Mediterranean (Hochman et al., 2022a; Khodayar et al., 2025).
From a climatological standpoint, cyclones are responsible for most of the wind and precipitation extremes within the Mediterranean (Nissen et al., 2010; Flaounas et al., 2016; Hochman et al., 2022b). Therefore, cyclones play a central role in the compoundness of high-impact weather events (Catto and Dowdy, 2021; Rousseau-Rizzi et al., 2024; Portal et al., 2024), also considering that relatively compact systems close to the coast additionally contribute to impacts with storm surges and significantly high waves (Patlakas et al., 2021; Ferrarin et al., 2023a, b). Especially in the case of precipitation, recent results have shown that intense water vapor transport and Rossby wave breaking are the two main features that lead to extreme Mediterranean events (de Vries, 2021; Hochman et al., 2023). Both of these large-scale atmospheric features favor the development of cyclones into deep, low-pressure systems, the first through baroclinic forcing and the latter through diabatic forcing by intensifying convection (e.g., Davolio et al., 2020). Thus, their understanding is crucial for predicting socioeconomic impacts on weather and climate scales.
Future trends in cyclone-induced hazards in the Mediterranean are mainly quantified through downscaling experiments (e.g., Reale et al., 2022) or statistical–deterministic methods that generate synthetic tracks (e.g., Romero and Emanuel, 2017; Sandler et al., 2024). Nevertheless, additional investigation is needed to assess the role of climate change in the intensification of storms that occur in the current climate. While attributing extreme events, such as medicanes and high-impact extratropical storms, is a rather tricky task, recent studies based on analogues have suggested that several recent storms are more intense than would have been expected in the absence of climate change (Faranda et al., 2022, 2023). Further investigation of this critical topic requires a case-by-case approach to take into account the particularities of each storm and to acquire a more holistic understanding of the specific processes related to cyclone intensity that are also affected by climate change.
When a high-impact weather event occurs, it encompasses multiple interconnected aspects often studied separately. First, understanding the event's dynamics and physical processes is crucial for assessing and interpreting weather forecasting performance and climate change attribution. Second, the associated hazards – such as floods and windstorms – must be assessed according to the specific weather conditions, as well as the vulnerability and exposure of the affected areas. Despite their interdependence, all these aspects of a specific weather event are rarely examined through an integrated approach. Our motivation is thus to apply a comprehensive framework to provide an interdisciplinary assessment of the Storm Daniel event. In particular, we aim to address the following four questions:
-
How did cyclone development stages relate to flooding in Greece and Libya?
-
How reliable and accurate were numerical models for predicting weather conditions and river discharges at different lead times?
-
Can numerical weather prediction models adequately simulate climate extremes?
-
Can we link Storm Daniel's characteristics to climate change?
The following section describes the datasets and methods, while Sect. 3 briefly describes the storm dynamics. Section 4 analyses Storm Daniel's predictability, and Sect. 5 discusses the potential contribution of natural variability and human-induced climate change to the characteristics and evolution of Storm Daniel.
2.1 Datasets
To analyze the evolution of the cyclone and assess its predictability, we use the operational analysis and the ensemble prediction system (EPS) products of the European Centre for Medium-Range Weather Forecasts (ECMWF). Since the last model upgrade at the ECMWF (Cycle 48r1), operational analysis and medium-range ensemble forecast data have been available at a grid spacing of about 9 km. The increase in horizontal resolution and improvements in the data-assimilation system led to substantial improvements in forecast skill (ECMWF Newsletter, 176, 2023). The EPS comprises 50 members that are initialized with a perturbed analysis using slightly modified model physics, along with a control forecast. This probabilistic forecasting system has been designed to provide a range of possible weather conditions up to 15 d in advance, offering an estimation of predictability. Finally, to assess Daniel's climatological aspects, we used ERA5 reanalysis (Hersbach et al., 2020), which provides hourly atmospheric fields at a 0.25° grid spacing.
We used river discharge data from the Global Flood Awareness System (GloFAS; Grimaldi et al., 2022) to investigate the hydrological impacts of Daniel across Greece and Libya. GloFAS, an integral component of the Copernicus Emergency Management Service (CEMS), provides global operational flood forecasts. It integrates the open-source LISFLOOD hydrological model with ERA5 meteorological reanalysis data, interpolated to match the GloFAS resolution (0.05° for version 4.0), and is produced at a daily frequency. This dataset includes historical discharge records essential for establishing discharge climatology from 1993 to 2023. To assess flood forecast potential, we also employed data from the European Flood Awareness System (EFAS). EFAS utilizes the open-source LISFLOOD hydrological model, calibrated at a higher spatial resolution of approximately 1.5 km over European latitudes. Forecasts are issued twice daily, initialized at 00:00 and 12:00 UTC, and provide lead times ranging from 5 to 15 d to capture a wide range of potential weather conditions affecting river discharge. These forecasts incorporate data from the 51 members of the ECMWF EPS, the Deutscher Wetterdienst (DWD) high-resolution forecasts and the 20-member COSMO Local Ensemble Prediction System (COSMO-LEPS), ensuring a comprehensive analysis of forecast capability. For this study, we used EFAS forecasts driven by the 51 ECMWF EPS ensemble members.
Finally, to evaluate Daniel's marine and coastal impacts, we analyzed wave data from the Mediterranean Sea Waves Analysis and Forecast system (Korres et al., 2023), available through the Copernicus Marine Service (CMEMS). Additionally, wave climatology was derived using the Mediterranean Sea wave reanalysis dataset (1993–2021; Korres et al., 2021), also provided by CMEMS.
2.2 Methods
2.2.1 Object diagnostics
We identify two-dimensional objects of extreme precipitation to assess the predictability of major impacts in the EPS forecasts. These objects are defined separately for each member of the EPS as neighboring grid points where daily precipitation values exceed the 99th percentile in the ERA5 climatology (1990–2020). Using these objects, we define the probability of the EPS forecasts predicting extreme weather associated with Daniel. Similarly, we define the likelihood of cyclone occurrence in the EPS by identifying cyclone masks in each ensemble member, based on the outermost mean sea level pressure (MSLP) contour enclosing an area smaller than that of a circular disk with a 200 km radius.
2.2.2 Air parcel trajectories and moisture source diagnostic
Using the LAGRANTO tool, 10 d air parcel backward trajectories were calculated at 20 hPa intervals between 1000 and 300 hPa from starting locations on a regular latitude–longitude grid with a 30 km resolution within defined boxes over Greece and Libya (as shown in Fig. 1a; Wernli and Davies, 1997; Sprenger and Wernli, 2015). We computed two sets of backward trajectories: (i) the first concerns Storm Daniel, with trajectories initialized every 6 h on 5 and 11 September 2023 from the Greece and Libya boxes, respectively, using 6 h 3D wind fields from the ECMWF operational analysis data; (ii) the second concerns air parcel trajectories based on ERA5 reanalysis wind fields and corresponds to the 100 most extreme daily precipitation events in each region. These trajectories were initialized from the same grid points in the Greece and Libya boxes as in the first set. The 100 extreme events were identified as the days with the highest number of grid points within the Libya or Greece regions recording daily surface precipitation exceeding the 90th percentile for autumn (1990–2023). Storm Daniel is included among the 100 most extreme daily precipitation events in both regions. Along all trajectories, we interpolated specific humidity, relative humidity and the boundary layer height pressure.
We identified moisture sources in Daniel and the 100 most extreme daily precipitation events using the moisture source diagnostic developed by Sodemann et al. (2008). This method tracks changes in specific humidity along all trajectories that precipitate upon arrival, which are defined as air parcels showing a decrease in specific humidity during the last time step before arrival and a relative humidity larger than 90 % upon arrival (following Sodemann et al., 2008). Along each trajectory, an increase in specific humidity is interpreted as a moisture uptake, while a decrease indicates moisture loss. Each moisture loss reduces the contribution of preceding moisture uptakes, weighted by the magnitude of each uptake.
For a detailed description of the moisture source diagnostic, see Sodemann et al. (2008). In our analysis, moisture uptakes along each trajectory were weighted by the decrease in specific humidity during the last step before arrival. Relative moisture uptakes were then computed across all trajectories for each 6 h time step, gridded onto a global 1° latitude–longitude grid and averaged daily. These values are expressed in 10−5 % km−2, indicating each grid cell's relative contribution per square kilometer to precipitation in the target region. Finally, the daily relative moisture sources averaged over the 100 most extreme events were used as a climatological reference for Daniel.
2.2.3 The role of natural variability and human-driven climate change
We applied the methodology developed in the framework “ClimaMeter” (see Faranda et al., 2024, for more details). ClimaMeter offers a dynamic approach to contextualizing and analyzing weather extremes within a climate context. This framework provides both an accessible, immediate contextualization of extreme weather events and a more in-depth technical analysis after their occurrence.
In this study, we investigate how Mediterranean depressions affecting Greece and Libya have changed in the present climate (2001–2022; factual period) compared to how they would have appeared in the past climate (1979–2000; counterfactual period). To this end, we compute analogues of MSLP anomalies associated with Storm Daniel using data from the MSWX database (Beck et al., 2022). We then identify significant differences between the present and past analogues in terms of MSLP, near-surface temperature, precipitation and wind speed.
To account for the seasonal cycle in MSLP and temperature, we remove the average pressure and temperature as well as the climatological daily mean values for each calendar day at every grid point. Total precipitation and wind speed data are not preprocessed. If the duration of the event is longer than 1 d, we apply a moving average across the duration of the event for all variables. We examined all daily MSLPs within each period and selected the best 15 analogues, i.e., those that minimize the Euclidean distance to the event, representing roughly the smallest 1 ‰ Euclidean distances in each subset. We tested extracting between 10 and 20 analogues and found no qualitatively significant variations in the results. As is standard in attribution studies, the event itself is excluded from the present period analysis.
Following Faranda et al. (2022), we define several diagnostic quantities to support the interpretation of analogue-based attributions. These quantities are then compared between the counterfactual and factual periods. The quantities are as follows.
-
Analogue quality (Q). Q is the average Euclidean distance of a given day from its 29 closest analogues. If the value of Q for the extreme event belongs to the same distribution as its analogues, then the event is not unprecedented, and attribution can be performed. If the Q value exceeds its analogues, the event is unprecedented and not attributable.
-
Predictability index (D). Using dynamical systems theory, we can compute the local dimension D of each MSLP map (Faranda et al., 2017). The local dimension is a proxy for the number of active degrees of freedom of the field, meaning that the higher the D, the less predictable the temporal evolution of the MSLP maps will be (Faranda et al., 2017). If the dimension D of the event analyzed is higher or lower than its analogues, then the extreme will be less or more predictable than the closest dynamical situations identified in the data.
-
Persistence index (Θ). Another quantity derived from dynamical systems theory is the persistence Θ of a given configuration (Faranda et al., 2017). Persistence estimates the number of days we will likely observe a situation analogous to the one under consideration.
Finally, to account for the possible influence of low-frequency modes of natural variability in explaining the differences between the two periods, we also considered the potential roles of the El Niño–Southern Oscillation (ENSO), the Atlantic Multidecadal Oscillation (AMO) and the Pacific Decadal Oscillation (PDO). We performed this analysis using monthly indices produced by NOAA/ERSSTv5. Data for ENSO and AMO were retrieved from the Royal Netherlands Meteorological Institute (KNMI) Climate Explorer. At the same time, the PDO time series was downloaded from the NOAA National Centers for Environmental Information (NCEI). The significance of the changes between the distributions of variables during the past and present periods was evaluated using a two-tailed Cramér–von Mises test at the 0.05 significance level. If the p value is smaller than 0.05, the null hypothesis that both samples are from the same distribution is rejected; namely, we interpret the distributions as being significantly different. We use this test to determine the role of natural variability.
3.1 Cyclogenesis stage and impacts in Greece
Before Daniel formed, an omega-blocking pattern and anticyclonic Rossby wave breaking occurred over Europe (Couto et al., 2024). Wave breaking resulted in the intrusion of an upper-level PV streamer into the central Mediterranean basin, triggering cyclogenesis in the Ionian Sea on 4 September 2023, which eventually led to the formation of Daniel within 24 h (marked by the northernmost, first track point in Fig. 1a). Figure 2a shows that the cyclone on 5 September 2023 was located between Italy and Greece, developing as a moderate low-pressure system with a minimum MSLP value of about 1004 hPa. The PV streamer in the upper troposphere wrapped cyclonically around the cyclone center (green contour in Fig. 2a), indicating an ongoing baroclinicity which contributed to the cyclone's development. Accordingly, a high-wind-speed pattern follows the PV streamer's orientation with larger values over the Balkans and on the northwestern side of the cyclone (wind barbs in Fig. 2a). This configuration summarizes a typical dynamical structure of Mediterranean cyclones at a stage preceding maturity, i.e., the time of maximum intensity (Flaounas et al., 2015).
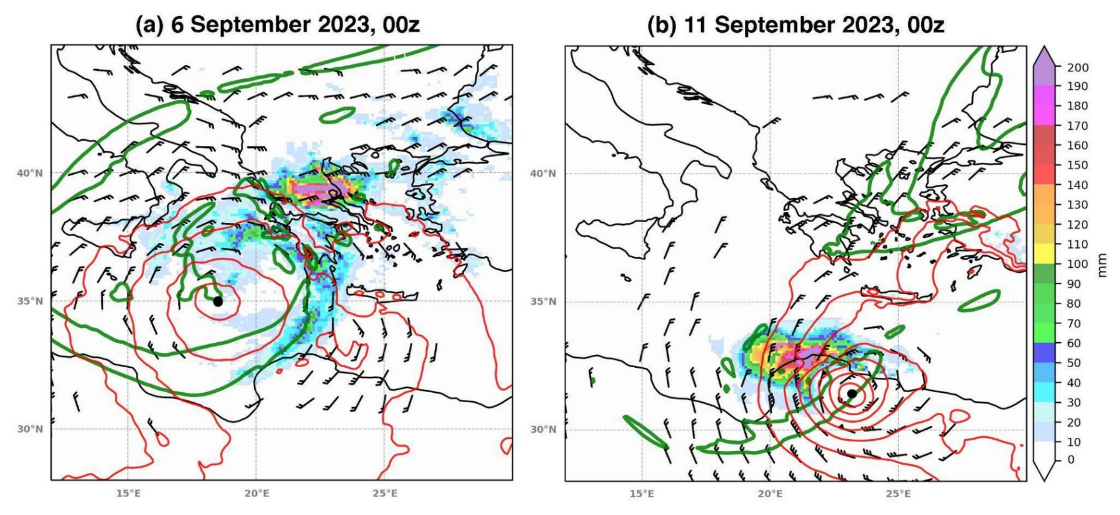
Figure 2(a) Potential vorticity of 2 PVU at 300 hPa (green contour), wind speed higher than 15 kn at 850 hPa (in barbs, with full and half bars depicting 10 and 5 kn, respectively) and MSLP (red contours for values lower than 1012 hPa with 2 hPa interval) on 6 September 2023 at 00:00 UTC. The 24 h total accumulated precipitation from 5 to 6 September at 00:00 UTC is shown in shading (max value 434 mm). (b) Same as panel (a) but for 11 September 2023 at 00:00 UTC (max precipitation value 382 mm). The black dot indicates the minimum MSLP position in both panels.
Accumulated precipitation also follows the typical structure of Mediterranean cyclones, with higher amounts on the northeastern side of the cyclone center (Flaounas et al., 2018). Figure 2a shows that at the cyclone's initial stages, the highest precipitation accumulation was observed in central Greece (Dimitriou et al., 2024). NOAAN surface stations recorded more than 750 mm of daily rainfall and up to 1235 mm within 4 d in the eastern parts of the Thessaly region (flooded areas are shown in cyan colors in Fig. 1b). Notably these peak values are underestimated by about 40 % in the ECMWF analysis (with a max IFS 24 h accumulated rainfall of 434 mm on 6 September 2023 00:00 UTC).
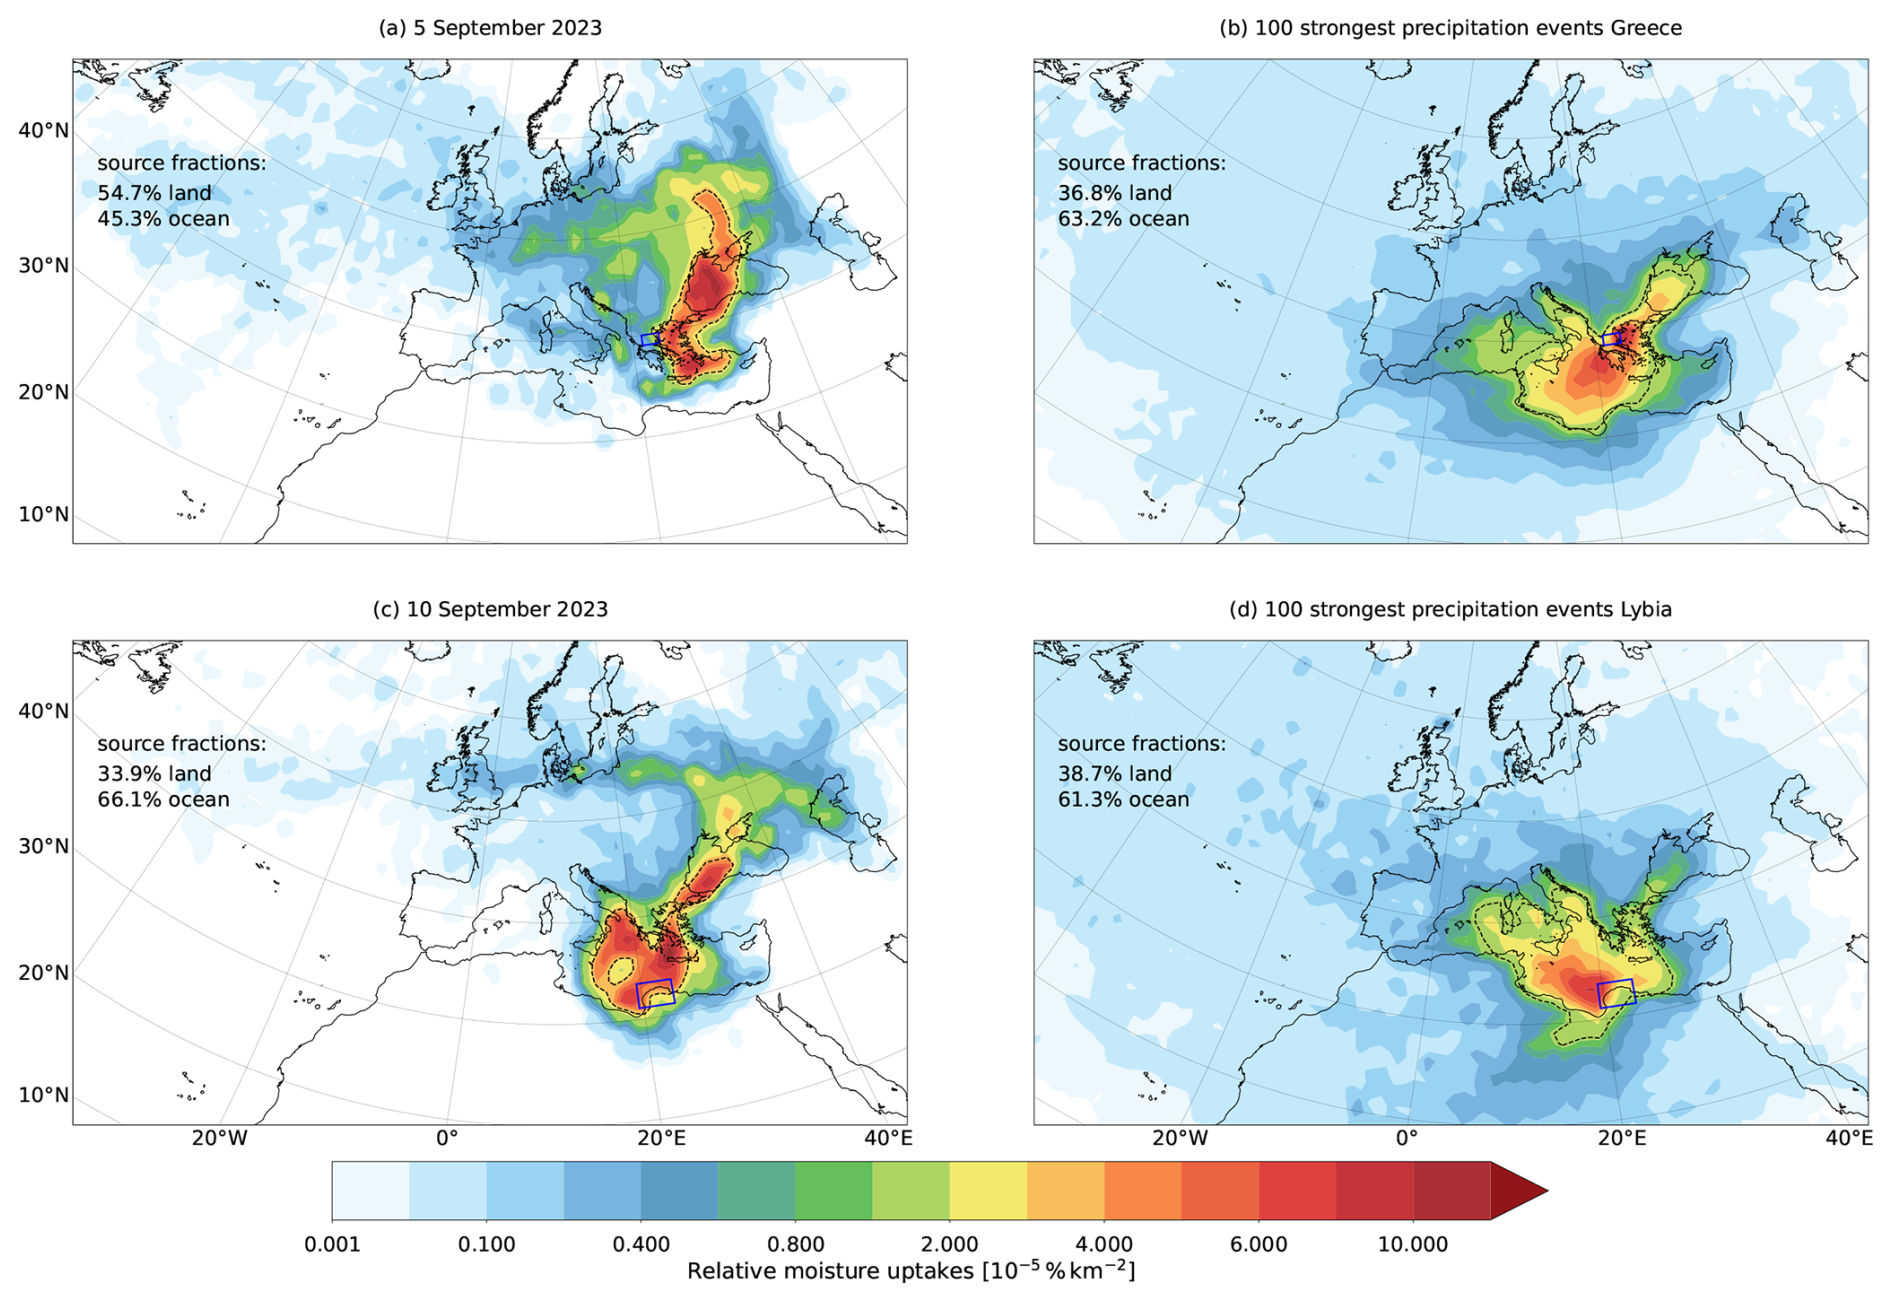
Figure 3(a) Relative moisture uptakes that contribute to the precipitation event in Thessaly (depicted with the blue rectangle) on 5 September 2023. The dashed black contour outlines the largest moisture source regions, which account for 50 % of the total moisture uptake. The numbers on the top left show the relative land and ocean fraction of the moisture sources. (b) As in panel (a) but for the 100 most extreme daily precipitation events in Thessaly from 1990 to 2023. (c) As in panel (a) but for the precipitation in the study region in Libya (blue rectangle) on 10 September 2023. (d) As in panel (b) but for Libya.
To quantify the contribution of local and remote areas to such an intense precipitation event in Greece, Fig. 3a identifies the areas where moisture uptake has been significant for the air parcels that reached the flooded region of Thessaly (blue square in Fig. 3a). Considering the largest moisture uptakes that contribute at least 50 % of the catastrophic precipitation in Greece (dashed black contour in Fig. 3a, which primarily separates the green from the red colors), major sources were found in the Aegean and the Black seas. This tilted southwest-to-northeast orientation of essential water sources follows the pathway of strong winds blowing over the Balkans and the eastern Mediterranean (wind barbs in Fig. 2a), with a similar orientation to the upper-level PV streamer. The intense sea surface fluxes induced by easterly winds are a precursor feature common to other cyclones developing in the same area (e.g., Miglietta et al., 2021). Further moisture mainly originated from central to eastern Europe and the North Atlantic Ocean. These source regions generally agree with a recent study (Argüeso et al., 2024), which investigated moisture sources of rainfall over Greece from 3 to 9 September 2023 using a Eulerian moisture source diagnostic. Our moisture source analysis shows larger contributions from land (54.7 %) than in Argüeso et al. (2024) (27 %). The Lagrangian method used in our study indicates relatively large moisture contributions from the north of the Black Sea because most of the air parcels arriving on 5 September 2023 descended and took up moisture in this region before moving southwestward along the western flank of the PV streamer. The differences in the land fraction between the two methods might originate from different periods used for the moisture source calculations, different handling of moisture uptakes above the boundary layer, a lower explained fraction of the total moisture sources (84 %) with the Eulerian compared to the Lagrangian diagnostic (explained fraction of 90 %) and general differences in Eulerian versus Lagrangian approaches. An ongoing comparison study of moisture source diagnostics investigates differences in these methods in detail and will shed more light on disagreements between various moisture source diagnostics. Overall, the moisture sources agree well with the climatology of moisture sources of the Mediterranean cyclones that produce the heaviest precipitation events (Flaounas et al., 2019). The moisture sources shown in Fig. 3a largely overlap with the climatological moisture sources of extreme precipitation in the same area. However, for Daniel, they are mainly concentrated over the Aegean Sea and regions to the northeast. In contrast, the typical moisture sources for extreme precipitation in Thessaly extend further over the central Mediterranean (Fig. 3b).
The hydrological impacts of Storm Daniel were profound and unprecedented. Figure 4 compares the peak mean daily river discharge during Daniel with historical records over 3 decades, integrating the cumulative hydrological impacts over the entire event. Figure 4a shows the spatial distribution of the maximum simulated peak discharge from January 1993 to August 2023 (i.e., before Daniel), demonstrating typical peak discharge patterns in the eastern Mediterranean. In contrast, Fig. 4b compares the event-wide mean daily peak discharge during September 2023, when Daniel occurred, against the historical peak river discharges of the last 30 years (Fig. 4a). The results reveal an unprecedented magnitude of Daniel's impacts, with several areas experiencing river discharges that exceeded the historical maximums by 300 % to 500 %. The darkest shades in Fig. 4b indicate the most heavily affected regions, where the river discharge during Daniel exceeded previous records by at least a factor of 5, highlighting that Daniel was an unprecedented event of increased river discharge levels (further discussed in Sect. 5). At this cyclone stage, 17 human casualties were registered in Thessaly, along with a profound hydrological aftermath. The extreme rainfall from 3 to 8 September 2023 led to widespread flooding across 1150 km2 in the Thessalian plain, 70 % of which was agricultural land. The inundation severely affected the cotton crops, with floodwaters covering more than 282 km2, roughly 30 % of the region's total cotton fields. Over 35 000 farm animals were also affected (He et al., 2024).
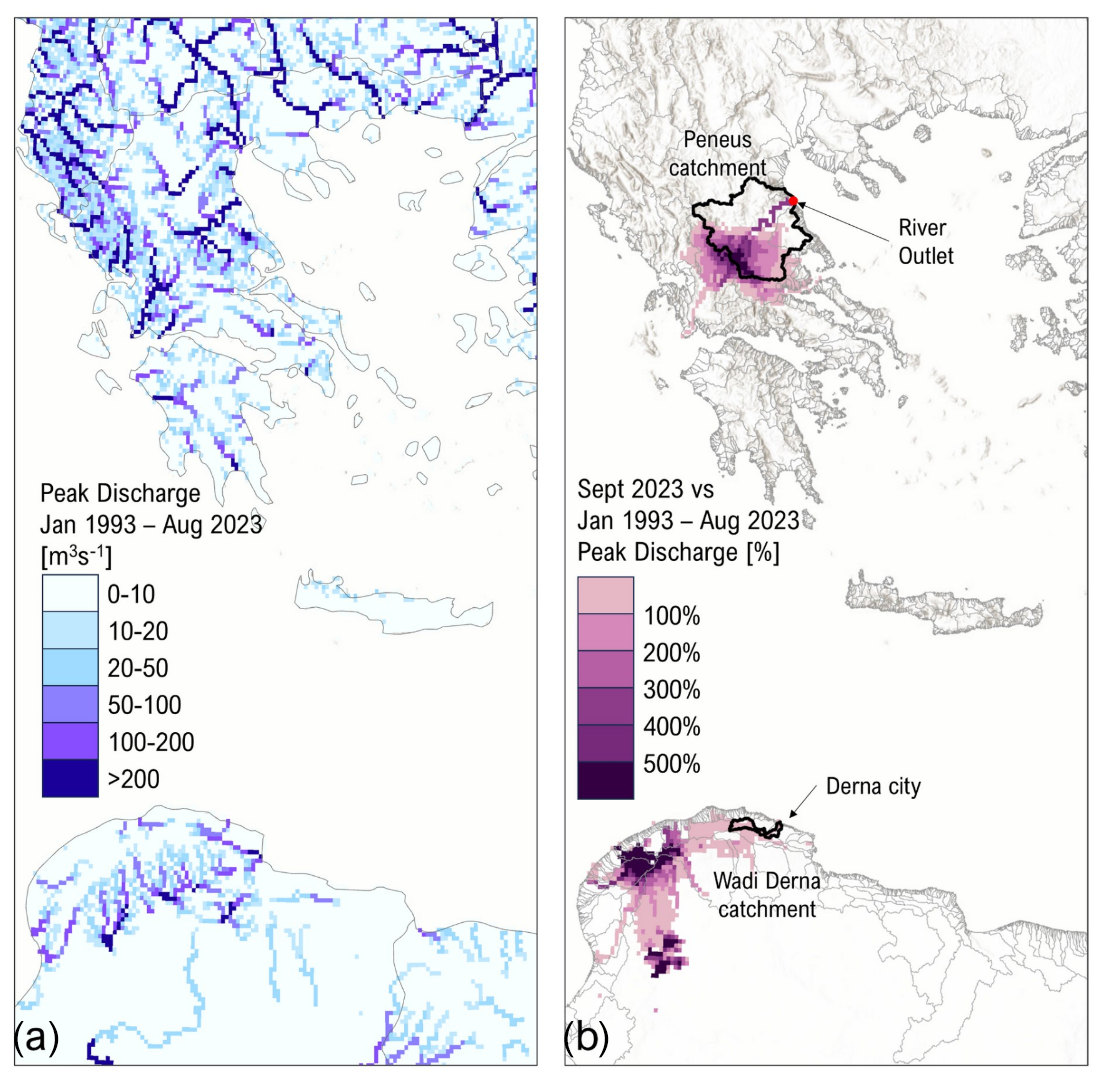
Figure 4(a) Peak discharge over 3 recent decades (January 1993–August 2023) versus Storm Daniel as represented by the Global Flood Awareness System spatial distribution of the maximum peak river discharge from January 1993 to August 2023. (b) Comparison map for September 2023 illustrating the event-wide peak river discharges as a percentage increase over the maximum peak river discharges during the last 30 years in panel (a).
3.2 Mature stage and impacts in Libya
Severe weather gradually faded in Greece during the night of 6 September 2023, while the surface cyclone moved southwards in phase with the upper-tropospheric low. In the following 3 d, Daniel lingered over the central Mediterranean Sea (circular part of the track in Fig. 1a), with minimum pressure remaining almost constant, close to 1004 hPa (Fig. 1a). Figure 5a and b show the sea surface temperature (SST) anomaly in the area affected by Storm Daniel on 3 and 9 September, respectively. Before the passage of Storm Daniel, positive SST anomalies dominated the study area, with values exceeding 1 °C between the Libyan coast and Greece and lower anomalies (0 to 0.5 °C) observed east of Sicily. Following the storm's passage, a significant drop in SST resulted in an extensive area of negative anomalies greater than 1 °C between Libya and Greece. A colder SST core with a decrease of less than 1.5 °C was observed east of Sicily, while the northern Aegean Sea experienced an even more pronounced decline. Such SST cooling after the passage of medicanes has been previously diagnosed using explicitly resolved air–sea interactions in coupled atmosphere–ocean models (Ricchi et al., 2017; Bouin and Lebeaupin Brossier, 2020; Varlas et al., 2020) and SST observations (Avolio et al., 2024). Nevertheless, the feedback mechanism between cyclone intensity and SST cooling is expected to be less important than the one typically observed in tropical cyclones.
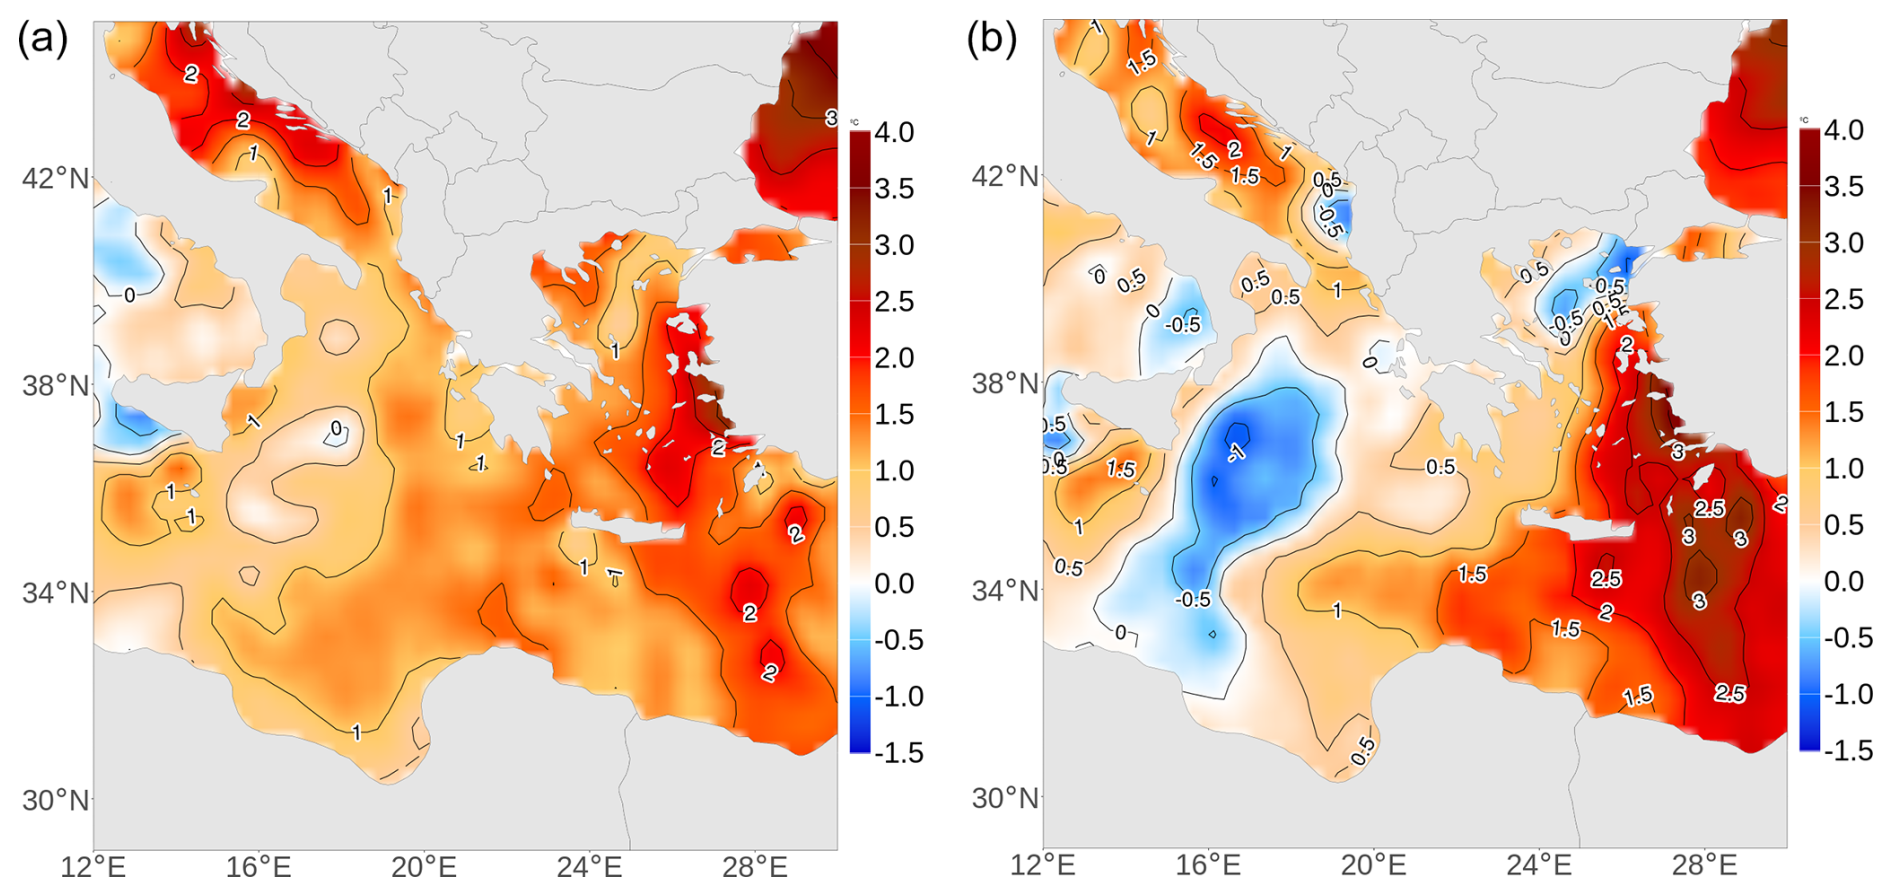
Figure 5(a) Daily SST anomaly from ERA5 for 3 September 2023 and (b) 9 September 2023. The reference climatology for anomaly determination is 1982–2011.
The role of anomalously high SSTs in intensifying cyclones has been previously shown in several studies based on numerical sensitivity experiments (Miglietta et al., 2011; Romaniello et al., 2015; Messmer et al., 2017; Pytharoulis, 2018; Argüeso et al., 2024; Sánchez et al., 2024). In the case of Daniel, deep moist convection was favored, as suggested by the great extent of the areas covered by cold cloud tops and intense lightning activity close to the cyclone center (not shown). Subsequently, on 8 September, the cyclone started showing tropical-like features, like a deep warm core, spiral cloud bands and a maximum wind speed in the low levels a few tens of kilometers from the center. Thus, the cyclone satisfies the phenomenological definition of a medicane recently proposed (Miglietta et al., 2025). Deep convection contributed to the rapid deepening of the cyclone, which reached a minimum MSLP of 997 hPa on 10 September 2023 at 18:00 UTC after making landfall on the northeastern coast of Libya around 10 September 2023 at 06:00 UTC (Fig. 1).
A comparison of Fig. 2a and b shows that, at the time of maturity, the area covered by at least 2 PVU at 300 hPa is significantly smaller than during cyclogenesis. Nevertheless, Fig. 2b shows that the 2 PVU patch is collocated with the cyclone center, advected from the west. Hewson et al. (2024) proposed that this collocation is responsible for the cyclone's intensification just before landfall. The intensification of a Mediterranean cyclone due to the synergy of upper-level baroclinic forcing and deep convection is a common characteristic of intense Mediterranean cyclones, including medicanes (Flaounas et al., 2021). A previous case of a medicane intensifying due to the collocation of a PV streamer with the cyclone center was documented by Chaboureau et al. (2012). This phenomenon reflects both the anomalous nature of this medicane (since medicanes generally intensify over the sea and weaken inland) and the critical role of upper-level features in the evolution of Mediterranean cyclones.
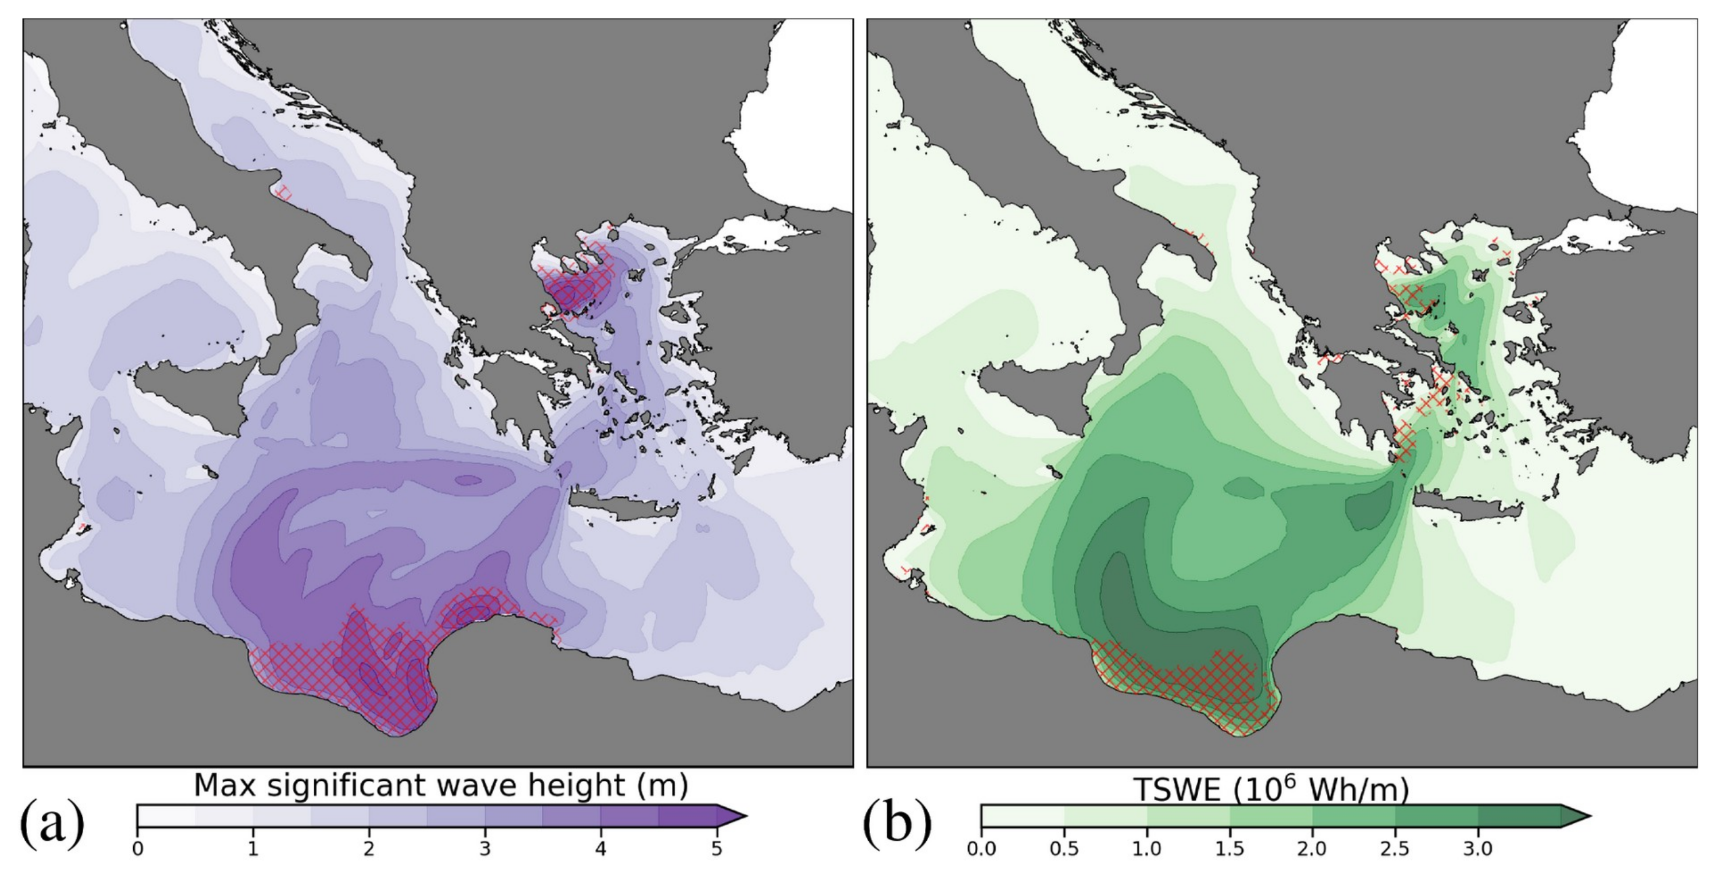
Figure 6(a) Maximum significant wave height. (b) Total wave energy of the storm. Purple (a) and red (b) patches mark areas of extreme conditions (above the 99th percentile) determined based on the Mediterranean Sea wave reanalysis.
At the same time, Daniel developed a significantly stronger MSLP gradient, leading to wind speeds reaching up to 40 kn (about 20 m s−1). The intense winds associated with the storm generated a severely disturbed sea in the central Mediterranean basin, with southwestward-propagating waves extending from the Aegean Sea to Libya following the strong wind pathway (Fig. 2b). Indeed, the analysis of the wave data from the Mediterranean Sea Waves Analysis and Forecast shows waves with a significant height of about 5 m in the Gulf of Sirte and the northern Aegean Sea (Fig. 6a). Such values exceed the 99th percentile in the Mediterranean Sea wave reanalysis. A peculiar aspect of Daniel is that strong winds blew in the central Mediterranean Sea for many days. As a result, Daniel preserved a severe sea state over northern Greece, in the central Mediterranean basin and along the Libyan coast. To evaluate the cumulative impact of the event, we computed the total storm wave energy (TSWE; Arena et al., 2015) by integrating the wave power contribution of each sea state over the storm duration (Fig. 6b). TSWE reached peak values of about 3000 kWh m−1 in the Gulf of Sirte, which is above the 99th percentile of the total storm wave energy obtained from the Mediterranean Sea wave reanalysis. Such an energetic sea condition and the storm surge affected much of Libya's eastern coastal zones, causing coastal flooding, erosion and infrastructure damage (World Bank, 2023).
In terms of precipitation, Storm Daniel also presented exceptional features. During the cyclone's mature stage, Bayda experienced about 414.1 mm of rainfall within less than 24 h, equaling 80 % of the city's mean annual accumulated precipitation and a new daily precipitation record (World Meteorological Organisation, 2023a). It is worth mentioning that simulated 24 h total accumulated precipitation on 11 September 2023 in Libya, up to 382 mm, was not located within the most impacted area, the Derna catchment, as is discussed in Hewson et al. (2024). Significant moisture sources (red colors in Fig. 3c) encompass the cyclone center, with more than 50 % of the moisture originating from the Mediterranean Sea. This suggests that the cyclone-induced circulation played an essential role in moistening the atmosphere within the proximity of the cyclone. Nevertheless, the largest moisture sources that contribute collectively at least 50 % of the total precipitation in Libya (dashed black contour encompassing green to red colors in Fig. 3c) still retain a southwest-to-northeast orientation as in Fig. 3a (i.e., during the precipitation event in Greece). Comparing the moisture sources between the two precipitation events in Greece and Libya, the cyclone tends to attract more moisture from its surrounding area in the latter case. In contrast, in both cases, northern moisture sources tend to align with the large-scale circulation responsible for downstream cyclogenesis in the Mediterranean. This southwest–northeast orientation of moisture sources contrasts with the climatological sources in Fig. 3b and d, which mainly highlight the importance of local sources, especially from the Mediterranean Sea westwards of the two study regions.
Figure 4 highlights the region's exceptional river discharges, as in Greece's case. However, the absence of similarly strong discharge signals in several severely impacted regions, such as the wider Pelion area in Greece and Derna (Libya), is notable and can be attributed to several factors. First, the GloFAS model has limitations in spatial resolution and calibration. The model operates at a resolution of approximately 5 km (0.05°), which, while adequate for global-scale flood awareness, is insufficient for resolving localized hydrological dynamics. For instance, the catchments east of Volos, including the wider Pelion area, are approximately 30 km2, while the Derna basin spans around 575 km2. In both cases, localized rainfall-runoff dynamics are critical in shaping discharge patterns, particularly during extreme events. Due to insufficient in situ discharge data, the absence of Greece and Libya in the GloFAS calibration dataset further exacerbates these limitations since the model relies on generalized parameter regionalization rather than site-specific calibration, introducing significant uncertainties into discharge predictions. Furthermore, inaccuracies in the rainfall inputs depicted in Fig. 2 propagate into the discharge simulations shown in Fig. 4. For instance, within the Peneus catchment, the maximum recorded 24 h accumulated precipitation was 274 mm at Zappeio and 226 mm at Neraida, as Dimitriou et al. (2024) reported, while accumulations of up to 750 mm were recorded outside the catchment, specifically over the Pelion area, east of Volos. In the Wadi Derna catchment, extreme rainfall exceeded 400 mm d−1, with torrential rainfall ranging between 150 and 240 mm across several locations and Al-Bayda recording a maximum of 414.1 mm (World Meteorological Organisation, 2023b). These rainfall extremes were underrepresented in the GloFAS rainfall inputs, propagating into the discharge simulations and contributing to the muted signals observed in Fig. 4b.
Daniel's impacts took place in two distinct periods: during cyclogenesis and at maturity. In the former stage, most precipitation was produced in areas far from the cyclone center, drawing moisture from the surrounding areas. At the later stage, the cyclone impacts were relevant to landfall, and precipitation and sea level rise were significantly close to the cyclone center. Therefore, the two distinct stages of Daniel that provoked substantial impacts in Greece and Libya were linked to cyclone stages of different dynamics, which also have further implications for Daniel's numerical prediction. In the case of Greece, i.e., at the initial stage of Daniel, it is the timely prediction of cyclogenesis that would have primarily provided useful information to civil protection, whereas, in the case of Libya, it would have been the accurate prediction of the cyclone track, intensification and its landfall location. This section focuses on the predictability of the environmental hazards linked to Daniel's socioeconomic impacts, i.e., precipitation amounts, sea state and cyclone track.
4.1 Forecasting the cyclogenesis stage
Concerning the cyclogenesis stage, a forecast model has to predict the formation of the cyclone to provide valuable information regarding its impact. This suggests that numerical weather prediction models should accurately reproduce the large-scale atmospheric circulation, the Rossby wave breaking and the consequent intrusion of the PV streamer within the Mediterranean, as shown in Fig. 2a by the green contour. Such a large-scale circulation pattern is absent from forecasts initialized 1 week ahead (Fig. 7a). At a lead time of 120 h, the PV streamer is present, though its location shows high uncertainty among EPS members (Fig. 7c). Indeed, the PV distribution of all EPS members at 300 hPa (outlined by colored crosses in Fig. 7) depicts a much larger area of possible high PV values than the one in Fig. 2a. This is due to the limited agreement on the occurrence – or colocation – of the intrusion of the PV streamer among the EPS members, ranging between 25 % and 50 %, as suggested by the blue crosses in Fig. 7c.
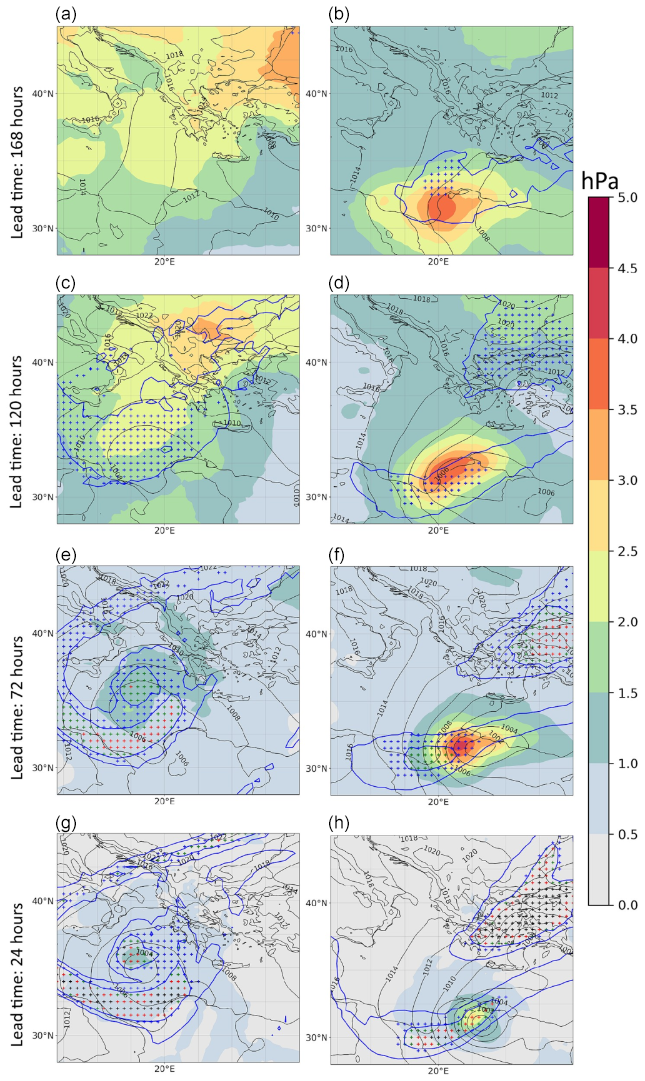
Figure 7Standard deviation (in color shading) and average (black contour) MSLP from the 51 ensemble members of the ECMWF EPS. Blue contours enclose areas with a median equal to 1 and 2 PVU at 300 hPa among all members of the EPS. Blue crosses indicate areas where at least 25 % of the members have PV values greater than 2 PVU. Green, red and black crosses denote agreement by at least 50 %, 75 % and 95 % of the members, respectively. Panels depict different lead forecast times valid on 6 September at 00:00 UTC (a, c, e, g) and 11 September at 00:00 UTC (b, d, f, h).
Following the uncertainty in the PV streamer occurrence, the cyclone is also absent from the MSLP ensemble average 1 week ahead (black contour in Fig. 7a). The MSLP spread seems consistent within the shown domain (about 1 to 3 hPa). At subsequent lead times, a higher spread of MSLP tends to concentrate close to the cyclone center (Fig. 7c and e) until it becomes negligible 24 h before cyclogenesis (Fig. 7g). At such a short lead time, the cyclone formation was forecast with confidence to occur in the Ionian Sea, to the southwest of Greece (black contours in Fig. 7g). Confident forecasts of cyclogenesis should go hand in hand with higher agreement among the EPS members on the location of the PV streamer. Indeed, 24 h before cyclogenesis, more than 95 % of EPS members agreed on the area of PV streamer intrusion. Accordingly, average values (blue contour in Fig. 7g) better match the ones in the ECMWF analysis (green contour in Fig. 2a).
To get deeper insights into the representation of cyclogenesis among the EPS members, Fig. 8 shows the level of agreement on the cyclone objects (as presented in Sect. 2.2.1). At a lead time of 168 h, the cyclogenesis forecast was relatively poor (Fig. 8a). Still, at a lead time of 120 h (Fig. 8c), cyclone centers are present (red dots in Fig. 8), scattered in the central Mediterranean but still close to the actual location where the cyclone initially formed. Higher overlapping of cyclone objects among the EPS members (green shading in Fig. 8) is indeed within the limits of the observed cyclone object, as in the ECMWF analysis (black contour in Fig. 8c). In fact, about 30 % of the different EPS members produce overlapping cyclone objects. At a forecast lead time of 3 d, the overlapping of cyclone objects increases clearly (comparing shaded green areas between Fig. 8c and e), suggesting higher agreement among the EPS members on the cyclone occurrence within the correct location. The high agreement is retained even for shorter lead times (Fig. 8g).
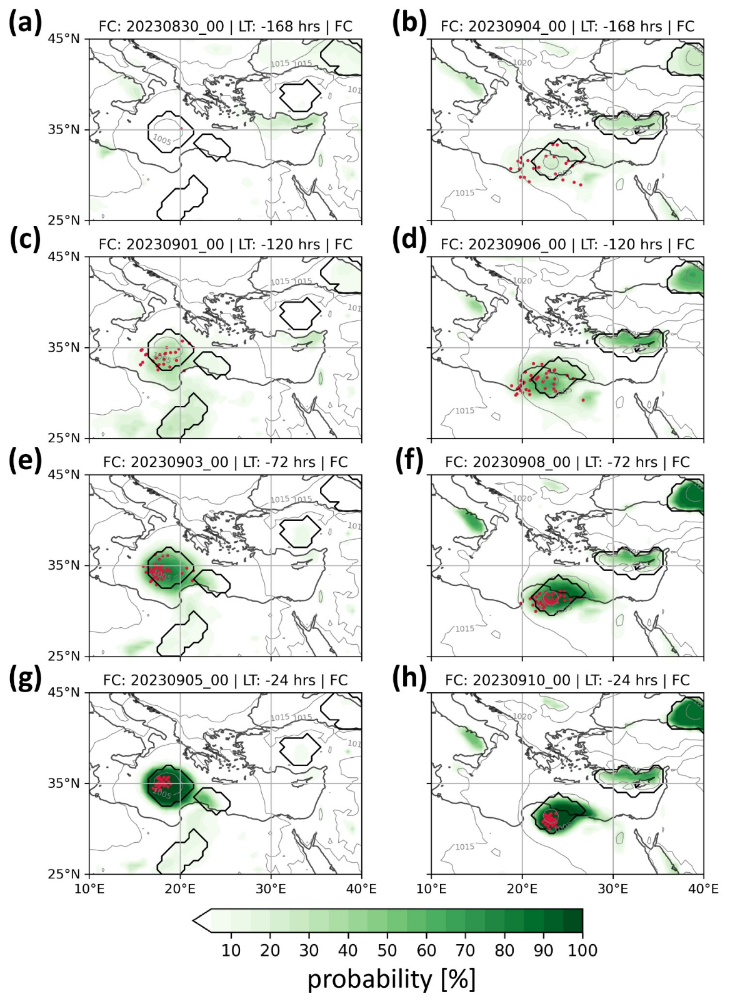
Figure 8Percentage of overlapping cyclone objects (green shading) among the ensemble prediction system members for different lead times valid on 6 September 2023 at 00:00 UTC (left column panels) and 11 September 2023 at 00:00 UTC (right column panels). Black contours show cyclone objects in the ECMWF analysis (gray contours for MSLP isobars in the ECMWF analysis). Red dots depict the location of the minimum MSLP of Daniel in the ensemble members.
The similar behavior in the cyclone and PV streamer predictability relies on the direct relationship between the Rossby wave breaking over the Atlantic Ocean and the accurate prediction of Mediterranean cyclogenesis. This has been highlighted by Chaboureau et al. (2012) and Pantillon et al. (2013) for the case of the extratropical transition of a hurricane upstream of a medicane, more recently by Portmann et al. (2020) for another case, and has been demonstrated by Scherrmann et al. (2024) in a semi-idealized framework. In the case of Daniel, Hewson et al. (2024) similarly suggested that the extratropical transition of Hurricane Franklin was responsible for the high uncertainty 1 week ahead. Only in forecasts initialized after the extratropical transition has occurred is the PV streamer predicted to intrude on the Mediterranean, thus explaining the contrast between 5 and 7 d lead times. A similar “jump” in the predictability of cyclone occurrence has been shown for several medicane cases by Di Muzio et al. (2019). Most probably, this “jump” is due to the dependence of Mediterranean cyclogenesis on the preceding Rossby wave breaking and, consequently, on the credible inclusion of this event within the initial forecast conditions.
4.2 Forecasting cyclone location and intensity at the mature stage
Figure 1a shows that on 10 September, Daniel made landfall on the coasts of Libya. For all different forecast lead times of this event, the spread of MSLP consistently retains high values close to the landfall area (right column of panels in Fig. 7). This is directly relevant to the high-MSLP gradients close to the cyclone center (Fig. 2b), where even a “small” displacement of cyclone centers may result in a relatively large standard deviation of MSLP in the EPS. Indeed, Fig. 8b and d point to the high certainty in the cyclone occurrence in the EPS, where most members produce consistent and overlapping cyclone objects (depicted by dark-green shading). Such performance comes in contrast to forecasting the stage of cyclogenesis, where MSLP spread does not have a clear pattern (the left panels of Fig. 7, green and yellow areas), and cyclone objects present limited overlapping for the same lead times (e.g., comparing Fig. 8c and d). The limited agreement among the EPS members in terms of the PV streamer intrusion leads to considerable differences among the EPS members on the location or even the occurrence of cyclogenesis. In contrast, the predictability of landfall in Libya seems more consistent among the EPS members of ECMWF.
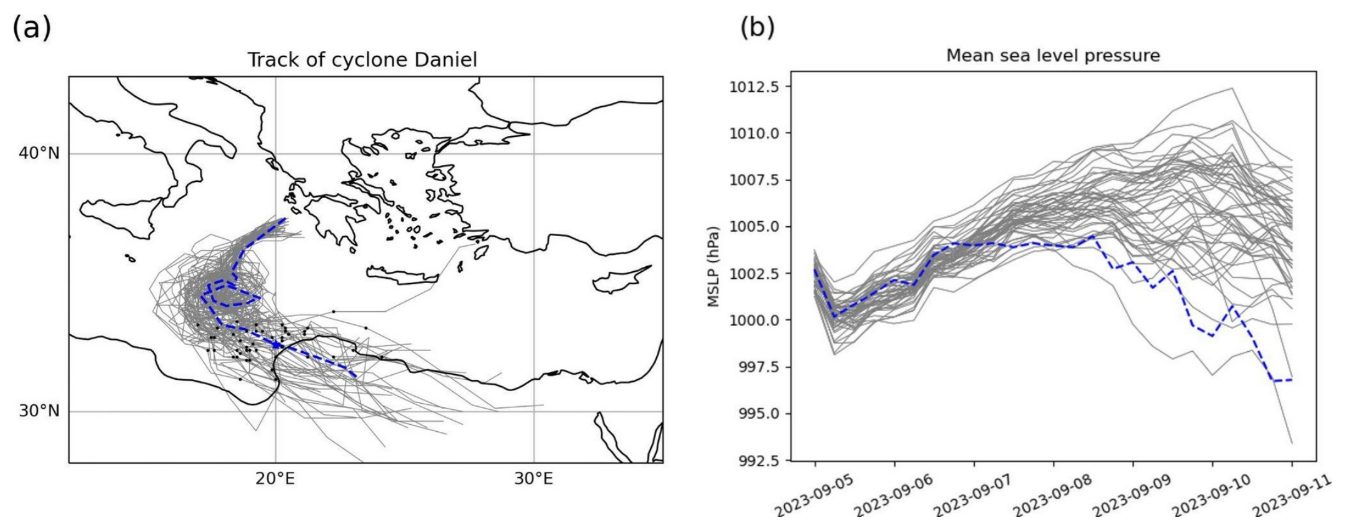
Figure 9(a) Cyclone tracks based on MSLP at the center of Cyclone Daniel as represented by the ECMWF analysis (dashed blue line) and by the 50 members of the EPS of the ECMWF (gray lines), initialized on 5 September at 00:00 UTC. The black dots in panel (a) depict the cyclone location on 10 September at 00:00 UTC. (b) As in panel (a) but as time series of minimum MSLP.
Considering a forecast lead time of 120 h (i.e., initialization on 6 September), the cyclone has already formed and was located over the central Mediterranean (just before the spiral part of the track). Therefore, the cyclone has already been inscribed in the model's initial conditions. Still, from the perspective of impacts, the location of landfall and the cyclone's intensity are crucial. Figure 9a shows that even for an early lead time of 5 d (initial conditions of 5 September 2023, 00:00 UTC), the cyclone tracks from all EPS members make landfall on the Libyan coasts. The spread of the tracks is wide enough to include the actual cyclone track (in blue color in Fig. 9a); therefore, the forecast may lead to a reliable and timely warning of potential impacts.
Nevertheless, Fig. 9b shows that almost all the EPS members underestimated the cyclone's intensity by forecasting too high MSLP values on 10 September at the time of landfall. The intensity of the cyclone is dependent on the baroclinic and diabatic forcing of its development (Flaounas et al., 2021). Therefore, the performance of all EPS members depends on the accurate representation of the parametrized processes, mainly convection close to the cyclone center and surface fluxes, and the morphology of the PV streamer intrusion. For the present case, Hewson et al. (2024) noted that, while in the development stage the latent heat released from convection, favored by the high SST and intense sea surface fluxes, balanced out the tendency for frictional decay, in the last stage a marked upper-level low moving from the west (marked by high PV values in Fig. 7h) was responsible for a further deepening. Upper-tropospheric forcing is crucial in accurately predicting cyclone intensity in this context. While Fig. 7b – unlike Fig. 7a – shows that some EPS members align with the location of this upper-tropospheric feature (blue crosses), an average of 2 PVU and an agreement above 50 % among the EPS members near the cyclone center are only evident at a lead time of approximately 3 d (Fig. 7f, depicted by green crosses).
5.1 Forecasting climate extremes
The previous sections focused on the capacity of the EPS to forecast Daniel's cyclogenesis as the primary driver of impacts. In this section, we extend this analysis by focusing on the predictability of hazards in a climatological context, namely extreme precipitation and consequent floods. We used the ERA5 reanalysis to diagnose extremes since this product offers a reliable and consistent representation of present-day climate (Hersbach et al., 2020). In this respect, the left column of Fig. 10 shows the area affected by extreme daily precipitation on 5 September (in red contour, explained in Sect. 2.2.1). In addition, Fig. 10 shows the percentage of the EPS members that forecast daily precipitation exceeding the climatological threshold for extremes, defined by the 99th percentile of daily precipitation in ERA5 (in blue shading). At a lead time of 120 h (Fig. 10c), less than half of the ensemble members predicted the climatological extreme precipitation amounts within the area delimited by the climatological values of ERA5 (red contours). Nevertheless, the area formed by the blue shading in Fig. 10c is consistent with the climatological extremes. The members of the EPS that produce extreme precipitation could provide information on the potential occurrence of high-impact weather at least 5 d in advance. Therefore, accurately forecasting the time and location of cyclone formation (as shown in Fig. 8) may play a secondary role in predicting its impacts in Greece. In this context, the reliable simulation of moisture inflow, which is more closely linked to large-scale circulation, as previously discussed by the EPS members, could be more crucial for impact prediction.
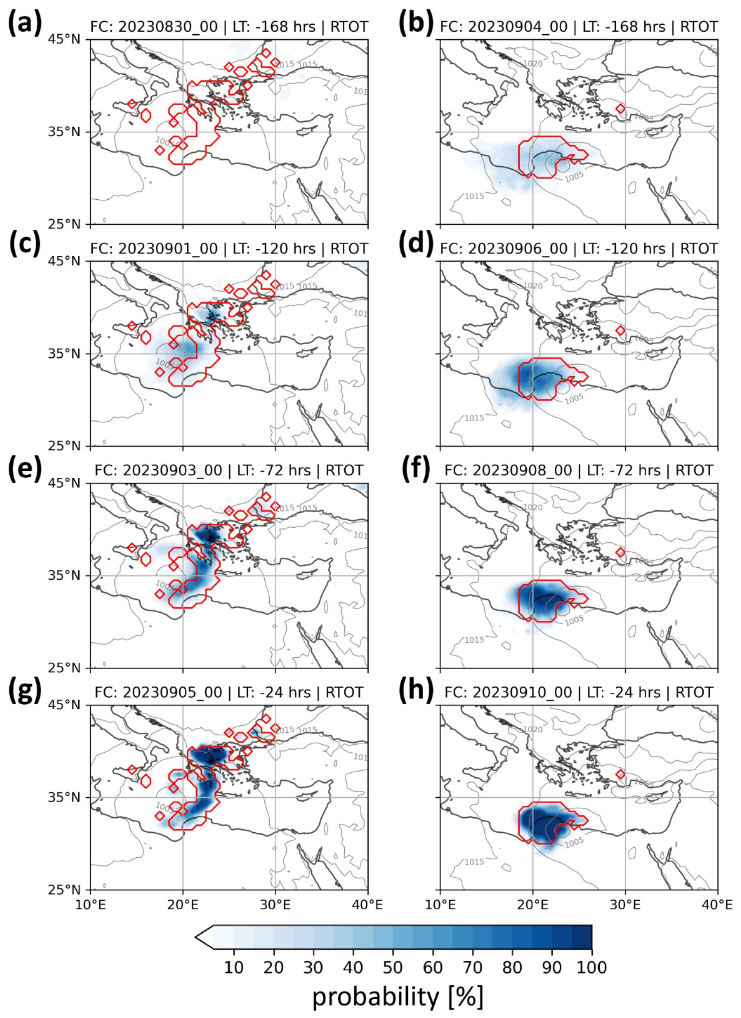
Figure 10Percentage of overlapping objects (in blue shading) among the ensemble prediction members for 24 h accumulation (ending at the validity time) of extreme precipitation for different lead times valid on 6 September 2023 at 00:00 UTC (left column panels) and 11 September 2023 at 00:00 UTC (right column panels). Red contours show objects of extreme precipitation determined based on ERA5 climatology (gray contours for MSLP isobars in the ECMWF analysis).
Interestingly, the overlap of extreme precipitation objects among the EPS members might exceed 70 % in the area of Thessaly in Greece for a lead time of even 120 h (Fig. 10c). This percentage is significantly higher than the maximum percentage of overlap between the cyclone objects (Fig. 8c). This suggests that the EPS members have been more consistent in the production of extreme precipitation even if cyclone centers presented a comparably greater spread. For subsequent lead times, the predictability of extreme precipitation strongly increases, showing a high probability for a lead time of 72 h. Indeed, almost all members predict extreme precipitation off the coast and in the northeastern part of Greece within the eventually flooded area of Thessaly.
When Daniel made landfall and produced impacts on the Libyan coasts, the EPS showed higher predictability, with cyclone objects and associated extreme precipitation being predicted at least 5 d in advance by several EPS members (Fig. 10d), although the locations of both cyclone and precipitation objects are still displaced to the southwest compared to the analysis (Figs. 8d and 10d). This comes per the southern displacement of several ensemble member tracks in Fig. 9a. The probability strongly increases at shorter lead times (Fig. 10f and h), and all EPS members tend to converge to similar cyclone locations when reaching a lead time of 1 d (Fig. 8h).
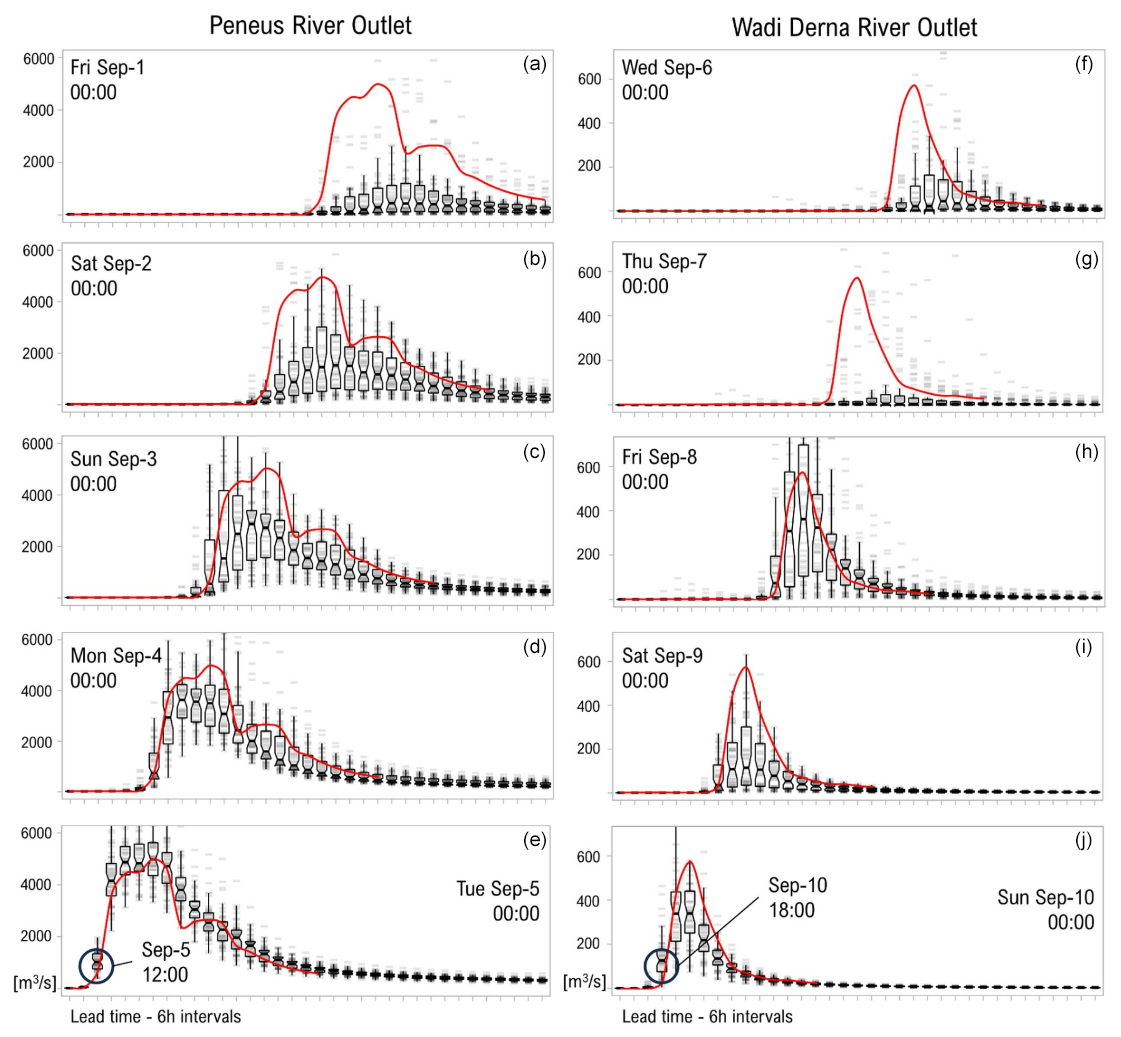
Figure 116 h ensemble river discharge forecasts for the Peneus and Wadi Derna catchments compared to the “perfect forecast” benchmark (red line). The “perfect forecast” represents the initialization of each forecast for all time steps across the event, taken as a reference for evaluating forecast accuracy, with the observed timing of rising hydrograph limbs marked on 5 September at noon local time (09:00 UTC) for the Peneus River in Thessaly and 10 September at 18:00 local time (16:00 UTC) for the Wadi Derna River. Gray stripes (tick marks) represent individual ensemble members from the EFAS model, driven by the 51 ensemble members of the ECMWF EPS. Overlapping tick marks darken, visually highlighting areas of member agreement (convergence). Forecast summary data are displayed as boxplots, where the box represents the interquartile range (IQR), the whiskers show the range of values within 1.5 times the IQR, and the horizontal black line inside the box indicates the median. The notches around the median show the 95 % confidence interval.
The potential of extreme precipitation leading to substantial socioeconomic impacts has also been transferred to hydrologic discharge forecasts. The hydrographs presented in Fig. 11 examine river discharge predictability as forecast by the operational European Flood Awareness System (EFAS) during Daniel. For the Peneus River outlet in Thessaly, the forecast initiated on 1 September underpredicted the peak discharge on 5 September. Nevertheless, extreme river discharges were evident for several members 5 d in advance. The forecast accuracy improved, getting closer to the event, with ensemble members (gray stripes) converging towards the peak discharge (“perfect forecast”, red line). This trend indicates an increasing reliability of the forecast as the lead time decreases, particularly within 48 h of the event. The skill in discharge predictability for the Peneus River can be attributed, in part, to the large size of the basin (11 063 km2), which aligns relatively well with the spatial resolution of the EFAS model, enabling an accurate representation of distributed hydrological processes and moderating runoff variability.
The forecasts for the Wadi Derna River outlet (Fig. 11, right panels) exhibit significant variability and fail to converge during the earlier forecast initialization dates and at shorter lead times. This persistent lack of convergence can be attributed to distinct challenges of both temporal scales. For earlier forecast initialization dates, the primary source of variability lies in the westward displacement of extreme precipitation predicted by the EPS (Fig. 10b and d). For example, forecasts initialized on 9 September, during a critical period for implementing preventative measures, display a wide spread and a shortfall in the median forecast compared to the benchmark (red line). This variability persists even for forecasts initialized on 10 September. The failure to converge at shorter lead times is compounded by challenges inherent to the Wadi Derna catchment. The resolution of the precipitation forcings used in the forecasts, combined with the relatively small size (575 km2) and flash-flood-prone nature of this basin, amplifies the uncertainties in predicting discharge, particularly in response to localized extreme rainfall.
Figure 4 provides critical context by comparing the peak mean daily river discharge during Storm Daniel with the historical baseline. The unprecedented magnitude of the event is evident in Fig. 4b, where river discharges exceeded the historical reanalysis by at least a factor of 5 in certain regions. However, the relatively weak signal for the Wadi Derna catchment underscores the limitations of the GloFAS and EFAS systems in accurately resolving runoff dynamics in smaller basins. This discrepancy is primarily attributed to insufficient model resolution, inaccuracies in rainfall inputs and the lack of detailed hydrological calibration for these catchments. In contrast, the much stronger signal observed in the Peneus catchment aligns with larger basin sizes and better-resolved hydrological processes, where models more effectively captured the extreme nature of the event.
The ability of EFAS to predict extreme events, as shown in Fig. 11, highlights its value in forecasting severe hydrological impacts. However, discrepancies in simulated peak discharge remain apparent, such as the overestimation of runoff for the Peneus River outlet. EFAS simulated peak discharge at approximately 5000 m3 s−1, whereas observed values, based on station-level data and H–Q curve estimates, were less than 2000 m3 s−1 (Dimitriou et al., 2024). This overestimation reflects inherent limitations in the model's spatial resolution and hydrological representation. Furthermore, the absence of flood protection infrastructure, such as levees or dams that attenuate runoff and peak flows, is not accounted for in the EFAS and GloFAS systems, contributing to these discrepancies. Additionally, the simplified representation of retention processes, including floodplain storage and wetland buffering, further amplifies discharge estimates in some regions. For smaller basins such as Wadi Derna, the rapid hydrological response to localized extreme rainfall presents additional challenges. The variability in rainfall distribution, coupled with the model's limited ability to capture localized hydrological dynamics, results in a weaker signal for the catchment, even during an event as extreme as Storm Daniel. These limitations emphasize the need for improved model resolution, enhanced precipitation forcings and better calibration tailored to local catchment characteristics.
Nonetheless, EFAS's ability to predict extreme river discharges, particularly within short lead times, demonstrates the potential of operational forecast systems in capturing the extreme values of such events. Supported by EFAS and GloFAS, the Copernicus Emergency Management Service (CEMS) provides critical insights into the timing and magnitude of extreme hydrological events. These forecasts are vital for enhancing preparedness and response strategies in the face of escalating climate extremes, offering essential tools for civil protection efforts and mitigating the socioeconomic impacts of such disasters.
5.2 The role of natural variability and human-driven climate change in changing Daniel's dynamics
We use ClimaMeter's analogue-based approach (Faranda et al., 2024) to study the influence of human-driven climate change and natural variability on Storm Daniel. By comparing surface pressure patterns in the periods 1979–2000 (“past”) and 2001–present (“current”), we identify how similar Mediterranean depressions have evolved. We use MSWX data to analyze temperature, precipitation and wind speed changes associated with these analogues. We repeat the analysis twice, once for 5–6 September, when Daniel impacted Greece, and once for 10–11 September, when Daniel impacted Libya.
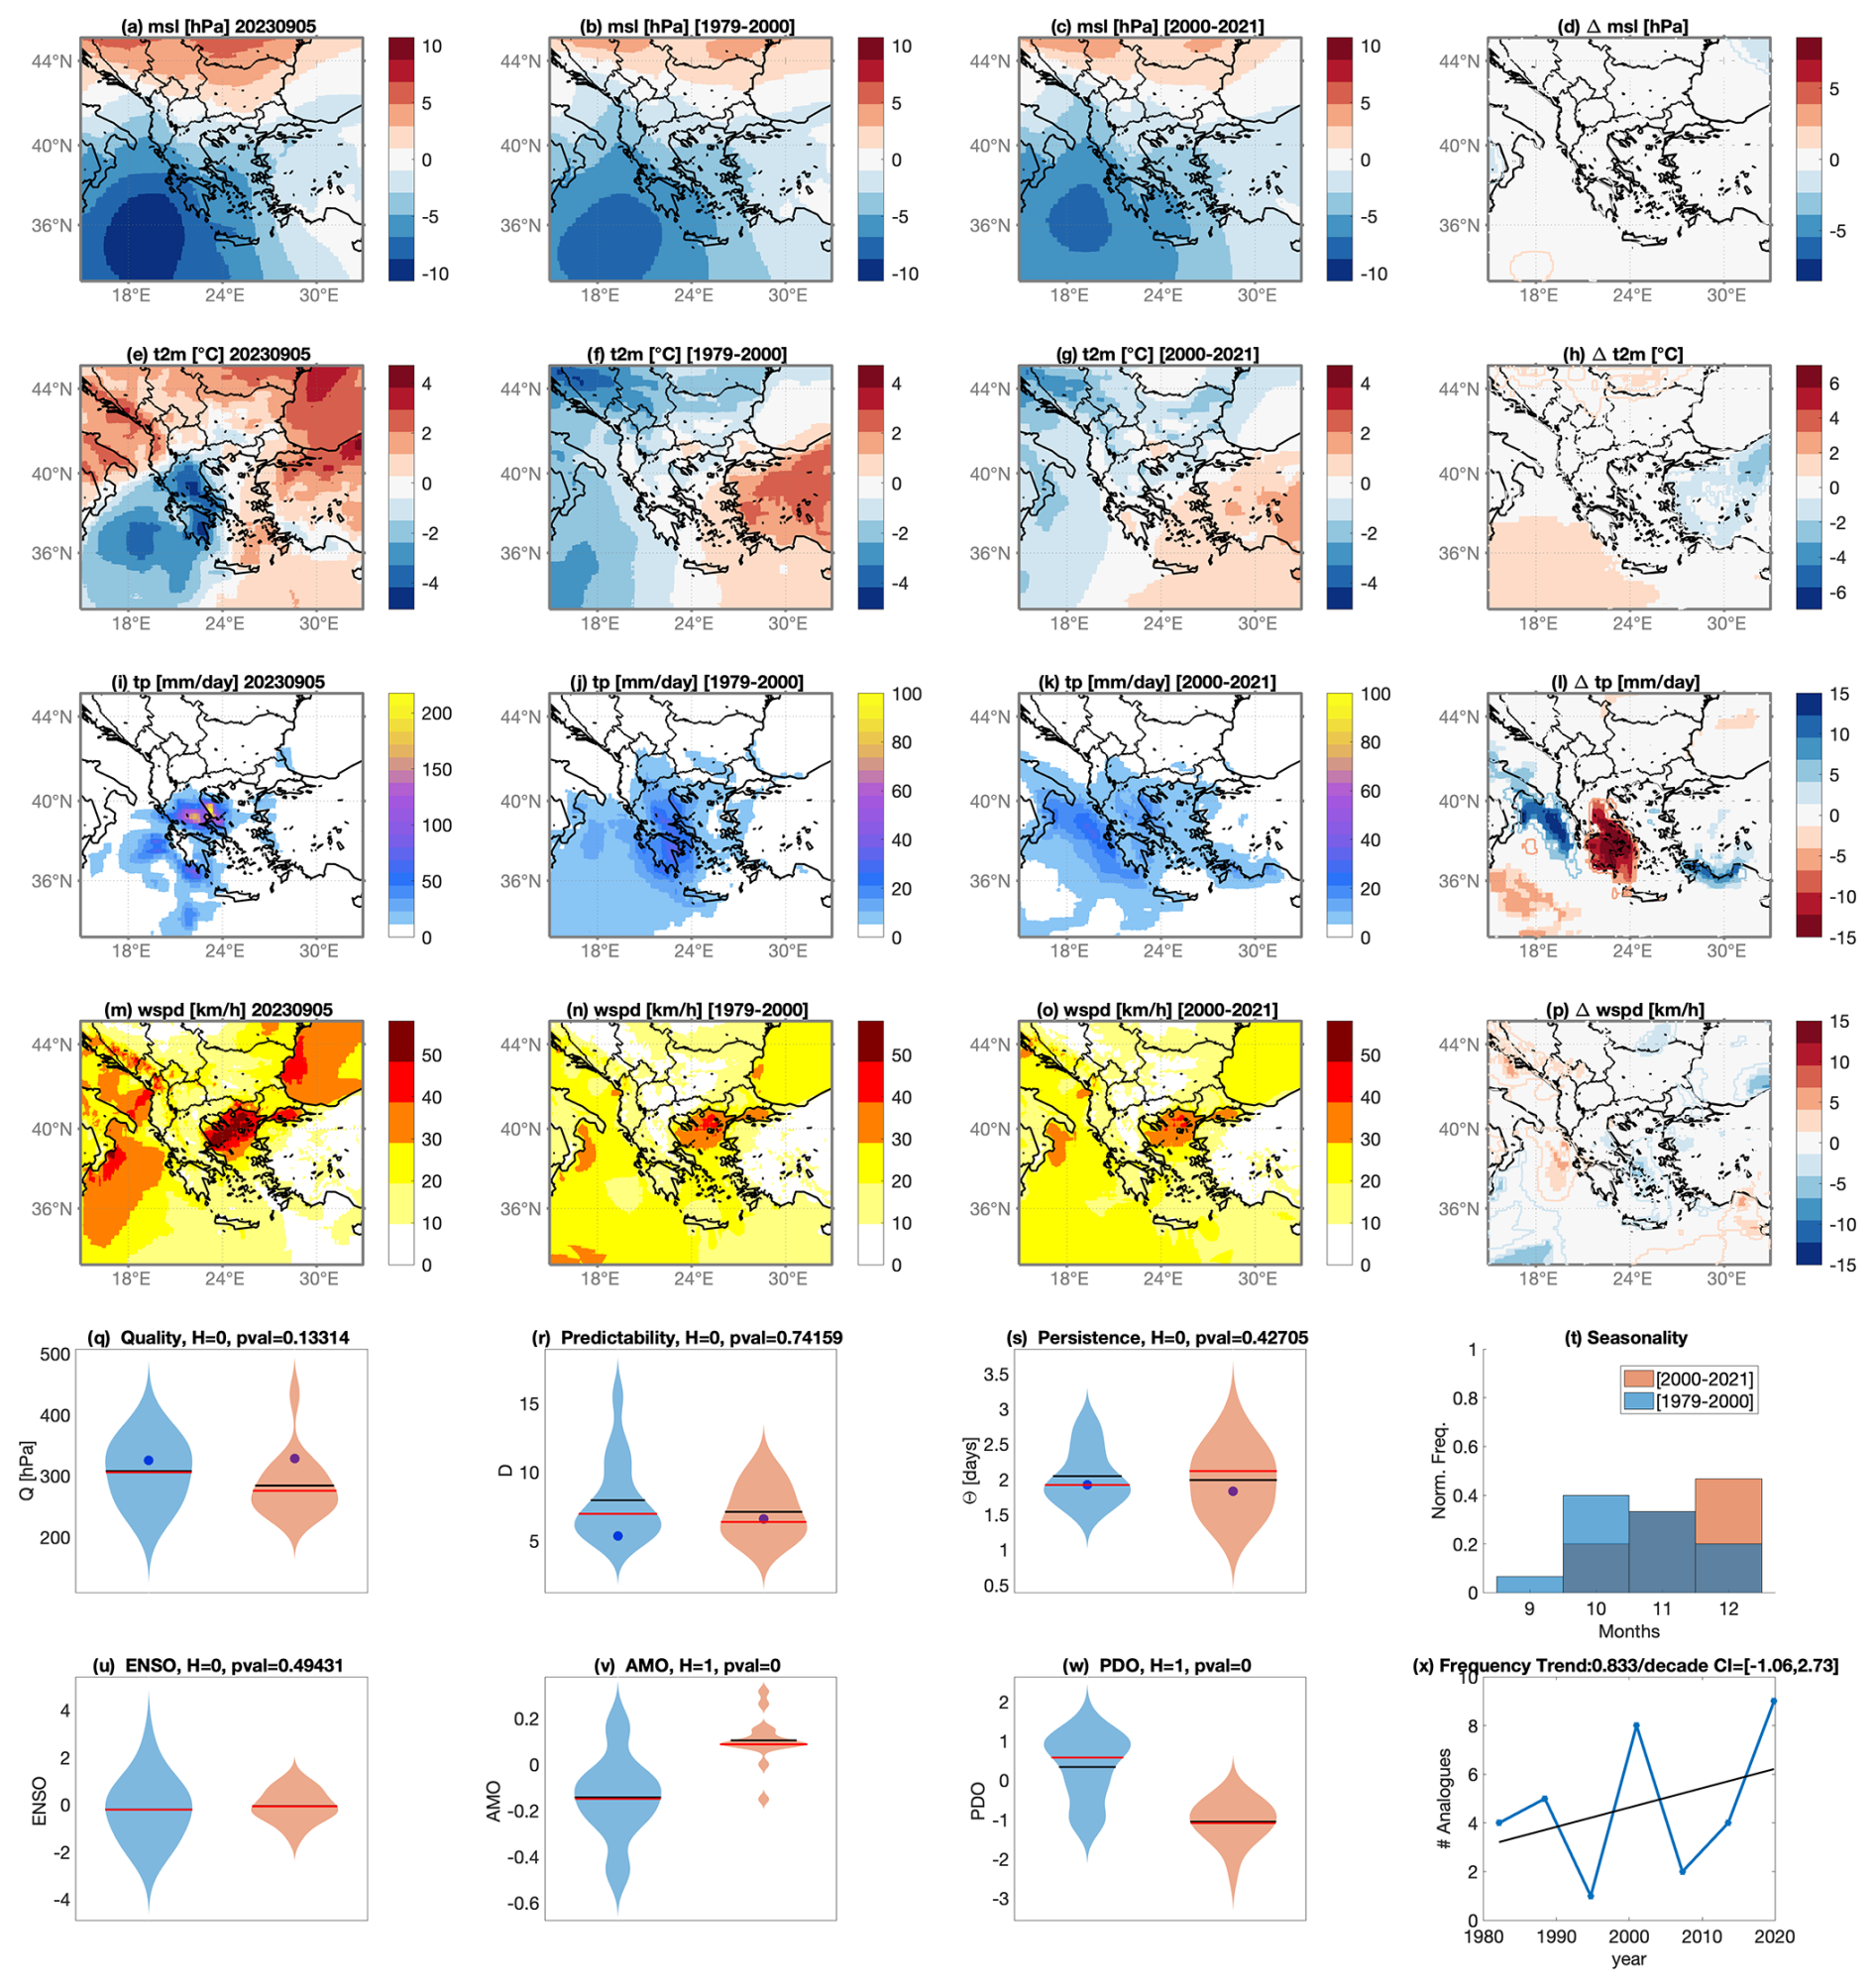
Figure 12Analogues for 5 September 2023; the region 33–45° N, 15–33° E; and the extended autumn season (September–December, SOND): average surface pressure anomaly (msl) (a), average 2 m temperature anomalies (t2m) (e), accumulated total precipitation (tp) (i) and average wind speed (wspd) in the period of the event. Average of the surface pressure analogues found in the counterfactual (1979–2000) (b) and factual periods (2001–2022) (c), along with corresponding 2 m temperatures (f, g), accumulated precipitation (j, k) and wind speed (n, o). Changes between present and past analogues are presented for surface pressure Δmsl (d), 2 m temperatures Δt2m (h), total precipitation Δtp (i) and wind speed Δwspd (p): color-filled shaded areas indicate significant anomalies obtained from the bootstrap procedure. Contours indicate non-significant changes: violin plots for past (blue) and present (orange) periods for quality Q analogues (q), predictability index D (r), persistence index Θ (s), and distribution of analogues in each month (t). Violin plots for past (blue) and present (orange) periods for ENSO (u), AMO (v) and PDO (w). Number of analogues occurring in each subperiod (blue) and linear trend (black). A blue dot marks values for the peak day of the extreme event. Horizontal bars in panels (q), (r), (s), (u), (v) and (w) correspond to the mean (black) and median (red) of the distributions. (x) Number of analogues found in subperiods of ∼ 6 years when 33 analogues are searched in the whole 1979–2022 period.
Regarding the impacts in Greece, we searched for analogues for 5 September 2023 within the region defined within the domain shown in Fig. 12a and within the extended autumn season from September to December (SOND). Figure 12a–d show that cyclone systems similar to Daniel impacting Greece have the same order of pressure minima in their center as in the past. Figure 12e–h show that during depressions, temperatures in the Ionian Sea increased by approximately 2 °C and decreased over Anatolia. Precipitation analysis (Fig. 12j–l) indicates that such events produce heavier rainfall over the Ionian Sea but generally reduced precipitation amounts over continental Greece and the Peloponnese (ranging between 4 and 12 mm d−1). To examine potential changes in the dynamical characteristics of these events, the metrics Q, D and Θ are computed and shown in Fig. 12q–s. These figures reveal no significant differences between the past and present climate periods. However, Q provides insight into the similarity of current events with past analogues, showing that the events have comparable counterparts in both time frames. Notably, similar events have become more frequent in December, whereas they were previously concentrated in October (Fig. 12t). To assess the potential influence of low-frequency modes of natural variability on the differences observed in the analogue composite maps, we compare the distributions of ENSO, AMO and PDO values on the analogue dates in both the past and present periods and test the statistical significance of the observed differences. For this date, our analysis suggests that natural climate variability, particularly the AMO and PDO, may have influenced the development of the MSLP pattern associated with the storm (Fig. 12u–w). To clarify the trend in event frequency, Fig. 12x expands the analysis to include 33 analogues for the whole period (1979–2022) instead of 15 in each 20-year period.
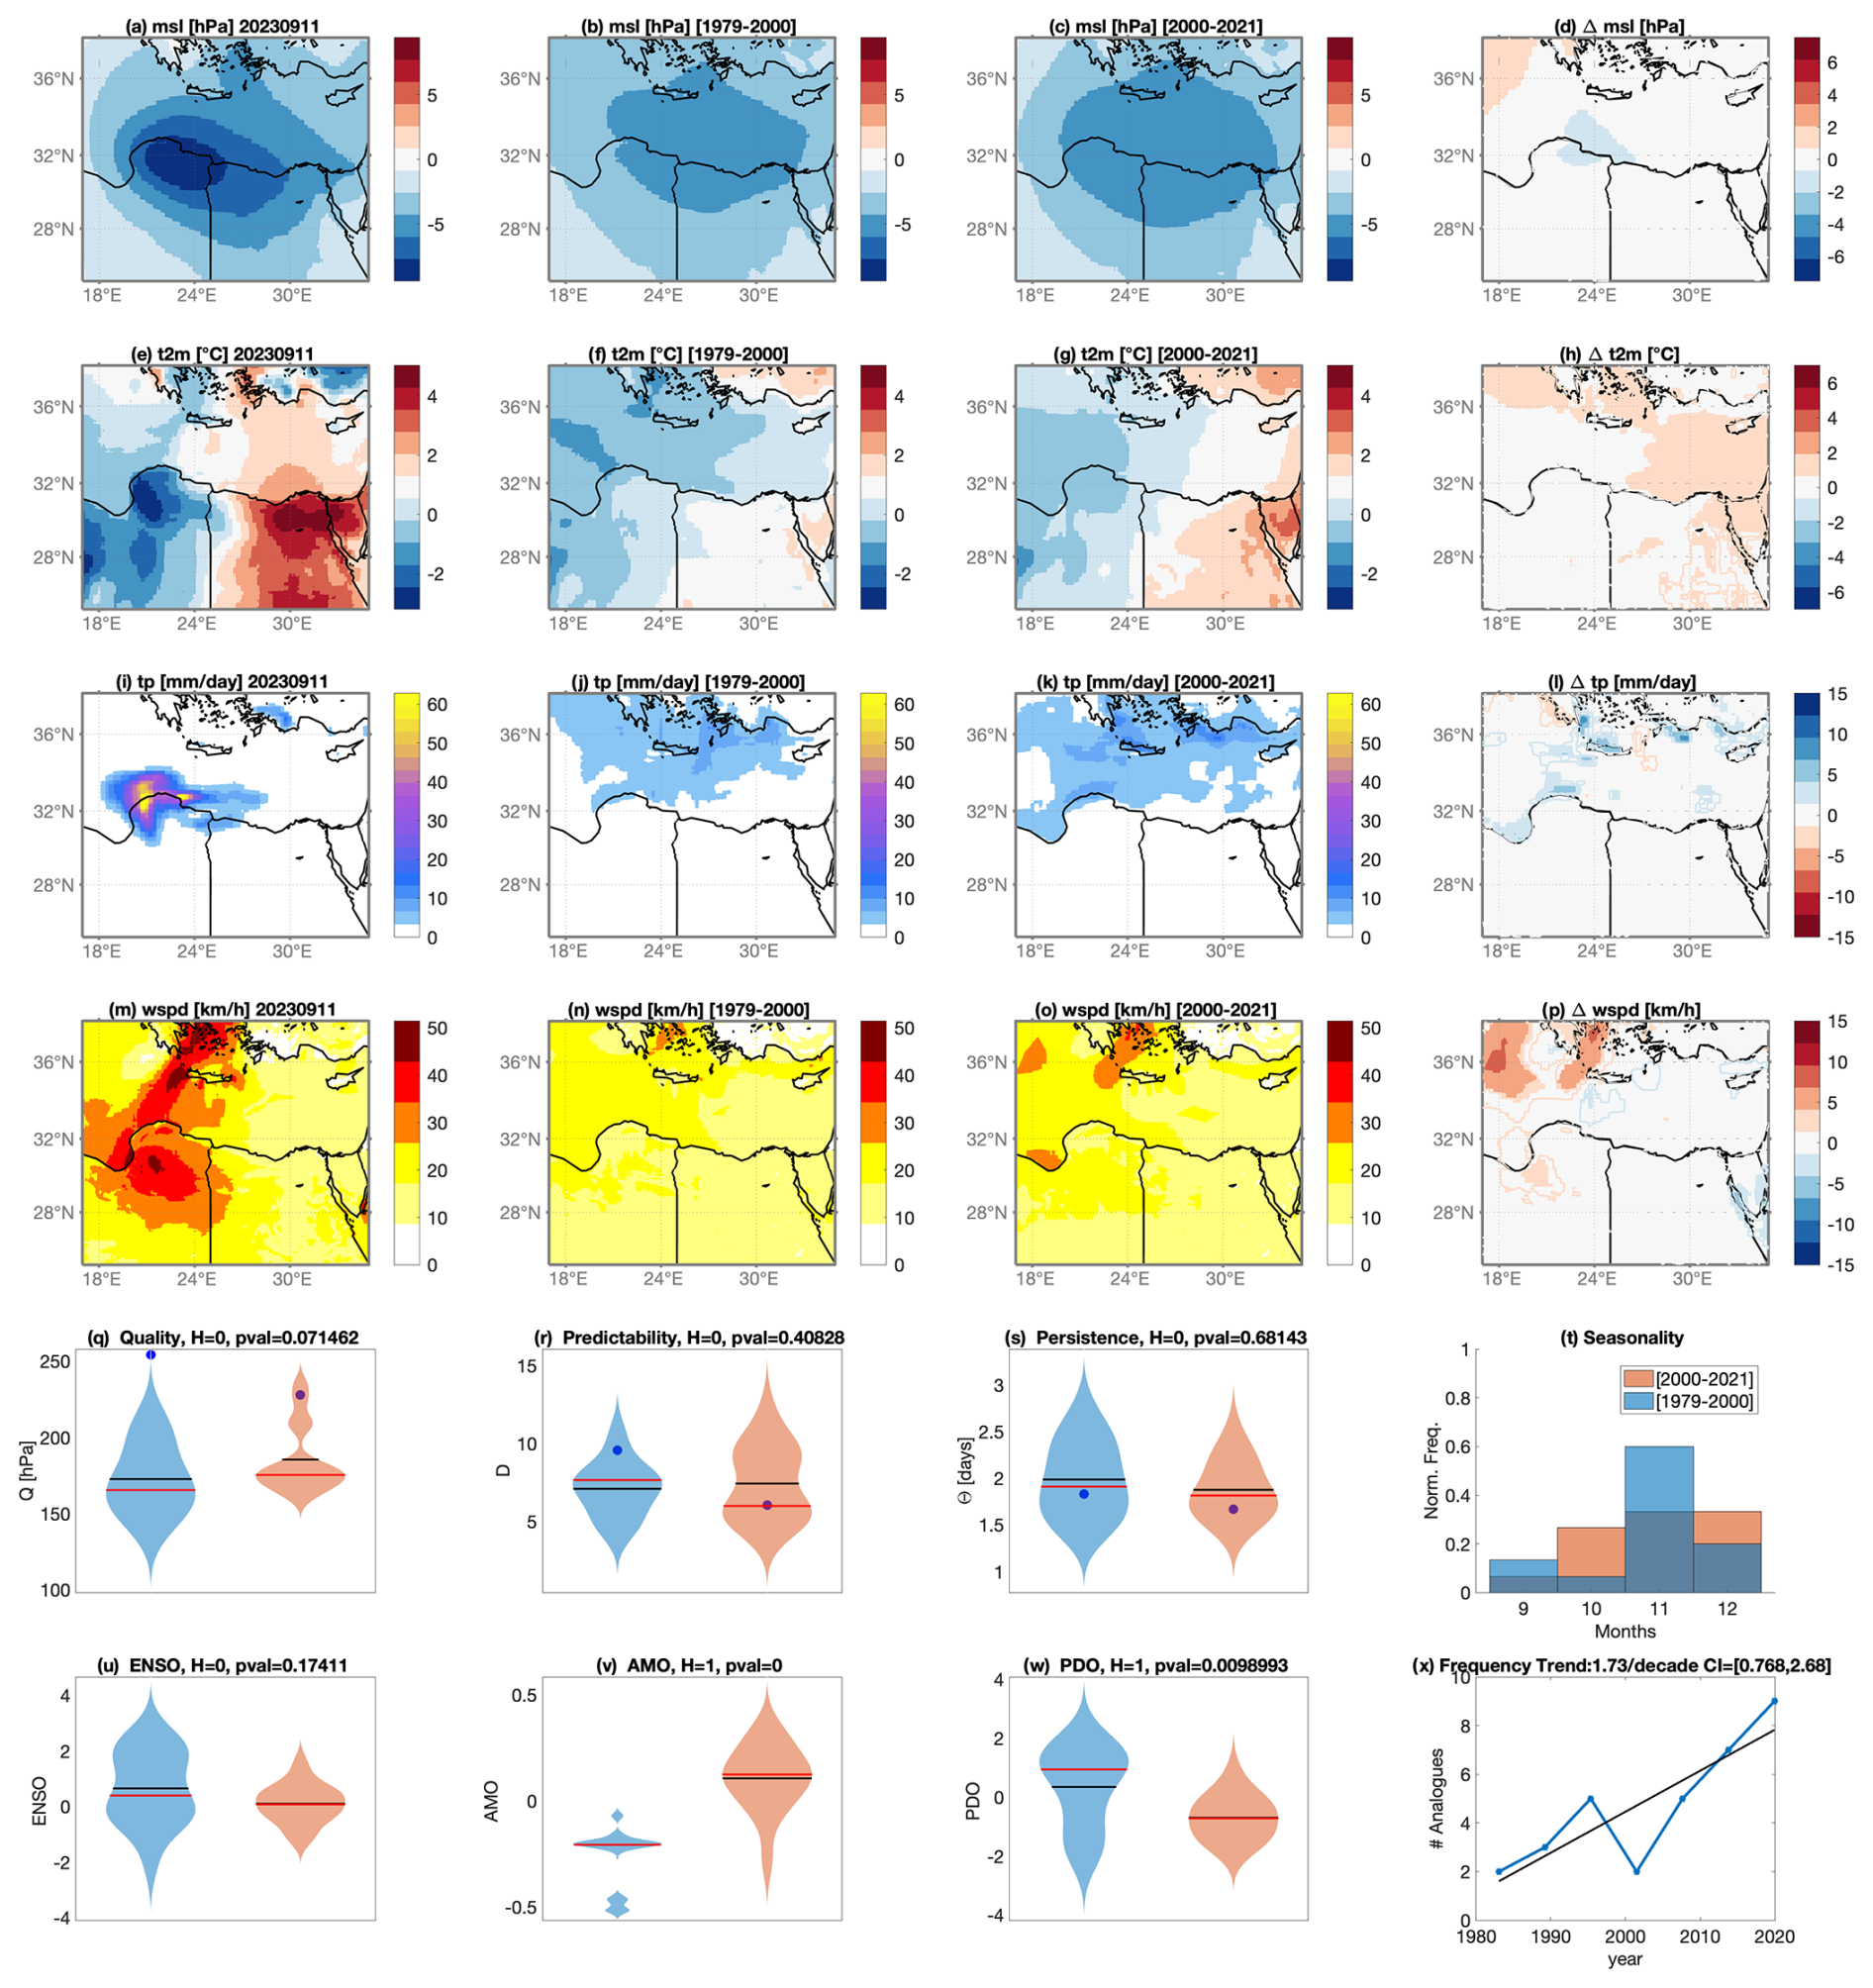
Figure 13As in Fig. 12, but for 10–11 September 2023; the region 17–35° E, 25–38° N; and the extended autumn season (SOND).
We repeat the analysis for 10–11 September 2023 within the region depicted in Fig. 13a, focusing on analogue detection for the SOND period. The results are reported in Fig. 13. The MSLP changes (Fig. 13d) show no substantial differences in the areas significantly affected. The temperature changes (Fig. 13h) indicate warming of up to +2 °C over the eastern part of the domain. Precipitation changes (Fig. 13l) show that similar events produced higher precipitation amounts along the eastern Libyan coast (ranging from 5 to 9 mm d−1), which experienced intense rainfall from Daniel on 10 September 2023. The metrics Q, D and Θ (Fig. 13q–s) show no significant differences between the past and present periods. Whereas the 5 September analysis of Q identified suitable analogues, in this case, Q shows that no good analogues are available, underscoring the exceptional nature of Daniel's pressure pattern when the storm impacted Libya. The frequency of such events decreased in September and November, with a slight increase observed in December (Fig. 13t). As with the 5 September, the AMO and PDO may have influenced the development of the MSLP pattern linked to the storm (Fig. 13u–w). Figure 13x showed changes in event frequency when 30 analogues were considered for the entire period analyzed instead of 15 in both periods. As in the case of impacts in Greece, a significant increasing trend in frequency is found.
The analogue method helps us understand extreme weather events like Daniel by comparing them to similar past events and seeing how they have changed over time. Our results suggest a role of the AMO and PDO in modulating the large-scale atmospheric patterns conducive to the development of Storm Daniel. Previous studies (see Hodgkins et al., 2017, and references therein) have suggested that positive phases of the AMO can enhance the likelihood of persistent ridges over Europe and modify Mediterranean circulation patterns, while the PDO has been linked to alterations in the waveguide structure of the jet stream across the Northern Hemisphere. These teleconnections may precondition the synoptic environment in which Mediterranean cyclones form and evolve, as Maslova et al. (2017) suggested. This assessment is exploratory, highlighting potential associations without making definitive attributions given the limitations of a 40-year dataset.
For 5 September, when Daniel impacted Greece, we found similar past Mediterranean storms, suggesting that this part of the storm's track was unusual but not unprecedented. Since we see no major changes in the MSLP pattern, the increase in precipitation over the region is most likely linked to higher SSTs, which provide more moisture to the atmosphere. This matches other studies that show Greece experienced extreme moisture anomalies.
For 10–11 September, when Daniel reached Libya, our method found no suitable past matches, highlighting the exceptional nature of the storm's pressure pattern at this stage. However, like in Greece, we do not see substantial changes in MSLP. The increased frequency of circulation analogues to Storm Daniel in recent decades suggests that the synoptic conditions conducive to such extreme Mediterranean cyclones are becoming more common. This shift implies a heightened background risk for similar high-impact events under present-day climate conditions. Combining multiple lines of evidence, as is customary in attribution studies, we can deduce that the increase in rainfall over Libya was likely driven by warmer SSTs and a warmer atmosphere, which can hold more water (Clausius–Clapeyron relationship), rather than a shift in atmospheric dynamics patterns. The MSWX dataset provides a reliable representation of large-scale atmospheric patterns but does not fully capture localized extreme precipitation intensities, which explains why our figures underestimate the observed rainfall totals, particularly in Libya; therefore, our analysis should be interpreted as reflecting broader climatological trends rather than exact station-level extremes. We also acknowledge that the small-scale, medicane structure of Storm Daniel presents significant challenges for attribution studies based on relatively coarse-resolution reanalyses. In this study, we do not attempt to reproduce the mesoscale features or rapid intensification processes that characterized Daniel. Instead, our analysis focuses on the large-scale circulation patterns that may create a favorable environment for developing such compact systems. While this approach provides insights into the changing likelihood of conducive synoptic configurations under current climate conditions, it is important to note that critical aspects of Daniel's intensity and structure may be underrepresented in our framework. As such, our results should be interpreted as exploratory and are limited by the resolution and scope of the datasets employed. Importantly, while Daniel brought heavy rainfall, the disaster in Derna was mainly caused by the failure of poorly maintained dams (Shirzaei et al., 2025). Dente et al. (2024) confirm this, showing that while rainfall was intense, it was not so extreme as to explain the scale of destruction; factors like unsafe building locations and poor emergency response played a major role. These considerations underscore a key point: while climate change can amplify precipitation by increasing SSTs, the most severe impacts often depend on societal factors such as infrastructure resilience and disaster preparedness.
In the last decade, more than 410 000 deaths have been attributed to weather-related disasters, mostly in low-income countries where heat waves and intense precipitation events are the leading causes of death. Besides fatalities, 1.7 billion people have been affected by these kinds of phenomena in the 2010–2020 decade. The IFRC World Disasters Report (IFRC, 2020) concluded that climate change is a risk multiplier, i.e., intensifying existing vulnerabilities, particularly in low-income countries. A glaring example of the impact of such disasters is the recent floods in the Mediterranean, especially in Greece and Libya, following the Mediterranean Cyclone Daniel.
This study aimed to comprehensively analyze Medicane Daniel by linking atmospheric dynamics, predictability and impacts. Impacts – including flooding and coastal sea state conditions in Libya – were also evaluated with numerical weather prediction models. We placed these findings in a broader climatological context of cyclone-driven precipitation, underscoring how the observed impacts connect to climate change attribution for both catastrophic events.
From the perspective of atmospheric dynamics, the processes governing Daniel's development were similar to those identified for other intense Mediterranean cyclones: cyclogenesis was triggered by the intrusion of an upper-level PV streamer in the Ionian Sea, and thereafter, the cyclone propagated erratically southwards; turned towards the east on 8 September; and finally developed into a well-defined, mesoscale, tropical-like cyclonic system. Regarding impacts, we identified two distinct stages: the first is relevant to cyclogenesis, where Daniel had newly formed and affected Greece with severe floods (on 5 September 2023). In the second stage, Daniel reached maturity after making landfall in Libya, where it inflicted severe socioeconomic impacts on 11 September 2023 due to floods (about 5 d after the floods in Greece). Storm Daniel produced extreme precipitation during both stages by transporting moist air toward the flood-affected regions. The moisture transport followed the large-scale atmospheric circulation and drew on two primary sources: an anomalously warm Mediterranean Sea and the continental areas of central and eastern Europe. Together, these reservoirs supplied the water vapor that fueled the catastrophic rainfall.
In Greece, the floods occurred during the cyclogenesis stage in regions quite remote from the cyclone center. On the other hand, floods in Libya occurred close to the cyclone center and at the stage of its maximum intensity. During its first stage in Greece, the predictions of the cyclone formation were relatively poor for lead times of more than 4 d. It was a rather challenging issue for the ECMWF EPS to precisely forecast the intrusion of the PV streamer in the Mediterranean. This result aligns with previous studies that showed relatively poor performance in predicting medicane occurrences for lead times of 4 to 5 d (Di Muzio et al., 2019). With higher confidence, the ECMWF EPS could forecast cyclogenesis, and thus the flooding event, for shorter lead times.
During its second stage (impacts in Libya), the cyclone transitioned into a medicane, making landfall in Libya within a few days after its formation. The predictions of the medicane track – and therefore its landfall – showed higher certainty for lead times of 4 d. These results indicate that numerical weather prediction models are less skillful at predicting cyclogenesis; however, once the cyclone has formed, the models could become more reliable at forecasting its subsequent track.
Precipitation amounts were found to correspond to climate extremes in both countries, Greece and Libya, where river discharges were responsible for floods that largely exceeded the climatological maxima of the last 20 years. The numerical weather prediction model could forecast these climate extremes (even if thresholds were defined by reanalysis and not by the same forecast model). This underscores the exceptional potential of giving the public timely, accurate warnings about the severity of impending high-impact weather events. In this context, we have analyzed Daniel with respect to climate change and provided the means to interpret Daniel as an event whose characteristics can largely be ascribed to human-driven climate change. In these regards, we have performed an analysis based on analogues; indeed, several cyclones with similar characteristics were found during winter. The anomalous occurrence of such a storm in September, a warmer month for SST, could be a reason for its enhanced destructiveness through enhanced precipitation.
In the scientific literature, weather events are typically analyzed as case studies with specific objectives that rarely escape the narrow scope of a single scientific discipline. Here, we used Daniel, a high-impact weather event, as a centerpiece for different approaches to better understand socioeconomic impacts through the prism of both weather and climate scales. We find such an approach to be valuable for linking different scientific communities and essential for communicating hazards to the local population. We envisage using this interdisciplinary approach for other weather extremes and regions.
To use the Sodemann et al. (2008) moisture source diagnostic, the WaterSip tool (Sodemann, 2025a) is provided by Sodemann (2025b; https://doi.org/10.5281/zenodo.16745927).
IFS analyses and EPS forecasts are available through the Meteorological Archival and Retrieval System (MARS) of the European Centre for Medium-Range Weather Forecasts (ECMWF) (https://www.ecmwf.int/en/forecasts/datasets/, last access 2 October 2025).
EF conceptualized this work and coordinated the collection of manuscript content from all coauthors. StD, SiD, AH, MMM, FP, KH and PP contributed input regarding the meteorological background of the event, discussed atmospheric dynamics and forecast implications, and wrote the relevant sections of the text. MS provided data for the analysis of water sources, which was analyzed by IT. AK and CF contributed data and analyses and wrote the sections on flooding and sea state, respectively. Finally, DF provided expertise and conducted the analysis of Storm Daniel in the context of climate change attribution.
At least one of the (co-)authors is a member of the editorial board of Weather and Climate Dynamics. The peer-review process was guided by an independent editor, and the authors also have no other competing interests to declare.
Publisher's note: Copernicus Publications remains neutral with regard to jurisdictional claims made in the text, published maps, institutional affiliations, or any other geographical representation in this paper. While Copernicus Publications makes every effort to include appropriate place names, the final responsibility lies with the authors.
We gratefully acknowledge Ambrogio Volontè and an anonymous reviewer for accurately reviewing our paper. This article is based upon collaborative work of two COST actions: CA19109 “MedCyclones” and CA22162 “FutureMed”, supported by COST – European Cooperation in Science and Technology (http://www.cost.eu, last access: 14 February 2025). It is also based on work within the scope of the “Earth observations as a cornerstone to the understanding and prediction of tropical like cyclone risk in the Mediterranean (MEDICANES)” project, ESA contract no. 4000144111/23/I-KE. Georgios Kyros from the National Observatory of Athens/meteo.gr is acknowledged for helping collect the Copernicus Sentinel-2 data in Fig. 1. We finally thank Franziska Aemisegger for providing the msd-cpp code for the calculation of the moisture sources.
Silvio Davolio received the support of the project “Geosciences for society: resources and their evolution” supported by the Italian Ministry of University and Research (MUR) through the funds “Dipartimenti di Eccellenza 2023/2027”. Platon Patlakas was funded by the EU's Horizon Europe program, OCEANIDS (G.A. no. 101112919). Mario Marcello Miglietta received financial support from Next Generation EU, Mission 4, Component 1, CUP B53D23007360006, “Thunderstorm outflows measurements and modeling for strong WIND nowcast and RISK mitigation (WIND RISK)”. Assaf Hochman acknowledges support by the Israel Science Foundation (grant no. 978/23) and the Planning and Budgeting Committee of the Israeli Council for Higher Education under the “MedWorld” Consortium. This work was partly supported by the European Space Agency through the “Earth observations as a cornerstone to the understanding and prediction of tropical-like cyclone risk in the Mediterranean (MEDICANES)” project (ESA Contract 4000144111/23/I-KE).
This paper was edited by Shira Raveh-Rubin and reviewed by Ambrogio Volonté and one anonymous referee.
Arena, F., Laface, V., Malara, G., and Romolo, A.: Estimation of downtime and of missed energy associated with a wave energy converter by the equivalent power storm model, Energies, 8, 11575–11591, https://doi.org/10.3390/EN81011575, 2015.
Argüeso, D., Marcos, M., and Amores, A.: Storm Daniel fueled by anomalously high sea surface temperatures in the Mediterranean, npj Clim. Atmos. Sci., 7, 307, https://doi.org/10.1038/s41612-024-00872-2, 2024.
Avolio, E., Fanelli, C., Pisano, A., and Miglietta, M. M.: Unveiling the relationship between Mediterranean tropical-like cyclones and rising Sea Surface Temperature, Geophys. Res. Lett., 51, e2024GL109921, https://doi.org/10.1029/2024GL109921, 2024.
Beck, H. E., Van Dijk, A. I. J. M., Larraondo, P. R., McVicar, T. R., Pan, M., Dutra, E., and Miralles, D. G.: MSWX: Global 3-Hourly 0.1° Bias-Corrected Meteorological Data Including Near-Real-Time Updates and Forecast Ensembles, B. Am. Meteorol. Soc., 103, E710–E732, https://doi.org/10.1175/BAMS-D-21-0145.1, 2022.
Bouin, M.-N. and Lebeaupin Brossier, C.: Impact of a medicane on the oceanic surface layer from a coupled, kilometre-scale simulation, Ocean Sci., 16, 1125–1142, https://doi.org/10.5194/os-16-1125-2020, 2020.
Catto, J. L. and Dowdy, A.: Understanding compound hazards from a weather system perspective, Weather and Climate Extremes, 32, 100313, https://doi.org/10.1016/j.wace.2021.100313, 2021.
Chaboureau, J., Pantillon, F., Lambert, D., Richard, E., and Claud, C.: Tropical transition of a Mediterranean storm by jet crossing, Q. J. Roy. Meteor. Soc., 138, 596–611, https://doi.org/10.1002/qj.960, 2012.
Couto, F. T., Kartsios, S., Lacroix, M., and Andrade, H. N.: A Quick Look at the Atmospheric Circulation Leading to Extreme Weather Phenomena on a Continental Scale, Atmosphere, 15, 1205, https://doi.org/10.3390/atmos15101205, 2024.
Davolio, S., Della Fera, S., Laviola, S., Miglietta, M. M., and Levizzani, V.: Heavy Precipitation over Italy from the Mediterranean Storm “Vaia” in October 2018: Assessing the Role of an Atmospheric River, Mon. Weather Rev., 148, 3571–3588, https://doi.org/10.1175/MWR-D-20-0021.1, 2020.
Dente, E., Armon, M., and Shmilovitz, Y.: The September 2023 flood in Derna, Libya: an extreme weather event or man-made disaster?, EGU General Assembly 2024, Vienna, Austria, 14–19 April 2024, EGU24-15755, https://doi.org/10.5194/egusphere-egu24-15755, 2024.
de Vries, A. J.: A global climatological perspective on the importance of Rossby wave breaking and intense moisture transport for extreme precipitation events, Weather Clim. Dynam., 2, 129–161, https://doi.org/10.5194/wcd-2-129-2021, 2021.
Dimitriou, E., Efstratiadis, A., Zotou, I., Papadopoulos, A., Iliopoulou, T., Sakki, G.-K., Mazi, K., Rozos, E., Koukouvinos, A., Koussis, A. D., Mamassis, N., and Koutsoyiannis, D.: Post-Analysis of Daniel Extreme Flood Event in Thessaly, Central Greece: Practical Lessons and the Value of State-of-the-Art Water-Monitoring Networks, Water, 16, 980, https://doi.org/10.3390/w16070980, 2024.
Di Muzio, E., Riemer, M., Fink, A. H., and Maier-Gerber, M.: Assessing the predictability of Medicanes in ECMWF ensemble forecasts using an object-based approach, Q. J. Roy. Meteor. Soc., 145, 1202–1217, https://doi.org/10.1002/qj.3489, 2019.
Duffourg, F. and Ducrocq, V.: Origin of the moisture feeding the Heavy Precipitating Systems over Southeastern France, Nat. Hazards Earth Syst. Sci., 11, 1163–1178, https://doi.org/10.5194/nhess-11-1163-2011, 2011.
Faranda, D., Messori, G., and Yiou, P.: Dynamical proxies of North Atlantic predictability and extremes, Sci. Rep., 7, 41278, https://doi.org/10.1038/srep41278, 2017.
Faranda, D., Bourdin, S., Ginesta, M., Krouma, M., Noyelle, R., Pons, F., Yiou, P., and Messori, G.: A climate-change attribution retrospective of some impactful weather extremes of 2021, Weather Clim. Dynam., 3, 1311–1340, https://doi.org/10.5194/wcd-3-1311-2022, 2022.
Faranda, D., Ginesta, M., Alberti, T., Coppola, E., and Anzidei, M.: Attributing Venice Acqua Alta events to a changing climate and evaluating the efficacy of MoSE adaptation strategy, npj Clim. Atmos. Sci., 6, 181, https://doi.org/10.1038/s41612-023-00513-0, 2023.
Faranda, D., Messori, G., Coppola, E., Alberti, T., Vrac, M., Pons, F., Yiou, P., Saint Lu, M., Hisi, A. N. S., Brockmann, P., Dafis, S., Mengaldo, G., and Vautard, R.: ClimaMeter: contextualizing extreme weather in a changing climate, Weather Clim. Dynam., 5, 959–983, https://doi.org/10.5194/wcd-5-959-2024, 2024.
Ferrarin, C., Pantillon, F., Davolio, S., Bajo, M., Miglietta, M. M., Avolio, E., Carrió, D. S., Pytharoulis, I., Sanchez, C., Patlakas, P., González-Alemán, J. J., and Flaounas, E.: Assessing the coastal hazard of Medicane Ianos through ensemble modelling, Nat. Hazards Earth Syst. Sci., 23, 2273–2287, https://doi.org/10.5194/nhess-23-2273-2023, 2023a.
Ferrarin, C., Orlić, M., Bajo, M., Davolio, S., Umgiesser, G., and Lionello, P.: The contribution of a mesoscale cyclone and associated meteotsunami to the exceptional flood in Venice on November 12, 2019, Q. J. Roy. Meteor. Soc., 149, 2929–2942, https://doi.org/10.1002/qj.4539, 2023b.
Flaounas, E., Raveh-Rubin, S., Wernli, H., Drobinski, P., and Bastin, S.: The dynamical structure of intense Mediterranean cyclones, Clim. Dynam., 44, 2411–2427, https://doi.org/10.1007/s00382-014-2330-2, 2015.
Flaounas, E., Di Luca, A., Drobinski, P., Mailler, S., Arsouze, T., Bastin, S., Beranger, K., and Lebeaupin Brossier, C.: Cyclone contribution to the Mediterranean Sea water budget, Clim. Dynam., 46, 913–927, https://doi.org/10.1007/s00382-015-2622-1, 2016.
Flaounas, E., Kotroni, V., Lagouvardos, K., Gray, S. L., Rysman, J.-F., and Claud, C.: Heavy rainfall in Mediterranean cyclones. Part I: contribution of deep convection and warm conveyor belt, Clim. Dynam., 50, 2935–2949, https://doi.org/10.1007/s00382-017-3783-x, 2018.
Flaounas, E., Fita, L., Lagouvardos, K., and Kotroni, V.: Heavy rainfall in Mediterranean cyclones, Part II: Water budget, precipitation efficiency and remote water sources, Clim. Dynam., 53, 2539–2555, https://doi.org/10.1007/s00382-019-04639-x, 2019.
Flaounas, E., Gray, S. L., and Teubler, F.: A process-based anatomy of Mediterranean cyclones: from baroclinic lows to tropical-like systems, Weather Clim. Dynam., 2, 255–279, https://doi.org/10.5194/wcd-2-255-2021, 2021.
Flaounas, E., Davolio, S., Raveh-Rubin, S., Pantillon, F., Miglietta, M. M., Gaertner, M. A., Hatzaki, M., Homar, V., Khodayar, S., Korres, G., Kotroni, V., Kushta, J., Reale, M., and Ricard, D.: Mediterranean cyclones: current knowledge and open questions on dynamics, prediction, climatology and impacts, Weather Clim. Dynam., 3, 173–208, https://doi.org/10.5194/wcd-3-173-2022, 2022.
Grimaldi, S., Salamon, P., Disperati, J., Zsoter, E., Russo, C., Ramos, A., Carton De Wiart, C., Barnard, C., Hansford, E., Gomes, G., and Prudhomme, C.: River discharge and related historical data from the Global Flood Awareness System, v4.0, European Commission, Joint Research Centre (JRC) [data set], https://doi.org/10.24381/cds.a4fdd6b9, 2022.
He, K., Yang, Q., Shen, X., Dimitriou, E., Mentzafou, A., Papadaki, C., Stoumboudi, M., and Anagnostou, E. N.: Brief communication: Storm Daniel flood impact in Greece in 2023: mapping crop and livestock exposure from synthetic-aperture radar (SAR), Nat. Hazards Earth Syst. Sci., 24, 2375–2382, https://doi.org/10.5194/nhess-24-2375-2024, 2024.
Hersbach, H., Bell, B., Berrisford, P., Hirahara, S., Horányi, A., Muñoz-Sabater, J., Nicolas, J., Peubey, C., Radu, R., Schepers, D., Simmons, A., Soci, C., Abdalla, S., Abellan, X., Balsamo, G., Bechtold, P., Biavati, G., Bidlot, J., Bonavita, M., De Chiara, G., Dahlgren, P., Dee, D., Diamantakis, M., Dragani, R., Flemming, J., Forbes, R., Fuentes, M., Geer, A., Haimberger, L., Healy, S., Hogan, R. J., Hólm, E., Janisková, M., Keeley, S., Laloyaux, P., Lopez, P., Lupu, C., Radnoti, G., De Rosnay, P., Rozum, I., Vamborg, F., Villaume, S., and Thépaut, J.: The ERA5 global reanalysis, Q. J. Roy. Meteor. Soc., 146, 1999–2049, https://doi.org/10.1002/qj.3803, 2020.
Hewson, T., Ashoor, A., Boussetta, S., Emanuel, K., Lagouvardos, K., Lavers, D., Magnusson, L., Pillosu, F., and Zsoter, E.: Medicane Daniel: an extraordinary cyclone with devastating impacts, ECMWF newsletters, 179, 33–47, 2024.
Hochman, A., Scher, S., Quinting, J., Pinto, J. G., and Messori, G.: Dynamics and predictability of cold spells over the Eastern Mediterranean, Clim. Dynam., 58, 2047–2064, https://doi.org/10.1007/s00382-020-05465-2, 2022a.
Hochman, A., Marra, F., Messori, G., Pinto, J. G., Raveh-Rubin, S., Yosef, Y., and Zittis, G.: Extreme weather and societal impacts in the eastern Mediterranean, Earth Syst. Dynam., 13, 749–777, https://doi.org/10.5194/esd-13-749-2022, 2022b.
Hochman, A., Plotnik, T., Marra, F., Shehter, E.-R., Raveh-Rubin, S., and Magaritz-Ronen, L.: The sources of extreme precipitation predictability; the case of the “Wet” Red Sea Trough, Weather and Climate Extremes, 40, 100564, https://doi.org/10.1016/j.wace.2023.100564, 2023.
Hochman, A., Shachar, N., and Gildor, H.: Unraveling sub-seasonal precipitation variability in the Middle East via Indian Ocean sea surface temperature, Sci. Rep., 14, 2919, https://doi.org/10.1038/s41598-024-53677-x, 2024.
Hodgkins, G. A., Whitfield, P. H., Burn, D. H., Hannaford, J., Renard, B., Stahl, K., Fleig, A. K., Madsen, H., Mediero, L., Korhonen, J., Murphy, C., and Wilson, D.: Climate-driven variability in the occurrence of major floods across North America and Europe, J. Hydrol., 552, 704–717, 2017.
IFRC: World Disasters Report 2020 Executive Summary, International Federation of Red Cross and Red Crescent Societies, https://www.ifrc.org/document/world-disasters-report-2020 (last access: 22 September 2025), 2020.
IOM: Libya – Storm Daniel Flash update 8, Global Data Institute of the UN International Organization for Migration (IOM), https://dtm.iom.int/fr/node/30081 (last access: 2 October 2025), 2023.
Khodayar, S., Davolio, S., Di Girolamo, P., Lebeaupin Brossier, C., Flaounas, E., Fourrie, N., Lee, K.-O., Ricard, D., Vie, B., Bouttier, F., Caldas-Alvarez, A., and Ducrocq, V.: Overview towards improved understanding of the mechanisms leading to heavy precipitation in the western Mediterranean: lessons learned from HyMeX, Atmos. Chem. Phys., 21, 17051–17078, https://doi.org/10.5194/acp-21-17051-2021, 2021.
Khodayar, S., Kushta, J., Catto, J. L., Dafis, S., Davolio, S., Ferrarin, C., Flaounas, E., Groenemeijer, P., Hatzaki, M., Hochman, A., Kotroni, V., Landa, J., Láng-Ritter, I., Lazoglou, G., Liberato, M. L. R., Miglietta, M. M., Papagiannaki, K., Patlakas, P., Stojanov, R., and Zittis, G.: Mediterranean Cyclones in a Changing Climate: A Review on Their Socio-Economic Impacts, Rev. Geophys., 63, e2024RG000853, https://doi.org/10.1029/2024RG000853, 2025.
Korres, G., Ravdas, M., Denaxa, D., and Sotiropoulou, M.: Mediterranean Sea Waves Reanalysis INTERIM (CMEMS Med-Waves, MedWAM3I system) (Version 1), Copernicus Monitoring Environment Marine Service (CMEMS) [data set], https://doi.org/10.25423/CMCC/MEDSEA_MULTIYEAR_WAV_006_012_MEDWAM3I, 2021.
Korres, G., Oikonomou, C., Denaxa, D., and Sotiropoulou, M.: Mediterranean Sea Waves Analysis and Forecast (Copernicus Marine Service MED-Waves, MEDWAM4 system) (Version 1), Copernicus Marine Service (CMS) [data set], https://doi.org/10.25423/CMCC/MEDSEA_ANALYSISFORECAST_WAV_006_017_MEDWAM4, 2023.
Lagouvardos, K., Kotroni, V., Bezes, A., Koletsis, I., Kopania, T., Lykoudis, S., Mazarakis, N., Papagiannaki, K., and Vougioukas, S.: The automatic weather stations NOANN network of the National Observatory of Athens: operation and database, Geosci. Data J., 4, 4–16, https://doi.org/10.1002/gdj3.44, 2017.
Maslova, V., Voskresenskaya, E. N., and Lubkov, A.: Multidecadal change of winter cyclonic activity in the Mediterranean associated with AMO and PDO, Terr. Atmos. Ocean. Sci., 28, 965–977, https://doi.org/10.3319/TAO.2017.04.23.01, 2017.
Messmer, M., Gómez-Navarro, J. J., and Raible, C. C.: Sensitivity experiments on the response of Vb cyclones to sea surface temperature and soil moisture changes, Earth Syst. Dynam., 8, 477–493, https://doi.org/10.5194/esd-8-477-2017, 2017.
Miglietta, M. M., Moscatello, A., Conte, D., Mannarini, G., Lacorata, G., and Rotunno, R.: Numerical analysis of a Mediterranean “hurricane” over south-eastern Italy: Sensitivity experiments to sea surface temperature, Atmos. Res., 101, 412–426, https://doi.org/10.1016/j.atmosres.2011.04.006, 2011.
Miglietta, M. M., Carnevale, D., Levizzani, V., and Rotunno, R.: Role of moist and dry air advection in the development of Mediterranean tropical-like cyclones (medicanes), Q. J. Roy. Meteor. Soc., 147, 876–899, https://doi.org/10.1002/qj.3951, 2021.
Miglietta, M. M., Flaounas, E., González-Alemán, J. J., Panegrossi, G., Gaertner, M. A., Pantillon, F., Pasquero, C., Schultz, D. M., D'Adderio, L. P., Dafis, S., Husson, R., Ricchi, A., Carrió, D. S. C., Davolio, S., Fita, L., Picornell, M. A., Pytharoulis, I., Raveh-Rubin, S., Scoccimarro, E., Bernini, L., Cavicchia, L., Conte, D., Ferretti, R., Flocas, H., Gutiérrez-Fernández, J., Hatzaki, M., Santaner, V. H., Jansà, A., and Patlakas, P.: Defining Medicanes: Bridging the Knowledge Gap Between Tropical and Extratropical Cyclones in the Mediterranean, Bulletin of the American Meteorological Society, 106, E1955–E1971, https://doi.org/10.1175/BAMS-D-24-0289.1, 2025.
Nissen, K. M., Leckebusch, G. C., Pinto, J. G., Renggli, D., Ulbrich, S., and Ulbrich, U.: Cyclones causing wind storms in the Mediterranean: characteristics, trends and links to large-scale patterns, Nat. Hazards Earth Syst. Sci., 10, 1379–1391, https://doi.org/10.5194/nhess-10-1379-2010, 2010.
OCHA: Flash Appeal Libya, United Nations Office for the Coordination of Humanitarian Affairs (OCHA), https://www.unocha.org/publications/report/libya/libya-flood-response-flash-appeal-sept-2023-dec-2023-issued-september-2023 (last access: 2 October 2025), 2023.
Pantillon, F., Davolio, S., Avolio, E., Calvo-Sancho, C., Carrió, D. S., Dafis, S., Gentile, E. S., Gonzalez-Aleman, J. J., Gray, S., Miglietta, M. M., Patlakas, P., Pytharoulis, I., Ricard, D., Ricchi, A., Sanchez, C., and Flaounas, E.: The crucial representation of deep convection for the cyclogenesis of Medicane Ianos, Weather Clim. Dynam., 5, 1187–1205, https://doi.org/10.5194/wcd-5-1187-2024, 2024.
Pantillon, F. P., Chaboureau, J.-P., Mascart, P. J., and Lac, C.: Predictability of a Mediterranean Tropical-Like Storm Downstream of the Extratropical Transition of Hurricane Helene (2006), Mon. Weather Rev., 141, 1943–1962, https://doi.org/10.1175/MWR-D-12-00164.1, 2013.
Patlakas, P., Stathopoulos, C., Tsalis, C., and Kallos, G.: Wind and wave extremes associated with tropical-like cyclones in the Mediterranean basin, Int. J. Climatol., 41, https://doi.org/10.1002/joc.6795, 2021.
Pfahl, S., Madonna, E., Boettcher, M., Joos, H., and Wernli, H.: Warm Conveyor Belts in the ERA-Interim Dataset (1979–2010), Part II: Moisture Origin and Relevance for Precipitation, Journal of Climate, 27, 27–40, https://doi.org/10.1175/JCLI-D-13-00223.1, 2014.
Portal, A., Raveh-Rubin, S., Catto, J. L., Givon, Y., and Martius, O.: Linking compound weather extremes to Mediterranean cyclones, fronts, and airstreams, Weather Clim. Dynam., 5, 1043–1060, https://doi.org/10.5194/wcd-5-1043-2024, 2024.
Portmann, R., González-Alemán, J. J., Sprenger, M., and Wernli, H.: How an uncertain short-wave perturbation on the North Atlantic wave guide affects the forecast of an intense Mediterranean cyclone (Medicane Zorbas), Weather Clim. Dynam., 1, 597–615, https://doi.org/10.5194/wcd-1-597-2020, 2020.
Pytharoulis, I.: Analysis of a Mediterranean tropical-like cyclone and its sensitivity to the sea surface temperatures, Atmos. Res., 208, 167–179, https://doi.org/10.1016/j.atmosres.2017.08.009, 2018.
Raveh-Rubin, S. and Flaounas, E.: A dynamical link between deep Atlantic extratropical cyclones and intense Mediterranean cyclones, Atmos. Sci. Lett., 18, 215–221, https://doi.org/10.1002/asl.745, 2017.
Raveh-Rubin, S. and Wernli, H.: Large-scale wind and precipitation extremes in the Mediterranean: dynamical aspects of five selected cyclone events, Q. J. Roy. Meteor. Soc., 142, 3097–3114, https://doi.org/10.1002/qj.2891, 2016.
Reale, M., Cabos Narvaez, W. D., Cavicchia, L., Conte, D., Coppola, E., Flaounas, E., Giorgi, F., Gualdi, S., Hochman, A., Li, L., Lionello, P., Podrascanin, Z., Salon, S., Sanchez-Gomez, E., Scoccimarro, E., Sein, D. V., and Somot, S.: Future projections of Mediterranean cyclone characteristics using the Med-CORDEX ensemble of coupled regional climate system models, Clim. Dynam., 58, 2501–2524, https://doi.org/10.1007/s00382-021-06018-x, 2022.
Ricchi, A.,Miglietta, M. M., Barbariol, F., Benetazzo, A., Bergamasco, A., Bonaldo, D., Cassardo, C., Falcieri, F. M., Modugno, G., Russo, A., Sclavo, M., and Carniel, S.: Sensitivity of a Mediterranean tropical-like cyclone to different model configurations and coupling strategies, Atmosphere, 8, 1–32, https://doi.org/10.3390/atmos8050092, 2017.
Romaniello, V., Oddo, P., Tonani, M., Torrisi, L., Grandi, A., and Pinardi, N.: Impact of Sea Surface Temperature on COSMO Forecasts of a Medicane over the Western Mediterranean Sea, Journal of Earth Science and Engineering, 5, https://doi.org/10.17265/2159-581X/2015.06.002, 2015.
Romero, R. and Emanuel, K.: Climate Change and Hurricane-Like Extratropical Cyclones: Projections for North Atlantic Polar Lows and Medicanes Based on CMIP5 Models, J. Climate, 30, 279–299, https://doi.org/10.1175/JCLI-D-16-0255.1, 2017.
Rousseau-Rizzi, R., Raveh-Rubin, S., Catto, J. L., Portal, A., Givon, Y., and Martius, O.: A storm-relative climatology of compound hazards in Mediterranean cyclones, Weather Clim. Dynam., 5, 1079–1101, https://doi.org/10.5194/wcd-5-1079-2024, 2024.
Sánchez, C., Gray, S., Volonté, A., Pantillon, F., Berthou, S., and Davolio, S.: The impact of preceding convection on the development of Medicane Ianos and the sensitivity to sea surface temperature, Weather Clim. Dynam., 5, 1429–1455, https://doi.org/10.5194/wcd-5-1429-2024, 2024.
Sandler, D., Saaroni, H., Ziv, B., Hochman, A., Harnik, N., and Rostkier-Edelstein, D.: A multiscale approach to statistical downscaling of daily precipitation: Israel as a test case, Int. J. Climatol., 44, 59–71, https://doi.org/10.1002/joc.8315, 2024.
Scherrmann, A., Wernli, H., and Flaounas, E.: The upstream–downstream connection of North Atlantic and Mediterranean cyclones in semi-idealized simulations, Weather Clim. Dynam., 5, 419–438, https://doi.org/10.5194/wcd-5-419-2024, 2024.
Shirzaei, M., Vahedifard, F., Sadhasivam, N., Ohenhen, L., Dasho, O., Tiwari, A., Werth, S., Azhar, M., Zhao, Y., Nicholls, R. J., and AghaKouchak, A.: Aging dams, political instability, poor human decisions and climate change: recipe for human disaster, npj Nat. Hazards, 2, 1–8, https://doi.org/10.1038/s44304-024-00056-1, 2025.
Sioni, F., Davolio, S., Grazzini, F., and Giovannini, L.: Revisiting the atmospheric dynamics of the two century floods over north-eastern Italy, Atmos. Research, 286, 106662, https://doi.org/10.1016/j.atmosres.2023.106662, 2023.
Sodemann, H.: The Lagrangian moisture source and transport diagnostic WaterSip V3.2, EGUsphere [preprint], https://doi.org/10.5194/egusphere-2025-574, 2025a.
Sodemann, H.: Source code of the Lagrangian moisture source and transport diagnostic WaterSip V3.2.1, Zenodo [code], https://doi.org/10.5281/zenodo.16745927, 2025b.
Sodemann, H., Schwierz, C., and Wernli, H.: Interannual variability of Greenland winter precipitation sources: Lagrangian moisture diagnostic and North Atlantic Oscillation influence, J. Geophys. Res., 113, 2007JD008503, https://doi.org/10.1029/2007JD008503, 2008.
Sprenger, M. and Wernli, H.: The LAGRANTO Lagrangian analysis tool – version 2.0, Geosci. Model Dev., 8, 2569–2586, https://doi.org/10.5194/gmd-8-2569-2015, 2015.
Varlas, G., Vervatis, V., Spyrou, C., Papadopoulou, E., Papadopoulos, A., and Katsafados, P.: Investigating the impact of atmosphere–wave–ocean interactions on a Mediterranean tropical-like cyclone, Ocean Model., 153, 101675, https://doi.org/10.1016/j.ocemod.2020.101675, 2020.
Wernli, H. and Davies, H. C.: A Lagrangian-based analysis of extratropical cyclones. I: The method and some applications, Q. J. Roy. Meteor. Soc., 123, 467–489, https://doi.org/10.1002/qj.49712353811, 1997.
World Bank: Libya Storm and Flooding 2023, Rapid Damage and Needs Assessment, World Bank, Washington, DC, http://recovery.preventionweb.net/quick/82808 (last access: 22 September 2025), 2023.
World Meteorological Organisation: https://wmo.int/media/news/ libya-floods-show-need-multi-hazard-early-warnings-unified-response (last access: 10 March 2024), 2023a.
World Meteorological Organisation: https://wmo.int/media/news/ storm-daniel-leads-extreme-rain-and-floods-mediterranean-heavy-loss-of-life-libya (last access: 3 February 2025), 2023b.
- Abstract
- Introduction
- Datasets and methods
- Atmospheric processes leading to impacts
- Weather forecasting of Daniel and implications for impacts
- Daniel's impacts in a climatological context
- Summary and conclusions
- Code availability
- Data availability
- Author contributions
- Competing interests
- Disclaimer
- Acknowledgements
- Financial support
- Review statement
- References