the Creative Commons Attribution 4.0 License.
the Creative Commons Attribution 4.0 License.
 | 04 Dec 2025
The potential of GNSS radio occultation data for the analysis of the tropical width: a comparison with reanalyses
Annika Reiter
Andrea K. Steiner
The tropical width is changing, with a poleward expansion being linked to anthropogenic climate change. This in turn has great implications on the temperature and precipitation patterns in the subtropical regions. Previous studies have found varying widening trends, most of which have been derived using reanalysis and climate model data. These trend discrepancies underline the need for studies using alternative datasets. Here, we explore the potential of GNSS radio occultation (RO) data for analyzing the tropical width as an independent observational source of information with key characteristics: high accuracy, global availability, and long-term consistency. We evaluate the skill of RO temperature and newly established RO wind records to accurately capture tropical width features, using tropopause break and jet stream metrics. The results are compared to three state-of-the-art reanalysis datasets (i.e., ERA5, MERRA-2, and JRA-3Q). Zonal-mean patterns and the regional structure of tropical width features are investigated to test the utility of RO in respect to its spatial robustness. Furthermore, we provide a perspective on the necessary record length for reliable trend estimation of the tropical width. Comparisons of RO to reanalyses show overall high agreement of the zonal-mean values. As for the zonally resolved metrics, results from reanalyses and RO align well with exceptions over the northern hemisphere. While the RO record length is still a bit too short for detecting tropical width trends, the results are encouraging and confirm that RO is a valuable alternative observation-based dataset, with increasing relevance towards the future.
- Article
(6232 KB) - Full-text XML
- BibTeX
- EndNote


Commonly the tropical edge in response to climate change is investigated using climate model output (e.g., Chemke and Polvani, 2019; Waugh et al., 2018) and reanalysis records (e.g., Davis and Davis, 2018; Nguyen et al., 2018; Staten et al., 2018). Most of these studies reveal that the tropics are expanding poleward due to anthropogenic climate change (e.g., Davis and Birner, 2013; Grise et al., 2019; Hu et al., 2018; Staten et al., 2019), which has great implications on the temperature and precipitation patterns in the subtropics (Amaya et al., 2018; Feng and Fu, 2013; Sharmila and Walsh, 2018; Xian et al., 2021).
However, the reported trend results of the tropical width are not fully consistent (Staten et al., 2018) and often overlook the complex uncertainty of the underlying dataset (Baldassare et al., 2023). In the case of reanalyses, the error characteristics include the amount and source of assimilated data combined with model uncertainties, such as assigned weights or set parameters (Hoffman et al., 2017; Long et al., 2017; Parker, 2016). This in turn, can lead to biases in the trend estimation and thus merits comparison and validation with observations.
Global navigation satellite system (GNSS) radio occultation (RO) provides atmospheric information, with clearly quantified error characteristics, including the sampling error and structural uncertainty (Scherllin-Pirscher et al., 2011; Steiner et al., 2013) – posing an alternative, observation-based dataset for studying tropical width metrics. The GNSS RO technique has the decisive advantage of long-term stability with no need for inter-calibration between satellite missions because it is based on precise time measurements. Data are provided with global coverage, near-all weather capability, and a specifically high-vertical resolution in the upper troposphere and lower stratosphere (UTLS) (e.g., Angerer et al., 2017; Foelsche et al., 2011; Scherllin-Pirscher et al., 2021; Steiner et al., 2020a). In the low- to mid-latitudes of the upper troposphere a resolution of about 100 to 200 m, and about 500 m in the lower stratosphere can be attained (Zeng et al., 2019). This is particularly interesting for the investigation of features in the troposphere and the tropopause region, such as variability and changes of the tropical width. Furthermore, the location of the measured air parcel can be precisely positioned, which enables independent information on altitude and pressure (Scherllin-Pirscher et al., 2017). Consequently, the RO method offers benchmark-quality temperature data and high-quality information on geopotential height fields (Steiner et al., 2013).
To investigate the width of the tropics, a variety of different methods were developed and tested, commonly referred to as tropical width metrics (Adam et al., 2018; Davis and Birner, 2017). The primary purpose of these metrics is to determine the poleward edges of the Hadley cell and their changes in response to climate change. Many metrics exist, which can be more generally divided into direct and indirect measures of the circulation edges. The most common cell edge metric is the meridional mass stream function (PSI), which is directly connected to the Hadley cell (e.g., Grise and Davis, 2020; Staten et al., 2018). Other metrics focus more on tropical tropospheric features, which are connected with the Hadley circulation and hence represent more indirect measures (Waugh et al., 2018). These include the subtropical jet (STJ), tropopause break (TPB) and eddy driven jet (EDJ). The correlations and interconnections between individual metrics have been of interest (Davis and Birner, 2017; Davis and Rosenlof, 2012), with a recent focus on their specific association with the Hadley cell. For instance, Menzel et al. (2019, 2024) found a disconnect between the PSI and the STJ and thus argue that the STJ should not be used as a Hadley cell metric. Furthermore, the TPB correlates with the STJ (Davis and Birner, 2017; Waugh et al., 2018), which additionally questions the applicability of TPB associated metrics to determine the Hadley cell edges. As a counter example, although the EDJ lies outside the Hadley circulation and the tropical belt, changes of the EDJ metric correlate well with the ones from the Hadley cell edges (Menzel et al., 2023; Waugh et al., 2018). In accordance, the metric selection must be considered carefully in respect to the research question. All metrics represent important features of the tropical atmosphere, with individual influences on regional weather and climate patterns. Under climate change, shifts in these tropical width features can therefor lead to different changes in these subtropical patterns.
Initial studies exist analysing the tropical width using RO data (Ao and Hajj, 2013; Davis and Birner, 2013). Subsequent research has shown that the high-quality temperature record from RO can be used to investigate zonally averaged as well as regional structures (Anjana et al., 2023; Luan et al., 2020; Mathew and Kumar, 2018). A main focus hereby has been on temperature-based metrics such as the TPB. Other variables and metrics from RO are still relatively unexplored. Most recently, there has been progress in deriving wind fields from RO geopotential height data (Danzer et al., 2024; Nimac et al., 2025) and further beyond the fundamental geostrophic and gradient wind. These new higher-order wind estimates open the possibility to investigate wind-based metrics, such as the STJ, EDJ and possibly the PSI metric.
In this study, we test the potential of RO temperature and wind data to investigate the tropical width and its changes based on selected common tropical width metrics, including TPB, EDJ, STJ, and PSI. We validate RO in respect to most recent reanalysis datasets, inspecting the spatial and temporal consistency of a monthly timeseries. We separately test zonal-mean tropical width metrics and zonally resolved tropical width metrics, using high-quality temperature data and new higher-order climatic wind fields, while also comparing different modern reanalyses in the process.
This paper is structured as follows. The datasets and methodology are detailed in Sect. 2, while Sect. 3 presents the results for the selected metrics based on RO and reanalysis data. Finally, discussions and conclusions are addressed in Sect. 4.
2.1 GNSS RO data
In this study, monthly-mean RO multi-satellite temperature and wind climatology data is analysed. These are computed from RO phase data at UCAR/CDAAC (University Corporation for Atmospheric Research/COSMIC Data Analysis and Archive Center), which provides data from six satellite missions: CHAMP (Wickert et al., 2001), GRACE (Beyerle et al., 2005), FORMOSAT-3/COSMIC (Anthes et al., 2008), C/NOFS (de La Beaujardière, 2004), SAC-C (Hajj et al., 2004), MetOp (Luntama et al., 2008). These satellites produce an average of 60 000 profiles per month (Angerer et al., 2017). The phase data is processed with the Wegener Center (WEGC) Occultation Processing System OPSv5.6, providing high-quality temperature and geopotential height data on altitude levels (Angerer et al., 2017; Steiner et al., 2020a), which are mapped to pressure levels.
The RO data used in this study are derived with a moist air retrieval, combining ECMWF short-range forecast data with RO observations in the lower to mid troposphere (see Steiner et al., 2020a, Table 1). The monthly-mean data are computed on a 2.5° × 2.5° latitude × longitude grid on 137 pressure levels, from 1000 to 10 hPa. The horizontal grid is established using spatial and temporal weighting of the RO profiles. Hereby, the spatial weighting uses an area of influences which corresponds to a constant 600 km radius, where the profiles are weighted according to their distance to the center location applying a bivariate (latitude–longitude) Gaussian function. The function has a peak at the center and a respective standard deviation of 150 km (300 km) in the latitudinal (longitudinal) direction. The temporal weighting uses Gaussian-time weighting within ±2 d. Temporal and spatial weighting ensures that the observed information is fully utilized, while keeping the number of empty grid points low, with remaining gaps filled using bilinear interpolation (see further details in Ladstädter et al., 2022; Yessimbet et al., 2024). RO data have their highest precision and accuracy in the upper troposphere-lower stratosphere region, with uncertainty estimates of less than 0.7 K for individual temperature profiles from 8 to 30 km and an accuracy of about 0.1 K (Scherllin-Pirscher et al., 2021). RO climate data records are therefore well suited for reliable trend analyses including benchmark quality temperature and geopotential height fields with a structural uncertainty of temperature trends of less than 0.05 to 0.1 K per decade for global to latitudinal means and a structural uncertainty of geopotential height trends of less than 4 m per decade within the RO core region (Steiner et al., 2013, 2020a). Climatological wind is derived from geopotential fields on pressure levels. As a novelty the winds are computed using a best-estimate algorithm which dynamically applies the most suitable wind retrieval method dependent on latitude and altitude. Thereby, the method uses the initial corresponding balanced wind estimates (i.e., the geostrophic equation in the troposphere and the gradient wind in the stratosphere) and adds advective contributions on top of these initial wind estimates. Furthermore, in the equatorial region curvature terms are included to the equatorial balanced winds. As to the quality of the wind fields, values are within ±2 m s−1 (Danzer et al., 2024; Nimac et al., 2025) and thus fulfil the WMO-OSCAR standard for horizontal wind information (see WMO-OSCAR, 2025).
Table 1List of datasets and their associated information used in this study.
The respective multi-satellite record spans from 2001 to 2020. However, we chose to only study the period September 2006 to December 2020, due to fewer satellite missions in the early stages and hence a lower number of occultation events, increasing sampling and statistical errors (Angerer et al., 2017; Scherllin-Pirscher et al., 2017; Steiner et al., 2020a). Compared to initial RO studies of the tropical width (e.g., Ao and Hajj, 2013; Luan et al., 2020), we use a finer horizontal grid, which is possible due to the high number of RO profiles since 2006. This allows for a more detailed spatial investigation.
2.2 Reanalysis data
Three state-of-the-art reanalyses are selected, those are: ERA5 (Hersbach et al., 2020) by the European Center for Medium-Range Weather Forecasts (ECMWF), MERRA-2 Analysis (Gelaro et al., 2017) by the National Aeronautics and Space Administration (NASA) and JRA-3Q (Kosaka et al., 2024) by the Japanese Meteorological Agency (JMA). Just like with the RO dataset, we use temperature and zonal wind reanalysis data on isobaric levels to calculate various tropical width metrics, as well as the meridional wind to analyse the atmospheric mass stream function. The horizontal resolution, vertical range, number of pressure levels and the time period studied for each dataset are listed in Table 1. For comparison with the RO record, the monthly reanalysis data are downloaded on their native grid and then regridded using Climate data operators (CDO) bilinear interpolation function “remapbil” (Schulzweida, 2023) to match the 2.5° × 2.5° latitude × longitude grid of the RO data. We note that the individual reanalyses refer to the interpolated version, unless stated otherwise.
2.3 Tropical edge metrics
To quantify the tropical width, we analyzed five different metrics using zonal-mean and zonally resolved tropical width metrics. These metrics describe different features of the atmosphere at the tropical edge, a detailed description is given below:
- 1.
TPB is the latitude where the meridional tropopause height gradient has its maximum between 0 and 60° latitude. The tropopause height is defined according to the World Meteorological Organization (WMO, 1957) as “the lowest level at which the lapse-rate decreases to 2 °C km−1 or less, provided that the average lapse-rate between this level and all higher levels within 2 km does not exceed 2 °C km−1”. The tropopause features a height drop between the tropics and extra-tropics, which has previously been applied to define the tropical edge (e.g., Davis and Rosenlof, 2012).
- 2.
TPB (max Δθ), also known as the maximum dry bulk static stability, estimates the latitude of the maximum potential temperature difference at the tropopause and the minimum value of the air column (Davis and Birner, 2013, 2017). Again, this metric is defined between the equatorial boundary 10° and polar boundary 60°. Although the RO dataset based on moist-air retrieval is available from 1000 hPa upward, the data is only observation-dominated at higher levels, while information from ECMWF forecasts comes in at lower levels (Steiner et al., 2020a). Therefore, we specifically select the minimum value for RO at the 400 hPa level following Luan et al. (2020). For reanalysis the minimum value is located near the surface. Previous comparisons have shown good agreement with some seasonal exceptions (Luan et al., 2020).
- 3.
EDJ is located at the latitude of the zonal wind maximum closest to the 850 hPa level poleward 15° and equatorward 70° (Adam et al., 2018). For RO data, the metric is adapted to select the maximum at the 700 hPa level. As described for TPB (maxΔθ) metric above, RO provides independent high-quality information at higher levels of the troposphere, where the data is purely observation-based and not combined with ECMWF forecasts. This specific level is at the upper range previously used to study the EDJ (Keel et al., 2024; Woollings et al., 2010), hence additional tests are provided. Figure 1 shows generally good agreement for the tested levels for zonal-mean and zonally resolved results, and thus supports the decision to use the 700 hPa level for RO. Over Europe and Eastern Asia, the metric deviates for the individual levels and hence should be interpreted with care.
- 4.
STJ describes the latitude of the subtropical jet core, which is identified at the zonal wind maximum between 100 and 400 hPa after subtracting the zonal wind of the EDJ. The STJ is defined in the latitude range from 10 to 60°.
- 5.
PSI is defined as the zero crossing of the meridional mass stream function at 500 hPa between 30 and 60° latitude. The zonal-mean PSI metric is calculated according Eq. (1):
where a is Earth's radius, φ is the latitude, g is the gravitational acceleration, p is the pressure and denotes the zonal-mean meridional wind. For the longitudinally dependent metric, first the meridional component of the divergent wind vdiv is calculated using the windspharm software package (Dawson, 2016), then the longitudinally dependent stream function ψ (Galanti et al., 2022) is calculated using to Eq. (2):
The Tropical-Width Diagnostic software package for Python (PyTropD) builds the foundation for this metric calculations (Adam et al., 2018). Although this package was originally developed for computing zonal-mean metrics, by now it has also been tested for zonally resolved results. Luan et al. (2020) investigated the regional tropopause, whereas Liu et al. (2021) analysed the jet streams at individual longitudes. As described above, the computation of the zonal-mean mass stream function and the zonally resolved mass streamfunction is not identical. For the regional streamfunction, we build on initial work of Schwendike et al. (2014) and later studies by e.g., Galanti et al. (2022).
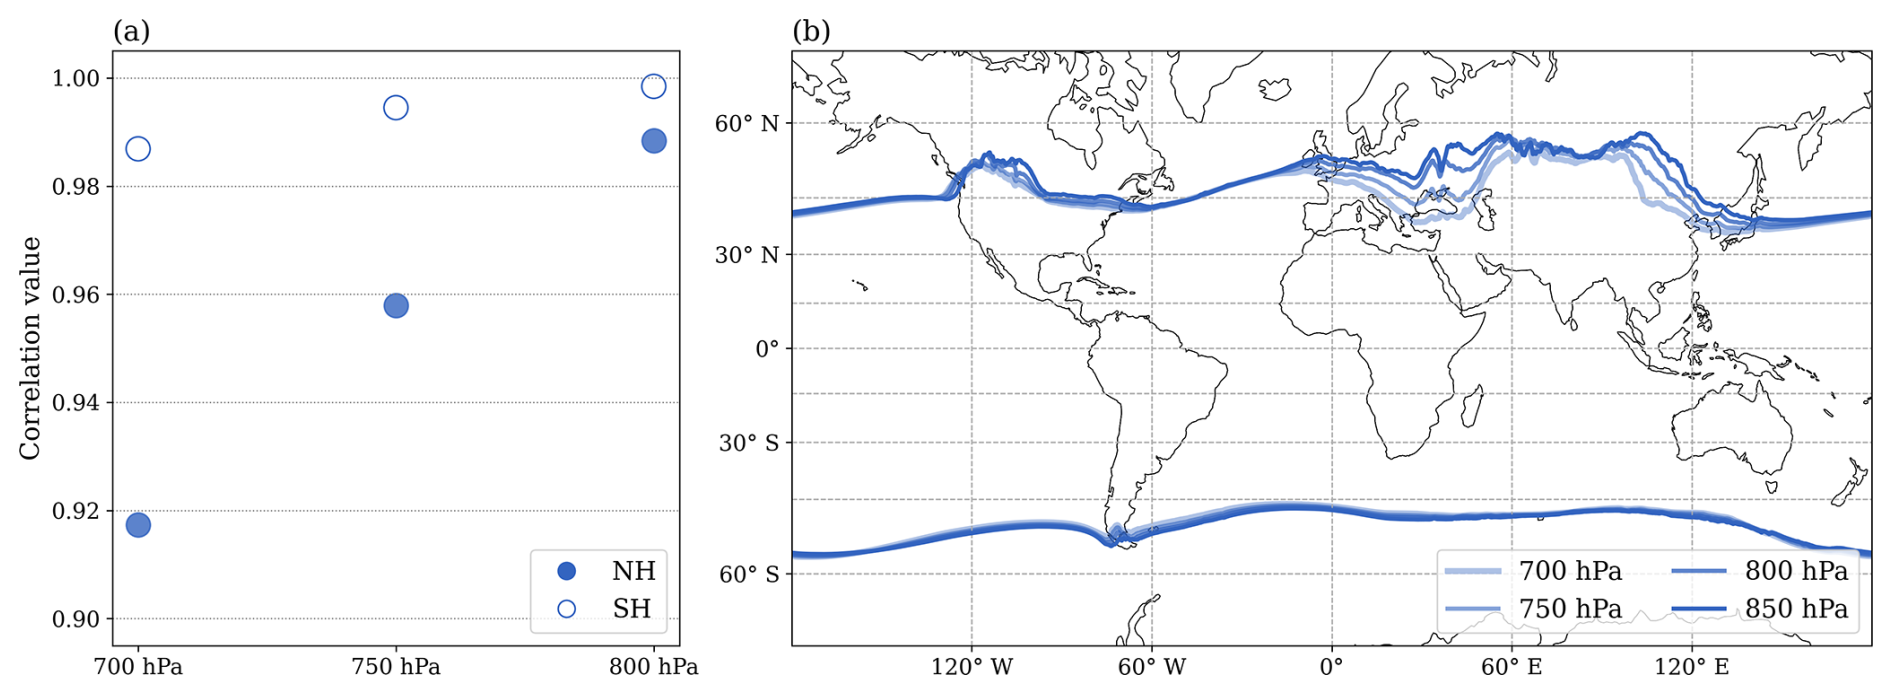
Figure 1Results of the EDJ metric at different pressure levels for monthly ERA5 values averaged over the period 1980 to 2024 on its native grid, (a) shows correlation values for 700, 750, and 800 hPa with the commonly used 850 hPa level, (b) depicts the zonally resolved metric.
2.4 Additional methods
To compare the metric results from RO and reanalyses, statistical methods are applied. A correlation is performed on monthly-mean anomaly values. The metric results over time are linearly interpolated to fill missing values, this is e.g., the case for the PSI metric over the summer months when the Hadley cell is highly asymmetric. Statistical significance of a correlation is assumed for p value < 0.001 (i.e., 99.9 % confidence interval).
In this section, we test the suitability of RO data to (i) calculate zonal-mean tropical width metrics and (ii) investigate the regional structure of the selected metrics. Hereby, RO will be validated using reanalyses. Finally, we (iii) provide a perspective on the necessary record length for trend studies using these metrics, to emphasize the future value of the long-term consistent RO record.
3.1 Zonal-mean metrics
In an initial analysis we study the monthly time series of the selected zonal-mean temperature and wind metrics over the RO record period September 2006 to December 2020 (Fig. 2). The time series compares RO data and multiple reanalysis, providing a first insight for the northern and southern hemisphere, hereafter NH and SH, respectively. The values from RO show good agreement with values from reanalyses for the TPB metrics and STJ metric, following the same patterns over time. Contrarily, while the EDJ appears to follow a similar seasonal cycle for all datasets, the absolute position of this metric differs for RO. The results of the EDJ from RO, in comparison to the reanalysis datasets, are shifted towards the equator particularly in the NH. This could be a result of the chosen method, as explained in Sect. 2.3, the EDJ for RO is calculated at 700 hPa, in contrast to the reanalyses where this metric is calculated at 850 hPa. An extended discussion on the time series analysis of these metrics using RO data is done in Davis and Birner (2013). They investigated the seasonal cycle and interannual variability of the Hadley cell. However, their study is based on a rather short RO record from 2007 to 2011 using data from the COSMIC mission.
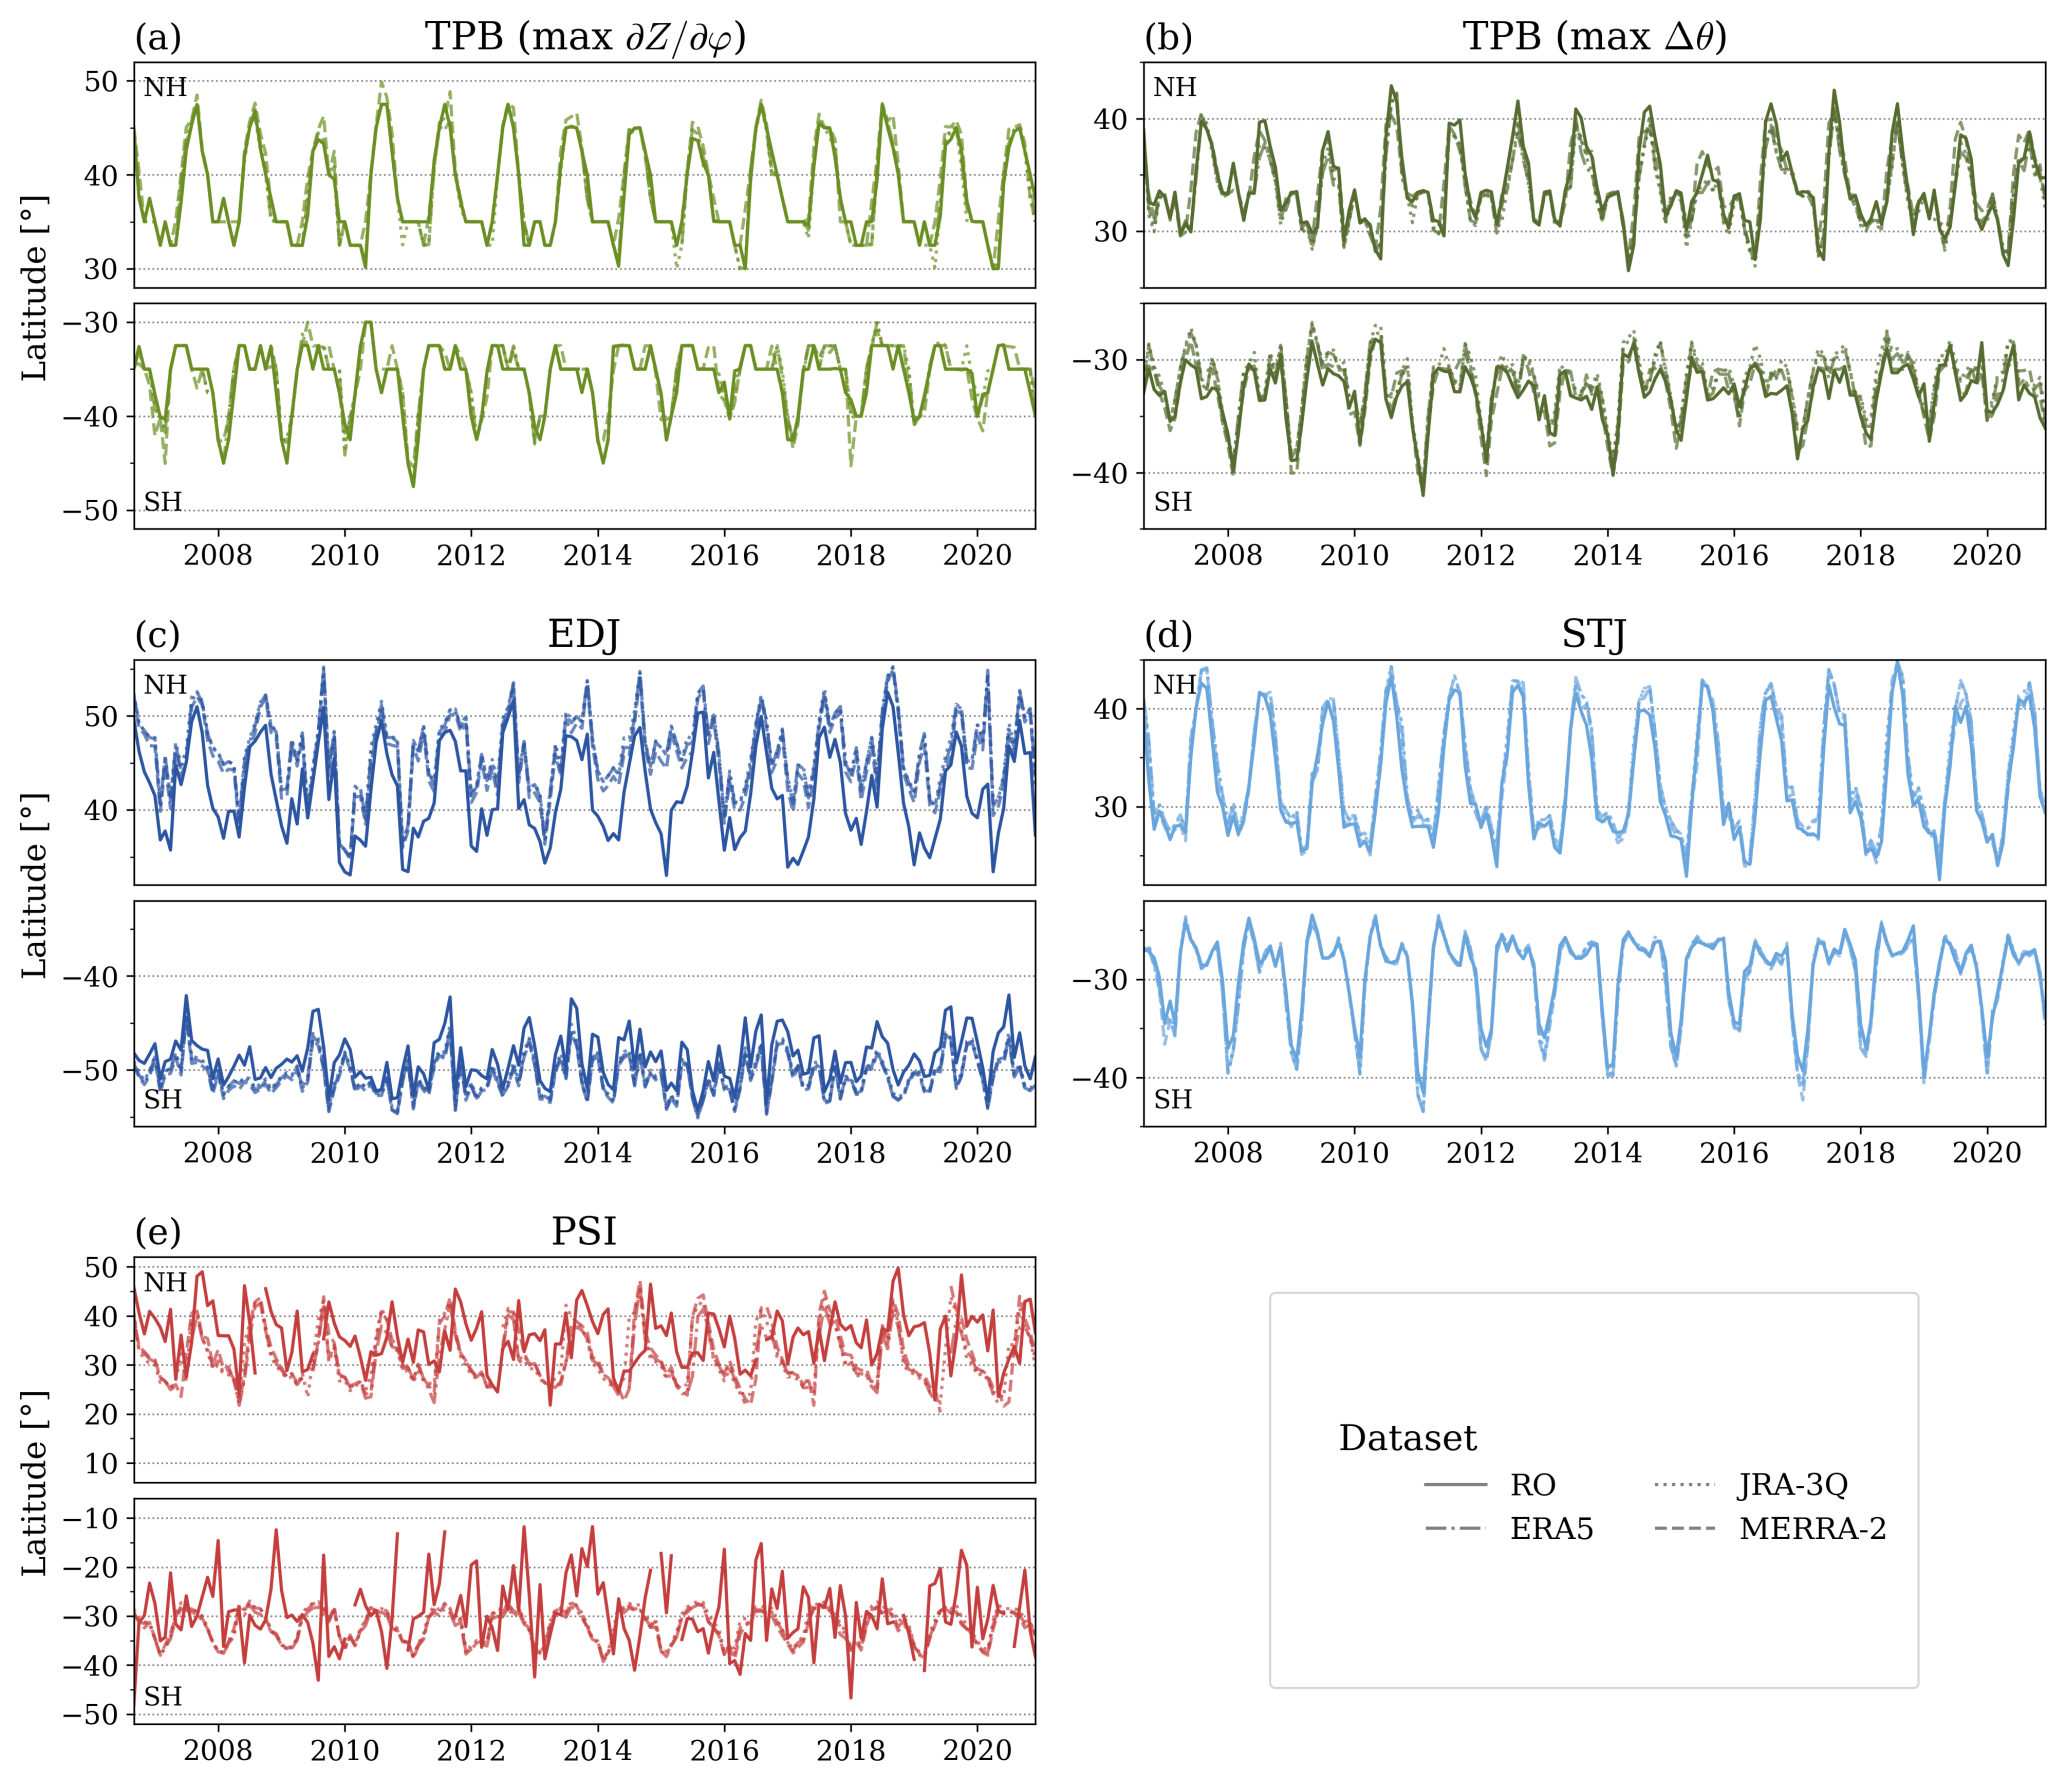
Figure 2Time series of five different metrics (a–e) describing the monthly latitudinal edges of the tropical width (TPB, STJ) and Hadley cell (PSI), as well as the location of the eddy driven jet (EDJ) from September 2006 to December 2020. The NH and SH edge is shown for the RO and reanalysis datasets. The range of the vertical axis is chosen for the respective results.
To better quantify the validity of the RO dataset, correlations between RO and reanalyses, between different reanalyses, and between reanalyses on different grid spacings are presented in Fig. 3. Figure 3a shows the correlation results between RO and the three state-of-the-art reanalyses. Hereby, the TPB metrics, STJ metric and EDJ metric have strong correlations. Especially the jet metrics in the SH are in very good agreement between the datasets, which indicates the high quality of the derived zonal wind component from RO. The correlations with reanalyses are clustered very close together for the individual metrics and hemispheres, with the exception of TPB . For this metric, the correlation values between RO and MERRA-2 are noticeably lower which differs from the results of the other reanalyses. Overall, the high correlation values provide a first impression that RO is suitable for determining these zonal-mean tropical width metrics.
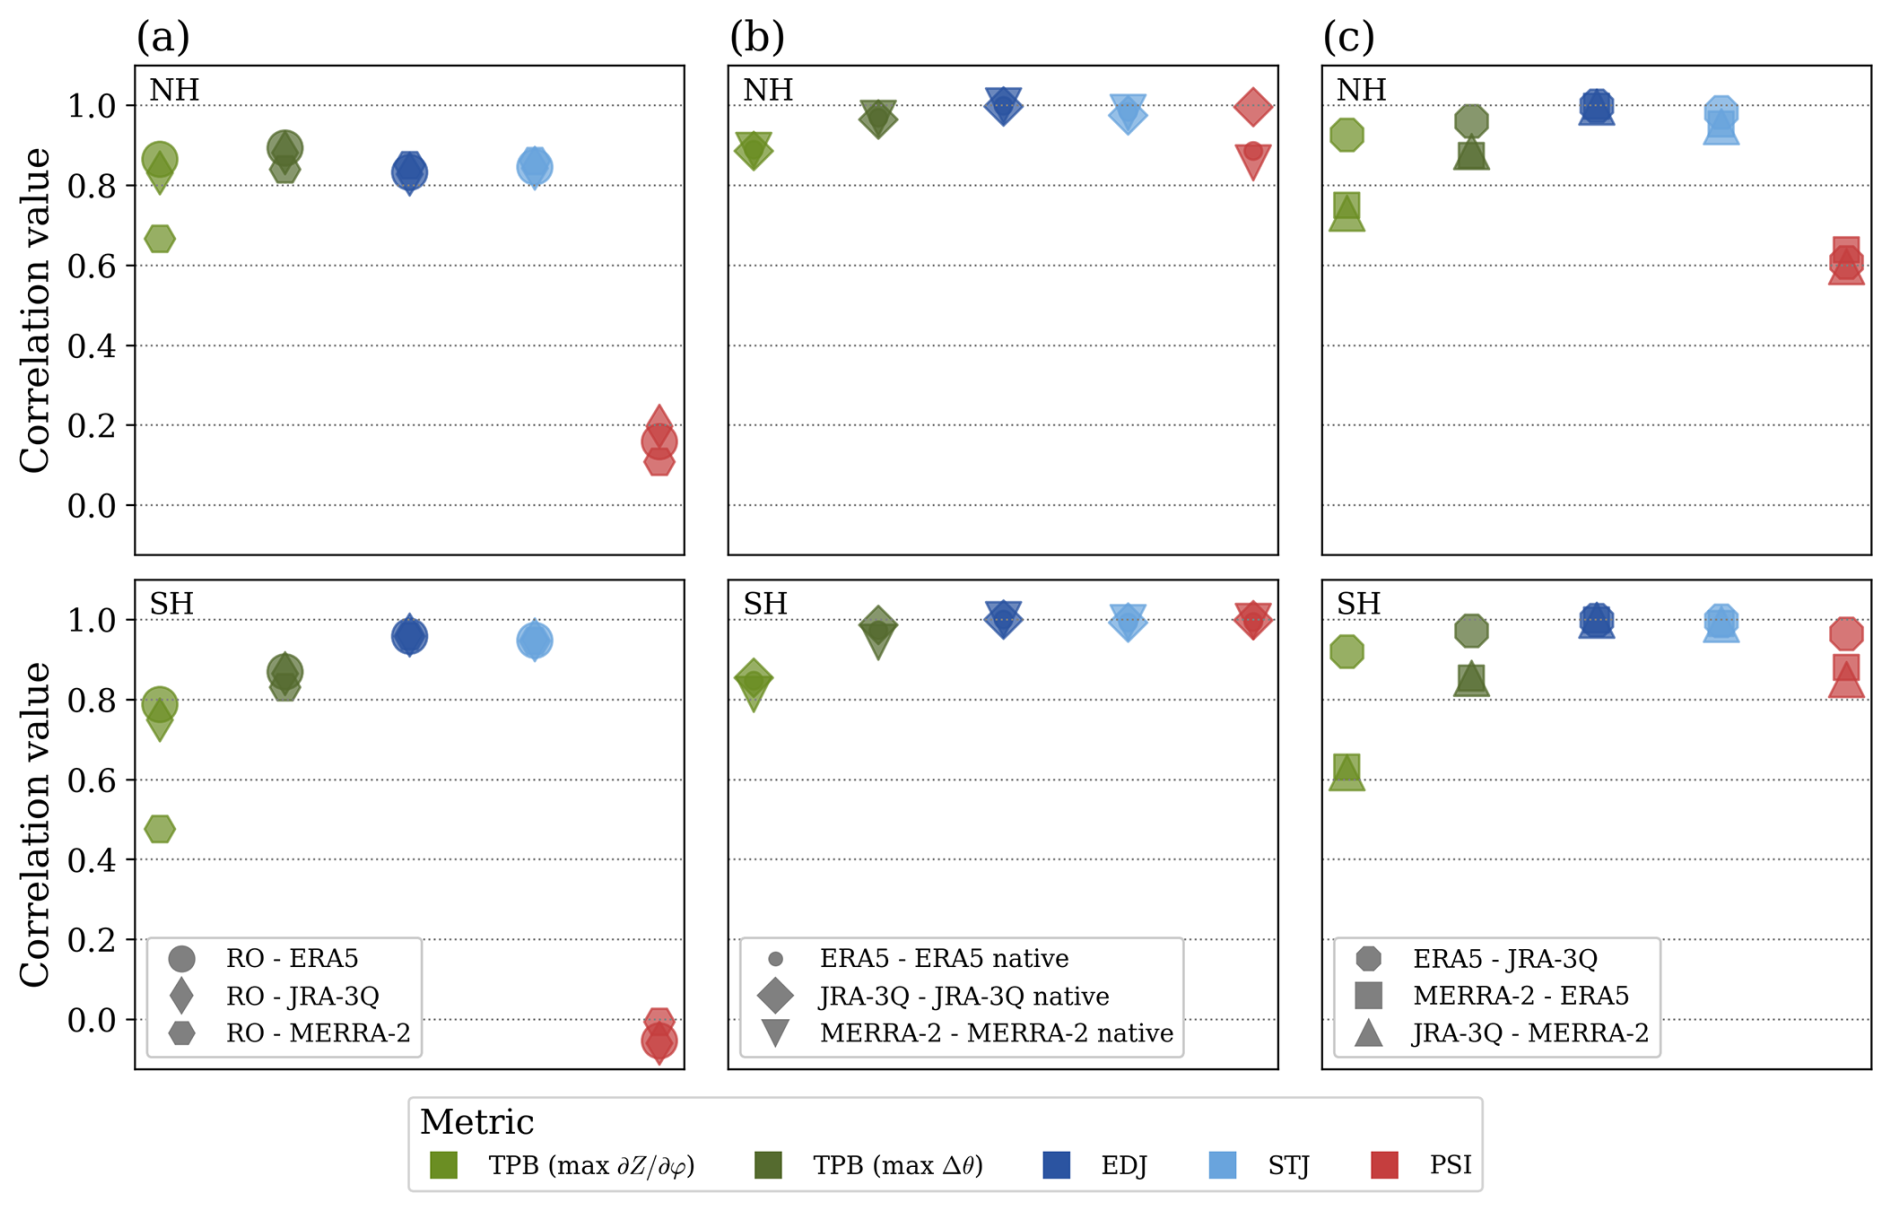
Figure 3Correlation of monthly anomalies of tropical edge values between the different datasets for five different metrics over the time period September 2006 to December 2020. The correlation of RO and different reanalyses as shown in (a), (b) reveals the correlation of the reanalyses interpolated to the RO grid and on their native grid, and (c) depicts the correlation among the different reanalysis datasets. All correlations are statistically significant (p value < 0.001), apart from the PSI metric in (a).
A first attempt to calculate the mass stream function using RO winds accounting for advection terms was performed. However, the results show that the underlying wind field estimates from RO geopotential height are at this point not qualified to determine the Hadley cell edge using the PSI metric. In the NH (in Fig. 2e), the calculated results appear to be in range of the Hadley cell edge as determined by reanalyses, while in the SH, the wind estimates of the meridional wind component seem to lack the necessary detail to calculate the PSI metric. Figure 3a supports these findings, as no correlation can be found between RO and reanalyses in the SH. In the NH, the correlation is very weak. However, we note that this does not speak against the overall quality of the higher order winds, rather the zonal-mean meridional wind is a small term, which can so far not be captured accurately with the applied wind equations. For further details on the underlying wind data see Nimac et al. (2025). Overall, our results demonstrate a great improvement of the initial winds calculated from RO data (Scherllin-Pirscher et al., 2014), as the zonal average of previous wind estimates, such as geostrophic and gradient wind, was by default zero and thus the zonal-mean stream function could not be calculated at all. In this regard, we highlight the importance of advancements in the development of global, observational winds to validate reanalysis and climate model data, which has also previously been emphasized by others (Pikovnik and Zaplotnik, 2025). As a conclusion from the analysis in Fig. 2, the PSI metric calculated from RO winds will not be further investigated in this study. Results from reanalysis data are still included in our investigation, as the Hadley cell edge represents a very important feature of the tropical atmosphere, and the PSI is one of its most common metrics.
A critical factor that must be taken into account is the role of grid dependence. The correlation presented in Fig. 3a is performed for RO and reanalyses interpolated on the same grid (i.e., 2.5° × 2.5°), which is rather coarse compared to the native grid of the reanalysis fields. As a result, it could be argued that there is a loss of information. The grid dependence of the specific metrics and in respect to the studied dataset has been previously discussed. Davis and Birner (2016) showed that the horizontal resolution is of relevance in trend studies of the tropical width, as a finer grid can result in a narrower tropical belt. Furthermore, the spread in trend results from various climate models can be attributed to their different grid sizes. Another study by Luan et al. (2020) based on reanalysis, showed that for various TPB metrics on a regional perspective, the structure of the tropopause remained the same for multiple tested grids. This information will be further important in Sect. 3.2.
Here we provide further information on the relevance of the grid spacing of the underlying dataset for these specific metrics. Overall, the methods applied in this study use either linear interpolation between two data points or a function to determine the weighted center, to reduce the grid dependence of the metrics (Adam et al., 2018). Figure 3b illustrates the grid dependence of each metric for reanalyses. Generally, the correlation between the native grid and interpolated grid for all reanalyses show good agreement, which indicates that the results from the datasets on their native grid and lower resolution grid are nearly identical. This strengthens the confidence in the RO datasets and underlines that the results provided can be highly relevant despite the lower grid resolution. Nevertheless, two things stand out from this plot. One aspect is, TPB on both hemispheres has lower correlation values than the other metrics, seen for all datasets. Another aspect regards the PSI metric in the NH. For this metric, the correlation is smaller for ERA5 and MERRA-2, whereas the correlation values stay high for JRA-3Q. This is the only instances where we see a difference between the individual datasets. In any way, the results from both TPB and PSI in the NH depict a strong correlation, although these metrics appear to be more sensitive to the underlying resolution of the dataset.
Figure 3c visualizes the correlation values of the five metrics between the different reanalysis datasets. The results show overall strong correlations with no specific differences between the hemispheres for the TPB and jet metrics. Contrary, the PSI metric displays a greater correlation in the SH in comparison to the NH. Consistent with the correlations between RO and reanalyses (i.e., Fig. 3a), for TPB the correlations among the individual reanalyses are slightly lower than for the other metrics. The correlation for this metric improves for the reanalyses on their native grid (Fig. A1). Generally, for both TPB metrics, ERA5 and JRA-3Q, which are newer datasets, are considerably stronger correlated among each other than towards MERRA-2. It is also noteworthy that the correlation results of the jet metrics are approximately equal to one, which suggests that the individual reanalysis are very similar.
3.2 Regional structure of the metrics
Next, we evaluate the utility of RO data to examine the regional structure of the TPB and jet metrics. Figure 4 presents the results of the longitudinally resolved metrics for the NH and SH averaged over the inspected period, September 2006 to December 2020, for RO and reanalyses. The plot shows differences in the regional structures and the location of these metrics. An additional plot (Fig. A2) provides information for reanalyses on their native grid, showing that the overall structure of the metrics remains.
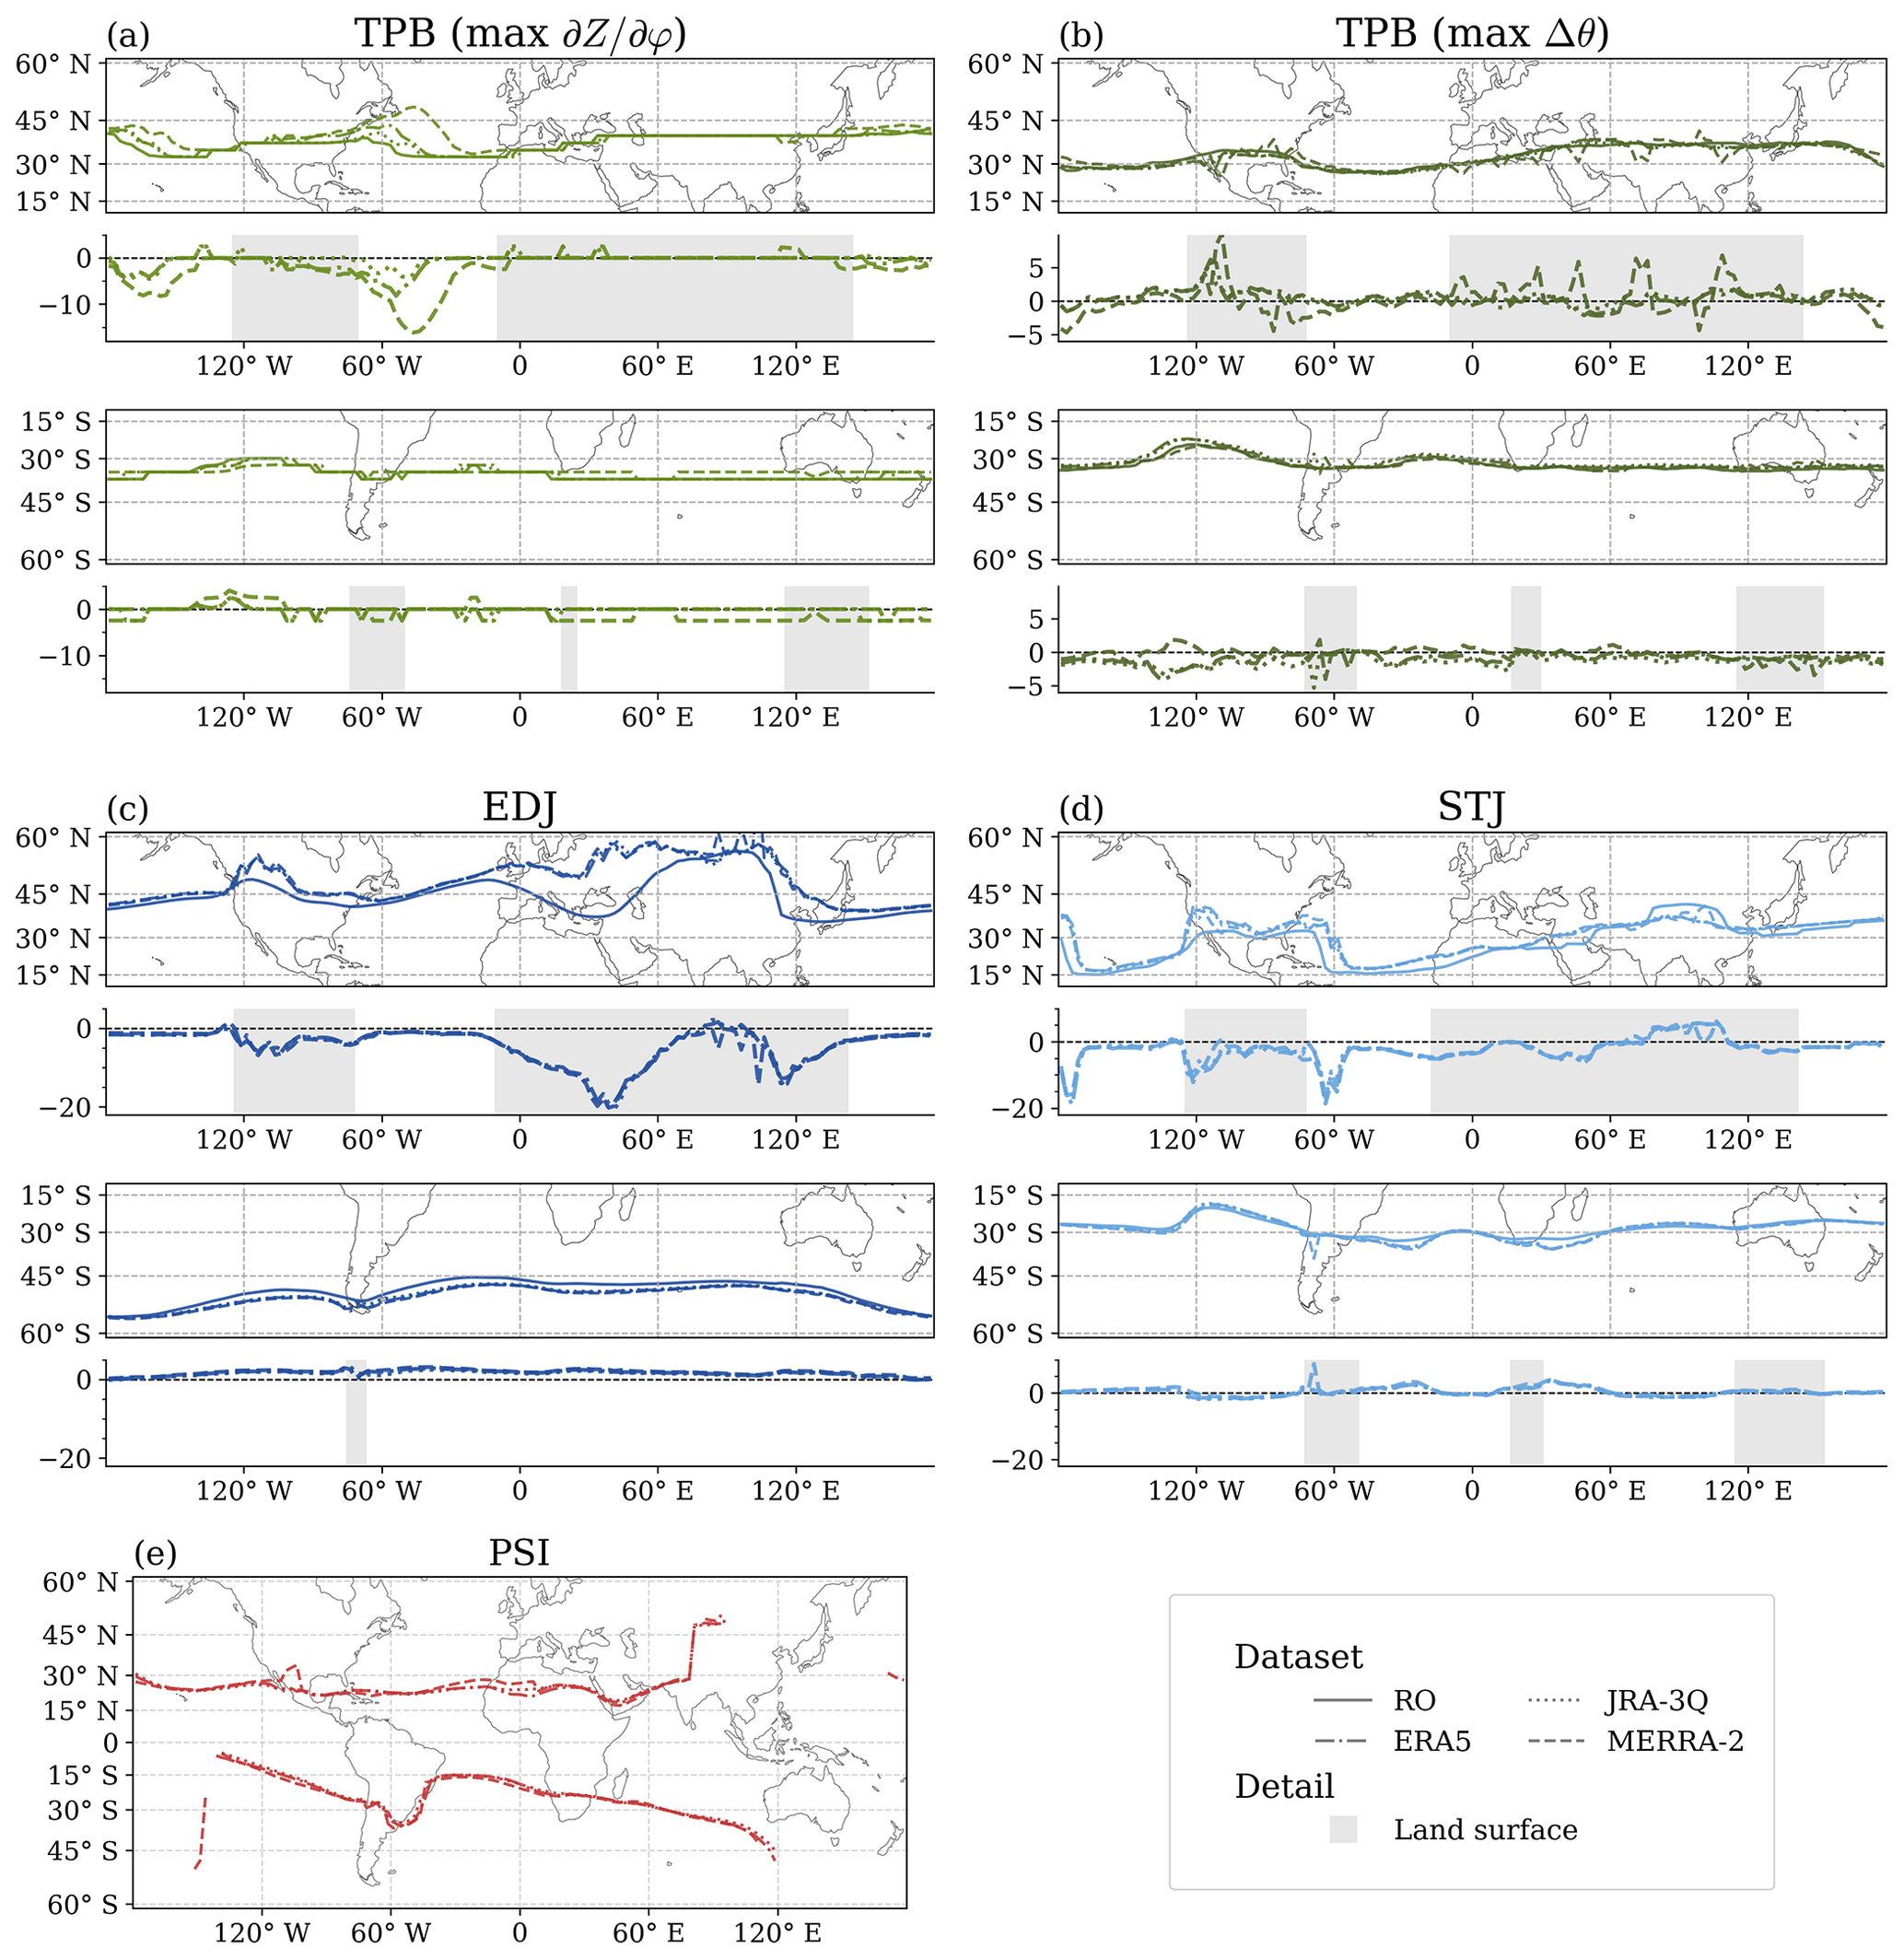
Figure 4Mean longitudinally varying tropical edge of the NH and SH for RO and reanalyses for five cell edge metrics (a–e) over the RO period. Additionally, the difference between RO and reanalyses is shown for each edge, with the land surface indicated in grey shading. The PSI-metric (e) is only shown for reanalyses.
The TPB metrics (Fig. 4a–b) display a mostly uniform structure around the globe, where TPB is located slightly more poleward than TPB (maxΔθ), which position varies around 30° on each hemisphere. In contrast, the jet stream metrics reveal a stronger regional variance. Figure 4c and d show two distinct jets over all longitudes, although we note that for shorter time steps the jets can merge into one at particular longitudes and for some seasons (Lee and Kim, 2003). The STJ (Fig. 4d) in the NH is located around 15° N in the eastern Pacific and over the Atlantic, and at about 30° N over America, Asia and the western Pacific. In the SH the STJ is rather uniform at 30° S, with an exception over the eastern Atlantic. The EDJ (Fig. 4c) is found more poleward compared to the STJ. In the NH the EDJ varies around 45° N and in the SH it is located even further towards the pole at about 50° S. The structure of the EDJ seems to be influenced by the topography, explicitly in the NH. Finally, Fig. 4e, shows the PSI metric for reanalyses. The mass stream function forms sub cell structures, which can vary in their extent and strength and show a clear seasonality (Li et al., 2022). As a result, this metric is not always globally available. The PSI metric displays a relatively uniform edge in the NH, which stretches from the mid Pacific to the Tibetan Plateau. In the SH, there is more variation. In general, we note that our analysis focuses on monthly values averaged over a longer time period. Thus, we are not explicitly regarding the seasonal cycle of the metrics, although the location and structure of the seasonal metrics can differ (see e.g., Li et al., 2022; Luan et al., 2020).
Below each map showing the regional structure of each metric, a difference plot more clearly visualizes the specific difference between RO and the reanalyses datasets. Overall, the metric results from different datasets align well. Some exceptions occur over the NH, specifically for the EDJ metric there are some notable systematic differences over certain regions, which result most likely from the level selection of 850 hPa for reanalyses and 700 hPa for RO data (see also initial validation in Fig. 1). Also, for the STJ in the NH, differences between the RO dataset and reanalyses occur at some longitudes near 175, 120 and 60° W. In general, the temperature-based metrics show closer agreement than the wind-based jet metrics and the differences for all metrics are smaller over the SH than in the NH. The hemispheric differences could be a result of the underlying topography, as in the SH, there is generally less land surface and mountain ranges which can influence the position of the specific tropospheric features.
Furthermore, it is hypothesised that the differences might be smaller over the oceans compared to over land surfaces, due to the available number of observations assimilated in reanalyses. More precisely, reanalyses assimilate observational data from various sources. However, in assimilating many observational data sources, reanalyses introduce spatial and temporal inhomogeneities. One important observational data source for reanalyses are radiosondes, which are mostly available over the land surface (Fujiwara et al., 2017). This can lead to these theorized differences and could also contribute to possible land-sea contrasts. The hypothesis cannot be uniformly confirmed among the different metrics. While TPB (maxΔθ) indeed shows larger differences among RO and reanalysis over land, TPB has the greatest deviations above the ocean. As for the jets, the deviations between RO and reanalyses appear to be connected to the topography. In regions with high mountain ranges, such as the Rocky Mountains and Tibetan plateau, it is difficult to determine these metrics.
Trend perspectives
Finally, we provide a perspective on the needed time length to calculate trends, in order to emphasize the possible future value of the long-term consistent RO record for trend studies. In this regard, we investigate the three reanalysis datasets over their longer record (i.e., 1980 to 2024). Figure 5 shows all possible trend values for a given time window length (i.e., 15, 25, 35 years) over the reanalysis record period for the respective datasets, metrics and hemispheres. Additionally, the median of all calculated trends for a specific time window and dataset is marked, to indicate the overall trend of the metric.
Figure 5 demonstrates the importance of a sufficient record length for trend analysis of tropical widening. Previously, also shorter data records, such as the RO record, have been used in trend studies of the tropical width, providing varying results (Ao and Hajj, 2013; Darrag et al., 2022). Figure 5 clearly visualizes the wide spread of trend for these shorter records. For instance, 15-year trends over the 1980 to 2024 time period range from poleward to equatorward shifts for the metrics on both hemispheres. Particularly, TPB (maxΔθ) and EDJ show a larger spread of the calculated trend signals. The inconclusive trend results continue also for the 25-year periods, with the exception of TPB (maxΔθ) and PSI in the SH. Besides these, the trend value distribution only starts to support the general understanding of tropical widening, for the longest time window length in this study, i.e., 35 years. Here, the trends for most datasets and metrics are unilaterally placed relative to zero, indicating a significant poleward shift of the metric. This is denoted by positive trend values in the NH and negative trend values in the SH.
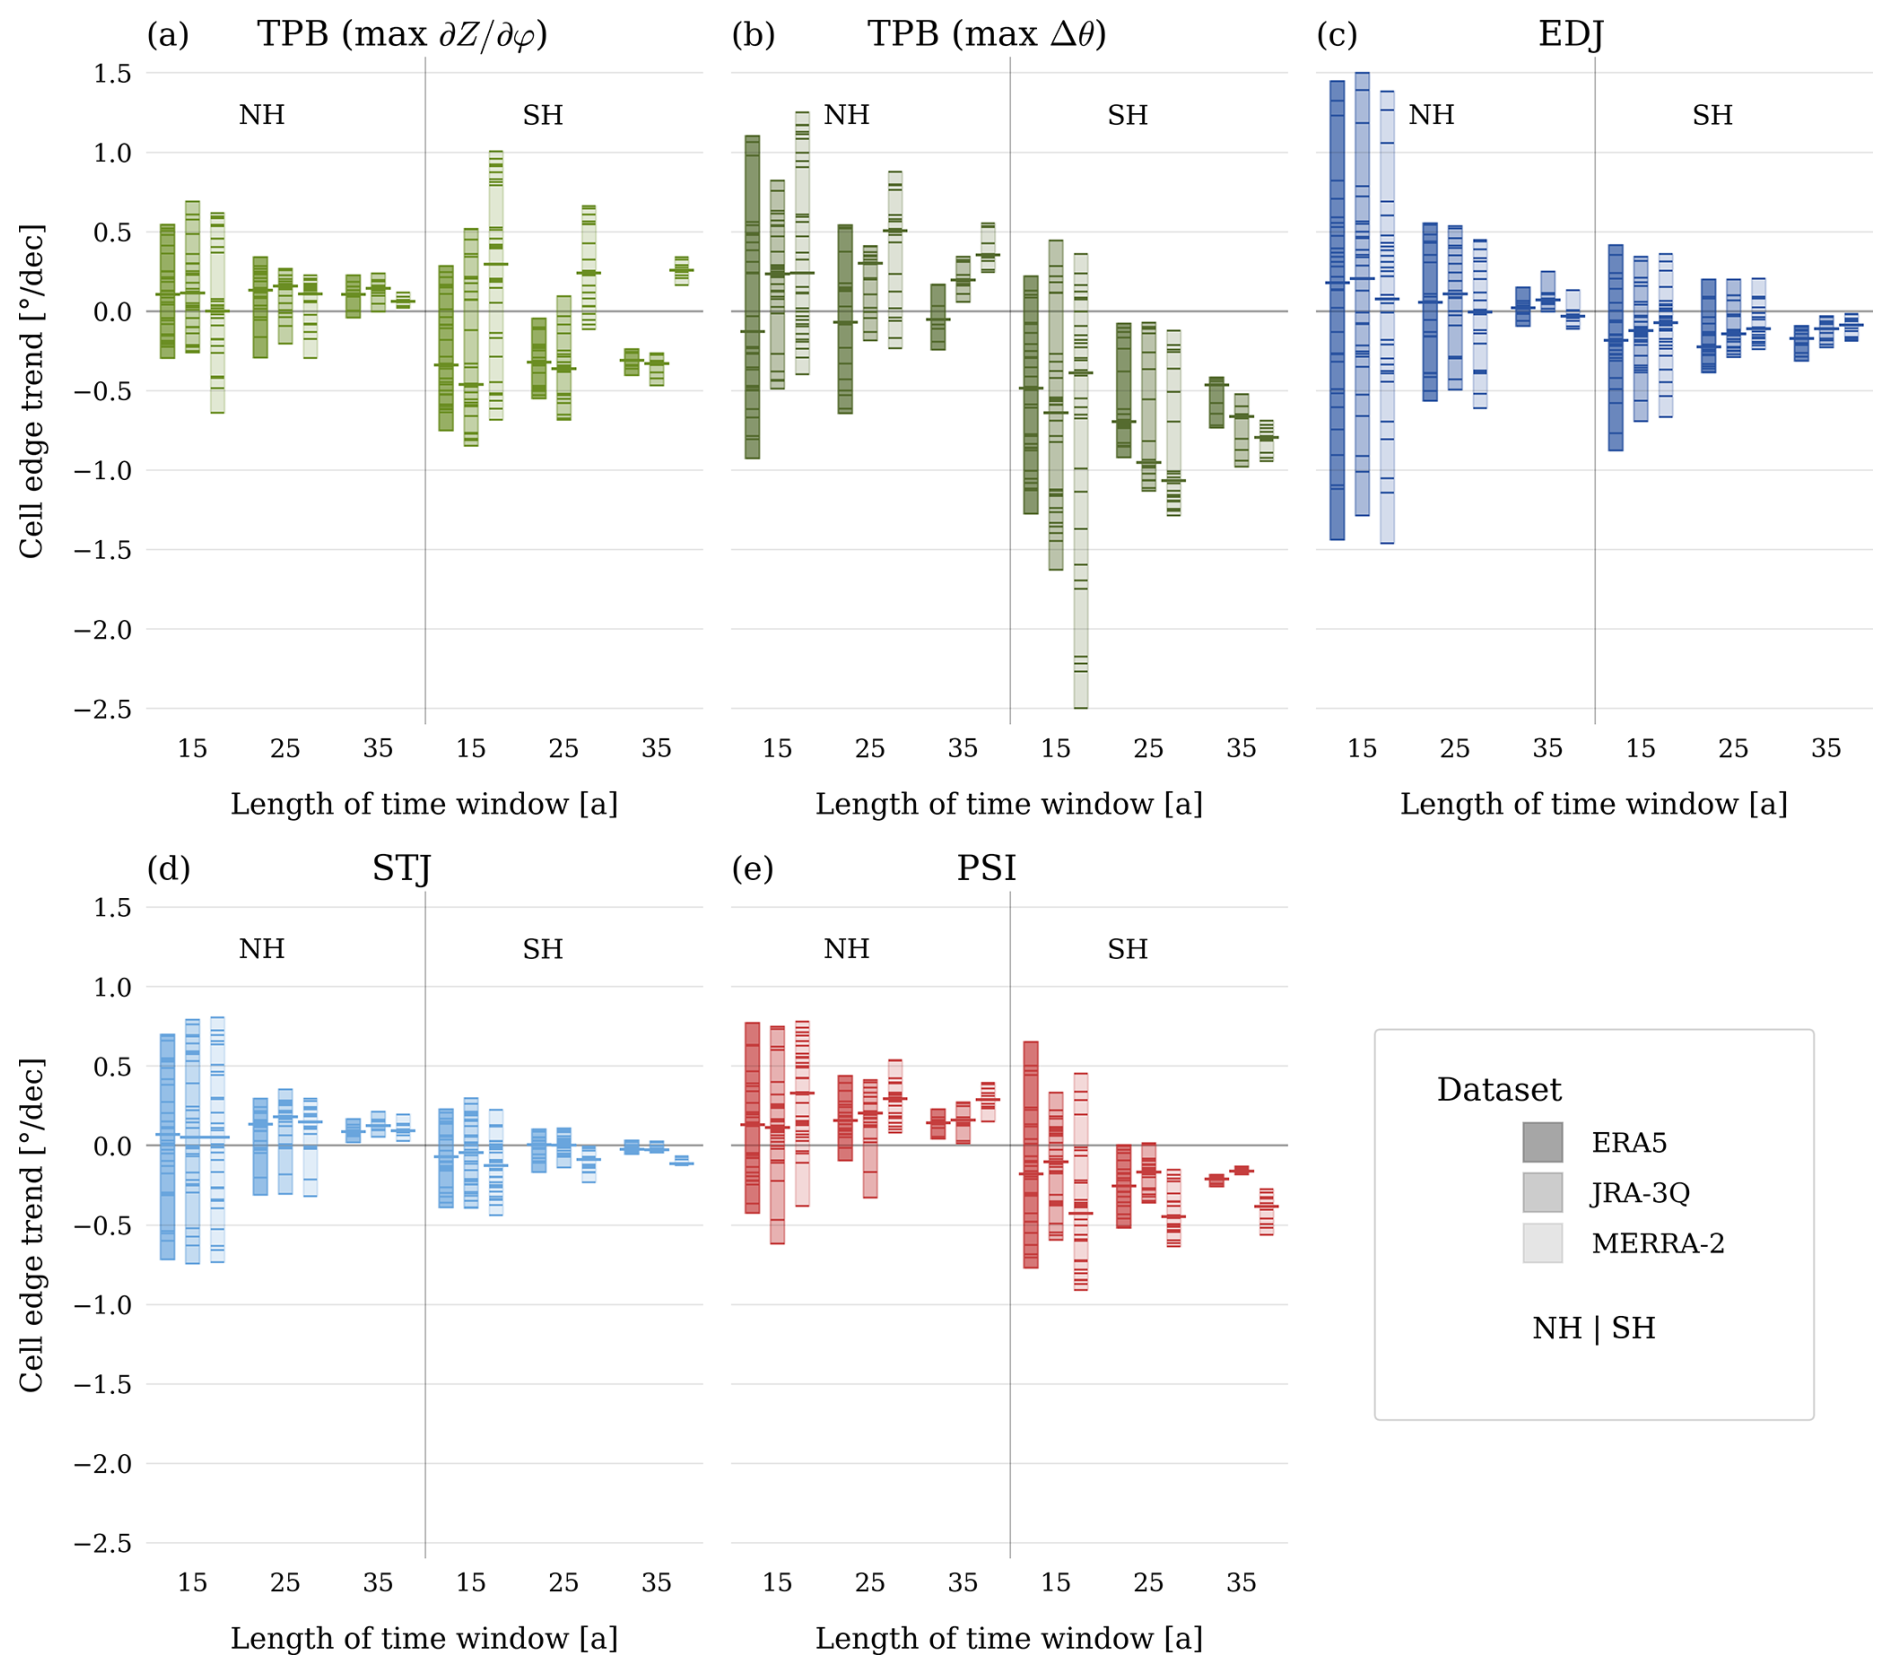
Figure 5Cell edge trend for different metrics (a–e) and reanalyses (shading) for the three time window lengths – 15, 25, and 35 years. Every trend of a specific time length calculated within the period 1980–2024 is indicated by a horizontal line. A shaded bar is in the background of each dataset for the different time windows. The median of each dataset and specific time window length is indicated by a longer horizontal line.
Generally, there are differences between temperature and wind-based metrics. While the wind-based metrics exhibit a greater spread of trends in the NH, temperature-based metrics show more spread of trends in the SH. Furthermore, the distribution and range of the trends for the temperature-based metrics differ more between the datasets. Interestingly, the STJ and EDJ metric, which are both based on zonal wind, showcase very similar results between the different datasets. The spread of the single trends for a time window length and their distribution is consistent between all datasets. This is unlike the other metrics, which are based on temperature data (i.e., TPB) and the meridional wind (i.e., PSI), where the results of the individual datasets visibly differ. Furthermore, the STJ and EDJ trend results in the SH are more consistent with less spread than in the NH, where metrics over high mountain regions may add to the greater spread.
We note that the broad distribution of the trend values for a time window length might also indicate the strong influence of climate variability and other drivers of tropical width change, obscuring the global warming signal. Multiple drivers, such as internal climate variability and natural and anthropogenic external forcings, influence the location of these tropical width metrics, as discussed in recent literature (Grise et al., 2019; Staten et al., 2019). These effects also complicate the estimation of tropical widening trends and underline the importance of a sufficiently long data record.
Besides the record length also the long-term consistency of the used data set is significant for trend assessments, which is a known flaw of reanalysis (Fujiwara et al., 2017). In this regard, one surprising and interesting result can be seen in Fig. 5a. The results of MERRA-2 in the SH indicate an equatorward shift, which is contrary to the other datasets and metric results of this study. While in general, narrowing trends in various TPB metrics for MERRA-2 have been found in other studies (Martin et al., 2020; Zou et al., 2023), this specific difference in the results of the TPB results has not been documented. No information on a similar discovery could be found in the literature, as to the best of our knowledge, a trend for this particular metric over the available record length (i.e., 1980 onwards) has not been investigated for MERRA-2. Additional testing indicates a possibly, artificially induced trend which results from an unexpected change of the TPB time series. More specifically, when looking at the longer time series of the TPB in comparison between the different reanalysis datasets, Fig. 6 suggests that the shift might have occurred in the early 21st century. This potentially implies a possible discontinuity of the MERRA-2 temperature record near the tropopause height. In this time period, multiple changes in the data assimilation of the reanalysis have occurred, e.g., GNSS RO bending angles since July 2004, MLS temperature from August 2004 and ATOVS starting in May 2007 are being assimilated in MERRA-2 (Fujiwara et al., 2017; Gelaro et al., 2017). Based on these current findings, a long-term trend of the TPB metric in MERRA-2 should be viewed with caution and a more detailed study on these results would be of interest.
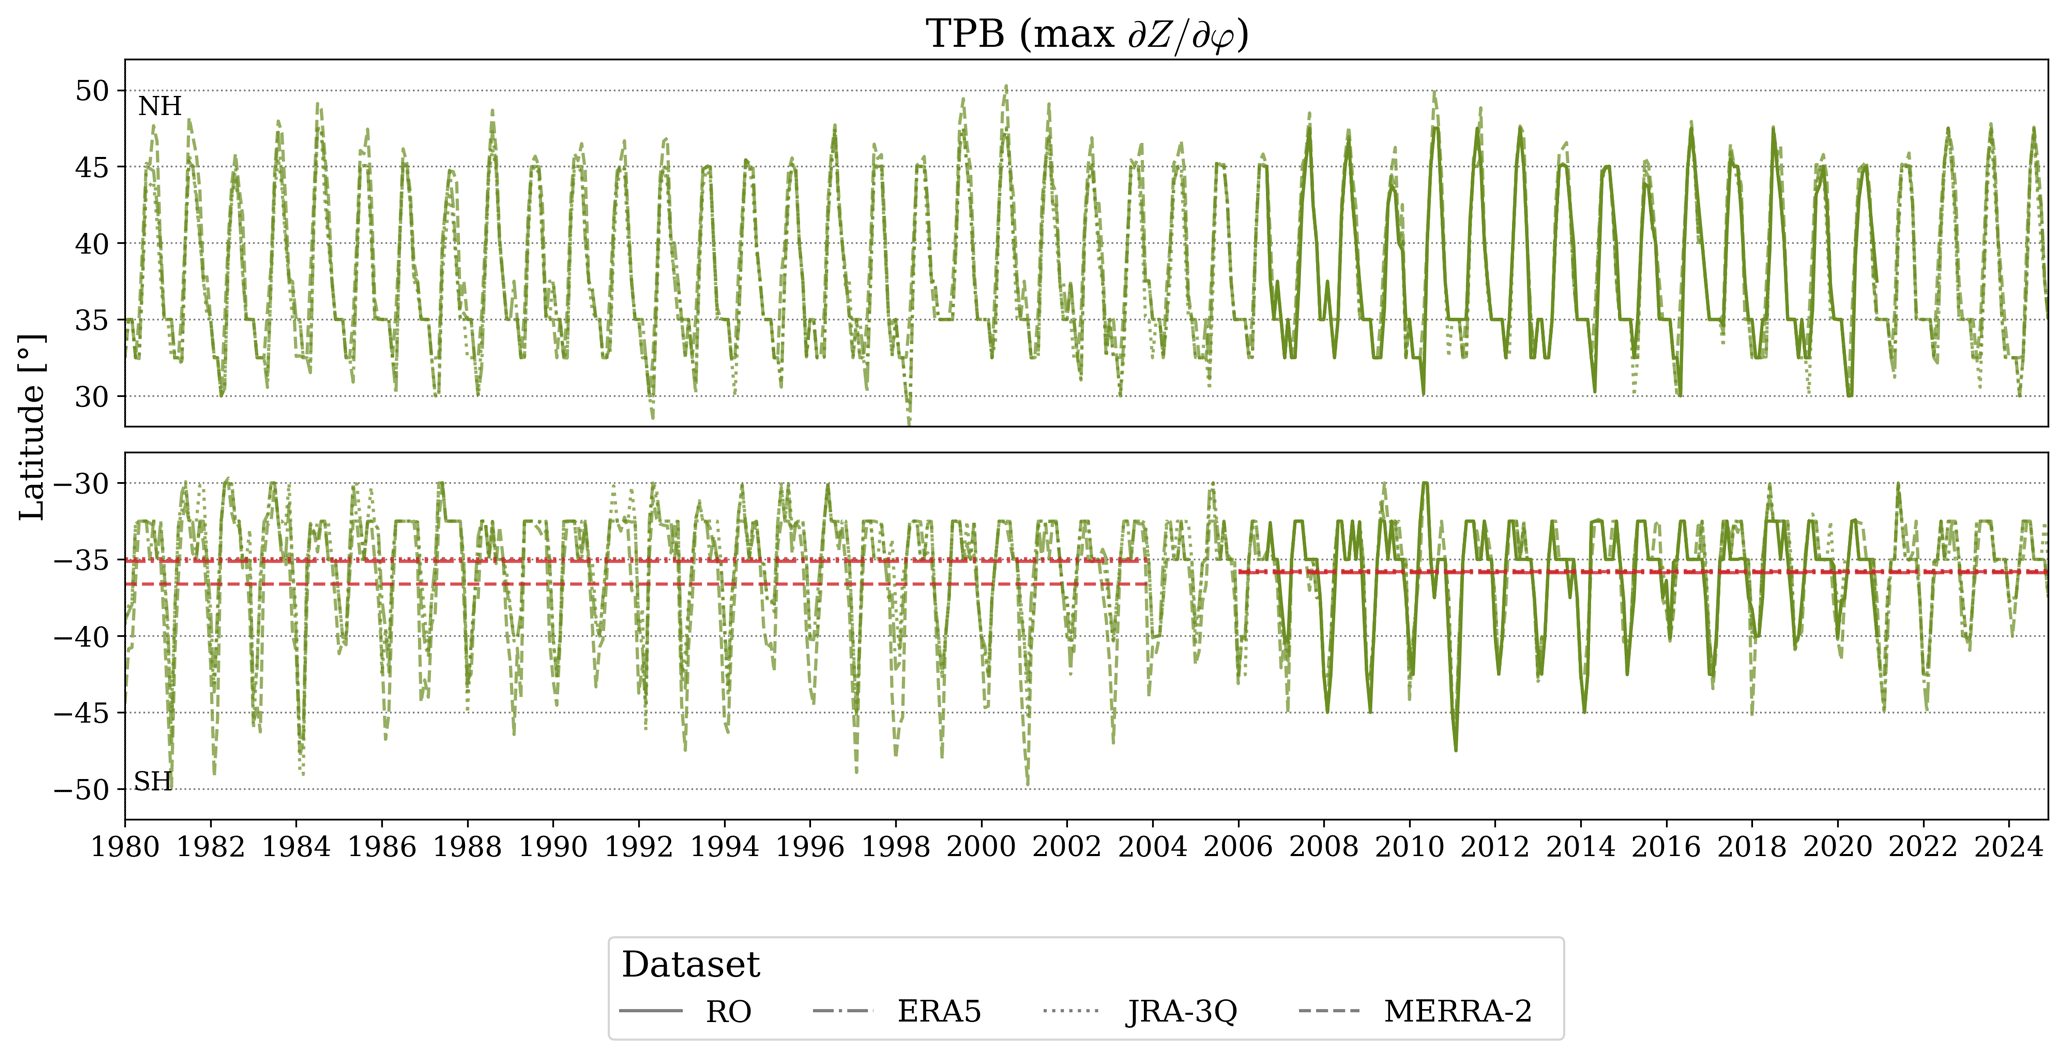
Figure 6Monthly time series of TPB latitudinal edges from 1980 to 2024. The NH and SH edge is shown for the RO and reanalysis datasets. The red horizontal lines in the SH indicate the mean edge value for the three reanalyses spanning over two different time periods.
In this study we demonstrated the applicability of observational RO temperature and new RO wind data to examine a range of tropical width metrics, including tropopause break and jet stream metrics. The study focused on the potential of RO data for zonal-mean and zonally resolved positions of selected tropospheric features using common tropical width metrics. By showing similarly strong correlations between RO and reanalyses, as demonstrated between different reanalyses, our results illustrate the capability of this globally available, independent observational dataset.
Our study results based on the WEGC RO OPSv5.6 record and most recent reanalyses are consistent with previous findings of RO records, the studied TPB metrics show high agreement between the datasets (e.g., Darrag et al., 2022; Luan et al., 2020). Furthermore, we extend upon earlier temperature-based studies, additionally focusing on wind-based metrics and using new wind records from RO. The recent development of these advanced RO wind fields beyond the fundamental geostrophic approach allows a more detailed investigation of the jet streams. Additionally, this study is the first of its kind, analysing also regional jet streams based on RO data. The results of the EDJ and STJ from RO agree with the results from the three reanalyses. Especially in the SH, the results of the jet streams show very close agreement between the datasets, highlighting RO as an important observational data source, where others, e.g., radiosondes are scarce.
We have proven the general applicability of RO data to locate jet streams, however, currently, the EDJ metric shows large systematic differences over some regions in the NH between RO and the reanalyses, which limits its utility for climate monitoring. Furthermore, other methods to define the jets exist (Keel et al., 2024; Liu et al., 2021), which were not tested in the process. Hence, a detailed investigation of further jet metrics using RO observations presents an interesting direction for future research to gain more insight into the jet response to climate change.
Moreover, a focus of this work has been on the grid dependence of the specific metrics. The RO record studied here is available on a 2.5° × 2.5° grid. Despite this being a finer spatial grid than used in previous RO-based studies, it is rather coarse in comparison to state-of-the-art reanalyses. This issue was tested by comparing results from native and regridded reanalyses. The findings are fairly consistent also for the reduced grid spacing in the zonal-mean and for zonally resolved data, as shown also in Luan et al. (2020) for TPB metrics.
While we see great potential in RO records for the study of tropical atmospheric features, we also acknowledge their constraints. RO data has been successfully applied in climate studies, for instance, to investigate atmospheric temperature trends (e.g., Ladstädter et al., 2023; Steiner et al., 2020b) and tropopause trends (Ladstädter et al., 2025; Meng et al., 2021) over recent decades. However, for trend studies of the tropical width, which exhibits large variability, the record length is not yet considered long enough using regionally resolved RO data since 2006. This currently confines the full potential of the RO dataset. Consistent with other studies (e.g., Grise et al., 2018), we showed that an extended record length is necessary for trend estimation of these tropical width metrics. A revenue of subsequent work will be to focus on regional trends, which may manifest over shorter timescales due to a more pronounced climate signal in certain geographic areas (e.g., Manney and Hegglin, 2018; Martin et al., 2020).
To summarize, the obtained results show the potential of RO data for the study of tropical width metrics, highlighting a clear set of applicable methods for this specific observational dataset. This paves the way for future trend studies as the observational record grows. Our investigation extended beyond the well-established RO temperature record to include advanced RO wind information. While we perceived strong potential in RO data for temperature-based metrics and zonal-wind-based metrics, we find that the computation of the meridional RO wind component needs further research. Nevertheless, results confirm a high suitability for zonal-mean applications and zonally resolved studies. The RO record is highly relevant in validating reanalysis and climate model data, when the full potential of its long-term consistency and high accuracy can be employed.
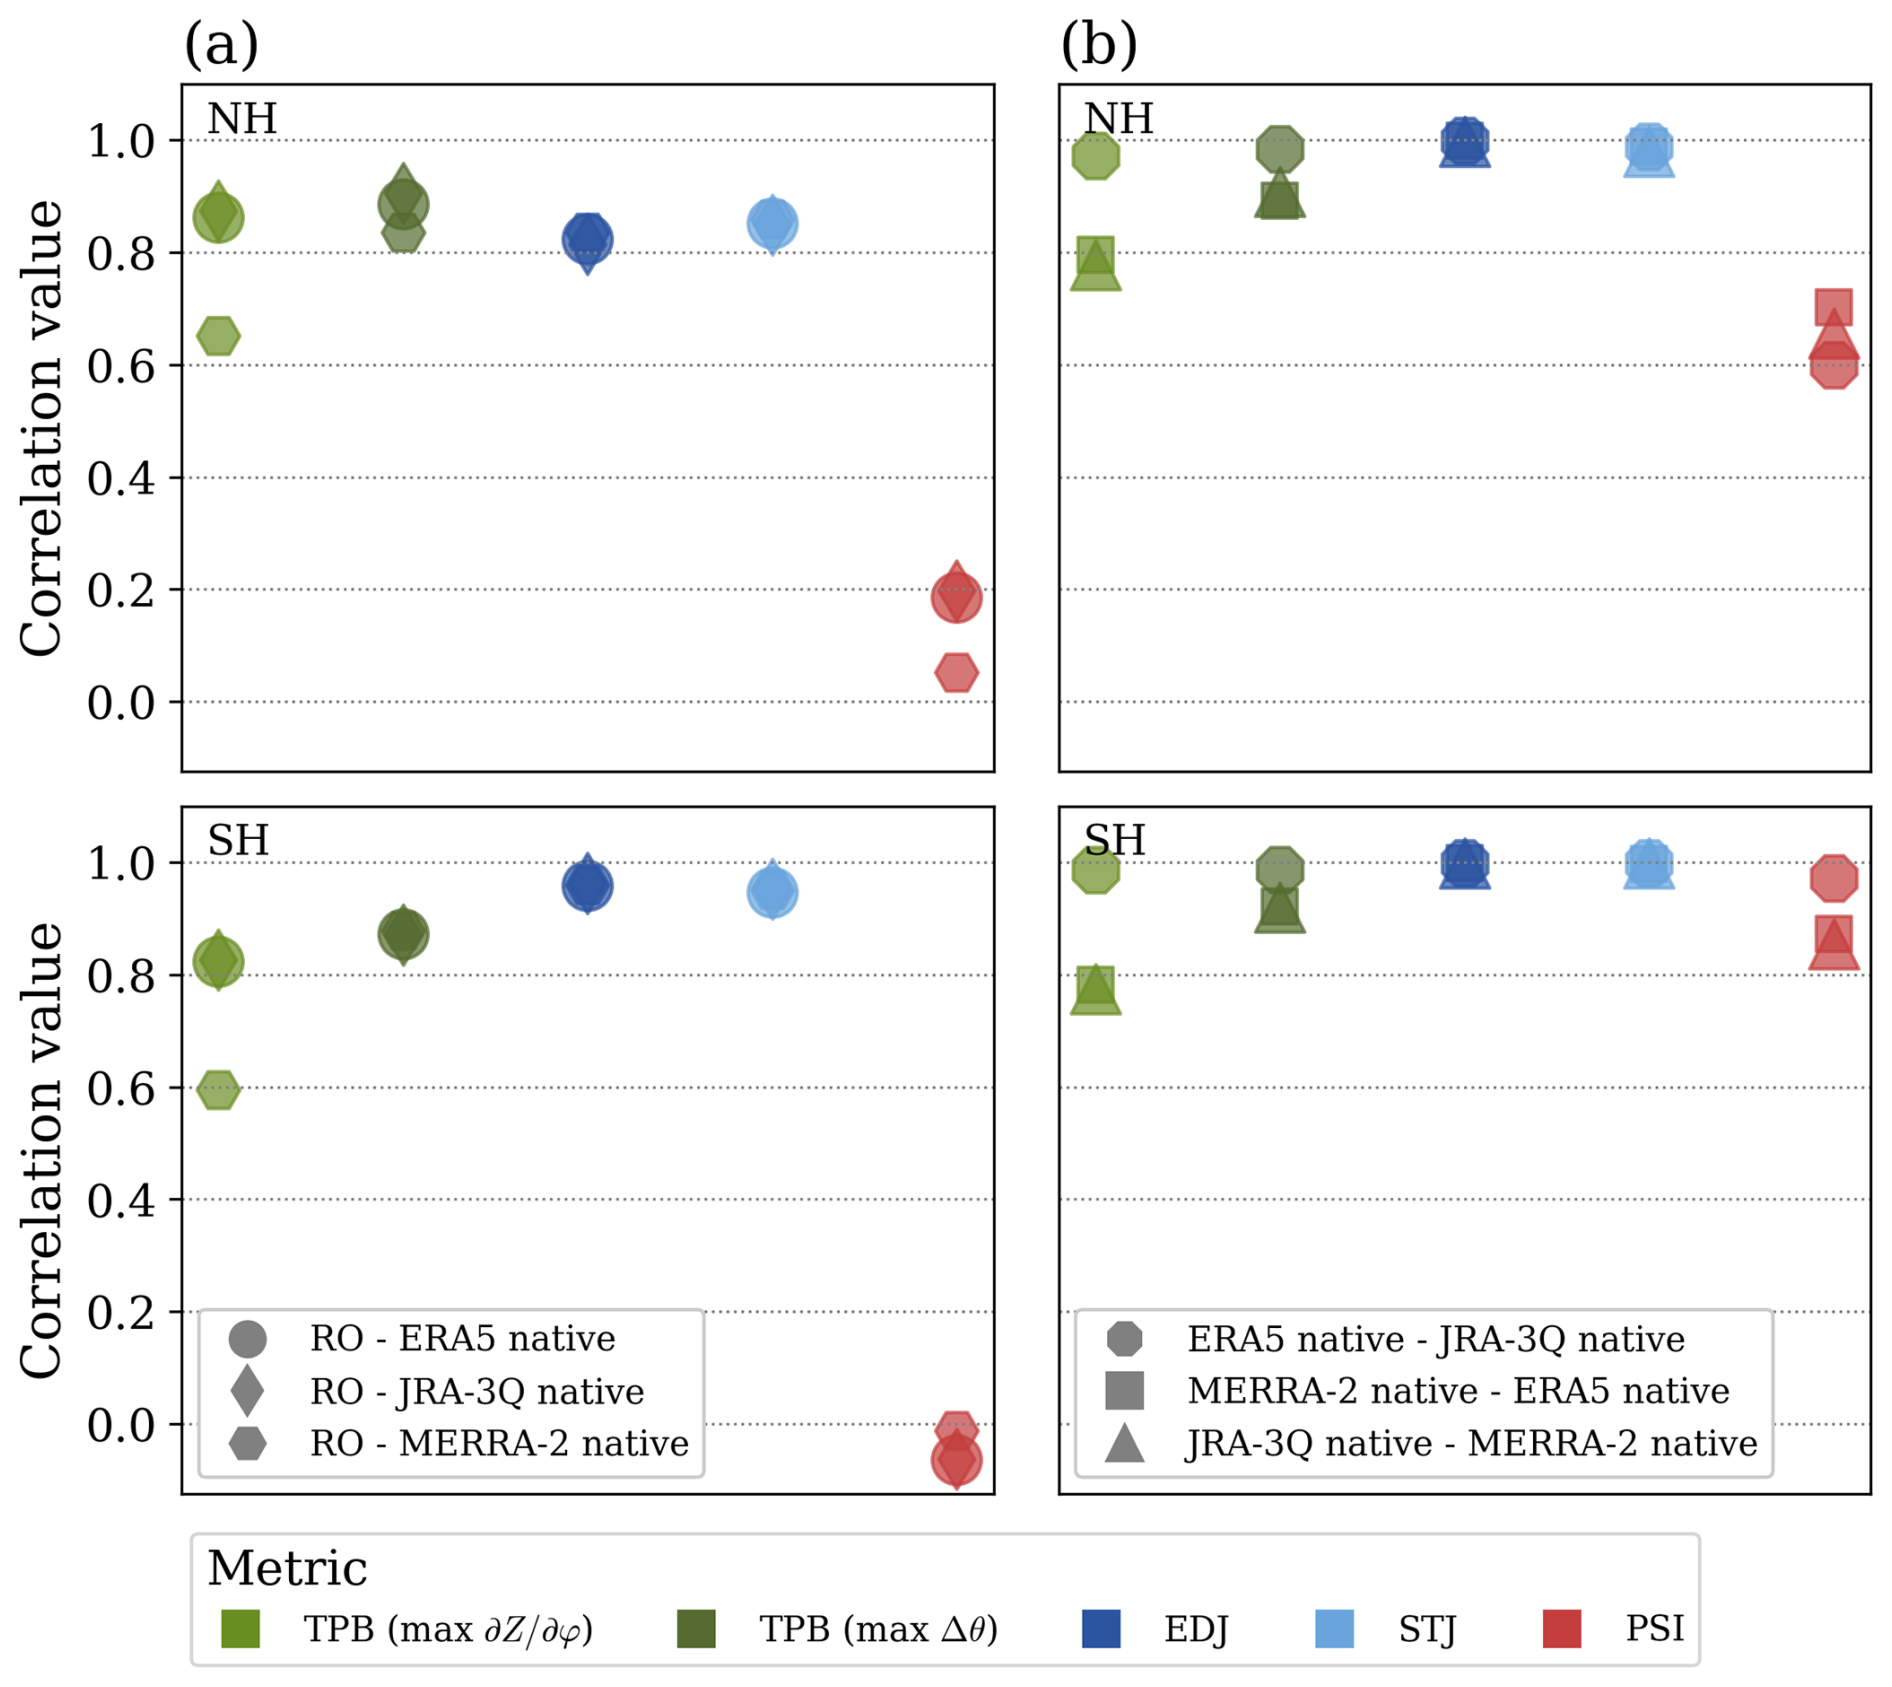
Figure A1Correlation of monthly anomalies of tropical edge values between the different datasets for five different metrics over the time period September 2006 to December 2020. The correlation of RO and different reanalyses on their native grid as shown in (a), and (b) the correlation among the different reanalysis datasets on their native grids. All correlations are statistically significant (p value < 0.001), apart from the PSI metric in (a).
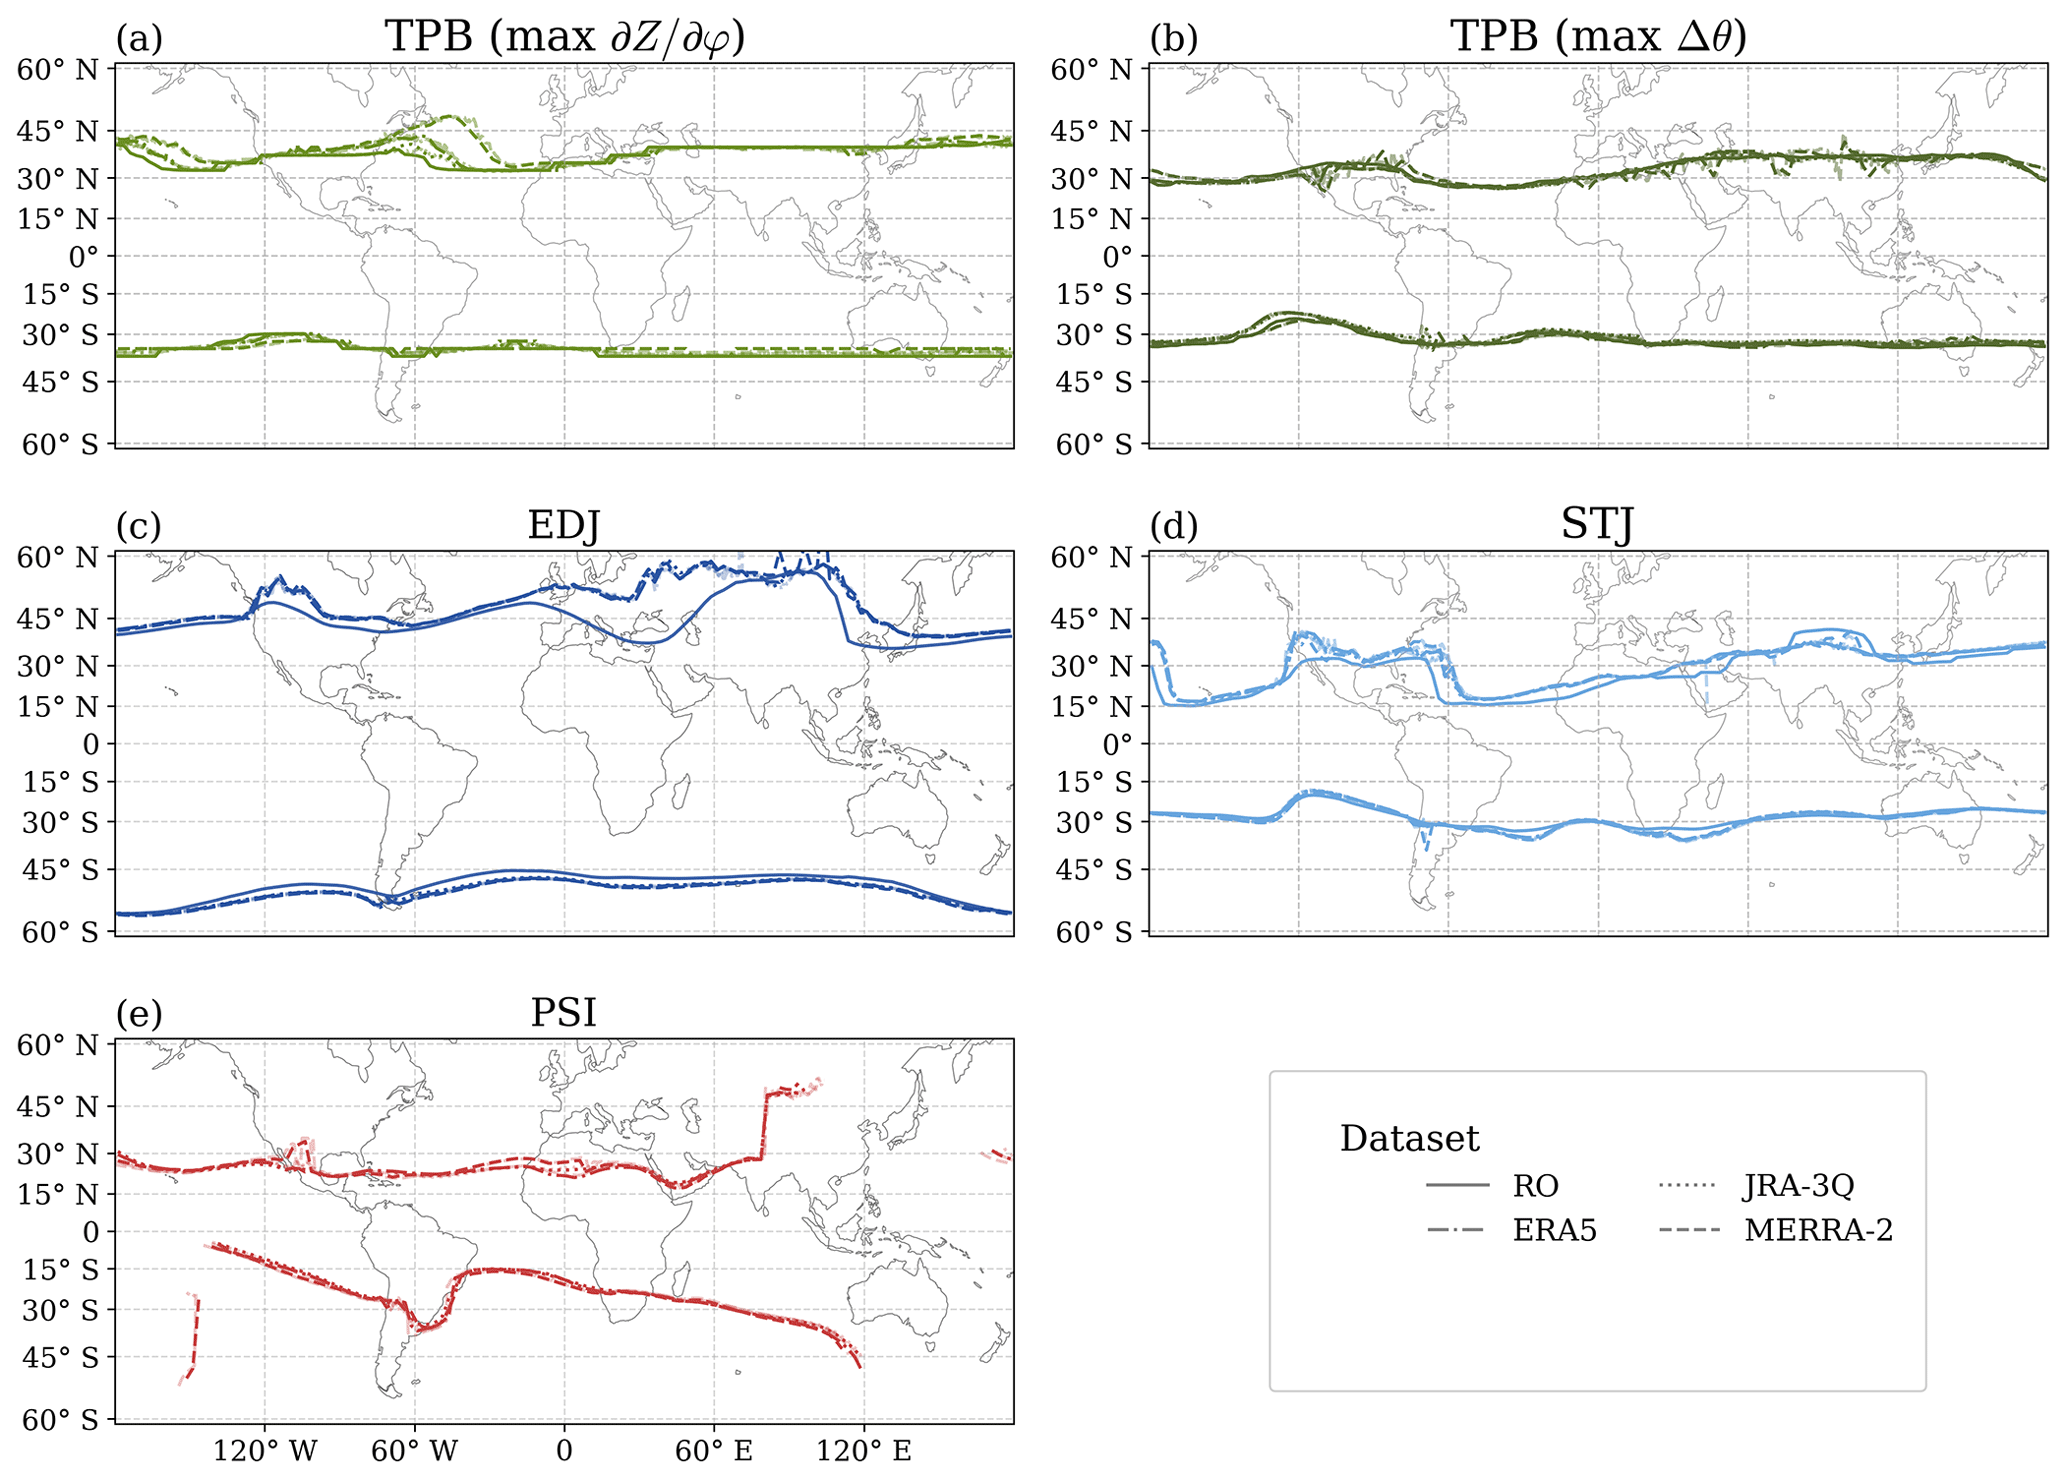
Figure A2Mean longitudinally varying tropical edge of the NH and SH for RO and reanalyses for five cell edge metrics (a–e) over the RO period. The PSI-metric (e) is only shown for reanalyses. Bold lines show the results from the datasets on the 2.5° × 2.5° latitude × longitude grid, while shaded lines show the results from the reanalyses on their native grid.
The WEGC RO OPSv5.6 data used in this study are archived under https://doi.org/10.25364/WEGC/OPS5.6:2021.1 (EOPAC Team, 2021). All reanalyses data are publicly available: ERA5 was downloaded from the climate data store (https://climate.copernicus.eu, last access: 30 October 2025; Hersbach et al., 2023), MERRA-2 was acquired from GES DISC (https://disc.gsfc.nasa.gov, last access: 30 October 2025; Global Modeling and Assimilation Office (GMAO), 2015), JRA-3Q was obtained from NSF NCAR Research Data Archive (https://rda.ucar.edu, last access: 30 October 2025; Japan Meteorological Agency, 2024). The calculations were performed using Python 3.11 and build on the freely available software packages windspharm (Dawson, 2016) and PyTropD (Adam et al., 2018).
Conceptualization: AR, JD; data curation: AR; formal analysis: AR; funding acquisition: JD; methodology: AR, JD; supervision: JD, AKS; validation and visualization: AR, JD, AKS; writing (original draft preparation): AR, JD; writing (review and editing): AR, JD, AKS.
The contact author has declared that none of the authors has any competing interests.
Publisher's note: Copernicus Publications remains neutral with regard to jurisdictional claims made in the text, published maps, institutional affiliations, or any other geographical representation in this paper. While Copernicus Publications makes every effort to include appropriate place names, the final responsibility lies with the authors. Views expressed in the text are those of the authors and do not necessarily reflect the views of the publisher.
This article is part of the special issue “The SPARC Reanalysis Intercomparison Project (S-RIP) Phase 2 (ACP/WCD inter-journal SI)”. It is not associated with a conference.
We thank the UCAR/CDAAC RO team for providing the RO excess phase and orbit data, and the WEGC RO team for supplying the OPSv5.6 retrieved profile data. We are particularly grateful to Florian Ladstädter (WEGC) for providing the monthly gridded climatology data. Within the Strato-Clim team, we thank Johannes Unegg (WEGC) and Irena Nimac (WEGC) for providing the wind fields, and we especially thank Gottfried Kirchengast (WEGC) for many fruitful discussions. Finally, we gratefully acknowledge the Austrian Science Fund (FWF) for supporting this work under grant no. P-40182, and the University of Graz for the financial support of the publication costs (open access).
This research has been supported by the Austrian Science Fund (grant no. P-40182). The authors acknowledge the financial support by the University of Graz.
This paper was edited by Thomas Birner and reviewed by Chi Ao and one anonymous referee.
Adam, O., Grise, K. M., Staten, P., Simpson, I. R., Davis, S. M., Davis, N. A., Waugh, D. W., Birner, T., and Ming, A.: The TropD software package (v1): standardized methods for calculating tropical-width diagnostics, Geosci. Model Dev., 11, 4339–4357, https://doi.org/10.5194/gmd-11-4339-2018, 2018.
Amaya, D. J., Siler, N., Xie, S.-P., and Miller, A. J.: The interplay of internal and forced modes of Hadley Cell expansion: lessons from the global warming hiatus, Clim. Dynam., 51, 305–319, https://doi.org/10.1007/s00382-017-3921-5, 2018.
Angerer, B., Ladstädter, F., Scherllin-Pirscher, B., Schwärz, M., Steiner, A. K., Foelsche, U., and Kirchengast, G.: Quality aspects of the Wegener Center multi-satellite GPS radio occultation record OPSv5.6, Atmos. Meas. Tech., 10, 4845–4863, https://doi.org/10.5194/amt-10-4845-2017, 2017.
Anjana, U., Mathew, S. S., and Kumar, K. K.: Retrieval of the Hadley circulation boundaries at regional scales using global positioning system-radio occultation measurements, GPS Solut., 28, 22, https://doi.org/10.1007/s10291-023-01561-y, 2023.
Anthes, R. A., Bernhardt, P. A., Chen, Y., Cucurull, L., Dymond, K. F., Ector, D., Healy, S. B., Ho, S.-P., Hunt, D. C., Kuo, Y.-H., Liu, H., Manning, K., McCormick, C., Meehan, T. K., Randel, W. J., Rocken, C., Schreiner, W. S., Sokolovskiy, S. V., Syndergaard, S., Thompson, D. C., Trenberth, K. E., Wee, T.-K., Yen, N. L., and Zeng, Z.: The COSMIC/FORMOSAT-3 Mission: Early Results, B. Am. Meteorol. Soc., 89, 313–334, https://doi.org/10.1175/BAMS-89-3-313, 2008.
Ao, C. O. and Hajj, A. J.: Monitoring the width of the tropical belt with GPS radio occultation measurements, Geophys. Res. Lett., 40, 6236–6241, https://doi.org/10.1002/2013GL058203, 2013.
Baldassare, D., Reichler, T., Plink-Björklund, P., and Slawson, J.: Large uncertainty in observed estimates of tropical width from the meridional stream function, Weather Clim. Dynam., 4, 531–541, https://doi.org/10.5194/wcd-4-531-2023, 2023.
Beyerle, G., Schmidt, T., Michalak, G., Heise, S., Wickert, J., and Reigber, C.: GPS radio occultation with GRACE: Atmospheric profiling utilizing the zero difference technique, Geophys. Res. Lett., 32, L13806, https://doi.org/10.1029/2005GL023109, 2005.
Chemke, R. and Polvani, L. M.: Exploiting the Abrupt 4 × CO2 Scenario to Elucidate Tropical Expansion Mechanisms, J. Climate, 32, 859–875, https://doi.org/10.1175/JCLI-D-18-0330.1, 2019.
Danzer, J., Pieler, M., and Kirchengast, G.: Closing the gap in the tropics: the added value of radio-occultation data for wind field monitoring across the Equator, Atmos. Meas. Tech., 17, 4979–4995, https://doi.org/10.5194/amt-17-4979-2024, 2024.
Darrag, M., Jin, S., Calabia, A., and Samy, A.: Determination of tropical belt widening using multiple GNSS radio occultation measurements, Ann. Geophys., 40, 359–377, https://doi.org/10.5194/angeo-40-359-2022, 2022.
Davis, N. A. and Birner, T.: Seasonal to multidecadal variability of the width of the tropical belt, J. Geophys. Res.-Atmos., 118, 7773–7787, https://doi.org/10.1002/jgrd.50610, 2013.
Davis, N. A. and Birner, T.: Climate Model Biases in the Width of the Tropical Belt, J. Climate, 29, 1935–1954, https://doi.org/10.1175/JCLI-D-15-0336.1, 2016.
Davis, N. A. and Birner, T.: On the Discrepancies in Tropical Belt Expansion between Reanalyses and Climate Models and among Tropical Belt Width Metrics, J. Climate, 30, 1211–1231, https://doi.org/10.1175/JCLI-D-16-0371.1, 2017.
Davis, N. A. and Davis, S. M.: Reconciling Hadley Cell Expansion Trend Estimates in Reanalyses, Geophys. Res. Lett., 45, 11439–11446, https://doi.org/10.1029/2018GL079593, 2018.
Davis, S. M. and Rosenlof, K. H.: A Multidiagnostic Intercomparison of Tropical-Width Time Series Using Reanalyses and Satellite Observations, J. Climate, 25, 1061–1078, https://doi.org/10.1175/JCLI-D-11-00127.1, 2012.
Dawson, A.: Windspharm: A High-Level Library for Global Wind Field Computations Using Spherical Harmonics, Journal of Open Research Software, 4, e31, https://doi.org/10.5334/jors.129, 2016.
de La Beaujardière, O.: C/NOFS: a mission to forecast scintillations, J. Atmos. Sol.-Terr. Phy., 66, 1573–1591, https://doi.org/10.1016/j.jastp.2004.07.030, 2004.
EOPAC Team: Wegener Center GNSS Radio Occultation Record (2001–2020) [data set], https://doi.org/10.25364/WEGC/OPS5.6:2021.1, 2021.
Feng, S. and Fu, Q.: Expansion of global drylands under a warming climate, Atmos. Chem. Phys., 13, 10081–10094, https://doi.org/10.5194/acp-13-10081-2013, 2013.
Foelsche, U., Scherllin-Pirscher, B., Ladstädter, F., Steiner, A. K., and Kirchengast, G.: Refractivity and temperature climate records from multiple radio occultation satellites consistent within 0.05 %, Atmos. Meas. Tech., 4, 2007–2018, https://doi.org/10.5194/amt-4-2007-2011, 2011.
Fujiwara, M., Wright, J. S., Manney, G. L., Gray, L. J., Anstey, J., Birner, T., Davis, S., Gerber, E. P., Harvey, V. L., Hegglin, M. I., Homeyer, C. R., Knox, J. A., Krüger, K., Lambert, A., Long, C. S., Martineau, P., Molod, A., Monge-Sanz, B. M., Santee, M. L., Tegtmeier, S., Chabrillat, S., Tan, D. G. H., Jackson, D. R., Polavarapu, S., Compo, G. P., Dragani, R., Ebisuzaki, W., Harada, Y., Kobayashi, C., McCarty, W., Onogi, K., Pawson, S., Simmons, A., Wargan, K., Whitaker, J. S., and Zou, C.-Z.: Introduction to the SPARC Reanalysis Intercomparison Project (S-RIP) and overview of the reanalysis systems, Atmos. Chem. Phys., 17, 1417–1452, https://doi.org/10.5194/acp-17-1417-2017, 2017.
Galanti, E., Raiter, D., Kaspi, Y., and Tziperman, E.: Spatial Patterns of the Tropical Meridional Circulation: Drivers and Teleconnections, J. Geophys. Res.-Atmos., 127, e2021JD035531, https://doi.org/10.1029/2021JD035531, 2022.
Gelaro, R., McCarty, W., Suárez, M. J., Todling, R., Molod, A., Takacs, L., Randles, C. A., Darmenov, A., Bosilovich, M. G., Reichle, R., Wargan, K., Coy, L., Cullather, R., Draper, C., Akella, S., Buchard, V., Conaty, A., Silva, A. M. da, Gu, W., Kim, G.-K., Koster, R., Lucchesi, R., Merkova, D., Nielsen, J. E., Partyka, G., Pawson, S., Putman, W., Rienecker, M., Schubert, S. D., Sienkiewicz, M., and Zhao, B.: The Modern-Era Retrospective Analysis for Research and Applications, Version 2 (MERRA-2), J. Climate, 30, 5419–5454, https://doi.org/10.1175/JCLI-D-16-0758.1, 2017.
Global Modeling and Assimilation Office (GMAO): MERRA-2 instM_3d_ana_Np: 3d,Monthly mean,Instantaneous,Pressure-Level,Analysis,Analyzed Meteorological Fields V5.12.4, Goddard Earth Sciences Data and Information Services Center (GES DISC) [data set], Greenbelt, MD, USA, https://doi.org/10.5067/V92O8XZ30XBI, 2015.
Grise, K. M. and Davis, S. M.: Hadley cell expansion in CMIP6 models, Atmos. Chem. Phys., 20, 5249–5268, https://doi.org/10.5194/acp-20-5249-2020, 2020.
Grise, K. M., Davis, S. M., Staten, P. W., and Adam, O.: Regional and Seasonal Characteristics of the Recent Expansion of the Tropics, J. Climate, 31, 6839–6856, https://doi.org/10.1175/JCLI-D-18-0060.1, 2018.
Grise, K. M., Davis, S. M., Simpson, I. R., Waugh, D. W., Fu, Q., Allen, R. J., Rosenlof, K. H., Ummenhofer, C. C., Karnauskas, K. B., Maycock, A. C., Quan, X.-W., Birner, T., and Staten, P. W.: Recent Tropical Expansion: Natural Variability or Forced Response?, J. Climate, 32, 1551–1571, https://doi.org/10.1175/JCLI-D-18-0444.1, 2019.
Hajj, G. A., Ao, C. O., Iijima, B. A., Kuang, D., Kursinski, E. R., Mannucci, A. J., Meehan, T. K., Romans, L. J., de la Torre Juarez, M., and Yunck, T. P.: CHAMP and SAC-C atmospheric occultation results and intercomparisons, J. Geophys. Res.-Atmos., 109, D06109, https://doi.org/10.1029/2003JD003909, 2004.
Hersbach, H., Bell, B., Berrisford, P., Hirahara, S., Horányi, A., Muñoz-Sabater, J., Nicolas, J., Peubey, C., Radu, R., Schepers, D., Simmons, A., Soci, C., Abdalla, S., Abellan, X., Balsamo, G., Bechtold, P., Biavati, G., Bidlot, J., Bonavita, M., De Chiara, G., Dahlgren, P., Dee, D., Diamantakis, M., Dragani, R., Flemming, J., Forbes, R., Fuentes, M., Geer, A., Haimberger, L., Healy, S., Hogan, R. J., Hólm, E., Janisková, M., Keeley, S., Laloyaux, P., Lopez, P., Lupu, C., Radnoti, G., de Rosnay, P., Rozum, I., Vamborg, F., Villaume, S., and Thépaut, J.-N.: The ERA5 global reanalysis, Q. J. Roy. Meteor. Soc., 146, 1999–2049, https://doi.org/10.1002/qj.3803, 2020.
Hersbach, H., Bell, B., Berrisford, P., Biavati, G., Horányi, A., Muñoz Sabater, J., Nicolas, J., Peubey, C., Radu, R., Rozum, I., Schepers, D., Simmons, A., Soci, C., Dee, D., and Thépaut, J.-N.: ERA5 monthly averaged data on pressure levels from 1940 to present. Copernicus Climate Change Service (C3S) Climate Data Store (CDS) [data set], https://doi.org/10.24381/cds.6860a573, 2023.
Hoffman, R. N., Privé, N., and Bourassa, M.: Comments on “Reanalyses and Observations: What's the Difference?”, B. Am. Meteorol. Soc., 98, 2455–2459, https://doi.org/10.1175/BAMS-D-17-0008.1, 2017.
Hu, Y., Huang, H., and Zhou, C.: Widening and weakening of the Hadley circulation under global warming, Sci. Bull., 63, 640–644, https://doi.org/10.1016/j.scib.2018.04.020, 2018.
Japan Meteorological Agency: Japanese Reanalysis for Three Quarters of a Century (JRA-3Q) Monthly Statistics, updated monthly, NSF National Center for Atmospheric Research [data set], https://doi.org/10.5065/PH0D-MH18, 2024.
Keel, T., Brierley, C., and Edwards, T.: jsmetrics v0.2.0: a Python package for metrics and algorithms used to identify or characterise atmospheric jet streams, Geosci. Model Dev., 17, 1229–1247, https://doi.org/10.5194/gmd-17-1229-2024, 2024.
Kosaka, Y., Kobayashi, S., Harada, Y., Kobayashi, C., Naoe, H., Yoshimoto, K., Harada, M., Goto, N., Chiba, J., Miyaoka, K., Sekiguchi, R., Deushi, M., Kamahori, H., Nakaegawa, T., Tanaka, T. Y., Tokuhiro, T., Sato, Y., Matsushita, Y., and Onogi, K.: The JRA-3Q Reanalysis, J. Meteorol. Soc. Jpn., Ser. II, 102, 49–109, https://doi.org/10.2151/jmsj.2024-004, 2024.
Ladstädter, F., Stocker, M., Yessimbet, K., and Steiner, A. K.: GNSS RO providing a detailed view on the thermal structure and changes in Earth's atmosphere, International Workshop on Occultations for Probing Atmosphere and Climate 2022, Leibnitz, Austria, 8–14 September 2022, https://static.uni-graz.at/fileadmin/_files/_event_sites/_opacirowg2022/programme/08.9.22/AM/Session_1/OPAC-IROWG-2022_Ladstaedter.pdf (last access: 26 November 2025), 2022.
Ladstädter, F., Steiner, A. K., and Gleisner, H.: Resolving the 21st century temperature trends of the upper troposphere–lower stratosphere with satellite observations, Sci. Rep., 13, 1306, https://doi.org/10.1038/s41598-023-28222-x, 2023.
Ladstädter, F., Stocker, M., Scher, S., and Steiner, A. K.: Observed changes in the temperature and height of the globally resolved lapserate tropopause, Atmos. Chem. Phys., 25, 16053–16062, https://doi.org/10.5194/acp-25-16053-2025, 2025.
Lee, S. and Kim, H.: The Dynamical Relationship between Subtropical and Eddy-Driven Jets, J. Atmos. Sci., 60, 1490–1503, https://doi.org/10.1175/1520-0469(2003)060<1490:TDRBSA>2.0.CO;2, 2003.
Li, Y., Li, X., Xie, S.-P., Zhang, G., Wang, Z., Wang, W., and Hou, Y.: Regional Perspective of Hadley Circulation and Its Uncertainties Among Different Datasets: Spread in Reanalysis Datasets, J. Geophys. Res.-Atmos., 127, e2022JD036940, https://doi.org/10.1029/2022JD036940, 2022.
Liu, X., Grise, K. M., Schmidt, D. F., and Davis, R. E.: Regional Characteristics of Variability in the Northern Hemisphere Wintertime Polar Front Jet and Subtropical Jet in Observations and CMIP6 Models, J. Geophys. Res.-Atmos., 126, e2021JD034876, https://doi.org/10.1029/2021JD034876, 2021.
Long, C. S., Fujiwara, M., Davis, S., Mitchell, D. M., and Wright, C. J.: Climatology and interannual variability of dynamic variables in multiple reanalyses evaluated by the SPARC Reanalysis Intercomparison Project (S-RIP), Atmos. Chem. Phys., 17, 14593–14629, https://doi.org/10.5194/acp-17-14593-2017, 2017.
Luan, L., Staten, P. W., Ao, C. O., and Fu, Q.: Seasonal and Annual Changes of the Regional Tropical Belt in GPS-RO Measurements and Reanalysis Datasets, J. Climate, 33, 4083–4094, https://doi.org/10.1175/JCLI-D-19-0671.1, 2020.
Luntama, J.-P., Kirchengast, G., Borsche, M., Foelsche, U., Steiner, A., Healy, S., Engeln, A. von, O'Clerigh, E., and Marquardt, C.: Prospects of the EPS GRAS Mission For Operational Atmospheric Applications, B. Am. Meteorol. Soc., 89, 1863–1876, https://doi.org/10.1175/2008BAMS2399.1, 2008.
Manney, G. L. and Hegglin, M. I.: Seasonal and Regional Variations of Long-Term Changes in Upper-Tropospheric Jets from Reanalyses, J. Climate, 31, 423–448, https://doi.org/10.1175/JCLI-D-17-0303.1, 2018.
Martin, E. R., Homeyer, C. R., McKinzie, R. A., McCarthy, K. M., and Xian, T.: Regionally Varying Assessments of Upper-Level Tropical Width in Reanalyses and CMIP5 Models Using a Tropopause Break Metric, J. Climate, 33, 5885–5903, https://doi.org/10.1175/JCLI-D-19-0629.1, 2020.
Mathew, S. S. and Kumar, K. K.: Estimation of Zonally Resolved Edges of the Tropical Belt Using GPS-RO Measurements, IEEE J. Sel. Top. Appl., 11, 2555–2561, https://doi.org/10.1109/JSTARS.2018.2828342, 2018.
Meng, L., Liu, J., Tarasick, D. W., Randel, W. J., Steiner, A. K., Wilhelmsen, H., Wang, L., and Haimberger, L.: Continuous rise of the tropopause in the Northern Hemisphere over 1980–2020, Science Advances, 7, eabi8065, https://doi.org/10.1126/sciadv.abi8065, 2021.
Menzel, M. E., Waugh, D., and Grise, K.: Disconnect Between Hadley Cell and Subtropical Jet Variability and Response to Increased CO2, Geophys. Res. Lett., 46, 7045–7053, https://doi.org/10.1029/2019GL083345, 2019.
Menzel, M. E., Waugh, D. W., and Orbe, C.: Connections between Upper Tropospheric and Lower Stratospheric Circulation Responses to Increased CO2, J. Climate, 36, 4101–4112, https://doi.org/10.1175/JCLI-D-22-0851.1, 2023.
Menzel, M. E., Waugh, D. W., Wu, Z., and Reichler, T.: Replicating the Hadley cell edge and subtropical jet latitude disconnect in idealized atmospheric models, Weather Clim. Dynam., 5, 251–261, https://doi.org/10.5194/wcd-5-251-2024, 2024.
Nguyen, H., Hendon, H. H., Lim, E.-P., Boschat, G., Maloney, E., and Timbal, B.: Variability of the extent of the Hadley circulation in the southern hemisphere: a regional perspective, Clim. Dynam., 50, 129–142, https://doi.org/10.1007/s00382-017-3592-2, 2018.
Nimac, I., Danzer, J., and Kirchengast, G.: The added value and potential of long-term radio occultation data for climatological wind field monitoring, Atmos. Meas. Tech., 18, 265–286, https://doi.org/10.5194/amt-18-265-2025, 2025.
Parker, W. S.: Reanalyses and Observations: What's the Difference?, B. Am. Meteorol. Soc., 97, 1565–1572, https://doi.org/10.1175/BAMS-D-14-00226.1, 2016.
Pikovnik, M. and Zaplotnik, Ž.: The Changes of the Northern Hadley Cell Strength in Reanalyses and Radiosonde Observations, arXiv [preprint], https://doi.org/10.48550/arXiv.2503.05331, 14 May 2025.
Scherllin-Pirscher, B., Kirchengast, G., Steiner, A. K., Kuo, Y.-H., and Foelsche, U.: Quantifying uncertainty in climatological fields from GPS radio occultation: an empirical-analytical error model, Atmos. Meas. Tech., 4, 2019–2034, https://doi.org/10.5194/amt-4-2019-2011, 2011.
Scherllin-Pirscher, B., Steiner, A. K., and Kirchengast, G.: Deriving dynamics from GPS radio occultation: Three-dimensional wind fields for monitoring the climate, Geophys. Res. Lett., 41, 7367–7374, https://doi.org/10.1002/2014GL061524, 2014.
Scherllin-Pirscher, B., Steiner, A. K., Kirchengast, G., Schwärz, M., and Leroy, S. S.: The power of vertical geolocation of atmospheric profiles from GNSS radio occultation, J. Geophys. Res.-Atmos., 122, 1595–1616, https://doi.org/10.1002/2016JD025902, 2017.
Scherllin-Pirscher, B., Steiner, A. K., Anthes, R. A., Alexander, M. J., Alexander, S. P., Biondi, R., Birner, T., Kim, J., Randel, W. J., Son, S.-W., Tsuda, T., and Zeng, Z.: Tropical Temperature Variability in the UTLS: New Insights from GPS Radio Occultation Observations, J. Climate, 34, 2813–2838, https://doi.org/10.1175/JCLI-D-20-0385.1, 2021.
Schulzweida, U.: CDO User Guide, Version 2.3.0, Zenodo, https://doi.org/10.5281/zenodo.10020800, 2023.
Schwendike, J., Govekar, P., Reeder, M. J., Wardle, R., Berry, G. J., and Jakob, C.: Local partitioning of the overturning circulation in the tropics and the connection to the Hadley and Walker circulations, J. Geophys. Res.-Atmos., 119, 1322–1339, https://doi.org/10.1002/2013JD020742, 2014.
Sharmila, S. and Walsh, K. J. E.: Recent poleward shift of tropical cyclone formation linked to Hadley cell expansion, Nat. Clim. Change, 8, 730–736, https://doi.org/10.1038/s41558-018-0227-5, 2018.
Staten, P., Lu, J., Grise, K., Davis, S., and Birner, T.: Re-examining tropical expansion, Nat. Clim. Change, 8, 768–775, https://doi.org/10.1038/s41558-018-0246-2, 2018.
Staten, P. W., Grise, K. M., Davis, S. M., Karnauskas, K., and Davis, N.: Regional Widening of Tropical Overturning: Forced Change, Natural Variability, and Recent Trends, J. Geophys. Res.-Atmos., 124, 6104–6119, https://doi.org/10.1029/2018JD030100, 2019.
Steiner, A. K., Hunt, D., Ho, S.-P., Kirchengast, G., Mannucci, A. J., Scherllin-Pirscher, B., Gleisner, H., von Engeln, A., Schmidt, T., Ao, C., Leroy, S. S., Kursinski, E. R., Foelsche, U., Gorbunov, M., Heise, S., Kuo, Y.-H., Lauritsen, K. B., Marquardt, C., Rocken, C., Schreiner, W., Sokolovskiy, S., Syndergaard, S., and Wickert, J.: Quantification of structural uncertainty in climate data records from GPS radio occultation, Atmos. Chem. Phys., 13, 1469–1484, https://doi.org/10.5194/acp-13-1469-2013, 2013.
Steiner, A. K., Ladstädter, F., Ao, C. O., Gleisner, H., Ho, S.-P., Hunt, D., Schmidt, T., Foelsche, U., Kirchengast, G., Kuo, Y.-H., Lauritsen, K. B., Mannucci, A. J., Nielsen, J. K., Schreiner, W., Schwärz, M., Sokolovskiy, S., Syndergaard, S., and Wickert, J.: Consistency and structural uncertainty of multi-mission GPS radio occultation records, Atmos. Meas. Tech., 13, 2547–2575, https://doi.org/10.5194/amt-13-2547-2020, 2020a.
Steiner, A. K., Ladstädter, F., Randel, W. J., Maycock, A. C., Fu, Q., Claud, C., Gleisner, H., Haimberger, L., Ho, S.-P., Keckhut, P., Leblanc, T., Mears, C., Polvani, L. M., Santer, B. D., Schmidt, T., Sofieva, V., Wing, R., and Zou, C.-Z.: Observed Temperature Changes in the Troposphere and Stratosphere from 1979 to 2018, J. Climate, 33, 8165–8194, https://doi.org/10.1175/JCLI-D-19-0998.1, 2020b.
Waugh, D. W., Grise, K. M., Seviour, W. J. M., Davis, S. M., Davis, N., Adam, O., Son, S.-W., Simpson, I. R., Staten, P. W., Maycock, A. C., Ummenhofer, C. C., Birner, T., and Ming, A.: Revisiting the Relationship among Metrics of Tropical Expansion, J. Climate, 31, 7565–7581, https://doi.org/10.1175/JCLI-D-18-0108.1, 2018.
Wickert, J., Reigber, C., Beyerle, G., König, R., Marquardt, C., Schmidt, T., Grunwaldt, L., Galas, R., Meehan, T. K., Melbourne, W. G., and Hocke, K.: Atmosphere sounding by GPS radio occultation: First results from CHAMP, Geophys. Res. Lett., 28, 3263–3266, https://doi.org/10.1029/2001GL013117, 2001.
WMO (World Meteorological Organization): Meteorology – A three-dimensional science: Second session of the commission for aerology, WMO Bulletin, 4, 134–138, https://library.wmo.int/idurl/4/42003 (last access: 26 November 2025), 1957.
WMO-OSCAR: Observing Systems Capability Analysis and Review Tool OSCAR, World Meteorological Organization (WMO): Variable: Wind (horizontal), https://space.oscar.wmo.int/variables/view/wind_horizontal, last access: 26 November 2025.
Woollings, T., Hannachi, A., and Hoskins, B.: Variability of the North Atlantic eddy-driven jet stream, Q. J. Roy. Meteor. Soc., 136, 856–868, https://doi.org/10.1002/qj.625, 2010.
Xian, T., Xia, J., Wei, W., Zhang, Z., Wang, R., Wang, L.-P., and Ma, Y.-F.: Is Hadley Cell Expanding?, Atmosphere, 12, 1699, https://doi.org/10.3390/atmos12121699, 2021.
Yessimbet, K., Steiner, A. K., Ladstädter, F., and Ossó, A.: Observational perspective on sudden stratospheric warmings and blocking from Eliassen–Palm fluxes, Atmos. Chem. Phys., 24, 10893–10919, https://doi.org/10.5194/acp-24-10893-2024, 2024.
Zeng, J., Sokolovskiy, S., Schreiner, W., and Hunt, D.: Representation of vertical atmospheric structures by radio occultation observations in the UTLS: comparison to high resolution radiosonde profiles, J. Atmos. Ocean. Tech., 36, 655–670, https://doi.org/10.1175/JTECH-D-18-0105.1, 2019.
Zou, L., Hoffmann, L., Müller, R., and Spang, R.: Variability and trends of the tropical tropopause derived from a 1980–2021 multi-reanalysis assessment, Front. Earth Sci., 11, 1177502, https://doi.org/10.3389/feart.2023.1177502, 2023.