the Creative Commons Attribution 4.0 License.
the Creative Commons Attribution 4.0 License.
Investigating the influence of changing ice surfaces on gravity wave formation impacting glacier boundary layer flow with large-eddy simulations
Brigitta Goger
Ivana Stiperski
Matthis Ouy
Lindsey Nicholson
Mountain glaciers are located in highly complex terrain, and their local microclimate is influenced by mountain boundary layer processes and dynamically induced gravity waves. Previous observations from turbulence flux towers, as well as large-eddy simulations, over the Hintereisferner (HEF) glacier in the Austrian Alps have shown that down-glacier winds are often disturbed by cross-glacier flow from the north-west associated with gravity waves. In this work, we explore how changing the ice surface coverage upstream of HEF influences this gravity wave formation and intensity and the feedback that this has on boundary layer flow over HEF. In semi-idealized large-eddy simulations, we explore the impact of changing surface properties on HEF's microclimate by removing the upstream glaciers only (NO_UP) and removing all ice surfaces (NO_GL). Simulations suggest that removing the upstream glaciers (which causes a change in boundary layer stratification from stable to unstable) leads to a weaker gravity wave that breaks earlier than in the reference simulation, resulting in enhanced turbulent mixing over HEF. As a consequence, this leads to higher temperatures over the HEF tongue. Removing all glaciers results – as expected – in higher temperatures of up to 5 K over the missing ice surfaces, while the gravity wave pattern is similar to that in the NO_UP simulation, indicating that the upstream boundary layer exerts dominant control over downstream responses in such highly dynamic conditions. Furthermore, the results show that the upstream glaciers have a stabilizing effect on the boundary layer, impacting gravity wave formation, downslope windstorm intensity, and their feedback on the flow structure in valleys downstream. This case study shows that a single glacier tongue is not isolated from its environment under strong synoptic forcing and that surrounding glaciers and local topography have to be taken into account when studying atmosphere–cryosphere exchange processes.
- Article
(19956 KB) - Full-text XML
- BibTeX
- EndNote
The Earth's mountainous regions are important sources of global freshwater and are strongly affected by climate change and elevation-dependent warming (Hock et al., 2022; Byrne et al., 2024; Pepin et al., 2022). In recent years, the European mountain cryosphere (permafrost, glaciers, snow) has undergone significant change (Beniston et al., 2018), with decreasing overall snow depths (Matiu et al., 2021) and rapid and accelerating glacier recession (e.g. Voordendag et al., 2023; Cremona et al., 2023; Rounce et al., 2023). While there is a clear scientific consensus regarding the large-scale patterns of glacier recession, there is still a knowledge gap related to how glacier shrinkage influences the mountain boundary layer (MoBL; Lehner and Rotach, 2018) and how that in turn will influence subsequent glacier melt (Beniston et al., 2018).
The MoBL represents a complex multiscale interaction between the surface, complex heterogeneous topography, and the atmosphere aloft, with MoBL processes occurring on timescales of 1 h to several hours (Rotach and Zardi, 2007; Lehner, 2024; Pfister et al., 2024). Some of the major features of the MoBL are thermally induced circulation at multiple scales, from slope flows to valley winds up to Alpine pumping (Zardi and Whiteman, 2013; Goger and Dipankar, 2024), which together can influence the exchange of heat, mass, and momentum between the surface and the free atmosphere. European glaciers are located in mountainous terrain, and although they develop their own microclimate with persistent katabatic down-glacier flows, they are also affected by valley winds and/or the larger-scale synoptic flows (Oerlemans, 2010; Potter et al., 2018). Under a warming climate, recent observations and modelling over the Haut glacier d'Arolla in the Swiss Alps suggest that with decreasing glacier ice area, the thermally induced up-valley flow progressively dominates the glacier microclimate and ultimately might contribute to increased melting (Shaw et al., 2023, 2024). Conway et al. (2021) suggest that local glacier boundary layer flow is also influenced by local breeze systems induced by larger ice fields nearby (ice field breezes) and that a single glacier tongue is not isolated from its environment.
Besides thermally induced flows, larger-scale synoptic forcing has a non-negligible impact on local glacier boundary layers (e.g. Litt et al., 2017; Mott et al., 2020). When stratified flow is displaced vertically by topography, it is forced to leave its hydrostatic equilibrium, leading to the formation of gravity waves, more specifically lee waves (e.g. if an inversion or a decrease in the Scorer parameter with height is present; Scorer, 1949), where the lee wave amplitude depends on the topography height, shape, and upstream profiles of vertical wind shear and atmospheric stability (Jackson et al., 2013). Gravity waves are common over the Alps (Jiang and Doyle, 2004), and large-amplitude gravity waves can lead to supercritical flow in the lee of mountains, resulting in downslope windstorms (e.g. föhn winds; Gohm and Mayr, 2004). The supercritical flow can form due to wave breaking aloft (visualized as overturning isentropes and associated with severe turbulence) or along an inversion; can plunge into valleys, interacting with the local boundary layer and modifying its spatiotemporal structure (Jiang et al., 2006; Adler and Kalthoff, 2016; Kalthoff et al., 2020; Haid et al., 2022); and under appropriate conditions can lead to boundary layer separation (French et al., 2015; Grubišić et al., 2015) and turbulent flow reversal at the surface, associated with the formation of atmospheric rotors (Grubišić et al., 2008; Strauss et al., 2015; Vosper et al., 2018). Because melting glaciers exhibit a constant surface temperature of 0 °C and are comparatively smoother than ice-free mountainous areas, glaciers can themselves influence the very formation of gravity waves. In a study of föhn flow over the Larsen C ice shelf, Antarctica, Turton et al. (2018) hypothesize that upstream ice surfaces influence the isentrope drawdown in downslope windstorms. A numerical sensitivity study over Hofsjökull ice cap, Iceland, suggests that downslope windstorms are stronger due to the stabilizing effect of the ice surfaces on gravity waves, while removing the ice cap from the simulation domain led to weaker gravity waves (Jonassen et al., 2014); the authors attribute this pattern change mostly to different surface roughness with a minimal effect of temperature change.
Many of the aforementioned phenomena were observed during the Hintereisferner experiment (HEFEX, Mott et al., 2020), a measurement campaign at the Hintereisferner (HEF) glacier, Austrian Alps. Along- and across-glacier transects of eddy-covariance (EC) stations allowed the analysis of spatial heat advection patterns. The distinct katabatic down-glacier flow was often disturbed by lateral (cross-glacier) flow in 20 % of the data. Within the HEFEX observational set-up, the reason for these disturbances could not be immediately identified, and one of the major questions was the origin of this cross-glacier flow. A large-eddy-simulation (LES) set-up was used to investigate the nature and source of these cross-glacier disturbances (Goger et al., 2022). With a horizontal mesh size of 48 m, the model was able to simulate mesoscale wind patterns on the glacier for both summer and winter successfully, but small-scale glacier boundary layer features were not resolved accurately (e.g. the katabatic down-glacier flow; Goger et al., 2022; Voordendag et al., 2024).
Under north-westerly synoptic flow, the simulation showed that a gravity wave forms upstream of HEF over the surrounding smaller glaciers. In agreement with the observations, the LES showed that this gravity wave was responsible for the erosion of the glacier boundary layer over the glacier tongue. However, the role of the upstream glaciers in gravity wave formation that influences these cross-glacier disturbances remains unclear. Given the influence of boundary layer type on the gravity wave response, we hypothesize that the upstream glaciers have a crucial influence on the flow on HEF. In the follow-on study presented here, we therefore expand on the Hintereisferner case study under north-westerly flow from Goger et al. (2022) by replacing upstream glacier surfaces with bare rock in a semi-idealized set-up to address the following research questions.
-
What is the impact of removing upstream glacier surfaces on gravity wave formation, breaking, and associated downstream flow structure on the HEF glacier?
-
How are surface exchange and temperature patterns on the glacier influenced by the modified flow structure after removing upstream glacier surfaces?
The paper is organized as follows: in Sect. 2, we describe the area of interest, our model set-up, and the analyses presented. The results are presented in two sections: Sect. 3 describes the impact of the changing ice surfaces on the wind structure and upstream profiles, followed by Sect. 4, where we investigate the impact of the missing upstream glaciers on the sensible heat fluxes, advection patters, heat budget, and 2 m temperatures on the (remaining) glacier, before we discuss the results and conclude.
2.1 The Hintereisferner (HEF) glacier
Hintereisferner (HEF) is a large valley glacier in the Ötztal Alps, Austria. In 2018 (the year of our case study), HEF was around 6.3 km long, descending from its highest point, Weißkugel (3738 m a.m.s.l., metres above mean sea level), to 2460 m a.m.s.l., where the glacier tongue terminates. The glacier has been subject to continuous mass balance monitoring and meteorological observations for more than 70 years (Obleitner, 1994; Strasser et al., 2018) and is one of the benchmark glaciers of the World Glacier Monitoring Network (WGMS, 2017). The glacier, the same as the rest of the European mountain cryosphere (Beniston et al., 2018), has been affected by persistent and accelerating mass loss since the 1980s. While HEF has lost around 1 m of ice thickness per year over the last 20 years (Piermattei et al., 2024), extreme mass loss has been observed in some recent years (−3319 kg m−2 in 2022, 3.2 times higher than the long-term mean for 1991–2020; Voordendag et al., 2023). The HEFEX campaign took place on the glacier in the summer of 2018 (Mott et al., 2020), revealing persistent katabatic down-glacier flow but also frequent intrusions from the north-west (20 % of observation data), leading to erosion of the glacier boundary layer. These disturbances were investigated by Goger et al. (2022) using numerical simulations, revealing gravity waves over the north-western ridge to be the major mechanism behind the intrusions into the katabatic flow.
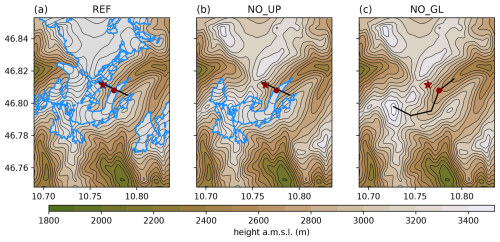
Figure 1Overview of the model topography of the innermost domain (colours and contour lines) and the glacier outlines (light blue) for (a) the reference run with realistic glacier outlines (REF), (b) no upstream glaciers (NO_UP), and (c) no glaciers at all (NO_GL). The black lines show the cross-section lines used in the analysis, the red dot shows the location of the HEF tongue, and the red star shows the upstream location used in the discussion of the results.
Table 1Surface parameters from the CORINE dataset for the two land use categories, snow or ice and bare rock, for the summer season, following Pineda et al. (2004).

2.2 Numerical model
We employ the Weather Research and Forecasting (WRF) model version 4.1 (Skamarock et al., 2019) for our numerical study. Most of the model set-up is as in Goger et al. (2022); therefore, we only repeat the most relevant information for the present study. We use a nested set-up consisting of four domains, where the outermost domain spans Europe, with Δx=6 km, and receives ERA5 reanalyses (Hersbach et al., 2020) as boundary and initial conditions. We subsequently decrease the domain sizes to Δx=1 km, Δx=240 m, and to the innermost domain at Δx=48 m (Goger et al., 2022, their Fig. 1b). The lowest model level in the innermost domain is at 7 m, resulting in the lowest model half-level height of z=3.5 m. We use the Thompson microphysics (Thompson et al., 2008), the MM5 revised surface layer scheme (Jiménez et al., 2012), and the RRTMG two-stream radiation scheme (Iacono et al., 2008), with topographic shading for all domains. We switch off the boundary layer parameterization in the two innermost domains and employ the turbulence closure following Deardorff (1980). Since the boundary layer flow is of a turbulent nature, we utilize the online averaging module WRF LES diagnostics by Umek (2020) and create 15 min averages of selected model variables.
The reference simulation (REF) is a real-case simulation of the glacier boundary layer from 17 August 2018 (Fig. 1a), where the synoptic flow direction was mostly north-westerly, resulting in sustained disturbance of the glacier boundary layer (Goger et al., 2022, their north-west day case study). For this study, we conduct two additional sensitivity simulations of domain 3 (Δx=240 m) and domain 4 (Δx=48 m) with changes in glacier ice surfaces: for the first sensitivity run, we replace the upstream glacierized area north of HEF (NO_UP, Fig. 1b), with the land use category of the surroundings, namely bare rock, while the topography remains the same. For the second sensitivity run, we replace all glacier surfaces in the domain, including HEF, with the bare rock land category (NO_GL, Fig. 1c). Table 1 shows the differences in surface parameters between the two land use categories according to Pineda et al. (2004).
At this point, we want to mention that the two sensitivity runs do not represent realistic glacier surfaces under future climate projections (Zekollari et al., 2019) because these projections predict continuous shrinkage of all ice surfaces instead of removing the entire upstream glaciers, as is the case in our NO_UP run. Furthermore, real-world glacier recession progresses from lower to higher elevations, while our case study involves the unrealistic removal of the high-elevation ice surrounding HEF. However, the aim of this study is not to investigate the glacier boundary layer development under future climate scenarios but rather to isolate and explore the role of the upstream glacier land cover on the local boundary layer over HEF and the associated surface exchange. Therefore, we consider the NO_UP and NO_GL runs to be semi-idealized simulations. All simulations were initialized on 17 August at 03:00 UTC and ran for 18 h. All further time information in this publication refers to UTC, so we will omit UTC at all further occurrences. The first 3 h of simulation time are considered model spin-up (while the land use remains constant for the entire simulation time) because our phenomena of interest (gravity waves, boundary layer processes) have timescales of 1 h or less. We investigate the time period from 06:00 until 12:00 because REF delivered the most reliable results in comparison with observations from the HEFEX campaign during this time period (Goger et al., 2022). REF starts to deviate from the observations after 12:00 (Goger et al., 2022, their Fig. 2) due to the well-known scale separation problem in LES (Schemann et al., 2020; Umek et al., 2021). This time period is relatively short, but since observations suggest that the situation over the glacier does not change drastically from 12:00 until sunset, an extended analysis does not bring new insights. Since we analyse a situation dominated by dynamically induced processes, we assume that thermal effects, such as the thermally induced valley flow circulation, are secondary. Furthermore, we only show the output of domain 4 for our analysis, and any numerical data mentioned will stem from this domain at Δx=48 m.
At the current horizontal grid spacing (Δx=48 m), not all scales in the LES are resolved equally well. As for all real-case LESs, the scale separation problem (isolating the smaller from the larger scales) is inherent (Schemann et al., 2020). This leads to a better representation of the larger scales (e.g. the dynamically induced gravity wave), which is also evident in the north-west day simulation of Goger et al. (2022), where they noted too strong erosion of the glacier boundary layer by the gravity wave. Furthermore, we cannot expect that the small-scale stable boundary layer over HEF is resolved accordingly (both in the vertical and horizontal), because according to Cuxart (2015), horizontal grid spacing of less than 10 m is necessary to simulate stable boundary layers in a realistic way. Still, since we focus in this study mostly on dynamically driven processes, we think that we can provide important information regarding the impact of gravity wave formation on the glacier boundary layer flow development.
2.3 Analyses performed
2.3.1 Cross-sections
The atmospheric structures of the different simulations are presented as vertical slices along the transects shown in Fig. 1, and the vertical profiles of the atmosphere are also presented for the two locations marked: at the edge of the upstream glaciers and over the HEF glacier tongue.
2.3.2 Scorer parameter
To explore how the upstream profiles influence gravity wave formation, we show vertical profiles of potential temperature, wind speed, wind direction, and the Scorer parameter (Scorer, 1949) from the HEF tongue and from a point located over the upstream glaciers (upstream) in Fig. 4. The Scorer parameter is used to check whether atmospheric conditions are favourable for gravity wave formation and is defined as
dependent on the height z; U=U(z) is the vertical profile of the horizontal wind, and N=N(z) is the Brunt-Väisälä frequency:
with θ as the potential temperature and g the acceleration due to gravity. When l2(z) decreases or changes strongly with height (e.g. the existence of an inversion or increasing wind speed with height), conditions are favourable for the formation of trapped lee waves.
2.3.3 Up-valley wind index (UWI) and flow channelling
To disentangle the dynamical mechanisms related to the wind direction differences within the HEF valley and aloft due to changes in synoptic flow, we first compute the up-valley wind index (UWI) based on the wind direction, developed by Shaw et al. (2023) as follows:
where wdir is the wind direction at 10 m above the ground at the HEF tongue (while Shaw et al., 2023 used observations from 2 m above the ground), and ϕ is the orientation of the glacier valley (in our case, 45°). When UWI =1, the flow is exactly up-glacier, while UWI ≈0.5 indicates cross-glacier flow, and UWI ≈0 implies down-glacier flow. While the UWI gives an overview of the wind direction over the glacier, it does not give information on the kind of atmospheric forcing that leads to the wind direction shift.
Whiteman and Doran (1993) defined four scenarios of interactions between the (synoptic) flow aloft and the flow within a valley: thermally driven forcing, downward momentum transport by gravity waves, forced channelling, and pressure-driven channelling. To learn which forcing is responsible for the wind direction in the glacier valley in our simulations, the wind direction of the synoptic flow aloft (in our case the upstream location) and the wind direction of the valley flow can be compared via a scatter plot. The resulting pattern shows whether the flow falls into one of the four categories of Whiteman and Doran (1993, their Fig. 1).
2.3.4 Heat advection patterns and heat budget
Observations and numerical simulations agree that the local flow patterns over HEF strongly affect the heat transport and advection processes over the glacier tongue (Mott et al., 2020; Goger et al., 2022; Haugeneder et al., 2024). Therefore, in order to assess the sensitivity of heat transport to the changed glacier surface cover, we calculate the horizontal temperature advection as in Goger et al. (2022):
where Δs is the distance between the stations, Δθ is the temperature difference, and is the average horizontal wind speed. In order to consider the total vertical heat budget, we calculate the temperature tendency equation (Wyngaard, 2010):
with temperature advection with the mean wind in all three directions (u is zonal, v meridional, and w vertical) and the vertical heat flux divergence. Here, the turbulent sensible heat flux contains both the resolved and subgrid-scale (SGS) contributions. We neglect the radiative flux divergence because we consider it small during daytime. Horizontal averages are taken over Δx=48 m.
2.3.5 Resulting temperature on the glacier
Finally, the impact of changing the ice surface extent on the simulated 2 m temperature is assessed. We choose the diagnostic 2 m temperature instead of the skin temperature because the skin temperature is constant at 0 °C over the melting glacier. The 2 m temperature calculation is based on Eq. (4) from Jiménez et al. (2012):
where Tg is the skin temperature, Ta is the temperature from the lowest model level, z0 is the roughness length, L is the Obukhov length, and ψh is the exchange coefficient for heat provided by the model's surface layer scheme. Therefore, the 2 m temperature considers the state of the near-surface boundary layer and therefore gives more detailed information than, e.g. air temperature from the lowest model level. Still, we have to keep in mind that the expression calculating 2 m temperature in the model's surface layer scheme (Jiménez et al., 2012) relies on the Monin–Obukhov similarity theory (MOST; Monin and Obukhov, 1954), which breaks down in katabatic flows (Grisogono et al., 2007) and is in need of substantial revision (Stiperski and Calaf, 2023). However, we consider its application reasonable in our case, as we do not observe katabatic glacier winds in our time period of interest (Mott et al., 2020; Goger et al., 2022).
The reference simulation (REF) is a real-case simulation of the glacier boundary layer from 17 August 2018. Under north-westerly synoptic influence, a gravity wave formed over the north-western ridge close to HEF, leading to a continuous disturbance of the glacier boundary layer. The case study day was dominated by cross-glacier flow and high values of non-stationarity (Mahrt, 1998) of the sensible heat flux during gravity wave breaking episodes and a strong mesoscale influence on the glacier boundary layer. Due to the aforementioned phenomena, the local glacier boundary layer is heavily disturbed in both simulations and observations, and no katabatic down-glacier flow is present.
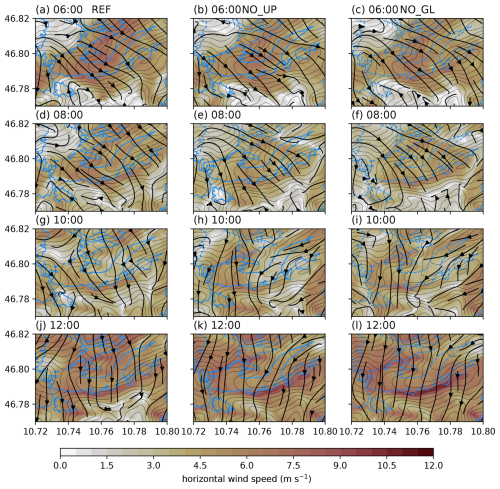
Figure 2Simulated flow structure with 10 m horizontal wind speed (colour gradient) and streamlines (black arrows) at four different times (06:00, a–c; 08:00, d–f; 10:00, g–i; and 12:00, j–l). The left row is REF, the middle is NO_UP, and the right row is NO_GL. The blue contours represent the glacier outlines in the simulations, while dashed blue lines indicate the locations of the missing ice surfaces. The thin black contours show model topography.
3.1 Spatial patterns of the wind field
A comparison of 10 m horizontal wind speeds between the REF, NO_UP, and NO_GL simulations reveals differences in the flow structure over the glacier dependent on the time of day (Fig. 2). In the morning (06:00, Fig. 2a–c), cross-glacier flow with wind speeds of around 6 m s−1 dominates in all three simulations. In the REF simulation, this cross-glacier flow is present throughout the simulation. In the NO_UP and NO_GL simulations, however, we note the weakening of the cross-glacier flow, visible in reduced wind speeds after 08:00 (Fig. 2e, f). While the cross-glacier flow prevails with reduced wind speeds in the REF simulation at 10:00 (Fig. 2g), the NO_UP and NO_GL simulations show an up-glacier flow dominating the wind field at the glacier tongue (Fig. 2h, i). This up-glacier flow persists until 12:00 (Fig. 2k, l), together with a horizontal wind speed maximum at the north-facing slope next to the glacier.
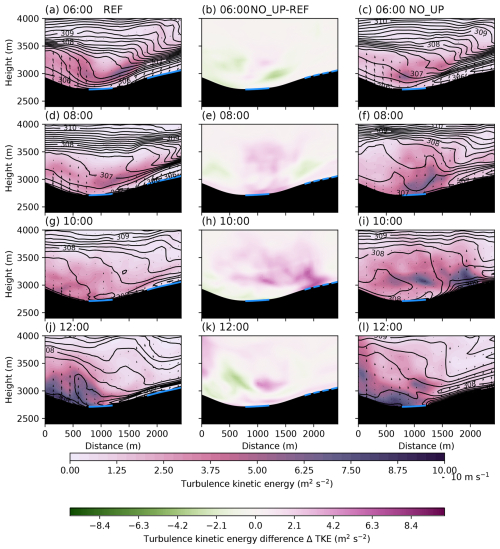
Figure 3Vertical cross-section along the black line in Fig. 1b (looking up the valley) of simulated total TKE (subgrid and resolved, colours), isentropes (black contours), and cross-valley wind speed (arrows) from REF (left column), NO_UP (right column), and the difference in TKE from NO_UP − REF (middle column) at four different times (06:00, a–c; 08:00, d–f; 10:00, g–i; and 12:00, j–l). The solid blue lines show glacier surfaces, while dashed blue lines indicate the locations of the glacier surfaces that were removed.
3.2 Vertical structure of the upstream flow and above HEF
Although the surface flow showed similar characteristics in the different simulations at 06:00, the vertical cross-sections show some marked differences. In the REF simulation, the cross-section of steepening isentropes at around 3500 m a.m.s.l. in the HEF valley at 06:00 reveals a gravity wave with hydraulic jump-like features (Fig. 3a), with an elevated turbulence kinetic energy (TKE) maximum around 200 m above the surface. The overturning isentropes in the NO_UP simulation (Fig. 3c) indicate wave breaking with reduced near-surface static stability and a weaker TKE maximum (ΔTKE m2 s−2), while the general structure of the gravity wave is similar to that in REF. The isentropes overturn 2 h later (08:00) in the REF simulation as well (Fig. 3d), while the gravity wave in the NO_UP simulation has already broken, with reduced upstream stability under the influence of surface friction (Fig. 3f). The strong turbulent mixing over the HEF tongue, with higher TKE values, is evident in NO_UP compared to REF (Fig. 3e). At 10:00, the gravity wave in REF is breaking as well (Fig. 3g), while NO_UP shows no distinct gravity wave pattern anymore according to the isentropes (Fig. 3i) with strong turbulent mixing and higher TKE values that are present over the HEF tongue (Fig. 3h). At 12:00, the highest TKE values are present over the glacier in REF, and the gravity wave re-established itself with a distinct dynamically forced downslope flow (Fig. 3j), while in the NO_UP simulation, reduced stability is visible upstream in association with a much weaker gravity wave (Fig. 3i) and reduced TKE values (Fig. 3k). To summarize, a gravity wave is present in both simulations, breaking over the HEF glacier valley. However, in the NO_UP simulation, the gravity wave is weaker and has a different breaking pattern, leading to higher TKE values and enhanced mixing over the glacier tongue. In the NO_GL simulations, the general structure and gravity wave formation are similar to those of the NO_UP simulation (Fig. A1). Therefore, we conclude that most of the gravity wave's dynamics is governed by the upstream glaciers and not by HEF itself.
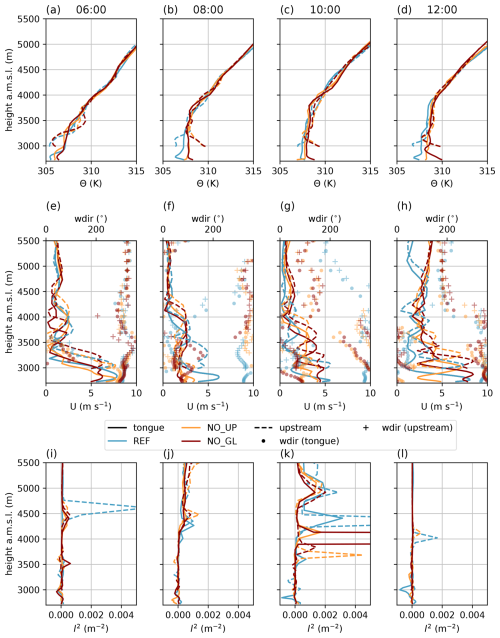
Figure 4Vertical profiles of potential temperature (a–d), horizontal wind speed and direction (e–h), and the Scorer parameter (i–l) from REF (blue), NO_UP (orange), and NO_GL (red) from two locations, the HEF tongue (solid lines, red point in Fig. 1) and upstream (dashed lines, red star in Fig. 1), at four different times of the day.
Next, we consider the time evolution of the vertical profiles of the atmosphere at the upstream location and at the HEF tongue. In all simulations at 06:00, the potential temperature profile at the HEF tongue reveals a stable boundary layer (Fig. 4a) that differs from the stratification further aloft at both locations (the HEF tongue and upstream) in accordance with a jet-like cross-glacier flow (Fig. 4e). The only difference between REF and the simulations without the upstream glaciers is the strength of the jet maximum. At the upstream location, north-westerly flow has already become established at 06:00, and potential temperature profiles are stably stratified in all simulations. The Scorer parameter (Eq. 1, Fig. 4i) shows, as expected, local maxima close to the inversions (Fig. 4a), except for one peak in the REF simulation at the upstream location that favours gravity wave formation.
Differences start to emerge between the simulations 2 h later: at the upstream location, the near-surface potential temperature difference is up to 4 K, and the profiles in the simulations without the upstream glaciers now show unstable stratification (and a convective boundary layer) compared to the neutral profile at this time in the REF simulation that is forming under the influence of the gravity wave. The Scorer parameter shows almost no favourable conditions for gravity wave formation in accordance with the weakened gravity wave visible in the cross-sections at 08:00 (Fig. 3b, f). At the HEF tongue, potential temperature values within ≈600 m above the surface are higher by 2 K in NO_UP and NO_GL simulations compared to those in REF (Fig. 4b). The wind speeds show a less distinct jet in the simulations without the upstream glaciers, while there is still a distinct low-level jet maximum in REF over the HEF tongue (Fig. 4f).
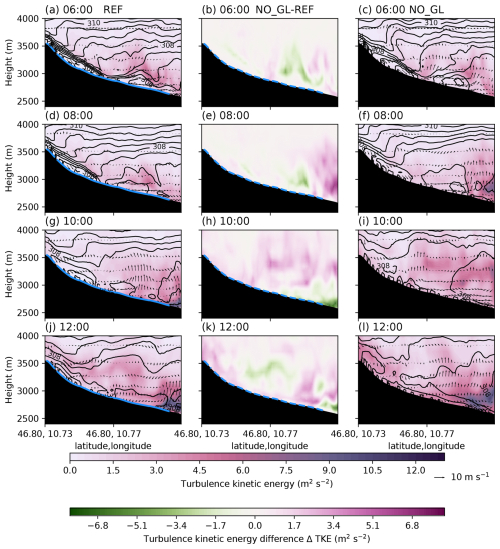
Figure 5Vertical cross-section along the line in Fig. 1c of simulated total TKE (colours), isentropes (black contours), and along-valley wind speed (arrows) from REF (left column), NO_GL (right column), and the difference in TKE from NO_GL − REF (middle column) at four different times (06:00, a–c; 08:00, d–f; 10:00, g–i; and 12:00, j–l). The solid blue lines show glacier surfaces, while dashed blue lines indicate the location of the glacier surfaces that were removed.
At 10:00, the flow is north-westerly at the upstream location in all simulations, and the potential temperature profiles (Fig. 4c) show a similar picture as at 08:00 at both locations; however, the wind direction over the glacier tongue now reveals a distinct up-valley flow in the NO_UP and NO_GL simulations (Fig. 4g), while the flow remains cross-glacier in the REF simulation. The Scorer parameter again shows favourable conditions for gravity wave formation, which are strongest in the REF simulation (Fig. 4k).
Finally, at 12:00, there are clear differences in the potential temperature profiles close to the surface: at the HEF tongue, we note a convective boundary layer in NO_GL, while there is mostly neutral stratification in REF and NO_UP (Fig. 4d). The wind patterns (Fig. 4h) show chaotic behaviour at the HEF tongue due to the gravity wave breaking and strong turbulence (Fig. 3), while it is clear that the synoptic flow from aloft changes direction below 4000 m a.m.s.l., and all simulations now show up-glacier flow. Upstream, there is still stable stratification in REF, while the simulations without the upstream glaciers show neutral or convective boundary layers. The Scorer parameter again reveals no favourable signs for gravity wave formation (Fig. 4l).
Since we noted distinct up-valley flow in the simulations without the upstream glaciers (NO_UP and NO_GL), we also explore the vertical structure of the atmosphere along the glacier (Fig. 5). In the REF simulation, there is a strongly stable boundary layer (SBL) with down-glacier flow at the upper parts of the glacier at 06:00 (Fig. 5a), while below 3000 m a.m.s.l., the weaker flow, reduced stability, and higher TKE values are associated with the strong cross-glacier flow over the tongue (Fig. 3). In NO_GL, the isentropes show that there is generally weaker stratification (Fig. 5c) in accordance with the lower TKE values associated with the weaker gravity wave (Fig. 5b). REF still shows a jet-like flow over the upper part of HEF 2 h later (Fig. 5d); however, in NO_GL, the stable stratification over the missing glacier is continuously weakened (Fig. 5f). Furthermore, NO_GL exhibits higher TKE values than REF below 3000 m a.m.s.l. (Fig. 5e), which are related to the earlier breaking cross-glacier gravity wave. The atmosphere above HEF is well-mixed in both REF and NO_GL at 10:00 and 12:00 (Fig. 5g–l), and the SBL is mostly eroded in both simulations, while the vertical profiles in the NO_GL simulation even suggest a convective boundary layer at the glacier tongue (Fig. 4d). This is likely one of the major reasons why the gravity wave is able to plunge and break into the glacier valley earlier in the NO_GL simulation than in REF: because there is weaker (or no) cold air that has to be eroded by the upper-level flow (Haid et al., 2022). Furthermore, the up-glacier flow with enhanced turbulent mixing is also noticeable in NO_GL (Fig. 5i and l).
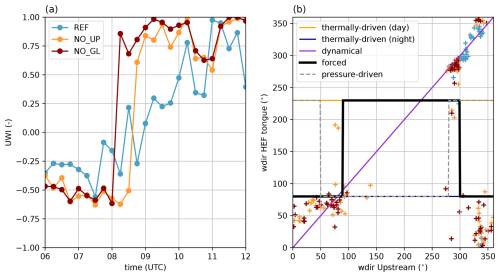
Figure 6(a) The up-valley wind index (UWI) for REF, NO_UP, and NO_GL for the HEF tongue location. (b) Scatter plot of wind direction (+ symbols) at the upstream locations (red star in Fig. 1) and at the HEF tongue (red point in Fig. 1) for all three simulations for our time period of interest. The lines in purple, black, and grey show the idealized categorizations from Whiteman and Doran (1993).
3.3 Wind direction shift in the glacier valley
In our simulations, the flow is in the cross-glacier direction for all three cases (Fig. 6a) before 08:00, related to the gravity wave present over the glacier tongue. However, after 08:00, the situation changes: in REF, there is a gradual shift in UWI (Eq. 3) towards 1 until 12:00, suggesting a gradual weakening of the cross-glacier flow associated with the gravity wave. However, in the other two simulations, UWI shows a sudden shift towards 1 at 08:00 (NO_GL) and 08:30 (NO_UP), suggesting up-glacier flow. When the gravity wave breaks (Fig. 3, at 10:00), the up-valley flow is established (Fig. 2), and, in contrast to the REF simulation, the gravity wave is unable to redevelop, and the up-glacier flow persists after 09:00 in NO_UP and NO_GL.
According to the Whiteman and Doran (1993) classification, the wind direction points in REF simulation collapse onto a diagonal line (Fig. 6b), suggesting that the wind structure in the HEF valley is dominated by downward momentum transport by the gravity wave. For the NO_GL and NO_UP simulations, a different picture emerges: some of the points still follow the diagonal line (hence, downward momentum transport), but others are grouped in the lower-left or lower-right corner. This pattern corresponds to forced channelling, where the synoptic flow is channelled into the valley. In theory, pressure-driven channelling could also be a reason for the up-glacier flow (with a slightly different wind direction pattern), but this would require a horizontal pressure gradient along the valley axis. We calculated the horizontal pressure gradient (not shown), but it showed no distinct signal; hence, we conclude that forced channelling is the major mechanism at play in the simulations without the upstream glaciers. Previous research on channelling flows in valleys suggests that shallow valleys are more prone to channelling of synoptic flows (Whiteman and Doran, 1993; Steyn et al., 2013) than deep Alpine valleys, where thermally induced flows are very resilient to synoptic influence (Zängl, 2009). Given that the upper Rofen Valley, where HEF is located, is rather shallow compared to its surroundings (the height difference between the HEF tongue and the upstream location is around 500 m), channelling of synoptic cross-glacier flows is a realistic scenario. To summarize, we conclude that the gravity wave leads to downward momentum transport over the HEF valley, and when it breaks and thus weakens, the synoptic flow is channelled via forced channelling into the glacier valley. In this case study, the up-glacier flows after 09:00 can be explained with dynamical forcing, and the thermal forcing component (e.g. slope or valley flows due to differential heating) is negligible.
In this section, we compare the three simulations with respect to sensible heat fluxes, advection patterns, the heat budget, and 2 m temperature. While we cannot resolve the glacier boundary layer in great detail, we are interested in assessing the impacts of the changed ice surfaces on the valley atmosphere and surface processes above HEF. Since we conduct semi-idealized simulations, we assess the changes in the sensitivity runs (NO_UP and NO_GL) compared to the reference simulation. Although we are aware that the sensible heat flux is simulated too strongly in the REF simulation compared to the observations, we also note that the general physical processes are simulated correctly (Goger et al., 2022).
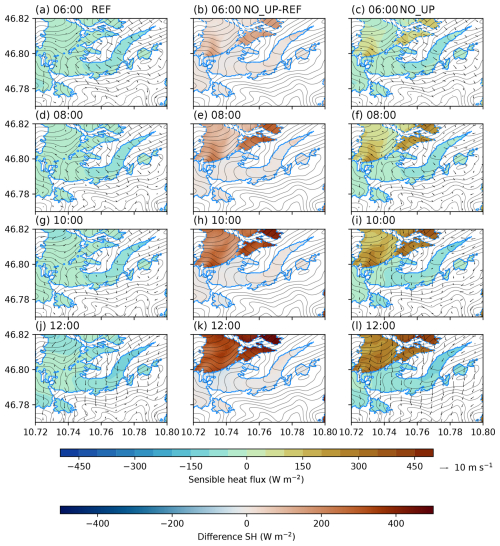
Figure 7Simulated sensible heat flux (colours) from the lowest model level and 10 m wind speed (black arrows) at four different times (06:00, a–c; 08:00, d–e; 10:00, g–i; and 12:00, j–l). The left row is REF, the middle is the difference between REF and NO_UP, and the right row is NO_UP. The blue contours represent the glacier outlines in the simulations, while dashed blue lines indicate the missing ice surfaces. The thin black contours show the model topography.
4.1 Spatial patterns of sensible heat flux
The surface sensible heat flux plays a pivotal role in the energy exchange over glaciers in the summer months. Over a melting glacier, the surface temperature is constant at 0 °C, impacting the bulk formulation of the sensible heat flux (Stull, 1988, their Eq. 7.4.1d). As the surface temperature over a melting glacier is exactly 0∘, sensible heat fluxes strongly depend on the wind speed; we can expect that changing wind patterns drive changes in the sensible heat flux structure. In the REF simulation with the realistic glacier surfaces, the sensible heat flux is negative (from the atmosphere to the ice, atmospheric notation) during the entire simulation over HEF (Fig. 7a, d, g, j). Over the remaining ice surface (i.e. HEF) in NO_UP, sensible heat flux magnitudes are 50 W m−2 smaller compared to those in REF at 06:00 (Fig. 7b). The changed sensible heat fluxes are present during the entire simulation time at the remaining ice surface in NO_UP. Interestingly, the sensible heat flux difference between NO_UP and REF is very small when cross-glacier flow is present in both simulations at the upper part of HEF (Fig. 7h, k, i, l). The largest differences between REF and NO_UP are visible at 12:00, when the gravity wave broke, and the strong up-glacier flow is present in NO_UP (Fig. 7i, l). It is not surprising that the sensible heat fluxes over the missing ice surfaces change sign between REF and NO_UP (Fig. 7k). This indicates that removing the upstream ice surfaces, and therefore their influence on atmospheric flow structures, impacts spatial variability in sensible heat fluxes and consequently can be expected to have an impact on HEF's melting patterns.
When we remove all glaciers from the model domain (Fig. 8), sensible heat fluxes reveal a large difference between NO_GL and REF that changes over the simulation time. At 06:00, sensible heat fluxes exhibit a difference of around 100 W m−2 over the missing ice surfaces (Fig. 8b), while with progressing simulation time, these differences change up to more than 500 W m−2, with opposite signs (Fig. 8k). This is not surprising since changing the land use category in the model from snow or ice to bare rock leads to changes in albedo and roughness length (Table 1), thus leading to positive sensible heat fluxes during the daytime. Interestingly, sensible heat fluxes remain smaller in the glacier valley than in its surroundings in the NO_GL simulation (Fig. 8c, f, i, l), likely due to the sheltered location of the valley and topographic shading. However, despite the large differences in the sensible heat fluxes (Fig. 8b, e, h, k), removing all ice surfaces does not have a large impact on the general flow structure, as the 10 m wind speeds (Fig. 2) and the gravity wave structure are very similar to the NO_UP simulation. Therefore, we can finally conclude that HEF's boundary layer ABL structure is in this particular case study mostly dominated by the upstream formation of gravity waves, as described in Sect. 3, and HEF itself plays a secondary role. Still, observations suggest the persistence of very shallow katabatic flow even in highly disturbed conditions (Mott et al., 2020), which is unable to be resolved by the model.
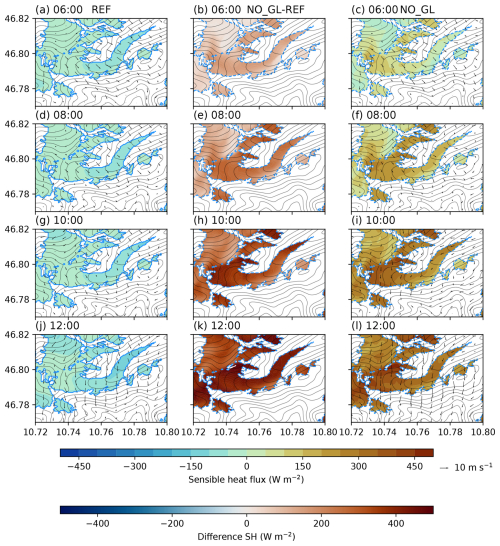
Figure 8Simulated sensible heat flux (colours) from the lowest model level and 10 m wind speed (black arrows) at four different times (06:00, a–c; 08:00, d–e; 10:00, g–i; and 12:00, j–i). The left row is REF, the middle is the difference between REF and NO_GL, and the right row is NO_GL. The blue contours represent the glacier outlines in the simulations, while dashed blue lines indicate the locations of the missing ice surfaces. The thin black contours show the model topography.
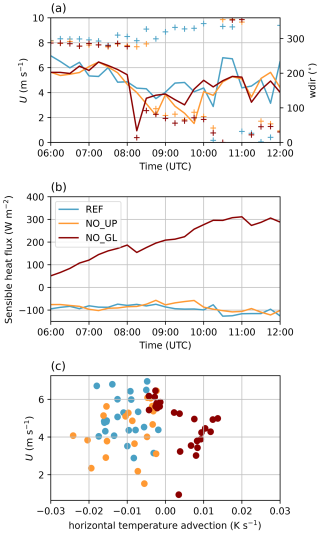
Figure 9(a) Time series of horizontal wind speed (lines) and wind direction (+ symbols) from the lowest model level for REF (blue), NO_UP (orange), and NO_GL (red) simulations at the HEF tongue. Panel (b) is the same as panel (a) but for sensible heat flux. (c) Scatter plot of horizontal temperature advection and horizontal wind speed over the time period of interest (06:00–12:00).
4.2 Horizontal advection patterns and heat budget
Time series of horizontal wind speed and direction from the lowest model level at the HEF tongue reveal no substantial differences in wind speed magnitude between the three simulations (Fig. 9a) despite the differences in wind direction between REF and the sensitivity simulations, which are related to the up-valley flow caused by earlier gravity wave breaking, as outlined in the previous sections. With no change in wind speed, the sensible heat flux magnitude at the HEF tongue (Fig. 7) does not change significantly (less than 50 W m−2) between REF and NO_UP either (Fig. 9b); however, when HEF is removed in NO_GL, the sensible heat flux changes sign, as expected, and increases substantially in magnitude, highlighting the importance of the glacier surface for the local sensible heat exchange.
Regarding the horizontal advection patterns over HEF (Eq. 4), Goger et al. (2022) showed that they are strongly influenced by the wind speed and dominant wind direction. As in the REF simulation, the glacier tongue in the NO_UP simulation is under the influence of horizontal cold-air advection during our time of interest (Fig. 9c). In the REF simulation, the horizontal cold-air advection is mostly associated with the gravity wave advecting potentially colder air from the upstream glaciers towards the HEF tongue. The horizontal advection patterns are very similar in the REF and NO_UP simulations, suggesting that the katabatic mechanism is not important in the simulations (Fig. 9c). In the NO_GL simulation, on the other hand, the advection is generally warm despite the flow being cross-glacier. In general, gravity waves lead to warm-air advection due to the isentropic drawdown, and because upstream glaciers are missing, this effect is expected over the HEF tongue.
The heat budget (Eq. 5) of the REF simulation (Fig. 10a) reveals cooling of the column above the HEF tongue between 06:00 and 08:30, with slight interruptions above 2800 m a.m.s.l. and oscillations in time. This coincides with the gravity wave breaking pattern because the brief periods of positive correspond to the gravity wave breaking in REF (Fig. 3), and the atmosphere above HEF experiences cooling from 09:00 until 12:00 at heights above 2850 m a.m.s.l. The time-averaged vertical heat budget reveals that cold-air advection dominates during our time period of interest, as the gravity wave advects cold air from the upstream glaciers towards the HEF tongue (Fig. 10d). In the NO_UP simulation, a different picture emerges (Fig. 10b): the HEF tongue is well-mixed, with very weak cooling or heating, and with weaker absolute heating/cooling values than in REF. This alternating pattern in NO_UP's heat budget leads to an overall zero net effect (Fig. 10e). Similar patterns are visible in the NO_GL simulation (Fig. 10c) but with stronger heating effects than in the other simulations (Fig. 10f). We relate this to the much weaker gravity wave also breaking earlier in the simulations without the upstream glacier surfaces (NO_UP and NO_GL) having a large influence on the heating rate over the HEF tongue. To summarize, the vertical heating rate in REF shows distinct heating or warming patterns in relation to the gravity wave, where in NO_UP, there is a net zero effect, and in NO_GL it shows a small warming effect.
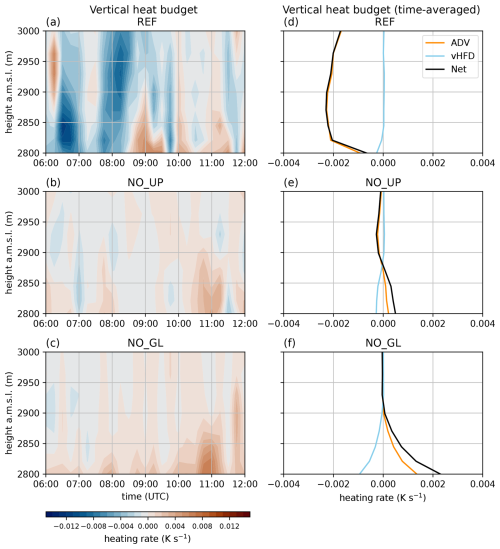
Figure 10(a–c) Time series of the total heat budget over the HEF tongue for REF (a), NO_UP (b), and NO_GL (c). (d–f) Time-averaged (over the time period from 06:00 to 12:00) components of the total vertical heat budget at the HEF tongue (net), namely temperature advection (ADV) and vertical heat flux divergence (vHFD), for REF (d), NO_UP (e), and NO_GL (f).
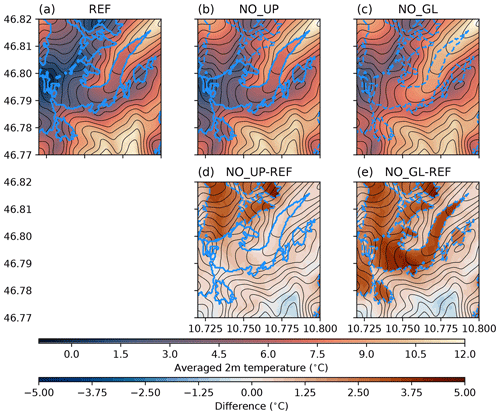
Figure 11(a–c) Averaged 2 m temperature (colours) over the simulation period of interest (06:00–12:00) for REF, NO_UP, and NO_GL. (d–e) The difference in averaged 2 m temperature compared to REF. All panels – topography (black contours), ice surfaces (blue outlines), and missing ice surfaces compared to REF (dashed blue outlines).
4.3 Resulting temperature structure on the glacier
The 2 m temperature (Eq. 6) averaged over our time period of interest (06:00–12:00) shows temperatures close to 0 °C over all ice surfaces, especially over the upstream glaciers (Fig. 11a), while the glacier surroundings are up to 10 °C warmer. The NO_UP simulation shows higher 2 m temperatures over the missing upstream glaciers, with a temperature contrast of up to 5 °C compared to those in REF (Fig. 11b). Furthermore, the HEF tongue is warmer by 1 °C than the REF counterpart (Fig. 11d), suggesting that the glacier tongue is influenced by the (warmer) surroundings (Fig. 9). Finally, removing all glaciers (Fig. 11c) leads to a temperature increase of 5 °C at all missing ice surfaces compared to the temperatures in REF. The surroundings are 1 °C warmer than in REF (Fig. 11f), suggesting a large influence of the strong turbulent mixing induced by the breaking gravity wave.
In general, our LES simulations proved an ideal test bed to study the impact of dynamically induced flows on the glacier boundary layer. As already discussed in Goger et al. (2022) and Voordendag et al. (2024), more than 10 grid points across the glacier valley are present in our domain, and this hints that the major MoBL processes are resolved (Wagner et al., 2014). When we assume that the effective horizontal resolution of the model is 7Δx (Stull, 2017, their p. 761), phenomena with a horizontal extent of 336 m are resolved on the grid, which is adequate to resolve the gravity wave across the valley and the associated processes. Since the focus of the study is on the dynamical forcing and gravity waves, which form on scales larger than the small-scale glacier boundary layer, we can expect that the model delivers reliable results from these processes. Still, the flow very near the surface is influenced strongly by the subgrid-scale parametrization, and the potential very shallow katabatic flow that might persist very close to the surface (Mott et al., 2020) is not captured by the model.
We analysed results from a 6 h period (06:00–12:00) because not only did REF started to deviate from observations after 12:00 (Goger et al., 2022) but also after this time, the two sensitivity simulations (NO_UP and NO_GL) did not give new insights into the gravity wave dynamics: in both NO_UP and NO_GL, the gravity wave does not re-establish itself and up-glacier flow prevails, the same as in the REF simulation after 12:00 (not shown). While we only show findings from a single case study, it indicates that HEF cannot be treated in isolation from the surrounding glacier surfaces because of the strong impact of the upstream glaciers on gravity wave formation. This is similar to findings from other studies in different glacierized settings. For example, a study of föhn flows over the Larsen C ice shelf, Antarctica (Turton et al., 2018), found that the stabilizing effect of upstream ice surfaces influences the isentrope drawdown of gravity waves. Jonassen et al. (2014) simulated gravity waves over the Hofsjökull ice cap, Iceland, and also found stronger downslope flow acceleration in simulations with the ice cap, while removing the ice cap led to weaker downslope flows.
The gravity wave in both the NO_UP and NO_GL simulations is weaker and breaks earlier compared to the simulation with realistic glaciers (REF), leading to stronger turbulent mixing. The dynamical force balance due to gravity wave breaking changes the flow regime inside the valley from across-glacier caused by downward momentum transport in REF to up-valley flow due to forced channelling (Whiteman and Doran, 1993). Another interesting aspect is that the flow structure in the simulations without the upstream glaciers (NO_UP and NO_GL) is very similar despite the presence of the HEF glacier tongue in NO_UP. This suggests that in our particular case study, the flow structure in the glacier valley is so strongly dominated by the upstream conditions that local effects of the HEF ice surface itself do not provide a relevant feedback to the simulated local wind patterns. On the other hand, the HEF ice surface is a dominant control of the surface heat exchange.
In the two sensitivity simulations, the earlier gravity wave breaking leads to stronger mixing above the HEF glacier surface and stronger sensible heat fluxes into the glacier. Therefore, we can conclude that removing upstream glaciers leads to an overall destabilization of the atmosphere above HEF, an increase in near-surface air temperatures, and weaker gravity waves. The role of the upstream glaciers on the cross-glacier flow is non-negligible; therefore, it makes sense to speak of a system of glaciers (HEF and the upstream glaciers) influencing the local microclimates of one another on a scale of around 5–10 km. However, this length scale for the development of mesoscale ice breezes (similar to that in Conway et al., 2021) depends on the size of the glaciers and connected upstream ice fields. Examples of larger ice fields influencing the local wind patterns on the glacier tongue are the Columbia ice field in Canada (Conway et al., 2021), the Jostedalsbreen ice field in Western Norway (Haualand et al., 2024), or Vatnajökull ice cap in Iceland (Björnsson et al., 2005). All of them span more than 50 km, and dependent on flow direction, the development of either ice field breezes or gravity waves is favourable to develop. Our work allowed us to shed light on the impact of upstream ice fields/glaciers on local glacier boundary layers, but more detailed research in combination with a wind climatology and flow-resolving simulations is necessary in the future.
A final open question to discuss is how representative our 6 h of simulation is for HEF and its surroundings. Currently, we can only compare to a wind climatology at HEF compiled by Obleitner (1994), and they found a significant northerly gradient wind influence on the south-facing slope of the valley, the same wind direction as in our case study. Furthermore, Mott et al. (2020) noted in the HEFEX campaign that in 20 % of their wind observations, the katabatic flow was disturbed, and the glacier boundary layer was eroded. Therefore, we can assume that the situation of strong north-westerly winds and gravity waves eroding the glacier boundary layer described in this paper is not a single occurrence. Still, an updated wind climatology over HEF is necessary to quantify these events. Furthermore, applying an intermediate complexity model such as HICAR (Reynolds et al., 2023, 2024) to the region for entire seasons would shed more light on the typical wind patterns over HEF, given its small computational cost. However, we still see high-resolution full-physics numerical simulations (e.g. Sauter and Galos, 2016; Gerber et al., 2018; Mott et al., 2019; Draeger et al., 2024; Voordendag et al., 2024; Haualand et al., 2024) as the current standard to investigate the physical processes over glaciers located in complex terrain despite their high computational cost.
We conducted semi-idealized large-eddy simulations at Δx=48 m over the Hintereisferner (HEF) glacier in the Austrian Alps for a short case study with north-westerly synoptic flow. The reference simulation (REF) was run with realistic glacier surfaces, while the NO_UP simulation ran without upstream glaciers, and in the NO_GL simulation, all ice surfaces were removed from the domain. The results allow us to draw the following conclusions.
-
Under north-westerly synoptic flow, a gravity wave forms over the HEF tongue location in all three simulations, which, when it breaks, leads to turbulent mixing over the HEF glacier surface.
-
Removing the upstream glaciers in the NO_UP simulation leads to neutral stratification with an unstable surface layer and thus less favourable conditions for gravity wave formation. The gravity wave in the NO_UP simulation is weaker than in REF and breaks 30 min earlier, leading to earlier onset of strong turbulent mixing over the remaining glacier surface and changing the cross-glacier flow into up-glacier flow. A similar pattern is present in the NO_GL simulation.
-
The upstream glaciers are not necessary for gravity wave formation but strongly influence their strength by stabilizing the upstream profile.
-
In this case study, the wind patterns over the glacier valley are governed by downward momentum transport by the gravity wave. When it breaks, the synoptic flow is channelled into the valley, leading to up-glacier flows.
-
Due to the changed gravity wave structure, higher temperatures and higher spatial variability in sensible heat fluxes are present at the HEF tongue location in the NO_UP and NO_GL simulations.
-
Due to the strong gravity wave, the heat budget over HEF is negative in the REF simulation. However, when the gravity wave is weakened in the sensitivity runs, we note a net-zero heat budget in NO_UP and slight overall warming in NO_GL.
-
The local boundary layer flow structure in the NO_GL simulation is very similar to that in the NO_UP simulation, suggesting that the atmosphere over HEF is therefore less governed by the surface below (ice) but instead by dynamical forcing.
-
The results suggest that HEF is not isolated from the nearby environment (rock surface and/or slopes) and that the influence of upstream ice surfaces on local boundary layer development cannot be disregarded. Henceforth, in the near future, it is advisable to investigate a system of glaciers instead of studying processes on isolated glacier tongues only.
The present study gave insights into the impact of ice surfaces on gravity wave formation and breaking, which affect glacier boundary layer development. In the future, similar studies with different upstream conditions could be conducted. However, one of the open questions in glacier boundary layer dynamics is the future changes in glacier boundary layer structure in a warming climate, which could be quantified with high-resolution LES using future ice surfaces derived from climate projections.
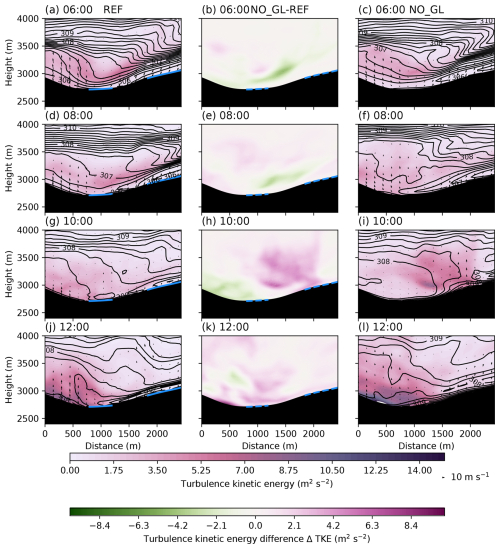
Figure A1Vertical cross-section along the black line in Fig. 1b (looking up the valley) of simulated total TKE (subgrid and resolved, colours), isentropes (black contours), and cross-valley wind speed (arrows) from REF (left column), NO_GL (right column), and the difference in TKE from NO_GL − REF (middle column) at four different times (06:00, a–c; 08:00, d–f; 10:00, g–i; and 12:00, j–l). The solid blue lines show glacier surfaces, while dashed blue lines indicate the locations of the glacier surfaces that were removed.
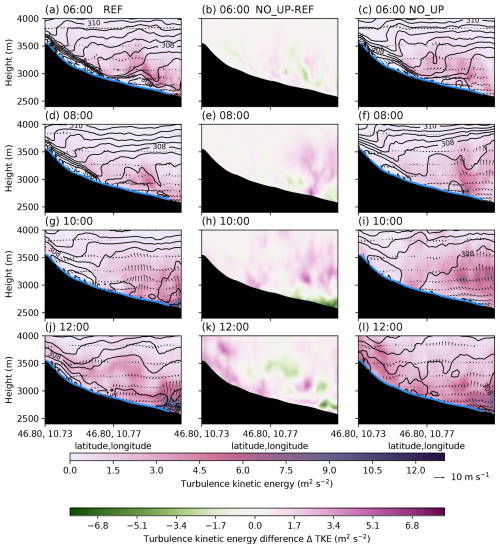
Figure A2Vertical cross-section along the line in Fig. 1c of simulated total TKE (colours), isentropes (black contours), and along-valley wind speed (arrows) from REF (left column), NO_UP (right column), and the difference in TKE from NO_UP − REF (middle column) at four different times (06:00, a–c; 08:00, d–f; 10:00, g–i; and 12:00, j–l). The solid blue lines show glacier surfaces, while dashed blue lines indicate the locations of the glacier surfaces that were removed.
The WRF v4.1 model code can be downloaded from GitHub: https://github.com/wrf-model/WRF/releases/tag/v4.1 (WRF, 2019), and the averaging module WRF LES diagnostics is available at https://doi.org/10.5281/zenodo.3901119 (Umek, 2020). The model output is available upon request from Brigitta Goger. Figures were generated using python-matplotlib (Hunter, 2007), with colour maps by Crameri (2023): https://doi.org/10.5281/zenodo.8035877.
BG set up and conducted the numerical simulations and wrote the initial draft of the paper. MO performed the analysis of numerical data as a part of his internship at Universität Innsbruck in summer 2023, supervised by IS. IS and LN provided input on the analysis, and all authors read and improved the paper where necessary.
The contact author has declared that none of the authors has any competing interests.
Publisher’s note: Copernicus Publications remains neutral with regard to jurisdictional claims made in the text, published maps, institutional affiliations, or any other geographical representation in this paper. While Copernicus Publications makes every effort to include appropriate place names, the final responsibility lies with the authors.
This work is part of the project “Measuring and modelling snow-cover dynamics at high resolution for improving distributed mass balance research on mountain glaciers”, a joint project fully funded by the Austrian Science Foundation (FWF; project number I 3841-N32, https://doi.org/10.55776/I3841) and the Deutsche Forschungsgemeinschaft (DFG; project number SA 2339/7-1). The computational results presented have been achieved using the Vienna Scientific Cluster (VSC) under project number 71434. The work of Ivana Stiperski was funded through the European Research Council (ERC) under the European Union's Horizon 2020 research and innovation programme (grant agreement no. 101001691). We thank Michael Haugeneder and Cole Lord-May for their concise and thoughtful referee reports, which led to the improvement of the paper.
This research has been supported by the Austrian Science Fund (grant nos. I 3841-N32, European Research Council (ERC), and 101001691).
This paper was edited by Juerg Schmidli and reviewed by Michael Haugeneder and Cole Lord-May.
Adler, B. and Kalthoff, N.: The Impact of Upstream Flow on the Atmospheric Boundary Layer in a Valley on a Mountainous Island, Bound.-Lay. Meteorol., 158, 429–452, https://doi.org/10.1007/s10546-015-0092-y, 2016. a
Beniston, M., Farinotti, D., Stoffel, M., Andreassen, L. M., Coppola, E., Eckert, N., Fantini, A., Giacona, F., Hauck, C., Huss, M., Huwald, H., Lehning, M., López-Moreno, J.-I., Magnusson, J., Marty, C., Morán-Tejéda, E., Morin, S., Naaim, M., Provenzale, A., Rabatel, A., Six, D., Stötter, J., Strasser, U., Terzago, S., and Vincent, C.: The European mountain cryosphere: a review of its current state, trends, and future challenges, The Cryosphere, 12, 759–794, https://doi.org/10.5194/tc-12-759-2018, 2018. a, b, c
Björnsson, H., Gudmundsson, S., and Pálsson, F.: Glacier winds on Vatnajökull ice cap, Iceland, and their relation to temperatures of its lowland environs, Ann. Glaciol., 42, 291–296, https://doi.org/10.3189/172756405781812493, 2005. a
Byrne, M. P., Boos, W. R., and Hu, S.: Elevation-dependent warming: observations, models, and energetic mechanisms, Weather Clim. Dynam., 5, 763–777, https://doi.org/10.5194/wcd-5-763-2024, 2024. a
Conway, J. P., Helgason, W. D., Pomeroy, J. W., and Sicart, J. E.: Icefield Breezes: Mesoscale Diurnal Circulation in the Atmospheric Boundary Layer Over an Outlet of the Columbia Icefield, Canadian Rockies, J. Geophys. Res.-Atmos., 126, e2020JD034225, https://doi.org/10.1029/2020JD034225, 2021. a, b, c
Crameri, F.: Scientific colour maps, Zenodo [code], https://doi.org/10.5281/zenodo.8035877, 2023. a
Cremona, A., Huss, M., Landmann, J. M., Borner, J., and Farinotti, D.: European heat waves 2022: contribution to extreme glacier melt in Switzerland inferred from automated ablation readings, The Cryosphere, 17, 1895–1912, https://doi.org/10.5194/tc-17-1895-2023, 2023. a
Cuxart, J.: When Can a High-Resolution Simulation Over Complex Terrain be Called LES?, Front. Earth Sci., 3, 6, https://doi.org/10.3389/feart.2015.00087, 2015. a
Deardorff, J. W.: Stratocumulus-capped mixed layers derived from a three-dimensional model, Bound.-Lay. Meteorol., 18, 495–527, https://doi.org/10.1007/BF00119502, 1980. a
Draeger, C., Radić, V., White, R. H., and Tessema, M. A.: Evaluation of reanalysis data and dynamical downscaling for surface energy balance modeling at mountain glaciers in western Canada, The Cryosphere, 18, 17–42, https://doi.org/10.5194/tc-18-17-2024, 2024. a
French, J. R., Haimov, S. J., Oolman, L. D., Grubišić, V., Serafin, S., and Strauss, L.: Wave-induced boundary-layer separation in the lee of the Medicine Bow Mountains. Part I: Observations, J. Atmos. Sci., 72, 4845–4863, https://doi.org/10.1175/JAS-D-14-0376.1, 2015. a
Gerber, F., Besic, N., Sharma, V., Mott, R., Daniels, M., Gabella, M., Berne, A., Germann, U., and Lehning, M.: Spatial variability in snow precipitation and accumulation in COSMO–WRF simulations and radar estimations over complex terrain, The Cryosphere, 12, 3137–3160, https://doi.org/10.5194/tc-12-3137-2018, 2018. a
Goger, B. and Dipankar, A.: The impact of mesh size, turbulence parameterization, and land-surface-exchange scheme on simulations of the mountain boundary layer in the hectometric range, Q. J. Roy. Meteor. Soc., 150, 3853–3873, https://doi.org/10.1002/qj.4799, 2024. a
Goger, B., Stiperski, I., Nicholson, L., and Sauter, T.: Large-eddy simulations of the atmospheric boundary layer over an Alpine glacier: Impact of synoptic flow direction and governing processes, Q. J. Roy. Meteor. Soc, 148, 1319–1343, https://doi.org/10.1002/qj.4263, 2022. a, b, c, d, e, f, g, h, i, j, k, l, m, n, o, p, q
Gohm, A. and Mayr, G. J.: Hydraulic aspects of föhn winds in an Alpine valley, Q. J. Roy. Meteor. Soc., 130, 449–480, https://doi.org/10.1256/qj.03.28, 2004. a
Grisogono, B., Kraljević, L., and Jeričević, A.: The low-level katabatic jet height versus Monin–Obukhov height, Q. J. Roy. Meteor. Soc., 133, 2133–2136, https://doi.org/10.1002/qj.190, 2007. a
Grubišić, V., Doyle, J. D., Kuettner, J., Dirks, R., Cohn, S. A., Pan, L. L., Mobbs, S., Smith, R. B., Whiteman, C. D., Czyzyk, S., Vosper, S., Weissmann, M., Haimov, S., de Wekker, S. F. J., and Chow, F. K.: The Terrain-Induced Rotor Experiment, B. Am. Meteor. Soc., 89, 1513–1533, https://doi.org/10.1175/2008BAMS2487.1, 2008. a
Grubišić, V., Serafin, S., Strauss, L., Haimov, S. J., French, J. R., and Oolman, L. D.: Wave-induced boundary-layer separation in the lee of the Medicine Bow Mountains. Part II: Numerical modeling, J. Atmos. Sci., 72, 4865–4884, https://doi.org/10.1175/JAS-D-14-0381.1, 2015. a
Haid, M., Gohm, A., Umek, L., Ward, H. C., and Rotach, M. W.: Cold-Air Pool Processes in the Inn Valley During Föhn: A Comparison of Four Cases During the PIANO Campaign, Bound.-Lay. Meteor., 182, 335–362, https://doi.org/10.1007/s10546-021-00663-9, 2022. a, b
Haualand, K. F., Sauter, T., Abermann, J., de Villiers, S. D., Georgi, A., Goger, B., Dawson, I., Nerhus, S. D., Robson, B., Hauknes Sjursen, K., Thomas, D., Thomaser, M., and Yde, J. C.: Micro-Meteorological Impact of Glacier Retreat and Proglacial Lake Temperature in Western Norway, ESS Open Archive, https://doi.org/10.22541/essoar.172926901.19613096/v1, 2024. a, b
Haugeneder, M., Lehning, M., Stiperski, I., Reynolds, D., and Mott, R.: Turbulence in the Strongly Heterogeneous Near-Surface Boundary Layer over Patchy Snow, Bound.-Lay. Meteorol., 190, 7, https://doi.org/10.1007/s10546-023-00856-4, 2024. a
Hersbach, H., Bell, B., Berrisford, P., Hirahara, S., Horányi, A., Muñoz Sabater, J., Nicolas, J., Peubey, C., Radu, R., Schepers, D., Simmons, A., Soci, C., Abdalla, S., Abellan, X., Balsamo, G., Bechtold, P., Biavati, G., Bidlot, J., Bonavita, M., De Chiara, G., Dahlgren, P., Dee, D., Diamantakis, M., Dragani, R., Flemming, J., Forbes, R., Fuentes, M., Geer, A., Haimberger, L., Healy, S., Hogan, R. J., Hólm, E., Janisková, M., Keeley, S., Laloyaux, P., Lopez, P., Lupu, C., Radnoti, G., de Rosnay, P., Rozum, I., Vamborg, F., Villaume, S., and Thépaut, J.-N.: The ERA5 global reanalysis, Q. J. Roy. Meteor. Soc., 146, 1999–2049, https://doi.org/10.1002/qj.3803, 2020. a
Hock, R., Rasul, G., Adler, C., Cáceres, B., Gruber, S., Hirabayashi, Y., Jackson, M., Kääb, A., Kang, S., Kutuzov, S., Milner, A., Molau, U., Morin, S., Orlove, B., and Steltzer, H.: High Mountain Areas, in: IPCC Special Report on the Ocean and Cryosphere in a Changing Climate, edited by: Pörtner, H.-O., Roberts, D., Masson-Delmotte, V., Zhai, P., Tignor, M., Poloczanska, E., Mintenbeck, K., Alegría, A., Nicolai, M., Okem, A., Petzold, J., Rama, B., and Weyer, N., Cambridge University Press, 131–202, https://doi.org/10.1017/9781009157964.004, 2022. a
Hunter, J. D.: Matplotlib: A 2D Graphics Environment, Comput. Sci. Eng., 9, 90–95, https://doi.org/10.1109/MCSE.2007.55, 2007. a
Iacono, M. J., Delamere, J. S., Mlawer, E. J., Shephard, M. W., Clough, S. A., and Collins, W. D.: Radiative forcing by long-lived greenhouse gases: Calculations with the AER radiative transfer models, J. Geophys. Res.-Atmos., 113, D13103, https://doi.org/10.1029/2008JD009944, 2008. a
Jackson, P. L., Mayr, G., and Vosper, S.: Dynamically-Driven Winds, in: Mountain Weather Research and Forecasting, edited by Chow, F. K., De Wekker, S. F. J., and Snyder, B. J., Springer Atmospheric Sciences, Springer Netherlands, ISBN 978-94-007-4097-6 978-94-007-4098-3, 121–218, https://doi.org/10.1007/978-94-007-4098-3_3, 2013. a
Jiang, Q. and Doyle, J. D.: Gravity Wave Breaking over the Central Alps: Role of Complex Terrain, J. Atmos. Sci., 61, 2249–2266, https://doi.org/10.1175/1520-0469(2004)061<2249:GWBOTC>2.0.CO;2, 2004. a
Jiang, Q., Doyle, J. D., and Smith, R. B.: Interaction between Trapped Waves and Boundary Layers, J. Atmos. Sci., 63, 617–633, https://doi.org/10.1175/JAS3640.1, 2006. a
Jiménez, P. A., Dudhia, J., González-Rouco, J. F., Navarro, J., Montávez, J. P., and García-Bustamante, E.: A Revised Scheme for the WRF Surface Layer Formulation, Mon. Weather Rev., 140, 898–918, https://doi.org/10.1175/MWR-D-11-00056.1, 2012. a, b, c
Jonassen, M. O., Ágústsson, H., and Ólafsson, H.: Impact of surface characteristics on flow over a mesoscale mountain, Q. J. Roy. Meteor. Soc., 140, 2330–2341, https://doi.org/10.1002/qj.2302, 2014. a, b
Kalthoff, N., Adler, B., and Bischoff-Gauß, I.: Spatio-temporal Structure of the Boundary Layer under the Impact of Mountain Waves, Meteorol. Z., 29, 409–424, https://doi.org/10.1127/metz/2020/1033, 2020. a
Lehner, M.: The Boundary Layer Over Complex Terrain, in: Reference Module in Earth Systems and Environmental Sciences, Elsevier, ISBN 978-0-12-409548-9, https://doi.org/10.1016/B978-0-323-96026-7.00075-8, 2024. a
Lehner, M. and Rotach, M. W.: Current Challenges in Understanding and Predicting Transport and Exchange in the Atmosphere over Mountainous Terrain, Atmosphere, 9, 276, https://doi.org/10.3390/atmos9070276, 2018. a
Litt, M., Sicart, J.-E., Six, D., Wagnon, P., and Helgason, W. D.: Surface-layer turbulence, energy balance and links to atmospheric circulations over a mountain glacier in the French Alps, The Cryosphere, 11, 971–987, https://doi.org/10.5194/tc-11-971-2017, 2017. a
Mahrt, L.: Flux Sampling Errors for Aircraft and Towers, J. Atmos. Ocean. Tech., 15, 416–429, https://doi.org/10.1175/1520-0426(1998)015<0416:FSEFAA>2.0.CO;2, 1998. a
Matiu, M., Crespi, A., Bertoldi, G., Carmagnola, C. M., Marty, C., Morin, S., Schöner, W., Cat Berro, D., Chiogna, G., De Gregorio, L., Kotlarski, S., Majone, B., Resch, G., Terzago, S., Valt, M., Beozzo, W., Cianfarra, P., Gouttevin, I., Marcolini, G., Notarnicola, C., Petitta, M., Scherrer, S. C., Strasser, U., Winkler, M., Zebisch, M., Cicogna, A., Cremonini, R., Debernardi, A., Faletto, M., Gaddo, M., Giovannini, L., Mercalli, L., Soubeyroux, J.-M., Sušnik, A., Trenti, A., Urbani, S., and Weilguni, V.: Observed snow depth trends in the European Alps: 1971 to 2019, The Cryosphere, 15, 1343–1382, https://doi.org/10.5194/tc-15-1343-2021, 2021. a
Monin, A. S. and Obukhov, A. M.: Osnovnye zakonomernosti turbulentnogo peremeshivanija v prizemnom sloe atmosfery (Basic Laws of Turbulent Mixing in the Atmosphere Near the Ground), Trudy geofiz. inst. AN SSSR, 24, 163–187, 1954. a
Mott, R., Wolf, A., Kehl, M., Kunstmann, H., Warscher, M., and Grünewald, T.: Avalanches and micrometeorology driving mass and energy balance of the lowest perennial ice field of the Alps: a case study, The Cryosphere, 13, 1247–1265, https://doi.org/10.5194/tc-13-1247-2019, 2019. a
Mott, R., Stiperski, I., and Nicholson, L.: Spatio-temporal flow variations driving heat exchange processes at a mountain glacier, The Cryosphere, 14, 4699–4718, https://doi.org/10.5194/tc-14-4699-2020, 2020. a, b, c, d, e, f, g, h
Obleitner, F.: Climatological features of glacier and valley winds at the Hintereisferner (Ötztal Alps, Austria), Theor. Appl. Climatol., 49, 225–239, https://doi.org/10.1007/BF00867462, 1994. a, b
Oerlemans, J. F.: The microclimate of valley glaciers, IGITUR, Universiteitsbibliotheek Utrecht, ISBN 987-90-393-5305-5, https://dspace.library.uu.nl/handle/1874/202997, 2010. a
Pepin, N. C., Arnone, E., Gobiet, A., Haslinger, K., Kotlarski, S., Notarnicola, C., Palazzi, E., Seibert, P., Serafin, S., Schöner, W., Terzago, S., Thornton, J. M., Vuille, M., and Adler, C.: Climate Changes and Their Elevational Patterns in the Mountains of the World, Rev. Geophys., 60, e2020RG000730, https://doi.org/10.1029/2020RG000730, 2022. a
Pfister, L., Gohm, A., Kossmann, M., Wieser, A., Babić, N., Handwerker, J., Wildmann, N., Vogelmann, H., Baumann-Stanzer, K., Alexa, A., Lapo, K., Paunović, I., Leinweber, R., Sedlmeier, K., Lehner, M., Hieden, A., Speidel, J., Federer, M., and Rotach, M. W.: The TEAMx-PC22 Alpine field campaign – Objectives, instrumentation, and observed phenomena, Meteorol. Z., 33, 199–228, https://doi.org/10.1127/metz/2024/1214, 2024. a
Piermattei, L., Zemp, M., Sommer, C., Brun, F., Braun, M. H., Andreassen, L. M., Belart, J. M. C., Berthier, E., Bhattacharya, A., Boehm Vock, L., Bolch, T., Dehecq, A., Dussaillant, I., Falaschi, D., Florentine, C., Floricioiu, D., Ginzler, C., Guillet, G., Hugonnet, R., Huss, M., Kääb, A., King, O., Klug, C., Knuth, F., Krieger, L., La Frenierre, J., McNabb, R., McNeil, C., Prinz, R., Sass, L., Seehaus, T., Shean, D., Treichler, D., Wendt, A., and Yang, R.: Observing glacier elevation changes from spaceborne optical and radar sensors – an inter-comparison experiment using ASTER and TanDEM-X data, The Cryosphere, 18, 3195–3230, https://doi.org/10.5194/tc-18-3195-2024, 2024. a
Pineda, N. Jorba, O., Jorge, J., and Baldasano, J. M.: Using NOAA AVHRR and SPOT VGT data to estimate surface parameters: application to a mesoscale meteorological model, Int. J. Remote Sens., 25, 129–143, https://doi.org/10.1080/0143116031000115201, 2004. a, b
Potter, E. R., Orr, A., Willis, I. C., Bannister, D., and Salerno, F.: Dynamical Drivers of the Local Wind Regime in a Himalayan Valley, J. Geophys. Res.-Atmos., 123, 13186–13202, https://doi.org/10.1029/2018JD029427, 2018. a
Reynolds, D., Gutmann, E., Kruyt, B., Haugeneder, M., Jonas, T., Gerber, F., Lehning, M., and Mott, R.: The High-resolution Intermediate Complexity Atmospheric Research (HICAR v1.1) model enables fast dynamic downscaling to the hectometer scale, Geosci. Model Dev., 16, 5049–5068, https://doi.org/10.5194/gmd-16-5049-2023, 2023. a
Reynolds, D., Quéno, L., Lehning, M., Jafari, M., Berg, J., Jonas, T., Haugeneder, M., and Mott, R.: Seasonal snow–atmosphere modeling: let's do it, The Cryosphere, 18, 4315–4333, https://doi.org/10.5194/tc-18-4315-2024, 2024. a
Rotach, M. W. and Zardi, D.: On the boundary-layer structure over highly complex terrain: Key findings from MAP, Q. J. Roy. Meteor. Soc., 133, 937–948, https://doi.org/10.1002/qj.71, 2007. a
Rounce, D. R., Hock, R., Maussion, F., Hugonnet, R., Kochtitzky, W., Huss, M., Berthier, E., Brinkerhoff, D., Compagno, L., Copland, L., Farinotti, D., Menounos, B., and McNabb, R. W.: Global glacier change in the 21st century: Every increase in temperature matters, Science, 379, 78–83, https://doi.org/10.1126/science.abo1324, 2023. a
Sauter, T. and Galos, S. P.: Effects of local advection on the spatial sensible heat flux variation on a mountain glacier, The Cryosphere, 10, 2887–2905, https://doi.org/10.5194/tc-10-2887-2016, 2016. a
Schemann, V., Ebell, K., Pospichal, B., Neggers, R., Moseley, C., and Stevens, B.: Linking Large-Eddy Simulations to Local Cloud Observations, J. Adv. Model. Earth Sy., 12, e2020MS002209, https://doi.org/10.1029/2020MS002209, 2020. a, b
Scorer, R. S.: Theory of waves in the lee of mountains, Q. J. Roy. Meteor. Soc., 75, 41–56, https://doi.org/10.1002/qj.49707532308, 1949. a, b
Shaw, T. E., Buri, P., McCarthy, M., Miles, E. S., Ayala, A., and Pellicciotti, F.: The Decaying Near-Surface Boundary Layer of a Retreating Alpine Glacier, Geophys. Res. Lett., 50, e2023GL103043, https://doi.org/10.1029/2023GL103043, 2023. a, b, c
Shaw, T. E., Buri, P., McCarthy, M., Miles, E. S., and Pellicciotti, F.: Local Controls on Near-Surface Glacier Cooling Under Warm Atmospheric Conditions, J. Geophys. Res.-Atmos., 129, e2023JD040214, https://doi.org/10.1029/2023JD040214, 2024. a
Skamarock, W. C., Klemp, J. B., Dudhia, J., Gill, D. O., Liu, Z., Berner, J., Wang, W., Powers, J. G., Duda, M. G., Barker, D. M., and Huang, X.-Y.: A Description of the Advanced Research WRF Model Version 4, Tech. rep., NCAR Technical Note NCAR/TN-556+STR, https://doi.org/10.5065/1dfh-6p97, 2019. a
Steyn, D. G., Wekker, S. F. J. D., Kossmann, M., and Martilli, A.: Boundary Layers and Air Quality in Mountainous Terrain, in: Mountain Weather Research and Forecasting, edited by: Chow, F. K., De Wekker, S. F. J., and Snyder, B. J., Springer Atmospheric Sciences, Springer Netherlands, 261–289, ISBN 978-94-007-4097-6 978-94-007-4098-3, https://doi.org/10.1007/978-94-007-4098-3_5, 2013. a
Stiperski, I. and Calaf, M.: Generalizing Monin-Obukhov Similarity Theory (1954) for Complex Atmospheric Turbulence, Phys. Rev. Lett., 130, 124001, https://doi.org/10.1103/PhysRevLett.130.124001, 2023. a
Strasser, U., Marke, T., Braun, L., Escher-Vetter, H., Juen, I., Kuhn, M., Maussion, F., Mayer, C., Nicholson, L., Niedertscheider, K., Sailer, R., Stötter, J., Weber, M., and Kaser, G.: The Rofental: a high Alpine research basin (1890–3770 m a.s.l.) in the Ötztal Alps (Austria) with over 150 years of hydrometeorological and glaciological observations, Earth Syst. Sci. Data, 10, 151–171, https://doi.org/10.5194/essd-10-151-2018, 2018. a
Strauss, L., Serafin, S., Haimov, S., and Grubišić, V.: Turbulence in breaking mountain waves and atmospheric rotors estimated from airborne in situ and Doppler radar measurements, Q. J. Roy. Meteor. Soc., 141, 3207–3225, https://doi.org/10.1002/qj.2604, 2015. a
Stull, R. B.: Boundary Conditions and Surface Forcings, in: An Introduction to Boundary Layer Meteorology, edited by: Stull, R. B., no. 13 in Atmospheric Sciences Library, Springer Netherlands, 251–294, ISBN 978-90-277-2769-5 978-94-009-3027-8, https://doi.org/10.1007/978-94-009-3027-8, 1988. a
Stull, R. B.: Practical Meteorology: An Algebra-based Survey of Atmospheric Science, Univ. of British Columbia, ISBN 978-0-88865-283-6, 2017. a
Thompson, G., Field, P. R., Rasmussen, R. M., and Hall, W. D.: Explicit Forecasts of Winter Precipitation Using an Improved Bulk Microphysics Scheme. Part II: Implementation of a New Snow Parameterization, Mon. Weather Rev., 136, 5095–5115, https://doi.org/10.1175/2008MWR2387.1, 2008. a
Turton, J. V., Kirchgaessner, A., Ross, A. N., and King, J. C.: The spatial distribution and temporal variability of föhn winds over the Larsen C ice shelf, Antarctica, Q. J. Roy. Meteor. Soc., 144, 1169–1178, https://doi.org/10.1002/qj.3284, 2018. a, b
Umek, L.: lukasumek/WRF_LES_diagnostics: WRF_LES_diagnostics, Zenodo [code], https://doi.org/10.5281/zenodo.3901119, 2020. a, b
Umek, L., Gohm, A., Haid, M., Ward, H. C., and Rotach, M. W.: Large eddy simulation of foehn-cold pool interactions in the Inn Valley during PIANO IOP2, Q. J. Roy. Meteor. Soc., 147, 944–982, https://doi.org/10.1002/qj.3954, 2021. a
Voordendag, A., Prinz, R., Schuster, L., and Kaser, G.: Brief communication: The Glacier Loss Day as an indicator of a record-breaking negative glacier mass balance in 2022, The Cryosphere, 17, 3661–3665, https://doi.org/10.5194/tc-17-3661-2023, 2023. a, b
Voordendag, A., Goger, B., Prinz, R., Sauter, T., Mölg, T., Saigger, M., and Kaser, G.: A novel framework to investigate wind-driven snow redistribution over an Alpine glacier: combination of high-resolution terrestrial laser scans and large-eddy simulations, The Cryosphere, 18, 849–868, https://doi.org/10.5194/tc-18-849-2024, 2024. a, b, c
Vosper, S. B., Ross, A. N., Renfrew, I. A., Sheridan, P., Elvidge, A. D., and Grubišić, V.: Current Challenges in Orographic Flow Dynamics: Turbulent Exchange Due to Low-Level Gravity-Wave Processes, Atmosphere, 9, 361, https://doi.org/10.3390/atmos9090361, 2018. a
Wagner, J. S., Gohm, A., and Rotach, M. W.: The Impact of Horizontal Model Grid Resolution on the Boundary Layer Structure over an Idealized Valley, Mon. Weather Rev., 142, 3446–3465, https://doi.org/10.1175/MWR-D-14-00002.1, 2014. a
WGMS: Hintereisferner, Alps, https://wgms.ch/products_ref_glaciers/hintereisferner-alps/ (last access: 27 March 2025), 2017. a
Whiteman, C. D. and Doran, J. C.: The Relationship between Overlying Synoptic-Scale Flows and Winds within a Valley, J. Appl. Meteorol., 32, 1669–1682, https://doi.org/10.1175/1520-0450(1993)032<1669:TRBOSS>2.0.CO;2, 1993. a, b, c, d, e, f
WRF: WRF Version 4.1, GitHub [code], https://github.com/wrf-model/WRF/releases/tag/v4.1 (last access: 27 March 2025), 2019. a
Wyngaard, J. C.: Turbulence in the Atmosphere, Cambridge University Press, Cambridge, https://doi.org/10.1017/CBO9780511840524, 2010. a
Zängl, G.: The impact of weak synoptic forcing on the valley-wind circulation in the Alpine Inn Valley, Meteorol. Atmos. Phys., 105, 37–53, https://doi.org/10.1007/s00703-009-0030-y, 2009. a
Zardi, D. and Whiteman, C. D.: Diurnal Mountain Wind Systems, in: Mountain Weather Research and Forecasting, edited by: Chow, F. K., De Wekker, S. F. J., and Snyder, B. J., Springer Atmospheric Sciences, Springer Netherlands, 35–119, ISBN 978-94-007-4097-6 978-94-007-4098-3, https://doi.org/10.1007/978-94-007-4098-3, 2013. a
Zekollari, H., Huss, M., and Farinotti, D.: Modelling the future evolution of glaciers in the European Alps under the EURO-CORDEX RCM ensemble, The Cryosphere, 13, 1125–1146, https://doi.org/10.5194/tc-13-1125-2019, 2019. a
- Abstract
- Introduction
- Methods
- Upstream flow structure and gravity wave features in the glacier valley
- Impact on the glacier boundary layer
- Discussion
- Conclusions
- Appendix A: Vertical cross-glacier (NO_GL simulation) and along-glacier (NO_UP simulation) cross-sections
- Code and data availability
- Author contributions
- Competing interests
- Disclaimer
- Acknowledgements
- Financial support
- Review statement
- References


