the Creative Commons Attribution 4.0 License.
the Creative Commons Attribution 4.0 License.
 | 11 Jul 2025
Diverse causes of extreme rainfall in November 2023 over Equatorial Africa
Masilin Gudoshava
Roméo S. Tanessong
Alain T. Tamoffo
Derbetini A. Vondou
Understanding the atmospheric factors that lead to extreme rainfall events is essential to improve climate forecasting. This study aims to diagnose the physical processes underlying the extreme rainfall event of November 2023 in Equatorial Africa (EA), using the ERA5 reanalysis dataset. Composite, spatio-temporal and correlation analyses are used to shed light on the relationship between the November 2023 extreme precipitation events and the various associated factors. The analysis reveals that these extreme rainfall events were mainly controlled by several factors that occurred during this period in the Pacific, Atlantic and Indian oceans. These factors include strong sea-surface-temperature (SST) anomalies in the Niño-3.4, North Tropical Atlantic, Equatorial Atlantic and Indian Ocean Dipole (IOD) oceanic regions; changes in zonal winds; the Walker circulation; the anomalous moisture flux and its divergence; the easterly jets; and the activity of the Madden–Julian Oscillation (MJO). This convergence of moisture flows entered the EA region through its western and eastern boundaries, coming from the Equatorial Atlantic and Indian oceans, respectively. The juxtaposition of these factors has led to strong and positive rainfall anomalies in EA, with the highest values over the East African region, mainly over southern Ethiopia, Somalia, Kenya and Tanzania, which received more than 430 mm of rainfall during the month. Our findings suggest that many dynamic atmospheric effects need to be taken into account jointly to anticipate this type of extreme event. The results of the present study contribute to the improvement of sub-seasonal to seasonal rainfall forecasts by the region's national meteorological services to enable us to increase the resilience of the region's citizens to these extreme weather conditions.
- Article
(3029 KB) - Full-text XML
- BibTeX
- EndNote


In recent decades, Equatorial Africa (EA) has experienced an increase in the frequency and intensity of extreme events, particularly droughts, torrential rains and floods (Kilavi et al., 2018). In addition, climate-sensitive sectors such as water, transport, health and agriculture are negatively impacted by these events, which have recently increased in magnitude and frequency. Flooding from these extreme events leads to infrastructural and socio-economic damage, water shortages, severe impacts on humans and socio-economic disruption (Funk et al., 2008; Tanessong et al., 2017). With the increase in greenhouse gases, the impacts of these extreme events continue and are projected to increase (Gudoshava et al., 2020; Ngavom et al., 2024). East and Central African countries are the regions influenced by high levels of intra-seasonal to inter-annual variability in rainfall (Lüdecke et al., 2021), which are the main flood-prone countries in Africa (Li et al., 2016). These exceptional flooding events generally occur during October and November months, which correspond to rainy months in Central and East Africa (Wainwright et al., 2020; Nicholson et al., 2022; Kenfack et al., 2024).
During November 2023, EA experienced a very wet period during which many parts of the region were affected by extreme rainfall events, most pronounced over East Africa, where heavy rainfall and floods caused damage in several countries such as Somalia, Ethiopia, Kenya, Burundi and Malawi (https://floodlist.com/africa/east-africa-floods-november-2023-somalia-ethiopia-kenya-burundi-malawi; Herrnegger et al., 2024) and caused up to 90 deaths and more than 113 690 people being temporarily displaced. In Kenya, many areas were devastated by significant flooding. At least 19 of the country's 47 counties were severely affected by the floods, which started at the end of October 2023. More than 46 people lost their lives, and over 58 000 people were displaced by the increased heavy precipitation and subsequent flooding (https://floodlist.com/africa/kenya-floods-update-november-2023, 14 November 2023). In Tanzania, some 10 090 people, or 2018 households, were affected, and 1245 houses were damaged, with over 40 deaths recorded (https://floodlist.com/africa/tanzania-floods-landslides-hanang-district-december-2023, 14 February 2024). Extreme rainfall events also occurred in western EA regions. The Democratic Republic of the Congo (DRC), the Central African Republic (CAR) and Nigeria also experienced significant flooding and landslides, which affected over 90 000 people, and around 10 schools and health centers were destroyed (https://www.unocha.org/publications/report/burkina-faso/west-and-central-africa-weekly-humanitarian-snapshot-15-21-november-2023, 14 February 2024). These conditions have placed EA in a severe food crisis. Given that climate models project a trend of increased extreme rainfall in the region (Fotso-Nguemo et al., 2019) and that the impacts of these extreme events are expected to increase (Gudoshava et al., 2020), it is essential to understand the processes behind these extreme events.
Numerous studies have examined the different causes of November's extreme rainfall in the EA. They have shown that these extreme events were associated with numerous mechanisms linked to sea-surface-temperature (SST) patterns in the tropical Pacific, Atlantic and Indian oceans (Nana et al., 2023, 2024; Palmer et al., 2023; Roy and Troccoli, 2024). These large-scale ocean drivers are the El Niño–Southern Oscillation (ENSO; Palmer et al., 2023), Indian Ocean Dipole (IOD; Nicholson, 2015; Roy and Troccoli, 2024), North Tropical Atlantic (NTA; McHugh and Rogers, 2001; Ingeri et al., 2024) and Equatorial Atlantic (ATL; Dezfuli and Nicholson, 2013). A study by Nicholson (2015) showed that IOD plays a role in the East African rainfall modulation, while Palmer et al. (2023) showed that increased rainfall in this region is due to the presence of positive IOD events during the October–December (OND) season. Following Wahiduzzaman and Luo (2020), several IOD episodes coincide with an ENSO event, and Zhang et al. (2015) found that an ENSO episode can lead to the development of an IOD event through the Walker circulation, which connects the Indian and Pacific oceans. In this context, Roy and Troccoli (2024) have shown that the increase in rainfall over East Africa is linked to the simultaneous presence of two factors, the IOD and ENSO. Moihamette et al. (2022) conducted a similar study but focused on the months of September–October–November over Central Africa. They found that during this period, the warm (positive IOD with El Niño) and cold (negative IOD with La Niña) phases of the IOD and ENSO frequently coincide. The study also showed that positive IOD events contribute significantly to more rainfall in Central Africa after the El Niño effect is removed. Another driver of East African rainfall is the NTA, which leads to more rainfall over many countries, mainly Tanzania, Kenya and Uganda (Ingeri et al., 2024). Over western EA, the Indian Ocean influences the climate system of this region through the ATL region, mainly in October and November (Moihamette et al., 2024). Furthermore, in November, ENSO and IOD were not considered to be important factors in many flood-affected regions, particularly northern regions (north of 5° N; e.g., Moihamette et al., 2022). Consequently, all the events of November 2023 were probably the result of the simultaneous occurrence of several factors. These include SST in the Indian, Atlantic and Pacific oceans; the atmospheric zonal circulation; Walker circulation; Madden–Julian Oscillation (MJO; Madden and Julian, 1971, 1972) activity; moisture transport and divergence; and African jets.
This study aims to identify and analyze the different factors that can sustain these extreme rainfall events in Equatorial Africa. This paper is structured as follows: data and metrics used to diagnose mechanisms are described in Sect. 2 and features in the EA rainfall and ocean SSTs are presented in Sect. 3. Physical processes and underlying mechanisms associated with rainfall extremes are shown in Sect. 4. Section 5 summarizes and concludes the document.
2.1 Data
ERA5 produces monthly estimates of climate variables on a global scale, featuring a horizontal resolution of 31 km (0.25°×0.25°) and 137 vertical levels ranging from the surface to 1 hPa (Hersbach et al., 2020), with data available from 1979 to the present. In this study, we extracted ERA5 monthly data for rainfall (precip in mm d−1), SST (sst in K), zonal and meridional winds (u and v in m s−1), specific humidity (q in kg kg−1), vertical velocity (w in Pa s−1), surface pressure (sp in Pa), total column water vapor (tcwv in mm), 2 m dew point temperature (d2m in K), surface net solar radiation (ssr in J m−2) and low cloud cover (lcc in %). The data span 23 vertical levels, from 1000–200 hPa, and cover the period from November 1981–2023. To assess the ability of ERA5 to reproduce rainfall extremes that occurred in November 2023, the observational dataset from the Climate Hazards Group InfraRed Precipitation with Station dataset (CHIRPS; Funk et al., 2015) is used. This dataset includes high-resolution satellite imagery and station rain-gauge data, available from 1981 to the present, and has a high spatial resolution of 0.05°×0.05°. The SST dataset used in this paper to analyze the oceanic conditions is provided by the Extended Reconstructed Sea Surface Temperature Version 5 (ERSSTv5; Huang et al., 2017). The dataset is available from 1854 to the present at a resolution of 2.0°×2.0°.
2.2 Methods
The atmospheric factors explored in this study include the Dipole Mode Index (DMI), zonal winds; the Walker circulation over EA and the oceans; moisture flux and divergence fields; tropical SSTs in the Pacific, Atlantic and Indian oceans; and tropical waves, namely African easterly waves and the Madden–Julian Oscillation (MJO). We are focusing on these factors because they represent the main contributors to extreme rainfall events in the EA (Kuete et al., 2019; Nicholson et al., 2022; Roy and Troccoli 2024; Gudoshava et al., 2024). The DMI is calculated as the difference between SST anomalies in a western (60–80° E, 10° S–10° N) and an eastern sector (90–110° E, 10–0° S) of the central Indian Ocean. Since several oceans were anomalous during these extreme events, oceanic conditions of additional regions have been analyzed. These are the North Tropical Atlantic (NTA; 5–15° N and 40–15° W), the Equatorial Atlantic (ATL; 3° S–3° N and 20° W–10° E) and Niño-3.4 (5° S–5° N and 170–120° W).
We start our analyses by characterizing rainfall distribution as shown by both CHIRPS and ERA5 over EA (defined as 10° S–10° N, 10–50° E; see red box in Fig. 1). Afterwards, processes associated with November anomaly patterns are diagnosed. We first look at November anomalies in SSTs and specific humidity on the one hand and then at anomalies in wind and moisture flux on the other. The zonal and meridional circulation can be modulated by variations in winds and specific humidity, which can have an impact on the regional hydrological cycle, by either enhancing or weakening it, following the findings by Seager et al. (2010) and Tamoffo et al. (2024).
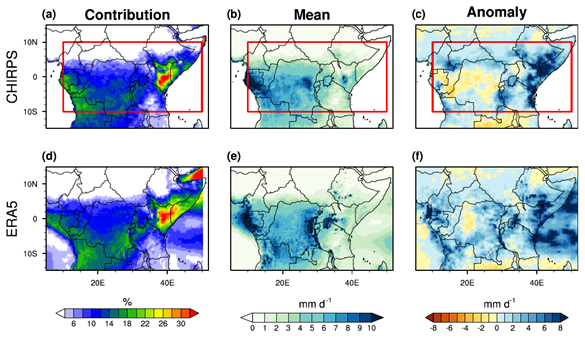
Figure 1(a, d) Percentage contribution of November climatology to total annual rainfall over tropical Africa, (b, e) long-term mean (LTM) (1981–2022) November rainfall and (c, f) November rainfall anomalies. Rainfall anomalies are calculated as the difference between CHIRPS 2023 and CHIRPS LTM November rainfall. The red box indicates the EA region. Publisher's remark: please note that the above figure contains disputed territories.
We have also investigated the water vapor mass transported within the zonal circulation by estimating the zonal mass-weighted stream-functions (ΨZ; Stachnik and Schumacher, 2011; Taguela et al., 2022), following Eq. (1):
where R is the Earth's radius (m), g the constant of gravity, and sp and Ptop the surface and top-level pressure, respectively, and the bracketed term denotes the meridional average of the zonal wind over the latitudes 10° S–10° N.
Research indicates the existence of a shallow zonal overturning circulation over western EA, identified and termed the Congo Basin cell (CB cell) by Longandjo and Rouault (2020). This cell is a closed and shallow zonal circulation confined to the lower troposphere (1000–800 hPa), and it remains active throughout the year. Similar to low-level westerlies (LLWs), the CB cell's intensity and width are influenced by near-surface temperature warming over both the western EA landmass and the eastern Equatorial Atlantic (Longandjo and Rouault, 2020; Taguela et al., 2022). The cell reaches its peak intensity and width in September. According to Longandjo and Rouault (2020), the CB cell's eastern boundary aligns with the Congo Air Boundary, a convergence zone. Here, LLWs originating from the Equatorial Atlantic, after traversing western EA, converge with the easterly winds of the Indian monsoon system, creating the cell's ascending branch. This convergence zone is characterized by peak convection and precipitation. Consequently, the longitudinal position of maximum rainfall in the region is determined by the width of the CB cell. Note that the CB cell is characterized by the negative values of the zonal mass-weighted stream-function (ΨZ<0). This function is used to characterize the Walker-type circulation over the western EA (Longandjo and Rouault 2020; Tamoffo et al., 2022). Environmental conditions for November 2023 are also analyzed through an assessment of vertically integrated moisture transport. Vertically integrated moisture flux (Q; Zheng and Eltahir, 1998) is calculated using Eq. (2), given as follows:
where V is the horizontal wind (m s−1).
For all metrics used in this study, composite anomalies are obtained by removing the 42-year average of the period 1981–2022. For significance testing, Student's t test is applied.
Figure 1 shows the percentage contribution of November rainfall climatology to total annual rainfall (Fig. 1a and d) and November mean rainfall (Fig. 1b and e) and the difference between November 2023 and the long-term mean (LTM) November rainfall (1981–2022; Fig. 1c and f). In general, November 2023 was exceptionally wet throughout the EA, with more rainfall over the eastern Africa area, where monthly anomalies were typically up to 7 mm d−1, than over the western area (Fig. 1c and f). Figure 4a features indices of standardized rainfall anomalies over EA since 1981, based on both CHIRPS and the ERA5 dataset. Extreme positive rainfall anomalies occurred in 1982, 1994, 1997, 2006 and 2019 in most parts of Equatorial Africa. November 2023 features the strongest anomaly since 1981.
Positive anomalies prevail from South Sudan and Ethiopia, around 10–15° N, to at least 10° S over the eastern region, and over northern (Equator to 15° N) and southern (15–5° S) regions, over the western EA area in CHIRPS data (Fig. 1c). There is generally good agreement between ERA5 and CHIRPS except in Congo Republic, northern part of Gabon and central part of DRC, where ERA5 does not well estimate the negative rainfall anomalies (Fig. 1f), and in eastern Africa regions, where ERA5 shows weaker rainfall than CHIRPS. During this month, most parts of the EA region received increased rainfall of up to 2 mm d−1. These areas (except the northern regions) coincide with those that strongly contribute to the annual EA rainfall (Fig. 1a and d) and normally receive at least 3 mm d−1 of total rainfall (Fig. 1b and e). In the typically dry northern regions during November, rainfall ranged between 3 and 9 mm d−1, exceeding the long-term mean (LTM) by approximately 2–8 mm d−1.
4.1 Sea surface temperatures
The tropical SST anomalies for November 2023, as estimated by ERSST and ERA5, are shown in Fig. 2. In both datasets, SST anomalies were predominantly positive throughout the equatorial and subtropical regions of the Pacific and Atlantic oceans. Pacific anomalies were strong and positive over the Equator, where anomalies were on the order of 2–2.9 K. That, and the positive and significant correlations with SSTs in Niño-3.4 (black box in Fig. 3c) indicate that ENSO was a factor in the East African rainfall anomalies of November 2023 (Chobo and Huo, 2024). This ENSO observation occurs when the Indian Ocean features a strong dipole pattern, with positive anomalies in the west pole (10° S–10° N and 50–70° E) and negative in the east pole (10–0° S and 90–110° E). Many studies show that positive ENSO phases are usually associated with positive rainfall anomalies over East Africa (Indeje et al., 2000; Shilenje and Ogwang, 2015; Onyutha, 2016). However, during the two positive El Niño events, 1983 and 1992, East African countries experienced significant droughts (Shisanya, 1990; Ibebuchi, 2021). These previous studies also found that in addition to ENSO, IOD plays an important role in the modulation of precipitation in East Africa. During this 2-year period, IOD was in its negative phase. This shows that it is important to take into account the combined influence of ENSO and IOD in the modulation of precipitation over East Africa before and during the OND season. In this context, a recent study by Roy and Troccoli (2024) showed that when IOD and ENSO are both positive in July–August–September (JAS) and OND, this leads to an increased rainfall over East Africa in OND. Note that in JAS 2023, these two modes were in their positive phase (https://origin.cpc.ncep.noaa.gov/products/analysis_monitoring/ensostuff/ONI_v5.php, last access: June 2025; https://ds.data.jma.go.jp/tcc/tcc/products/elnino/iodevents.html, last access: June 2025). An important remark is the similar patterns in Niño-3.4, IOD, NTA and ATL areas with those in October–November 2019, which were also associated with increased rainfall over East Africa (Nicholson et al., 2022; Ingeri et al., 2024).
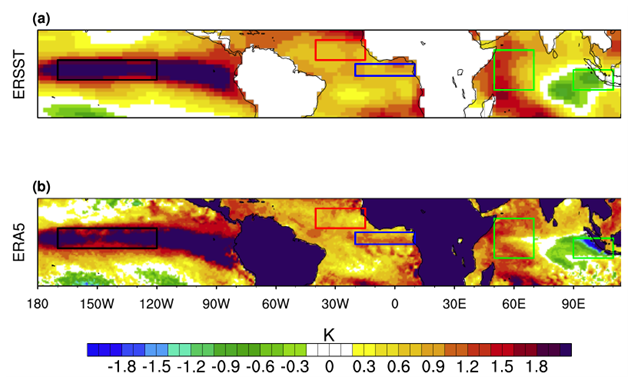
Figure 2SST anomalies during November 2023 for (a) ERSST and (b) ERA5. Red and blue boxes indicate the areas for North Tropical Atlantic (NTA; 5–15° N and 40–15° W) and Equatorial Atlantic (ATL; 3° S–3° N and 20° W–10° E) SST calculations; green boxes indicate the areas for DMI calculation. The black box over the Pacific Ocean is Niño-3.4 (5° S–5° N and 170–120° W).
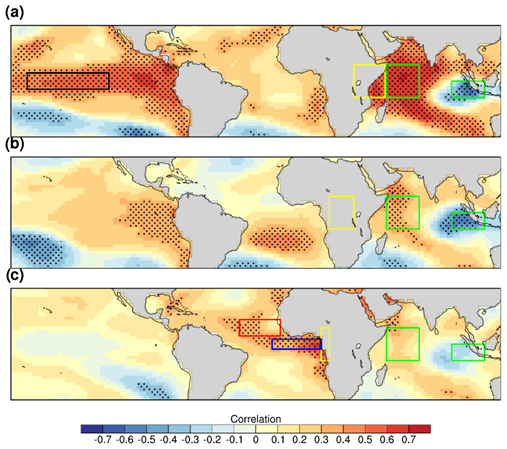
Figure 3Correlation coefficient between the (a) eastern EA (yellow box; 30–50° E), (b) Congo Basin (yellow box; 15–30° E) and (c) western EA (yellow box; 10–15° E) rainfall with SST during 1981–2023 period. The oceanic boxes are the same as those in Fig. 2. The stippling occurs where the correlation is statistically significant at the 95 % confidence level through Student's t test. The SST and rainfall data come from ERSST and CHIRPS, respectively.
Extreme positive values were recorded in November 1997, 2006, and 2019, all of which were exceptionally wet years in eastern EA. The 2023 positive dipole event ranks as the third strongest for November since 1981. Notably, the DMI magnitude in 2023 was smaller than in both November 1997 and 2019, when conditions in EA were considerably drier than in 2023, suggesting that additional factors may have contributed, such as Niño-3.4, which was absent in 2019 but present in 2023. The event may have influenced the CB, as significant correlations between the DMI and rainfall are evident (Fig. 3b), with the strongest impact observed in the far eastern EA region (Dezfuli and Nicholson, 2013). However, rainfall anomalies within CB exhibit both positive and negative values, which can be linked to the IOD due to significant correlations over the IOD regions. While heavy rainfall in both CB and eastern Africa is likely associated with the IOD, this does not hold true for other affected areas. Following Dezfuli and Nicholson (2013), correlations between SST and rainfall suggest that November rainfall in western EA is not influenced by the IOD, a conclusion further reinforced by the correlations in Fig. 3c.
The intense rainfall in western EA can likely be attributed to the Atlantic SST anomalies. It is important to highlight that SSTs along the eastern Atlantic coast and in the central Equatorial Atlantic show a strong positive correlation with November rainfall in western EA, as reported by Lutz et al. (2014). Figure 3c shows correlations of western EA November rainfall with SSTs. Over the Atlantic Ocean, significant and positive correlations between western EA rainfall and SST occur over NTA, ATL and eastern Atlantic coastal regions (Fig. 3c). Moihamette et al. (2024) suggest that in November, the Atlantic Ocean has a significant influence during positive IOD events, induced by its teleconnection with the Indian Ocean. This is characterized by anomalous westerly winds over the central Equatorial Atlantic Ocean (ATL, blue box in Fig. 3c), generating moisture advection towards western EA. These winds originate from the NTA domain (red box in Fig. 3c). Furthermore, these ocean regions featured strong standardized SST anomalies in 2023 (Fig. 4b). A feature to note is the exceptional warmth of SSTs in November 2023 over the NTA area (red line in Fig. 4b). Over the 1981–2023 period, the 2023 anomalies were the warmest on record. Another feature of NTA variability is its positive correlation (r>0.2) with eastern EA rainfall (Fig. 3a). A recent study by Ingeri et al. (2024) showed that positive SST anomalies in NTA from October–December led to enhanced East African rainfall, mainly over Tanzania, Kenya and southern Uganda. In addition, the SST time series over the Equatorial Atlantic showed that the 2023 anomalies led to the second warmest year after the November 2019 anomalies, which led to a significant increase in rainfall over western EA (Nicholson et al., 2022; Kenfack et al., 2024).
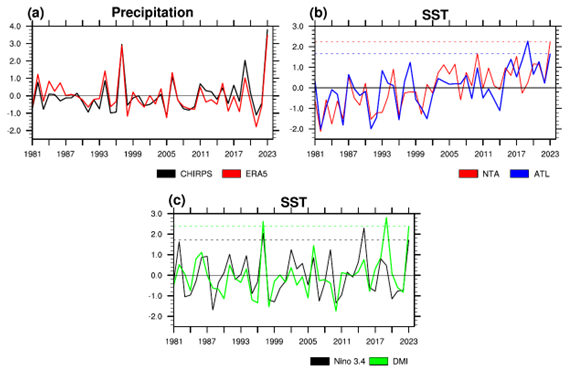
Figure 4(a) Indices of standardized rainfall anomalies over 1981–2023, averaged over the red box indicated in Fig. 1. (b) Indices of standardized SST anomalies over 1981–2023, average over the NTA and ATL oceanic regions. (c) As in (b) but for the DMI and ENSO index averaged over the IOD and Niño-3.4 oceanic regions. The SST data come from ERSST. The dashed horizontal lines in (b) and (c) indicate values for the year 2023.
The time series of SSTs for the Niño-3.4 region over the period 1981–2023 (black line in Fig. 4c) indicates the warmth in November 2023. During this period, the 2023 anomalies ranked among the three warmest years on record. This Pacific sector exhibits the strongest correlation with November rainfall over the CB (Moihamette et al., 2022) and over eastern EA (Fig. 3a; Palmer et al., 2023; Chobo and Huo, 2024; Roy and Troccoli, 2024). These SST anomalies likely played a key role in the positive rainfall anomalies observed in eastern EA, especially in coastal areas, as well as in the CB. Roy and Troccoli (2024) showed that when IOD and ENSO are both positive in November, this contributes to excessive rainfall over the whole of East Africa; south of the DRC; and north of Angola, Nigeria and CAR, while deficit rainfall occurs over certain parts of DRC. In this context, the study by Moihamette et al. (2022) showed that during simultaneous positive IOD and ENSO events, the influence of the positive phase of IOD on EA rainfall is significant with the non-El Niño effect, and this is characterized by an increase in moisture advection towards EA that contributes to an enhancement of rainfall intensity, which is more pronounced over eastern and western EA.
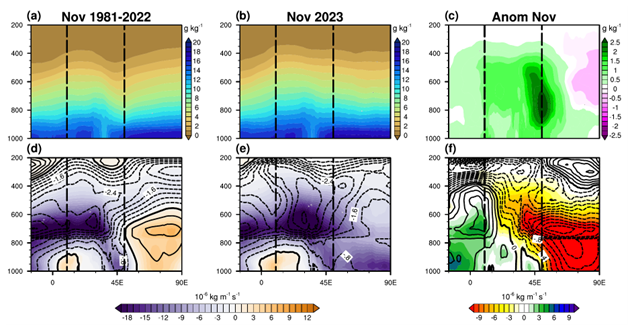
Figure 5Longitude–height cross-sections of (first row) specific humidity and (second row) zonal moisture flux (shaded: ) and zonal wind (contour: m s−1) for (a, d) the climatology of November 1981–2022, (b, e) November 2023 and (c, f) the anomaly, averaged between 10° S–10° N. The dashed black lines denote the limits of EA.
4.2 Dynamic factors associated with the November 2023 extreme rainfall
Many studies (e.g., Pokam et al., 2011, 2014; Taguela et al., 2022) have proposed a physical mechanism for modulating the long rains over CB on interannual timescales. They identified that changes in the low-level westerlies (LLWs) over the Equatorial Atlantic Ocean play a significant role in this modulation. These westerlies influence the moisture transport and atmospheric conditions over the region (Nana et al., 2023), impacting the onset, intensity and duration of the long rains. Variations in LLWs can alter the regional climate patterns, and this mechanism helps explain the variability in the long rains in relation to other climatic phenomena, such as the ENSO.
The maximum moisture convergence over equatorial Central Africa in SON is found to be a consequence of low-level moisture advection from the Atlantic Ocean. The subsequent LLWs are controlled by the heating contrast between land and ocean (Pokam et al., 2014). These heating contrasts lead to a Walker-type circulation over the Atlantic Ocean and equatorial Central Africa with the development of LLWs as its lower branch. These LLWs over the Equatorial Atlantic are strongly correlated with DMI (Moihamette et al., 2024). For East Africa rainfall variability, numerous studies have identified ENSO and IOD as the two main atmospheric drivers that influenced the October–November–December (OND) rainfall (Indeje et al., 2000; Shilenje and Ogwang, 2015; Roy and Troccoli, 2024). Following Black (2005), these drivers play an important role in the moisture convergence over East Africa through moisture advection from the Indian Ocean, even if they are not independent of each other. Roy and Troccoli (2024) showed that when ENSO and IOD are in the same phase during JAS, the Walker-like circulation appears to play a major role in changing the ascending branch into a descending branch in two situations (positive and negative phases) during the OND period.
4.2.1 Zonal circulation/winds, Walker circulation and water vapor mass transported over tropical oceans
Following the recent study of Longandjo and Rouault (2024), rainfall variability over EA is highly dependent on moisture inputs linked to atmospheric circulation. It is therefore important to show the characteristics of these moisture inputs to identify their oceanic origin.
Figure 5 depicts the vertical profile of specific humidity (first row) and zonal moisture flux (shaded) overlaid by zonal wind (contour; second row) in November for the climatology of 1981–2022 (Fig. 5a and d), 2023 average (Fig. 5b and e) and anomaly (Fig. 5c and f), averaged between 10° S–10° N.
Over the Indian Ocean, the 1981–2022 climatology is characterized by intense westerly flux, whereas the November 2023 average appears to be an easterly flux (Fig. 5d and e). Over the continent, moisture flux is predominantly easterly or westerly during November 2023, as in the climatology. We can conclude from this that two distinct mechanisms govern the moisture flux over the Indian Ocean and the continent. It is noteworthy that the anomaly analysis (Fig. 5c) confirms that there was more moisture over the EA in November 2023 than in the 1981–2022 climatology. This moisture surplus appears here to extend up to 400 hPa and is more pronounced over eastern EA between 900 and 500 hPa.
In addition, from the Atlantic Ocean, the westerly wind in 2023 was more pronounced near 30° E compared to the climatology (near 17° E). These results lead to a strong moisture flux from the Atlantic (Indian) Ocean over western (eastern) EA (Fig. 5f), following the work of Chadwick et al. (2016), who showed that increased humidity over land would be a response to increased moisture advection from the oceans under warming. The easterly flux over eastern EA is strong in the middle troposphere, where strong moisture is observed. It is interesting to note that the intensity of the LLW anomalies appears to extend to the upper troposphere (mainly 300 hPa). In conclusion, the intensification of the zonal wind over EA indicates that this moisture (strong from 900 hPa) probably comes from both the Equatorial Atlantic and the Indian oceans.
The preceding anomaly analysis leads us to conclude that both the Atlantic and Indian oceans contribute to the moisture increase (and thus more rainfall in November 2023) over the EA and that ENSO has a possible contribution mainly over the eastern EA. This suggests large-scale tropical climate control. To examine the links with tropical circulation, large-scale wind, omega and water vapor mass transport, field analyses are carried out, and the results are presented in Figs. 6–9.
From the lower to the upper troposphere, anomalous westerly (easterly) winds across the Equatorial Atlantic (western Indian) region penetrate the EA domain through its western (eastern) border (Fig. 6a–c). These westerly winds come from the NTA region (in the lower troposphere, Fig. 6a). Over eastern EA, the heavy rains of November 2023 were accompanied by a weakening of the westerly winds and reduced subsidence in the Indian Ocean, resulting in a supply of moisture to the continent (Hastenrath et al., 2010, 2011).
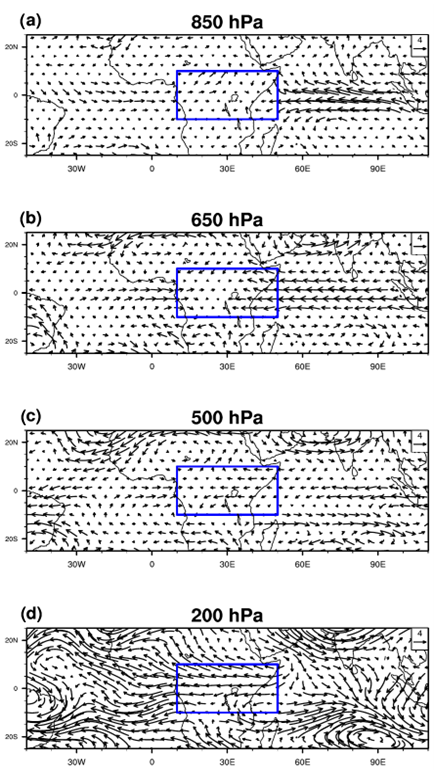
Figure 6Vector wind (m s−1) anomalies (November 2023 minus 1981–2022 mean) at (a) 850 hPa, (b) 650 hPa, (c) 500 hPa and (d) 200 hPa. The blue box indicates the EA region.
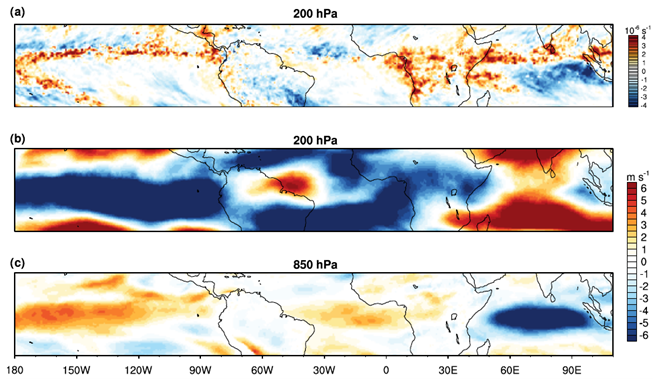
Figure 7Anomalies of (a) divergence () at 200 hPa and (b, c) zonal wind (m s−1) at (b) 200 hPa and (c) 850 hPa.
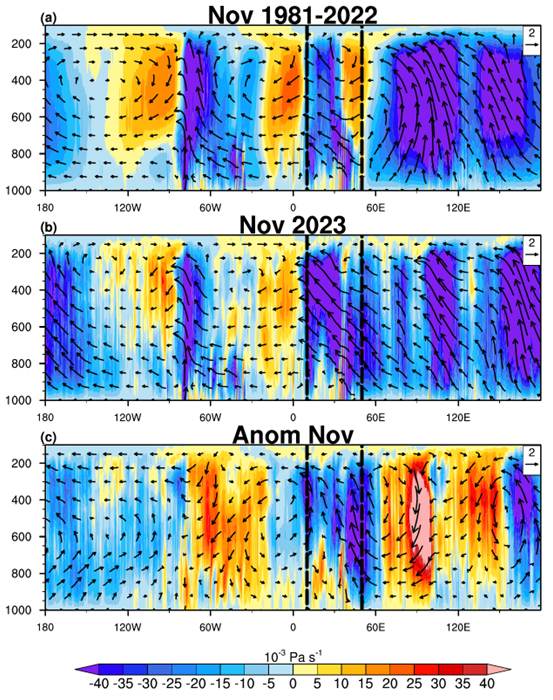
Figure 8Longitude–height cross-sections of vertical velocity (omega: ) selected over latitudes of 10° S–10° N in November for (a) climatology, (b) November 2023 and (c) anomalies. The shading (background) represents the vertical velocity, with negative values denoting ascent motions and positive values indicating subsidence. Additionally, the vectors (overlay: m s−1), obtained with the zonal wind component and vertical velocity, illustrate the behavior of the air mass during upward or downward movements. The dashed black lines denote the limits of EA.
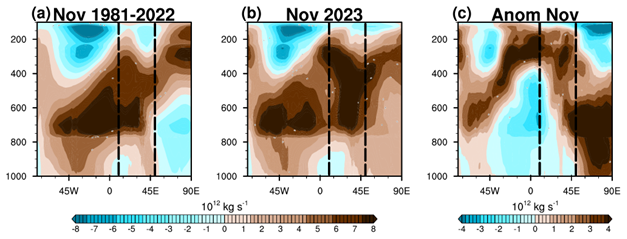
Figure 9Zonal mass-weighted stream function (contours: 1011 kg s−1) averaged between 10° S–10° N for (a) the mean, (b) November 2023 and (c) November 2023 minus the mean. Positive (negative) values indicate the westward (eastward) circulation. The dashed black lines denote the limits of EA.
In addition, both over the Equatorial Pacific and Equatorial Atlantic oceans and over western EA, westerly anomalies feature at 850 hPa, while easterly anomalies are evident over the equatorial Indian Ocean (Fig. 7c). Inverse anomalies are observed at 200 hPa (Fig. 7b), suggesting that the west–east zonal circulation is subject to changes. These are later shown by upper-level divergence and vertical motion analysis. Equatorial Africa and the coasts of the Atlantic and Indian oceans feature strong divergence at 200 hPa, followed by strong convergence over the NTA and eastern Indian Ocean regions (Fig. 7a); a reverse divergence anomalies' pattern characterizes lower-troposphere level (not shown). These patterns are consistent with Walker circulation, which has been examined by both vertical velocity (omega) and zonal wind combined with vertical velocity (Fig. 8). Note that negative values of omega denote ascent motions and positive values indicate subsidence.
For the 1981–2022 climatology (Fig. 8a), omega indicates that the ascent motions of the Indian Ocean Walker cell are very pronounced. The western Atlantic Ocean is characterized by strong rising motions, while the eastern Atlantic Ocean experiences sinking motions. Over western Africa (10–30° E), the entire atmospheric column shows significant upward motion, whereas in eastern Africa (30–45° E), rising motions dominates at low levels, while sinking motions prevail in the middle and upper troposphere. This subsidence in eastern Africa leads to reduced rainfall. These findings are consistent with those observed during the exceptional October–November 2019 events, as noted by Nicholson et al. (2022). By contrast, these branches are weak in general during November 2023 (Fig. 8b). In contrast to climatology, 2023 shows strong ascendance in the middle and upper troposphere over eastern Africa. Here, we focus on three patterns of omega (color) and zonal wind combined with vertical velocity (vector) to evaluate the location and strength of the African Walker circulation cells. Anomalous rising motions correspond to areas with low-level converging vectors, mid-level ascent motions and upper-level diverging vectors that will typically experience more rainfall. Following Fig. 8c, at 850 hPa, anomalous rising (sinking) motions are associated with areas of westerly (easterly) anomalies. At 200 hPa, anomalous ascendance (subsidence) corresponds to areas of easterly (westerly) anomalies.
It is noteworthy that rainfall deficits are observed over the Congo Basin, around 15–35° E. This region of rainfall deficits is linked to a corresponding area of reduced rising motion at low levels (Fig. 8c). Over the three oceans, the zonal cells are weaker but more pronounced over the Atlantic and Indian oceans than the Pacific Ocean. In the case of the Pacific Ocean, the increase in Pacific cells is linked with the El Niño events; the cells are moved westward, and vertical motion anomalies are weak along the coast of South America. Thus, the SST's El Niño pattern could be highly developed. Both the Atlantic and the Indian oceans feature greater vertical motion contrasts than the Pacific Ocean. This is characterized by an increased ascent (subsidence) over the eastern (western) Atlantic Ocean and western (eastern) Indian Ocean. The consequence is a strengthening of the ascent which extends over Equatorial Africa and is accompanied by an increase in rainfall over Africa, mainly in East Africa.
To further investigate the vertical motion, the water vapor mass transport analysis is done through the mass-weighted stream-function (Fig. 9). For the climatology mean (Fig. 9a), the CB cell (ψ<0) is located between 1 and 18° E and extends up to 950 hPa, whereas it occurs at −1 and 28° E and extends around 975 hPa during November 2023 (Fig. 9b). These CB cell locations coincide with the Walker cell ascending branch (Fig. 8a and b) over EA, which is more intense during November 2023 and associated with sinking branches over the Equatorial Atlantic and Indian oceans (Figs. 8c and 9c). Near to 800 hPa, the CB cell westward (ψ>0) of the circulation is greater during November 2023 (Fig. 9c), leading to the presence of an easterly jet in the middle troposphere. These results confirm those obtained by the Walker circulation and, consequently, the pattern of rainfall anomalies.
4.2.2 Moisture flux divergence
Figure 10 shows the vertically integrated (1000–200 hPa) moisture flux convergence (color) and vertically integrated moisture flux (vectors). Positive values indicate convergence, and negative values indicate divergence. Overall, the whole of EA exhibits moisture convergence with strong and significant moisture convergence in areas which feature strong and positive rainfall anomalies (Fig. 1c and f). The weak moisture divergence observed over the central part of DRC confirms the weak and negative rainfall anomalies also observed in this area. Note that all vectors in the EA region originate from the two neighboring oceans through the western and eastern boundaries only. As for the western and eastern borders of the EA, we note a weakness of the meridional component along the northern and southern borders compared to the size of the zonal component. This confirms that these two oceans were mainly responsible for the wet episodes of 2023. The strong westerly winds become southwesterly to easterly, advecting moist air from the Atlantic Ocean towards the northern regions (Gabon, northern DRC, CAR and Cameroon). It is noteworthy that the strong westerly winds over the Equatorial Atlantic originate from the NTA region, where strong and significant moisture divergence has been observed (not shown). For the eastern EA boundary, strong easterly winds from the Indian Ocean advect moist air in eastern and some southern regions, mainly over Somalia, southwest Ethiopia, eastern Kenya, Uganda and northern Angola. These results confirm the warm SST feature over oceans in Fig. 2. Although the November 2023 DMI is lower than that in 2019, when the strongest positive IOD event since the 1950s occurred during October and November (Nicholson et al., 2022), the eastern region of EA was wetter in 2023 compared to 2019. This can be seen through the convergence and moisture flux anomalies and consequently the higher precipitation in November 2023. One explanation could be the significant presence of the El Niño event in 2023, which contributed to humidifying the East Africa region (Palmer et al., 2023; Roy and Troccoli, 2024), unlike 2019, when during the positive IOD event, the El Niño episode was absent (Nicholson et al., 2022).
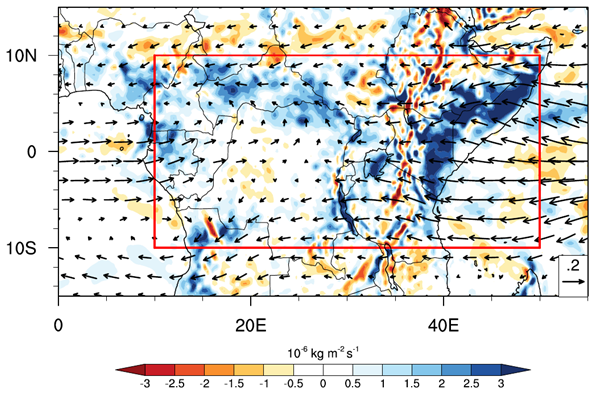
Figure 10(a) Anomalies of vertically integrated (1000–200 hPa) moisture flux (vectors: ) and vertically integrated moisture flux convergence (positive values) or divergence (negative values) anomalies (shading: ). Only significant vectors (shading) above the 90 % (95 %) level are shown. The red box indicates the EA region. Publisher's remark: please note that the above figure contains disputed territories.
The northern regions (western Nigeria, northern Cameroon, southern Chad, CAR and South Sudan), which receive less than 2 mm d−1 of rainfall and have a near-zero percentage contribution of November rainfall (Fig. 1a, b, d, e), recorded heavy rainfall in November 2023 (Fig. 1c–f). Similarly to the results of Nicholson et al. (2022) for October 2019, Fig. 11a confirms this northward displacement of the state of the African rain band in November 2023. During this year, the 35 mm isopleth of the total column water vapor and the intertropical discontinuity (dashed blue and red lines, respectively) move to the north, enhancing rainfall in the northern regions. These dashed lines correspond to the limit of the anomalous meridional mean sea level pressure gradient, characterized by anomalous high pressure over the area south of the 35 mm isopleth of the total column water vapor and the intertropical discontinuity lines and lower pressure over the north, except over the eastern EA areas. A similar pressure, intertropical discontinuity, 35 mm isopleth of the total column water vapor, and easterly (westerly) moisture flux anomaly were observed over eastern EA (Gabon, CAR and Chad) in October (November) 2019 when extreme rainfall and flooding occurred in the latter country (Nicholson et al., 2022). As shown in Fig. 11b, low cloud cover (LCC) is below average in the southwest of EA (mainly over CB and south of Cameroon and Gabon) except in southwestern CB and northern Angola (10–20° E, 6–10° S), but it becomes above average over the northern part of EA (mainly over CAR) and the whole of East Africa. These positive LCC anomalies coincide with positive and strong surface net solar radiation anomalies. These spatial differences in atmospheric convective activity revealed by LCC and surface net solar radiation explain the spatial variations in rainfall anomalies shown in Fig. 1c and f.
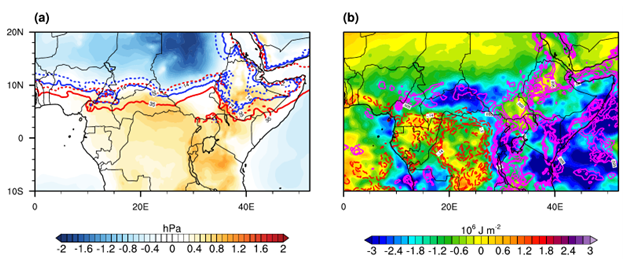
Figure 11(a) The anomalous state of the African rain band in November 2023 is characterized by mean sea level pressure anomalies (colored) relative to the 1981–2022 average, along with the positions of the intertropical discontinuity (ITD) and total column water vapor isopleths. The ITD is indicated by the 14 °C 2 m dew point temperature contours, with the mean ITD position shown by a solid blue line and the November 2023 position by a dashed blue line. Similarly, the mean location of the 35 mm total column water vapor isopleths is marked by a solid red line, while the November 2023 position is represented by a dashed red line. (b) Spatial representation of the surface net solar radiation anomalies (shading: 106 J m−2). Red (magenta) lines represent negative (positive) low-cloud-cover (%) anomalies. Publisher's remark: please note that the above figure contains disputed territories.
4.2.3 LLWs, easterly jets and MJO activity
One of the key atmospheric features over western EA are the African Easterly Jet (AEJ) and Tropical Easterly Jet (TEJ). Following Nicholson and Grist (2003), AEJ and TEJ are maximum easterly winds that occur in the mid-troposphere (from 700–600 hPa) and upper troposphere (around 200 hPa), respectively. Here, we describe the characteristics of these atmospheric features during the November 2023 extreme rainfall. The African Easterly Jet's southern component (AEJ-S) only appears from September–November, and its jet core is located at around 10° S in November (Kuete et al., 2022). In contrast to the AEJ-S, the northern component (AEJ-N) occurs during all months of the year, and its core is located at around 5° N in November. Like the AEJ-N, the TEJ features during all months and is located near to and south of the Equator. Nicholson and Grist (2003) showed that Central Africa is a region where the divergence of the upper troposphere (Fig. 7a) is enhanced, which could favor convective activity (Fig. 8c), suggesting that the variability in the TEJ may influence the variability in precipitation in the region. Figure 12 shows latitude–height cross-sections of easterly winds (dashed contours) of the 1981–2022 November mean and November 2023 at 10° E, overlaid by the zonal moisture flux (color) calculated from the west boundary (10° E) minus east boundary (30° E).
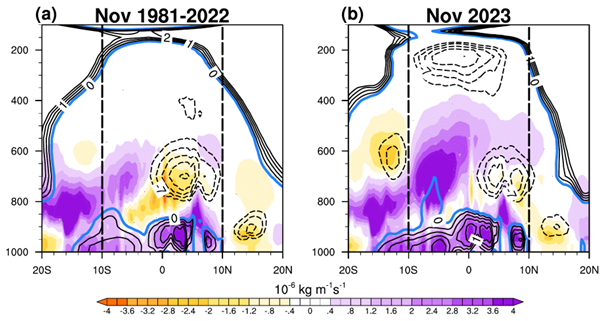
Figure 12Latitude–height cross-sections of net zonal moisture flux () calculated from the west boundary (10° E) minus east boundary (30° E) for (a) climatology and (b) November 2023. Solid (dashed) black lines represent LLWs (AEJ components and TEJ; ) with a contour interval of 0.5 (1) m s−1, calculated at 10° E for the respective periods. Positive values indicate moisture flux convergence and negative values moisture flux divergence. The dashed black lines denote the limits of EA.
For the mean climatology (Fig. 12a), only AEJ-N is observed at around 3° N at 700 hPa, with core speeds reaching 10 m s−1. This intensification of AEJ-N coincides with strong moisture flux divergence. During November 2023 (Fig. 12b), both AEJ components and TEJ are present in the middle and upper troposphere, respectively. During this year, the mid-level zonal moisture convergence (divergence) induced by the weak AEJ-S (jet core not exceeding 7 m s−1; Kuete et al., 2019) increases (decreases), favoring increases in mid-tropospheric moisture convergence south of the Equator over western EA and resulting in wet conditions over the domain (Fig. 1c and f). AEJ-N moves further north and its intensity decreases from 10–8 m s−1, also leading to more western EA rainfall during positive IOD events, which is more pronounced during the October–November months (Moihamette et al., 2024). Following Moihamette et al. (2024), this decrease in the AEJ-N drove the equatorial easterly moisture transport to the western EA. These conclusions are in agreement with a study by Dezfuli and Nicholson (2013) showing that during October and November, the months with stronger (weaker) AEJ components experience dry (wet) conditions over western EA. Also, Nicholson and Grist (2003) showed that when both AEJ components are present, western EA's rain band moves further south (10° S to the Equator); this is only observed during November. Another feature is that the LLWs, which are weak in climatology, were anomalously strong and extended up to 700 hPa, mainly over Southern Hemisphere latitudes. These wind changes lead to enhanced rainfall in western EA during the SON seasons (Pokam et al., 2014; Kuete et al., 2019; Taguela et al., 2022).
Here, we analyze one of eastern Africa's intra-seasonal climate drivers, the MJO, through the Real-time Multivariate MJO (RMM) index. This later strongly influences the Equatorial Africa region's rainfall during March–April–May (Sandjon et al., 2012) and November and December (Pohl and Camberlin, 2006; Berhane and Zaitchik, 2014; Berhane, 2016; Zaitchik, 2017; Palmer et al., 2023). According to Pohl and Camberlin (2006) and Kimani et al. (2020), during phases 6–8 (1–4) of the MJO, there is an increased chance of the highest rainfall over the coastal (highland) regions of East Africa during OND months, through moisture advection from the Indian Ocean. The ENSO–MJO relationship was studied by Pohl and Matthews (2007), who found that maximum MJO activity is often observed during El Niño events. In addition, Berhane (2016) showed that this juxtaposition of MJO activity and ENSO events leads to an increase in precipitation that is greater than when El Niño events are absent.
Figure 13 shows the MJO phase space diagram for November 2023, based on the RMM index. It should be noted that the MJO was active for 19 d, during phases leading to wet periods in the highland and coastal areas of East Africa (Pohl and Camberlin, 2006; Berhane and Zaitchik, 2014; Zaitchik, 2017). During November 2023, the MJO was in phases 6–8 from 8–19 November, which are the phases leading to wet spells over the East African coast (Pohl and Camberlin, 2006; Zaitchik, 2017), mainly over Somalia and the eastern parts of the Ethiopia, Tanzania and Kenya regions. Also, during 20–25 and 30 November 2023, the MJO was in phases 1, 2 and 4, which are the phases typically associated with increased rainfall over the highland region of East Africa (Pohl and Camberlin, 2006), mainly over Uganda, the western and northern part of Kenya, and Tanzania.
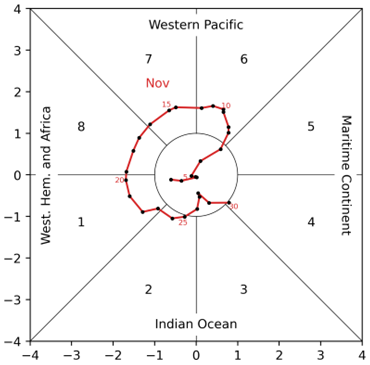
Figure 13Madden–Julian Oscillation (MJO) phases and intensity (red line) space diagram for November 2023. Each black dot represents the value for a given day, with selected dates labeled in red (source: NOAA/NCEI, https://www.ncei.noaa.gov/access/monitoring/monthly-report/synoptic/202311, last access: 26 November 2024).
This study examines the extreme wet conditions that occurred in November 2023 in Equatorial Africa (EA) and shows that this rainy episode was caused by several factors. While some anomalous rainfall over both western and eastern Equatorial Africa was attributed to moisture transport from the Atlantic and Indian oceans, respectively, the unusually very strong November 2023 MJO activity was a significant factor. In addition to meteorological conditions, further research is therefore needed to quantify the roles that dynamic and thermodynamic processes played in the extreme events of November 2023. The most important findings of this study are as follows:
-
Although the rain band in November is over the area to the south of the Equator, many northern areas feature positive rainfall anomalies, most pronounced over eastern Africa. These strongest November 2023 rainfall anomalies occurred when significant SST anomalies were observed in the three equatorial oceans.
-
In contrast to the extreme rainfall of November 2019 in East Africa, where the DMI reached record levels, the DMI of November 2023, which is lower than that of 2019, caused more rainfall. This may be due to the presence of strong El Niño conditions over the Equatorial Pacific in 2023. But over Central Africa, the rainfall anomalies in 2023 are lower than in 2019, certainly due to the state of the Equatorial Atlantic Ocean, which was warmer in 2019 than in 2023.
-
SST anomalies over the Atlantic (Indian) Ocean are associated with anomalous westerly (easterly) winds that bring more moisture over EA (Fig. 5c). Moisture flux from both oceans (Fig. 5f) induced a weakening of the ascending and descending branches of both neighboring oceans' Walker-like cells (Figs. 8 and 9).
-
The westerly moisture flux from the Atlantic Ocean that veered into southwesterlies moved the rain belt further north by enhancing the transport of moist air over the northern (5–10° N) regions (Fig. 11).
-
Over western EA where extreme rain also occurs, the African wind and easterly wind regime is an important factor. The presence of strong equatorial westerlies, AEJ-S and TEJ, and the movement of AEJ-N further north have also retarded the retreat of the West African rain band, causing positive rainfall anomalies over northern areas (especially over Nigeria, Cameroon, CAR, Sudan and southern Chad).
-
Another driver is the MJO activity, which was active during several days of November 2023 (Fig. 12). We have shown that the positive rainfall anomalies over East Africa coincided with active phases of MJO, which enhanced rainfall in November over both western and eastern areas of East Africa. This increase in rainfall was significant with the occurrence of the El Niño events.
This study demonstrates that the anomalous wetness conditions over Equatorial Africa were caused mainly by the Atlantic and Indian oceans, through the anomalous moisture transport and moisture flux divergence, Walker circulation, and changes in the zonal winds induced by extremely strong SST anomalies. These anomalous patterns were similar to those observed over this region in October–November 2019, when extreme rainfall occurred, following Nicholson et al. (2022). The present study demonstrates the importance of accounting for ocean–atmosphere interactions in intra-seasonal forecast models to refine regional climate information provided to policymakers. It is important to highlight that the robustness of these findings requires additional evaluation. Our study exclusively examines the meteorological causes of these extreme events. Further investigations should encompass the roles that dynamic and thermodynamic processes played in these November 2023 events.
Figures shown in this study are plotted using the NCAR Command Language (NCL; https://doi.org/10.5065/D6WD3XH5, NCAR Command Language, 2017). Codes can be obtained from the corresponding author.
All observational and reanalysis data used in this study are publicly available at no charge and with unrestricted access. One plot is generated using the website of NOAA/NCEI at https://www.ncei.noaa.gov/access/monitoring/monthly-report/synoptic/202311 (NOAA/NCEI, 2025). The ERA5 reanalysis is produced within the Copernicus Climate Change Service (C3S) by the ECMWF and is accessible via the link https://cds.climate.copernicus.eu/datasets/reanalysis-era5-pressure-levels-monthly-means?tab=download (Hersbach et al., 2023); the CHIRPS2 data are available at https://data.chc.ucsb.edu/products/CHIRPS-2.0/global_daily/netcdf/p05/by_month/ (UCSB, 2025); the ERSST data are available at https://iridl.ldeo.columbia.edu/SOURCES/.NOAA/.NCDC/.ERSST/.version5/.sst/ (Huang et al., 2017, last access: 8 July 2025).
HNN: conceptualization; data upload; data analysis; formal analysis; investigation; methodology; software; validation; writing – original draft; writing – review and editing. MG: project administration; supervision; formal analysis; investigation; validation; writing – original draft; writing – review and editing. RST: project administration; supervision; validation; methodology; writing – review and editing. ATT: project administration; validation; methodology; writing – review and editing. DAV: project administration; supervision; validation, methodology; writing – review and editing.
The contact author has declared that none of the authors has any competing interests.
Publisher's note: Copernicus Publications remains neutral with regard to jurisdictional claims made in the text, published maps, institutional affiliations, or any other geographical representation in this paper. While Copernicus Publications makes every effort to include appropriate place names, the final responsibility lies with the authors.
The authors thank all the reanalysis, observational and satellite data providers used in this study. We would like to express our gratitude to the anonymous reviewers, along with the editor, for their constructive suggestions, which have greatly improved the quality of the paper. We gratefully appreciate the efforts of the International Joint Laboratory Dynamics of Terrestrial Ecosystems in Central Africa (IJL DYCOCA/LMI DYCOFAC) initiative during the realization of this work.
This paper was edited by Dariusz Baranowski and reviewed by two anonymous referees.
Berhane, F. and Zaitchik, B.: Modulation of daily precipitation over East Africa by the Madden–Julian oscillation, J. Climate, 27, 6016–6034, https://doi.org/10.1175/jcli-d-13-00693.1, 2014.
Berhane, F. G.: Intraseasonal Precipitation Variability Over Tropical Africa, Ph. D., Johns Hopkins University, Baltimore, MD, USA, 2016.
Black, E.: The relationship between Indian Ocean sea–surface temperature and East African rainfall, Phil. Trans. R. Soc. A. 363, 43–47, https://doi.org/10.1098/rsta.2004.1474, 2005.
Chadwick, R., Good, P., and Willett, K.: A simple moisture advection model of specific humidity change over land in response to SST warming, J. Climate, 29, 7613–7632, https://doi.org/10.1175/jcli-d-16-0241.1, 2016.
Chobo, J. S. and Huo, L.: The relationship between extreme precipitation events in East Africa during the short rainy season and Indian Ocean Sea surface temperature, J. Geosc. Env. Prot., 12, 1–16, https://doi.org/10.4236/gep.2024.129001, 2024.
Dezfuli, A. K. and Nicholson, S. E.: The relationship of rainfall variability in Western Equatorial Africa to the tropical oceans and atmospheric circulation. Part II: The Boreal Autumn, J. Climate, 26, 66–84, https://doi.org/10.1175/jcli-d-11-00686.1, 2013.
Fotso-Nguemo, T. C., Diallo, I., Diakhaté, M., Vondou, D. A., Mbaye, M. L., Haensler, A., Gaye, A. T., and Tchawoua, C.: Projected changes in the seasonal cycle of extreme rainfall events from CORDEX simulations over Central Africa, Climatic Change, 155, 339–357, https://doi.org/10.1007/s10584-019-02492-9, 2019.
Funk, C., Dettinger, M. D., Michaelsen, J. C., Verdin, J. P., Brown, M. E., Barlow, M., and Hoell, A.: Warming of the Indian Ocean threatens eastern and southern African food security but could be mitigated by agricultural development, P. Natl. Acad. Sci. USA, 105, 11081–11086, https://doi.org/10.1073/pnas.0708196105, 2008.
Funk, C., Peterson, P., Landsfeld, M., Pedreros, D., Verdin, J., Shukla, S., Husak, G., Rowland, J., Harrison, L., Hoell, A., and Michaelsen, J.: The climate hazards infrared precipitation with stations – a new environmental record for monitoring extremes, Sci. Data, 2, 150066, https://doi.org/10.1038/sdata.2015.66, 2015.
Gudoshava, M., Misiani, H. O., Segele, Z. T., Jain, S., Ouma, J. O., Otieno, G., Anyah, R., Indasi, V. S., Endris, H. S., Osima, S., Lennard, C., Zaroug, M., Mwangi, E., Nimusiima, A., Kondowe, A., Ogwang, B., Artan, G., and Atheru, Z.: Projected effects of 1.5 °C and 2 °C global warming levels on the intra-seasonal rainfall characteristics over the Greater Horn of Africa, Environ. Res. Lett., 15, 034037, https://doi.org/10.1088/1748-9326/ab6b33, 2020.
Gudoshava, M., Nyinguro, P., Talib, J., Wainwright, C., Mwanthi, A., Hirons, L., de Andrade, F., Mutemi, J., Gitau, W., Thompson, E., Gacheru, J., Marsham, J., Endris, H. S., Woolnough, S., Segele, Z., Atheru, Z., and Artan, G.: Drivers of sub-seasonal extreme rainfall and their representation in ECMWF forecasts during the Eastern African March-to-May seasons of 2018–2020, Meterol. Appl., 31, e70000, https://doi.org/10.1002/met.70000, 2024.
Hastenrath, S., Polzin, D., and Mutai, C.: Diagnosing the droughts and floods in Equatorial East Africa during boreal autumn 2005–08, J. Climate, 23, 813–817, https://doi.org/10.1175/2009jcli3094.1, 2010.
Hastenrath, S., Polzin, D., and Mutai, C.: Circulation mechanisms of Kenya rainfall anomalies, J. Climate, 24, 404–412, https://doi.org/10.1175/2010jcli3599.1, 2011.
Herrnegger, M., Kray, P., Stecher, G., Cherono Kiplangat, N., Otieno, D., Olang, L., and Nicholson, S. E.: Paleohydrology repeating? Regional hydrological change may lead to an overflow and cross-mixing of an alkaline and a freshwater lake in East Africa, J. Hydrol., 55, 101951, https://doi.org/10.1016/j.ejrh.2024.101951, 2024.
Hersbach, H., Bell, B., Berrisford, P., Hirahara, S., Horányi, A., Muñoz-Sabater, J., Nicolas, J., Peubey, C., Radu, R., Schepers, D., Simmons, A., Soci, C., Abdalla, S., Abellan, X., Balsamo, G., Bechtold, P., Biavati, G., Bidlot, J., Bonavita, M., De Chiara, G., Dahlgren, P., Dee, D., Diamantakis, M., Dragani, R., Flemming, J., Forbes, R., Fuentes, M., Geer, A., Haimberger, L., Healy, S., Hogan, R. J., Hólm, E., Janisková, M., Keeley, S., Laloyaux, P., Lopez, P., Lupu, C., Radnoti, G., de Rosnay, P., Rozum, I., Vamborg, F., Villaume, S., and Thépaut, J.: The ERA5 global reanalysis, Q. J. Roy. Meteor. Soc., 146, 1999–2049, https://doi.org/10.1002/qj.3803, 2020.
Hersbach, H., Bell, B., Berrisford, P., Biavati, G., Horányi, A., Muñoz Sabater, J., Nicolas, J., Peubey, C., Radu, R., Rozum, I., Schepers, D., Simmons, A., Soci, C., Dee, D., and Thépaut, J.-N.: ERA5 monthly averaged data on pressure levels from 1940 to present, Copernicus Climate Change Service (C3S) Climate Data Store (CDS) [data set], https://doi.org/10.24381/cds.6860a573, 2023.
Huang, B., Thorne, P. W., Banzon, V. F., Boyer, T., Chepurin, G., Lawrimore, J. H., and Zhang, H.-M.: Extended reconstructed sea surface temperature, version 5: Upgrades, validations, and intercomparisons, J. Climate, 30, 8179–8205, https://doi.org/10.1175/jcli-d-16-0836.1, 2017 (data available at: https://iridl.ldeo.columbia.edu/SOURCES/.NOAA/.NCDC/.ERSST/.version5/.sst/, last access: 8 July 2025).
Ibebuchi, C. C.: Revisiting the 1992 severe drought episode in South Africa: The role of El Niño in the anomalies of atmospheric circulation types in Africa south of the equator, Theor. Appl. Climatol., 146, 723–740, https://doi.org/10.1007/s00704-021-03741-7, 2021.
Indeje, M., Semazzi, F. H. M., and Ogallo, L. J.: ENSO signals in East African rainfall seasons, Int. J. Climatol., 20, 19–46, https://doi.org/10.1002/(sici)1097-0088(200001)20:1<19::aid-joc449>3.0.co;2-0, 2000.
Ingeri, C., Wen, W., Sebaziga, J. N., Iyakaremye, V., Ekwacu, S., Ayabagabo, P., Twahirwa, A., and Kazora, J.: Potential driving systems associated with extreme rainfall across East Africa during october to december (OND) season 2019, J. Geosc. Env. Prot., 12, 25–49, https://doi.org/10.4236/gep.2024.127003, 2024.
Kenfack, K., Marra, F., Djomou, Z. Y., Tchotchou, L. A. D., Tamoffo, A. T., and Vondou, D. A.: Dynamic and thermodynamic contribution to the October 2019 exceptional rainfall in western central Africa, Weather Clim. Dynam., 5, 1457–1472, https://doi.org/10.5194/wcd-5-1457-2024, 2024.
Kilavi, M., MacLeod, D., Ambani, M., Robbins, J., Dankers, R., Graham, R., Titley, H., Salih, A., and Todd, M.: Extreme rainfall and flooding over central kenya including nairobi city during the long-rains season 2018: Causes, predictability, and potential for early warning and actions, Atmosphere, 9, 472, https://doi.org/10.3390/atmos9120472, 2018.
Kimani, M., Hoedjes, J. C. B., and Su, Z.: An assessment of MJO circulation influence on air–sea interactions for improved seasonal rainfall predictions over East Africa, J. Climate, 33, 8367–8379, https://doi.org/10.1175/jcli-d-19-0296.1, 2020.
Kuete, G., Pokam Mba, W., and Washington, R.: African Easterly Jet South: Control, maintenance mechanisms and link with Southern subtropical waves, Clim. Dynam., 54, 1539–1552, https://doi.org/10.1007/s00382-019-05072-w, 2019.
Kuete, G., Mba, W. P., James, R., Dyer, E., Annor, T., and Washington, R.: How do coupled models represent the African Easterly Jets and their associated dynamics over Central Africa during the September–November rainy season? Clim. Dynam., 60, 2907–2929, https://doi.org/10.1007/s00382-022-06467-y, 2022.
Li, C., Chai, Y., Yang, L., and Li, H.: Spatio-temporal distribution of flood disasters and analysis of influencing factors in Africa, Nat. Hazards, 82, 721–731, https://doi.org/10.1007/s11069-016-2181-8, 2016.
Longandjo, G.-N. T. and Rouault, M.: On the structure of the regional-scale circulation over Central Africa: Seasonal evolution, variability, and mechanisms, J. Climate, 33, 145–162, https://doi.org/10.1175/jcli-d-19-0176.1, 2020.
Longandjo, G.-N. T. and Rouault, M.: Revisiting the seasonal cycle of rainfall over Central Africa, J. Climate, 37, 1015–1032, https://doi.org/10.1175/jcli-d-23-0281.1, 2024.
Lüdecke, H.-J., Müller-Plath, G., Wallace, M. G., and Lüning, S.: Decadal and multidecadal natural variability of African rainfall, J. Hydrol., 34, 100795, https://doi.org/10.1016/j.ejrh.2021.100795, 2021.
Lutz, K., Jacobeit, J., and Rathmann, J.: Atlantic warm and cold water events and impact on African west coast precipitation, Int. J. Climatol., 35, 128–141, https://doi.org/10.1002/joc.3969, 2014.
Madden, R. A. and Julian, P. R.: Detection of a 40–50 d oscillation in the zonal wind in the Tropical Pacific, J. Atmos. Sci., 28, 702–708, https://doi.org/10.1175/1520-0469(1971)028<0702:doadoi>2.0.co;2, 1971.
Madden, R. A. and Julian, P. R.: Description of global-scale circulation cells in the Tropics with a 40–50 d period, J. Atmos. Sci., 29, 1109–1123, https://doi.org/10.1175/1520-0469(1972)029<1109:dogscc>2.0.co;2, 1972.
McHugh, M. J. and Rogers, J. C.: North atlantic oscillation influence on precipitation variability around the southeast african convergence zone, J. Climate, 14, 3631–3642, https://doi.org/10.1175/1520-0442(2001)014<3631:naoiop>2.0.co;2, 2001.
Moihamette, F., Pokam, W. M., Diallo, I., and Washington, R.: Extreme Indian Ocean dipole and rainfall variability over Central Africa, Int. J. Climatol., 42, 5255–5272, https://doi.org/10.1002/joc.7531, 2022.
Moihamette, F., Pokam, W. M., Diallo, I., and Washington, R.: Response of regional circulation features to the Indian Ocean dipole and influence on Central Africa climate, Clim. Dynam., 62, 1–21, https://doi.org/10.1007/s00382-024-07251-w, 2024.
Nana, H. N., Tanessong, R. S., Tchotchou, L. A. D., Tamoffo, A. T., Moihamette, F., and Vondou, D. A.: Influence of strong South Atlantic Ocean Dipole on the Central African rainfall's system, Clim. Dynam., 62, 1–16, https://doi.org/10.1007/s00382-023-06892-7, 2023.
Nana, H. N., Tamoffo, A. T., Kaissassou, S., Djiotang Tchotchou, L. A., Tanessong, R. S., Kamsu-Tamo, P. H., Kenfack, K., and Vondou, D. A.: Performance-based evaluation of NMME and C3S models in forecasting the June–August Central African rainfall under the influence of the South Atlantic Ocean Dipole, Int. J. Climatol., 44, 2462–2483, https://doi.org/10.1002/joc.8463, 2024.
Ngavom, Z., Fotso-Nguemo, T. C., Vondou, D. A., Fotso-Kamga, G., Zebaze, S., Yepdo, Z. D., and Diedhiou, A.: Projected changes in population exposure to extreme precipitation events over Central Africa under the global warming levels of 1.5 °C and 2 °C: Insights from CMIP6 simulations, Model. Earth Syst. Environ., 10, 5753–5769, https://doi.org/10.1007/s40808-024-02091-3, 2024.
Nicholson, S. E.: Long-term variability of the East African “short rains” and its links to large-scale factors, Int. J. Climatol., 35, 3979–3990, https://doi.org/10.1002/joc.4259, 2015.
Nicholson, S. E. and Grist, J. P.: The seasonal evolution of the atmospheric circulation over West Africa and Equatorial Africa, J. Climate, 16, 1013–1030, https://doi.org/10.1175/1520-0442(2003)016<1013:tseota>2.0.co;2, 2003.
Nicholson, S. E., Fink, A. H., Funk, C., Klotter, D. A., and Satheesh, A. R.: Meteorological causes of the catastrophic rains of October/November 2019 in equatorial Africa, Global. Planet. Change, 208, 103687, https://doi.org/10.1016/j.gloplacha.2021.103687, 2022.
NOAA/NCEI: NOAA National Centers for Environmental Information, Monthly Synoptic Discussion for November 2023, published online December 2023, retrieved on 9 July 2025, https://www.ncei.noaa.gov/access/monitoring/monthly-report/synoptic/202311 (last access: 26 November 2024), 2025.
Onyutha, C.: Geospatial trends and decadal anomalies in extreme rainfall over uganda, east africa, Adv. Meteorol., 2016, 15–15, https://doi.org/10.1155/2016/6935912, 2016.
Palmer, P. I., Wainwright, C. M., Dong, B., Maidment, R. I., Wheeler, K. G., Gedney, N., Hickman, J. E., Madani, N., Folwell, S. S., Abdo, G., Allan, R. P., Black, E. C. L., Feng, L., Gudoshava, M., Haines, K., Huntingford, C., Kilavi, M., Lunt, M. F., Shaaban, A., and Turner, A. G.: Drivers and impacts of Eastern African rainfall variability, Nat. Rev. Earth Environ., 4, 254–270, https://doi.org/10.1038/s43017-023-00397-x, 2023.
Pohl, B. and Camberlin, P.: Influence of the Madden–Julian Oscillation on East African rainfall. I: Intraseasonal variability and regional dependency, Q. J. Roy. Meteor. Soc., 132, 2521–2539, https://doi.org/10.1256/qj.05.104, 2006.
Pohl, B. and Matthews, A. J.: Observed changes in the lifetime and amplitude of the Madden–Julian oscillation associated with interannual ENSO sea surface temperature anomalies, J. Climate, 20, 2659–2674, https://doi.org/10.1175/jcli4230.1, 2007.
Pokam, W. M., Djiotang, L. A. T., and Mkankam, F. K.: Atmospheric water vapor transport and recycling in Equatorial Central Africa through NCEP/NCAR reanalysis data, Clim. Dynam., 38, 1715–1729, https://doi.org/10.1007/s00382-011-1242-7, 2011.
Pokam, W. M., Bain, C. L., Chadwick, R. S., Graham, R., Sonwa, D. J., and Kamga, F. M.: Identification of processes driving low-level westerlies in west equatorial africa, J. Climate, 27, 4245–4262, https://doi.org/10.1175/jcli-d-13-00490.1, 2014.
Roy, I. and Troccoli, A.: Identifying important drivers of East African October to December rainfall season, Sci. Total Environ., 914, 169615, https://doi.org/10.1016/j.scitotenv.2023.169615, 2024.
Sandjon, A. T., Nzeukou, A., and Tchawoua, C.: Intraseasonal atmospheric variability and its interannual modulation in Central Africa, Meteorol. Atmos. Phys., 117, 167–179, https://doi.org/10.1007/s00703-012-0196-6, 2012.
Seager, R., Naik, N., and Vecchi, G. A.: Thermodynamic and dynamic mechanisms for large-scale changes in the hydrological cycle in response to global warming*, J. Climate, 23, 4651–4668, https://doi.org/10.1175/2010jcli3655.1, 2010.
Shilenje, Z. W. and V. Ongoma, Relationship between the North Atlantic Oscillation index and October–December rainfall variability over Kenya, J. Geol. Geophys., 4, 1–14, 2016.
Shisanya, Chris, A.: The 1983–1984 drought in Kenya, J. East. Afr. Res. Dev., 20, 127–148, http://www.jstor.org/stable/24326214 (last access: 8 July 2025), 1990.
Stachnik, J. P. and Schumacher, C.: A comparison of the Hadley circulation in modern reanalyses, J. Geophys. Res.-Atmos., 116, D22102, https://doi.org/10.1029/2011jd016677, 2011.
Taguela, T. N., Pokam, W. M., Dyer, E., James, R., and Washington, R.: Low-level circulation over Central Equatorial Africa as simulated from CMIP5 to CMIP6 models, Clim. Dynam., 62, 8333–8351, https://doi.org/10.1007/s00382-022-06411-0, 2022.
Tamoffo, A. T., Amekudzi, L. K., Weber, T., Vondou, D. A., Yamba, E. I., and Jacob, D.: Mechanisms of rainfall biases in two CORDEX-CORE regional climate models at rainfall peaks over central equatorial africa, J. Climate, 35, 639–668, https://doi.org/10.1175/jcli-d-21-0487.1, 2022.
Tamoffo, A. T., Weber, T., Abel, D., Ziegler, K., Cabos, W., Sein, D. V., and Laux, P.: Regionally coupled climate model ROM projects more plausible precipitation change over Central Equatorial Africa, J. Geophys. Res.-Atmos., 129, https://doi.org/10.1029/2024jd041466, 2024.
Tanessong, R. S., Vondou, D. A., Djomou, Z. Y., and Igri, P. M.: WRF high resolution simulation of an extreme rainfall event over Douala (Cameroon): A case study, Model. Earth Syst. Environ., 3, 927–942, https://doi.org/10.1007/s40808-017-0343-7, 2017.
UCSB: Index of /products/CHIRPS-2.0/global_daily/netcdf/p05/by_month/, UCSB [data set], https://data.chc.ucsb.edu/products/CHIRPS-2.0/global_daily/netcdf/p05/by_month/ (last access: 5 May 2025), 2025.
Wahiduzzaman, M. and Luo, J.-J.: A statistical analysis on the contribution of El Niño–Southern Oscillation to the rainfall and temperature over Bangladesh, Meteorol. Atmos. Phys., 133, 55–68, https://doi.org/10.1007/s00703-020-00733-6, 2020.
Wainwright, C. M., Finney, D. L., Kilavi, M., Black, E., and Marsham, J. H.: Extreme rainfall in East Africa, October 2019–January 2020 and context under future climate change, Weather, 76, 26–31, https://doi.org/10.1002/wea.3824, 2020.
Zaitchik, B. F.: Madden–Julian Oscillation impacts on tropical African precipitation, Atmos. Res., 184, 88–102, https://doi.org/10.1016/j.atmosres.2016.10.002, 2017.
Zhang, W., Wang, Y., Jin, F., Stuecker, M. F., and Turner, A. G.: Impact of different El Niño types on the El Niño/IOD relationship, Geophys. Res. Lett., 42, 8570–8576, https://doi.org/10.1002/2015gl065703, 2015.
Zheng, X. and Eltahir, E. A. B.: A Soil Moisture–Rainfall Feedback Mechanism: 2. Numerical experiments, Water Resour. Res., 34, 777–785, https://doi.org/10.1029/97wr03497, 1998.