the Creative Commons Attribution 4.0 License.
the Creative Commons Attribution 4.0 License.
 | 24 Jul 2025
Extreme weather anomalies and surface signatures associated with merged Atlantic–African jets during northern winter
Sohan Suresan
Nili Harnik
Rodrigo Caballero
The winter-long merging of the African and Atlantic jets during 2009–2010 was associated with extreme winter weather across the Northern Hemisphere. Past studies have shown that merging of these two jets is linked to weaker Atlantic eddy activity and stronger tropical heating, and is strongly correlated with a negative North Atlantic Oscillation (NAO) state. Here, we examine the relationship between jet merging and extreme weather, taking care to separate out the effects of the NAO and El Niño, in order to be left with the added influence of Atlantic–African jet merging. Our analysis, which examines percentile exceedance and anomaly composites of surface temperature, surface wind, and precipitation, identifies distinct weather signatures of merged-jet winters, notably affecting the Iberian Peninsula, North Africa, the southern Mediterranean, southwest Greenland, and Northern Europe. Additionally, we analyze the relationship between merged jets and shifts in cyclone track orientation contributing to the observed extreme weather patterns over these regions. Furthermore, once we remove the NAO effect from the merged-jet surface temperature anomaly signal, we find that winter-long jet merging coincides with anomalously warm Arctic, cold Eurasian, and strong El Niño conditions. The resulting weaker high-latitude temperature gradient is consistent with a weakening of eddy activity and, alongside stronger tropical heating, is thought to ultimately lead to persistent jet merging. This is consistent with previous theoretical work suggesting that reduced midlatitude baroclinicity and stronger tropical heating result in a transition from coexisting thermally driven subtropical and eddy-driven midlatitude jets to one with a single mixed eddy–thermally driven jet. This provides further evidence that Atlantic–African jet merging constitutes a dynamical regime transition of the Atlantic jet.
- Article
(11376 KB) - Full-text XML
-
Supplement
(9633 KB) - BibTeX
- EndNote


The jet stream, which appears as a relatively narrow band of a local maximum of high-speed wind with large amplitude meanders in the upper troposphere, forms an important feature of the mean flow in the atmosphere. The variability in latitude, shape, and strength of the jet streams has a significant influence on our weather and climate, and could increase the likelihood of a range of extreme weather events, such as cold spells, heatwaves, storms, and heavy precipitation (Screen and Simmonds, 2014). Several such extreme weather events attributed to the jet stream variability have been observed in recent decades, for example, the extreme cold winter over Europe linked to the equatorward shift of the jet during 2009–2010 (Cattiaux et al., 2010; Harnik et al., 2014), the hot summer over Europe associated with a poleward jet shift in 2018 (Drouard et al., 2019), and the extended Californian drought during 2011–2014, associated with the wavy nature of the jet (Seager et al., 2015). Hence studies on jet streams are vital for advancing our understanding of Earth's atmospheric dynamics and improving weather forecasts.
According to current understanding, two types of jet stream can be distinguished, based on latitudinal position and driving mechanism: subtropical jets and midlatitude jets (sometimes referred to as polar front jets). The subtropical jet (STJ), also referred to as a “thermally driven jet,” is primarily driven by the advection of absolute angular momentum by the mean meridional circulation (MMC) influenced by thermal processes over the tropics and is concentrated around the subtropical boundary of the Hadley cell (Schneider, 1977; Held and Hou, 1980). The midlatitude jet is correlated to the midlatitude cyclone tracks and is located inside the Ferrel cell where the eddy momentum flux convergence (EMFC) is strongest. The eddy momentum flux convergence by baroclinic waves is the major driving force of this “eddy-driven jet (EDJ)” (Held, 1975; Rhines, 1975; Panetta, 1993). There are a number of numerical studies that show the merging of these two jets and also a shift between single-jet and double-jet regimes due to variation in external thermal forcing and the midlatitude baroclinicity (Lee and Kim, 2003; Kim and Lee, 2004; Son and Lee, 2005; Eichelberger and Hartmann, 2007; Lu et al., 2010; O'Rourke and Vallis, 2013; Michel and Rivière, 2014). This theoretical evidence shows that changes in external conditions can lead to significant changes in the dynamical properties of the flow, resulting in a dynamical regime transition. Given a warmer future climate scenario, such a transition could potentially occur more frequently in response to stronger thermal driving (Son and Lee, 2005, 2006).
One such transition appears to have taken place throughout the winter of 2009–2010 (hereafter referred to as the 2010 winter). Usually, the Atlantic jet is eddy-driven and tilted meridionally, while the African jet is more of a classic STJ. The two are climatologically separate, with a double-jet region in the eastern Atlantic basin. However during the 2010 winter, the Atlantic jet was exceptionally equatorward and merged with the African jet downstream into one zonally oriented jet with a structure and variability similar to the characteristic of the Pacific jet (Harnik et al., 2014). Using reanalysis data, Li and Wettstein (2012) showed that the Pacific jet is both thermally and eddy-driven. Consequently, this leads to the notion that the Atlantic jet appears to have undergone a transition from being predominantly eddy-driven to being a mixed eddy–thermally driven merged jet during the 2010 winter (Harnik et al., 2014; Lachmy and Harnik, 2016). Later studies by Lachmy and Harnik (2020) using an idealized two-layer model have also shown that the negative phase of the annular mode of eddy-driven jet regimes is similar to a merged-jet regime.
What makes this specific 2010 winter event especially interesting is its extreme persistence. It is known that the eddy-driven jet can exhibit persistent southward shifts within its expected range of variability but this typically only occurs on a synoptic timescale (Lorenz and Hartmann, 2003; Eichelberger and Hartmann, 2007; Barnes and Hartmann, 2010). However, in the 2010 case, an equatorward-shifted, zonally oriented jet configuration persisted over an entire season and even reemerged the following winter. Such a configuration is rare and has only been observed once before, about 40 years prior to 2009–2010, during the 1968–1969 winter, and is also suggestive of a dynamical jet regime transition.
Further, the 2010 winter was also an interesting season in other respects; it featured a number of notable atmospheric and oceanic anomalies, including an intense and prolonged negative phase of the North Atlantic Oscillation (NAO), a positive El Niño–Southern Oscillation (ENSO) phase, and unusually cold and extreme wet weather conditions over the Northern Hemisphere (Barnes and Hartmann, 2010; Wang et al., 2010; Seager et al., 2010; Cattiaux et al., 2010; Vicente-Serrano et al., 2011; Moore and Renfrew, 2012; Santos et al., 2013). The abnormally high snowfall experienced during this winter in the mid-Atlantic states of the USA and northwest Europe was suggested to be primarily influenced by the negative NAO, with additional contributions from El Niño (Seager et al., 2010). Notably, the 2009–2010 El Niño was the strongest since the winter of 1997–1998 and ranked as the fifth most intense event since 1950 (National Climatic Data Center, 2010).
In general, the positive (negative) phase of the NAO is typically linked to relatively warm (cold) temperatures over Europe (Hurrell, 1995). In fact, the frequency of cold event occurrence over the extratropical Northern Hemisphere (NH) during winter and that of warm extremes over North Africa and Arab regions are strongly influenced by the NAO (Thompson and Wallace, 2001; Donat et al., 2014). Meanwhile, ENSO is also known to affect both mean and extreme precipitation and temperature levels in many parts of the NH (Ropelewski and Halpert, 1986; Schubert et al., 2008; Alexander et al., 2009; Kenyon and Hegerl, 2010; Arblaster and Alexander, 2012; Donat et al., 2014). It has even been shown using dynamical models that the exceptionally severe winters in Europe during 1940–1942 were influenced by the propagation of ENSO signals from the troposphere to the stratosphere, impacting the phases of the Arctic Oscillation (Brönnimann et al., 2004). Although the variability in winter climate across much of the NH is prominently influenced by the NAO and the ENSO phases (Hurrell, 1995; Brönnimann et al., 2004), the added influence of jet merging on such extreme weather patterns remains unexplored.
In this study, we investigate the influence of prolonged jet merging over a month or longer on weather extremes, and examine how this effect differs, if at all, from the impact of a strongly negative NAO and El Niño. We aim to understand whether the extreme weather patterns observed during jet-merging winters result solely from the combined influence of NAO and El Niño or if there is an additional impact from the merged jet across the Atlantic specific to these months. Our analysis seeks to uncover unique signals associated with the merged Atlantic–African jet winters, particularly in relation to extreme surface temperature, surface wind, and precipitation distributions across the NH. This hypothesis is built on some theoretical foundations:
-
The NAO is generally understood as a manifestation of wave–mean flow interactions typical of an eddy-driven jet regime.
-
When midlatitude baroclinic instability strengthens, it leads to stronger eddies that can push an equatorward merged jet poleward and increase its variability, making it behave more like an eddy-driven jet.
-
A merged-jet regime, however, is expected when extratropical eddies weaken while tropical thermal forcing intensifies.
-
Idealized model studies suggest that a merged-jet regime resembles the negative empirical orthogonal function (EOF) phase of the eddy-driven jet.
-
Previous work, like that of Harnik et al. (2014), has shown that anomalous tropical heating, as is observed during El Niño events, can influence the Atlantic subtropical jet.
Given all these, we expect the merged-jet regime to project strongly on a negative NAO, and to occur when there is a strongly anomalous tropical heating, but to be different from a simple combination of both because of a dynamical regime change of the eddy-driven Atlantic jet to a merged Atlantic–African jet that affects/enhances the extreme weather conditions. Our results aim to show this added unique signal, which is exclusive from the usual NAO and El Niño or their combined effect.
The analyses carried out in this study are all based on the daily/monthly averaged December–February (DJF) data of wind, precipitation, and temperature from the ERA5 reanalysis (Hersbach et al., 2023a) of the European Centre for Medium-Range Weather Forecasts (ECMWF) at a spatial resolution of 0.25 × 0.25 from January 1950 to December 2020. We used the National Oceanic and Atmospheric Administration (NOAA) Climate Prediction Center (CPC) NAO index (based on Jianping and Wang, 2003) and Oceanic Niño Index (ONI) derived from the ERSST v5 data (Huang et al., 2017).
The zonal jet index (ZJI), which is adapted from Harnik et al. (2014), helps us to identify merged-jet time periods. In order to calculate the ZJI, we use the zonal wind at 300 hPa: . We first find the latitude of the jet axis , defined at each longitude λ as the latitude ϕ with the maximum magnitude of u300, and calculate the maximum absolute value of its zonal derivative . This term will have the largest magnitude at the point where the jet axis jumps from the Atlantic to the African jet. The ZJI is then defined by taking the absolute value of this maximum latitude change over the longitude , and calculating its monthly anomaly from the climatological seasonal cycle. During jet merging, the zonal jump in jet axis latitude will disappear, hence the ZJI will have large negative values.
To study the variability in the distribution of extreme winter weather during merged-jet events, we first classify the winter months (December–February) into five groups as follows:
- a.
winter months with a strong merged Atlantic–African jet state: lower than −2 times the standard deviation of the winter monthly ZJI (14 winter months);
- b.
winter months with a strong negative NAO phase: monthly NAO index less than −1 times its standard deviation (29 winter months);
- c.
winter months with a strong negative NAO phase: monthly NAO index less than −1 times its standard deviation, but excluding the strong negative ZJI months in group (a) (20 winter months);
- d.
winter months with a strong El Niño phase: monthly ONI larger than 1 (32 winter months);
- e.
winter months with a strong El Niño phase: monthly ONI larger than 1, but excluding the strong negative ZJI months in group (a) (25 winter months).
For the time period to be consistent, we select winter months from a period of 1959–2020 as the cyclone tracks data used for analysis are available only over this time period. Detailed tables of the exact winter months in each group and their overlapping months are shown in the Supplement (Tables S1 and S2). From Table S2, we see that all the merged-jet (negative ZJI) winter months except one have a negative NAO phase, and most of these negative ZJI months coincide with a strong negative NAO or El Niño phase or even both (see the values in parentheses in Table S2). The zonal wind composite at 300 hPa of the five winter groups, along with a short description of their differences, is given in Fig. S1.
We then examine the daily mean data to identify the regions of extreme weather within each group mentioned. We first calculate the 95th and 5th percentiles of the daily 2 m temperature, 10 m wind, and daily precipitation, for each grid point, with the percentiles calculated based on all winter days in the data set. We then count the number of winter days within our different winter groups that exceed these thresholds (say, warmer than the 95th or colder than the 5th percentiles). Regions where these thresholds are exceeded for 10 % or more of the time are then recognized as areas for which the relevant winter group tends to increase the likelihood of the extreme weather type examined. For example, locations where the 95th percentile temperature was exceeded more than 10 % of the time imply an enhancement of warm extremes, while regions where the temperatures are colder than the 5th percentile for 10 % or more of the total winter days imply an enhancement of cold extremes. Correspondingly, we also identify regions for which extremes are less likely to happen as those for which the thresholds were exceeded less than 1 % of the total winter days. The regions of statistical significance for these percentages of winter days are calculated using the Monte Carlo significance test. The Monte Carlo simulation for the negative ZJI case is performed by randomly selecting 11 individual winter months (D, J, F) and 1 full winter from the period 1960–2020, then calculating the percentile exceedance as described earlier. This process is repeated 1000 times, generating a distribution at each grid point. The 99 % significance level is then determined at each grid point based on this distribution. A similar approach is also used for the negative NAO and El Niño cases, where 26 winter months + 1 DJF and 29 winter months + 1 DJF, respectively, are selected randomly and repeated 1000 times. This approach helps address the challenge of assessing significance when the signal is strongly influenced by tropical thermal forcing, which can persist throughout the winter – potentially, as in 2009–2010, when the entire DJF season experiences a merged jet.
To isolate the added influence of merged-jet winter signals on a monthly scale, ENSO and NAO signals are removed from monthly anomaly composites by linearly regressing out ONI and NAO indices before conducting the analysis. This methodology has been used in many previous studies (Kim et al., 2023; Chang et al., 2007; Zhang et al., 2014; You and Furtado, 2017; Amaya, 2019). Given the small sample size, we also tested partial least squares (PLS) regression and found minimal differences between the results. To analyze the role of synoptic-scale eddies, we compute surface eddy kinetic energy (EKE) by applying a boxcar filter to 10 m wind data. High-frequency eddies are defined using a 10 d high-pass filter on the 10 m wind velocity data and then the low-frequency EKE component is obtained by applying a 10 d low-pass filter to the high-pass-filtered EKE. This approach captures EKE variations that persist longer than 10 d. For identifying cyclones and comparing cyclone density, we use cyclone track data based on the extratropical cyclone tracks over the NH, produced by applying a cyclone tracking algorithm (Murray and Simmonds, 1991; Pinto et al., 2005) to the ECMWF ERA5 reanalysis mean sea level pressure data (remapped to 1.125 lat–long degrees). The algorithm is run for the NH region 20–90° N from a time period of 1959 to 2021 at 6 h time intervals. Detailed information about the methodology can be found in Murray and Simmonds (1991) and Pinto et al. (2005, 2009). It is worth noting that cyclone tracks based on Pinto et al. (2005) are recognized for being often longer in terms of both lifetime and track, compared with those derived from alternative tracking methods (see Neu et al., 2013).
As extreme weather events have been observed in connection with merged-jet (negative ZJI), negative NAO, and El Niño winters, our initial investigation focuses on the frequency of days with extreme weather across the NH during the entire winter period. In this section, we examine the distribution of 2 m surface temperature, 10 m surface wind, and precipitation across negative ZJI, negative NAO, and El Niño winter months.
3.1 Surface temperature
Figure 1 shows the spatial distribution of warm extreme frequency (the percentage of days exceeding the 95th percentile of 2 m surface temperature) for each winter group described in the previous section. Here we see, in Fig. 1a, that the winter months with the merged-jet state have a distinctive warm day distribution that is different from the other months. The stippled regions indicate where warm extreme frequencies are greater than 10 %, with a statistically significance of 99 %, while regions in white indicate fewer warm extreme days. There are five regions with increased warm extreme occurrence during merged-jet winters: Greenland, the subtropical North and South Atlantic, North Africa–Mediterranean, and the central Pacific. Looking at negative NAO with and without negative ZJI months (Fig. 1b, c) and ENSO with and without negative ZJI months (Fig. 1d, e), we observe distinct patterns. The tropical Pacific and southern subtropical Atlantic appear in both ENSO cases, suggesting they are part of the ENSO signal. Meanwhile, Greenland appears in the negative NAO months, though to a lesser extent when negative ZJI months are removed, suggesting this is partly a negative NAO signal but the jet merging extends the number of extreme warm days over Greenland. The warm extreme over subtropical North Atlantic and North Africa–Mediterranean appears dominant in the negative ZJI months, suggesting they are associated with the jet merging. We also see two regions with few warm extreme days – Europe and the southeastern tropical Pacific. The tropical eastern Pacific region appears in the negative NAO months, with and without negative ZJI, indicating this is due to negative NAO. Note that the negative NAO and El Niño signals oppose each other during the negative ZJI months, with the NAO signal dominating in the eastern tropical Pacific, with anomalously few extreme warm days, and El Niño dominating in the central tropical Pacific, with more extreme warm days. The reduction of extreme warm days over Europe, however, only appears predominantly in the negative ZJI groups, suggesting the stronger correlation of anomalous jet merging to fewer extreme warm days over Europe. Also note from Fig. 1b and c that the white regions over poles are significant during the negative NAO, indicating that the poles are less susceptible to warm extremes during negative NAO winter months. The poles experience warmer extremes during negative ZJI months, compared with negative NAO months. We used a bootstrapping analysis to support this.
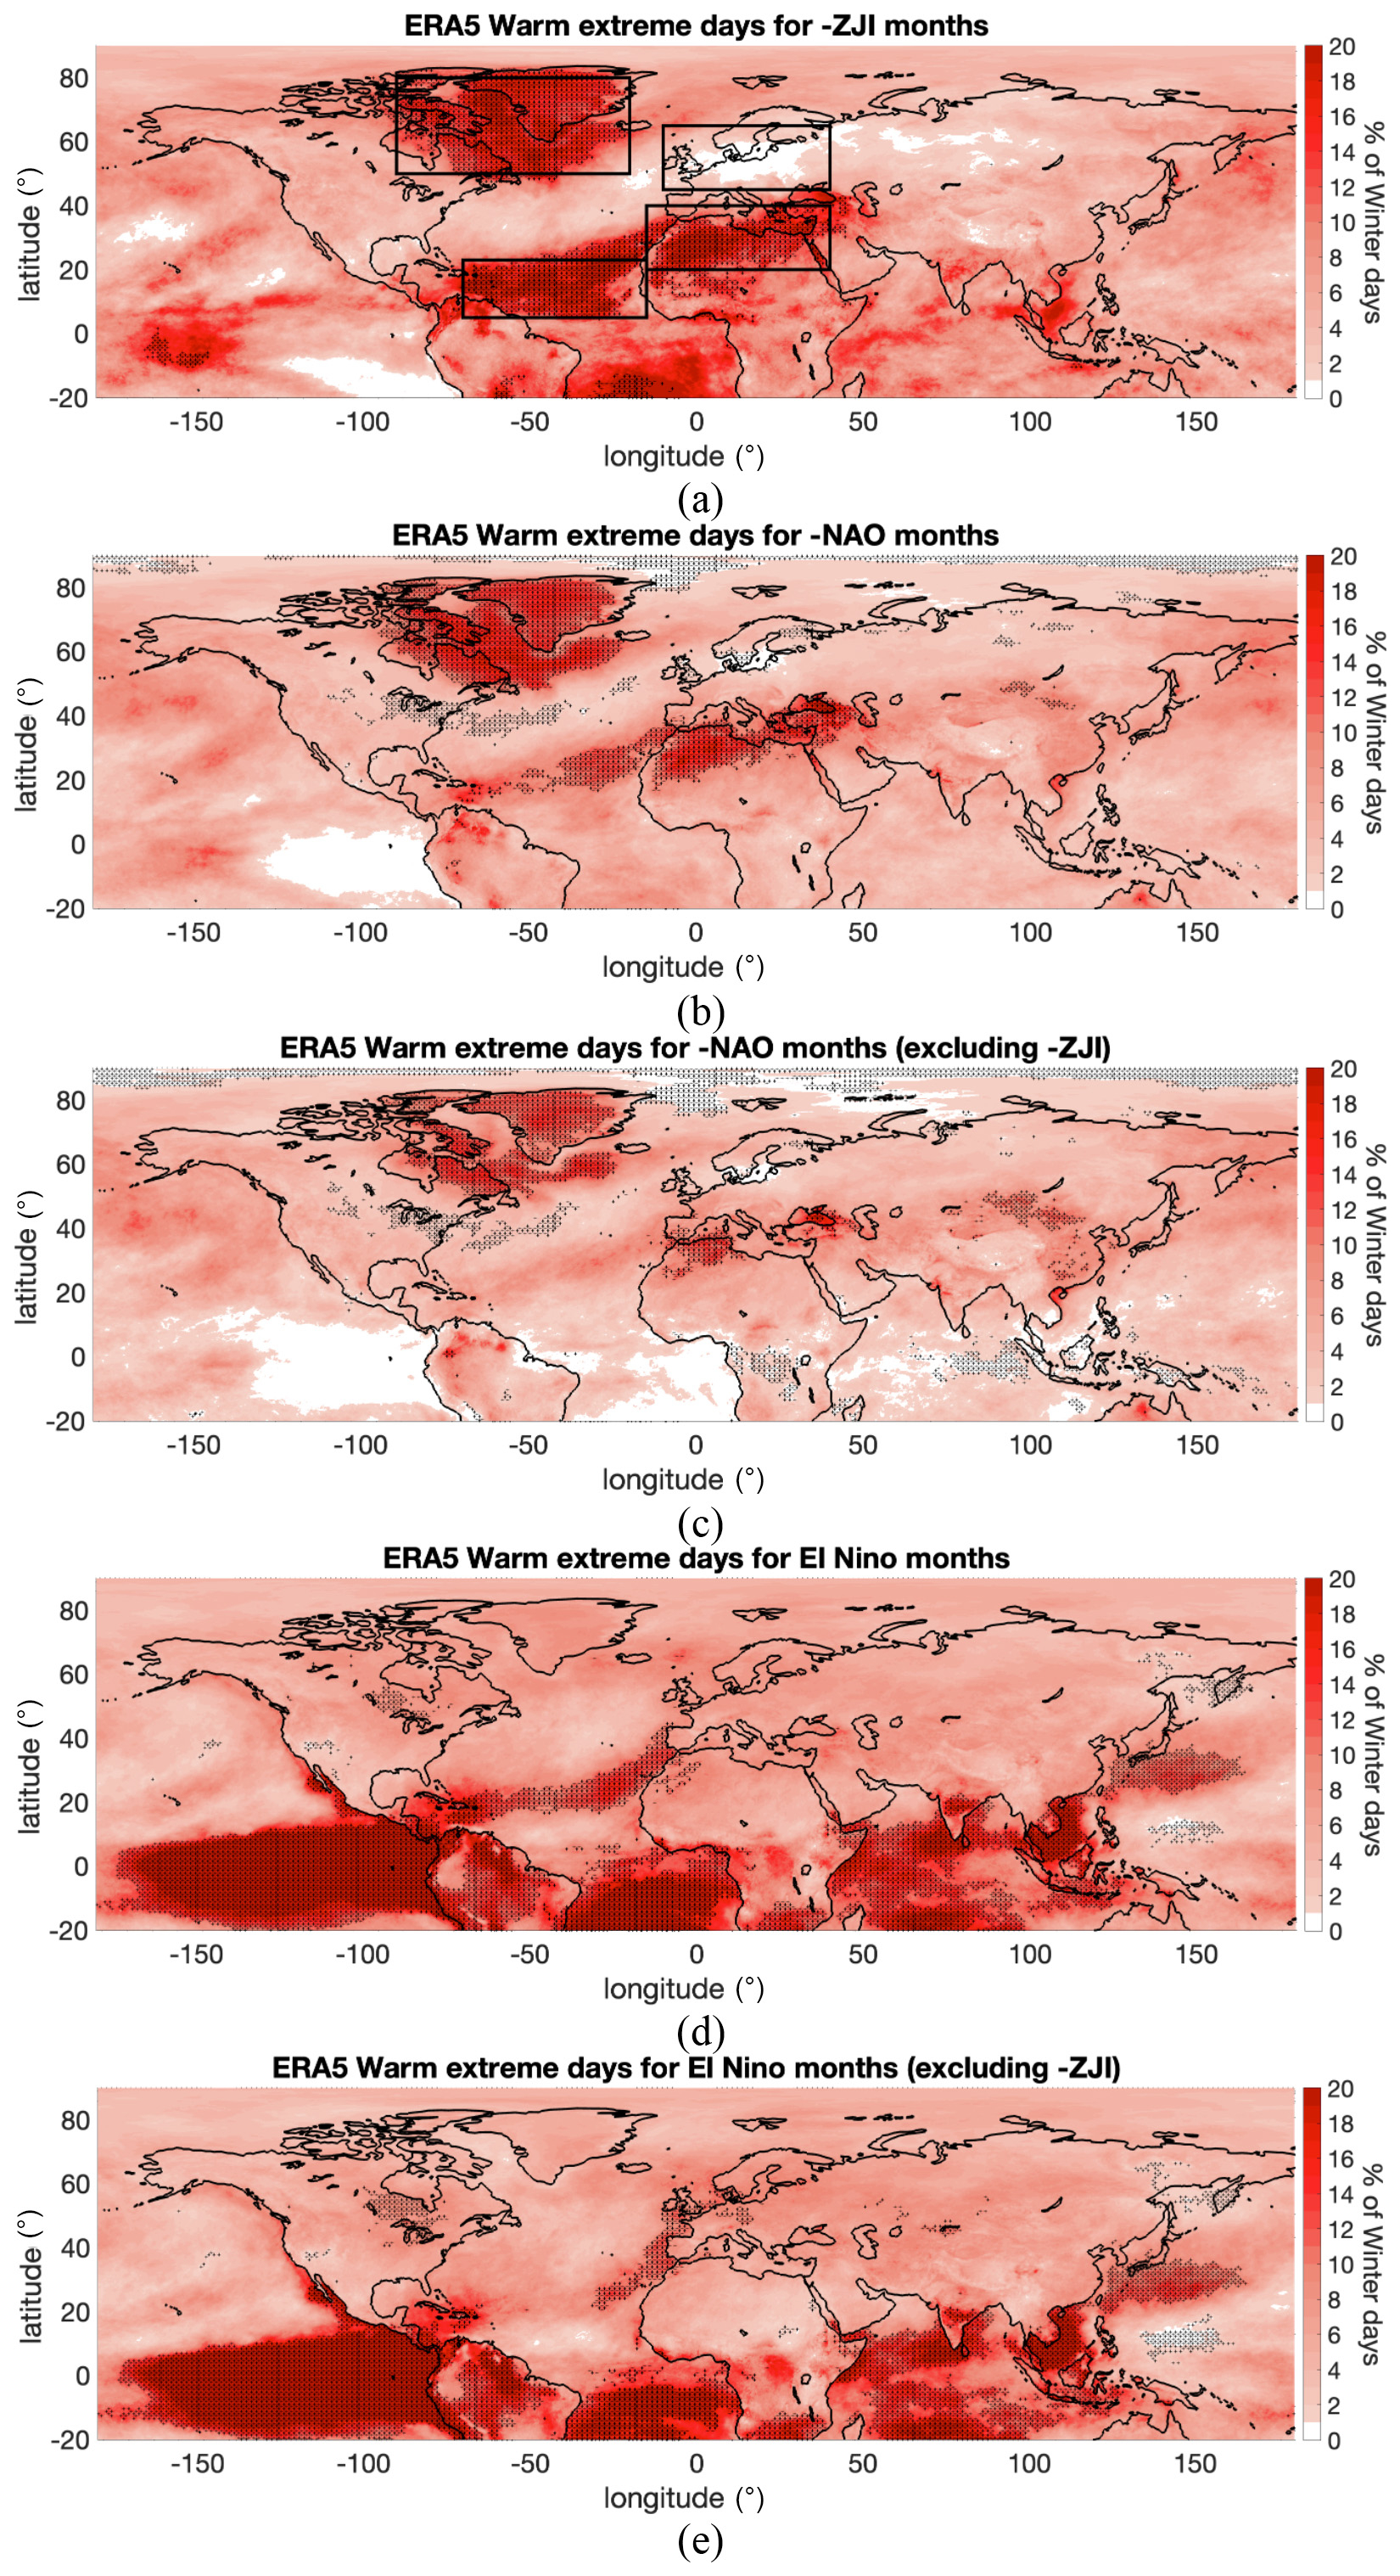
Figure 1Distribution of the percentage of warm extreme days for (a) merged-jet winter months, (b) negative NAO winter months, (c) negative NAO winter months excluding merged-jet months, (d) El Niño winter months, (e) El Niño winter months excluding merged-jet months. The regions stippled in black (+) represent regions significant at 99 % using Monte Carlo simulation.
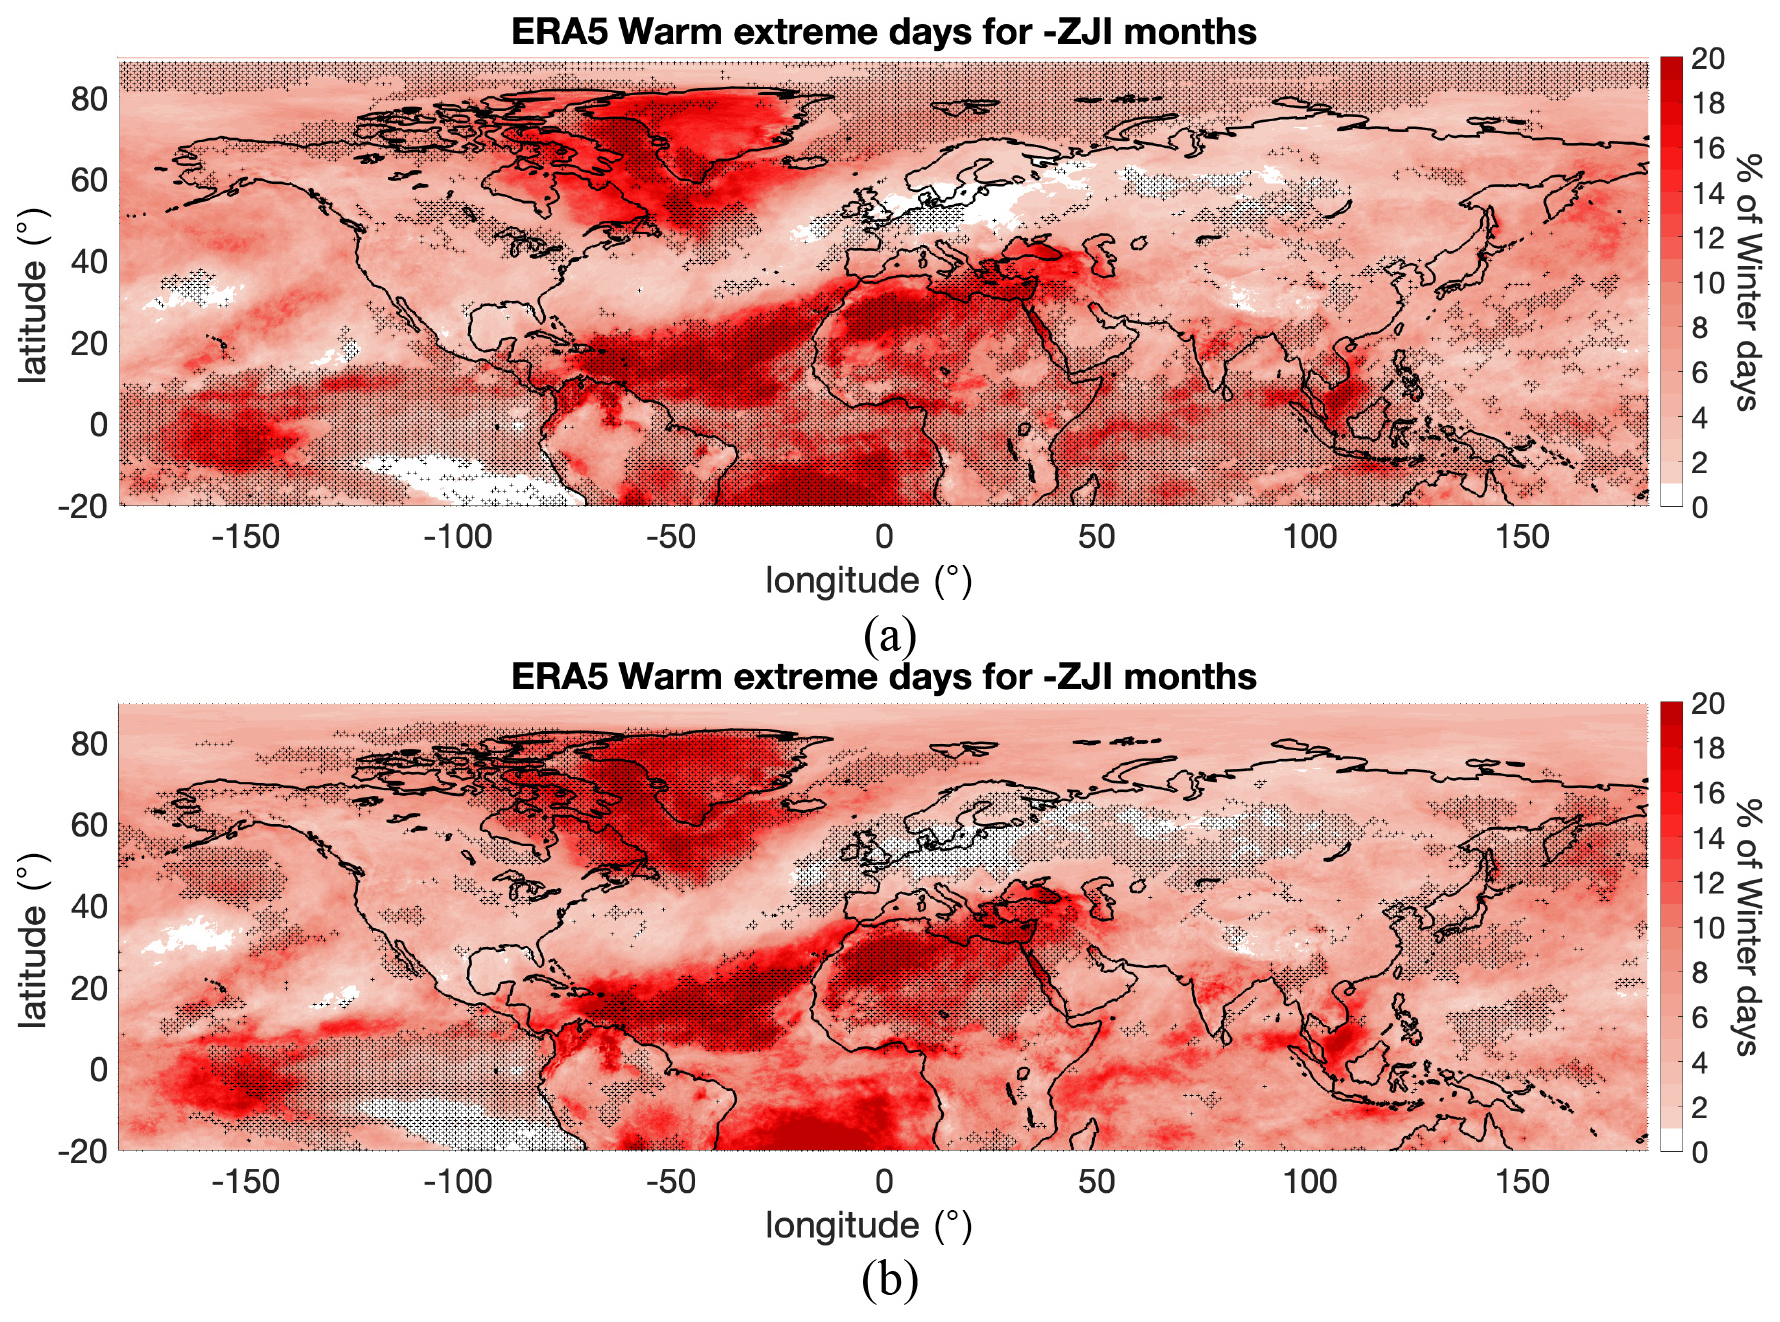
Figure 2Distribution of the percentage of warm extreme days for merged-jet winter months: same as Fig. 1a but regions stippled in black (+) represent regions significant at 99 % using bootstrapping w.r.t. (a) negative NAO months (excluding negative ZJI) and (b) El Niño months (excluding negative ZJI).
Note that, previously, the Monte Carlo simulation was run with respect to climatology. Now we apply bootstrapping by randomly selecting 20 (25) months from within negative NAO (El Niño) months excluding negative ZJI, with repetition, and calculating the percentile exceedance. We then repeat this 1000 times, resulting in a distribution at each grid point with respect to negative NAO (El Niño) months and then calculate the 99 % significance over this distribution at each grid point for the negative ZJI percentile exceedance plots. This result is in Fig. 2a and b, which shows Fig. 1a but with the 99 % significance shading calculated with respect to negative NAO and El Niño, respectively, using bootstrapping. Here we see that in Fig. 2a the tropical, western European, and polar regions are significantly different from the negative NAO years and that in Fig. 2b the stippled regions over Greenland, the eastern Pacific, the central Atlantic, North Africa, the Mediterranean, and Europe are significantly different, relative to El Niño. This indicates that these regions are more/less susceptible to warm extremes during negative ZJI winter months, compared with negative NAO and El Niño.
To have a better understanding of the daily surface temperature distribution for each winter, we examine box plots for specific regions of interest highlighted in the boxes shown in Fig. 1a. Figure 3a–d illustrates the box plots of area-averaged daily surface temperatures over the tropical–subtropical North Atlantic, North Africa–Mediterranean, Greenland, and Europe, respectively. The plots show distribution during climatological winter days (all winter days between 1960 and 2020), El Niño winter days (excluding negative ZJI), negative NAO winter days (excluding negative ZJI), and merged-jet (negative ZJI) winter days. The mean and median of each group are also marked, along with the 95 % confidence interval calculated using the bootstrapping analysis. This is done by using data from each sample of box plots to generate a sampling distribution by repeatedly taking random samples from the known sample, with replacement, and then computing sample medians/means. We repeat this 10 000 times to get 10 000 bootstrap samples, which give the 10 000 medians/means. Once we find this distribution, we can calculate the 95 % confidence interval.
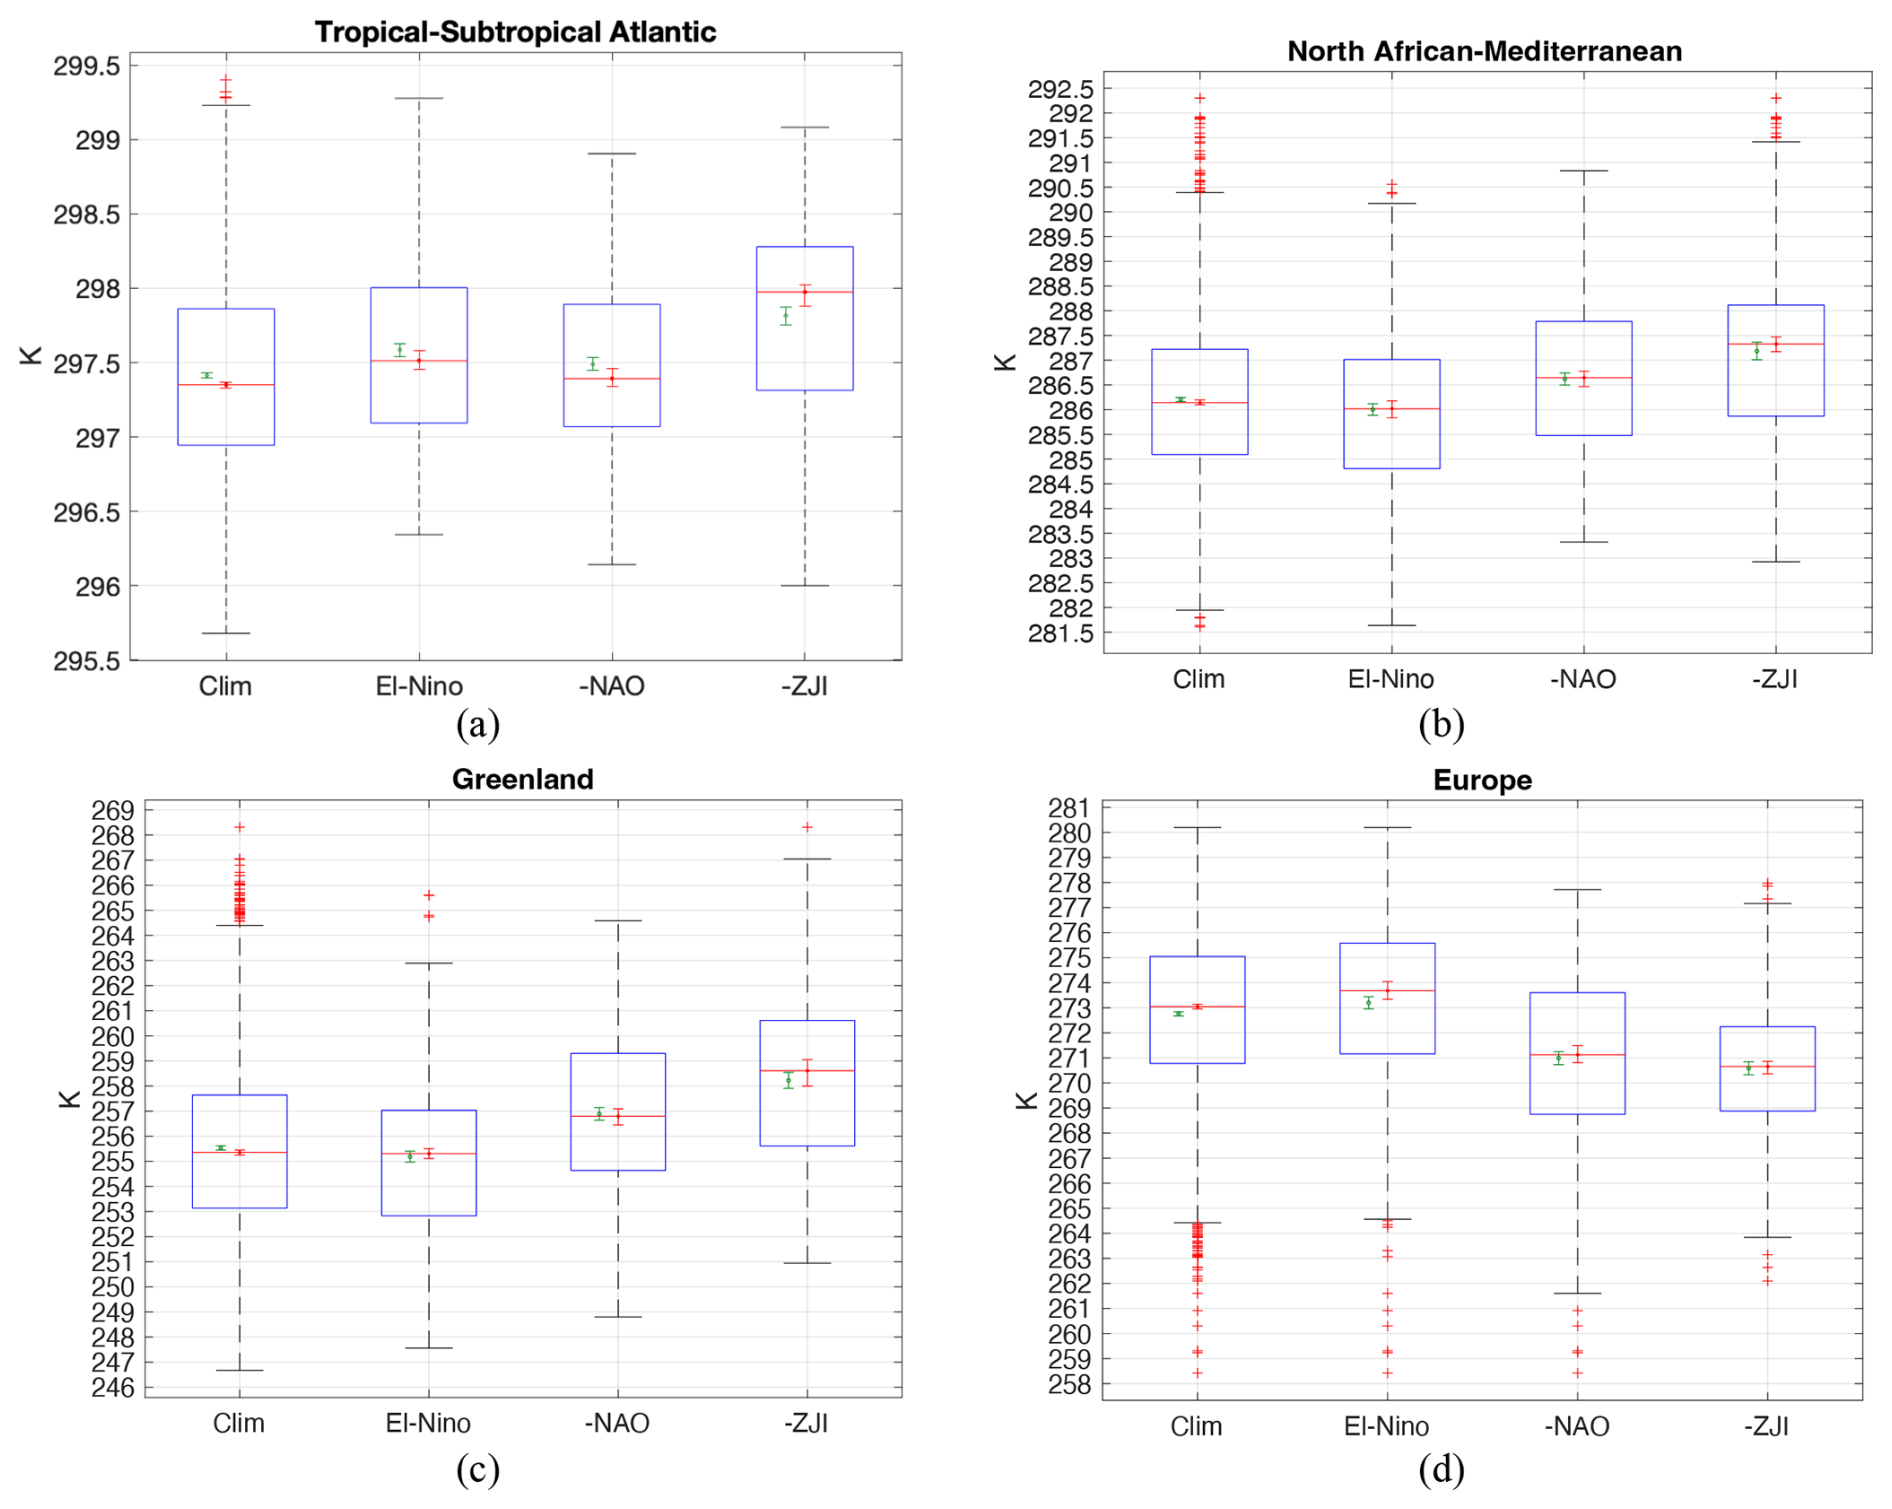
Figure 3Box plots of daily average surface temperatures for DJF climatology (1960–2020), El Niño months (excluding negative ZJI), negative NAO months (excluding negative ZJI), and merged-jet months (negative ZJI) over (a) the tropical–subtropical Atlantic within the region [5–23° N, 70–15° W], (b) North Africa–Mediterranean [20–40° N, 15° W–40° E], (c) the Greenland region [50–80° N, 90–20° W], (d) Europe [45–65° N, 10° W–40° E]. These regions are marked in boxes in Fig. 1a. In each box plot, the red line represents the median along with its 95 % confidence interval, while the lower and upper edges of the box represent the 25th and 75th percentiles, respectively. The whiskers stretch to the furthest data points that are not deemed outliers, which are values that are more than 1.5 times the interquartile range away from the bottom or top of the box, and any outliers are depicted individually with a red (+) marker symbol. The value marked in green on the left half of each box represents the mean value along with its 95 % confidence interval.
The tropical–subtropical North Atlantic region shows a shift to warmer surface temperatures during merged-jet months, with El Niño contributing to the overall warm extremes more than negative NAO. Over the North Africa–Mediterranean regions, the merging contributes to the strongest extremes and a warmer region in the mean. In Greenland, jet merging contributes to many of the extremes, including the most extreme warm days, as well as to the mean, while in Europe, clearly, there are fewer warm extremes and the mean temperature during jet merging is lower than during ENSO and negative NAO winters. We also note that, in Greenland, merged-jet winters have fewer cold extremes compared with other winters.
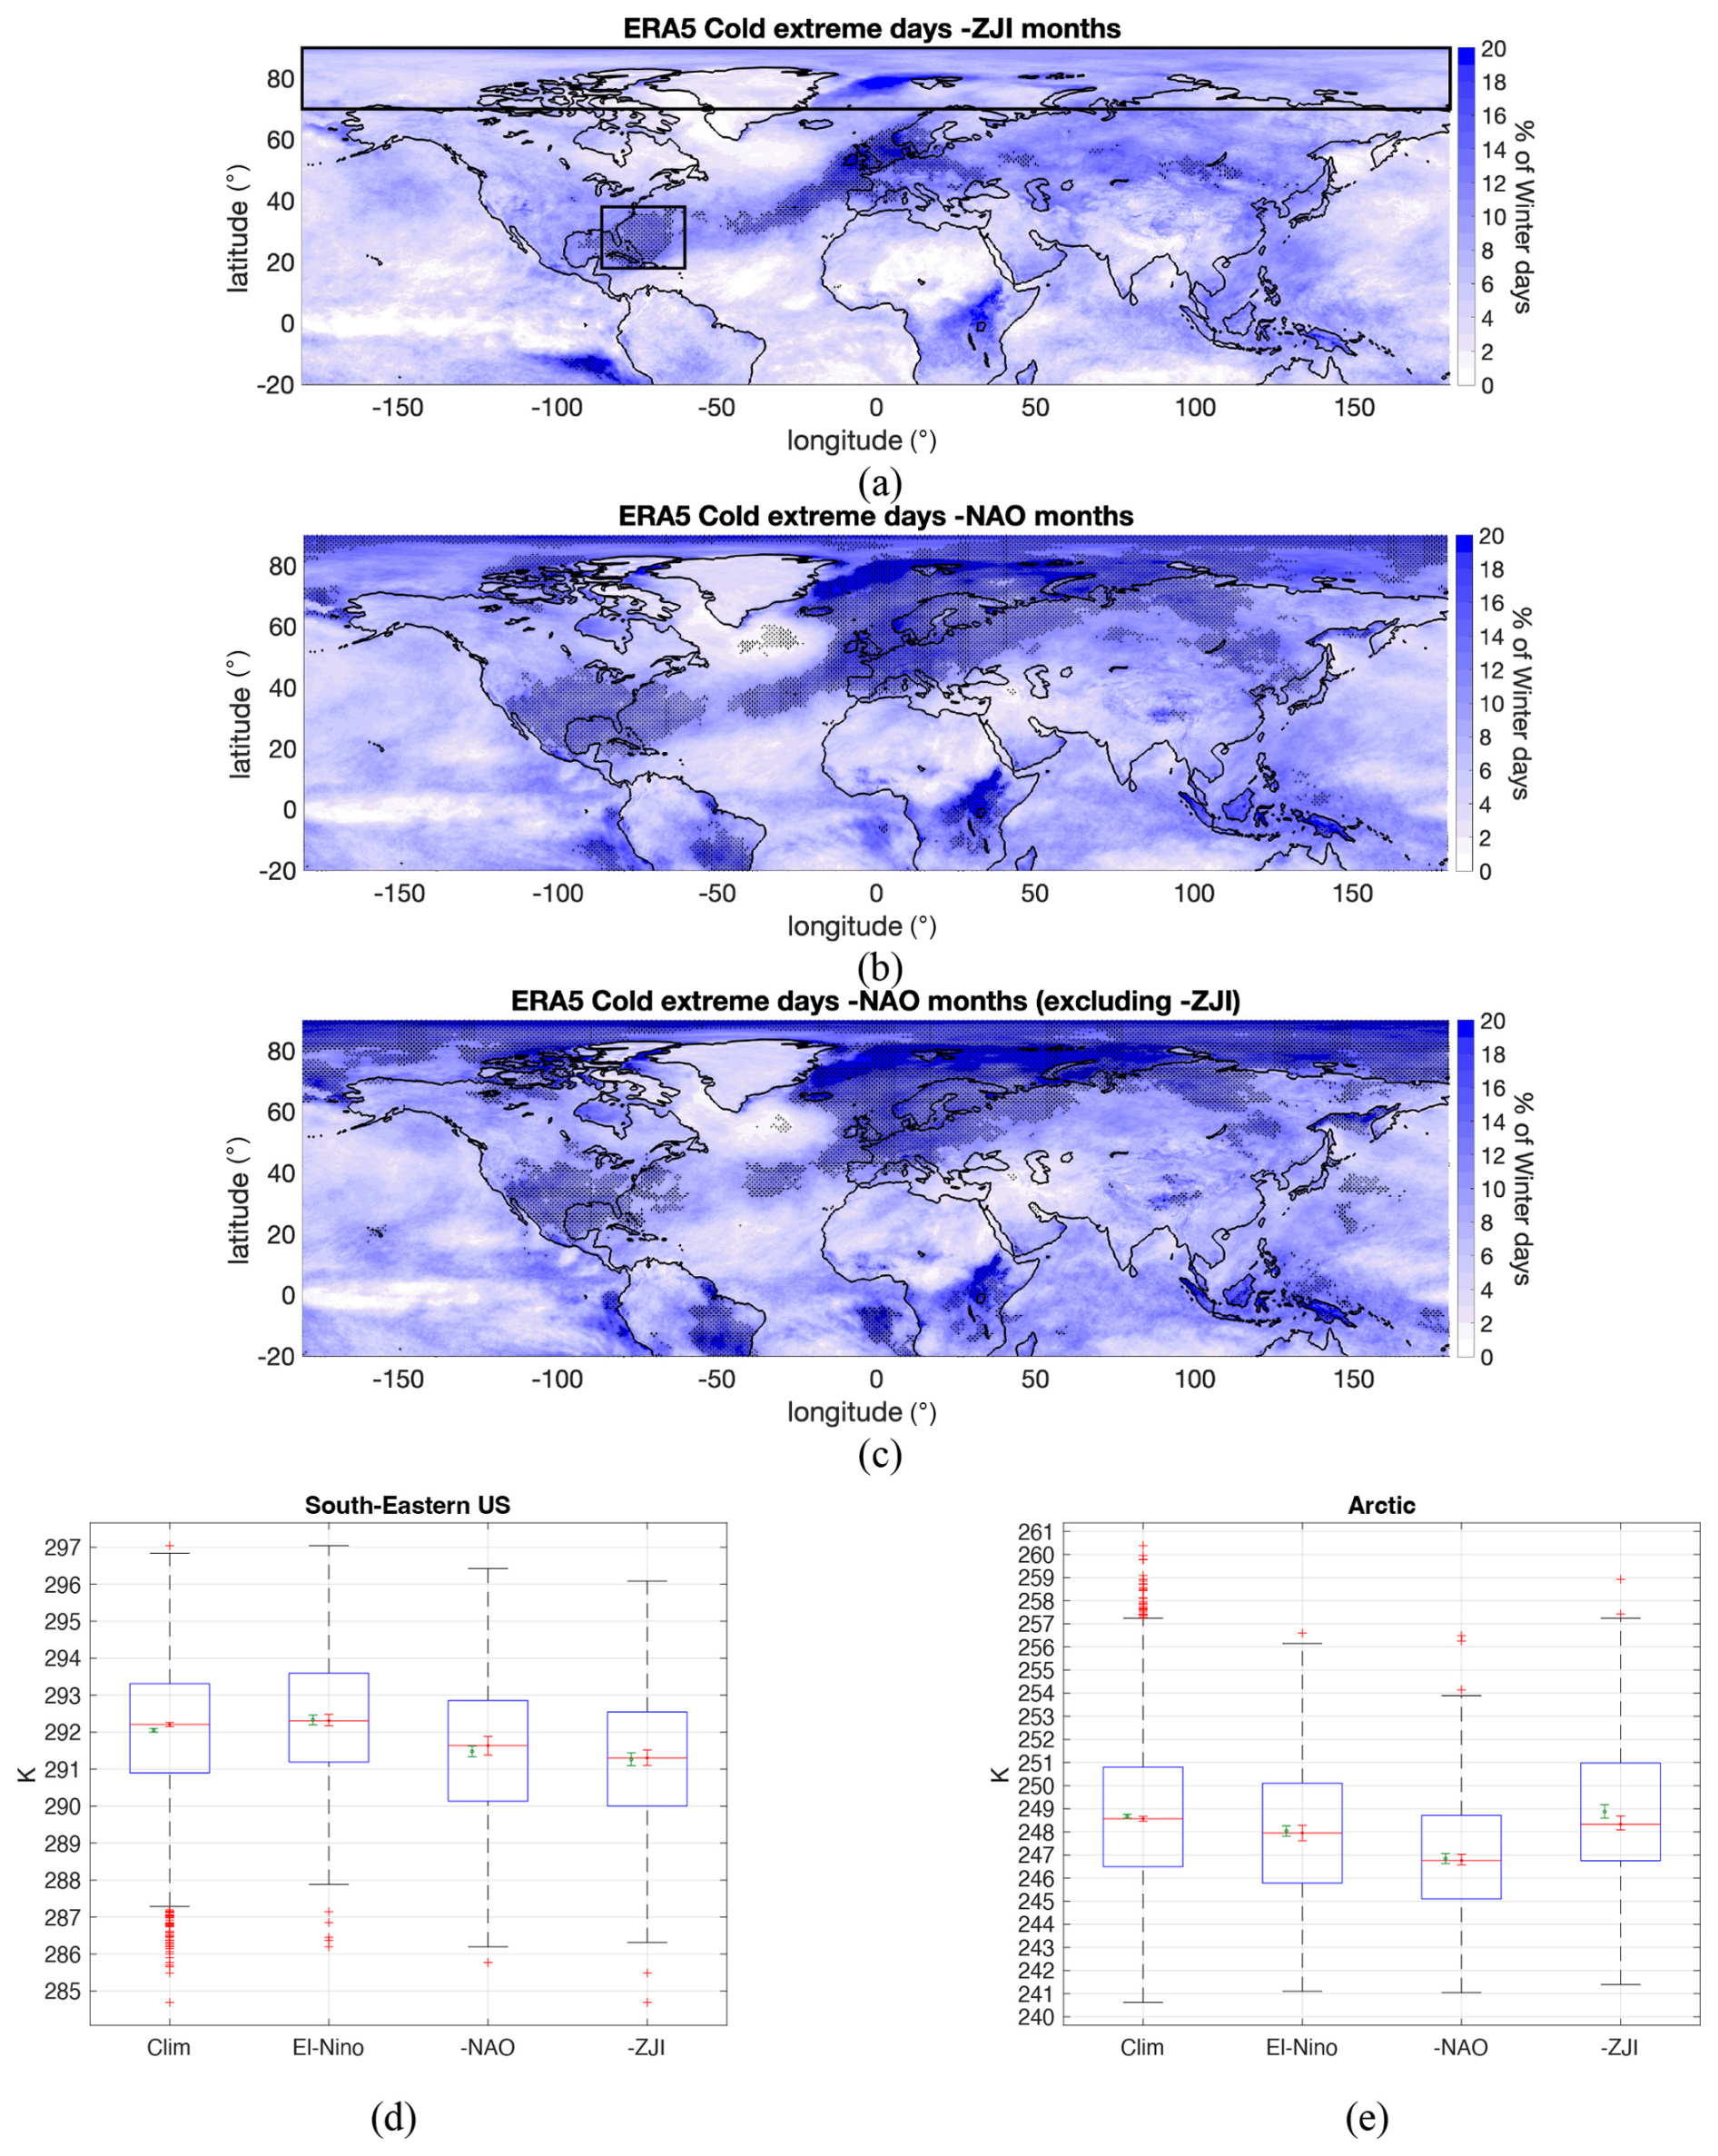
Figure 4(a–c) Distribution of the percentage of cold extreme days for (a) merged-jet winter months, (b) negative NAO winter months, (c) negative NAO winter months excluding merged-jet months. The regions stippled in black (+) represent regions significant at 99 % using Monte Carlo simulation. (d, e) Box plots of daily average surface temperature similar to Fig. 3 over (d) the southeast US coast [18–38° N, 86–60° W] and (e) the Arctic [70–90° N, 180° W–180° E]. These regions are marked in boxes in Fig. 4a.
We next examine the relation between jet merging and the occurrence of extreme cold days (Fig. 4a–c), by examining the number of days that are colder than the 5th percentile of temperature. Here we highlight the regions greater than the 10 % threshold in dark blue shading – these are regions that experience a larger number of extreme cold days. Regions where extreme cold days occur less than 1 % of the time are shown in white. From Fig. 4a we see that, during negative ZJI months, the increased extreme cold days mostly occur in the northwestern European region. This pattern forms a belt stretching from the subtropical eastern US coast, extending to the Scandinavian region, encompassing the UK and other northern European countries, and even branching into Asia. Looking at negative NAO with and without negative ZJI months (Fig. 4b, c), we see that the cold extremes in the western–central US are influenced by negative NAO, whereas the eastern coast is influenced by the jet merging. The cooling over the tropical eastern Pacific region appears in the negative NAO months, with and without negative ZJI, indicating that this is primarily associated with negative NAO, although the jet merging extends the number of extreme cold days slightly toward the central Pacific.
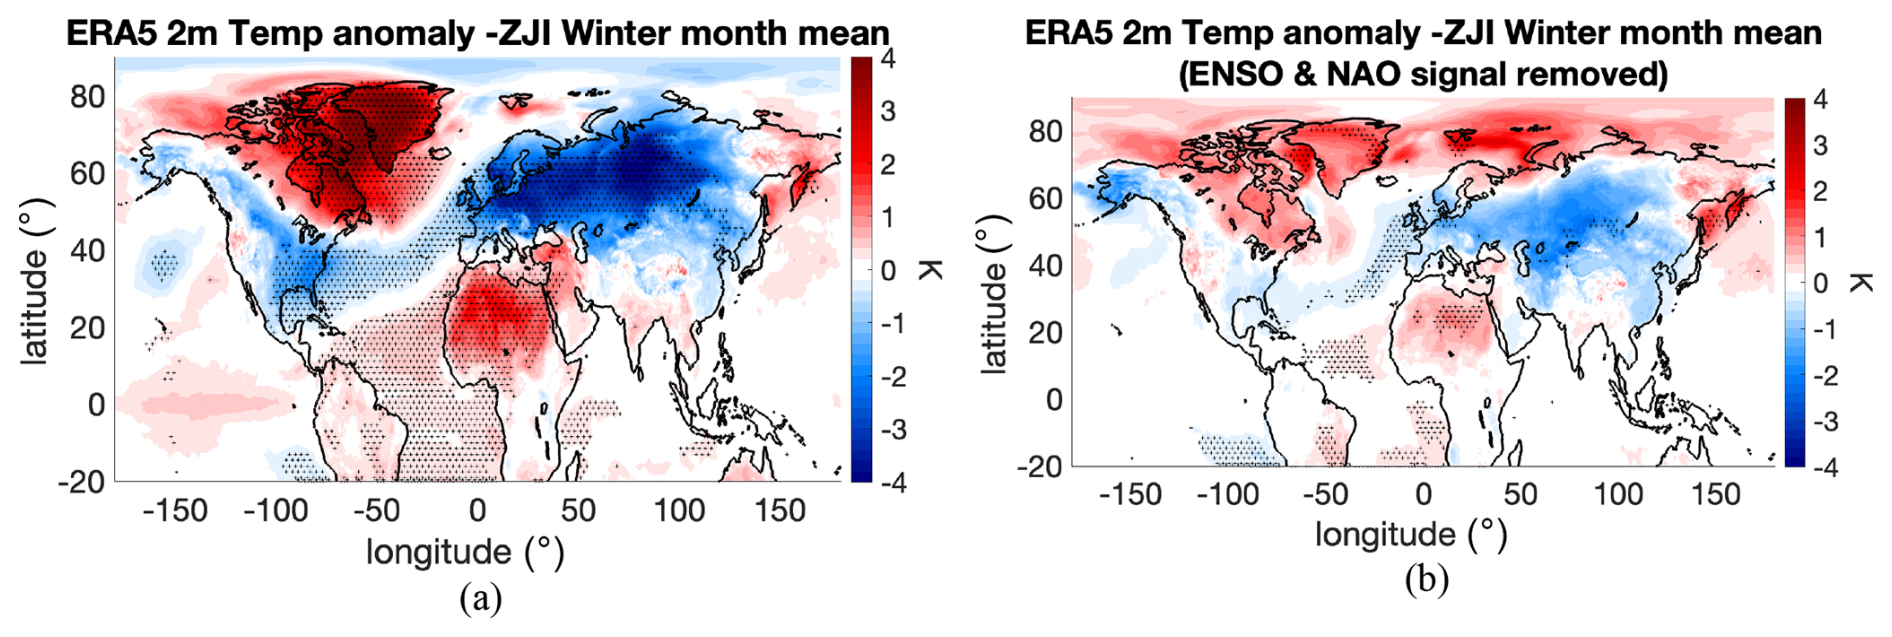
Figure 5(a) Composite for anomalous detrended 2 m surface temperature (K) for negative ZJI winter months. (b) Same as panel (a) but with the NAO and ENSO signals removed using linear regression analysis. The stipples (+) represent regions for which the composites are significant at 95 %, based on a two-sided Student's t test against climatology.
We also see that the Arctic region exhibits more pronounced cold extremes during negative NAO when not accompanied by a merged jet. Negative NAO tends to be associated with stronger cooling in high-latitude Eurasia and the Arctic. In other words, negative ZJI winters have a warmer Arctic compared with negative NAO alone, pointing to the potential influence of Arctic warming on merged-jet formation. We also see some regions of fewer cold extremes during jet merging – North Africa, the subtropical Atlantic, western Greenland, and the central Pacific, which coincide with the regions of high warm extremes seen earlier during jet merging. The distribution of cold extremes across the NH is observed to be notably weak in terms of their influence by El Niño, both with and without the negative ZJI (Fig. S2a and b, shown in the Supplement). The box plots over the regions of the southeastern US and the Arctic shown in boxes in Fig. 4a are shown in Fig. 4d and e. Here we see that the southeastern USA shifts to a colder surface temperature on average during jet merging, contributing to the extremes including the most extreme cold days, whereas during jet merging the Arctic seems to have a warmer surface temperature and contributes more to the warm extreme days in climatological winter, while negative NAO contributes more to the cold extreme days.
As shown in Harnik et al. (2014, see their Fig. 11), most of the negative ZJI winter months coincide with either strong El Niño or negative NAO or even both. It is thus essential to explore whether the negative ZJI operates independently of the influence of ENSO and NAO or is intertwined with it. In order to do this, we examine composites of monthly mean surface temperature anomalies associated with negative ZJI, before and after regressing out the ENSO and NAO signals from the detrended surface temperature data field. Figure 5a shows the monthly anomaly composite of detrended surface temperature for the negative ZJI winter months, where we see the typical tripole pattern over the Atlantic Ocean often associated with the negative NAO phase and warming over the tropical eastern Pacific Ocean associated with the El Niño phase. We also see anomalous warming over North Africa, the Mediterranean, Greenland, and the entire tropical Atlantic, while there is anomalous cooling over most of Eurasia and the central USA. These composite anomalies are consistent with the results for temperature extremes shown in Figs. 1a and 4a. From this, we remove the ENSO and NAO signals using linear regression analysis, resulting in Fig. 5b. Upon their comparison, it is evident that the anomalous temperature distribution associated with extreme weather during the negative ZJI winter persists, though at a reduced magnitude, even after removing ENSO and NAO signals. Additionally, there emerges a noteworthy anomalous warming over the Arctic region. This warming anomaly during the negative ZJI winter was previously obscured by the prevailing NAO and ENSO signals, particularly the dominant NAO signal in the Arctic, as evidenced by individual signal removal analyses (see Fig. S3a and b in the Supplement). Such an anomalous warming weakens the meridional temperature gradient that affects the midlatitude baroclinicity and weakens the eddy fluxes over these regions (Yuval and Kaspi, 2020; Chemke and Polvani, 2020). Hence this anomalous warmer Arctic and colder Eurasia could explain the weakened eddy activity over the midlatitude during negative ZJI winters, as observed during the 2010 winter (e.g., Harnik et al., 2014, see their Fig. 6).
3.2 Surface wind
We turn now to surface wind extremes. Similarly to the previous section, we examine the percentage of days within each winter group that experience 10 m wind in excess of its climatological 95th percentile. Figure 6a shows that extreme surface winds during negative ZJI winters are primarily concentrated over the subtropical Atlantic, Greenland, and the eastern tropical Pacific in the Southern Hemisphere. The former align with the equatorward-shifted, zonally oriented jet. Comparison with Fig. 6b reveals that strong winds over Greenland also occur during negative NAO winters (excluding negative ZJI winters), with the distinction that frequencies are higher during merged-jet winters. Notably, over the subtropical Atlantic, the wind extremes are predominantly situated in the east during negative NAO winters, contrasting the more evenly distributed pattern observed during jet merging. The most notable contrast in the distribution of extreme winds between negative ZJI winter and negative NAO winter is observed over the eastern tropical Pacific in the Southern Hemisphere, as highlighted in the box in Fig. 6a. In this region, there is a discernible increase in the frequency of extreme strong surface winds during negative ZJI winter, a pattern not evident in negative NAO winters. This difference is partly attributed to the influence of El Niño, as similar analyses for El Niño winters show a much weaker but comparable pattern (refer to Fig. S4b and c for details).
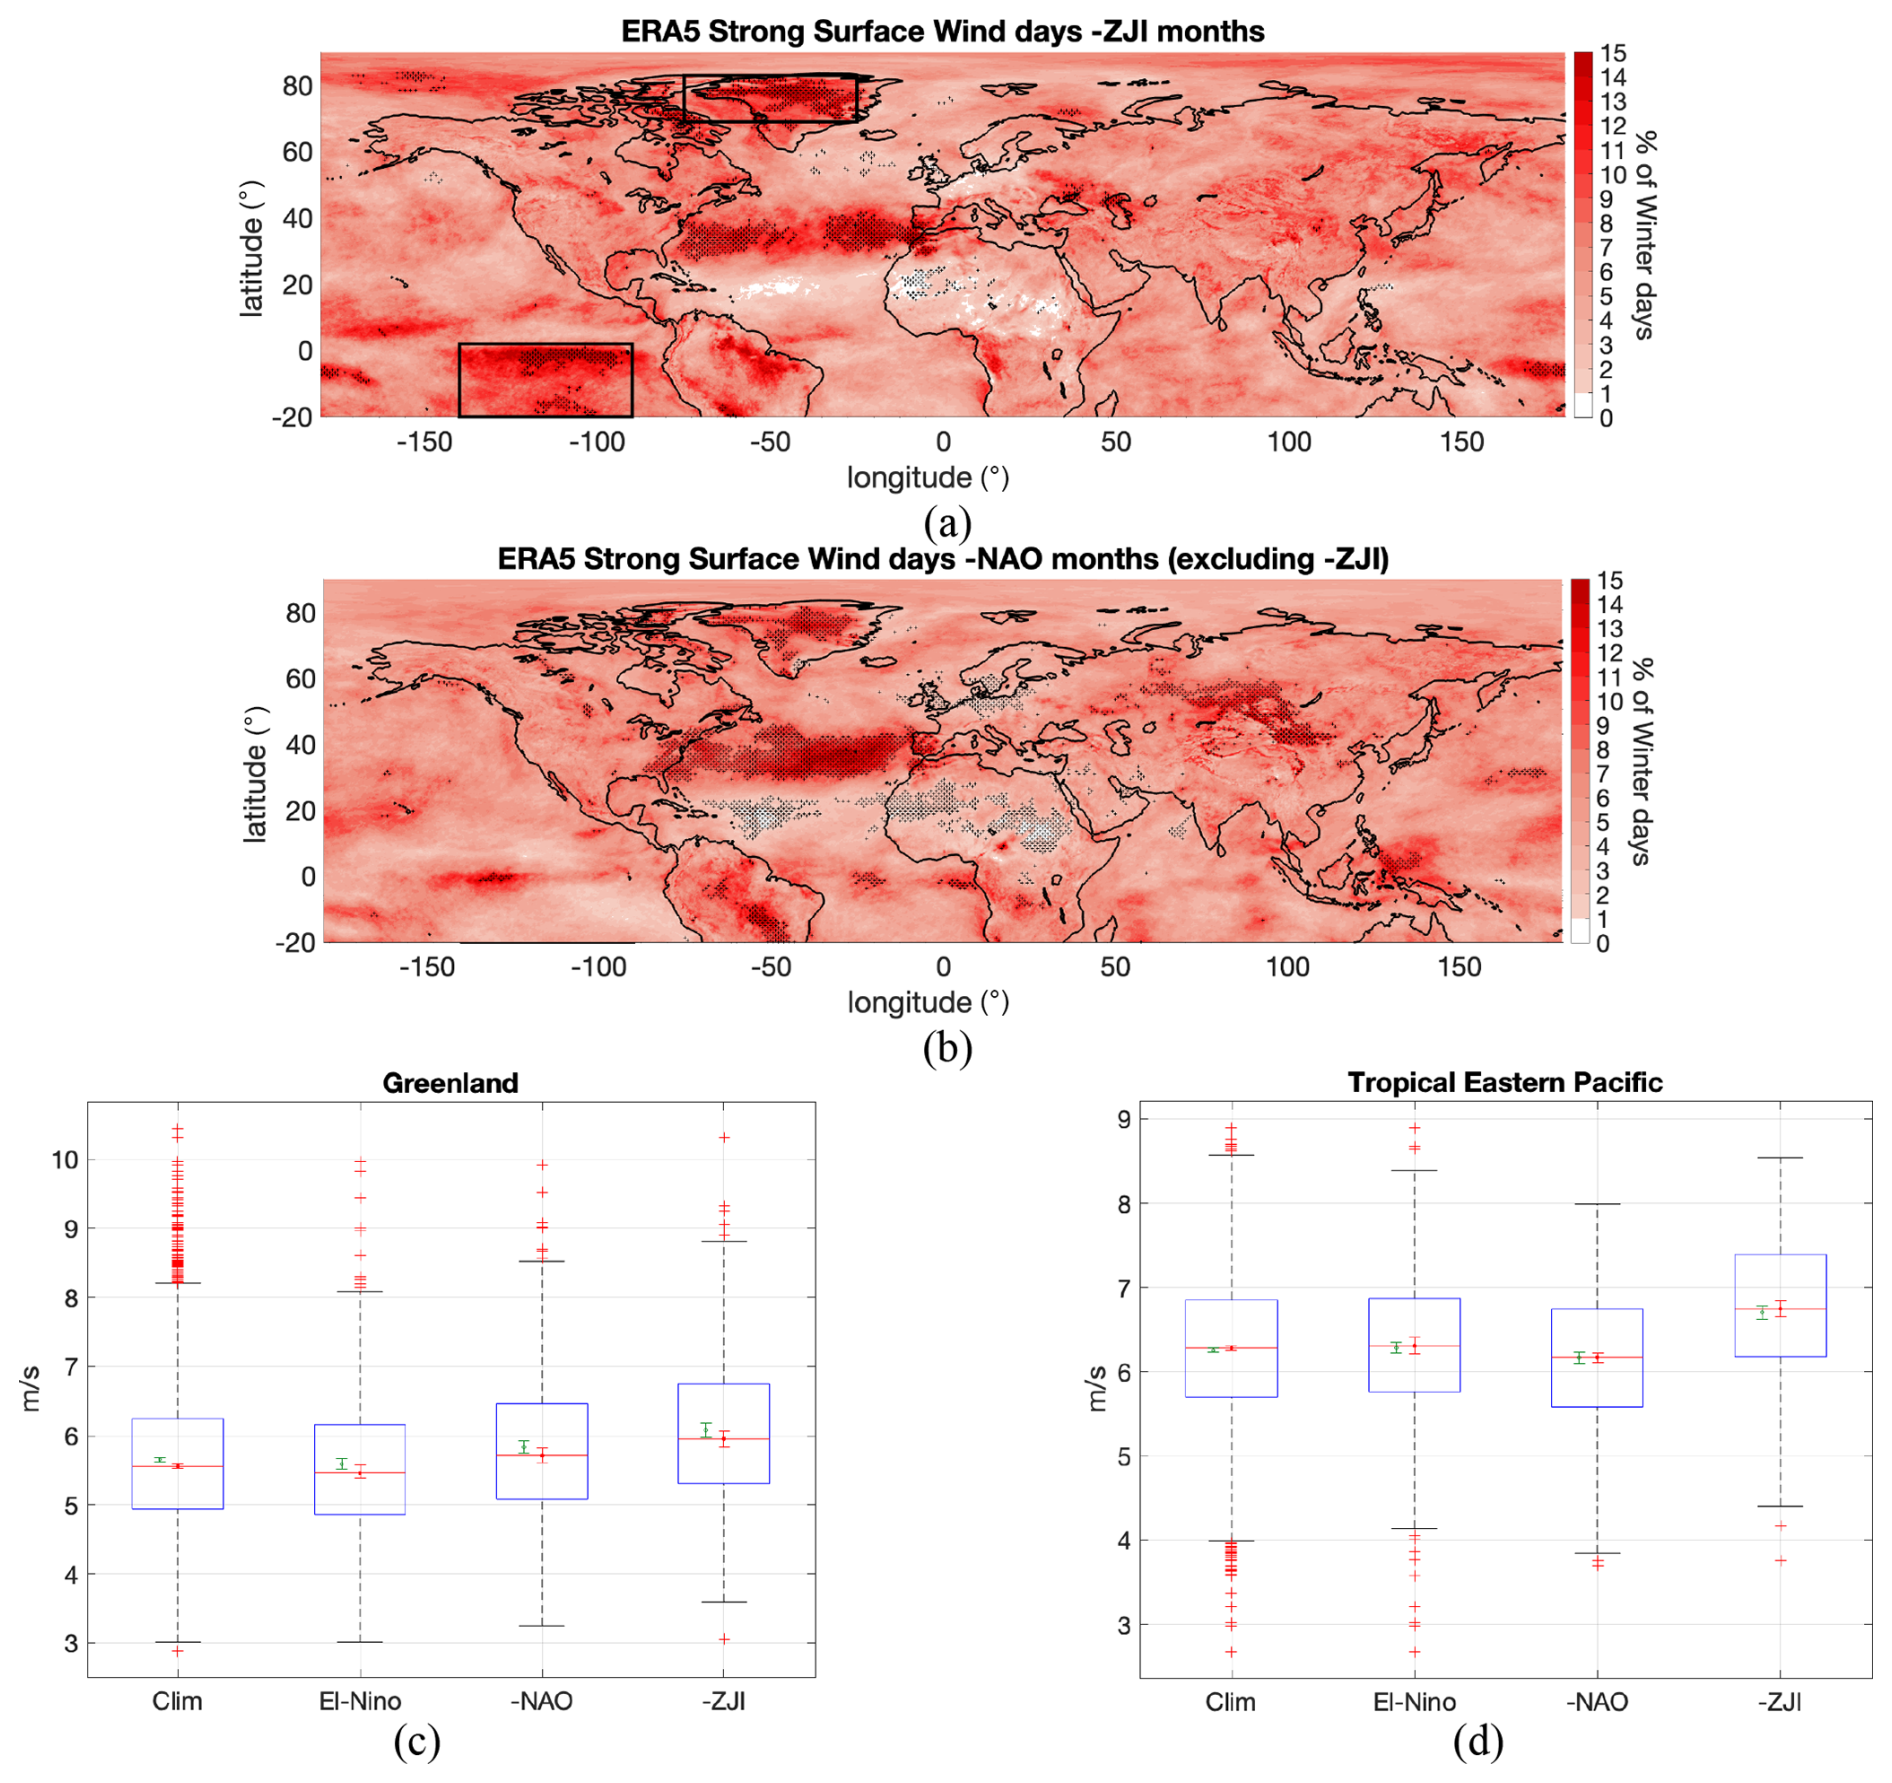
Figure 6(a, b) Distribution of the percentage of strong surface wind days for (a) merged-jet winter months, (b) negative NAO winter months excluding merged-jet months. The regions stippled in black (+) represent regions significant at 99 % using Monte Carlo simulation. (c, d) Box plots, similar to Fig. 3, of daily wind averaged over (c) Greenland [69–83° N, 75–25° W], (d) tropical eastern Pacific [20° S–2° N, 140–90° W]. These regions are marked in boxes in Fig. 6a.
The box plots of area-averaged daily mean surface wind over Greenland and the eastern tropical Pacific region, marked in boxes in Fig. 6a, are shown in Fig. 6c and d, respectively. Over Greenland, there appear to be stronger winds during merged-jet months, with negative NAO also contributing to the extremes. Except for one very weak wind day, the jet merging contributes mostly to the strongest wind days and to the mean. Over the eastern tropical Pacific, both the mean and median surface wind during negative ZJI winter days surpass those observed in negative NAO (excluding negative ZJI), El Niño (excluding negative ZJI), and climatological winter days. This shift signifies a higher concentration of strong winds over this region during negative ZJI winter days. This observed higher concentration of strong winds during negative ZJI winter months could be influenced by increased storm activity over the region during jet merging, necessitating further analysis to validate these findings.
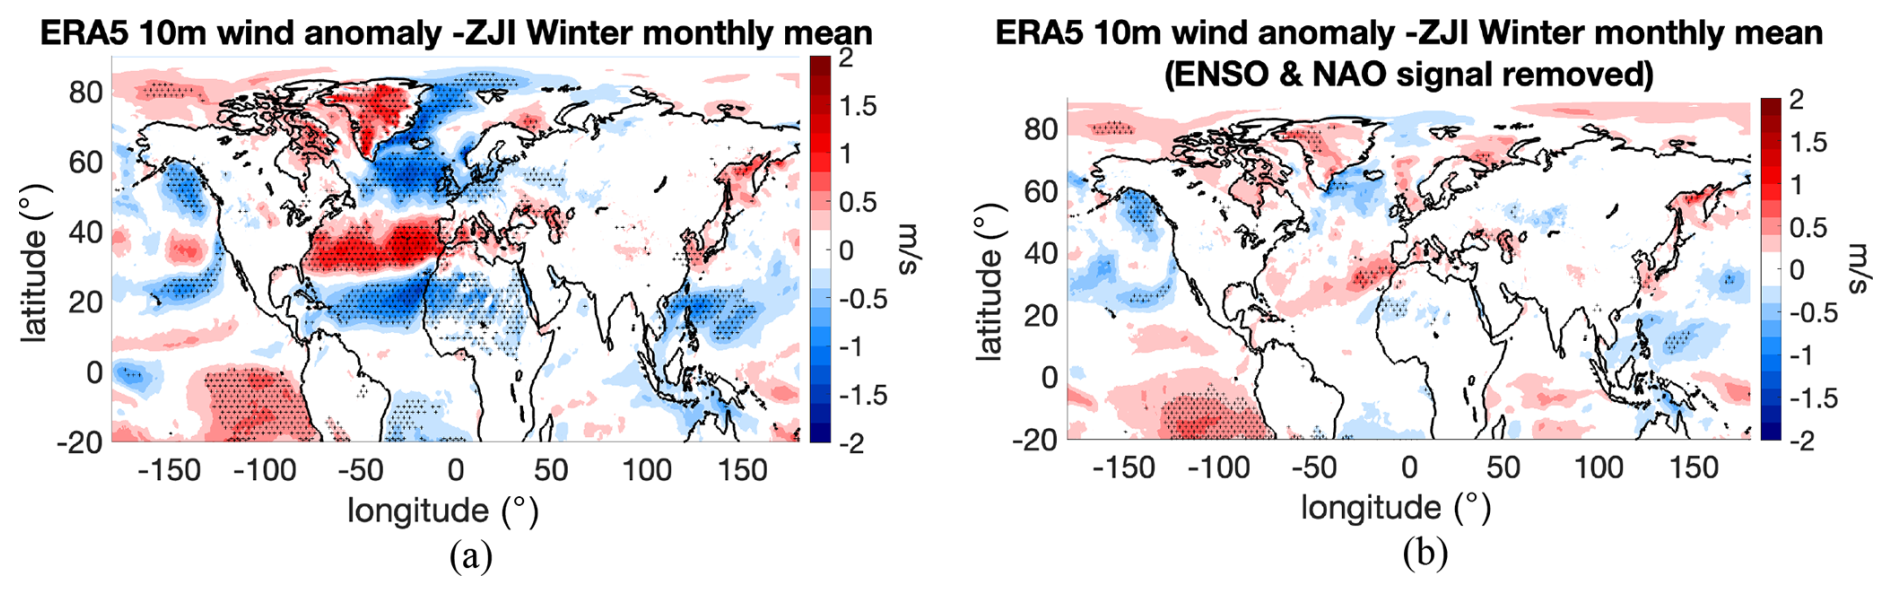
Figure 7(a) Composite for anomalous 10 m surface wind (m s−1) for negative ZJI winter months. (b) Same as panel (a) but with the NAO and ENSO signals removed using linear regression analysis. The stipples (+) represent regions for which the composites are significant at 95 %, based on a two-sided Student's t test against climatology.
Now we examine the 10 m surface wind anomaly composite for negative ZJI winter months, as shown in Fig. 7a. Here we see the presence of strong wind over the subtropical Atlantic Ocean aligning with the zonally oriented merged jet with weaker winds on either side, toward the midlatitude and tropics. We also see the strong wind at the tropical eastern Pacific and over the polar region near Greenland. This coincides with the regions experiencing the extreme wind during the negative ZJI winter shown in Fig. 6a. From this, we remove the NAO and ENSO signal, resulting in the residual wind signals shown in Fig. 7b. This plot shows that the stronger surface wind, contributed from the merged-jet event over the Atlantic, forms a belt stretching from the coast of Cuba, extending northeast with stronger wind toward the Iberian Peninsula. This is consistent with the fewer surface wind extremes toward the west of the Atlantic during negative NAO winter without negative ZJI shown in Fig. 6b. We also see that the strong wind activity over the tropical eastern Pacific continues to exist even after removing the NAO and ENSO signal. A previous study by Harnik et al. (2014), using Lagrangian back-trajectory analysis of the Atlantic subtropical jet, demonstrated a significant northward displacement of air parcels from this tropical eastern Pacific region to the subtropics. This transport process supplies additional airflow and momentum to the Atlantic jet, supporting its intensification and the formation of the merged jet. Additionally, we observe the strong wind anomaly persisting over the polar region near Greenland, which could be the result of potential shift in cyclone tracks to Greenland and the Arctic archipelago during negative ZJI winter months.
3.3 Precipitation
Similar to the previous analysis, we now examine the total precipitation. Figure 8a shows the frequency of days with high precipitation (exceeding the 95th percentile daily precipitation) for negative ZJI winter. Here we see that the extreme high precipitation is concentrated over the Iberian Peninsula and the western Greenland region. The former observation is consistent with a previous study (Vicente-Serrano et al., 2011), which showed the prolonged occurrence of rainy days during the winter of 2009–2010, exhibiting an unusually high frequency across much of the Iberian Peninsula. The study delved into the notable influence of the extreme negative winter NAO on precipitation in the western and southern areas of Iberia. Additionally, it highlighted the potential correlation between the southward displacement of the jet during the winter of 2010 and the anomalously intense precipitation, distinguishing it from other winters characterized by a strongly negative NAO. This correlation is clearly evident when comparing Fig. 8a and b, where we see a higher frequency of extreme precipitation during negative ZJI winter compared with negative NAO winter (excluding negative ZJI) over regions of the Iberian Peninsula and northern Africa and regions over western Greenland. We also looked into a similar plot for El Niño winter (see Fig. S5a–b) but no substantial contributions were identified over these regions. Figure 8c and d display box plots of total daily precipitation averaged over the regions of western Greenland and the areas covering the Iberian Peninsula and northern Africa, respectively (marked in boxes in Fig. 8a). In western Greenland, both the mean and median total precipitation are higher during negative ZJI winter, compared with negative NAO (excluding negative ZJI), El Niño (excluding negative ZJI), and climatological winter days. Additionally, on comparing the outliers, we see that there is notable extreme daily precipitation from the climatology that falls within the negative ZJI winter days. A more extreme pattern is observed over the Iberian Peninsula, where the mean total precipitation during negative ZJI winter is significantly higher than the average climatological and El Niño winters and slightly higher than negative NAO winter. Furthermore, the larger daily precipitation from the climatology falls within the negative ZJI winter days, indicating extreme precipitation during the merged-jet winters. It is also interesting to note from Fig. 8e, which shows the frequency of days with low precipitation (less than the 5th percentile of daily precipitation), that the low precipitation extreme is concentrated mostly over the south of Greenland during negative ZJI winter, in proximity to one of the deep-water formation regions. Jet merging appears to result in reduced precipitation input over this region south of Greenland during winter.
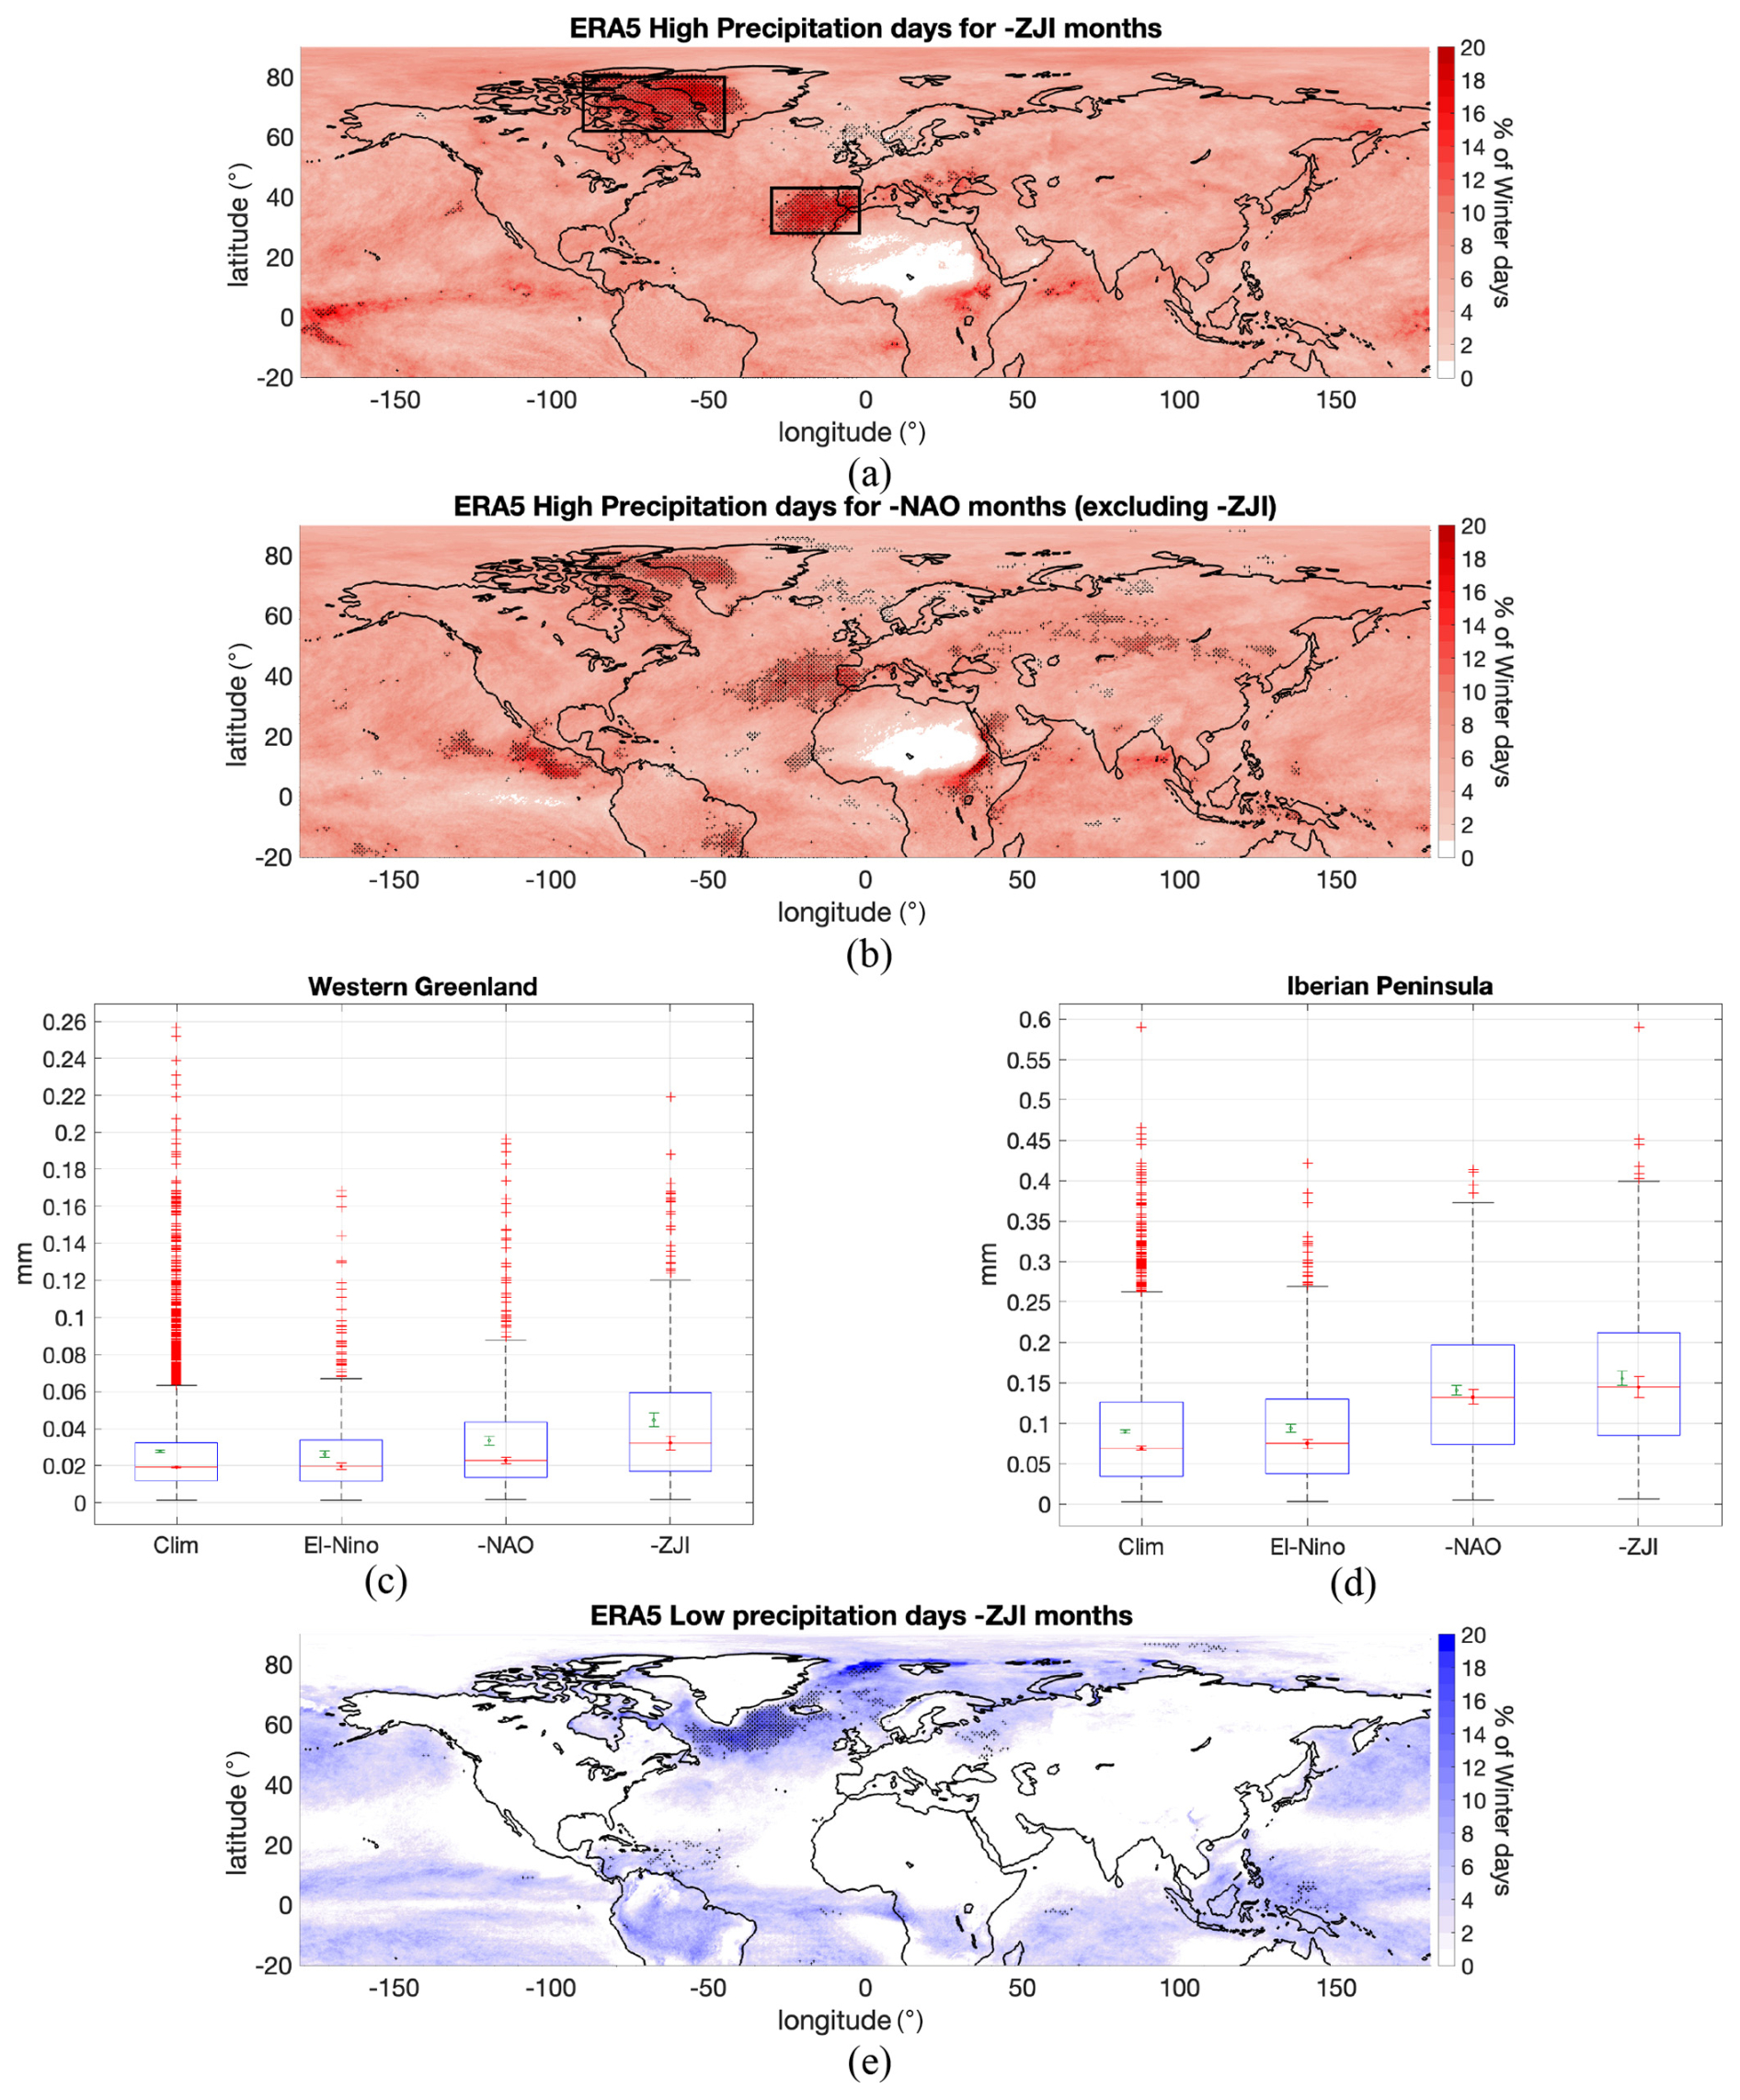
Figure 8(a, b) Distribution of the percentage of high precipitation days for (a) merged-jet winter months, (b) negative NAO winter months excluding merged-jet months. (c, d) Box plots, similar to Fig. 3, of daily wind averaged over (c) western Greenland [62–80° N, 90–45° W], (d) the Iberian Peninsula [28–43° N, 30–2° W] (boxes marked in Fig. 8a). (e) Distribution of the percentage of low precipitation days for merged-jet winter months. The regions stippled in black (+) represent regions significant at 99 % using Monte Carlo simulation.
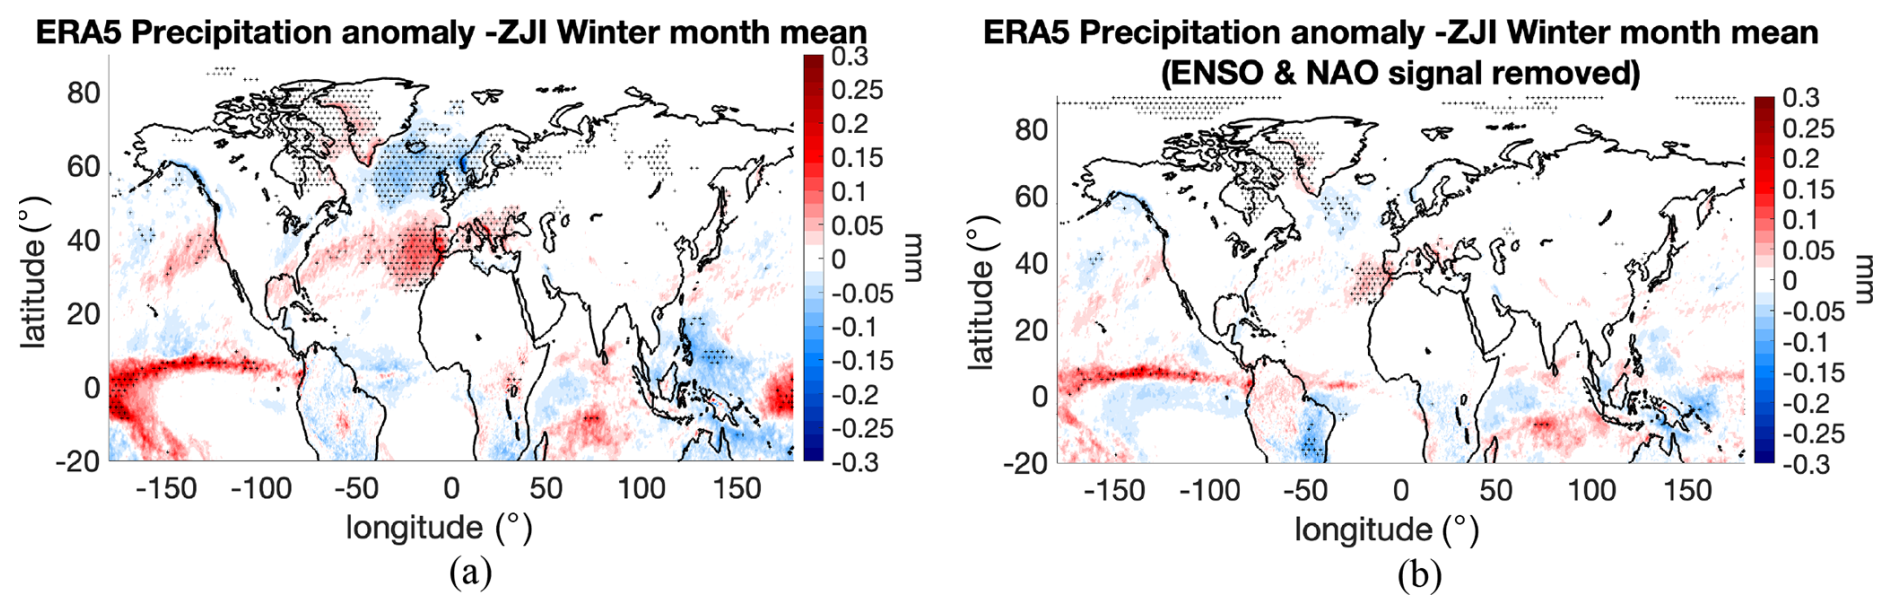
Figure 9(a) Composite for anomalous total precipitation (mm) for negative ZJI winter months. (b) Same as panel (a) but with the NAO and ENSO signals removed using linear regression analysis. The stipples (+) represent regions for which the composites are significant at 95 %, based on a two-sided Student's t test against climatology.
Now, for the precipitation composite anomaly for negative ZJI winter months, we look at Fig. 9a. We see that, over the Atlantic Ocean, the precipitation anomaly is higher over the subtropics, aligning with the stronger wind anomaly here during negative ZJI months. We also see the stronger precipitation anomaly over the western coast of Greenland and weaker precipitation anomaly over the eastern coast. The stronger precipitation anomaly over the tropical Pacific appears due to the higher convection over this region from strong El Niño conditions. Once we remove the NAO and ENSO signal from this, the residual signal appears, as shown in Fig. 9b. Here we see that the precipitation anomaly over the Iberian Peninsula still persists, even though the anomaly over the western Atlantic weakens, indicating the stronger precipitation over the Iberian Peninsula during merged-jet winter. We see a similar pattern over the western coast of Greenland, while, over the southeastern Greenland coast, there is a negative precipitation anomaly signal, which coincides with the region of low precipitation extremes seen earlier during jet merging. Even though we removed the ENSO signal, we see a strong precipitation anomaly over the tropical eastern Pacific region and increased precipitation over South America. The role of wind patterns and cyclone formation during jet-merging months contributing to this distribution needs to be investigated further.
We know that cyclones represent rotating weather systems capable of causing substantial rainfall, heightened surface winds, and destructive surges. The jet stream plays a significant role in both the initiation and intensification of cyclones and also influences the positioning of storm tracks (Holton, 2007; Pinto et al., 2009). Therefore, it is of interest to investigate and compare the potential impact of cyclones on regional extreme weather during negative ZJI winter months. Figure 10a–c show composite plots of the cyclone density anomaly during the negative ZJI winters and negative NAO winters (excluding negative ZJI) and the difference between them, as well as the 10 m surface eddy kinetic energy (EKE) anomaly in contours. The cyclone density anomaly during the negative ZJI winters shows that the cyclones have anomalously shifted southward and become zonally oriented, as expected, due to the merged-jet formation, influencing the cyclonic activity near the Iberian Peninsula, northern Africa, and much of the western and central Mediterranean. It is well known that the NAO influences the positioning and alignment of cyclone tracks, resulting in a northeastern extension of storm tracks during positive NAO phases and a southward shift during negative NAO phases (Pinto et al., 2009). This southward shift is exactly what we observe in Fig. 10b for negative NAO winter months but, on comparing it with Fig. 10a, we see that during negative ZJI months the cyclone tracks are oriented even farther south compared with negative NAO months (also see Fig. S6a and b, which shows Fig. 10a and b with the 95 % significant regions). It is also important to note that, during negative ZJI winter months, there is a higher cyclone density over the western regions of Greenland, which is not common in the usual negative NAO winters. This distinction is evident from Fig. 10c, where an increased concentration of cyclones is observed along the coast of Greenland and over the Atlantic at latitudes between 30 and 40° N.
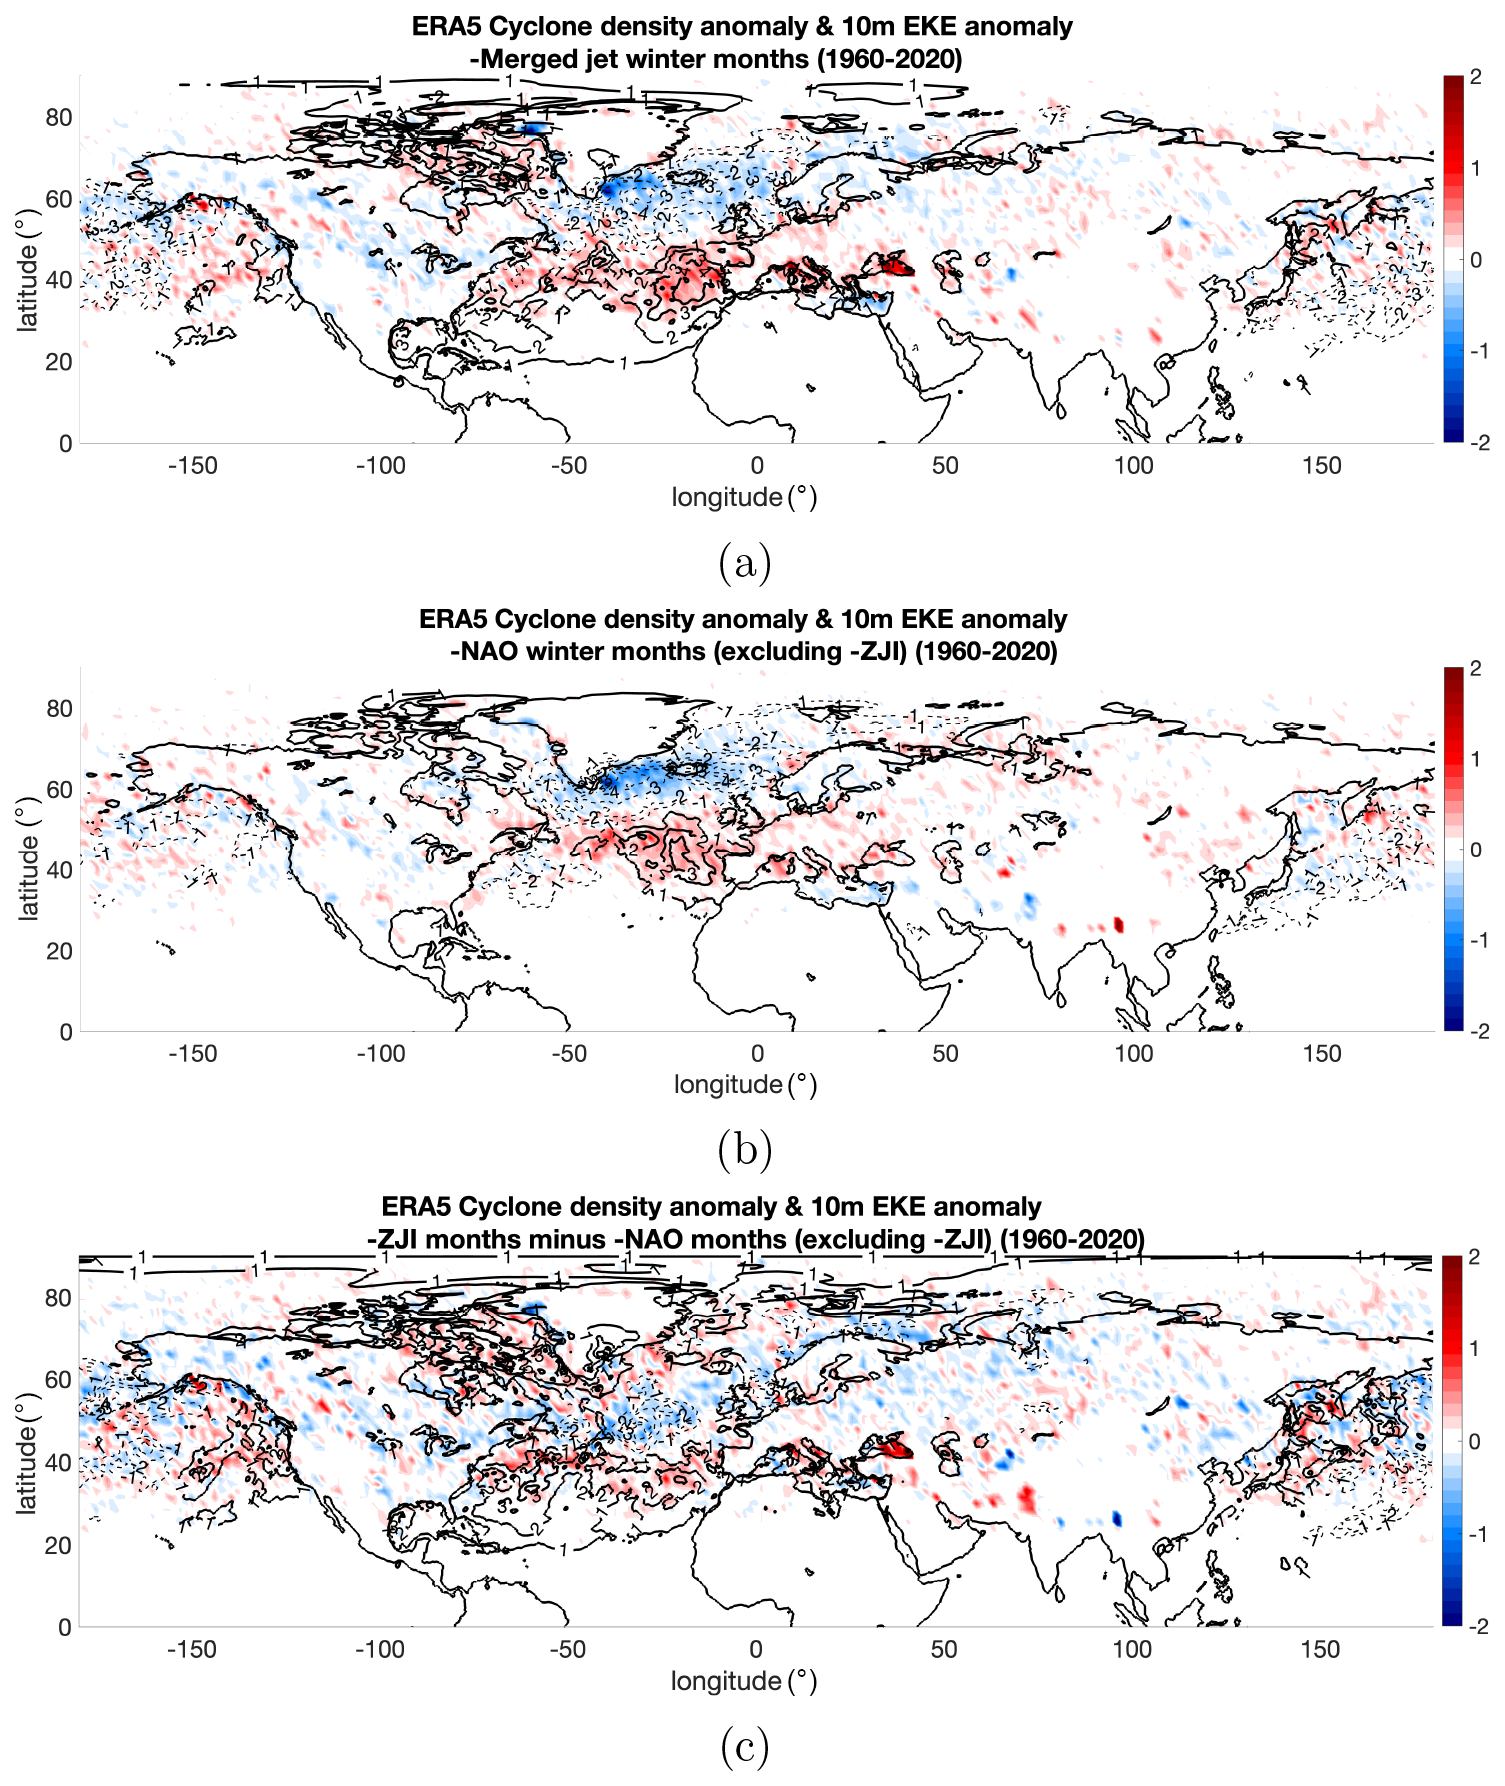
Figure 10(a, b) Cyclone density (number of cyclones per month per grid point) monthly anomaly composite during (a) merged-jet winter, (b) negative NAO winter months excluding merged-jet months. (c) Difference of cyclone density monthly anomaly between panels (a) and (b). The surface eddy kinetic energy (m2 s−2) anomaly is shown in contours. Positive and negative values are shown by solid and dashed lines, respectively.
The increased (decreased) anomaly in cyclone track density coincides with the positive (negative) anomaly in surface EKE. While both negative NAO winters and negative ZJI winters exhibit weaker EKE in the midlatitude Atlantic, negative ZJI winters stand out with stronger EKE, particularly over western Greenland and over the 40° N Atlantic region. This indicates that, during jet merging, the usually northeast-oriented cyclone tracks over the Atlantic not only shift southward, similar to negative NAO winters, but also extend to the western Greenland region with the stronger eddy kinetic energy. Hence, following cyclogenesis at the subtropical east Atlantic, there appears to be notable deviation from the conventional northeastward trajectory of cyclones during jet merging. Most cyclones exhibit a zonal migration toward the eastern Atlantic, extending across the Mediterranean, while certain cyclones move toward the western coast of Greenland, becoming ensnared amid the Arctic archipelago region. This phenomenon elucidates the aggregation of extreme anomalies observed over western Greenland, the dry weather experienced in northern Europe, and the heightened frequency of precipitation in the Iberian Peninsula, as discussed in the previous section.
We have analyzed how extreme surface temperature, precipitation, and surface wind events are distributed across the NH when the monthly Atlantic and African jets anomalously merge during winter. We have also explored how the distribution of these extremes differs during merged-jet winter months from those observed during winters influenced by strong negative NAO or El Niño conditions in the absence of jet merging.
Firstly, we identify that merged-jet winters exhibit a distinct extreme surface temperature pattern, forming a warm extreme belt over the Mediterranean, North Africa, and the subtropical Atlantic. This belt is much weaker during strong negative NAO/El Niño winters without jet merging, indicating a stronger link between merged jets and lower-latitude temperature extremes, compared with just negative NAO/El Niño. At the same time, at higher latitudes, warm and cold extremes are seen over Greenland and northern Eurasia, respectively. To assess whether merged-jet winters influence this extreme temperature distribution independently of ENSO and NAO, we regressed out their signals from detrended monthly temperature anomalies. The results show that anomalous temperature distributions, though weakened, persist during merged-jet winters. Notably, a warming over the Arctic emerges after removing NAO and ENSO signals. This anomalous warming could lead to decreased eddy activity (eddy fluxes and eddy kinetic energy) over these regions (Yuval and Kaspi, 2020; Chemke and Polvani, 2020), consistent with the jet merging. We note, furthermore, that the Arctic sea-ice loss, which we did not explicitly examine here, could play a role in weakening eddy activity and in the occurrence of extreme winter weather across the midlatitudes (Francis and Vavrus, 2012; Kim et al., 2014; Peings et al., 2023; Cohen et al., 2014, 2021; Kinnard et al., 2011; Rantanen et al., 2022).
In essence, during merged-jet winters, we observe a distinct distribution of surface temperature extremes accompanied by enhanced tropical heating over both the Atlantic and the Pacific regions (primarily due to El Niño). At the same time, over higher latitudes, a warm Arctic and cold Eurasia pattern emerges, altering the meridional temperature gradient and thereby influencing midlatitude baroclinicity. A similar, but zonally symmetric, reduction of mid- to high-latitude baroclinicity, alongside stronger tropical heating, has been shown in previous studies using idealized models to cause a dynamical regime shift from an eddy-driven jet to a mixed thermally driven and eddy-driven jet (Son and Lee, 2005; Lachmy and Harnik, 2014, 2016). But this has not been documented well within the real-world observations. Hence our results suggest that the merging of Atlantic and African jets is a real-world realization of a dynamical regime shift from an eddy-driven jet to a mixed thermally–eddy-driven jet. Additionally, the development of warmer oceanic regions, particularly over the subtropical Atlantic and equatorial Pacific, could contribute to sustaining the merged Atlantic–African jet throughout the winter season, thus affecting the extreme weather distribution over the NH.
Secondly, our analysis of surface wind extremes revealed concentrated regions of strong winds over the subtropical Atlantic, Greenland, and the eastern tropical Pacific during negative ZJI winters, with a notable increase in frequency compared with typical negative NAO winters. A strong wind activity over the tropical eastern Pacific continues to exist even on removing the NAO and ENSO signal; this possibly indicates an anomalous overturning circulation that gives rise to the ongoing air flow into the Atlantic jet from the subtropical Pacific during jet merging, as suggested in Harnik et al. (2014). Furthermore, our investigation into precipitation patterns demonstrated an increase in extreme precipitation over the Iberian Peninsula and western Greenland with low precipitation over the southeastern Greenland coast during negative ZJI winters, which was distinct from negative NAO and El Niño winters. This highlights the significant impact of the merged-jet event on regional precipitation distributions.
Finally, this study suggests a significant role of cyclones in driving extreme weather events during jet merging, through changing cyclone tracks. This is implied by the fact that the increase in precipitation, and also, to a certain degree, wind extremes, occurs in regions in which cyclones are more frequent. More explicitly, during negative ZJI winters, cyclones exhibit a much stronger southward and zonal shift, along with higher cyclone density over western Greenland. This is accompanied by corresponding changes in eddy kinetic energy, which is anomalously stronger or weaker in regions with more or fewer cyclones, respectively. Cyclones in negative ZJI winters shift from the conventional northeastward trajectory onto northern Europe, toward the eastern Atlantic and Mediterranean, with a second branch along the North American coast and western Greenland, contributing to regional extreme anomalies. These findings underscore the complex interplay between merged-jet dynamics over the Atlantic and cyclonic activity, ultimately influencing regional weather patterns and extreme events. Given the possible increase in Arctic amplification and extreme El Niño events (Cai et al., 2014; Wang et al., 2019) in the future global warming scenario, such persistent jet merging due to dynamical regime shifting and its associated extreme weather events can possibly occur more frequently. Indeed, analyses of large ensemble simulations from several general circulation models (GCMs) suggest that Atlantic–African jet merging is projected to become more frequent in the future. This projected increase is the focus of ongoing research and will be explored further in future work.
ERA5 data used in this study are freely available from the Copernicus Climate Change Service (C3S) Climate Data Store at https://doi.org/10.24381/cds.f17050d7 (Hersbach et al., 2023a) and https://doi.org/10.24381/cds.6860a573 (Hersbach et al., 2023b). The NAO index is available at https://www.cpc.ncep.noaa.gov/products/precip/CWlink/pna/nao.shtml (NOAA, 2024a) and the Oceanic Niño Index (ONI) is available at https://psl.noaa.gov/data/correlation/oni.data (NOAA, 2024b). Cyclone tracks were found in ERA5 using the algorithm from Pinto et al. (2005) and all the additional codes used for this study are available upon request.
The supplement related to this article is available online at https://doi.org/10.5194/wcd-6-789-2025-supplement.
SS, NH, and RC designed the analysis. SS carried out the analysis and drafted the first version of the manuscript with feedback from NH and RC. All authors contributed to discussions, structuring the analysis, and reviewing the paper.
At least one of the (co-)authors is a member of the editorial board of Weather and Climate Dynamics. The peer-review process was guided by an independent editor, and the authors also have no other competing interests to declare.
Publisher's note: Copernicus Publications remains neutral with regard to jurisdictional claims made in the text, published maps, institutional affiliations, or any other geographical representation in this paper. While Copernicus Publications makes every effort to include appropriate place names, the final responsibility lies with the authors.
The authors would like to thank Joaquim G. Pinto and his group at KIT, Germany, for providing the cyclone track data. The authors would also like to thank Gabriele Messori, Aleksa Stankovic, and Inovasita Alifdini for fruitful discussions during the early stages of the analysis, which helped to improve this work. In addition, the authors wish to acknowledge the two anonymous reviewers, whose insightful comments and suggestions helped to improve the paper.
This research has been supported by the European Union's Horizon 2020 research and innovation program (Marie Skłodowska-Curie grant no. 956396, EDIPI project) and the Israeli Science Foundation (grant no. 2466/23).
This paper was edited by Thomas Birner and reviewed by two anonymous referees.
Alexander, L. V., Uotila, P., and Nicholls, N.: Influence of sea surface temperature variability on global temperature and precipitation extremes, J. Geophys. Res.-Atmos., 114, D18116, https://doi.org/10.1029/2009JD012301, 2009. a
Amaya, D. J.: The Pacific meridional mode and ENSO: A review, Current Climate Change Reports, 5, 296–307, 2019. a
Arblaster, J. M. and Alexander, L. V.: The impact of the El Niño-Southern Oscillation on maximum temperature extremes, Geophys. Res. Lett., 39, L20702, https://doi.org/10.1029/2012GL053409, 2012. a
Barnes, E. A. and Hartmann, D. L.: Dynamical feedbacks and the persistence of the NAO, J. Atmos. Sci., 67, 851–865, 2010. a, b
Brönnimann, S., Luterbacher, J., Staehelin, J., Svendby, T., Hansen, G., and Svenøe, T.: Extreme climate of the global troposphere and stratosphere in 1940–42 related to El Niño, Nature, 431, 971–974, 2004. a, b
Cai, W., Borlace, S., Lengaigne, M., Van Rensch, P., Collins, M., Vecchi, G., Timmermann, A., Santoso, A., Mcphaden, M. J., Wu, L., England, M. H., Wang, G., Guilyardi, E., and Jin, F. F: Increasing frequency of extreme El Niño events due to greenhouse warming, Nat. Clim. Change, 4, 111–116, 2014. a
Cattiaux, J., Vautard, R., Cassou, C., Yiou, P., Masson-Delmotte, V., and Codron, F.: Winter 2010 in Europe: A cold extreme in a warming climate, Geophys. Res. Lett., 37, L20704, https://doi.org/10.1029/2010GL044613, 2010. a, b
Chang, P., Zhang, L., Saravanan, R., Vimont, D. J., Chiang, J. C., Ji, L., Seidel, H., and Tippett, M. K.: Pacific meridional mode and El Niño–Southern oscillation, Geophys. Res. Lett., 34, L16608, https://doi.org/10.1029/2007GL030302, 2007. a
Chemke, R. and Polvani, L. M.: Linking midlatitudes eddy heat flux trends and polar amplification, npj Clim. Atmos. Sci., 3, 8, https://doi.org/10.1038/s41612-020-0111-7, 2020. a, b
Cohen, J., Screen, J. A., Furtado, J. C., Barlow, M., Whittleston, D., Coumou, D., Francis, J., Dethloff, K., Entekhabi, D., Overland, J., and Jones, J.: Recent Arctic amplification and extreme mid-latitude weather, Nat. Geosci., 7, 627–637, 2014. a
Cohen, J., Agel, L., Barlow, M., Garfinkel, C. I., and White, I.: Linking Arctic variability and change with extreme winter weather in the United States, Science, 373, 1116–1121, 2021. a
Donat, M. G., Peterson, T. C., Brunet, M., King, A. D., Almazroui, M., Kolli, R. K., Boucherf, D., Al-Mulla, A. Y., Nour, A. Y., Aly, A. A., Nada, T. A. A., Semawi, M. M., Al Dashti, H. A., Salhab, T. G., El Fadli, K. I., Muftah, M. K., Dah Eida, S., Badi, W., Driouech, F., El Rhaz, K., Abubaker, M. J. Y., Ghulam, A. S., Erayah, A. S., Mansour, M. B., Alabdouli, W. O., Al Dhanhani, J. S., and Al Shekaili, M. N.: Changes in extreme temperature and precipitation in the Arab region: long-term trends and variability related to ENSO and NAO, Int. J. Climatol., 34, 581–592, 2014. a, b
Drouard, M., Kornhuber, K., and Woollings, T.: Disentangling dynamic contributions to summer 2018 anomalous weather over Europe, Geophys. Res. Lett., 46, 12537–12546, 2019. a
Eichelberger, S. J. and Hartmann, D. L.: Zonal jet structure and the leading mode of variability, J. Climate, 20, 5149–5163, 2007. a, b
Francis, J. A. and Vavrus, S. J.: Evidence linking Arctic amplification to extreme weather in mid-latitudes, Geophys. Res. Lett., 39, L06801, https://doi.org/10.1029/2012GL051000, 2012. a
Harnik, N., Galanti, E., Martius, O., and Adam, O.: The anomalous merging of the African and North Atlantic jet streams during the Northern Hemisphere winter of 2010, J. Climate, 27, 7319–7334, 2014. a, b, c, d, e, f, g, h, i
Held, I. M.: Momentum transport by quasi-geostrophic eddies, J. Atmos. Sci, 32, 1494–1497, 1975. a
Held, I. M. and Hou, A. Y.: Nonlinear axially symmetric circulations in a nearly inviscid atmosphere, J. Atmos. Sci., 37, 515–533, 1980. a
Hersbach, H., Bell, B., Berrisford, P., Biavati, G., Horányi, A., Muñoz Sabater, J., Nicolas, J., Peubey, C., Radu, R., Rozum, I., Schepers, D., Simmons, A., Soci, C., Dee, D., and Thépaut, J.-N.: ERA5 monthly averaged data on single levels from 1940 to present, Copernicus Climate Change Service (C3S) Climate Data Store (CDS) [data set], https://doi.org/10.24381/cds.f17050d7, 2023a. a, b
Hersbach, H., Bell, B., Berrisford, P., Biavati, G., Horányi, A., Muñoz Sabater, J., Nicolas, J., Peubey, C., Radu, R., Rozum, I., Schepers, D., Simmons, A., Soci, C., Dee, D., and Thépaut, J.-N.: ERA5 monthly averaged data on pressure levels from 1940 to present, Copernicus Climate Change Service (C3S) Climate Data Store (CDS) [data set], https://doi.org/10.24381/cds.6860a573, 2023b. a
Holton, J. R.: An introduction to dynamic meteorology, Elsevier Academic Press Boston, ISBN 9780123848666, 2007. a
Huang, B., Thorne, P. W., Banzon, V. F., Boyer, T., Chepurin, G., Lawrimore, J. H., Menne, M. J., Smith, T. M., Vose, R. S., and Zhang, H.-M.: Extended reconstructed sea surface temperature, version 5 (ERSSTv5): upgrades, validations, and intercomparisons, J. Climate, 30, 8179–8205, 2017. a
Hurrell, J. W.: Decadal trends in the North Atlantic Oscillation: Regional temperatures and precipitation, Science, 269, 676–679, 1995. a, b
Jianping, L. and Wang, J. X.: A new North Atlantic Oscillation index and its variability, Adv. Atmos. Sci., 20, 661–676, 2003. a
Kenyon, J. and Hegerl, G. C.: Influence of modes of climate variability on global precipitation extremes, J. Climate, 23, 6248–6262, 2010. a
Kim, B.-M., Son, S.-W., Min, S.-K., Jeong, J.-H., Kim, S.-J., Zhang, X., Shim, T., and Yoon, J.-H.: Weakening of the stratospheric polar vortex by Arctic sea-ice loss, Nat. Commun., 5, 4646, https://doi.org/10.1038/ncomms5646, 2014. a
Kim, H.-K. and Lee, S.: The wave–zonal mean flow interaction in the Southern Hemisphere, J. Atmos. Sci., 61, 1055–1067, 2004. a
Kim, J.-W., Yu, J.-Y., and Tian, B.: Overemphasized role of preceding strong El Niño in generating multi-year La Niña events, Nat. Commun., 14, 6790, https://doi.org/10.1038/s41467-023-42373-5, 2023. a
Kinnard, C., Zdanowicz, C. M., Fisher, D. A., Isaksson, E., de Vernal, A., and Thompson, L. G.: Reconstructed changes in Arctic sea ice over the past 1450 years, Nature, 479, 509–512, 2011. a
Lachmy, O. and Harnik, N.: The transition to a subtropical jet regime and its maintenance, J. Atmos. Sci., 71, 1389–1409, 2014. a
Lachmy, O. and Harnik, N.: Wave and jet maintenance in different flow regimes, J. Atmos. Sci., 73, 2465–2484, 2016. a, b
Lachmy, O. and Harnik, N.: Tropospheric jet variability in different flow regimes, Q. J. Roy. Meteor. Soc., 146, 327–347, 2020. a
Lee, S. and Kim, H.-K.: The dynamical relationship between subtropical and eddy-driven jets, J. Atmos. Sci., 60, 1490–1503, 2003. a
Li, C. and Wettstein, J. J.: Thermally driven and eddy-driven jet variability in reanalysis, J. Climate, 25, 1587–1596, 2012. a
Lorenz, D. J. and Hartmann, D. L.: Eddy–zonal flow feedback in the Northern Hemisphere winter, J. Climate, 16, 1212–1227, 2003. a
Lu, J., Chen, G., and Frierson, D. M.: The position of the midlatitude storm track and eddy-driven westerlies in aquaplanet AGCMs, J. Atmos. Sci., 67, 3984–4000, 2010. a
Michel, C. and Rivière, G.: Sensitivity of the position and variability of the eddy-driven jet to different SST profiles in an aquaplanet general circulation model, J. Atmos. Sci., 71, 349–371, 2014. a
Moore, G. and Renfrew, I.: Cold European winters: interplay between the NAO and the East Atlantic mode, Atmos. Sci. Lett., 13, 1–8, 2012. a
Murray, R. J. and Simmonds, I.: A numerical scheme for tracking cyclone centres from digital data, Aust. Meteorol. Mag., 39, 155–166, 1991. a, b
National Climatic Data Center: 2009–2010 Cold Season, NOAA's National Climatic Data Center, Asheville, NC, https://www.climatesignals.org/sites/default/files/resources/2009-2010-Cold-Season.compressed.pdf (last access: 21 February 2024), 2010. a
Neu, U., Akperov, M. G., Bellenbaum, N., Benestad, R., Blender, R., Caballero, R., Cocozza, A., Dacre, H. F., Feng, Y., Fraedrich, K., Grieger, J., Gulev, S., Hanley, J., Hewson, T., Inatsu, M., Keay, K., Kew, S. F., Kindem, I., Leckebusch, G. C., Liberato, M. L. R., Lionello, P., Mokhov, I. I., Pinto, J. G., Raible, C. C., Reale, M., Rudeva, I., Schuster, M., Simmonds, I., Sinclair, M., Sprenger, M., Tilinina, N. D., Trigo, I. F., Ulbrich, S., Ulbrich, U., Wang, X. L., and Wernli, H.: IMILAST: A community effort to intercompare extratropical cyclone detection and tracking algorithms, B. Am. Meteorol. Soc., 94, 529–547, 2013. a
NOAA: North Atlantic Oscillation index, Climate Indices: Monthly Atmospheric and Ocean Time Series, NOAA (National Oceanic and Atmospheric Administration) [data set], https://www.cpc.ncep.noaa.gov/products/precip/CWlink/pna/nao.shtml, last access: 10 January 2024a. a
NOAA: Oceanic Niño Index (ONI), Climate Indices: Monthly Atmospheric and Ocean Time Series, NOAA (National Oceanic and Atmospheric Administration) [data set], https://psl.noaa.gov/data/correlation/oni.data, last access: 10 January 2024b. a
O'Rourke, A. K. and Vallis, G. K.: Jet interaction and the influence of a minimum phase speed bound on the propagation of eddies, J. Atmos. Sci., 70, 2614–2628, 2013. a
Panetta, R. L.: Zonal jets in wide baroclinically unstable regions: Persistence and scale selection, J. Atmos. Sci., 50, 2073–2106, 1993. a
Peings, Y., Davini, P., and Magnusdottir, G.: Impact of Ural Blocking on Early Winter Climate Variability Under Different Barents-Kara Sea Ice Conditions, J. Geophys. Res.-Atmos., 128, e2022JD036994, https://doi.org/10.1029/2022JD036994, 2023. a
Pinto, J. G., Spangehl, T., Ulbrich, U., and Speth, P.: Sensitivities of a cyclone detection and tracking algorithm: individual tracks and climatology, Meteorol. Z., 14, 823–838, 2005. a, b, c, d
Pinto, J. G., Zacharias, S., Fink, A. H., Leckebusch, G. C., and Ulbrich, U.: Factors contributing to the development of extreme North Atlantic cyclones and their relationship with the NAO, Clim. Dynam., 32, 711–737, 2009. a, b, c
Rantanen, M., Karpechko, A. Y., Lipponen, A., Nordling, K., Hyvärinen, O., Ruosteenoja, K., Vihma, T., and Laaksonen, A.: The Arctic has warmed nearly four times faster than the globe since 1979, Commun. Earth Environ., 3, 168, https://doi.org/10.1038/s43247-022-00498-3, 2022. a
Rhines, P. B.: Waves and turbulence on a beta-plane, J. Fluid Mech., 69, 417–443, 1975. a
Ropelewski, C. F. and Halpert, M. S.: North American precipitation and temperature patterns associated with the El Niño/Southern Oscillation (ENSO), Mon. Weather Rev., 114, 2352–2362, 1986. a
Santos, J. A., Woollings, T., and Pinto, J. G.: Are the winters 2010 and 2012 archetypes exhibiting extreme opposite behavior of the North Atlantic jet stream?, Mon. Weather Rev., 141, 3626–3640, 2013. a
Schneider, E. K.: Axially symmetric steady-state models of the basic state for instability and climate studies. Part II. Nonlinear calculations, J. Atmos. Sci., 34, 280–296, 1977. a
Schubert, S. D., Chang, Y., Suarez, M. J., and Pegion, P. J.: ENSO and wintertime extreme precipitation events over the contiguous United States, J. Climate, 21, 22–39, 2008. a
Screen, J. A. and Simmonds, I.: Amplified mid-latitude planetary waves favour particular regional weather extremes, Nat. Clim. Change, 4, 704–709, 2014. a
Seager, R., Kushnir, Y., Nakamura, J., Ting, M., and Naik, N.: Northern Hemisphere winter snow anomalies: ENSO, NAO and the winter of 2009/10, Geophys. Res. Lett., 37, L14703, https://doi.org/10.1029/2010GL043830, 2010. a, b
Seager, R., Hoerling, M., Schubert, S., Wang, H., Lyon, B., Kumar, A., Nakamura, J., and Henderson, N.: Causes of the 2011–14 California drought, J. Climate, 28, 6997–7024, 2015. a
Son, S.-W. and Lee, S.: The response of westerly jets to thermal driving in a primitive equation model, J. Atmos. Sci., 62, 3741–3757, 2005. a, b, c
Son, S.-W. and Lee, S.: Preferred modes of variability and their relationship with climate change, J. Climate, 19, 2063–2075, 2006. a
Thompson, D. W. and Wallace, J. M.: Regional climate impacts of the Northern Hemisphere annular mode, Science, 293, 85–89, 2001. a
Vicente-Serrano, S. M., Trigo, R. M., López-Moreno, J. I., Liberato, M. L., Lorenzo-Lacruz, J., Beguería, S., Morán-Tejeda, E., and El Kenawy, A.: Extreme winter precipitation in the Iberian Peninsula in 2010: anomalies, driving mechanisms and future projections, Clim. Res., 46, 51–65, 2011. a, b
Wang, B., Luo, X., Yang, Y.-M., Sun, W., Cane, M. A., Cai, W., Yeh, S.-W., and Liu, J.: Historical change of El Niño properties sheds light on future changes of extreme El Niño, P. Natl. Acad. Sci. USA, 116, 22512–22517, 2019. a
Wang, C., Liu, H., and Lee, S.-K.: The record-breaking cold temperatures during the winter of 2009/2010 in the Northern Hemisphere, Atmos. Sci. Lett., 11, 161–168, 2010. a
You, Y. and Furtado, J. C.: The role of South Pacific atmospheric variability in the development of different types of ENSO, Geophys. Res. Lett., 44, 7438–7446, 2017. a
Yuval, J. and Kaspi, Y.: Eddy activity response to global warming–like temperature changes, J. Climate, 33, 1381–1404, 2020. a, b
Zhang, H., Clement, A., and Di Nezio, P.: The South Pacific meridional mode: A mechanism for ENSO-like variability, J. Climate, 27, 769–783, 2014. a