the Creative Commons Attribution 4.0 License.
the Creative Commons Attribution 4.0 License.
 | 25 Jun 2026
Impact, drivers and pathways of two Arctic atmospheric rivers in April 2020
Luisa E. Avilés-Podgurski
Patrick Martineau
Ayako Yamamoto
Amanda C. Maycock
Andrew Orr
Tony Phillips
Thomas J. Bracegirdle
Anna E. Hogg
Grzegorz Muszynski
Andrew Fleming
Atmospheric rivers (ARs) play a major role in transporting heat and moisture into the Arctic, yet their thermodynamic structure and regional impacts remain poorly understood. Here, we adopt a combined Eulerian–Lagrangian framework to investigate two intense ARs that penetrated into the central Arctic within one week in April 2020 during the MOSAiC field campaign. This study provides a comprehensive view of their large-scale dynamics, moisture sources, and thermodynamic evolution.
The first AR entered the Arctic via the Siberian sector, driven by a highly anomalous quasi-stationary anticyclone over north-central Siberia. The second followed an Atlantic pathway and was associated with an unusually deep and persistent cyclone over Baffin Bay. Despite their distinct origins and pathways, both events produced extreme surface impacts, including widespread warming across Eurasia exceeding 9 °C over a 7 d period and intense precipitation along the Greenland coast and in the central Arctic. The events coincided with a notable decline in sea ice extent along eastern Greenland and in the Barents-Kara Sea, that is highly correlated with the AR-induced warming and rainfall.
Backward trajectory analysis of parcels associated with extreme Arctic precipitation reveals distinct pathways and thermodynamic evolution. During both AR events, a subset of air parcels exhibiting classic AR characteristics is identified. These warm, moist, low-pressure airmasses ascend upon arrival and release intense precipitation. Moisture sources, however, differed by pathway: the Atlantic AR drew from the warm Gulf Stream region, while the Eurasian AR was fed by continental Eurasia. These findings highlight the diverse origins and mechanisms of ARs and their capacity to drive rapid Arctic climate and cryospheric changes.
- Article
(15671 KB) - Full-text XML
- BibTeX
- EndNote


Atmospheric rivers (ARs) are narrow bands of enhanced water vapour transport that play a crucial role in transporting moisture into the Arctic (Doyle et al., 2011; Liu and Barnes, 2015; Papritz et al., 2022; Ralph et al., 2018). ARs primarily originate in the subtropics and midlatitudes (Guan and Waliser, 2015) and are steered poleward by synoptic weather systems commonly associated with strong low–high pressure couplets (Dacre et al., 2015; Wang et al., 2024). Despite their episodic nature, ARs account for over 90 % of the total poleward moisture transport through the midlatitudes, making them key actors in the global hydroclimate (Nash et al., 2018; Zhu and Newell, 1998).
Arctic ARs occur year-round, following seasonally dependent pathways (Thaker et al., 2025). These pathways are largely concentrated over water bodies, where continuous evaporation supplies the necessary moisture (Pan et al., 2024; Salimi et al., 2020). Key regions include the Pacific sector and, in the Atlantic sector, the Nordic, Barents, and Kara Seas (Gong et al., 2025; Nash et al., 2018; Woods et al., 2013). Previous studies have emphasised the role of cyclone–anticyclone couplets in steering ARs into the Arctic (Gong et al., 2024). In the Atlantic sector, ARs are typically linked to cyclones that develop and deepen near Greenland, coupled with anticyclones over Scandinavia and Siberia (Papritz et al., 2022; Woods et al., 2013). Further, three distinct circulation patterns driving Arctic ARs have been identified: a dipole pattern, featuring high (low) pressure anomalies on the east (west) side of the AR; an anticyclone-dominated regime, characterised by a strong, persistent anticyclone on the east side of AR with a weak cyclone on the west; and a cyclone-dominated regime, characterised by a pronounced cyclone on the west side of the AR and weaker anticyclone on the east side (Ma et al., 2024b).
Recent decades have seen a rise in AR frequency in the Arctic (Gong et al., 2025; Thaker et al., 2025; Wang et al., 2024; Zhang et al., 2023). This observed rise is consistent with future projections under global warming, which indicate a poleward shift toward more frequent and intense ARs (Payne et al., 2020). However, these trends exhibit substantial regional variability (Wang et al., 2024; Zhang et al., 2023), with AR frequency over the North Atlantic increasing at roughly twice the rate as over the Pacific in recent decades (Ma et al., 2024a). Concurrently, the Arctic is undergoing accelerated surface warming, a phenomenon known as Arctic amplification (Previdi et al., 2021; Serreze and Barry, 2011). Enhanced poleward moisture transport has emerged as a key driver of this amplification, suggesting that continued increases in AR activity may exacerbate stress on an already vulnerable system (Doyle et al., 2011; Hao et al., 2019; Neff, 2018).
ARs can induce surface warming in the Arctic through various physical mechanisms. The greenhouse effect of water vapour and the latent heat released during condensation in advected airmasses can cause significant warming and promote surface melt (Boisvert et al., 2016; Mattingly et al., 2018). Increased atmospheric moisture also leads to the formation of extensive cloud bands with high liquid water content, which enhance downwelling longwave radiation and sensible heat fluxes (Hermann et al., 2020; Li et al., 2024; Svensson et al., 2023). This additional thermodynamic forcing contributes to surface warming, while simultaneously reducing the efficiency of the Arctic surface to cool radiatively (Cullather et al., 2016; Doyle et al., 2011; Graversen et al., 2011; Hegyi and Taylor, 2018). AR-induced rain-on-snow events and melt further reduce the surface albedo, amplifying surface warming (Kolbe et al., 2025; Zhang et al., 2023). Lastly, as an AR is advected into the polar environment, the warm, moist air is forced upward by the cold Arctic air, leading to a combination of condensation, cloud formation, and precipitation accompanied by further latent heat release (Komatsu et al., 2018).
ARs are increasingly recognised as a major driver of sea ice variability in the Arctic, capable of both inhibiting growth and inducing loss (Gong et al., 2025; Hegyi and Taylor, 2018; Thaker et al., 2025; Zhang et al., 2023, 2025). For instance, during the 2016–2017 winter season, ARs contributed to a record-low sea ice extent and substantial thinning (Binder et al., 2017; Hegyi and Taylor, 2018). In 2012 and 2020, years characterised by extremely low summer sea ice extent, individual ARs drove rapid and substantial sea ice loss (Li et al., 2024). While Li et al. (2024) highlight the dominant role of turbulent heat fluxes and strong near-surface winds that promote sea ice advection and rapid retreat along the sea ice margins, other studies identify enhanced downwelling longwave radiation as a key driver of AR-induced sea ice decline (Cullather et al., 2016; Doyle et al., 2011; Graversen et al., 2011; Hegyi and Taylor, 2018).
ARs also exert substantial impacts on the Greenland Ice Sheet by modulating surface energy and mass balance through moisture transport, melt processes, and snowfall (Bonne et al., 2015; Box et al., 2022; Loeb et al., 2024; Neff, 2018). Anomalously high moisture transported by ARs has been linked to enhanced surface melting and substantial mass loss (Mattingly et al., 2018). Landfalling ARs can also trigger föhn winds that drive exceptional melt episodes and speed-ups of outlet glaciers, whereas heavy snowfall during some AR events can increase the surface mass balance (Mattingly et al., 2023; Neff, 2018). Collectively, these studies underscore the role of ARs as episodic but potent drivers of cryosphere disruption and Arctic climate variability (Mattingly et al., 2023).
A remarkable sequence of ARs occurred during 13–21 April 2020, during which two distinct ARs travelled along different pathways before intruding and merging in the central Arctic. One AR travelled from northwestern Russia, while the second propagated poleward from the northern Atlantic (Kirbus et al., 2023). These ARs coincided with the Multidisciplinary Drifting Observatory for the Study of Arctic Climate (MOSAiC) expedition (Nicolaus et al., 2022; Shupe et al., 2022) with both passing directly over the research vessel (RV) Polarstern, which thus provides unique in situ measurements. Rinke et al. (2021) showed that these two Arctic ARs led to exceptional atmospheric conditions at the location of the ship, including record-breaking high moisture on 16, 19 and 20 April relative to the climatology for those dates, as well as the lowest outgoing longwave radiation ever recorded on 20 April. In addition, a rapid 20 °C increase in surface warming resulted in record-breaking daily temperatures on 16 and 19 April.
Previous studies have examined this episode from different perspectives. Kirbus et al. (2023) examined the poleward latent energy transport across the Arctic Circle and investigated the cloud and moisture properties around RV Polarstern. Dada et al. (2022) focused on aerosol transport and transformations near the ship. Svensson et al. (2023) investigated warm-air intrusions using MOSAiC data with a focus on airmass transformation, vertical structure, and surface energy exchanges.
Given the significant impacts that these ARs exerted on the Arctic, a deeper understanding of their origins, pathways, and poleward moisture transport is essential. Moreover, key questions remain regarding how unusual the synoptic-scale drivers were that contributed to the extreme nature of the two ARs, how the ARs are linked to surface impacts and sea ice loss beyond the immediate MOSAiC site, and how they evolved thermodynamically along their pathways. Our study addresses this gap by combining Eulerian and Lagrangian perspectives to trace the AR airmass origins, transport pathways, and thermodynamic changes. This broader approach complements previous work and provides new insights into AR dynamics and impacts during an exceptional event.
We employ a number of different tools to study the two ARs that reached the Arctic in April 2020. The AR entering the Arctic from northwestern Russia is referred to as the Eurasian AR, while the AR originating from the North Atlantic is termed the Atlantic AR. We further define 15–21 April 2020 as the target period, representing the main phase of the event during which the two ARs influenced Arctic conditions, with both systems located within the Arctic Circle (north of 66.34° N) for the majority of this period.
2.1 ERA5 reanalysis data
We use the European Centre for Medium-range Weather Forecasts (ECMWF) fifth generation reanalysis data set ERA5 (Copernicus Climate Change Service, 2023; Hersbach et al., 2020) to analyse meteorological fields linked to the two Arctic ARs. ERA5 performs well in the Arctic, capturing the spatial and temporal variability of key variables such as temperature, wind speed, and specific humidity (Graham et al., 2019; Hersbach et al., 2020). Further, ERA5 effectively represents snowfall events at high latitudes and shows good agreement with independent in situ datasets in distinguishing between rainfall and snowfall, although uncertainties remain, particularly over ocean regions where observational data are sparse (Barrett et al., 2020; Cast et al., 2026; Xiong et al., 2022). For this study, daily mean sea level pressure (MSLP), 2 m surface temperature (T2m), precipitation, and rainfall data at 0.25° × 0.25° horizontal grid spacing are used. In line with the ERA5 variable definition, here, precipitation refers to the combined total of rain and snow. Anomalies are calculated as deviations from the April mean climatology for the period 1979–2023.
To assess how unusual the atmospheric conditions associated with the Arctic ARs were, we determine anomalies and accumulated values during the target period against reference distributions constructed using a 7 d moving window for April 1979–2023. The same general framework is applied to all variables, although the spatial aggregation differs depending on the variable.
For MSLP, we examine the persistent intensity of low- and high-pressure systems associated with the Arctic ARs at their respective locations. For this, we determine the 7 d mean MSLP anomaly field for the target period and define bounding boxes enclosing each weather system. For each box, we construct a reference distribution of 7 d mean MSLP anomalies for April 1979–2023. The percentile of the target period anomaly is then computed within this distribution.
A similar approach is applied to T2m to quantify the longer-lasting impact of the ARs on the surface temperature. 7 d mean T2m anomalies are determined for April 1979–2023 and spatially averaged over the region within the Arctic Circle (north of 66.34° N) where the ARs prevailed for at least 3 d. The T2m anomaly for the target period is identified within this reference distribution and the percentile is determined.
For precipitation, 7 d accumulated amounts are computed at each grid cell for April 1979–2023. The values for the target period are then compared against the corresponding local reference distributions to determine their percentiles.
2.2 Sea ice data
To derive sea ice extent and sea ice concentration (SIC) changes, we use the daily sea ice concentration product OSI-401-b produced by the EUMETSAT Ocean and Sea Ice Satellite Application Facility (OSI SAF) at a 10 km horizontal resolution (OSI SAF, 2017; Tonboe and Lavelle, 2016). The global SIC data is derived from atmospherically corrected passive microwave satellite (SSMIS) brightness temperatures over the polar regions using the OSI SAF algorithm. Sea ice extent is defined based on a 15 % threshold of SIC.
2.3 Observational data from MOSAiC
To investigate the local meteorological conditions around RV Polarstern associated with the two Arctic ARs, we analyse high-resolution in situ observations from the MOSAiC expedition, a year-long, icebreaker-based research mission that took place from September 2019 to October 2020 (Shupe et al., 2020). During this period, the RV Polarstern drifted with the sea ice across the central Arctic Ocean, providing an unprecedented opportunity to observe air–surface interactions in the high Arctic.
We use processed and quality-controlled Level 3 data with 10 min temporal resolution for T2m, 2 m specific humidity (Q2m), 10 m wind speed (WS10m) and surface energy balance (SEB) components aggregated to 6 h (Cox et al., 2023a). The SEB components include incoming (in) and outgoing (out) shortwave (SW) and longwave (LW) radiation, as well as latent heat (LH) and sensible heat (SH) fluxes. The SEB is computed as
so that SEB is positive when incoming exceed outgoing fluxes. These measurements were collected at the “Met City” observation site located on the sea ice near RV Polarstern, which was equipped with a 10 m micrometeorological tower, a 23–30 m telescoping mast, and a radiation station (Cox et al., 2023b).
In addition, we use precipitation measurements at 1 min time intervals from a vertically-pointing ka-band radar mounted on the ship, accumulated to 6-hourly data (Clemens-Sewall et al., 2025). Together, these observations provide a detailed view of the thermodynamic and radiative processes during the two AR intrusions into the central Arctic.
2.4 AR detection
To study the two Arctic ARs, we use the global AR database produced by Guan and Waliser (2024). This dataset (Guan, 2024) is based on version 4 of the Tracking Atmospheric Rivers Globally as Elongated Targets (tARget) algorithm applied to ERA5 reanalysis data for 1940–2023 at 6 h intervals and a horizontal grid spacing of 0.25° × 0.25°.
tARget identifies AR objects based on integrated water vapour transport (IVT), geometry requirements and direction of motion (Guan and Waliser, 2015, 2024). It employs a hybrid thresholding approach that combines a month- and location-dependent 85th percentile IVT threshold with a hemispherically fixed, month-dependent threshold derived from the area-weighted spatial 5th percentile for each hemisphere. This combination enhances AR detection in regions where IVT is climatologically low, such as the cold and/or dry Arctic. Additionally, the tARget algorithm is capable of tracking ARs through space and time following their life cycle using a Lagrangian framework, extracting key characteristics such as lifetime, travel distance and mean zonal and meridional IVT, all of which are included in the global AR database. As the two ARs merge over the central Arctic in the latter stages of their lifetimes, the tARget tracking algorithm identifies them as a single AR object for those time steps.
2.5 Lagrangian parcel tracking
To investigate the thermodynamic evolution of airmasses and the moisture uptake and loss associated with the two Arctic ARs, we use the Lagrangian Analysis Tool LAGRANTO v2.0 (Sprenger and Wernli, 2015). While tARget v4 (see Sect. 2.4) includes Lagrangian feature tracking, it is limited to tracking the displacement of ARs over time, i.e. the propagation of a coherent pattern, which may move at a different speed and direction than the underlying airflow. LAGRANTO v2.0, by contrast, conducts air parcel tracking, computing full 3-D kinematic trajectories of individual air parcels that are essential for assessing sources and sinks of heat and moisture. Parcels are initialised at 80 hPa vertical intervals between 1000 and 200 hPa on an equidistant 100 km grid within the AR boundaries defined by the global AR database (Guan and Waliser, 2024). Parcels are released every 6 h for the period 13–21 April 2020 and tracked backward in time for 9 d. The trajectory calculations use the 3-D wind field and pressure retrieved from hourly ERA5 reanalysis data with a horizontal grid spacing of 0.5° × 0.5°. Along each trajectory, temperature, pressure (p), and specific humidity (Q) are traced. Additionally, potential temperature (θ) and temporal changes of pressure () and specific humidity () are computed to identify vertical motion and moisture exchange processes.
To identify the parcel trajectories relevant to extreme Arctic precipitation associated with the two ARs, we retain only those with endpoints within the Arctic Circle along the Greenland coast and in the central Arctic, where 7 d accumulated precipitation exceeds the 90th percentile (white stippling in Fig. 5b). Hereafter, we refer to a trajectory endpoint as the final location of an air parcel, from where the parcel is traced backward in time. As only the Atlantic AR contributes to precipitation along the Greenland coast, we perform separate analyses for the respective two regions. Instead of keeping a uniform trajectory length of 9 d across all parcel trajectories, the trajectory length is optimised for each region to best capture the thermodynamic evolution of air parcels most closely associated with ARs, accounting for both AR lifetime and the temporal variability of key thermodynamic parameters. Sensitivity analyses confirm that the results remain qualitatively consistent for trajectory lengths within the typical range of 5–9 d (not shown).
Following Binder et al. (2017), we identify the maximum difference in temperature (ΔT) and potential temperature (Δθ) along each trajectory relative to their endpoint values, effectively grouping the parcels into four subcategories. This approach provides insight into the adiabatic and diabatic processes experienced by the air parcels: trajectories with positive (negative) ΔT indicate a net temperature increase (decrease), while those with positive (negative) Δθ primarily reflect diabatic heating (cooling). This classification thus distinguishes airstreams with distinct thermodynamic characteristics.
3.1 Synoptic drivers of the Eurasian and Atlantic ARs
Figure 1 shows that the Eurasian and Atlantic ARs, each steered by a cyclone–anticyclone couplet, follow distinct pathways before merging in the central Arctic. Both ARs reach RV Polarstern within a few days of one another. The first AR, the Eurasian AR, advances into Arctic Circle on 13 April 2020 after travelling across Europe and Scandinavia, defining what we term the Eurasian pathway. It is steered by a quasi-stationary anticyclone over Siberia, located east of the AR, which deepens between 16 and 18 April. On the western flank of the AR, the associated cyclone lies over Scandinavia on 13–14 April. It then strengthens and shifts eastward by 16 April, displacing the AR further east. The second AR, the Atlantic AR, propagates northward over the Atlantic Ocean and reaches the Arctic Circle 3 d after the Eurasian AR on 16 April. The associated quasi-stationary cyclone develops over Baffin Bay west of Greenland, a region where cyclones frequently become occluded and slow-moving (Bintanja and Selten, 2014; Loeb et al., 2024). Together with a persistent anticyclone over the UK, the cyclone-anticyclone couplet steers the Atlantic AR towards south-eastern Greenland on 16–17 April. This coincides with the region of Greenland with the highest frequency of landfalling ARs (Waling et al., 2024). The cyclone undergoes rapid deepening and expands on 17 April while the anticyclone strengthens over Scandinavia, steering the AR further through the Fram Strait into the central Arctic. After the two ARs merge in the central Arctic on 19 April, AR airmasses persist until 21 April, sustained by anomalous low pressure north and north-west of Greenland and by two anticyclones, one over central-eastern Siberia and the other over Scandinavia.
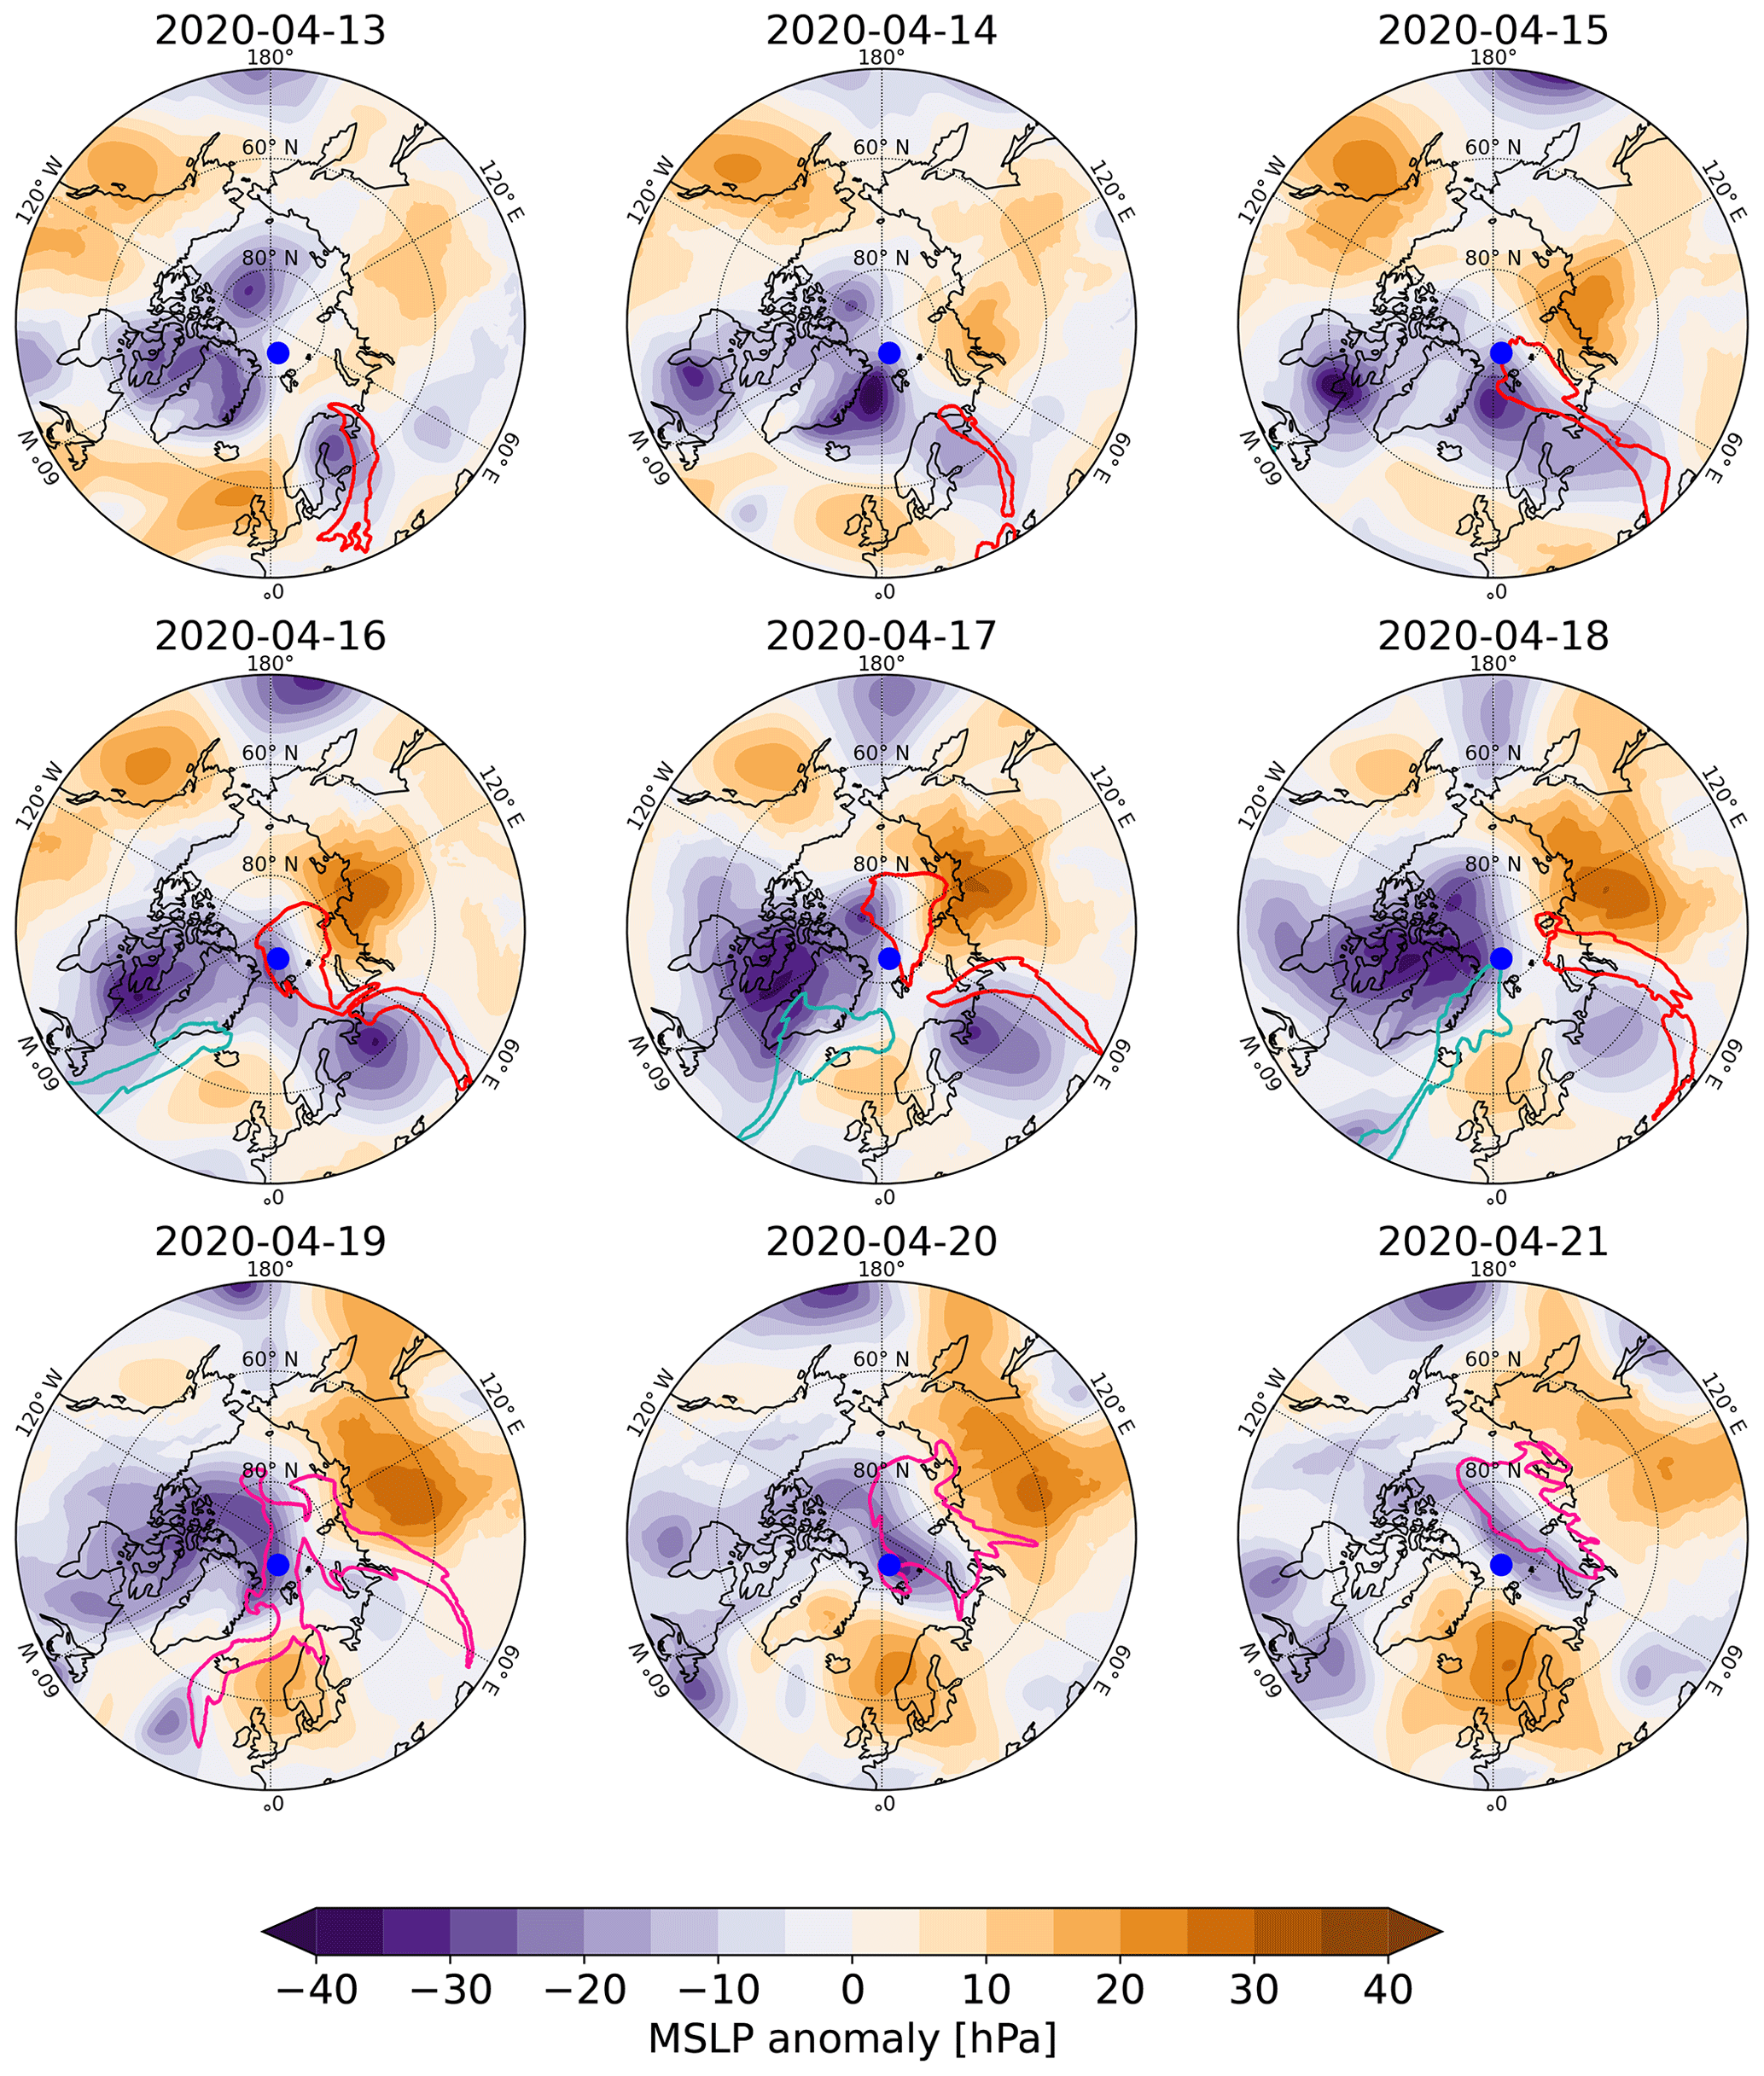
Figure 1Synoptic conditions based on ERA5. Daily MSLP anomalies relative to the April climatology (shading) are shown for 13–21 April 2020. Red (teal) contours outline the shapes of the Eurasian (Atlantic) AR at 12:00 UTC of the respective days diagnosed from the tARget database. After the ARs merge, the contours are shown in pink. The position of RV Polarstern is indicated by the blue dot.
To further investigate how unusual the persistent large-scale weather systems were that steered the Atlantic and Eurasian ARs into the Arctic, the 7 d averaged MSLP anomaly for the target period is computed. Figure 2a reveals a wave train of alternating high- and low-pressure systems across the mid- to high latitudes. This pattern features a deep cyclone over Baffin Bay, an anticyclone over the northeastern Atlantic, a cyclone over western Russia, and a pronounced anticyclone over northern Siberia, with each cyclone-anticyclone couplet steering one of the two ARs poleward. The cyclone centred over Baffin Bay (blue box) exhibits an exceptional 7 d mean anomaly of −18.3 hPa, placing it in the lowest 0.3 % of the climatological distribution for 1979–2023 over the same region (Fig. 2b), highlighting the rarity of such a persistent and strong negative MSLP anomaly over Baffin Bay. The accompanying anticyclone over the northern Atlantic is characterised by a 7 d mean anomaly of 6.6 hPa, corresponding to the upper 86.1 % of its distribution (not shown). This circulation pattern is consistent with the cyclone-dominant regime identified by Ma et al. (2024b). Meanwhile, the cyclone centred over western Russia forming part of the cyclone-anticyclone couplet associated with the Eurasian AR, is characterised by a 7 d mean of −7 hPa, placing it at the lower 11.6 % of its distribution (not shown). The anticyclone over northern Siberia (red box), in contrast, is highly anomalous with a 7 d mean anomaly of 15.6 hPa placing it in the upper 99.5 % of the distribution (Fig. 2c). The corresponding distribution is non-Gaussian, with a bell-shaped core from −10 to +10 hPa and a pronounced heavy tail toward positive values. The cyclone–anticyclone couplet corresponds to the anticyclone-dominated regime, which was the most common, accounting for approximately 40 % of the events analysed by Ma et al. (2024b) and linked to the strongest and most spatially extensive surface warming anomalies. Further analysis suggests that the extreme regional MSLP anomalies shown in Fig. 2 involve an upper-level wave train near the tropopause that is likely coupled with surface cyclogenesis. See Appendix A for additional information.
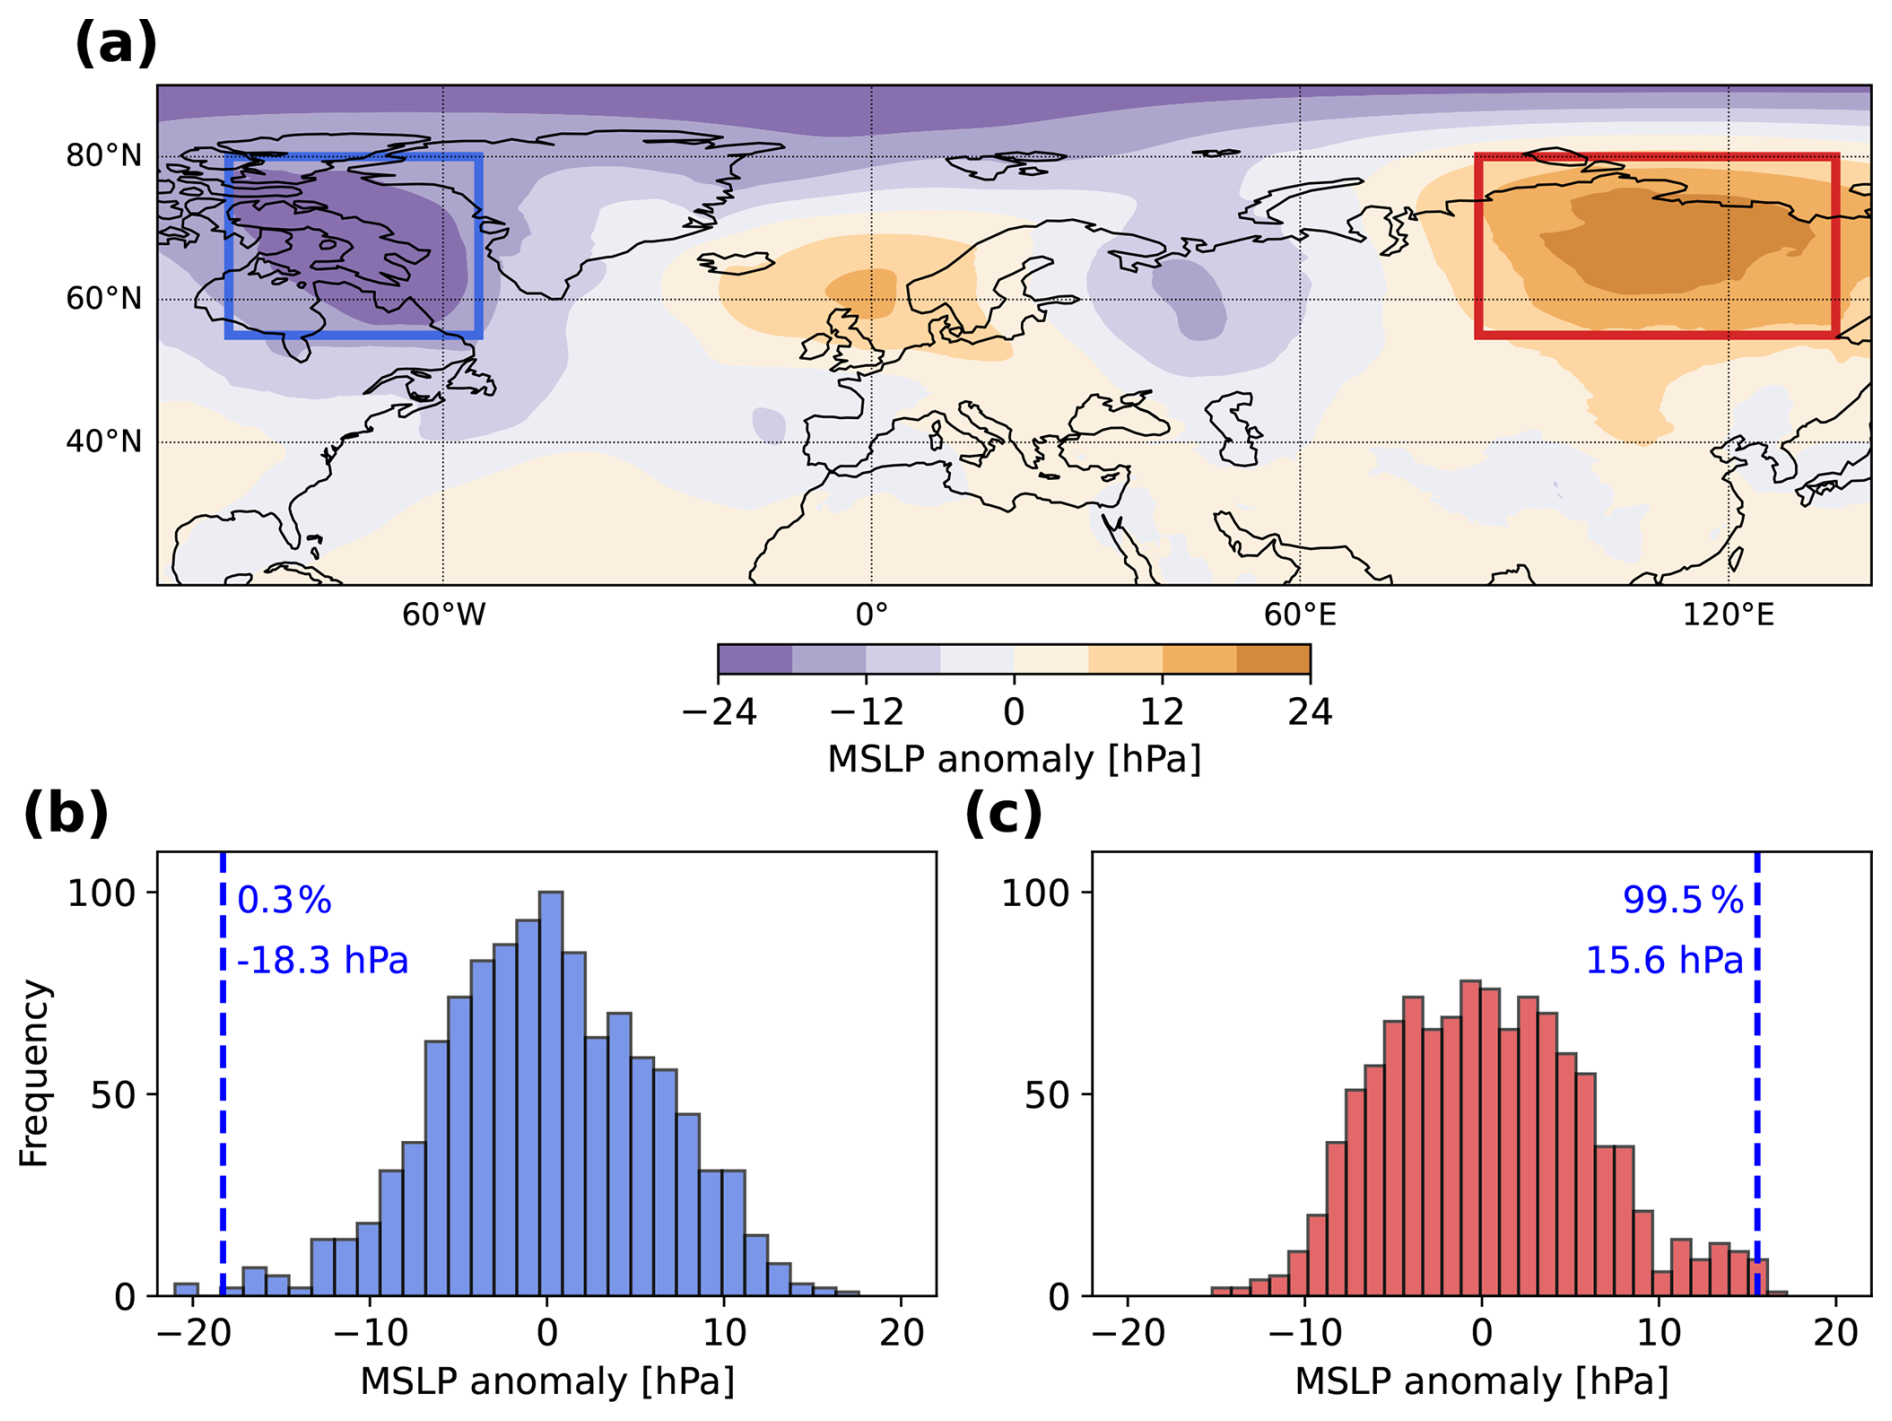
Figure 2Assessing the extreme nature of the synoptic weather systems driving the Atlantic and Eurasian ARs based on ERA5. (a) 7 d mean MSLP anomalies for 15–21 April 2020 relative to the April climatology. The extratropical cyclone west of Greenland is enclosed by a blue box (55–90° W and 55–80° N) while the anticyclone over northern Siberia is marked by a red box (85–135° E and 55–80° N). (b) Distribution of 7 d mean MSLP anomalies spatially averaged over the blue box in panel (a) for April 1979–2023. The anomaly of the target period is indicated by a blue vertical line, annotated with the percentile and mean anomaly. (c) As panel (b) but for the region enclosed by the red box in panel (a).
3.2 MOSAiC in situ observations
Next, we examine the impact of the Eurasian and Atlantic ARs on surface conditions near RV Polarstern (Fig. 3). The approach of the Eurasian AR is marked by a stark rise in T2m (Fig. 3a), increasing from about −30 °C on 13 April to just below 0 °C on 16 April. This warming is accompanied by higher WS10m (Fig. 3b), a pronounced increase of roughly 3 g kg−1 in Q2m (Fig. 3c), and a steady increase in SEB (Fig. 3d) from negative to positive values. Positive SEB values persist for about 2 d, indicating a net transfer of energy from the atmosphere to the surface and suggesting surface melt. Consistent with previous studies (e.g., Cullather et al., 2016), the increase in SEB under AR conditions is primarily driven by enhanced net longwave radiation, while turbulent fluxes play a comparatively minor role (Fig. 3f). Together with a reduced amplitude of the diurnal cycle of net shortwave radiation, the enhanced net longwave radiation suggests an increase in cloud cover. Notably, the rise in T2m, WS10m, Q2m, and SEB begins 1–2 d prior to the AR reaching the MOSAiC site, indicating that the airmasses associated with the AR were gradually influencing surface conditions before its core arrival. A spike in total precipitation occurs while the Eurasian AR remains above the ship on 16 April (Fig. 3e), followed by a sharp decline in Q2m due to the removal of atmospheric moisture through precipitation, and accompanied by a marked decrease in SEB. By 17 April, both, Q2m and SEB, return to values similar to those before the AR event, suggesting a transition to clear-sky conditions. WS10m decreases to about 5 m s−1 while T2m drops rapidly by about 15 °C between 16 and 17 April, yet remaining well above pre-Eurasian AR temperatures.
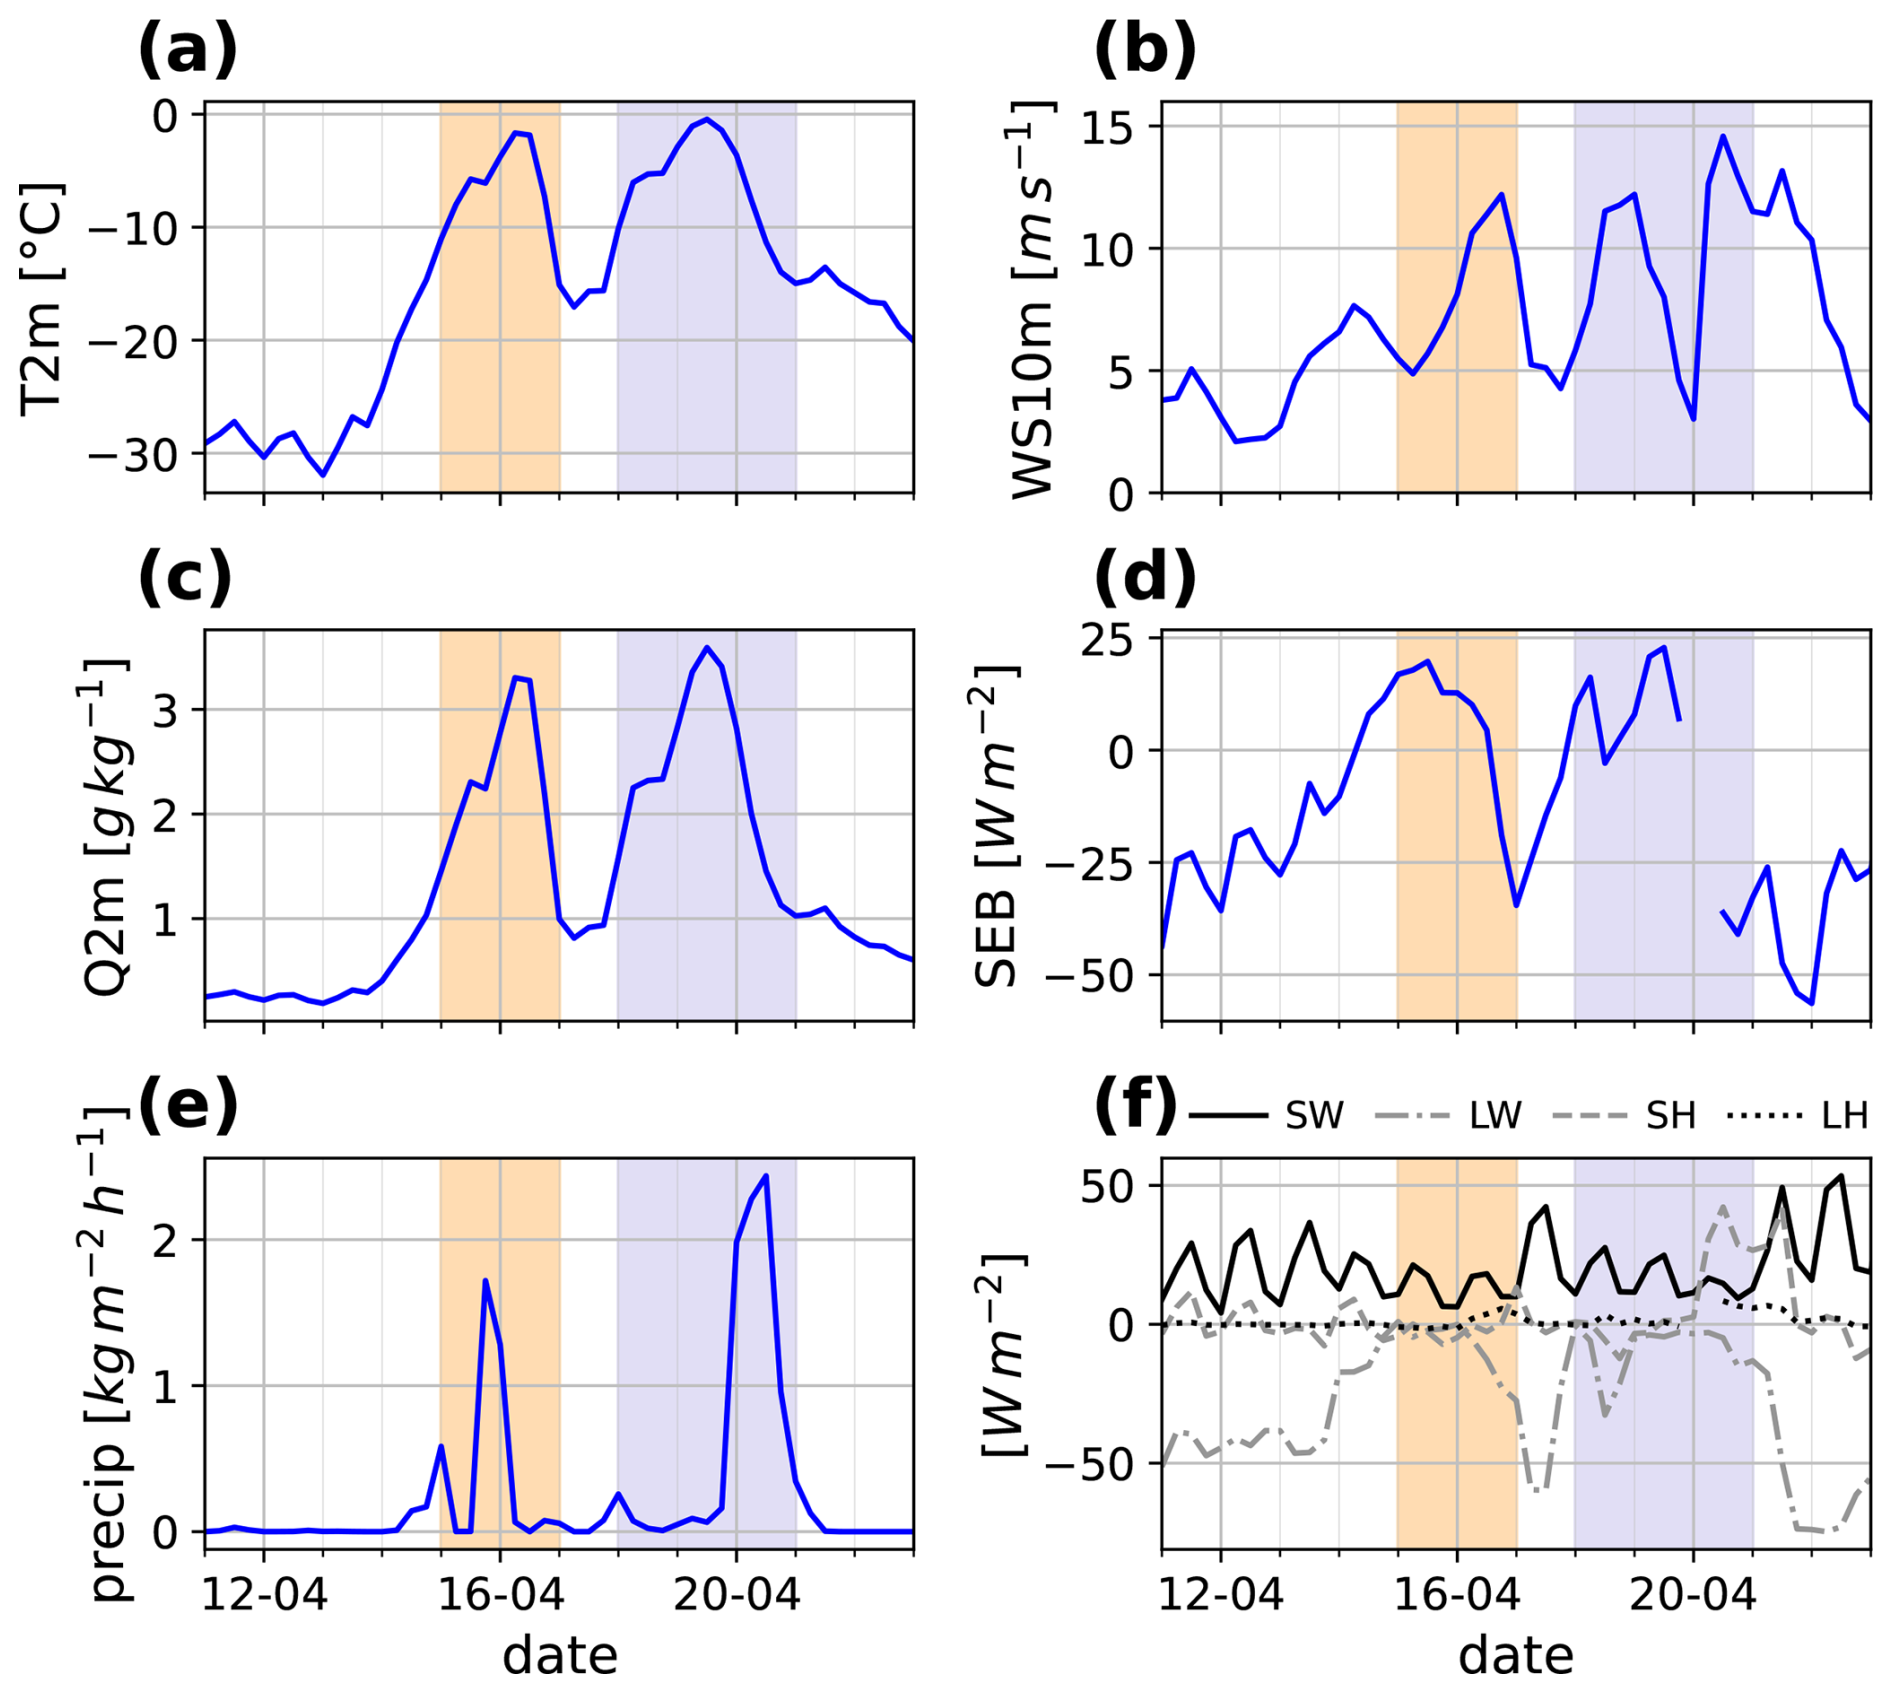
Figure 3MOSAiC in situ observations taken at RV Polarstern for 11–23 April 2020. Shown are time series of (a) T2m, (b) WS10m, (c) Q2m, (d) SEB, (e) total precipitation, and (f) individual SEB components including radiative and turbulent surface fluxes. SW (LW) denotes the net shortwave (longwave) flux, defined as the difference between incoming and outgoing radiation. Shaded areas indicate periods when the Eurasian AR (orange) and the Atlantic AR (purple) were located over the research vessel.
The Atlantic AR reaches RV Polarstern on 18 April, marking the onset of a rise in T2m (Fig. 3a) and Q2m (Fig. 3c). Both peak at higher values than during the Eurasian AR, with T2m slightly surpassing 0 °C. The arrival of the Atlantic AR is also accompanied by strong WS10m (Fig. 3b) and a marked increase in SEB to high positive values (Fig. 3d), reflecting enhanced energy influx to the surface. Between 19 and 21 April, precipitation (Fig. 3e) reaches amounts approximately 1.5 times greater than during the Eurasian AR, coinciding with data gaps in SEB. Analysis of the individual SEB components (Fig. 3f) shows that the increase in SEB is primarily driven by enhanced longwave radiation directed towards the surface, likely associated with increased cloud cover, whereas turbulent fluxes contribute only marginally. As during the Eurasian AR, reduced net shortwave radiation is observed. From 20 April, sensible heat flux increases over a 2 d period, due to an enhanced surface-to-air temperature gradient, increased wind speeds, or a combination of both. After the retreat of the Atlantic AR, Q2m and SEB return to levels similar to those before the Eurasian AR. T2m decreases gradually to around −20 °C but does not decrease to pre-AR temperatures, marking the transition from winter to spring (Svensson et al., 2023).
3.3 Impact on surface temperature, precipitation and sea ice
Having analysed the synoptic-scale context of the two ARs and their impacts on surface conditions around RV Polarstern, we examine how the two ARs impacted T2m, precipitation and sea ice extent in the wider Arctic. Strong positive T2m anomalies averaged over the target period 15–21 April 2020 are shown in Fig. 4a with anomalies exceeding 6 °C located over Greenland, central Siberia and the central Arctic. Further, widespread positive T2m anomalies of 3–9 °C dominate central Eurasia, encompassing parts of Siberia, southern Russia, and extending southward to the Caspian Sea. These coincide with an exceptionally intense and persistent heat wave in Siberia from January to June 2020 (Gloege et al., 2022; Overland and Wang, 2021). The positive T2m anomalies along the Eurasian pathway (see Fig. 1) align with previous findings indicating that the Eurasian AR was associated with the transport of considerable heat into higher latitudes (Dada et al., 2022; Kirbus et al., 2023). The area where the two ARs prevailed for at least 3 d within the Arctic Circle coincides with strong T2m anomalies exceeding 6–9 °C. Such strong 7 d mean T2m anomalies are extremely unusual for the region, placing them in the upper 98.6 % of the climatological distribution (Fig. 4b). Consistent with this, the corresponding absolute 7 d mean T2m value averaged over the same region reaches −8.53 °C, which is also exceptionally high relative to the April distribution, exceeding two standard deviations above the climatological mean (−17.2 °C) (not shown).
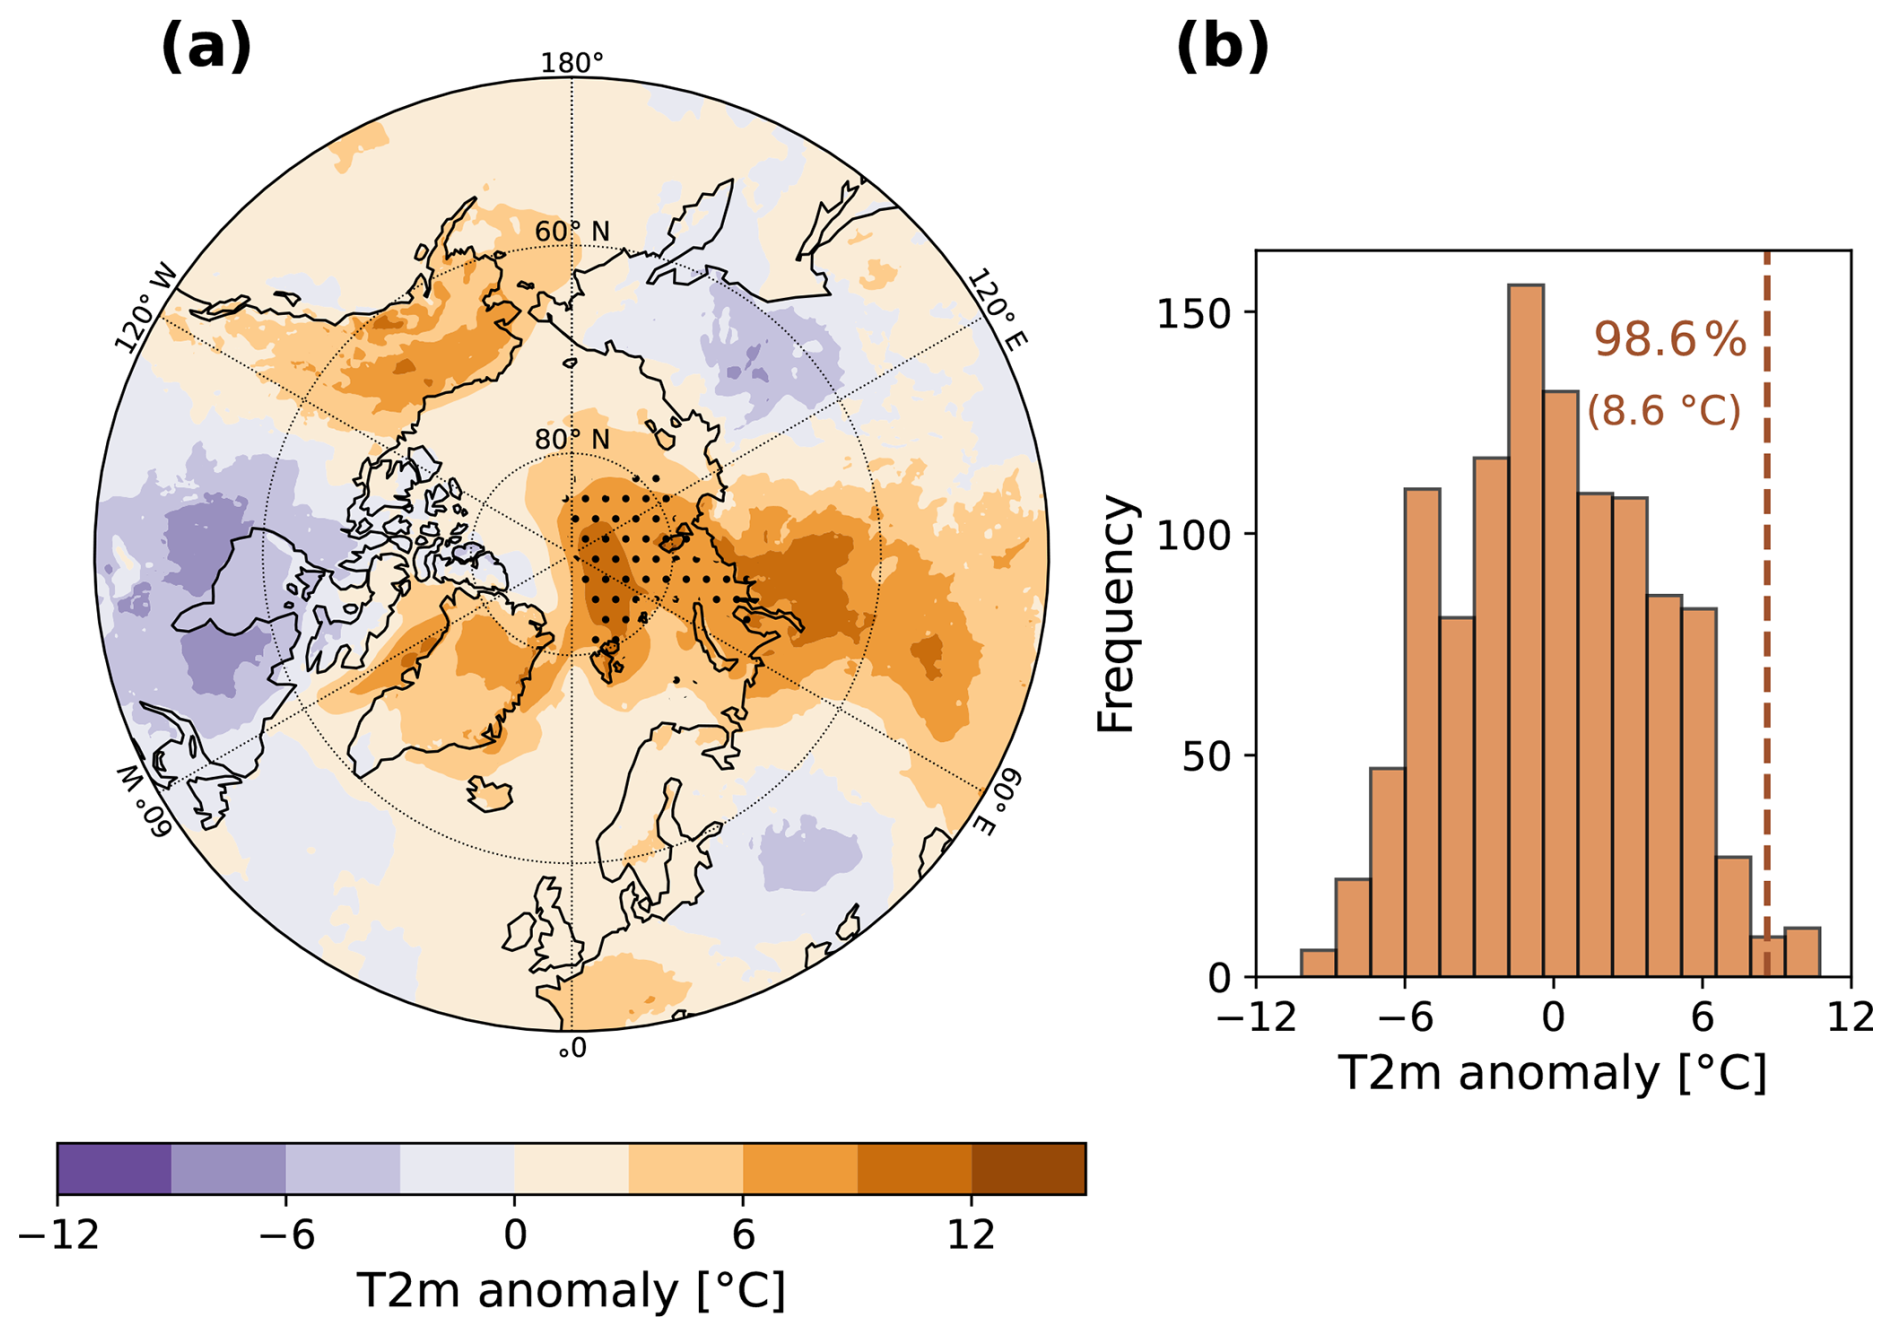
Figure 4Impact of the Eurasian and Atlantic ARs on surface temperature based on ERA5 data. (a) 7 d averaged T2m anomalies for the target period 15–21 April 2020. Stippling highlights areas within the Arctic Circle where AR conditions persisted for at least 3 d. (b) Distribution of 7 d mean T2m anomalies averaged over the stippling region in panel (a) for April 1979–2023. The anomaly for the target period is indicated by a vertical line, with the corresponding magnitude and percentile annotated.
Figure 5a shows that precipitation is particularly enhanced along the southeastern coast of Greenland, when accumulated over the target period, highlighting the key role of orographic uplift from the steep topography of Greenland in driving extreme precipitation events. In contrast, precipitation over the central Arctic remains relatively low compared to lower latitudes. When expressed as percentiles relative to the climatological distribution at each grid point (Fig. 5b), however, precipitation across the central Arctic is highly unusual, exceeding the 90th percentile and coinciding with areas where ARs persisted for at least 3 d (Fig. 4a). Precipitation along the southeastern Greenland coast is also highly anomalous relative to its climatology. These two regions correspond to the pathways of the two ARs (see Fig. 1), emphasizing the ARs' key role in delivering extreme, highly anomalous precipitation. Based on their respective pathways, the Atlantic AR primarily accounts for the extreme precipitation along the Greenland coast, while both ARs contribute to the exceptionally unusual precipitation over the central Arctic. Further, to assess the impact of both ARs on sea ice, the difference in SIC before and after the event is shown in Fig. 5c. A clear retreat of the sea ice edge is evident along the southeastern Greenland coast and in the Barents-Kara Sea, while an increase in SIC is observed in the Greenland Sea north of Iceland.
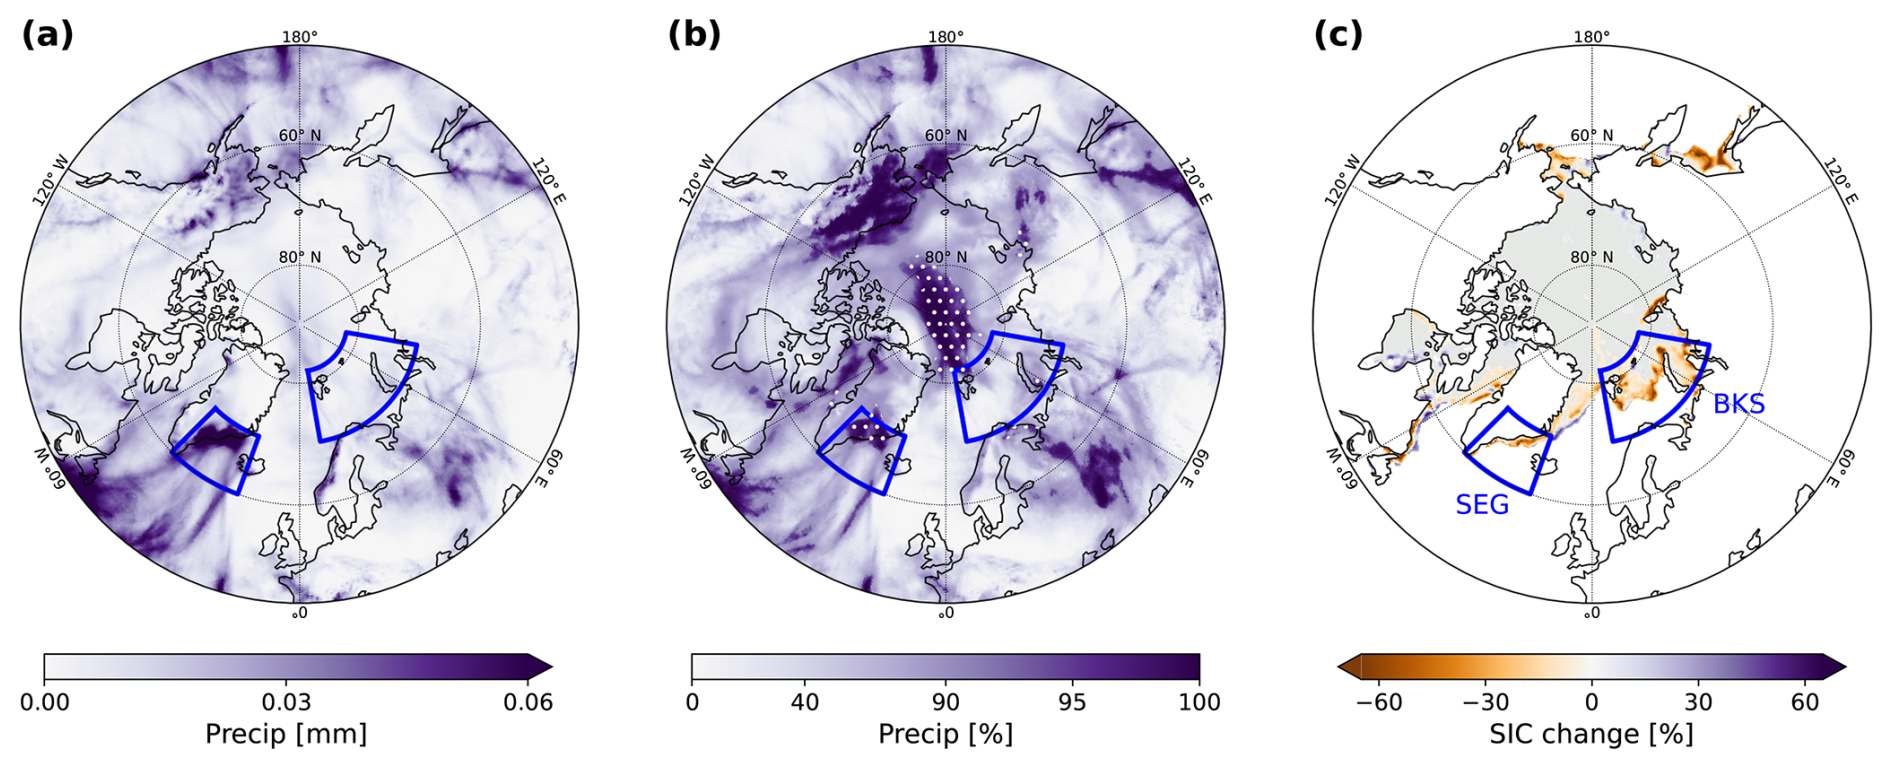
Figure 5Impact of the Eurasian and Atlantic ARs on precipitation and sea ice extent in the Arctic. (a) Precipitation accumulated over the 7 d target period. (b) Percentiles of accumulated precipitation for the target period relative to the April distribution 1979–2023 based on ERA5. A non-linear normalisation centred on the 90th percentile is used to highlight regions of extreme precipitation. Stippling shows areas within the Arctic Circle where ARs coincide with precipitation ≥ 90th percentile. (c) Changes in SIC in the Arctic Ocean between 12 April (before the AR event) and 22 April (after the event) using EUMETSAT OSI SAF OSI-401-b data; grey shading shows sea ice extent. Blue boxes mark the SEG and BKS regions.
To unravel how T2m, precipitation, rainfall and sea ice retreat are interconnected while being impacted by ARs, two boxes are defined along the sea ice edge to capture negative SIC changes (Fig. 5b). One box is defined over south-east Greenland (SEG, 20–45° W, 60–70° N) and the other over the Barents-Kara Sea (BKS, 10–80° E, 70–82° N); both lie on the pathway of the two ARs. Further, the SEG region encompasses the area along the Greenland coast where highly anomalous precipitation is observed (Fig. 5a), whereas BKS experiences strong and widespread positive T2m anomalies of 6–9 °C (Fig. 4a).
Area-averaged time series of T2m, precipitation, rainfall, and SIC are shown in Fig. 6 for the SEG and BKS regions. Over SEG, T2m undergoes a steady increase throughout April 2020, rising from around −10 °C to slightly above 0 °C by 17 April (Fig. 6a). SIC gradually decreases and remains anomalously low throughout the month, falling below the ±1 SD range of the April 2005–2025 climatology (not shown). Intermittent and well-defined precipitation events are recorded in SEG with daily totals exceeding 10 mm d−1 (Fig. 6c). In early April, rainfall remains low, whereas later a mix of rain and snow occurs. During the ARs, precipitation rates exceed 10 mm d−1 while rainfall surpasses 4 mm d−1. The time series further reveal that notable precipitation and rainfall events occur outside the period when the ARs are located over SEG, coinciding with other Arctic ARs passing over the region on 5–6, 12–13, and 21–22 April (not shown). A strong negative correlation is present between SIC and T2m (r = −0.69), suggesting that SIC decreases in SEG are closely linked to warmer T2m, whereas no correlation is found between SIC and precipitation (rprecip = 0.05) and between SIC and rainfall (rrain = −0.08).
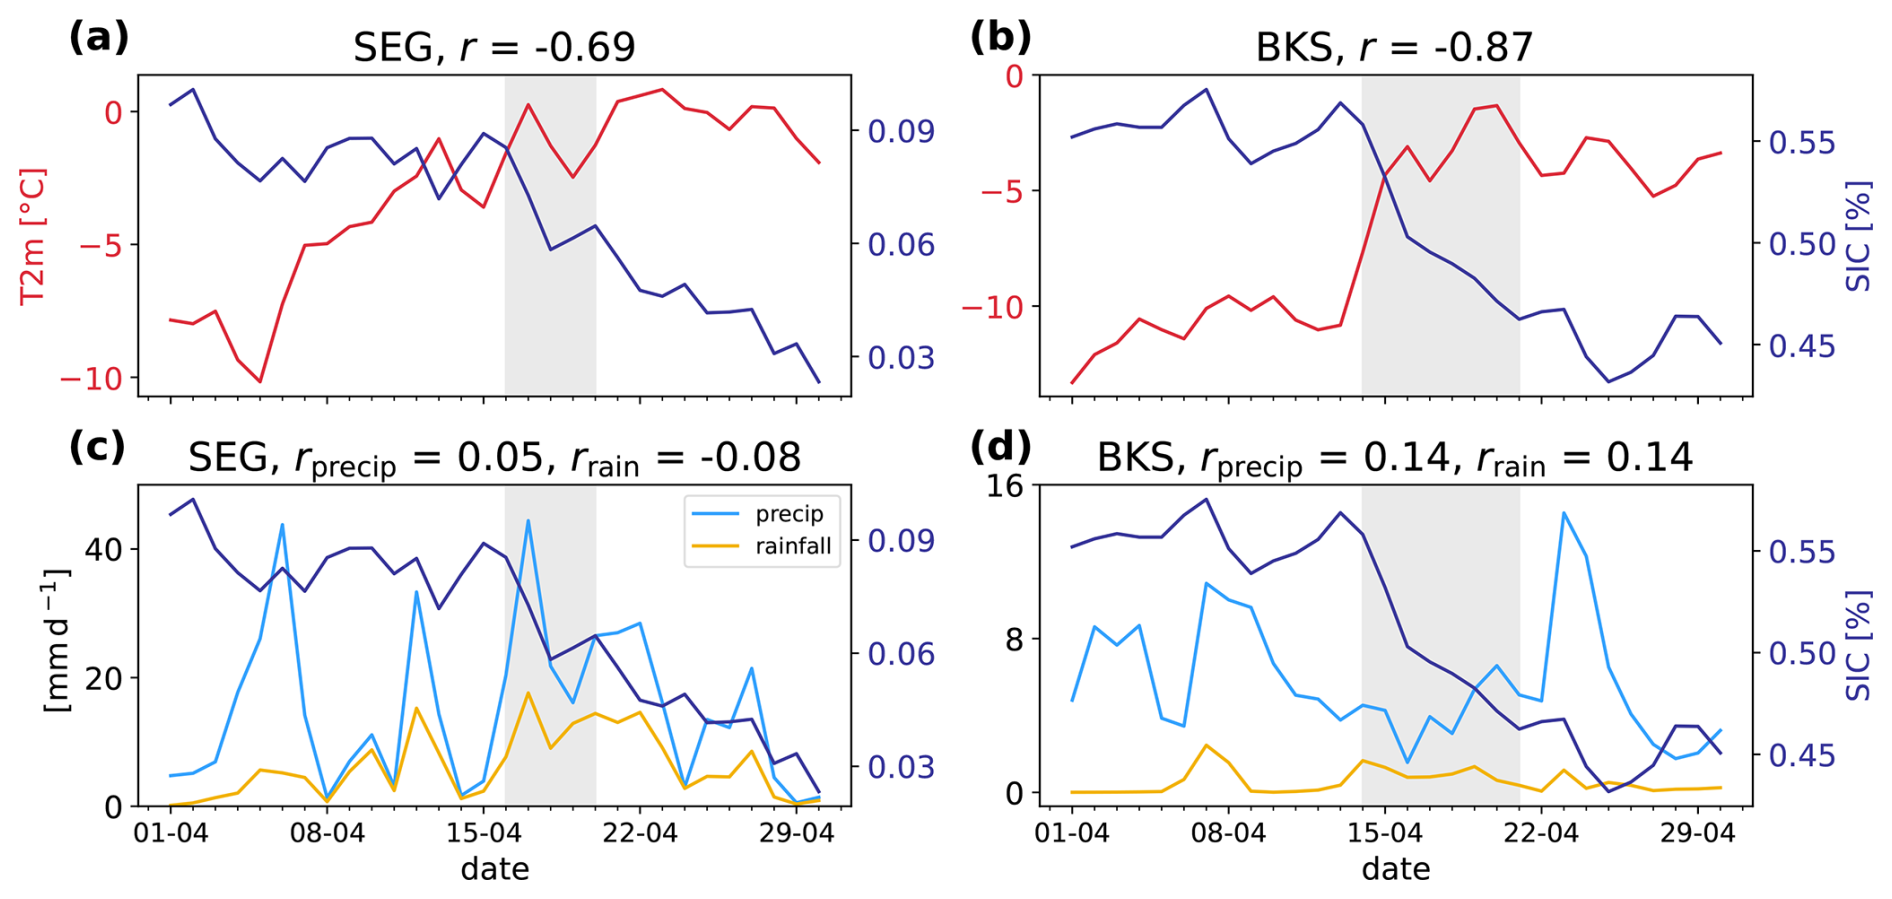
Figure 6Relation between surface variables and SIC over SEG and BKS based on ERA5 and OSI SAF data for April 2020. (a) Time series of T2m (red) and SIC (blue) averaged over the SEG region. Grey shading indicates the period during which at least one AR is located over the region. The Pearson correlation coefficient between the two time series is shown in the panel title. (b) is as in panel (a), but for the BKS region. (c, d) As in panels (a) and (b) but for SIC, total precipitation (light blue) and rainfall (orange). Here, rprecip represents the correlation coefficient between precipitation and SIC in the respective region, while rrain denotes the correlation coefficient between rainfall and SIC.
Over BKS, SIC declines throughout April 2020 (Fig. 6b). While SIC is above the climatological mean in early April, a rapid and exceptional decline is observed during the AR period compared to the typical cycle (not shown). T2m, in contrast, exhibits a sharp increase from −10 °C on 12 April, prior to the AR arrival, to values just below 0 °C by 18 April. After the AR retreat, T2m drops again to −5 °C, possibly due to clear-sky conditions and enhanced radiative cooling. Rainfall in BKS remains generally low (Fig. 6d) due to persistent sub-zero temperatures, although intermittent rainfall events do occur. Following the AR retreat, precipitation increases substantially. A strong negative correlation between T2m and SIC (r = −0.87) indicates that SIC decline over BKS is closely tied to surface warming, while no correlation was found between SIC and either total precipitation or rainfall.
3.4 Thermodynamic evolution of AR parcels associated with extreme precipitation
Having examined the drivers and surface impacts of the two ARs from a Eulerian point of view, this section uses a Lagrangian framework to analyse the spatial and thermodynamic evolution of airmasses and the moisture uptake and loss along the Eurasian and Atlantic pathways. We start by analysing 5 d backward trajectories with endpoints within the Arctic Circle where precipitation exceeds the 90th percentile along the Greenland coast (see white stippling in Fig. 5b). The same analysis is then repeated for trajectories with endpoints in the central Arctic, where highly anomalous precipitation (≥ 90th percentile) is observed during the two ARs.
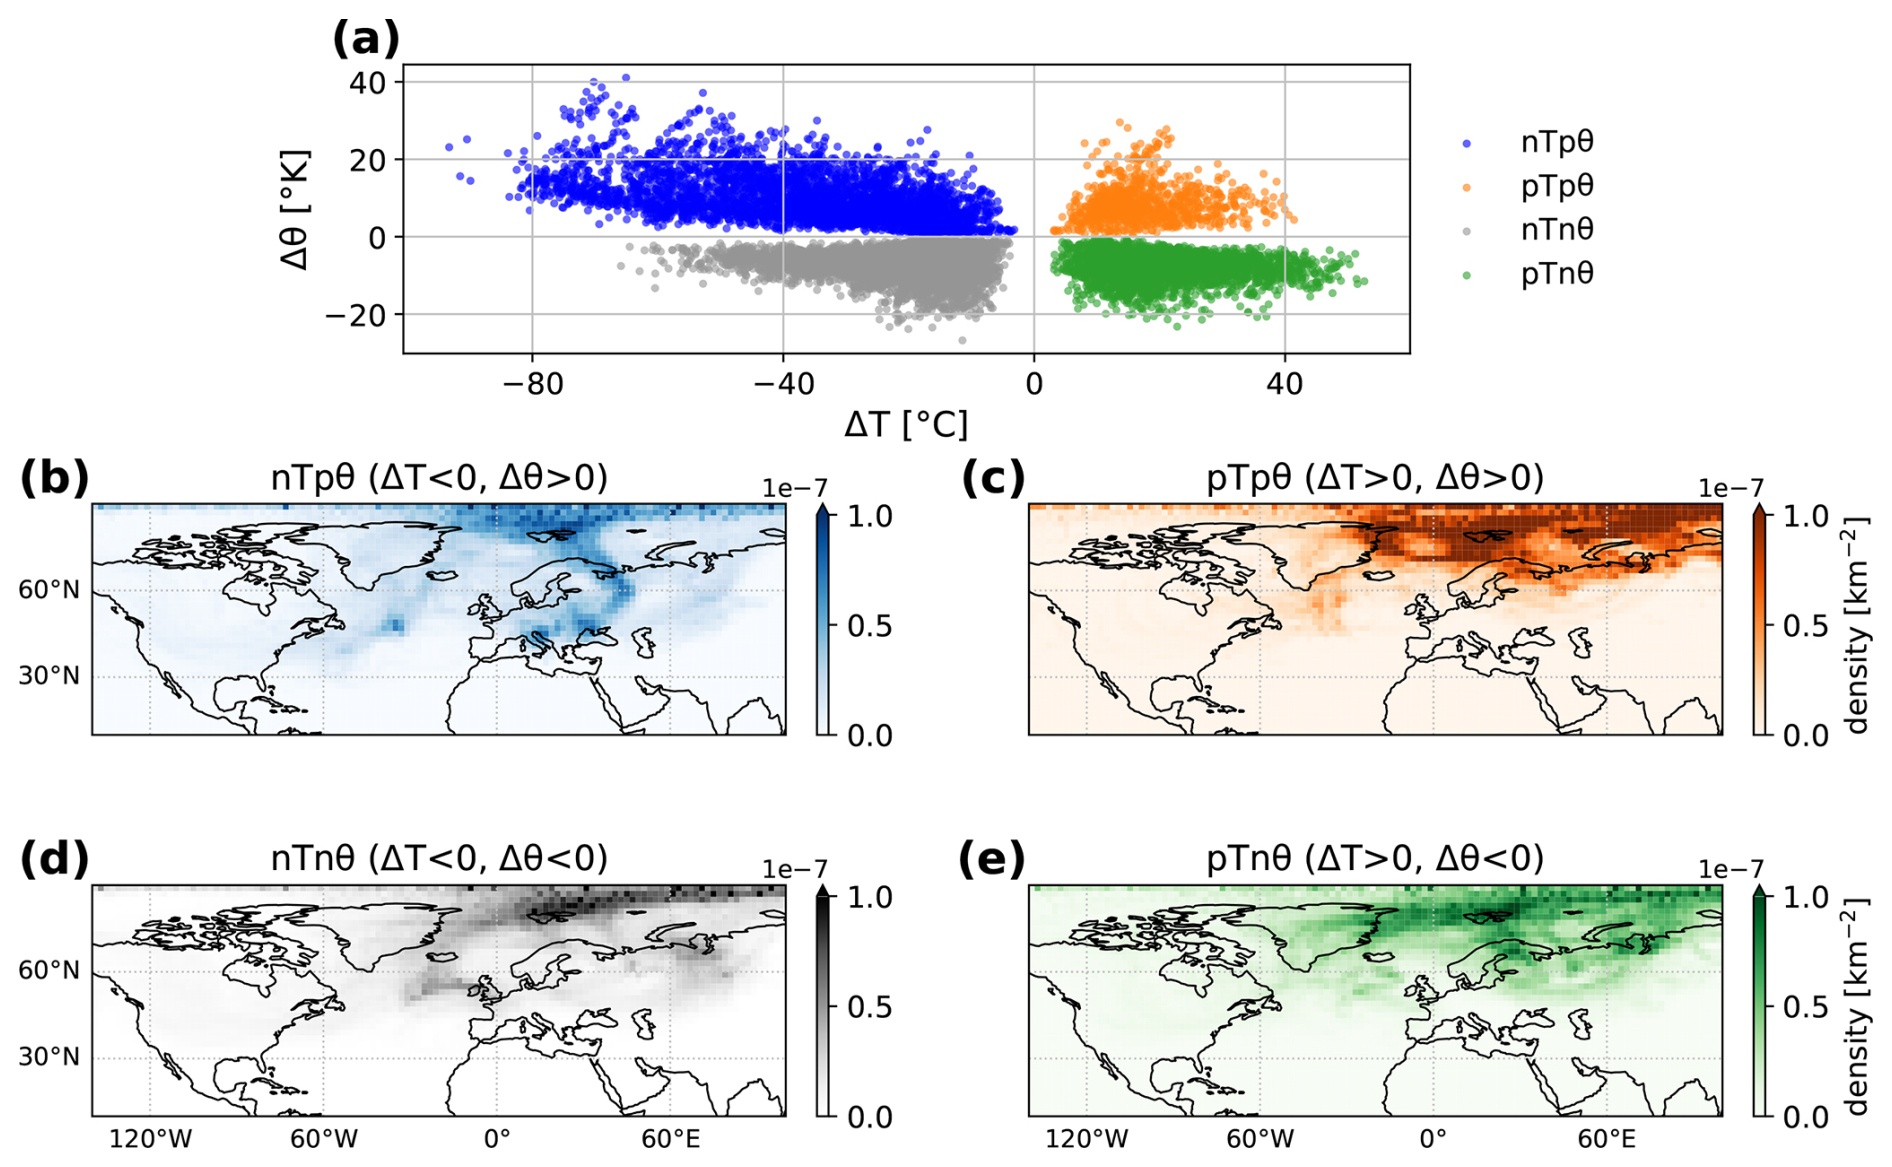
Figure 7a shows the scatter plot of the maximum differences in temperature (ΔT) and potential temperature (Δθ) relative to their trajectory endpoints, grouping the trajectories into four distinct groups. Positive (negative) ΔT indicate a net temperature increase (decrease), while positive (negative) Δθ reflect diabatic heating (cooling). The nTpθ group (blue, 46.4 % of trajectories) experiences cooling, together with diabatic heating. The pTpθ group (orange, 5.3 %) undergoes both warming and diabatic heating, while the nTnθ group (grey, 32.4 %) shows a net decrease in temperature and diabatic cooling. Finally, the pTnθ group (green, 15.9 %) exhibits warming coupled with diabatic cooling.
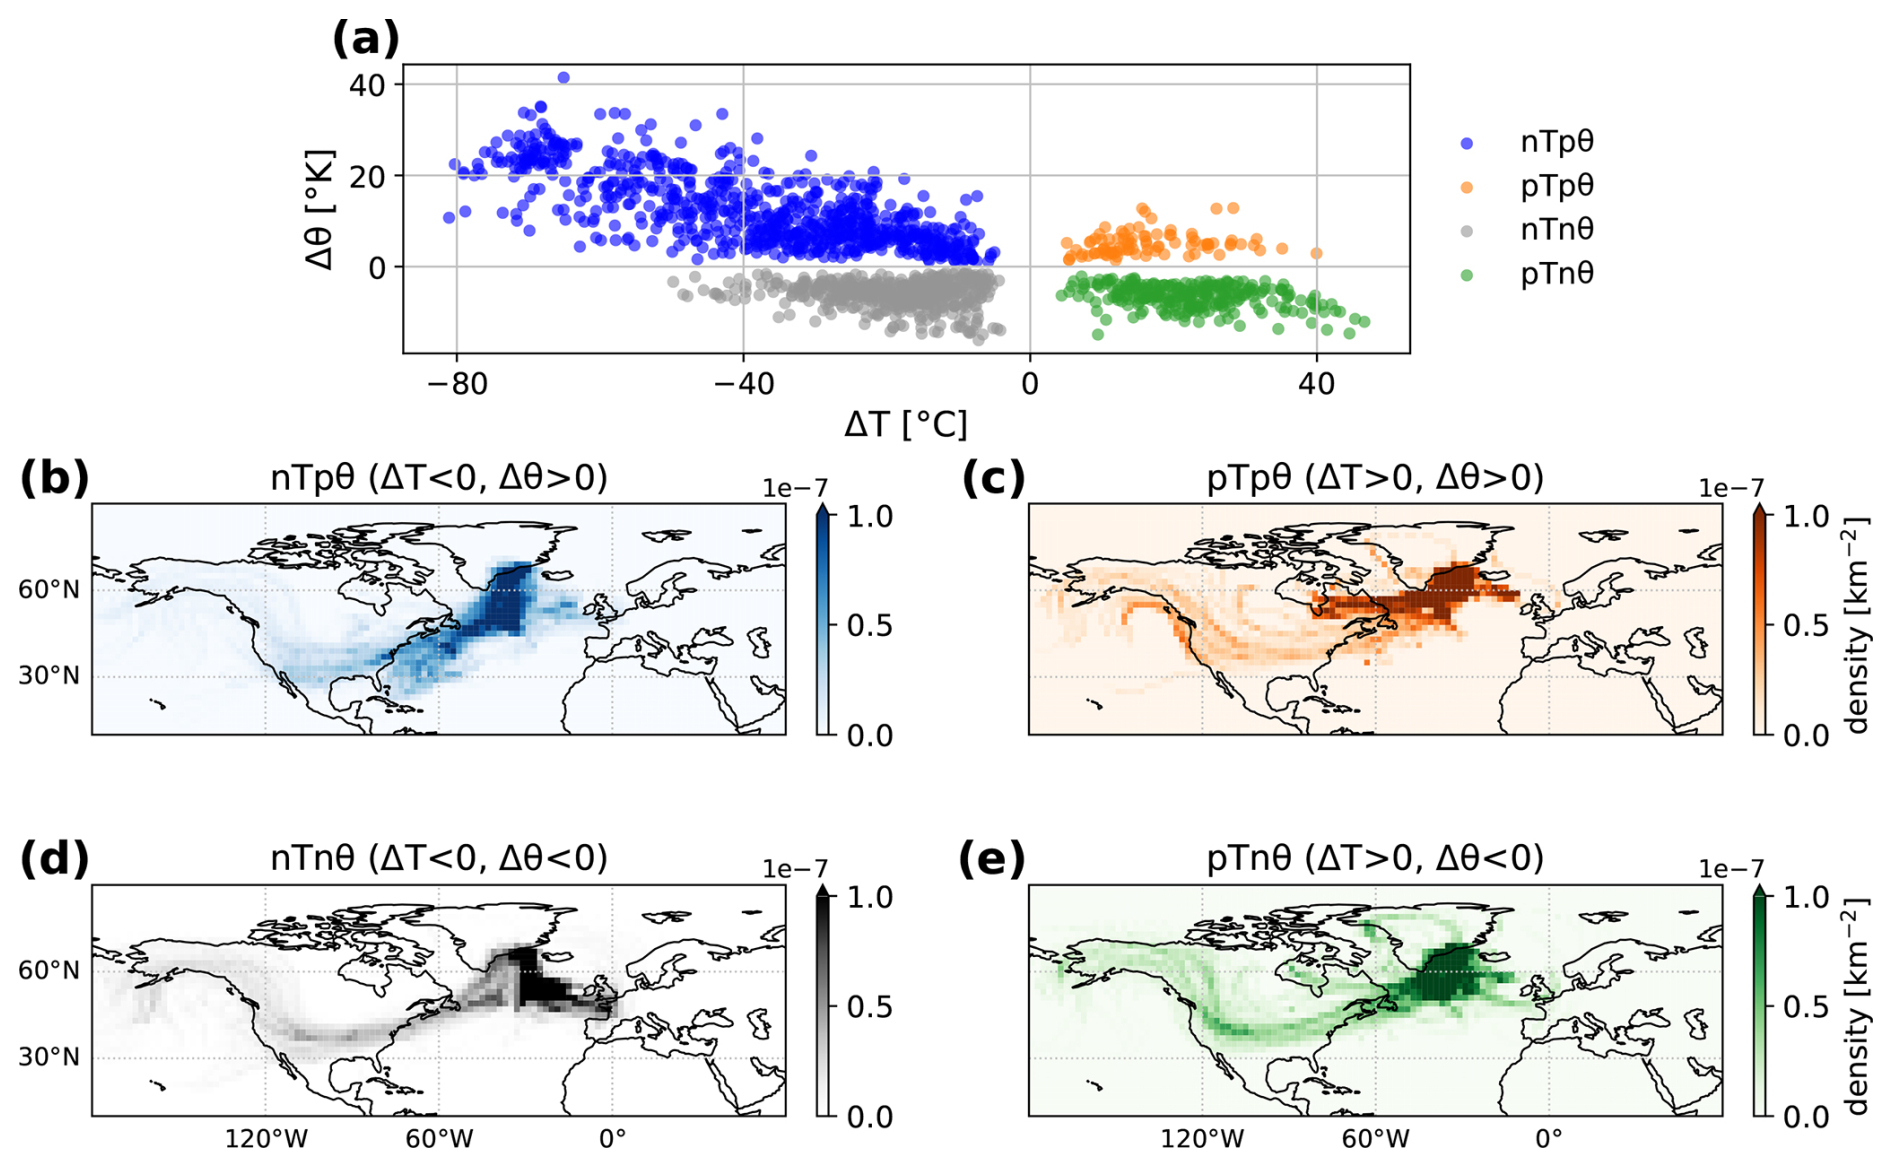
Figure 7Thermodynamic properties of parcels contributing to extreme precipitation over the Greenland coast within the Arctic Circle (white stippling in Fig. 5b over Greenland). 5 d backward trajectories are considered based on ERA5. (a) Maximum difference in temperature (ΔT) and potential temperature (Δθ) along each trajectory relative to their endpoints. Coloured clusters indicate four distinct groups: nTpθ (blue; negative ΔT, positive Δθ), pTpθ (orange; positive ΔT, positive Δθ), nTnθ (grey; negative ΔT, negative Δθ), and pTnθ (green; positive ΔT, negative Δθ). (b) Spatial density distribution of nTpθ trajectories, obtained by binning all parcel positions along their trajectories into 2° × 2° grid cells. Values represent the probability density per km2 of parcel positions, normalised by the total number of positions and the physical area of each grid cell, thereby accounting for the decrease in grid-cell area with increasing latitude. (c) Same as panel (b) but for pTpθ parcels. (d, e) Same as panels (b) and (c) but for nTnθ and pTnθ parcels.
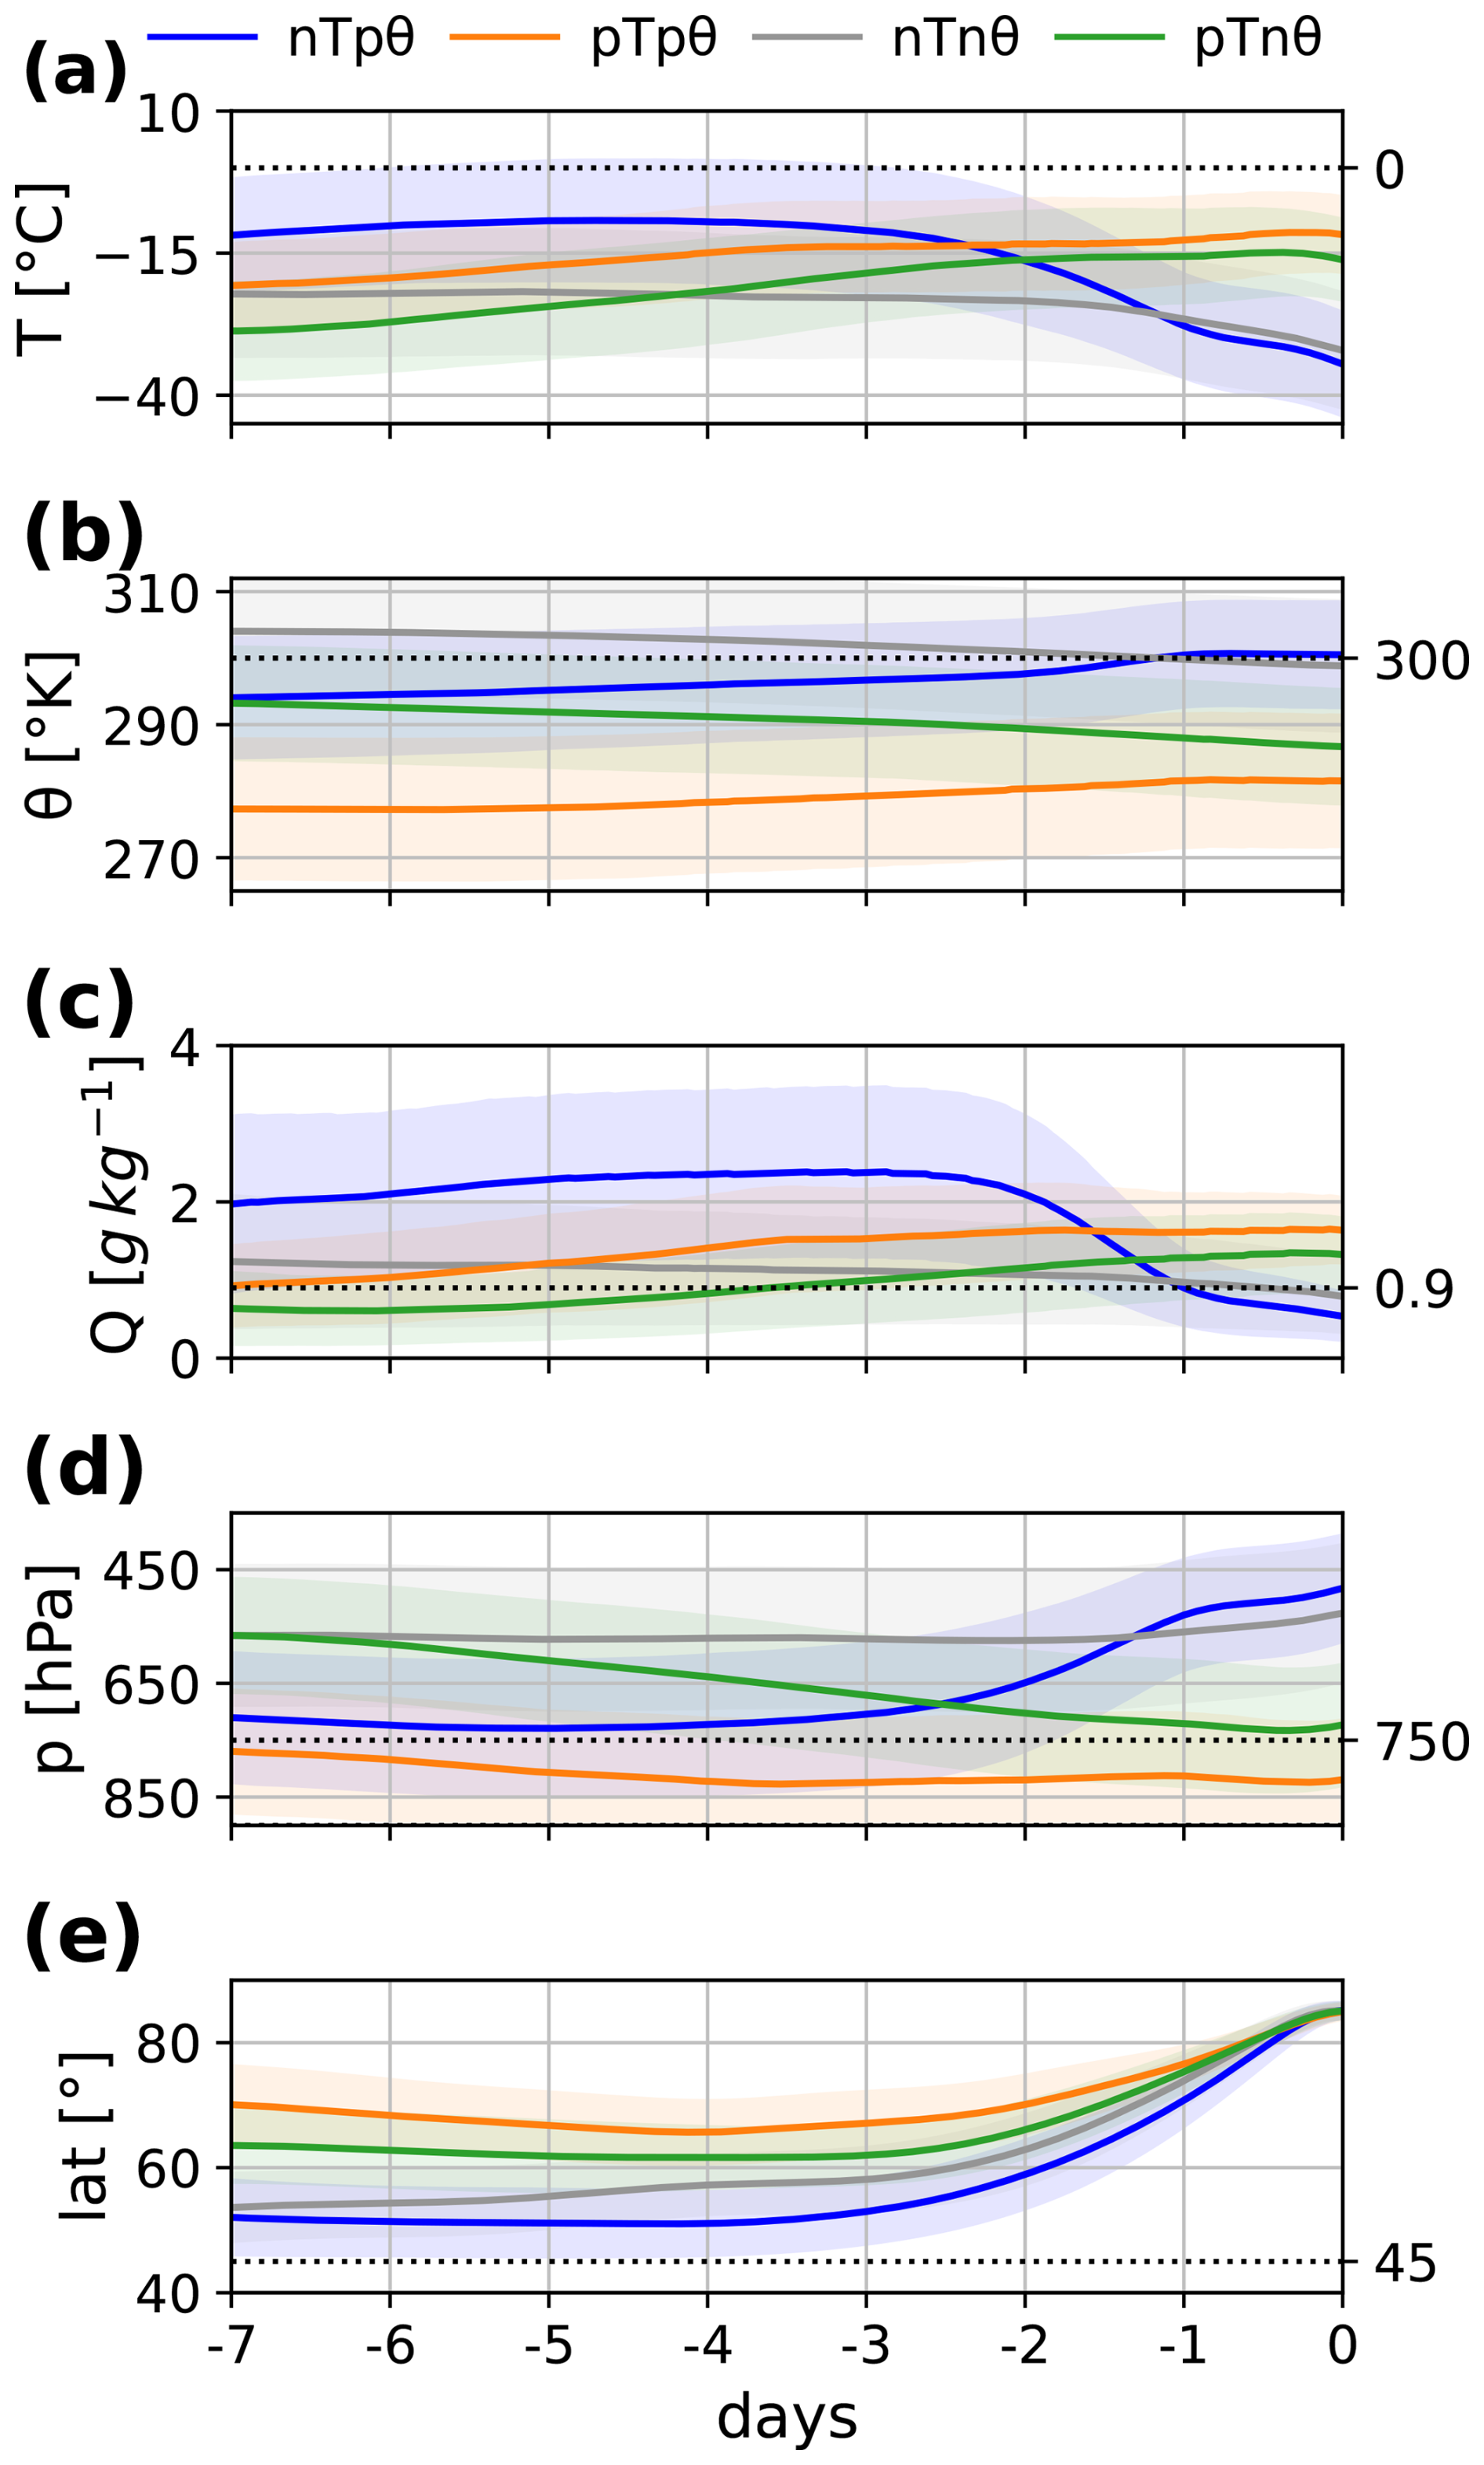
The spatial density distribution of nTpθ parcels (Fig. 7b) visualises the pathway taken by the corresponding parcels. It reveals that they primarily originate in the mid-latitudes over the western Atlantic, as well as across the USA and subsequently follow the Atlantic pathway north-eastward along the Gulf Stream before reaching the Greenland coast. This transport pattern agrees with the findings of Waling et al. (2024), who showed that, during summer, ARs reaching Greenland generally originate over the central USA and the western Atlantic between 30 and 45° N. The temporal evolution of key thermodynamic properties averaged across each subgroup (Fig. 8) supports this, indicating that nTpθ parcels typically originate in the mid-latitudes south of 45° N and undergo rapid poleward transport during the final 2 d before reaching their endpoints (Fig. 8e). The parcels remain relatively warm (Fig. 8a), averaging near 0 °C 3–4 d before arrival, and move at nearly constant potential temperature (Fig. 8b), indicating adiabatic motion. On average, they are found at around 750 hPa (Fig. 8d), although the full distribution extends below 900 hPa (not shown). This allows parcels at the lower levels to acquire moisture from the surface and is consistent with previous studies showing that the core of an AR and the associated strongest horizontal moisture fluxes are typically concentrated in the lower levels of the atmosphere below 700 hPa (Guan and Waliser, 2015; Ralph et al., 2017). The parcels have an initial specific humidity of 3 g kg−1, which increases steadily to a maximum of 4.2 g kg−1 2–3 d prior to arrival (Fig. 8c), indicating that moisture uptake along the pathway contributes to a substantial amplification of an already moisture-rich air mass. By 1 d prior to arrival, the parcels are located at approximately 50° N, 700 hPa, and carry roughly twice the April climatological specific humidity of the ambient free-tropospheric environment at that level and latitude. The interplay of these thermodynamic variables, their evolution along the trajectories and high moisture content show that nTpθ parcels exhibit characteristics typical for ARs, intensifying over warm ocean waters as they move poleward.
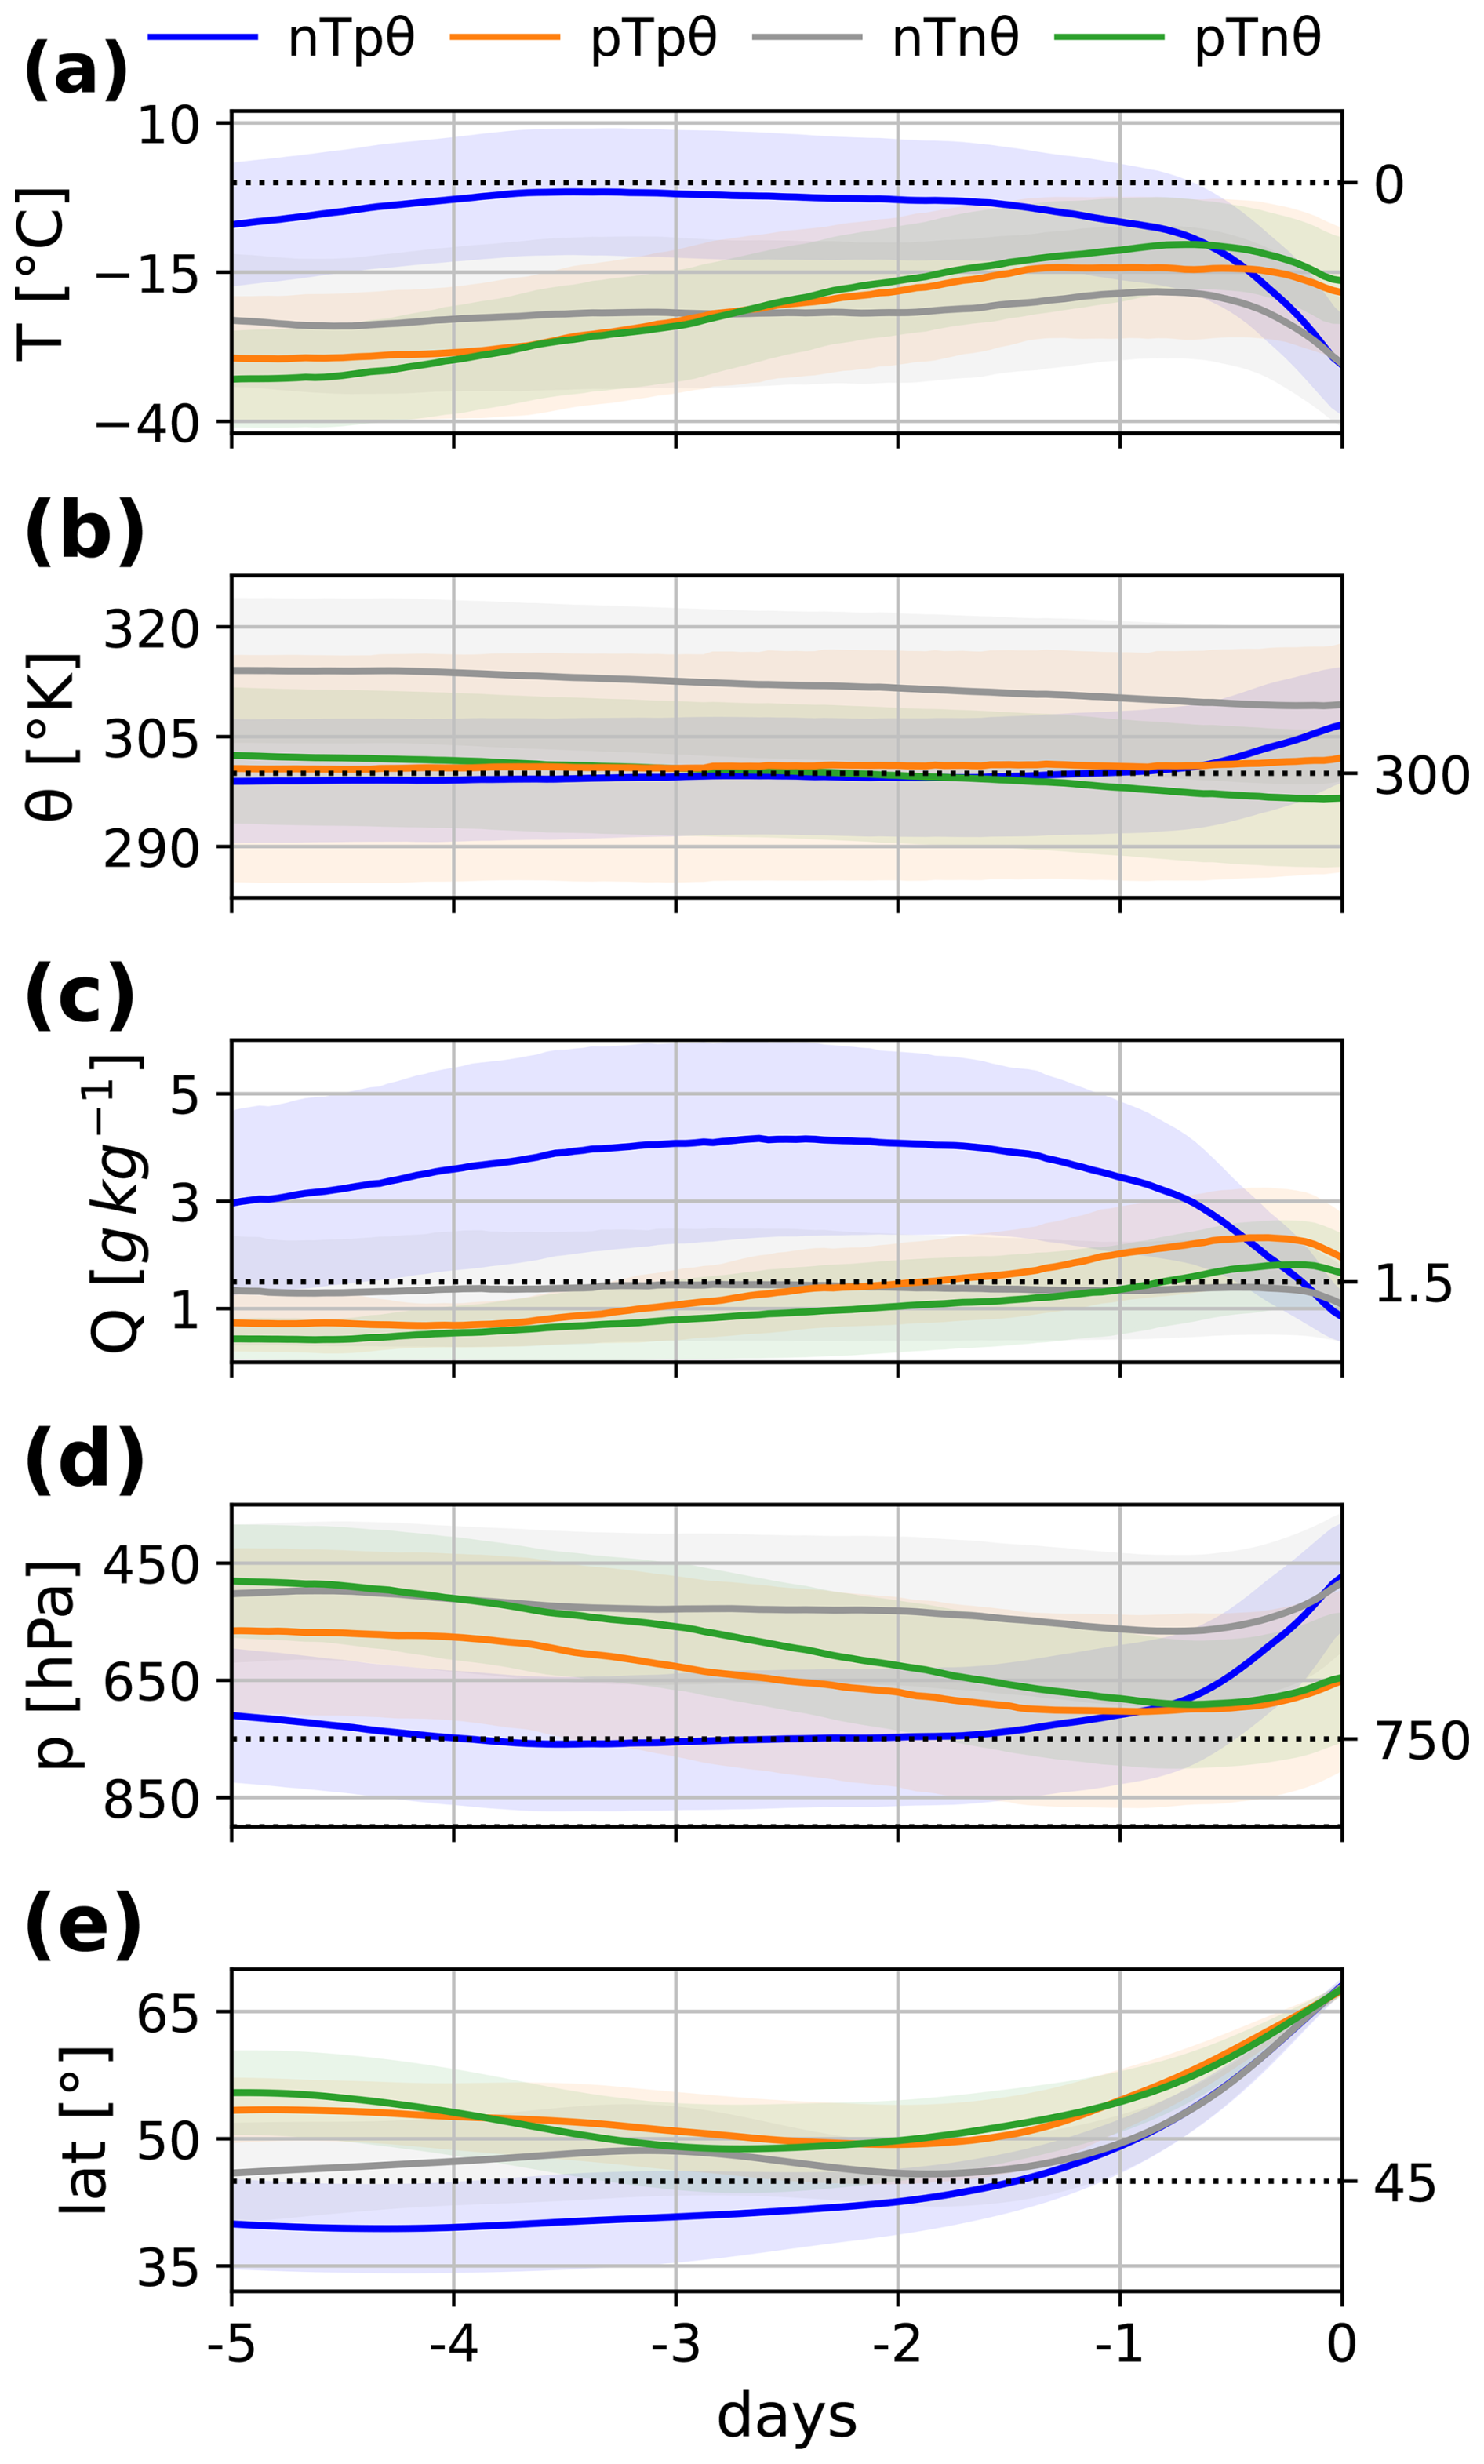
Figure 8Time evolution of thermodynamic properties along 5 d back trajectories based on ERA5. Panel (a) shows the temporal evolution of temperature averaged over each subgroup from Fig. 7 with the envelopes indicating ±1 SD of the spread across the constituent trajectories. The black dotted line marks 0 °C. (b) As in panel (a) but for the potential temperature with the black line marking 300 K, indicating the tropopause in polar regions. (c) As in panel (a) but for specific humidity; the black dotted line indicates the mean specific humidity at 50° N, 700 hPa for April 1979–2023. (d) As in panel (a) but for the pressure evolution; the black line marks 750 hPa. (e) As in panel (a) but for the mean latitude with the black line marking 45° N.
On the last day before landfall, nTpθ parcels experience a sharp decline in temperature and pressure, as well as specific humidity, together with an increase in potential temperature (Fig. 8). This indicates that airmasses rise upon reaching the Greenland coast, leading to cooling, condensation, and precipitation, accompanied by latent heat release. This thermodynamic evolution of nTpθ parcels reflects the complex interplay of surface heat exchange, moisture transport, and vertical mixing typical of ARs as they release moisture upon landfall.
In contrast, the pTpθ, nTnθ and pTnθ groups represent more local transports of airmasses. The nTnθ parcels are primarily located over the north-central Atlantic, west of the UK, with a smaller fraction originating across the USA (Fig. 7d). On average, these parcels follow a northward journey starting around 45° N (Fig. 8e) and are characterised by consistently cold temperatures below −15 °C (Fig. 8a). Lower pressure (Fig. 8d) and high potential temperature values (Fig. 8b) indicate that the parcels travel mainly in the middle troposphere. Furthermore, the gradual decline in potential temperature indicates slow diabatic cooling. Specific humidity (Fig. 8c) remains low and nearly constant, suggesting limited moisture uptake or loss. On the final day, the parcels ascend and experience a decline in temperature in addition to decreasing potential temperature. This indicates that nTnθ parcels move from warmer to colder regions and mix with cold airmasses near Greenland, thus, experiencing cooling and energy loss, possibly associated with evaporative processes. Owing to their higher-altitude and cold trajectories, nTnθ parcels are unable to take up moisture along their paths. Thus, despite their spatial proximity, they do not contribute to the extreme precipitation observed along the Greenland coast and lack key characteristics of ARs.
Parcels belonging to the pTpθ and pTnθ groups originate largely over the North Atlantic south of Greenland (Fig. 7c, e) and share similar characteristics. They originate near 60° N and follow a descending pathway from the mid-troposphere towards the lower altitudes (Fig. 8). Along their trajectories, the temperature and specific humidity increase. However, both groups remain relatively cold and retain overall low moisture content, limiting their contribution to precipitation along the Greenland coast.
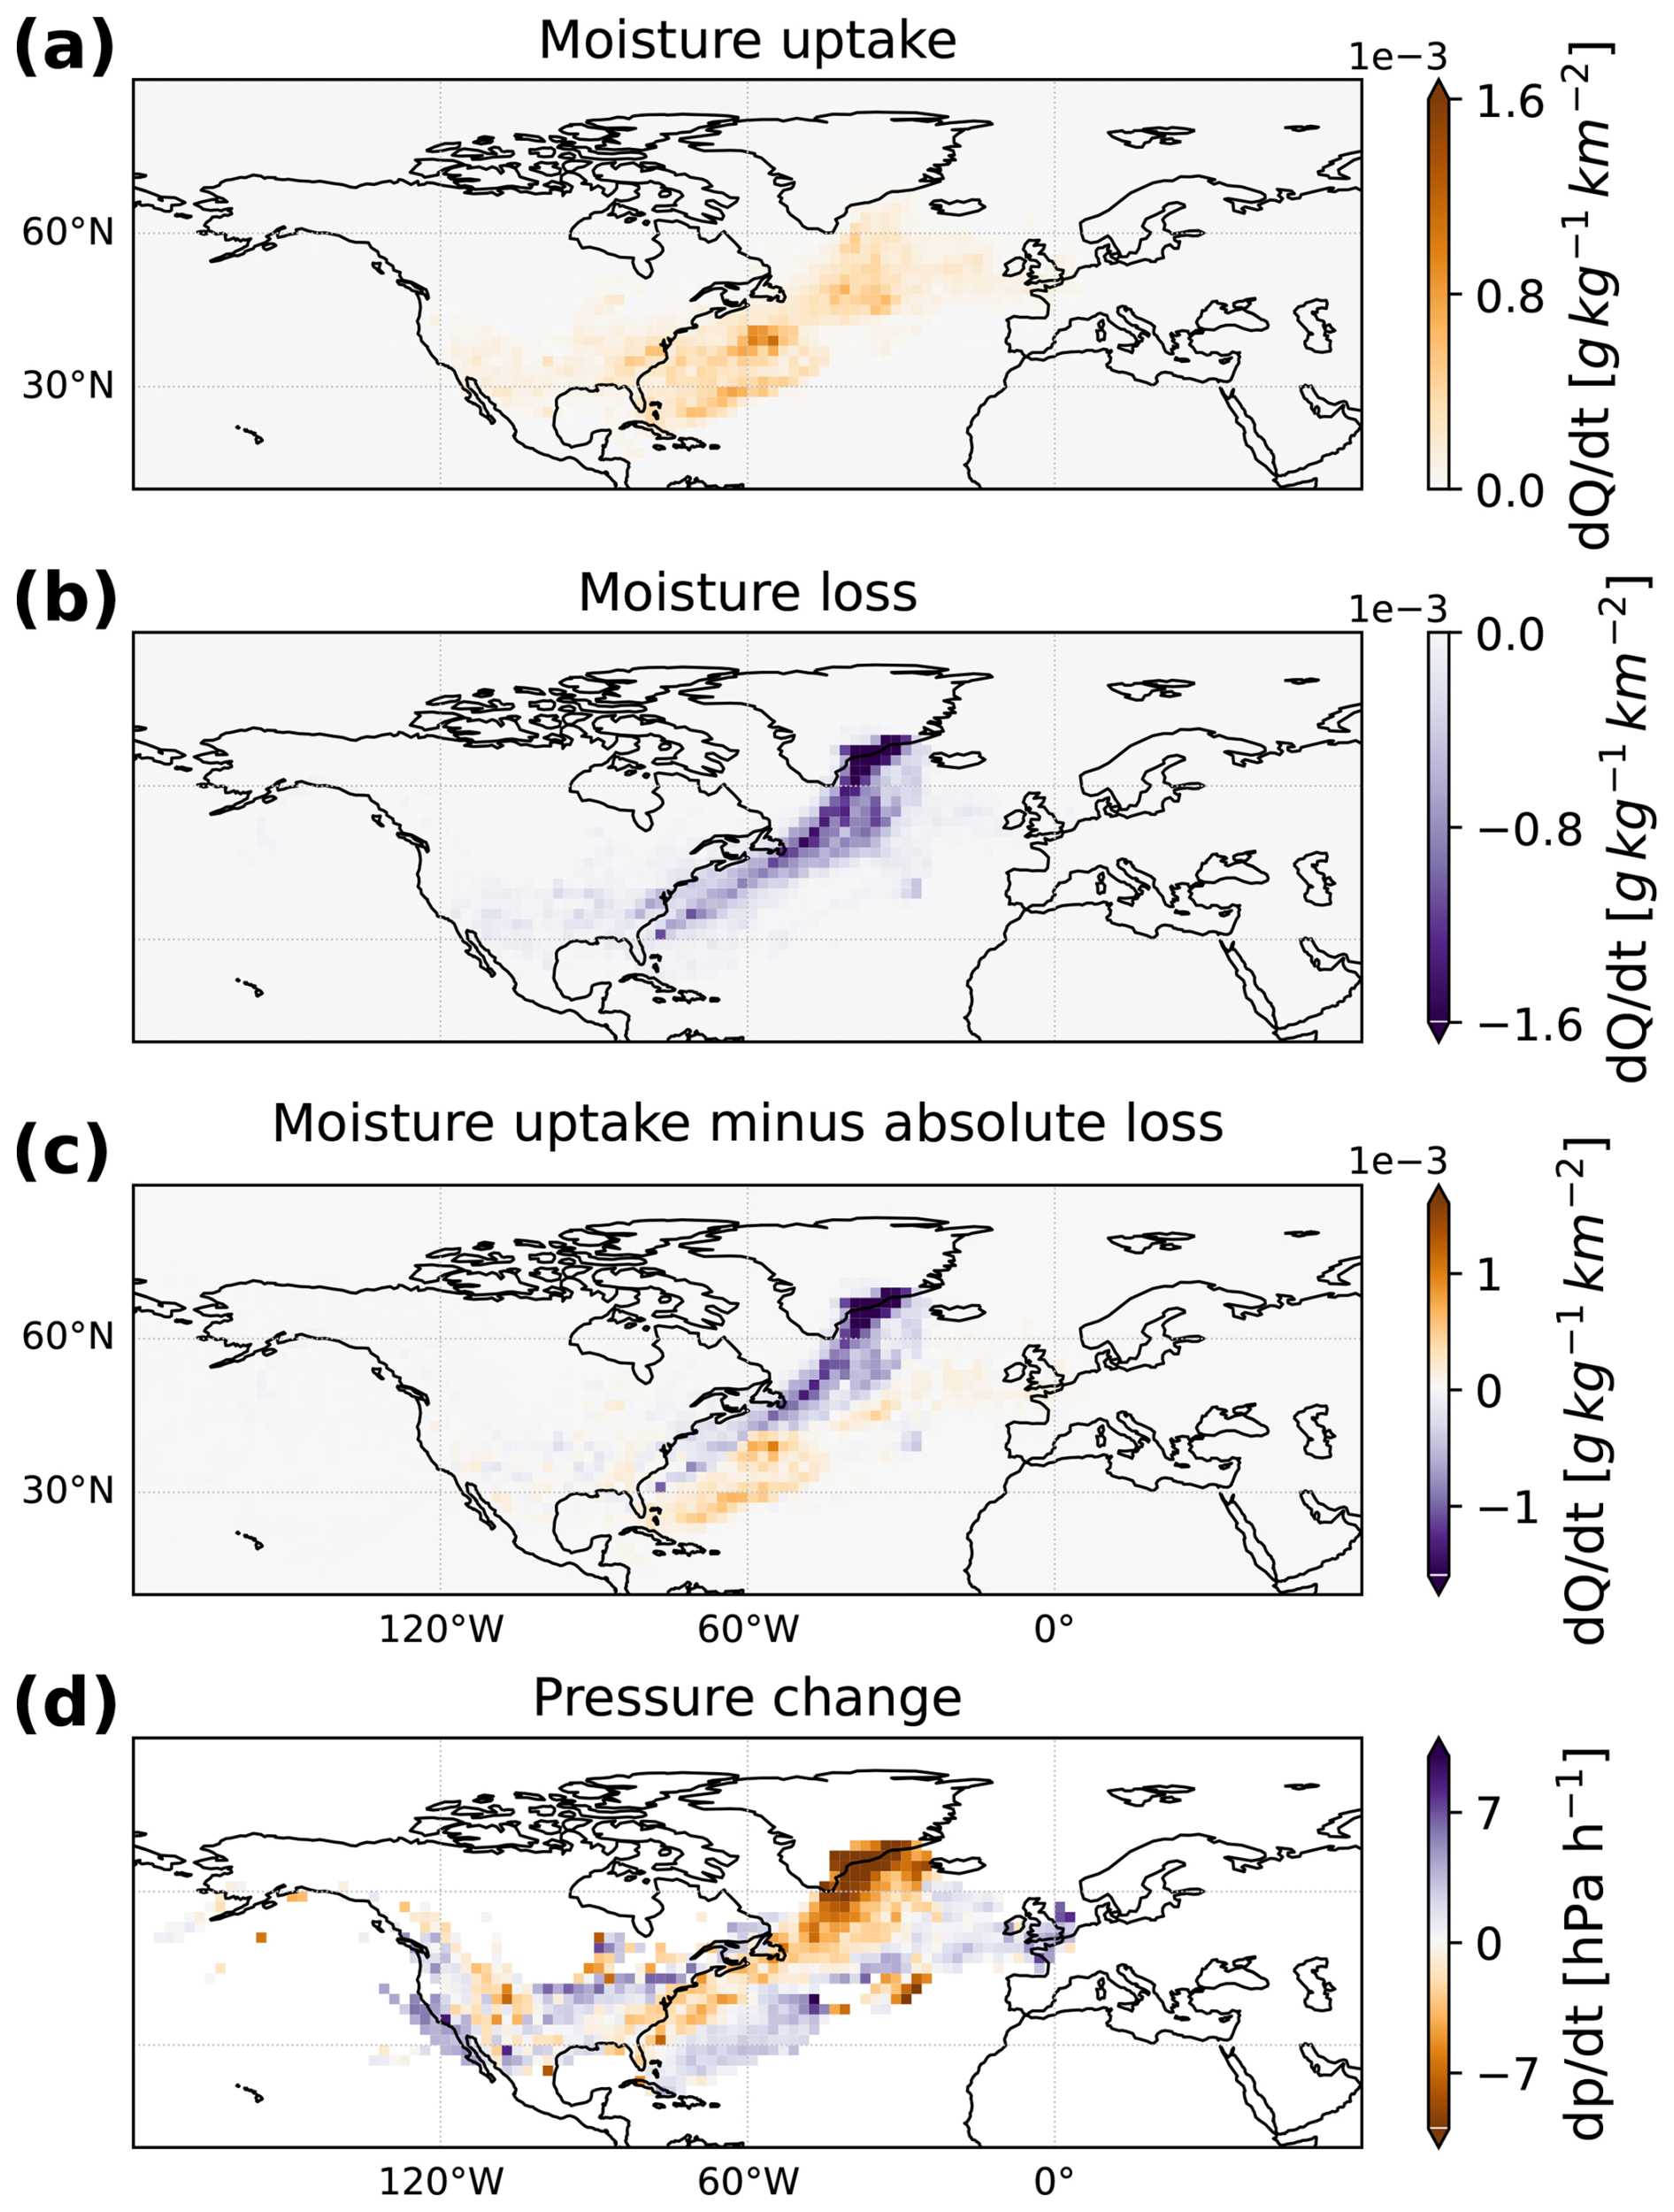
Figure 9Moisture gain and loss analysis of 5 d back trajectories for parcels belonging to the nTpθ group (see Fig. 7a) based on ERA5. From top to bottom, the panels show: (a) spatial distribution of accumulated moisture uptake ( > 0) along the trajectories. (b) Same as for panel (a) but for moisture loss ( < 0). (c) Spatial distribution of the net moisture exchange, calculated as the difference between panels (b) and (c), i.e. moisture uptake minus loss. (d) Map of average pressure changes per parcel for bins containing more than 20 parcels.
After having determined that nTpθ parcels exhibit key AR characteristics and act as the primary conveyors of extreme precipitation to the Greenland coast, we next focus on moisture uptake and loss regions along their trajectories. Figure 9 reveals that in general moisture uptake occurs predominantly at lower latitudes (Fig. 9a) and in the lower levels of the troposphere near 900 hPa (not shown). In contrast, moisture loss takes place at higher latitudes (Fig. 9b) and in the mid-troposphere (not shown). Further, moisture uptake is most pronounced over the western Atlantic near the USA coast, where warm sea surface temperatures favour upward turbulent surface fluxes, and over the north-central Atlantic south of Greenland. In contrast, moisture loss, corresponding to precipitation, is confined to a narrow filament along the Atlantic pathway from the eastern coast of Florida to Greenland. This loss intensifies near the Greenland coast, where orographic uplift of the landfalling Atlantic AR leads to extreme precipitation, as indicated by a marked decrease in the averaged parcel pressure in this region (Fig. 9d). Note that moisture loss exceeds moisture uptake as the initial moisture content of the parcels reflects the pre-existing atmospheric moisture of their mid-latitude origin region, which is subsequently lost during poleward transport in addition to the moisture gained through surface fluxes along the trajectory.
Next, the trajectory analysis is repeated for parcels with endpoints in the central Arctic, where extreme precipitation occurred during the two ARs (see white stippling in Fig. 5b). For this region, 7 d parcel trajectories are considered, again yielding four distinct groups based on the maximum changes in ΔT and Δθ along each trajectory relative to its endpoint. Figure 10a shows the resulting groups: nTpθ (27.2 % of trajectories), pTpθ (6.7 %), nTnθ (43.9 %), and pTnθ (22.2 %). Compared to the Greenland coast, where nearly half of the parcels fell within nTpθ, the dominant group in the central Arctic is nTnθ, while nTpθ accounts for only about one quarter of the trajectories. This difference may reflect the generally weaker strength of the ARs when reaching the central Arctic, reducing the fraction of nTpθ parcels that retain typical AR characteristics.
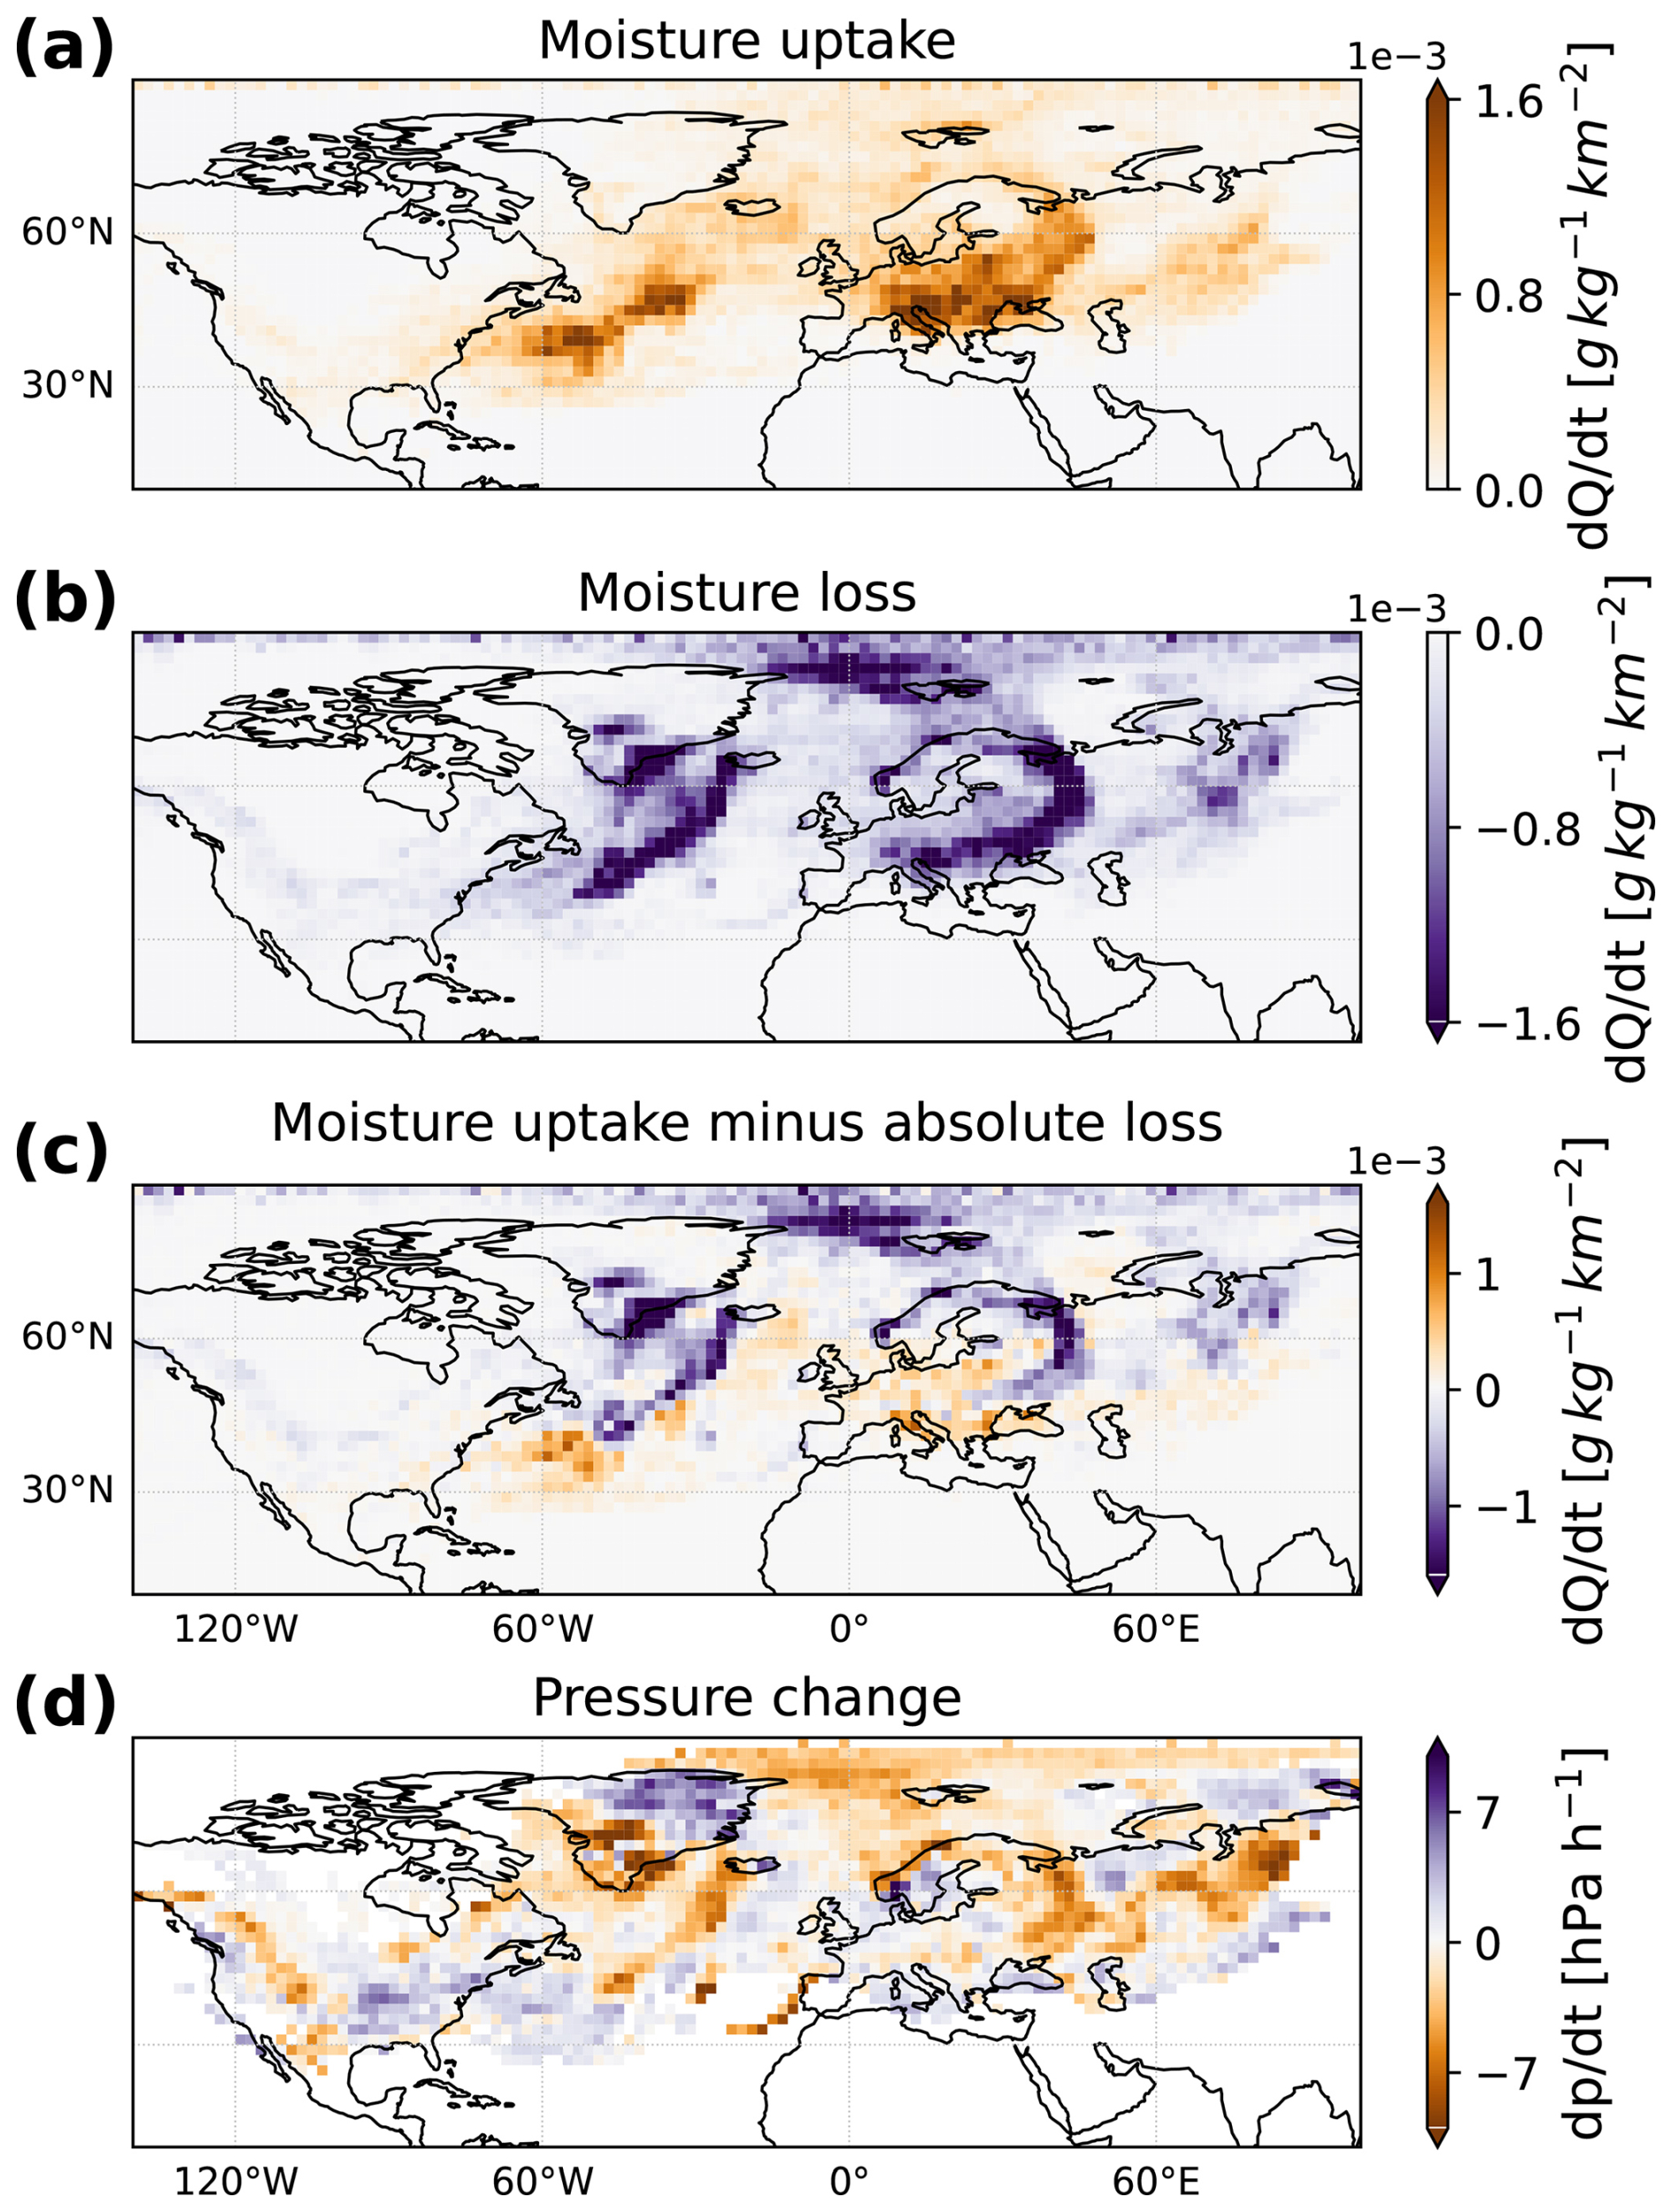
The trajectory density map for the nTpθ group (Fig. 10b) captures the distinct pathways of both the Atlantic and Eurasian ARs. Along the Atlantic, an elongated stream of parcels is shown, coinciding with regions of enhanced moisture uptake (Fig. 12a) and low parcel altitudes around 900 hPa (not shown). Moisture loss accompanied by upward motion also occurs along the Atlantic pathway towards Iceland (Fig. 12b, d). Additionally, strong moisture loss and upward motion is shown over the Greenland coast. Over Eurasia, two distinct trajectory pathways emerge. One follows an arch-shaped route from southern and eastern Europe through Siberia and eastern Scandinavia, reaching the Arctic Ocean and Svalbard. The other, less pronounced, is located farther east over Russia and Siberia, terminating over the Kara Sea. Both pathways are associated with the Eurasian AR, where a south-eastward shift of the driving low-high pressure couplet leads to an eastward displacement of the AR track (see Fig. 1). Moisture uptake along the Eurasian pathway is most prominent over central and eastern Europe as well as western Russia, while the eastern route shows limited moisture uptake east of the Urals (Fig. 12a). Moisture loss is concentrated over southern Europe and western Russia along an arch-shaped route (Fig. 12b). The close spatial alignment between moisture source and sink regions along the AR pathway suggests that a substantial fraction of the precipitated moisture is being locally recycled within the AR, as has been shown in previous studies (Nusbaumer and Noone, 2018). In the Arctic, enhanced moisture loss is observed in the vicinity of Greenland and Svalbard consistent with upward motion of air parcels.
The temporal evolution of properties along the trajectories show that nTpθ parcels reaching the central Arctic typically originate near 50° N and travel northward, mainly during the final 3 d before arrival (Fig. 11e). They are characterised by relatively warm temperatures compared to pTpθ, nTnθ and pTnθ parcels (Fig. 11a), although their average temperatures remain below 0 °C. Their nearly constant potential temperature indicates adiabatic motion (Fig. 11b), while mean pressure values around 750 hPa suggest that the parcels travel within the lower troposphere (Fig. 11d). Similar to nTpθ parcels reaching the Greenland coast (see Fig. 8c), those arriving in the central Arctic have high specific humidity (Fig. 11c). Two days prior to arrival, when the parcels are located near 60° N, 650 hPa, their specific humidity is more than twice the April climatological mean for this region and altitude, indicating that they are anomalously moist relative to the surrounding atmosphere. However, whereas the Greenland-bound nTpθ parcels exhibit a marked increase in Q along their trajectories, the central Arctic parcels maintain comparatively flat Q values. A steady decrease in temperature, along with decreasing humidity and decreasing pressure 1–3 d before arrival, coincides with the northward propagation of the parcels into the colder Arctic environment, reflecting progressive cooling and ascent, particularly between 60° and 70° N.
Parcels in the nTnθ group originate from the north-central Atlantic and travel northward along eastern Greenland into the high latitudes or are observed over northern Eurasia and the Kara Sea. These parcels represent a high-altitude feature characterised by low pressure, elevated potential temperature, and low, nearly constant specific humidity (Fig. 11). Given these characteristics, the nTnθ group does not appear to be part of the incoming AR plumes and likely contributes minimally to the anomalous precipitation observed in the central Arctic during the period. The pTpθ and pTnθ groups seem to be linked to more localised processes, similar to those observed for the parcels reaching the Greenland coast. Like the nTnθ group, they exhibit low temperatures and low specific humidity, which limit their capacity to produce significant precipitation.
By utilising a combined Eulerian and Lagrangian analysis framework, we have identified the dynamical drivers, local and Arctic-wide surface impacts, and the thermodynamic evolution of two distinct Arctic ARs during 13–21 April 2020. Together, these ARs contributed to highly unusual atmospheric conditions across the Arctic, underscoring their critical role in amplifying regional weather extremes, and shaping Arctic climate variability and associated cryospheric impacts.
Our analysis captures the detailed temporal evolution of the large-scale circulation patterns that steered the two major ARs into the Arctic (see Fig. 1), resulting in extraordinary transport of heat and moisture into the region. The Atlantic AR was driven by a highly exceptional cyclone over Baffin Bay and an anticyclone over the North Atlantic, while the Eurasian AR was driven by a cyclone over western Siberia and an extremely anomalous and persistent anticyclone over north-central Siberia (Fig. 2). The two ARs had distinct characteristics and regional impacts. The Eurasian AR was more strongly associated with widespread surface temperature anomalies, particularly across the Eurasian landmass (Fig. 4), while the Atlantic AR was characterised by abundant moisture transport, producing intense precipitation along the Greenland coast (Fig. 5a). The ARs led to increased cloud cover, enhanced downward longwave radiation, strong near-surface winds and regional warming (Figs. 3 and 6), coinciding with notable sea ice retreat in the Barents-Kara Sea and along the south-eastern coast of Greenland (Fig. 5c).
Backward parcel trajectories associated with extreme precipitation along the Greenland coast provide new insights into the thermodynamic evolution of the Atlantic AR. We identify four distinct groups of air parcels, each exhibiting unique thermodynamic characteristics (Fig. 7). Three of these groups are marked by persistently cold temperatures and low specific humidity (Fig. 8). Although embedded within the same synoptic system, these air parcels do not belong to the AR plume. In contrast, the dominant group, comprising roughly half of the trajectories, is primarily responsible for the anomalously high precipitation along the Greenland coast and displays clear AR characteristics (Figs. 8 and 9). These parcels originate south of 45° N and travel northward along the eastern coast of the USA, drawing moisture predominantly from the warm waters of the Gulf Stream (Fig. 9). This aligns with previous studies showing that Arctic ARs of subtropical origin propagating through the Atlantic sector acquire moisture from the western North Atlantic (Ma et al., 2025). During transport, the air parcels are characterised by relatively warm temperatures that increase to around 0 °C, increased specific humidity, and low pressure. Upon reaching Greenland, they ascend rapidly, cool, and release moisture through intense precipitation accompanied by latent heat release.
Trajectories associated with extreme precipitation in the central Arctic similarly reveal four distinct groups, three of which show limited potential for precipitation (Fig. 10). The remaining group, accounting for roughly one quarter of the trajectories, displays clear signatures of both the Atlantic and Eurasian ARs and is characterised by poleward transport of moist, relatively warm air from the midlatitudes (Figs. 11 and 12). These parcels travel within the lower troposphere under near-adiabatic conditions, gradually cooling and losing moisture as they enter the colder Arctic environment, where precipitation occurs north of 80° N.
The Eurasian AR derived its moisture from continental Eurasia (Fig. 12). While moisture uptake was most pronounced over central and eastern Europe, a secondary uptake region is evident east of the Ural Mountains over western Siberia. The close spatial alignment between moisture uptake and loss regions suggests that a substantial fraction of moisture is locally recycled within the AR (Nusbaumer and Noone, 2018), indicating that parcels already carried elevated moisture content when being incorporated into the AR airmass and highlighting the role of long-range transport in sustaining AR moisture content. In addition, moisture uptake over western Siberia may reflect land-surface feedbacks. Previous studies have shown that an intense and persistent heat wave affected Siberia in early 2020 (Ciavarella et al., 2021; Overland and Wang, 2021), leading to an unusually early onset of snowmelt and enhanced soil moisture (Gloege et al., 2022) that may have acted as a moisture reservoir for the Eurasian AR.
Our findings align with previous research on the role of ARs in transporting heat and moisture into polar regions (Gorodetskaya et al., 2014; Payne et al., 2020; Wang et al., 2024; Wille et al., 2019). We complement recent works by Kirbus et al. (2023) and Svensson et al. (2023), who analysed the same event using combined Eulerian and Lagrangian approaches, primarily focusing on impacts in the vicinity of RV Polarstern. Kirbus et al. (2023) emphasised the poleward transport of latent energy, associated cloud modifications, and surface energy balance anomalies driven by turbulent heat fluxes and radiation. Svensson et al. (2023), in turn, highlighted the large-scale circulation patterns channelling warm air intrusions into the Arctic, their surface impacts at the ship's location, and Lagrangian air-mass transformations along three distinct pathways reaching the vessel. By tracing the origin and evolution of air parcels associated with AR-induced extreme Arctic precipitation, our analysis extends previous findings by showing how distinct trajectory groups contributed to the build-up and release of moisture, thereby linking the large-scale transport dynamics directly to the precipitation observed along the Greenland coast and the central Arctic.
In a warming climate, increasing atmospheric moisture content in the Arctic (Serreze et al., 2012), together with declining sea ice (e.g., Yadav et al., 2020) and enhanced storm activity (Iijima et al., 2016), are expected to increase AR activity and expand their reach into the high latitudes. Recent studies show that ARs are becoming more frequently occurring features of the Arctic climate system (Wang et al., 2024; Woods and Caballero, 2016; Zhang et al., 2023), raising important questions about how the combined transport of heat, moisture, and aerosols influences Arctic amplification and cloud radiative forcing. Additionally, the impact of ARs on sea ice variability requires more detailed investigation, given the many interacting factors that govern sea ice change. Continued investigation into the mechanisms, variability, and impacts of ARs under a changing climate will be essential for improving projections and informing climate resilience strategies in the Arctic and beyond.
To assess the role of upper-level dynamics, we examine the Ertel potential vorticity (PV) at 12:00 UTC on the 315 K isentropic surface during 13–21 April 2020 (Fig. A1). The 315 K surface is representative of the mid latitude tropopause, where Rossby wave activity and wave breaking are typically strongest. High PV values indicate air of stratospheric origin while low PV values indicate tropospheric or lower latitude air.
Figure A1 shows a synoptic-scale upper-level wave train over the North Atlantic and Eurasian sectors. Both, cyclonic and anticyclonic wave breaking are evident, with filaments of high- and low-PV air partially detaching and mixed. However, the AR pathways are not consistently collocated with these detached filaments or with the clearest PV overturning features. Instead, the ARs tend to follow the sharp PV gradient along the western edge of the low-PV region as shown by Liu and Barnes (2015), before recirculating around the low-PV region over the central Arctic. This suggests that the ARs may have been steered by the upper-level wave train along regions of sharp negative PV gradients, while wave breaking may have contributed to the amplification and persistence the quasi-stationary wave train.
To further assess the extreme nature of the upper-level flow, we analyse the mean PV anomaly for the target period 15–21 April 2020 relative to the 1979–2023 climatology (Fig. A2), which shows a quasi-stationary wave train poleward of 40° N. We define regional boxes enclosing each positive and negative PV anomaly centre associated with the ARs. For the Atlantic AR, the positive PV anomaly over North America (red box) is highly unusual, lying at the 95.9th percentile of the climatological distribution, while the anomalously low PV over the North Atlantic (blue box) falls at the 1.2nd percentile. In contrast, the Eurasian AR is associated with a region of anomalously high PV over eastern Europe (pink box) that corresponds to the 70.4th percentile, whereas the negative PV anomaly over northern Siberia (cyan box) is exceptionally rare, being at the 0.4th percentile of the distribution. This indicates that the Eurasian AR event is distinguished primarily by an extreme intrusion of low-PV air into the high Arctic on the 315 K surface, consistent with strong poleward transport of anticyclonic upper-tropospheric air.
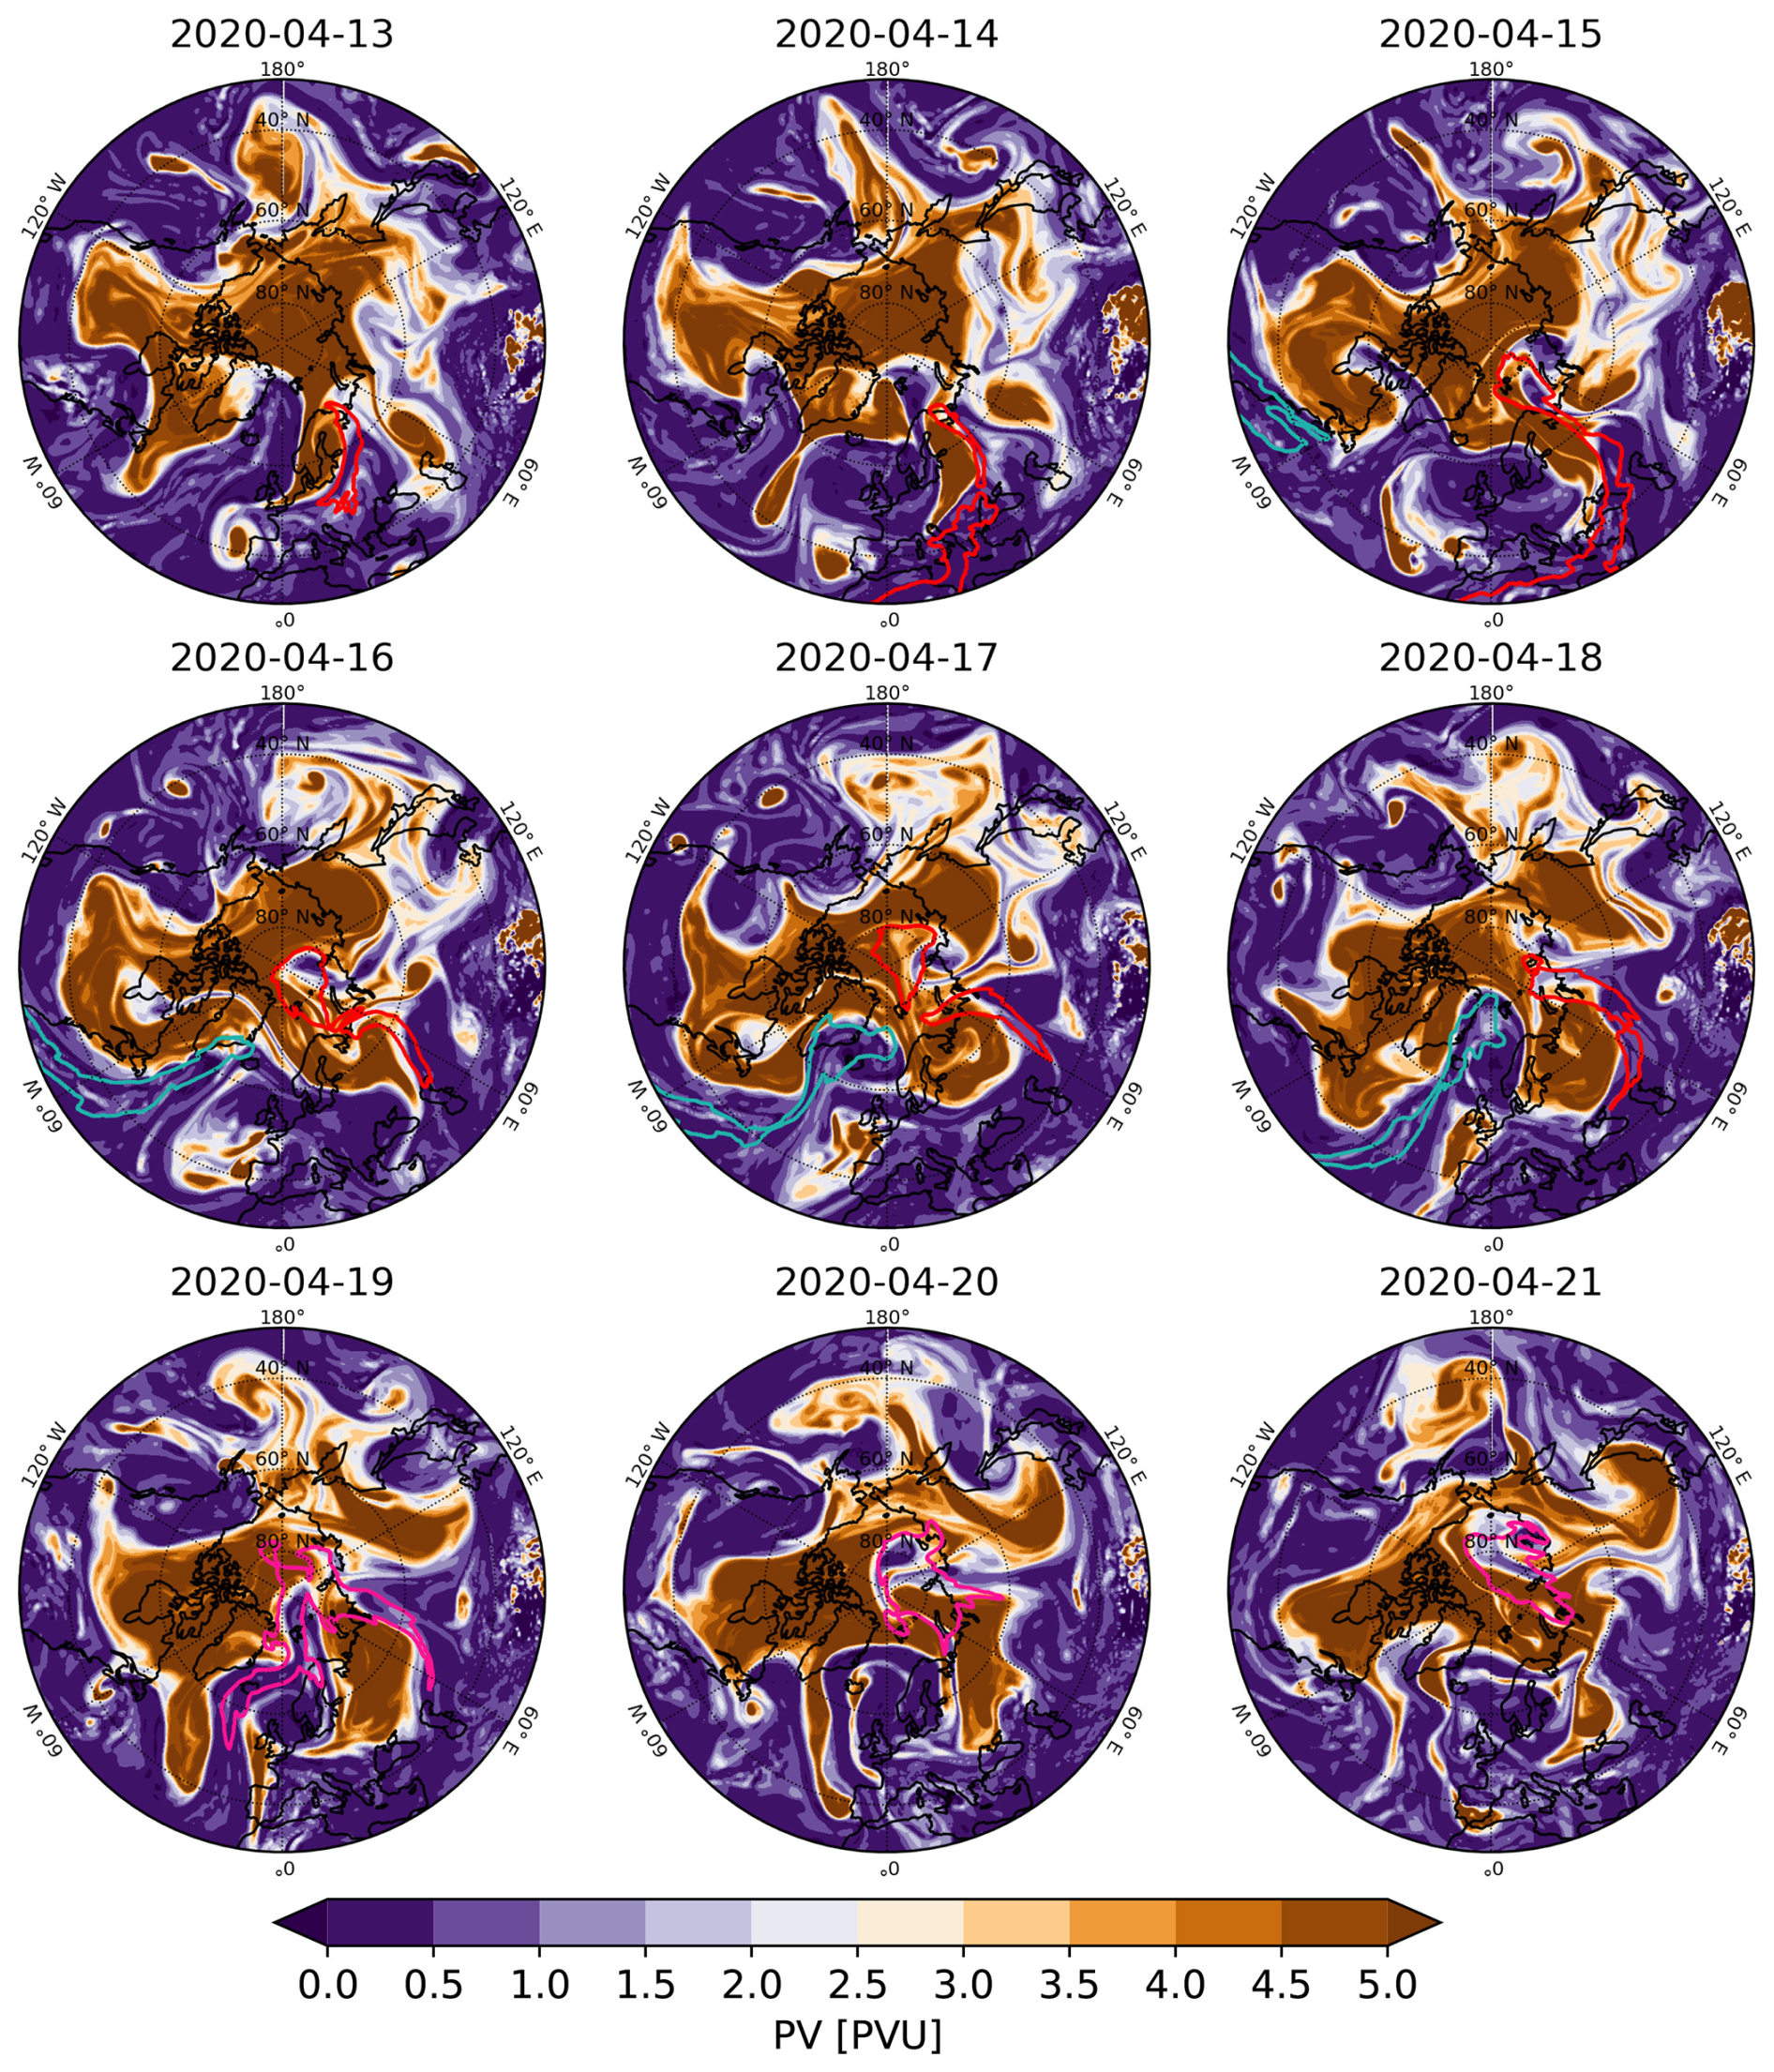
Figure A1Ertel PV on the 315 K isentropic surface at 12:00 UTC for 13–21 April 2020 (shading) based on ERA5 data. Red and teal contours delineate the boundaries of the Eurasian and Atlantic ARs, respectively, as diagnosed from the tARget database at 12:00 UTC each day. Following the merger of the two ARs, their combined boundary is shown in pink.
Diabatic processes associated with the ARs may have contributed to the persistence and amplification of the downstream negative PV anomalies. Previous studies show that latent heating can enhance anticyclonic blocking through two mechanisms. The direct mechanism involves cross-isentropic ascent, often in moist ascending air streams, that transports low-PV air from lower levels and lower latitudes into the upper troposphere, thereby amplifying upper-level ridges (Pfahl et al., 2015; Steinfeld and Pfahl, 2019; Yamamoto et al., 2021). The indirect mechanism involves latent-heating-enhanced divergent outflow on the western flank of the ridge, favouring its westward amplification (Steinfeld and Pfahl, 2019). Recent studies further highlight the role of North Atlantic and Gulf Stream moisture fluxes in supplying low-PV air and maintaining blocking through air-sea interaction and moist diabatic processes (Mathews et al., 2024; Mathews and Czaja, 2024). These processes likely helped maintain the low-PV anomalies over northern Siberia and western Europe, allowing them to extend further poleward into the Arctic and reinforce the Siberian anticyclonic circulation and Scandinavian High (see Fig. A2a).
Turning to the upstream side of the wave train, the extreme positive PV anomalies over North America are well placed to reinforce the driving cyclone located further north-east (see Fig. 1). Through PV inversion, such an upper-level anomaly supports cyclonic circulation, favours ascent downstream, and helps maintain low MSLP (Hoskins et al., 1985). The downstream block over the North Atlantic likely strengthens this coupling by slowing eastward Rossby wave propagation. The combination of the upstream positive PV anomaly and the downstream negative PV anomaly likely contributed to the persistence of the driving cyclone, although any deepening would still depend on low-level baroclinicity and diabatic processes (Davis and Emanuel, 1991).
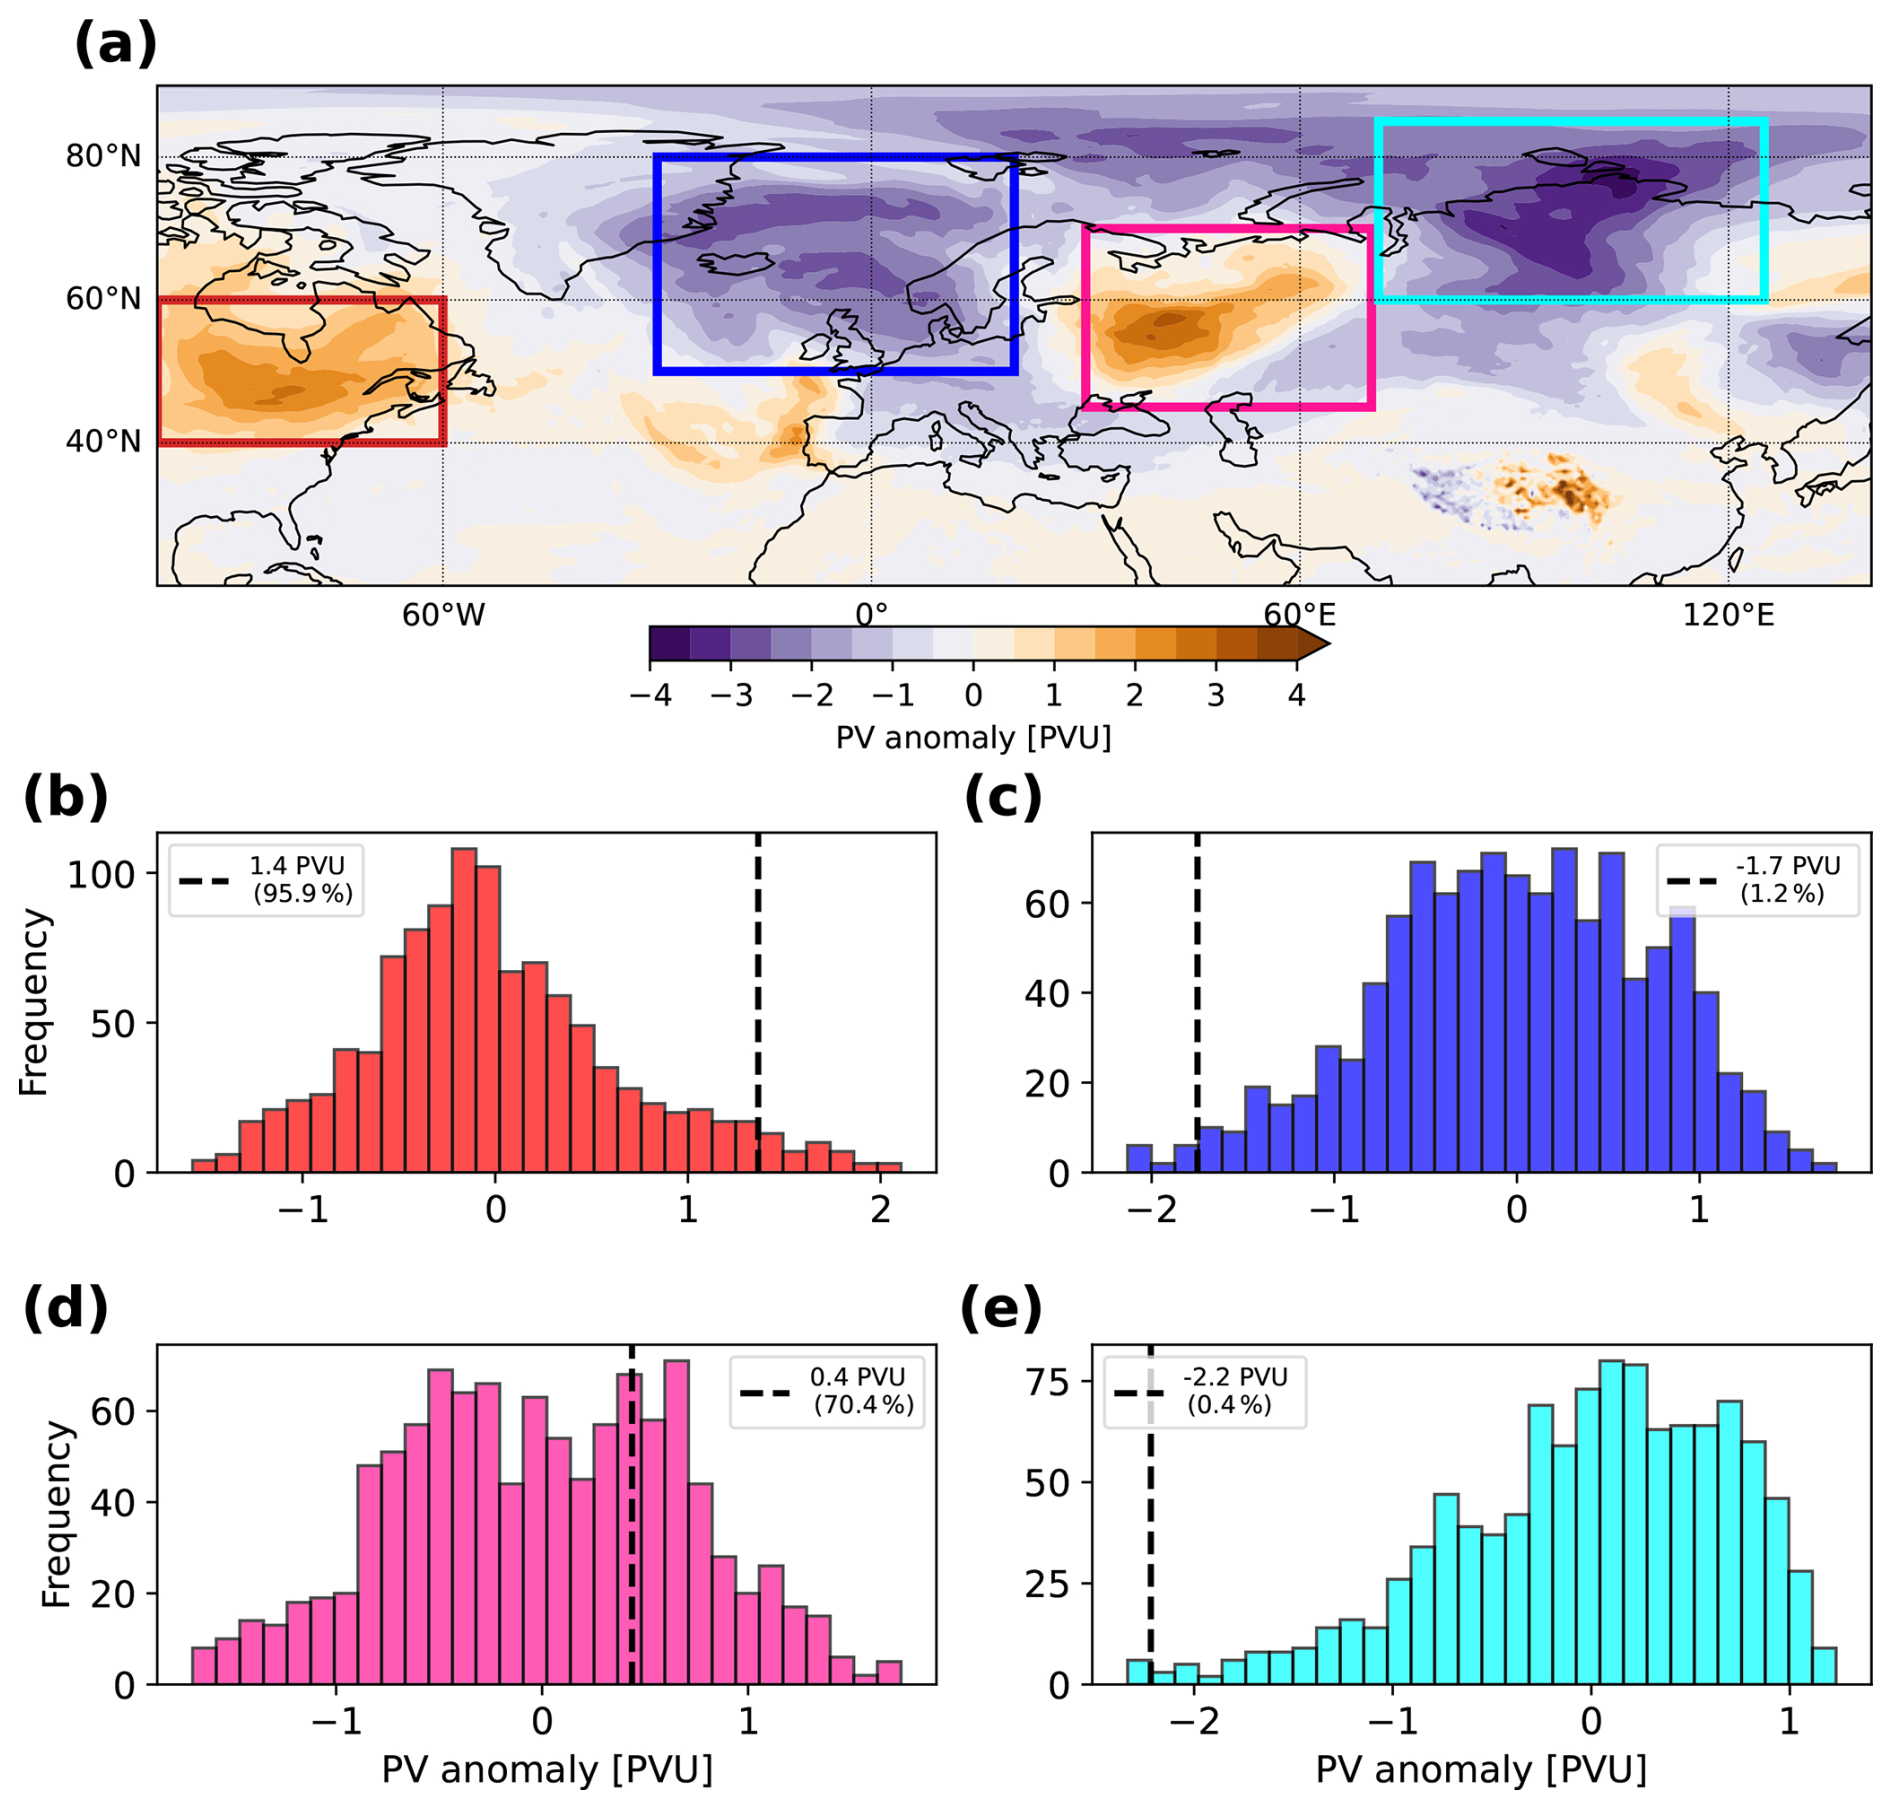
Figure A2(a) 7 d mean PV anomalies averaged over 15–21 April 2020 relative to the April climatology based on ERA5 data. Boxes denote the centres of action of the quasi-stationary wave train, defined over the following regions: 60–100° W, 40–60° N (red); 30° W–20° E, 50–80° N (blue); 30–70° E, 45–70° N (pink); and 70–125° E, 60–85° N (cyan). (b) Distribution of 7 d mean PV anomalies for April 1979–2023, averaged over the region enclosed by the red box in panel (a). The value for the target period is indicated by a black dashed line with its percentile and magnitude shown in the legend. (c–e) As in panel (b), but for the blue, pink, and cyan boxes in panel (a), respectively.
Together, these diabatic mechanisms and the extreme upstream high-PV anomaly favour a self-maintaining configuration in which wave activity, surface cyclogenesis, and moisture transport remain coupled during this 7 d period. The quasi-stationary wave train shown in Figs. 2 and A2 is consistent with reduced Rossby wave phase speeds under enhanced blocking and weakened high-latitude zonal flow. Overall, Figs. 1, 2, A1, and A2 point to a dynamically coupled, potentially phase-locked configuration linking the upstream high-PV anomalies, downstream low-PV anomalies, wave breaking, and diabatically active AR corridors.
All data used for this study is publicly available. ERA5 reanalysis data is provided by ECMWF and can be accessed at https://doi.org/10.24381/cds.143582cf (Copernicus Climate Change Service, 2023). MOSAiC meteorological data is available from the Arctic Data Centre at https://doi.org/10.18739/A2PV6B83F (Cox et al., 2023a), and MOSAiC precipitation data at https://doi.org/10.18739/A2WD3Q35Z (Clemens-Sewall et al., 2025). Data used in this manuscript was produced as part of the international Multidisciplinary drifting Observatory for the Study of the Arctic Climate (MOSAiC) with the tag MOSAiC20192020. The EUMETSAT OSI SAF product OSI-401-b is available at https://doi.org/10.15770/EUM_SAF_OSI_NRT_2004 (OSI SAF, 2017). The AR database provided by Bin Guan can be accessed via the Global Atmospheric Rivers Dataverse (https://doi.org/10.25346/S6/ZSW7UN, Guan, 2024).
LEAP conducted the analyses of synoptic conditions, AR-precipitation-SIC connections, and in situ observations guided by HL. LEAP carried out the trajectory calculations, supported by PM, AY, and TP. LEAP wrote the original manuscript. All authors provided input on the interpretation of the results, as well as editing and reviewing the manuscript.
The contact author has declared that none of the authors has any competing interests.
Publisher's note: Copernicus Publications remains neutral with regard to jurisdictional claims made in the text, published maps, institutional affiliations, or any other geographical representation in this paper. The authors bear the ultimate responsibility for providing appropriate place names. Views expressed in the text are those of the authors and do not necessarily reflect the views of the publisher.
LEAP is supported by the Natural Environment Research Council (NERC) Satellite Data in Environmental Science (SENSE) Centre for Doctoral Training. HL and TJB were supported by NERC-CANARI project. AEH is supported by ESA through the 5D Antarctica project. ACM is supported by the NERC-ExtAnt project. This work also benefited from funding provided by the UK–Japan Arctic Research Bursary Scheme. Further, we thank all those who contributed to MOSAiC and made this endeavour possible (Nixdorf et al., 2021). Finally, we sincerely thank the reviewers and the co-editor for their constructive comments, which substantially enhanced the quality of the paper.
This research has been supported by NERC (grant nos. NE/T00939X/1, NE/W004984/1 and NE/Y503307/1), and ESA (grant no. 4000146702/24/I-KE).
This paper was edited by Irina Rudeva and reviewed by five anonymous referees.
Barrett, A. P., Stroeve, J. C., and Serreze, M. C.: Arctic Ocean Precipitation From Atmospheric Reanalyses and Comparisons With North Pole Drifting Station Records, J. Geophys. Res.-Oceans, 125, https://doi.org/10.1029/2019JC015415, 2020. a
Binder, H., Boettcher, M., Grams, C. M., Joos, H., Pfahl, S., and Wernli, H.: Exceptional Air Mass Transport and Dynamical Drivers of an Extreme Wintertime Arctic Warm Event, Geophys. Res. Lett., 44, 12028–12036, https://doi.org/10.1002/2017GL075841, 2017. a, b
Bintanja, R. and Selten, F. M.: Future increases in Arctic precipitation linked to local evaporation and sea-ice retreat, Nature, 509, 479–482, https://doi.org/10.1038/nature13259, 2014. a
Boisvert, L. N., Petty, A. A., and Stroeve, J. C.: The Impact of the Extreme Winter 2015/16 Arctic Cyclone on the Barents–Kara Seas, Mon. Weather Rev., 144, 4279–4287, https://doi.org/10.1175/MWR-D-16-0234.1, 2016. a
Bonne, J. L., Steen-Larsen, H. C., Risi, C., Werner, M., Sodemann, H., Lacour, J. L., Fettweis, X., Cesana, G., Delmotte, M., Cattani, O., Vallelonga, P., Kjær, H. A., Clerbaux, C., Sveinbjörnsdóttir, Á. E., and Masson-Delmotte, V.: The summer 2012 Greenland heat wave: In situ and remote sensing observations of water vapor isotopic composition during an atmospheric river event, J. Geophys. Res., 120, 2970–2989, https://doi.org/10.1002/2014JD022602, 2015. a
Box, J. E., Wehrlé, A., van As, D., Fausto, R. S., Kjeldsen, K. K., Dachauer, A., Ahlstrøm, A. P., and Picard, G.: Greenland Ice Sheet Rainfall, Heat and Albedo Feedback Impacts From the Mid-August 2021 Atmospheric River, Geophys. Res. Lett., 49, https://doi.org/10.1029/2021GL097356, 2022. a
Cast, Z. I., Serreze, M. C., Cassano, E. N., and Barrett, A. P.: Seasonal characteristics and trends in precipitation partitioning in the Arctic, The Cryosphere, 20, 2127–2141, https://doi.org/10.5194/tc-20-2127-2026, 2026. a
Ciavarella, A., Cotterill, D., Stott, P., Kew, S., Philip, S., van Oldenborgh, G. J., Skålevåg, A., Lorenz, P., Robin, Y., Otto, F., Hauser, M., Seneviratne, S. I., Lehner, F., and Zolina, O.: Prolonged Siberian heat of 2020 almost impossible without human influence, Climatic Change, 166, https://doi.org/10.1007/s10584-021-03052-w, 2021. a
Clemens-Sewall, D., Cox, C., Schulz, K., Raphael, I., Persson, O., Shupe, M., and Smith, M.: Merged Datasets for the Multidisciplinary drifting Observatory for the Study of Arctic Climate (MOSAiC) Central Observatory in the Arctic Ocean (2019-2020) version 2, Arctic Data Center, https://doi.org/10.18739/A2WD3Q35Z, 2025. a, b
Copernicus Climate Change Service: Complete ERA5 global atmospheric reanalysis, Copernicus Climate Change Service (C3S) Climate Data Store (CDS) [data set], https://doi.org/10.24381/cds.143582cf, 2023. a, b
Cox, C., Gallagher, M., Shupe, M., Persson, O., Blomquist, B., Grachev, A., Riihimaki, L., Kutchenreiter, M., Morris, V., Solomon, A., Brooks, I., Costa, D., Gottas, D., Hutchings, J., Osborn, J., Morris, S., Preusser, A., and Uttal, T.: Met City meteorological and surface flux measurements (Level 3 Final), Multidisciplinary Drifting Observatory for the Study of Arctic Climate (MOSAiC), central Arctic, October 2019–September 2020, Arctic Data Center [data set], https://doi.org/10.18739/A2PV6B83F, 2023a. a, b
Cox, C. J., Gallagher, M. R., Shupe, M. D., Persson, P. O. G., Solomon, A., Fairall, C. W., Ayers, T., Blomquist, B., Brooks, I. M., Costa, D., Grachev, A., Gottas, D., Hutchings, J. K., Kutchenreiter, M., Leach, J., Morris, S. M., Morris, V., Osborn, J., Pezoa, S., Preußer, A., Riihimaki, L. D., and Uttal, T.: Continuous observations of the surface energy budget and meteorology over the Arctic sea ice during MOSAiC, Scientific Data, 10, https://doi.org/10.1038/s41597-023-02415-5, 2023b. a
Cullather, R. I., Lim, Y. K., Boisvert, L. N., Brucker, L., Lee, J. N., and Nowicki, S. M.: Analysis of the warmest Arctic winter, 2015–2016, Geophys. Res. Lett., 43, 10808–10816, https://doi.org/10.1002/2016GL071228, 2016. a, b, c
Dacre, H. F., Clark, P. A., Martinez-Alvarado, O., Stringer, M. A., and Lavers, D. A.: How do atmospheric rivers form?, B. Am. Meteorol. Soc., 96, 1243–1255, https://doi.org/10.1175/BAMS-D-14-00031.1, 2015. a
Dada, L., Angot, H., Beck, I., Baccarini, A., Quéléver, L. L., Boyer, M., Laurila, T., Brasseur, Z., Jozef, G., de Boer, G., Shupe, M. D., Henning, S., Bucci, S., Dütsch, M., Stohl, A., Petäjä, T., Daellenbach, K. R., Jokinen, T., and Schmale, J.: A central arctic extreme aerosol event triggered by a warm air-mass intrusion, Nat. Commun., 13, https://doi.org/10.1038/s41467-022-32872-2, 2022. a, b
Davis, C. A. and Emanuel, K. A.: Potential Vorticity Diagnostics of Cyclogenesis, Mon. Weather Rev., 119, 1929–1953, https://doi.org/10.1175/1520-0493(1991)119<1929:PVDOC>2.0.CO;2, 1991. a
Doyle, J. G., Lesins, G., Thackray, C. P., Perro, C., Nott, G. J., Duck, T. J., Damoah, R., and Drummond, J. R.: Water vapor intrusions into the High Arctic during winter, Geophys. Res. Lett., 38, https://doi.org/10.1029/2011GL047493, 2011. a, b, c, d
Gloege, L., Kornhuber, K., Skulovich, O., Pal, I., Zhou, S., Ciais, P., and Gentine, P.: Land-Atmosphere Cascade Fueled the 2020 Siberian Heatwave, AGU Advances, 3, https://doi.org/10.1029/2021AV000619, 2022. a, b
Gong, Z., Zhong, L., Hua, L., and Feng, J.: The role of atmospheric rivers and associated circulation patterns in the Arctic warming in boreal winter, Int. J. Climatol., 44, 2124–2138, https://doi.org/10.1002/joc.8444, 2024. a
Gong, Z., Zhong, L., Hua, L., and Feng, J.: Dynamic and Thermodynamic Impacts of Atmospheric Rivers on Sea Ice Thickness in the Arctic since 2000, J. Climate, 38, 2873–2890, https://doi.org/10.1175/JCLI-D-23-0509.1, 2025. a, b, c
Gorodetskaya, I. V., Tsukernik, M., Claes, K., Ralph, M. F., Neff, W. D., and Van Lipzig, N. P.: The role of atmospheric rivers in anomalous snow accumulation in East Antarctica, Geophys. Res. Lett., 41, 6199–6206, https://doi.org/10.1002/2014GL060881, 2014. a
Graham, R. M., Cohen, L., Ritzhaupt, N., Segger, B., Graversen, R. G., Rinke, A., Walden, V. P., Granskog, M. A., and Hudson, S. R.: Evaluation of six atmospheric reanalyses over Arctic sea ice from winter to early summer, J. Climate, 32, 4121–4143, https://doi.org/10.1175/JCLI-D-18-0643.1, 2019. a
Graversen, R. G., Mauritsen, T., Drijfhout, S., Tjernström, M., and Mårtensson, S.: Warm winds from the Pacific caused extensive Arctic sea-ice melt in summer 2007, Clim. Dynam., 36, 2103–2112, https://doi.org/10.1007/s00382-010-0809-z, 2011. a, b
Guan, B.: [Data] Global Atmospheric Rivers Database, Version 4, UCLA Dataverse [data set], https://doi.org/10.25346/S6/ZSW7UN, 2024. a, b
Guan, B. and Waliser, D. E.: Detection of atmospheric rivers: Evaluation and application of an algorithm for global studies, J. Geophys. Res., 120, 12514–12535, https://doi.org/10.1002/2015JD024257, 2015. a, b, c
Guan, B. and Waliser, D. E.: A regionally refined quarter-degree global atmospheric rivers database based on ERA5, Scientific Data, 11, https://doi.org/10.1038/s41597-024-03258-4, 2024. a, b, c
Hao, M., Luo, Y., Lin, Y., Zhao, Z., Wang, L., and Huang, J.: Contribution of atmospheric moisture transport to winter Arctic warming, Int. J. Climatol., 39, 2697–2710, https://doi.org/10.1002/joc.5982, 2019. a
Hegyi, B. M. and Taylor, P. C.: The Unprecedented 2016–2017 Arctic Sea Ice Growth Season: The Crucial Role of Atmospheric Rivers and Longwave Fluxes, Geophys. Res. Lett., 45, 5204–5212, https://doi.org/10.1029/2017GL076717, 2018. a, b, c, d
Hermann, M., Papritz, L., and Wernli, H.: A Lagrangian analysis of the dynamical and thermodynamic drivers of large-scale Greenland melt events during 1979–2017, Weather Clim. Dynam., 1, 497–518, https://doi.org/10.5194/wcd-1-497-2020, 2020. a
Hersbach, H., Bell, B., Berrisford, P., Hirahara, S., Horányi, A., Muñoz-Sabater, J., Nicolas, J., Peubey, C., Radu, R., Schepers, D., Simmons, A., Soci, C., Abdalla, S., Abellan, X., Balsamo, G., Bechtold, P., Biavati, G., Bidlot, J., Bonavita, M., De Chiara, G., Dahlgren, P., Dee, D., Diamantakis, M., Dragani, R., Flemming, J., Forbes, R., Fuentes, M., Geer, A., Haimberger, L., Healy, S., Hogan, R. J., Hólm, E., Janisková, M., Keeley, S., Laloyaux, P., Lopez, P., Lupu, C., Radnoti, G., de Rosnay, P., Rozum, I., Vamborg, F., Villaume, S., and Thépaut, J. N.: The ERA5 global reanalysis, Q. J. Roy. Meteor. Soc., 146, 1999–2049, https://doi.org/10.1002/qj.3803, 2020. a, b
Hoskins, B. J., McIntyre, M. E., and Robertson, A. W.: On the use and significance of isentropic potential vorticity maps, Q. J. Roy. Meteor. Soc., 111, 877–946, https://doi.org/10.1002/qj.49711147002, 1985. a
Iijima, Y., Nakamura, T., Park, H., Tachibana, Y., and Fedorov, A. N.: Enhancement of Arctic storm activity in relation to permafrost degradation in eastern Siberia, Int. J. Climatol., 36, 4265–4275, https://doi.org/10.1002/joc.4629, 2016. a
Kirbus, B., Tiedeck, S., Camplani, A., Chylik, J., Crewell, S., Dahlke, S., Ebell, K., Gorodetskaya, I., Griesche, H., Handorf, D., Höschel, I., Lauer, M., Neggers, R., Rückert, J., Shupe, M. D., Spreen, G., Walbröl, A., Wendisch, M., and Rinke, A.: Surface impacts and associated mechanisms of a moisture intrusion into the Arctic observed in mid-April 2020 during MOSAiC, Frontiers in Earth Science, 11, https://doi.org/10.3389/feart.2023.1147848, 2023. a, b, c, d, e
Kolbe, M., Bintanja, R., van der Linden, E. C., and Cordero, R. R.: Vertical structure and surface impact of atmospheric rivers reaching antarctic sea ice and land, Atmos. Res., 315, https://doi.org/10.1016/j.atmosres.2024.107841, 2025. a
Komatsu, K. K., Alexeev, V. A., Repina, I. A., and Tachibana, Y.: Poleward upgliding Siberian atmospheric rivers over sea ice heat up Arctic upper air, Scientific Reports, 8, https://doi.org/10.1038/s41598-018-21159-6, 2018. a
Li, L., Cannon, F., Mazloff, M. R., Subramanian, A. C., Wilson, A. M., and Ralph, F. M.: Impact of atmospheric rivers on Arctic sea ice variations, The Cryosphere, 18, 121–137, https://doi.org/10.5194/tc-18-121-2024, 2024. a, b, c
Liu, C. and Barnes, E. A.: Extrememoisture transport into the Arctic linked to Rossby wave breaking, J. Geophys. Res., 120, 3774–3788, https://doi.org/10.1002/2014JD022796, 2015. a, b
Loeb, N. A., Crawford, A., Herrington, A., McCrystall, M., Stroeve, J., and Hanesiak, J.: Projections and Physical Drivers of Extreme Precipitation in Greenland & Baffin Bay, J. Geophys. Res.-Atmos., 129, https://doi.org/10.1029/2024JD041375, 2024. a, b
Ma, W., Wang, H., Chen, G., Leung, L. R., Lu, J., Rasch, P. J., Fu, Q., Kravitz, B., Zou, Y., Cassano, J. J., and Maslowski, W.: The role of interdecadal climate oscillations in driving Arctic atmospheric river trends, Nat. Commun., 15, https://doi.org/10.1038/s41467-024-45159-5, 2024a. a
Ma, W., Wang, H., Chen, G., Qian, Y., Baxter, I., Huo, Y., and Seefeldt, M. W.: Wintertime extreme warming events in the high Arctic: characteristics, drivers, trends, and the role of atmospheric rivers, Atmos. Chem. Phys., 24, 4451–4472, https://doi.org/10.5194/acp-24-4451-2024, 2024b. a, b, c
Ma, W., Wang, H., Zhang, S., Singh, B., Qian, Y., Huo, Y., Feldl, N., and Audette, A.: Quantifying Moisture Sources of Arctic Atmospheric Rivers During the Recent Historical Period, J. Geophys. Res.-Atmos., 130, https://doi.org/10.1029/2025JD043918, 2025. a
Mathews, J. and Czaja, A.: Oceanic maintenance of atmospheric blocking in wintertime in the North Atlantic, Clim. Dynam., 62, 6159–6172, https://doi.org/10.1007/s00382-024-07196-0, 2024. a
Mathews, J. P., Czaja, A., Vitart, F., and Roberts, C.: Gulf Stream Moisture Fluxes Impact Atmospheric Blocks Throughout the Northern Hemisphere, Geophys. Res. Lett., 51, https://doi.org/10.1029/2024GL108826, 2024. a
Mattingly, K. S., Mote, T. L., and Fettweis, X.: Atmospheric River Impacts on Greenland Ice Sheet Surface Mass Balance, J. Geophys. Res.-Atmos., 123, 8538–8560, https://doi.org/10.1029/2018JD028714, 2018. a, b
Mattingly, K. S., Turton, J. V., Wille, J. D., Noël, B., Fettweis, X., Rennermalm, Å. K., and Mote, T. L.: Increasing extreme melt in northeast Greenland linked to foehn winds and atmospheric rivers, Nat. Commun., 14, 1743, https://doi.org/10.1038/s41467-023-37434-8, 2023. a, b
Nash, D., Waliser, D., Guan, B., Ye, H., and Ralph, F. M.: The Role of Atmospheric Rivers in Extratropical and Polar Hydroclimate, J. Geophys. Res.-Atmos., 123, 6804–6821, https://doi.org/10.1029/2017JD028130, 2018. a, b
Neff, W.: Atmospheric rivers melt Greenland, Nat. Clim. Change, 8, 857–858, https://doi.org/10.1038/s41558-018-0297-4, 2018. a, b, c
Nicolaus, M., Perovich, D. K., Spreen, G., Granskog, M. A., von Albedyll, L., Angelopoulos, M., Anhaus, P., Arndt, S., Jakob Belter, H., Bessonov, V., Birnbaum, G., Brauchle, J., Calmer, R., Cardellach, E., Cheng, B., Clemens-Sewall, D., Dadic, R., Damm, E., de Boer, G., Demir, O., Dethloff, K., Divine, D. V., Fong, A. A., Fons, S., Frey, M. M., Fuchs, N., Gabarró, C., Gerland, S., Goessling, H. F., Gradinger, R., Haapala, J., Haas, C., Hamilton, J., Hannula, H. R., Hendricks, S., Herber, A., Heuzé, C., Hoppmann, M., Høyland, K. V., Huntemann, M., Hutchings, J. K., Hwang, B., Itkin, P., Jacobi, H. W., Jaggi, M., Jutila, A., Kaleschke, L., Katlein, C., Kolabutin, N., Krampe, D., Kristensen, S. S., Krumpen, T., Kurtz, N., Lampert, A., Lange, B. A., Lei, R., Light, B., Linhardt, F., Liston, G. E., Loose, B., Macfarlane, A. R., Mahmud, M., Matero, I. O., Maus, S., Morgenstern, A., Naderpour, R., Nandan, V., Niubom, A., Oggier, M., Oppelt, N., Pätzold, F., Perron, C., Petrovsky, T., Pirazzini, R., Polashenski, C., Rabe, B., Raphael, I. A., Regnery, J., Rex, M., Ricker, R., Riemann-Campe, K., Rinke, A., Rohde, J., Salganik, E., Scharien, R. K., Schiller, M., Schneebeli, M., Semmling, M., Shimanchuk, E., Shupe, M. D., Smith, M. M., Smolyanitsky, V., Sokolov, V., Stanton, T., Stroeve, J., Thielke, L., Timofeeva, A., Tonboe, R. T., Tavri, A., Tsamados, M., Wagner, D. N., Watkins, D., Webster, M., and Wendisch, M.: Overview of the MOSAiC expedition: Snow and sea ice, Elementa, 10, https://doi.org/10.1525/elementa.2021.000046, 2022. a
Nixdorf, U., Dethloff, K., Rex, M., Shupe, M., Sommerfeld, A., Perovich, D., Nicolaus, M., Heuzé, C., Rabe, B., Loose, B., Damm, E., Gradinger, R., Fong, A., Maslowski, W., Rinke, A., Kwok, R., Spreen, G., Wendisch, M., Herber, A., Hirsekorn, M., Mohaupt, V., Frickenhaus, S., Immerz, A., Weiss-Tuider, K., König, B., Mengedoht, D., Regnery, J., Gerchow, P., Ransby, D., Krumpen, T., Morgenstern, A., Haas, C., Kanzow, T., Rack, F. R., Saitzev, V., Sokolov, V., Makarov, A., Schwarze, S., Wunderlich, T., Wurr, K., and Boetius, A.: MOSAiC Extended Acknowledgement, Zenodo, https://doi.org/10.5281/zenodo.5541624, 2021. a
Nusbaumer, J. and Noone, D.: Numerical Evaluation of the Modern and Future Origins of Atmospheric River Moisture Over the West Coast of the United States, J. Geophys. Res.-Atmos., 123, 6423–6442, https://doi.org/10.1029/2017JD028081, 2018. a, b
OSI SAF: Global Sea Ice Concentration (netCDF) – DMSP, EUMETSAT SAF on Ocean and Sea Ice, https://doi.org/10.15770/EUM_SAF_OSI_NRT_2004, 2017. a, b
Overland, J. E. and Wang, M.: The 2020 Siberian heat wave, Int. J. Climatol., 41, E2341–E2346, https://doi.org/10.1002/joc.6850, 2021. a, b
Pan, M., Lu, M., and Lall, U.: Diversity of cross-pacific atmospheric river main routes, Communications Earth and Environment, 5, https://doi.org/10.1038/s43247-024-01552-y, 2024. a
Papritz, L., Hauswirth, D., and Hartmuth, K.: Moisture origin, transport pathways, and driving processes of intense wintertime moisture transport into the Arctic, Weather Clim. Dynam., 3, 1–20, https://doi.org/10.5194/wcd-3-1-2022, 2022. a, b
Payne, A. E., Demory, M.-E., Leung, L. R., Ramos, A. M., Shields, C. A., Rutz, J. J., Siler, N., Villarini, G., Hall, A., and Ralph, F. M.: Responses and impacts of atmospheric rivers to climate change, Nature Reviews Earth & Environment, 1, 143–157, https://doi.org/10.1038/s43017-020-0030-5, 2020. a, b
Pfahl, S., Schwierz, C., Croci-Maspoli, M., Grams, C. M., and Wernli, H.: Importance of latent heat release in ascending air streams for atmospheric blocking, Nat. Geosci., 8, 610–614, https://doi.org/10.1038/ngeo2487, 2015. a
Previdi, M., Smith, K. L., and Polvani, L. M.: Arctic amplification of climate change: a review of underlying mechanisms, Environ. Res. Lett., 16, 093003, https://doi.org/10.1088/1748-9326/ac1c29, 2021. a
Ralph, F. M., Iacobellis, S. F., Neiman, P. J., Cordeira, J. M., Spackman, J. R., Waliser, D. E., Wick, G. A., White, A. B., and Fairall, C.: Dropsonde observations of total integrated water vapor transport within North Pacific atmospheric rivers, J. Hydrometeorol., 18, 2577–2596, https://doi.org/10.1175/JHM-D-17-0036.1, 2017. a
Ralph, F. M., Dettinger, M. C. L., Cairns, M. M., Galarneau, T. J., and Eylander, J.: Defining “Atmospheric river”: How the glossary of meteorology helped resolve a debate, B. Am. Meteorol. Soc., 99, 837–839, https://doi.org/10.1175/BAMS-D-17-0157.1, 2018. a
Rinke, A., Cassano, J. J., Cassano, E. N., Jaiser, R., and Handorf, D.: Meteorological conditions during the MOSAiC expedition: Normal or anomalous?, Elementa, 9, https://doi.org/10.1525/elementa.2021.00023, 2021. a
Salimi, S., Helali, J., Lotfi, M., Momenzadeh, H., Hosseini, S. A., Asaadi Oskuei, E., Izadi, A., Yarmoradi, Z., and Bakhshi, I.: Investigating the origin and pathways of atmospheric rivers in the world, Theor. Appl. Climatol., 142, 165–175, https://doi.org/10.1007/s00704-020-03299-w, 2020. a
Serreze, M. C. and Barry, R. G.: Processes and impacts of Arctic amplification: A research synthesis, Global Planet. Change, 77, 85–96, https://doi.org/10.1016/j.gloplacha.2011.03.004, 2011. a
Serreze, M. C., Barrett, A. P., and Stroeve, J.: Recent changes in tropospheric water vapor over the Arctic as assessed from radiosondes and atmospheric reanalyses, J. Geophys. Res.-Atmos., 117, https://doi.org/10.1029/2011JD017421, 2012. a
Shupe, M. D., Rex, M., Dethloff, K., Damm, E., Fong, A. A., Gradinger, R., Heuzé, C., Loose, B., Makarov, A., Maslowski, W., Nicolaus, M., Perovich, D., Rabe, B., Rinke, A., Sokolov, V., and Sommerfeld, A.: Arctic Report Card 2020: The MOSAiC Expedition: A Year Drifting with the Arctic Sea Ice, Tech. rep., https://doi.org/10.25923/9g3v-xh92, 2020. a
Shupe, M. D., Rex, M., Blomquist, B., G. Persson, P. O., Schmale, J., Uttal, T., Althausen, D., Angot, H., Archer, S., Bariteau, L., Beck, I., Bilberry, J., Bucci, S., Buck, C., Boyer, M., Brasseur, Z., Brooks, I. M., Calmer, R., Cassano, J., Castro, V., Chu, D., Costa, D., Cox, C. J., Creamean, J., Crewell, S., Dahlke, S., Damm, E., de Boer, G., Deckelmann, H., Dethloff, K., Dütsch, M., Ebell, K., Ehrlich, A., Ellis, J., Engelmann, R., Fong, A. A., Frey, M. M., Gallagher, M. R., Ganzeveld, L., Gradinger, R., Graeser, J., Greenamyer, V., Griesche, H., Griffiths, S., Hamilton, J., Heinemann, G., Helmig, D., Herber, A., Heuzé, C., Hofer, J., Houchens, T., Howard, D., Inoue, J., Jacobi, H. W., Jaiser, R., Jokinen, T., Jourdan, O., Jozef, G., King, W., Kirchgaessner, A., Klingebiel, M., Krassovski, M., Krumpen, T., Lampert, A., Landing, W., Laurila, T., Lawrence, D., Lonardi, M., Loose, B., Lüpkes, C., Maahn, M., Macke, A., Maslowski, W., Marsay, C., Maturilli, M., Mech, M., Morris, S., Moser, M., Nicolaus, M., Ortega, P., Osborn, J., Pätzold, F., Perovich, D. K., Petäjä, T., Pilz, C., Pirazzini, R., Posman, K., Powers, H., Pratt, K. A., Preußer, A., Quéléver, L., Radenz, M., Rabe, B., Rinke, A., Sachs, T., Schulz, A., Siebert, H., Silva, T., Solomon, A., Sommerfeld, A., Spreen, G., Stephens, M., Stohl, A., Svensson, G., Uin, J., Viegas, J., Voigt, C., von der Gathen, P., Wehner, B., Welker, J. M., Wendisch, M., Werner, M., Xie, Z. Q., and Yue, F.: Overview of the MOSAiC expedition: Atmosphere, Elementa, 10, https://doi.org/10.1525/elementa.2021.00060, 2022. a
Sprenger, M. and Wernli, H.: The LAGRANTO Lagrangian analysis tool – version 2.0, Geosci. Model Dev., 8, 2569–2586, https://doi.org/10.5194/gmd-8-2569-2015, 2015. a
Steinfeld, D. and Pfahl, S.: The role of latent heating in atmospheric blocking dynamics: a global climatology, Clim. Dynam., 53, 6159–6180, https://doi.org/10.1007/s00382-019-04919-6, 2019. a, b
Svensson, G., Murto, S., Shupe, M. D., Pithan, F., Magnusson, L., Day, J. J., Doyle, J. D., Renfrew, I. A., Spengler, T., and Vihma, T.: Warm air intrusions reaching the MOSAiC expedition in April 2020 – The YOPP targeted observing period (TOP), Elementa, 11, https://doi.org/10.1525/elementa.2023.00016, 2023. a, b, c, d, e
Thaker, R., Vavrus, S. J., Shields, C. A., DuVivier, A. K., Maclennan, M., Holland, M. M., and Landrum, L.: Arctic Atmospheric Rivers in a Changing Climate and the Impacts on Sea Ice, J. Geophys. Res.-Atmos., 130, https://doi.org/10.1029/2024JD042521, 2025. a, b, c
Tonboe, R. and Lavelle, J.: The EUMETSAT OSI SAF Sea Ice Concentration Algorithm Algorithm Theoretical Basis Document Documentation Change Record, Tech. rep., The Ocean and Sea Ice Satellite Application Facility, https://osisaf-hl.met.no/sites/osisaf-hl.met.no/files/baseline_document/osisaf_cdop2_ss2_atbd_amsr2-sea-ice-conc_v1p1.pdf (last access: 1 August 2025), 2016. a
Waling, A., Herrington, A., Duderstadt, K., Dibb, J., and Burakowski, E.: Using variable-resolution grids to model precipitation from atmospheric rivers around the Greenland ice sheet, Weather Clim. Dynam., 5, 1117–1135, https://doi.org/10.5194/wcd-5-1117-2024, 2024. a, b
Wang, Z., Ding, Q., Wu, R., Ballinger, T. J., Guan, B., Bozkurt, D., Nash, D., Baxter, I., Topál, D., Li, Z., Huang, G., Chen, W., Chen, S., Cao, X., and Chen, Z.: Role of atmospheric rivers in shaping long term Arctic moisture variability, Nat. Commun., 15, 5505, https://doi.org/10.1038/s41467-024-49857-y, 2024. a, b, c, d, e
Wille, J. D., Favier, V., Dufour, A., Gorodetskaya, I. V., Turner, J., Agosta, C., and Codron, F.: West Antarctic surface melt triggered by atmospheric rivers, Nat. Geosci., 12, 911–916, https://doi.org/10.1038/s41561-019-0460-1, 2019. a
Woods, C. and Caballero, R.: The role of moist intrusions in winter arctic warming and sea ice decline, J. Climate, 29, 4473–4485, https://doi.org/10.1175/JCLI-D-15-0773.1, 2016. a
Woods, C., Caballero, R., and Svensson, G.: Large-scale circulation associated with moisture intrusions into the Arctic during winter, Geophys. Res. Lett., 40, 4717–4721, https://doi.org/10.1002/grl.50912, 2013. a, b
Xiong, W., Tang, G., Wang, T., Ma, Z., and Wan, W.: Evaluation of IMERG and ERA5 Precipitation‐Phase Partitioning on the Global Scale, Water (Switzerland), 14, https://doi.org/10.3390/w14071122, 2022. a
Yadav, J., Kumar, A., and Mohan, R.: Dramatic decline of Arctic sea ice linked to global warming, Nat. Hazards, 103, 2617–2621, https://doi.org/10.1007/s11069-020-04064-y, 2020. a
Yamamoto, A., Nonaka, M., Martineau, P., Yamazaki, A., Kwon, Y.-O., Nakamura, H., and Taguchi, B.: Oceanic moisture sources contributing to wintertime Euro-Atlantic blocking, Weather Clim. Dynam., 2, 819–840, https://doi.org/10.5194/wcd-2-819-2021, 2021. a
Zhang, P., Chen, G., Ting, M., Ruby Leung, L., Guan, B., and Li, L.: More frequent atmospheric rivers slow the seasonal recovery of Arctic sea ice, Nat. Clim. Change, 13, 266–273, https://doi.org/10.1038/s41558-023-01599-3, 2023. a, b, c, d, e
Zhang, P., Taylor, P. C., Webster, M., Bailey, D. A., Ding, Q., and Li, L.: Unraveling Arctic Sea Ice Response to Atmospheric Rivers – Insights From Sea Ice Modeling, Geophys. Res. Lett., 52, https://doi.org/10.1029/2025GL115152, 2025. a
Zhu, Y. and Newell, R. E.: A Proposed Algorithm for Moisture Fluxes from Atmospheric Rivers, Mon. Weather Rev., 126, 725–735, https://doi.org/10.1175/1520-0493(1998)126<0725:APAFMF>2.0.CO;2, 1998. a