the Creative Commons Attribution 4.0 License.
the Creative Commons Attribution 4.0 License.
 | 03 Jul 2026
Atmospheric blocking representation in storm-resolving climate models under historical and future forcing
Edgar Dolores-Tesillos
Olivia Martius
Stephan Pfahl
Atmospheric blocking is a key driver of midlatitude weather extremes, including heatwaves and cold spells. Yet general circulation models (GCMs) struggle to capture the frequency, persistence, and spatial characteristics of blocking. Here, we evaluate atmospheric blocking in next-generation storm-resolving Earth system models from the nextGEMS, EERIE, and DestinE projects, focusing on ICON and IFS-FESOM with ∼ 10 km atmospheric and ∼ 5 km ocean grid spacing. We also provide first insights into the IFS-FESOM under SSP3-7.0 forcing.
Blocking frequency, duration, and size are assessed in historical simulations spanning 30 years for IFS and 27 years for ICON, relative to ERA5 reanalysis and a CMIP6 multi-model ensemble of eight models. We further examine links between blocking biases and the background flow, sea surface temperatures (SSTs), and storm-track activity. In the CMIP6 ensemble, persistent biases in blocking frequency, duration, and spatial extent are evident, particularly over the Euro-Atlantic sector, consistent with previous studies. Several of these biases persist in the storm-resolving coupled simulations or are even amplified, indicating that increased horizontal resolution alone does not systematically improve blocking representation. Among the storm-resolving models, performance varies regionally and seasonally. ICON exhibits larger winter biases, including overly zonal jets and an underestimation of Euro-Atlantic blocking compared to IFS. The coupled IFS configuration shows intermediate performance, reproducing some aspects of blocking variability but retaining substantial biases associated with SST errors and jet structure. In contrast, the atmosphere-only IFS simulation (IFS AMIP), which is forced with observed SSTs, reproduces blocking frequency and jet structure more realistically over both the North Atlantic and North Pacific. This highlights the strong sensitivity of blocking to sea surface temperatures and ocean–atmosphere coupling, and underscores the importance of realistic SST boundary conditions for improving blocking representation.
Under SSP3-7.0 forcing, IFS projects reduced winter blocking at high latitudes (e.g., northern Europe) and reduced summer blocking frequency over the North Atlantic, northern Europe, and Russia. Changes in magnitude, spatial pattern, and persistence are often of the same order as the model biases, indicating that projected blocking responses are difficult to disentangle from systematic errors related to jet structure, SST biases, and storm-track activity.
Overall, storm-resolving models show local improvements in blocking representation, particularly when forced with realistic SSTs. However, coupled simulations still exhibit large biases, underlining the need for further development of ocean–atmosphere coupling representation. These findings highlight both the potential and the current limitations of storm-resolving models for simulating and projecting persistent weather extremes in a warming climate.
- Article
(18434 KB) - Full-text XML
-
Supplement
(2873 KB) - BibTeX
- EndNote


Extratropical cyclones and atmospheric blocking are key drivers of midlatitude weather variability. While extratropical cyclones are fast-moving low-pressure systems that bring stormy conditions, atmospheric blocking refers to quasi-stationary, long-lived high-pressure systems that disrupt the typical west-to-east movement of weather systems (Elliott and Smith, 1949; Rex, 1950; Namias, 1964). By persistently deflecting storm-tracks, blocking can maintain extreme conditions such as prolonged heatwaves in summer or cold spells in winter (e.g., Kautz et al., 2022). These events have severe socio-economic impacts, affecting sectors such as energy, agriculture, and public health, making their accurate simulation a priority for climate modeling (e.g., Planchon et al., 2015; Grams et al., 2017; Ormanova et al., 2020; Ackerley et al., 2025).
However, CMIP5 and CMIP6 general circulation models (GCMs) struggle to reproduce key characteristics of atmospheric blocking, including its frequency, location, and duration (e.g., Schiemann et al., 2017, 2020). CMIP6 models, in particular, continue to underestimate blocking frequency in critical regions such as the Euro-Atlantic sector (Dolores-Tesillos et al., 2025). These biases degrade the skill of climate projections, especially regarding the persistence of high-impact weather regimes (Davini and D’Andrea, 2016). Several interacting factors are thought to contribute to these deficiencies, including both model-related aspects and physical processes of the climate system. Model-related aspects include (1) coarse horizontal resolution and (2) simplified parameterizations of moist diabatic processes, which influence the representation of key physical processes such as (3) storm-track (transient eddy) activity, (4) the large-scale jet waveguide (mean flow), and (5) sea surface temperatures (SSTs) and air–sea coupling. These factors are strongly interdependent and jointly affect the simulation of atmospheric blocking (Woollings et al., 2018; Dolores-Tesillos et al., 2025; Woollings et al., 2025).
First, horizontal resolution strongly affects the representation of synoptic-scale eddies, orography, and sharp gradients in the jet, all of which are essential for blocking dynamics (e.g., Shutts, 1983; Berckmans et al., 2013). Insufficient resolution can lead to overly zonal mean flows, muted Rossby wave breaking, and reduced variability in the upper-tropospheric circulation, thereby suppressing the formation and persistence of blocking events (Davini et al., 2017).
Second, storm-track biases influence blocking through their control on transient eddy forcing. Errors in storm-track intensity, position, or variability can weaken ridge amplification, alter eddy-mean flow feedbacks, or modify the supply of wave activity needed to initiate and sustain blocking (Zappa et al., 2014; Cheung et al., 2023; Dolores-Tesillos et al., 2025).
Third, the representation of the jet waveguide, which governs Rossby wave propagation in the large-scale flow, is critical for blocking dynamics. The latitude, strength, and curvature of the jet determine where Rossby wave packets can propagate (Wirth et al., 2018), break, or become trapped (Nakamura and Huang, 2018). Blocking tends to form preferentially in regions where the waveguide weakens and the flow becomes diffluent (e.g., Shutts, 1983; Nakamura and Huang, 2018), conditions that can be misrepresented in climate model simulations (Dolores-Tesillos et al., 2025). Biases in jet structure can therefore precondition the flow toward either enhanced or suppressed blocking, independent of storm-track activity.
Fourth, SST biases and air–sea coupling influence blocking indirectly by modulating baroclinicity, jet structure, and storm-track behavior (Athanasiadis et al., 2022; Cheung et al., 2023). SST gradients affect the thermal wind balance, while absolute SST anomalies alter surface heat fluxes, static stability, and moisture availability (e.g., Hermoso et al., 2024; Wills et al., 2024). The atmospheric response to SST biases depends on their spatial structure and on the background climatological state, including the mean position of the storm tracks. Consequently, SST anomalies do not exert a uniform influence across ocean basins or seasons. Sensitivity of blocking to tropical and extratropical SST anomalies has been documented in previous studies (e.g., Hinton et al., 2009; Scaife et al., 2011; Athanasiadis et al., 2022).
Finally, moist diabatic processes, particularly latent heat release associated with cloud formation in warm conveyor belts, are increasingly recognized as essential for blocking onset and maintenance (Steinfeld and Pfahl, 2019; Steinfeld et al., 2020; Dolores-Tesillos et al., 2025). The influence of diabatic heating on midlatitude circulation is expected to increase in a warming climate (e.g., Dolores-Tesillos et al., 2022; Dolores-Tesillos and Pfahl, 2024; Steinfeld et al., 2022), yet these processes remain challenging to represent accurately in global climate models due to limitations in both resolution and parameterizations (e.g., Dolores-Tesillos et al., 2025).
Recent studies have shown that increasing horizontal resolution has the potential to improve storm-track and blocking representation by better capturing orography, jet structure, warm conveyor belts, and transient eddies (Berckmans et al., 2013; Willison et al., 2013; Schemm, 2023; De Luca et al., 2024; Takasuka et al., 2024; Gao et al., 2025). Atmospheric blocking is strongly influenced by the interaction between large-scale flow, transient eddies, and diabatic processes, all of which depend sensitively on the representation of these features. Storm-resolving climate models therefore provide a unique framework to explicitly test these processes. By operating at kilometre-scale resolution, they substantially reduce the reliance on deep convection parameterizations, resolve mesoscale SST gradients and frontal structures, and represent transient eddies, jet curvature, and diabatic processes associated with warm conveyor belts more realistically (e.g., Vivant et al., 2025). Initial evaluations of kilometre-scale global simulations indicate promising improvements in the representation of several processes relevant to the large-scale circulation, including mesoscale precipitation structures, extreme rainfall, and orographic forcing (e.g., Wille et al., 2025; Brunner et al., 2025; Poujol et al., 2025). For instance, Wille et al. (2025) demonstrated that storm-resolving models can outperform conventional CMIP-class models in simulating precipitation extremes. The much finer representation of topography and mesoscale dynamics may also improve the simulation of planetary-scale waves and the background flow. These improvements directly target key mechanisms underlying blocking onset, maintenance, and decay, which are only partially captured in conventional CMIP-class models. As such, storm-resolving simulations offer an opportunity not only to assess whether increased resolution improves blocking statistics, but also to diagnose which processes remain limiting factors when resolution-related constraints are relaxed. However, the extent to which these improvements translate into a more realistic representation of atmospheric blocking remains unclear, particularly in fully coupled configurations where biases of SST, storm-tracks, and moist processes interact nonlinearly. Understanding whether storm-resolving models meaningfully reduce blocking biases, or instead reveal additional sensitivities related to the representation of the mean state, large-scale circulation, or coupled processes, is therefore a critical step for advancing blocking theory and climate projection credibility.
This study investigates atmospheric blocking in the Northern Hemisphere using storm-resolving simulations from the nextGEMS, EERIE, and DestinE projects. We analyze historical and SSP3-7.0 simulations with the Integrated Forecasting System coupled to the Finite-volumE Sea ice–Ocean Model (IFS-FESOM) and the ICOsahedral Non-hydrostatic model (ICON), comparing them against ERA5 and CMIP6 models. We assess the influence of model resolution, ocean forcing, and large-scale dynamics on blocking characteristics during both winter and summer.
We aim to answer the following research questions:
-
How does horizontal resolution influence the simulation of atmospheric blocking frequency, duration, and spatial structure in storm-resolving models compared to traditional CMIP6 models?
-
What are the key drivers of biases in blocking representation, including the roles of background flow characteristics, storm-track activity, sea surface temperatures?
-
What insights do storm-resolving simulations provide into potential changes in blocking characteristics under future warming (SSP3-7.0)?
This manuscript is organized as follows. Section 2 describes the data sources and simulation setup. Section 3 presents the methodology used for identifying and characterizing blocking events and capturing storm-track activity. The main results are presented in Sect. 4, followed by a discussion of the key findings in Sect. 5. Finally, Sect. 6 summarizes the conclusions and outlines future research directions.
The main data source is the nextGEMS project (Segura et al., 2025), which has developed a new generation of global storm-resolving Earth system models. The first modeling cycle included simulations with the ICOsahedral Non-hydrostatic model (ICON) and the Integrated Forecasting System coupled to the Finite-VolumE Sea ice–Ocean Model (IFS-FESOM), as described by Hohenegger et al. (2023) and Rackow et al. (2025), respectively. All simulation data are publicly available via the World Data Center for Climate (Koldunov et al., 2023; Wieners et al., 2024). Table 1 provides an overview of all simulations analyzed in this study.
Table 1Overview of storm-resolving simulations performed with the ICON and IFS-FESOM (IFS) models. Simulations distributed through the Climate DT (Destination Earth) initiative are marked with *. IFS SSP3-7.0 simulation is shared between nextGEMS and Climate DT. ΔxA and ΔxO denote the atmospheric and oceanic horizontal grid spacing, respectively. “Observed SST/SIC” refers to prescribed sea surface temperatures and sea ice concentrations based on observations.
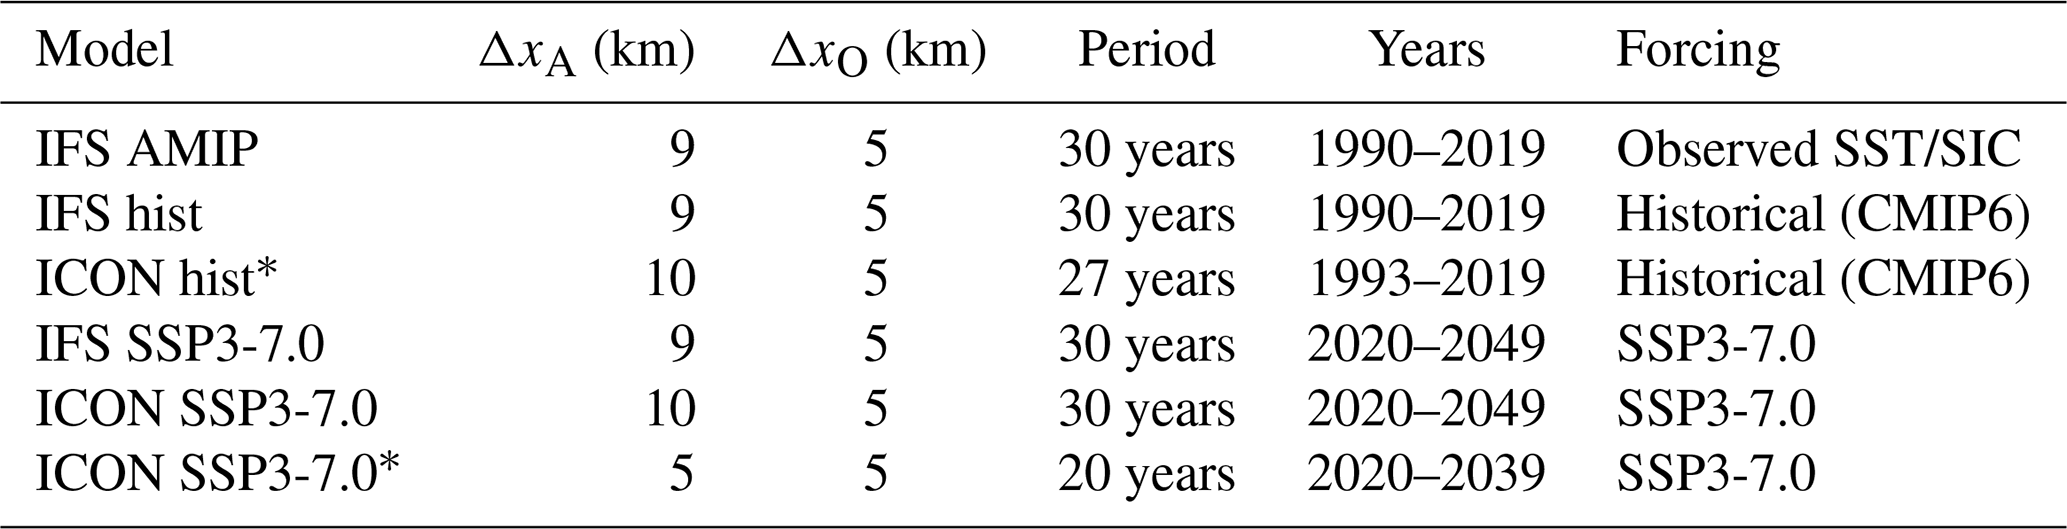
The ICON and IFS-FESOM models used in the nextGEMS project are fully coupled Earth system models (atmosphere, ocean, sea ice, and land) operating at kilometre-scale resolution with an energetically consistent climate (Segura et al., 2025). An energetically consistent climate is defined by Segura et al. (2025) as the state of a model consistent with the conservation of mass and energy with a top-of-the-atmosphere (TOA) energy balance close to 0 and no near surface temperature drift. This was one key achievement of the nextGEMS project. The control runs initially had strong drift towards cold or warm climates. By modifying cloud properties, the energetically consistent climate was achieved. Although capable of including additional components such as the carbon cycle and aerosols, the simulations used in this study were performed without these Earth system extensions. We refer to ICON and IFS-FESOM as storm-resolving Earth system models because their atmospheric horizontal grid spacing (approximately 5–10 km) lies within the range commonly considered sufficient to explicitly resolve the mesoscale structure of extratropical cyclones and storm-track dynamics. Global simulations at grid spacings of order 10 km or finer have been shown to capture key aspects of storm structure and evolution (Hohenegger et al., 2023), although more restrictive thresholds (e.g., ∼ 4 km) are often adopted for fully convection-resolving models (Prein et al., 2015).
A key distinction between both models lies in their treatment of moist convection. In ICON, deep convection is explicitly resolved, with the deep convection parameterization switched off. In contrast, IFS-FESOM continues to use a semi-parameterized approach to convection. Deep, shallow, and mid-level convection are represented using a mass-flux scheme in which the cloud-base mass flux is derived from a modified Convective Available Potential Energy (CAPE) closure (Rackow et al., 2025).
In addition to the nextGEMS simulations, we analyze an atmosphere-only IFS simulation from the European Eddy-Rich Earth-System Models (EERIE) project (https://eerie-project.eu/, last access: 20 December 2025). The EERIE project aims to assess the role of ocean mesoscale processes in modulating climate variability from seasonal to centennial scales. The IFS AMIP simulation uses the same atmospheric configuration as the IFS-FESOM setup but is forced with prescribed sea surface temperatures (SSTs) and sea ice concentrations (SICs) from ESA-CCI v3 (Embury et al., 2024). This configuration is particularly useful for isolating the impact of air–sea coupling on large-scale atmospheric circulation (e.g., Gates et al., 1999; Eyring et al., 2016; Ackerley et al., 2018; Priestley et al., 2023).
Two ICON simulations used in this study are retrieved from the Climate Change Adaptation Digital Twin of the Destination Earth initiative (https://destination-earth.eu/, last access: 20 December 2025), which aims to develop operational, multi-decadal, storm-resolving simulations to support climate change impact assessments and adaptation planning at local to regional scales (Hoffmann et al., 2023; Sandu, 2024). These simulations follow the nextGEMS configuration and are marked in Table 1 with an asterisk (*).
Regarding simulation periods and forcings, the historical simulations cover 1990–2019 (IFS hist) and 1993–2019 (ICON hist) and follow the CMIP6 historical forcing protocol. Future simulations (ICON fut, IFS fut) span 2020–2049 and use greenhouse gas concentrations – including ozone – prescribed by the CMIP6 SSP3-7.0 scenario (O'Neill et al., 2016). Note that most of the multidecadal simulations cover 30 years, which is expected to be sufficient for capturing natural variability and identifying robust blocking signatures (Gao et al., 2025).
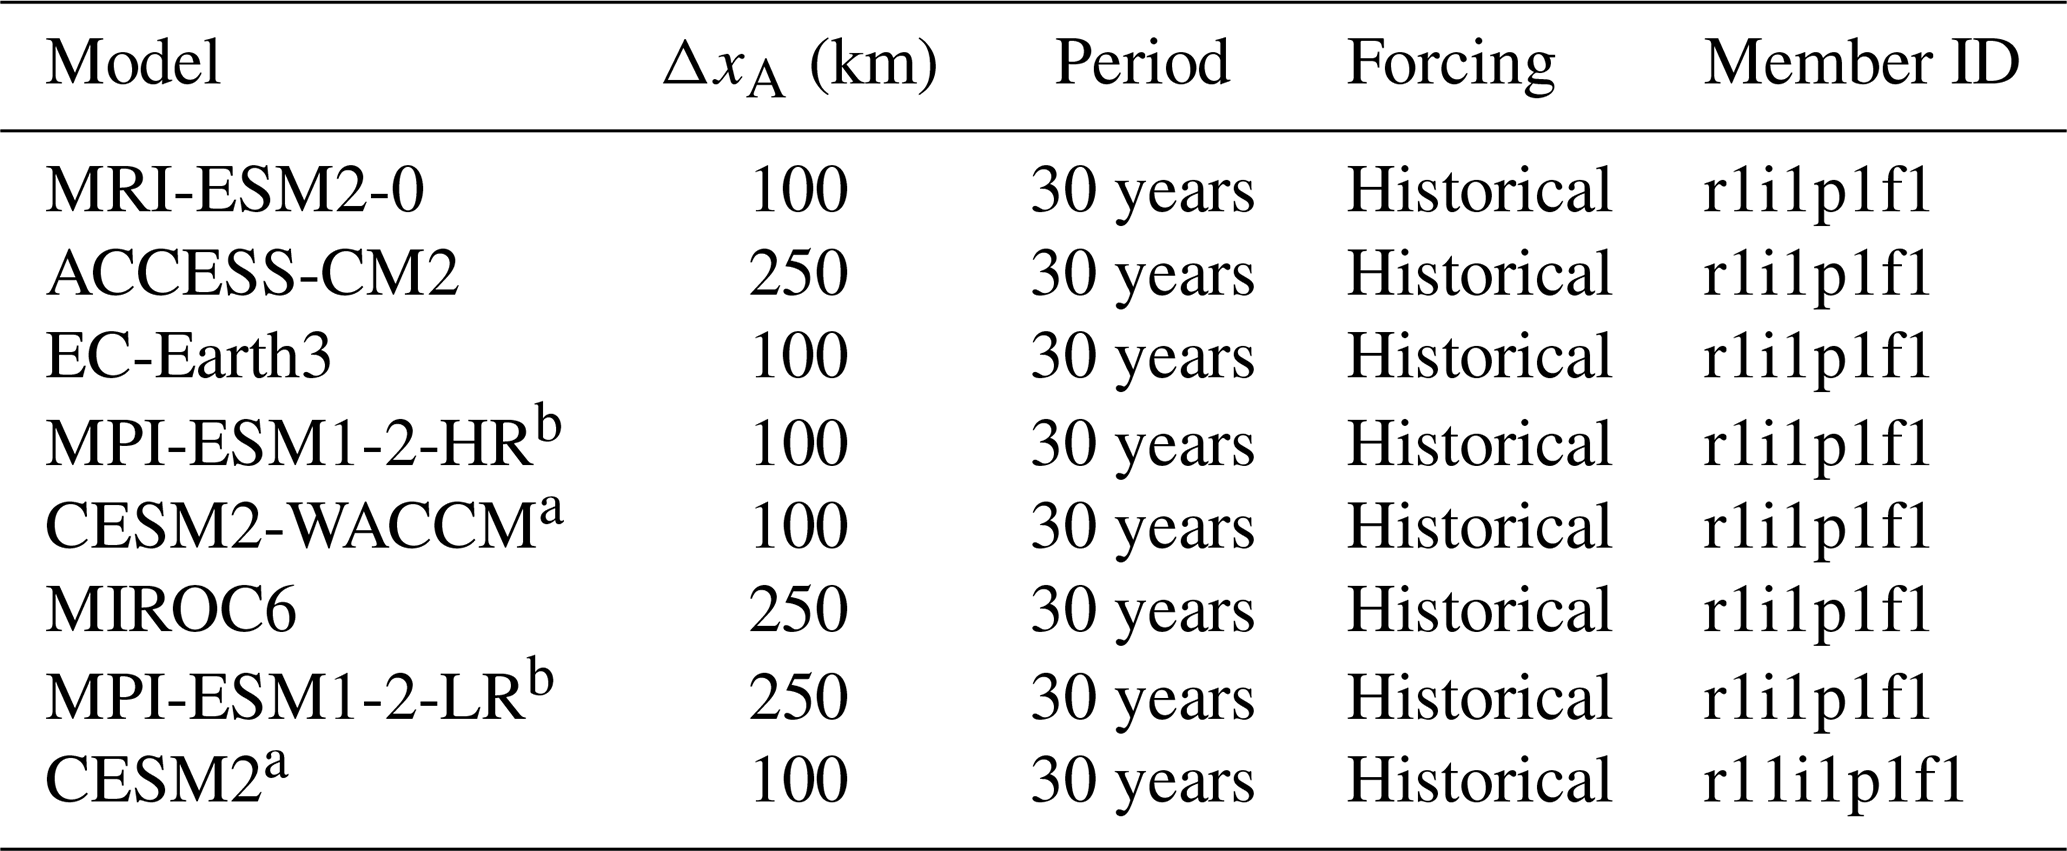
The ability of the nextGEMS simulations to reproduce large-scale circulation patterns is evaluated against ERA5 reanalysis data (Hersbach et al., 2020) for the period 1990–2019. To contextualize the performance of storm-resolving models within the broader climate modeling landscape, we additionally analyze simulations from eight CMIP6 models (Table 2) covering the historical period 1985–2014. This subset of CMIP6 models was selected to ensure consistency with our previous analysis of Euro-Atlantic blocking (Dolores-Tesillos et al., 2025) and based on their documented overall performance within the CMIP6 ensemble (Palmer et al., 2023). For consistency across datasets, all relevant variables are remapped to a common 1° × 1° spatial resolution prior to blocking identification.
Table 2List of CMIP6 models used in this study, including their horizontal grid spacing (ΔxA), simulation period, forcing, and member ID. Models marked with a or b share components or dependencies, as discussed in Brunner et al. (2020). The member ID encodes simulation variants based on realization, initialization, physics, and forcing configuration.
The simulations analysed in this study originate from two closely related European initiatives: nextGEMS and the Climate Change Adaptation Digital Twin (Climate DT) of Destination Earth (Doblas-Reyes et al., 2026). The Climate DT builds directly on developments from the nextGEMS project, including shared model configurations and, in some cases, identical simulations. In particular, the IFS–FESOM SSP3-7.0 simulation analysed here was originally produced within the nextGEMS framework and is also distributed through the Climate DT data portal. For ICON, both nextGEMS and Climate DT provide SSP3-7.0 simulations with comparable model configurations; however, the Climate DT ICON simulation analysed here employs a higher atmospheric horizontal resolution than its nextGEMS counterpart.
In addition to the IFS–FESOM configuration, the Climate DT initiative also includes simulations based on the IFS–NEMO coupled model. These simulations are not analysed in the present study because, at the time of analysis, they did not yet provide a sufficiently long and continuous temporal coverage to support a robust assessment of atmospheric blocking statistics. To improve transparency, simulations distributed through the Climate DT are explicitly marked in Table 1.
3.1 Blocking identification and tracking
3.1.1 Anomaly-based index (ANOM)
The ANOM index is calculated following the approach of Woollings et al. (2018), consistent with earlier studies (e.g., Schwierz et al., 2004). It identifies blocking by tracking anomalies in the 500 hPa geopotential height field (Z500). The methodology consists of the following steps:
-
A daily climatology is computed as the mean Z500 for each calendar day across each decadal baseline period (e.g., 1990–1999, 2000–2009, and 2010–2019), thereby removing interannual variability and long-term trends. A 31 d running mean is then applied to the daily Z500 data within each decade to smooth short-term fluctuations.
-
Anomalies are obtained by subtracting the decadal climatology from the corresponding daily Z500 values.
-
To remove high-frequency variability, the anomaly fields are smoothed using a 2 d running mean. A blocking threshold is then defined as the 90th percentile of Z500 anomalies over the 50–80° N latitude band.
-
Candidate blocking events are identified when the anomaly exceeds this threshold. These events must also satisfy persistence and quasi-stationarity criteria, requiring a spatial overlap of at least 50 % between consecutive days for a minimum duration of 5 d.
3.1.2 Absolute index (ABS)
Instantaneous blocks (IBs) are identified based on reversals in the meridional geopotential height gradient, following the method of Brunner and Steiner (2017) and consistent with previous work (e.g., Tibaldi and Molteni, 1990; Scherrer et al., 2006; Davini and D’Andrea, 2016; Rohrer et al., 2018). Three meridional geopotential height gradients are computed at each longitude λ and central latitude ϕ, representing the gradients to the north, to the south, and on the equatorward flank of the flow. Physically, these gradients are designed to diagnose a reversal of the typical midlatitude geopotential height gradient associated with westerly flow, which is a defining characteristic of atmospheric blocking:
For the Northern Hemisphere, a grid point is classified as blocked if it satisfies the following conditions:
Specifically, ΔZN represents the gradient between the central latitude and the region to its north, ΔZS the gradient between the central latitude and the region to its south, and ΔZE the gradient on the equatorward side, ensuring the presence of enhanced heights south of the block center. Here, λ spans longitudes from 180° W to 179° E, and ϕ latitudes from 75° S to 75° N. Gradients are calculated using Δϕ = 15°. Following previous studies (e.g., Tibaldi and Molteni, 1990; Davini et al., 2012; Prodhomme et al., 2016; Davini and D'Andrea, 2020), no temporal or spatial filtering is applied to the instantaneous blocking field. This ensures a larger sample size and preserves the detailed spatial structure of blocking events. Notably, results remain qualitatively similar when filtering is applied, as discussed in Davini and D'Andrea (2020).
3.2 Blocking metrics
To characterize blocking events, we compute several metrics from the identified blocking fields. Frequency is defined as the number of blocked days per season or year at each grid point, providing spatial and temporal information on blocking occurrence. Duration refers to the total length of each blocking episode, while size denotes the spatial extent of the blocking pattern, calculated as the physical area (in km2) of all contiguous grid points meeting the blocking criteria, with variations in grid-box size by latitude accounted for. These metrics allow for a comprehensive comparison of blocking characteristics across models and scenarios. Analyses are presented for the winter and summer seasons: December to February (DJF) and June to August (JJA). Blocking statistics are evaluated over two broad longitudinal sectors of the Northern Hemisphere, referred to here as the North Atlantic (ATL) and North Pacific (PAC) regions. These domains are defined following Schiemann et al. (2020) and encompass both oceanic and adjacent continental areas, rather than being restricted strictly to the ocean basins. This choice allows for a consistent comparison with previous blocking climatologies and ensures that continental blocking regimes, such as Ural blocking, are adequately represented, particularly during boreal summer. The exact longitudinal bounds of each domain are for 50–90° N, −90 to 90° E (ATL) and 40–90° N, 120–240° E (PAC).
3.3 Storm-tracks
To quantify synoptic-scale weather variability, we apply a Lanczos bandpass filter (2–6 d) to daily geopotential height at 500 hPa (Hoskins and Hodges, 2002; Greeves et al., 2007; Davini et al., 2017). The resulting bandpass-filtered fields are denoted by a prime (′). Storm-tracks are identified based on the standard deviation of the filtered geopotential height (), which serves as a proxy for the intensity, frequency, and location of transient eddies.
Storm-track intensity is computed seasonally for boreal winter (DJF) and summer (JJA), providing insight into the spatial and temporal variability of synoptic activity across different models and time periods.
4.1 Northern Hemisphere winter blocking
In this section, we compare blocking frequency, duration, and size in multidecadal storm-resolving simulations (IFS AMIP, IFS hist, and ICON hist) with the CMIP6 multi-model mean and the ERA5 reanalysis. Our focus is on Northern Hemisphere winter (DJF), using the ANOM index to highlight robust and spatially coherent biases. Additional results for the ABS index are provided in the Supplement (Figs. S1 and S2). The Northern Hemisphere summer season (JJA) is discussed in the next section.
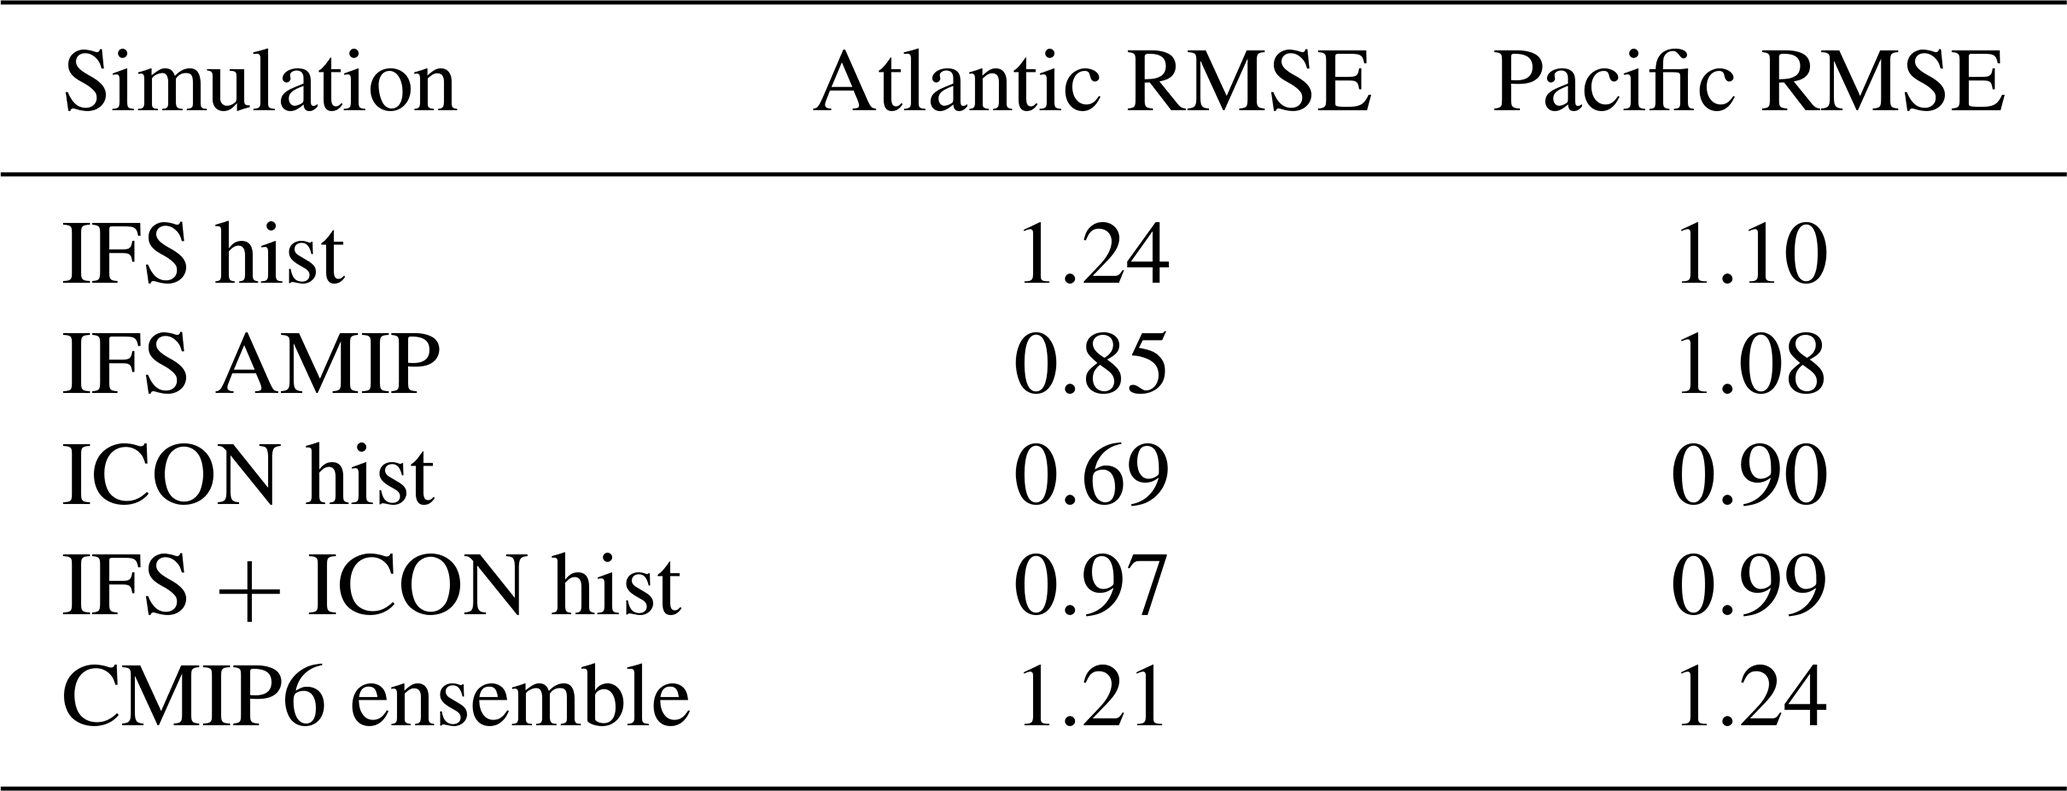
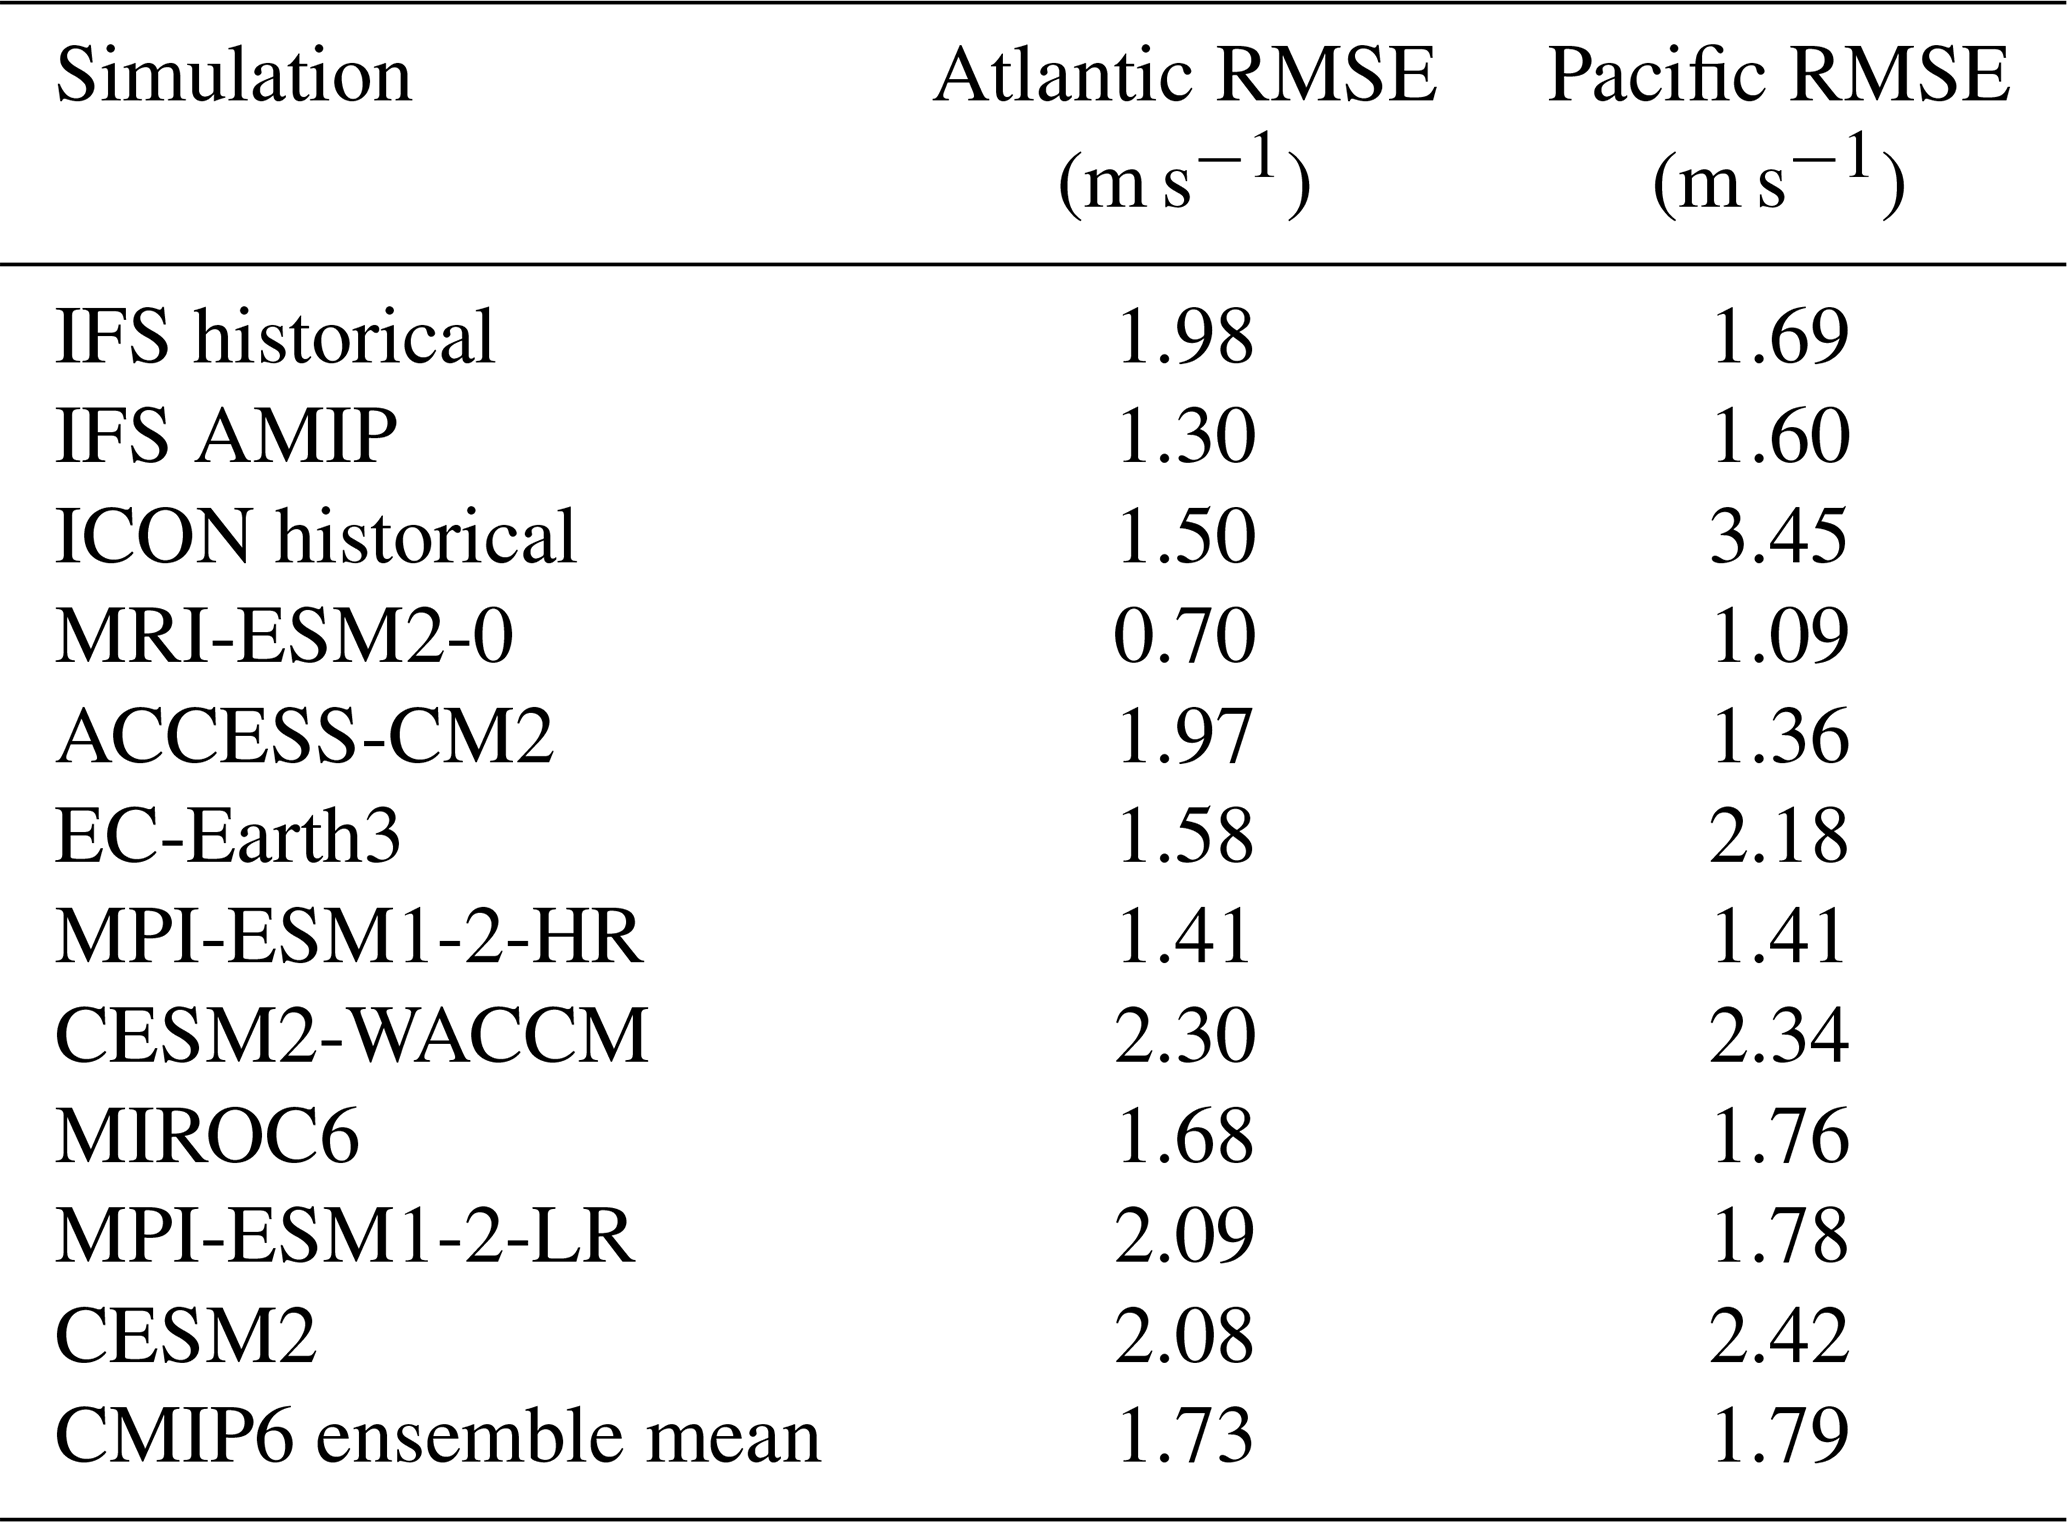
Figure 1 shows DJF blocking frequency biases relative to ERA5. IFS simulations reduce the underestimation of blocking in the North Atlantic found in CMIP6 by about 10 % (Fig. 1a, b, d). However, this improvement comes at the cost of an overestimation in other regions, including the Pacific and continental sectors. The RMSE values in Table 3 confirm that IFS AMIP and IFS hist outperform the CMIP6 ensemble in the North Atlantic. Note that comparing IFS AMIP with CMIP6 is not fully fair, since the AMIP run uses observed SSTs, whereas the CMIP6 results are taken from coupled simulations that include an ocean model.
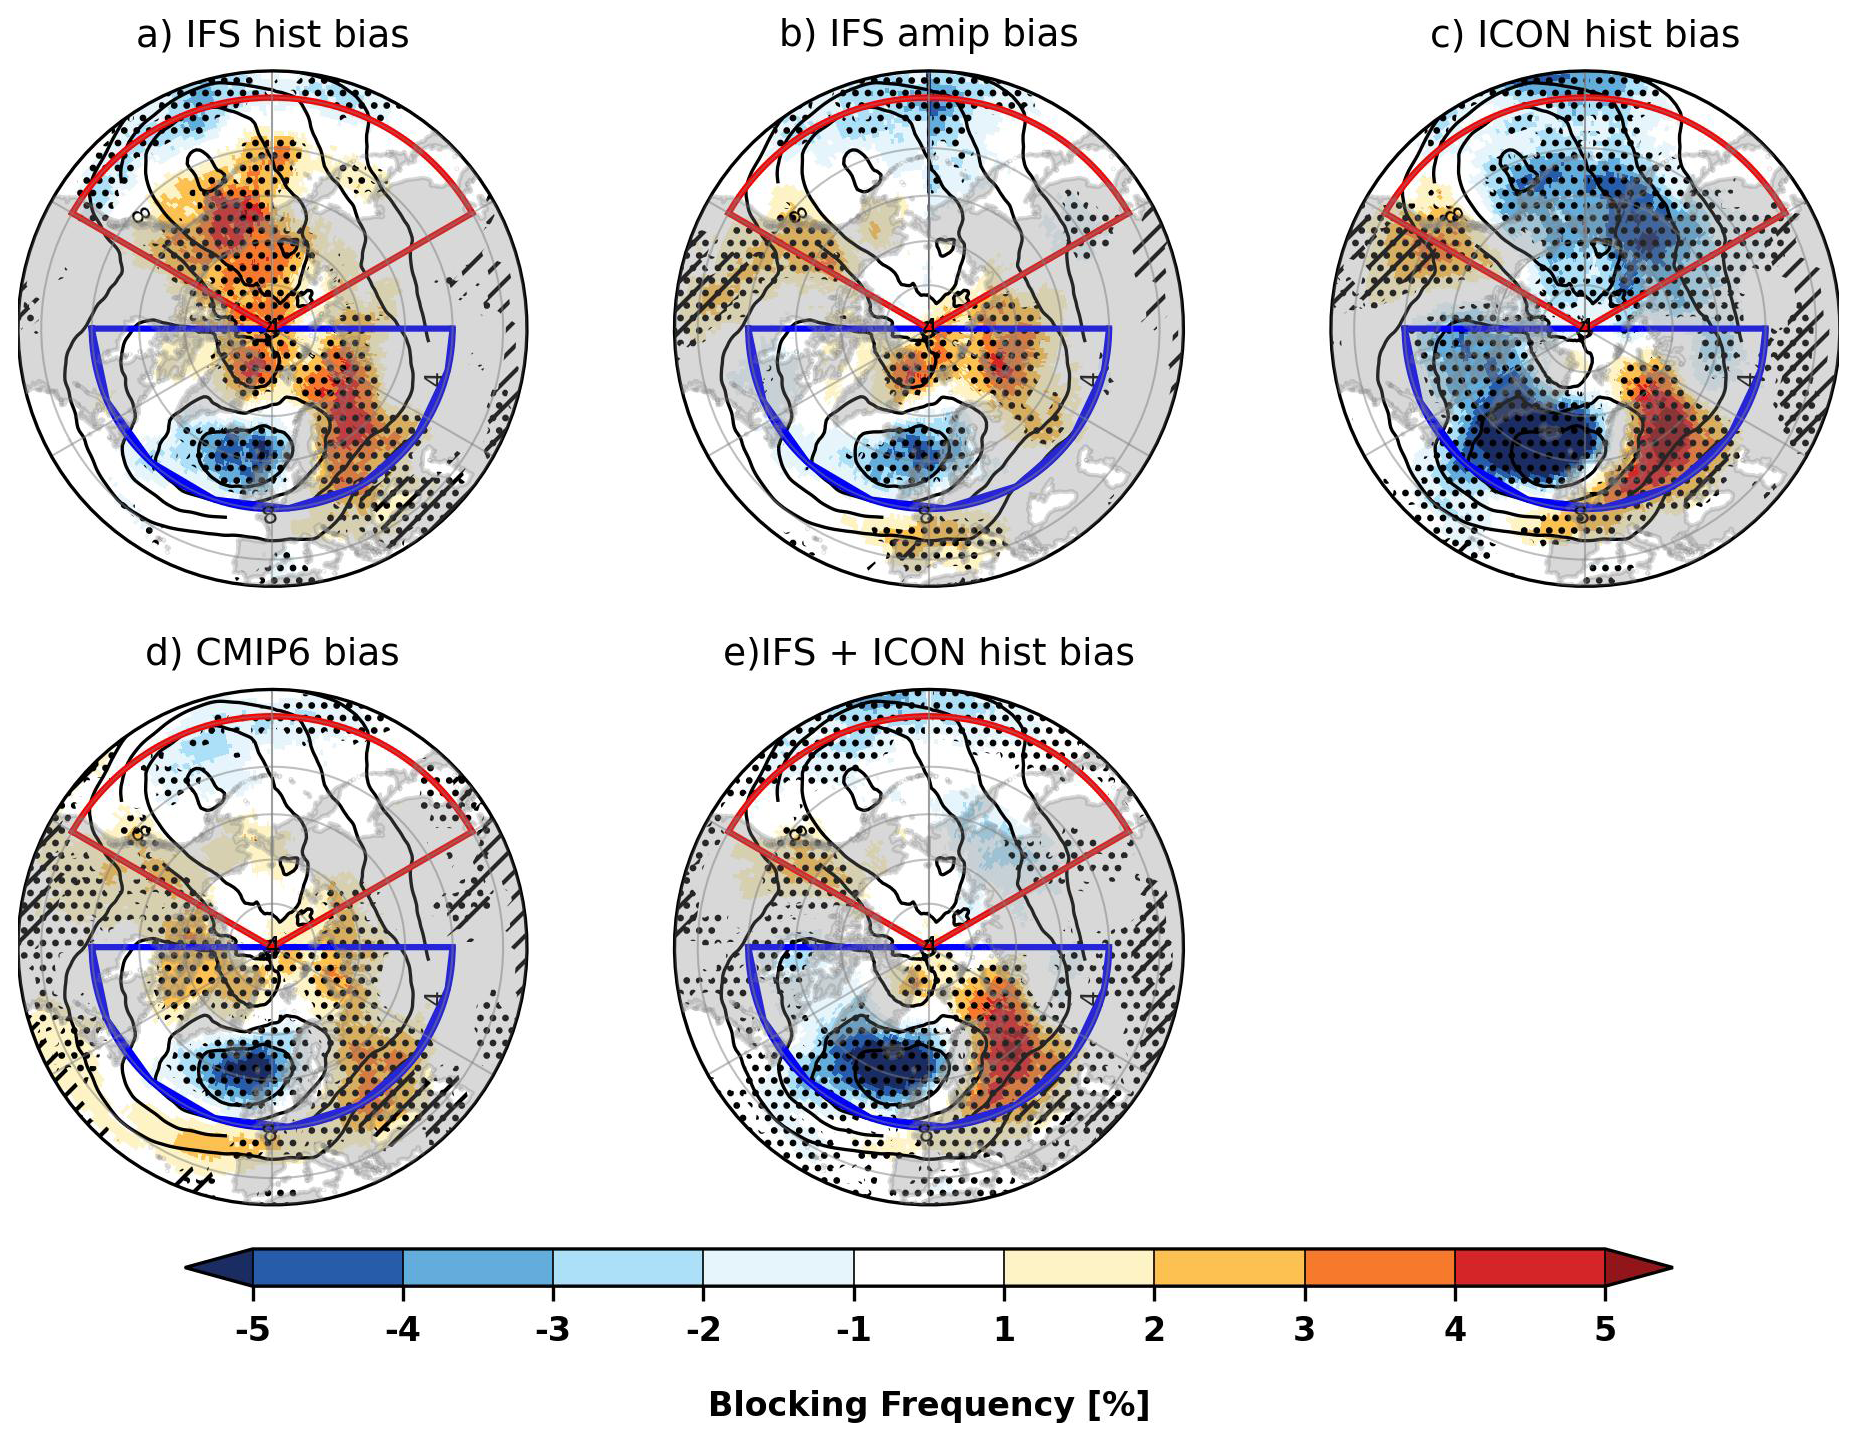
Figure 1Blocking frequency biases against ERA5 during Northern Hemisphere winter (DJF), based on the ANOM index, for (a) IFS historical, (b) IFS atmosphere-only, (c) ICON historical, (d) the CMIP6 ensemble mean based on 8 models, and (e) the mean of IFS and ICON historical simulations. Black contours indicate ERA5 blocking frequency (4 % intervals starting at 4 %). Hatched areas highlight regions with relative differences exceeding 80 %. Black dots indicate statistically significant differences (Z test in panels a, b and c; model agreement ≥ 80 % in panels d and e). Blue and red outlines indicate the North Atlantic and North Pacific basins, respectively.
Table 3Root Mean Square Error (RMSE) of DJF blocking frequency in historical simulations relative to ERA5, quoted separately for the North Atlantic and North Pacific sectors.
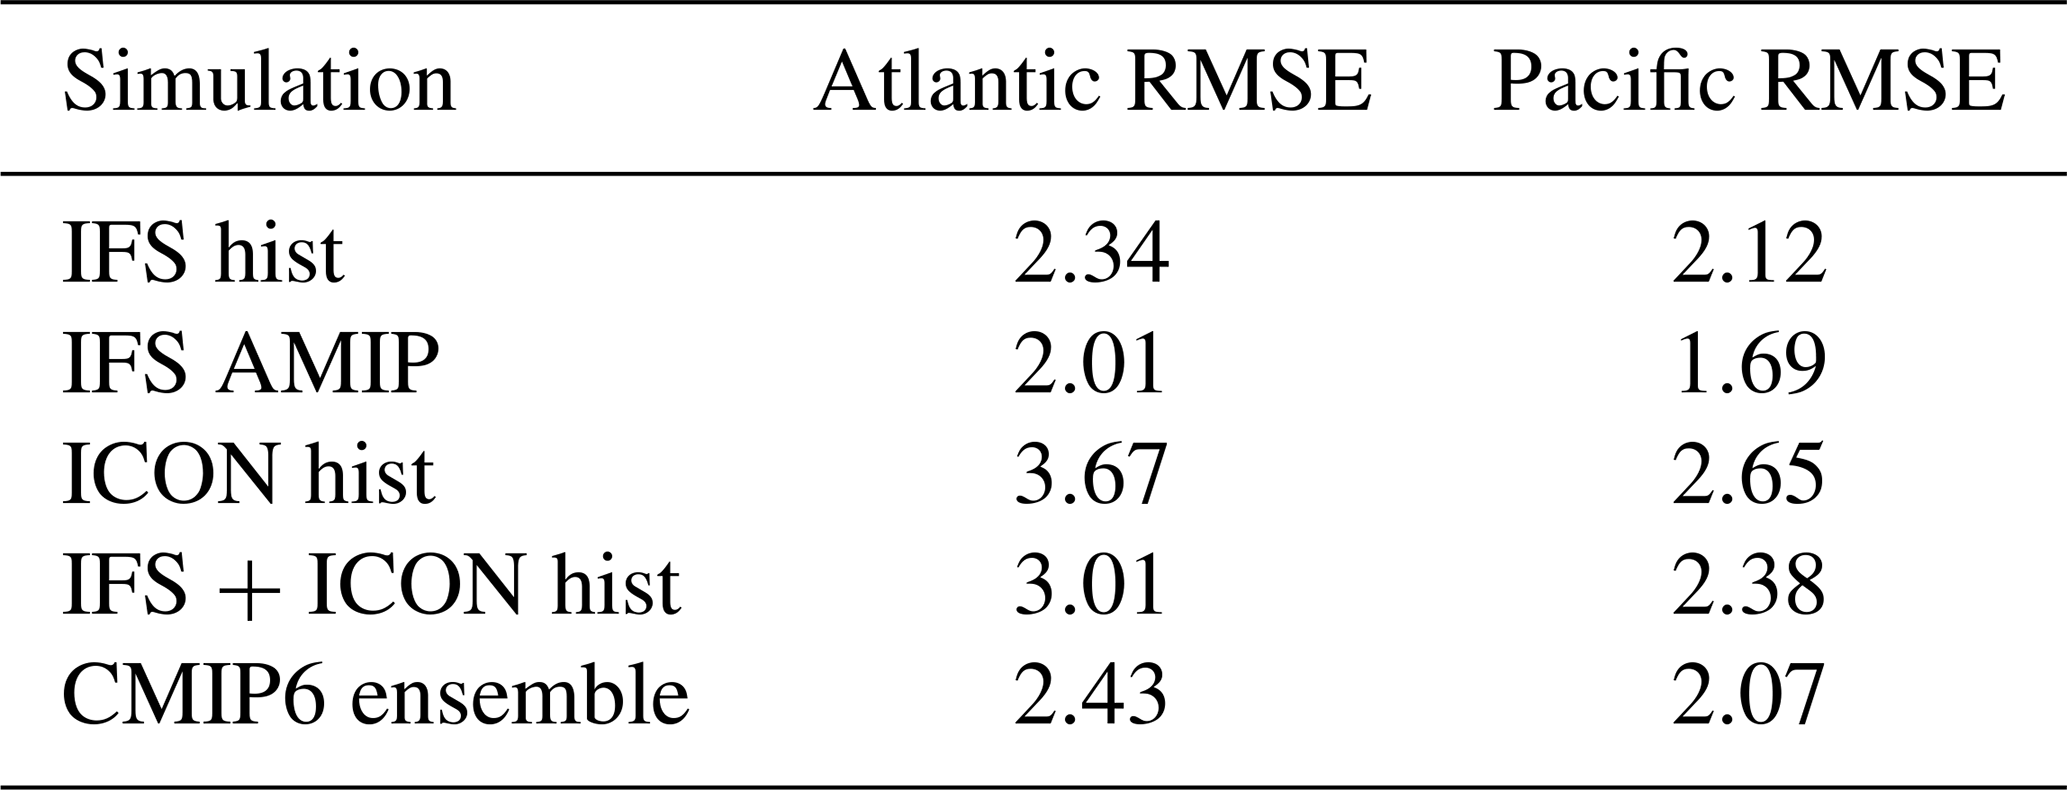
In contrast, ICON exhibits a pronounced underestimation of blocking frequency over the North Atlantic and an eastward displacement of blocking maxima toward Eurasia (Fig. 1c). Its North Atlantic RMSE (3.67) is higher than that of both IFS hist (2.34) and the CMIP6 ensemble (2.43). Among the IFS simulations, the AMIP run performs best, suggesting that biases of blocking frequency in the coupled version are partly driven by sea surface temperature (SST) errors. When observed SSTs are prescribed, the Atlantic blocking bias is substantially reduced (Fig. 1b), an improvement even more evident when using the ABS index (Fig. S1a).
In the North Pacific, IFS hist tends to overestimate blocking frequency, while AMIP simulations again show reduced biases. ICON hist underestimates Pacific blocking but overestimates activity over California, consistent with IFS AMIP.
To assess the effect of ensemble averaging, we also compute the mean bias of ICON and IFS hist (Fig. 1e). The resulting field appears spatially smoother and exhibits RMSE values comparable to the CMIP6 ensemble mean (Table 3). However, ICON and IFS display biases of the same sign over key regions (both underestimate blocking over the North Atlantic and overestimate it over Eastern Europe), indicating that the apparent smoothing does not reflect a compensation of biases in these regions but instead results from spatial averaging of similar model errors.
Blocking frequency biases reflect not only differences in the number of blocking events, but also how blocking frequency is accumulated by the blocking index through event duration and spatial extent. In the applied methodology, longer-lived or spatially larger blocking events contribute more blocked days and grid points, thereby increasing blocking frequency even if the total number of events remains unchanged. In addition, short-lived or spatially small events may fail to satisfy persistence or size criteria.
Figure 2a and d show the number of blocking events per year in each basin. In the North Atlantic, IFS AMIP and the CMIP6 ensemble match ERA5 reasonably well, while ICON and IFS hist underestimate the number of events. In the North Pacific, IFS hist produces fewer blocking events than ERA5, whereas ICON generates a larger number of events.
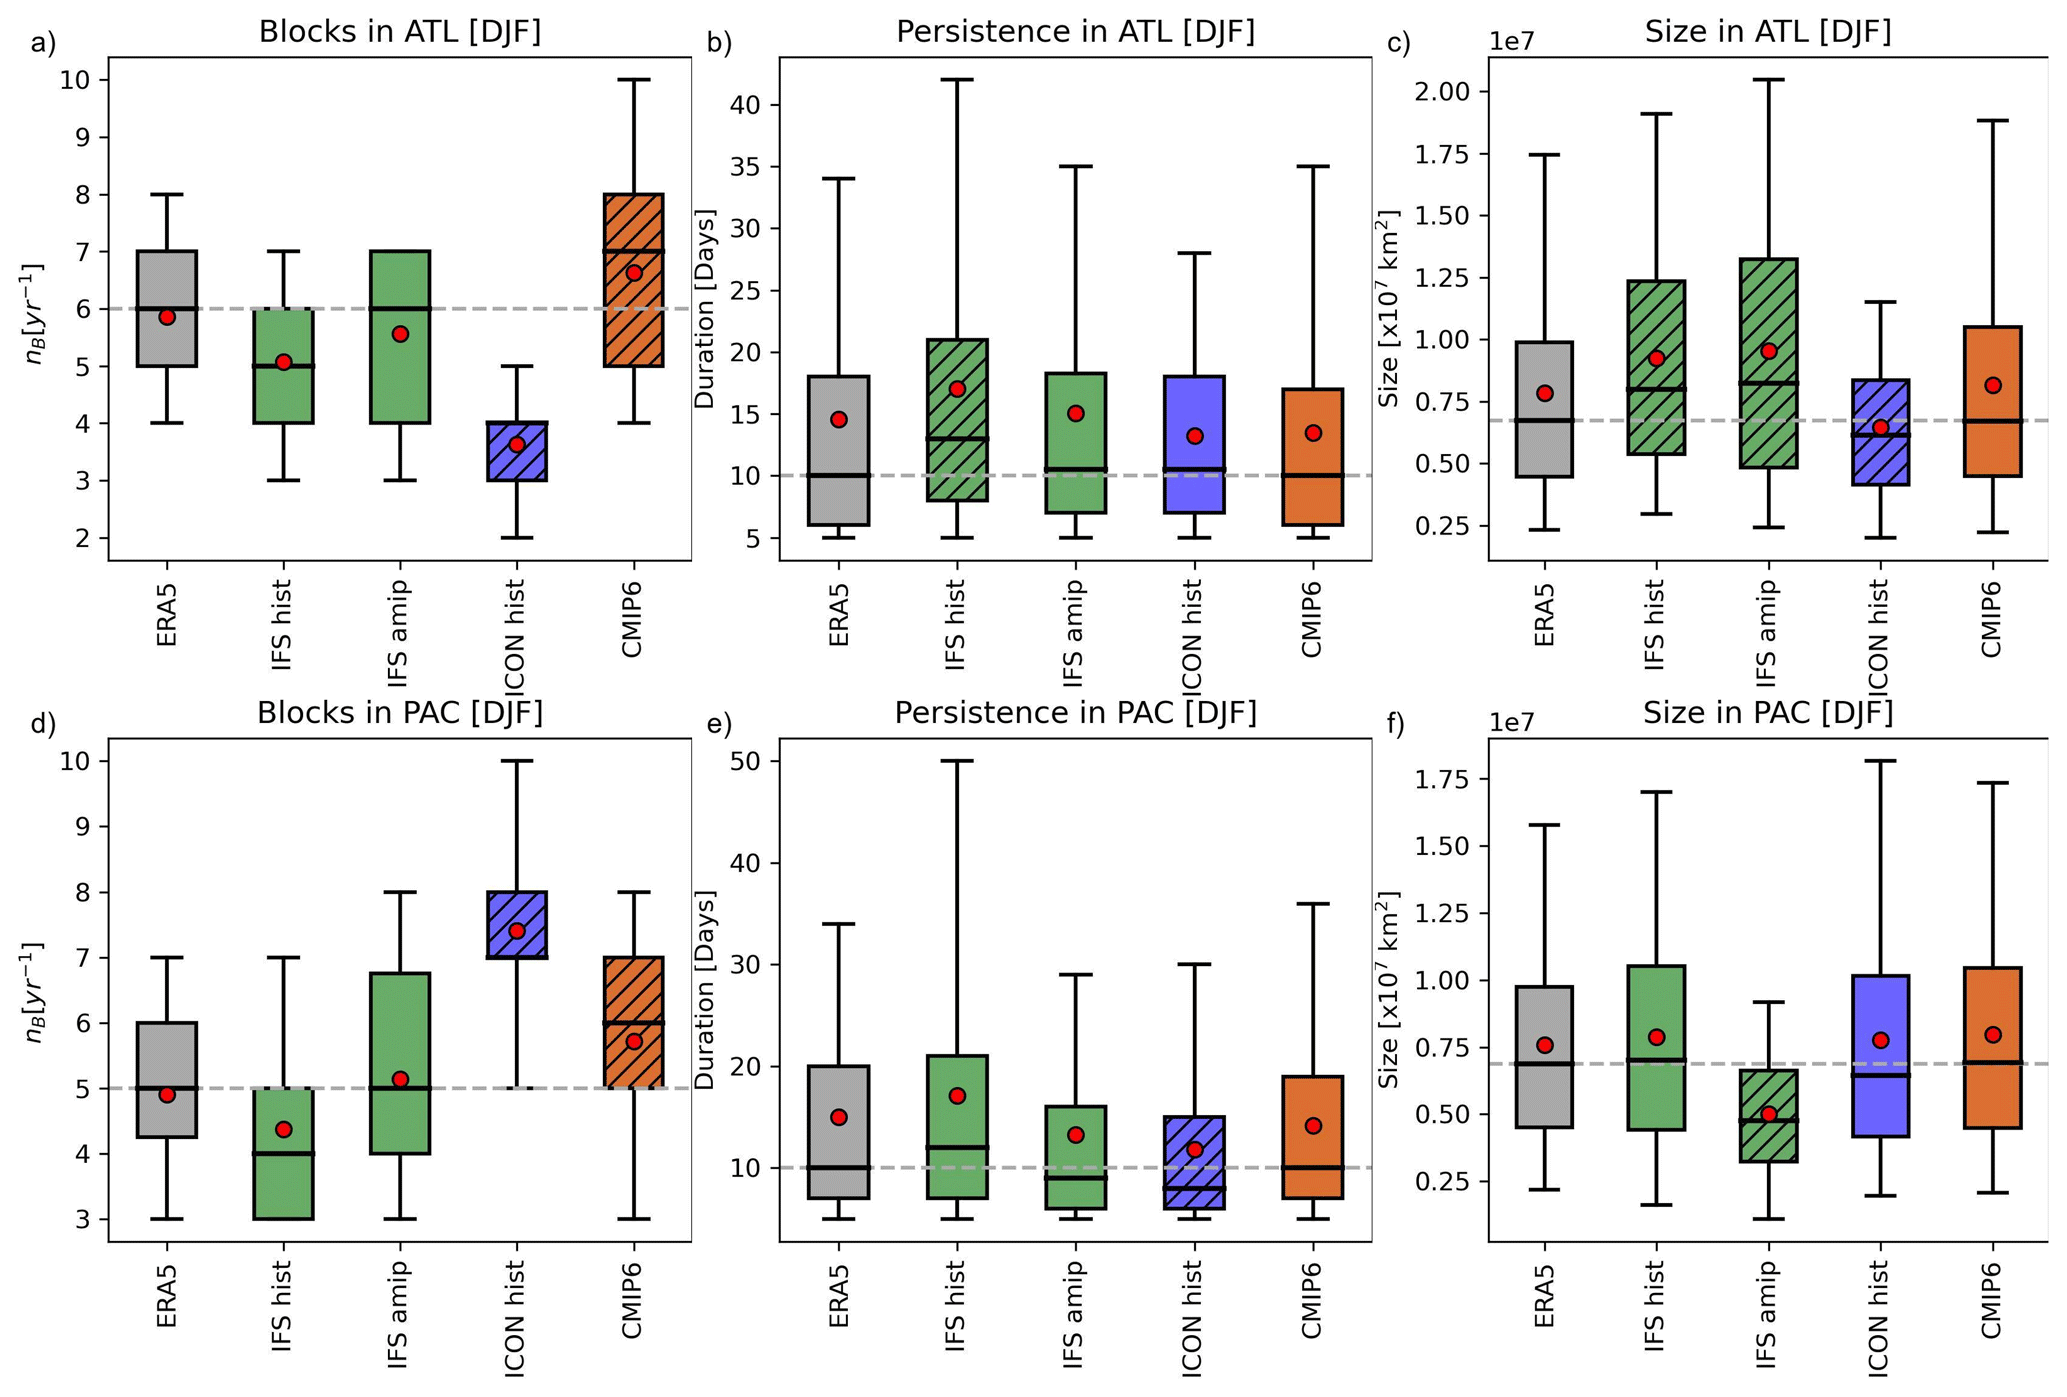
Figure 2Number of blocking events and their properties in the (a, b, c) North Atlantic basin and (d, e, f) North Pacific basin during DJF: number of events (a, d), blocking duration (b, e), and blocking size (c, f). The extent of the basins is shown as solid lines in Fig. 1, with blue representing the Atlantic and red the Pacific basin. Boxes represent the interquartile range (Q1–Q3), with the horizontal line indicating the median, whiskers extending from the 5th to the 95th percentile, and the red dot denoting the mean. Hatched boxes indicate statistically significant differences relative to ERA5 based on a Mann–Whitney U test (p < 0.05).
Blocking duration statistics show that IFS simulations tend to overestimate mean blocking duration in the North Atlantic, while IFS AMIP captures both the mean and the 95th percentile relatively well. ICON hist exhibits mean durations closer to ERA5 and comparable to the CMIP6 ensemble. In the North Pacific, IFS hist produces fewer but longer-lasting blocking events, whereas IFS AMIP yields slightly shorter events, and ICON generates more frequent but shorter-lived blocks (Figs. 2b, e).
Blocking size statistics show that IFS simulations overestimate block size in the North Atlantic, while ICON simulates systematically smaller blocks. In the North Pacific, IFS hist tends to overestimate block size and ICON to underestimate it, whereas the CMIP6 ensemble closely matches ERA5 (Figs. 2c, f).
The discussed blocking characteristics illustrate that blocking frequency biases emerge from a combination of event counts and methodological sensitivities to duration and size. In the North Pacific, the overestimation of the blocking frequency in IFS hist is primarily linked to persistent and spatially extensive blocks, whereas ICON’s biases are associated with a larger number of shorter-lived and smaller events.
In summary, we find that:
-
IFS generally outperforms ICON, especially in the North Atlantic.
-
IFS AMIP achieves the best agreement with ERA5, particularly in blocking frequency, highlighting the importance of accurate SST forcing.
-
In the Pacific, IFS hist simulates fewer but longer-lasting blocks, while ICON produces more but shorter-lived blocks.
-
ICON performs worse than CMIP6 for most metrics, especially with respect to blocking frequency and size.
These findings suggest that, while higher resolution alone does not guarantee improved blocking representation, storm-resolving models with realistic boundary conditions (as in AMIP) provide a clearer pathway toward better simulation of blocking. This result also emphasizes the need to better understand the interplay between SST biases, background flow, and moist processes in shaping blocking characteristics.
4.1.1 The representation of the background flow
We first examine how biases in the large-scale zonal flow relate to winter blocking characteristics in the multidecadal simulations of both storm-resolving models. As a diagnostic of the background flow, we analyze the seasonal-mean zonal wind at 500 hPa.
Figure 3 shows DJF mean 500 hPa zonal-wind biases relative to ERA5. In IFS hist, a positive bias of 2–3 m s−1 is found over the eastern North Atlantic and Europe. In the North Pacific, the jet is displaced poleward, with positive wind biases along its northern flank and negative biases to the south. These features are consistent with the typical link between stronger or shifted zonal flow and reduced blocking frequency. For instance, in the North Atlantic region, the positive westerly bias coincides with negative blocking anomalies (cf. Fig. 1).
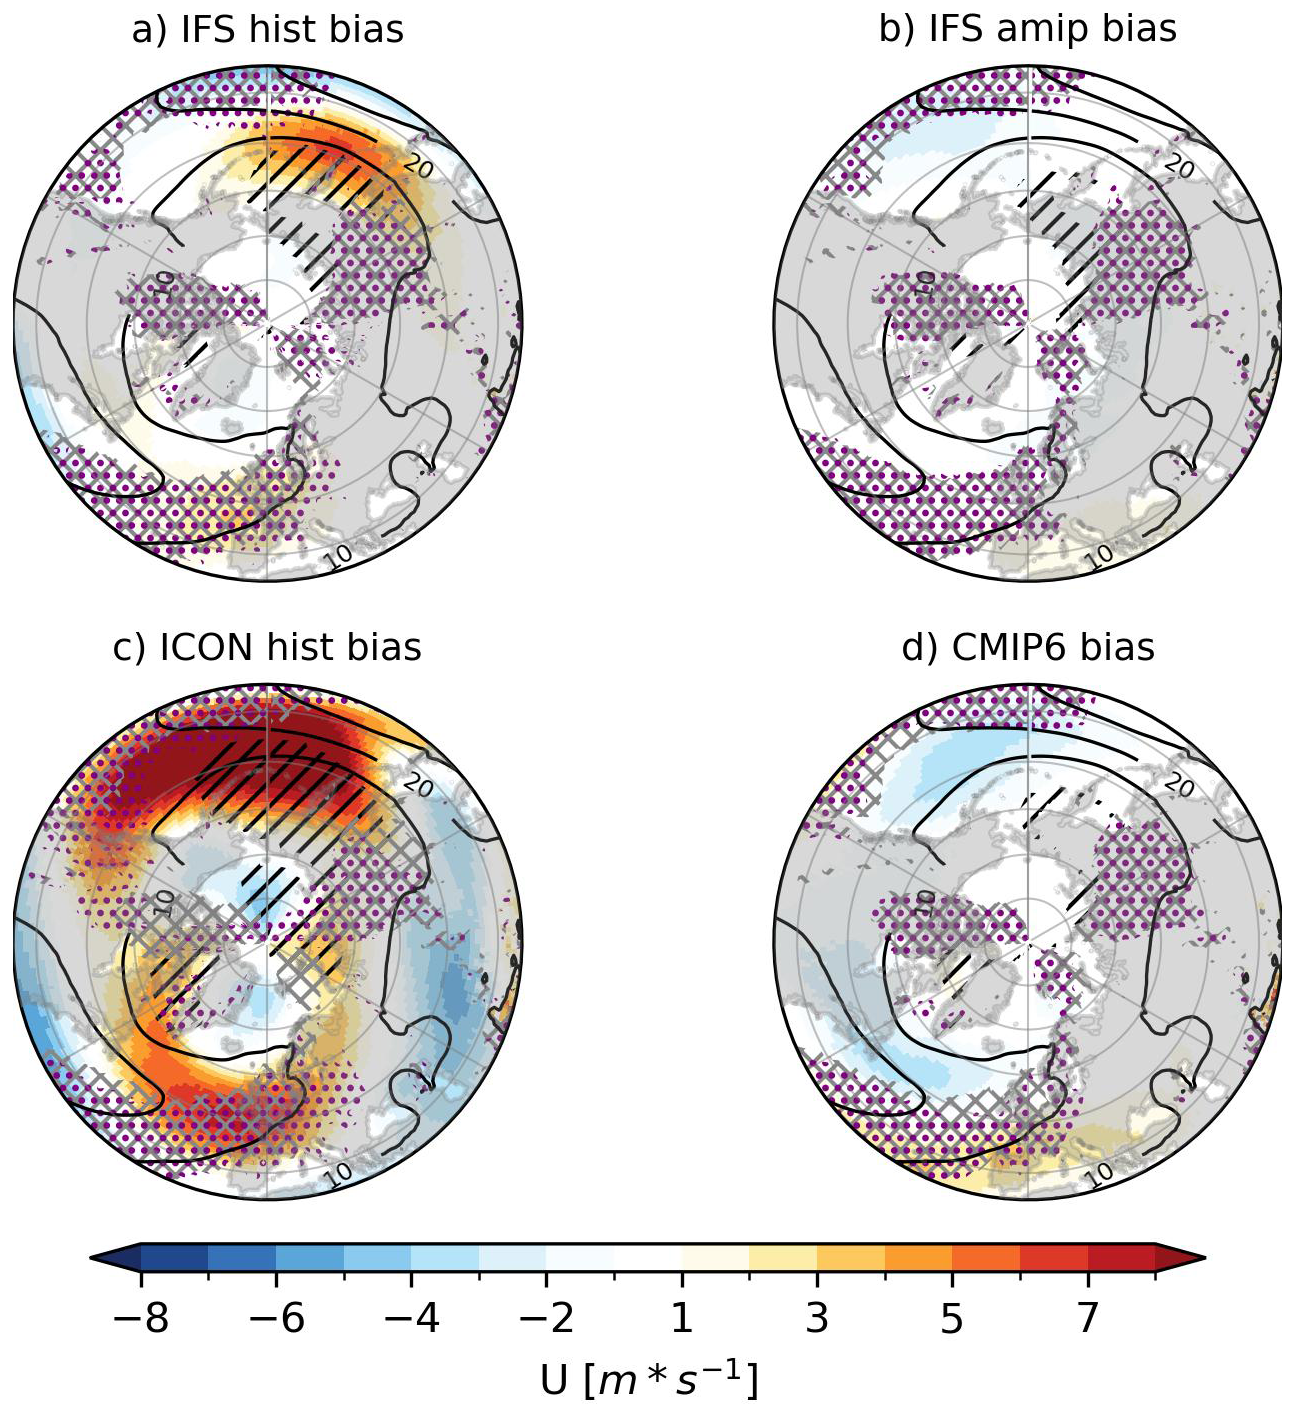
Figure 3Mid-level (500 hPa) zonal-wind biases against ERA5 in Northern Hemisphere winter for (a) IFS historical, (b) IFS atmosphere-only, (c) ICON historical, and (d) the CMIP6 ensemble mean (8 models). ERA5 zonal wind is indicated by contours. Hatched areas indicate regions where the bias relative to ERA5 exceeds 80 %. Regions of strong zonal-wind deceleration ( < −0.3 × 10⁻⁵ s−1) – potential jet-exit zones linked to wave breaking and blocking – are highlighted with purple stippling for each model and gray hatching for ERA5.
As discussed in the introduction, blocking occurrence is related to a decrease in waveguide strength in the zonal direction. We use as a simple proxy. Stippling in Fig. 3 highlights regions of strong zonal-wind deceleration ( < −0.3 × 10⁻⁵ s−1) for each model, while ERA5 zonal-wind deceleration is shown as gray hatching. These areas – often associated with jet-exit zones – can indicate leaky waveguides that may facilitate wave breaking and block formation (Nakamura and Huang, 2018). In winter, the spatial alignment between jet-exit regions and blocking anomalies offers a useful sanity check on the realism of large-scale flow features in the models: blocking is suppressed in regions of strong westerlies but may be favored near the jet exit, where wave breaking and diffluence increase.
IFS AMIP shows a better jet representation (both strength and location) relative to IFS hist, particularly in the North Atlantic, where the RMSE drops from 1.01 m s−1 (IFS hist) to 0.77 m s−1 (IFS AMIP) (Table 4). In contrast, ICON substantially overestimates jet strength in both basins. This bias likely contributes to the underestimation of blocking frequency and the predominance of short-lived blocking events in ICON (Figs. 1, 2).
Table 4Root Mean Square Error (RMSE) of 500 hPa zonal wind relative to ERA5 for different historical simulations, computed over the Northern Hemisphere Atlantic and Pacific basins (DJF).
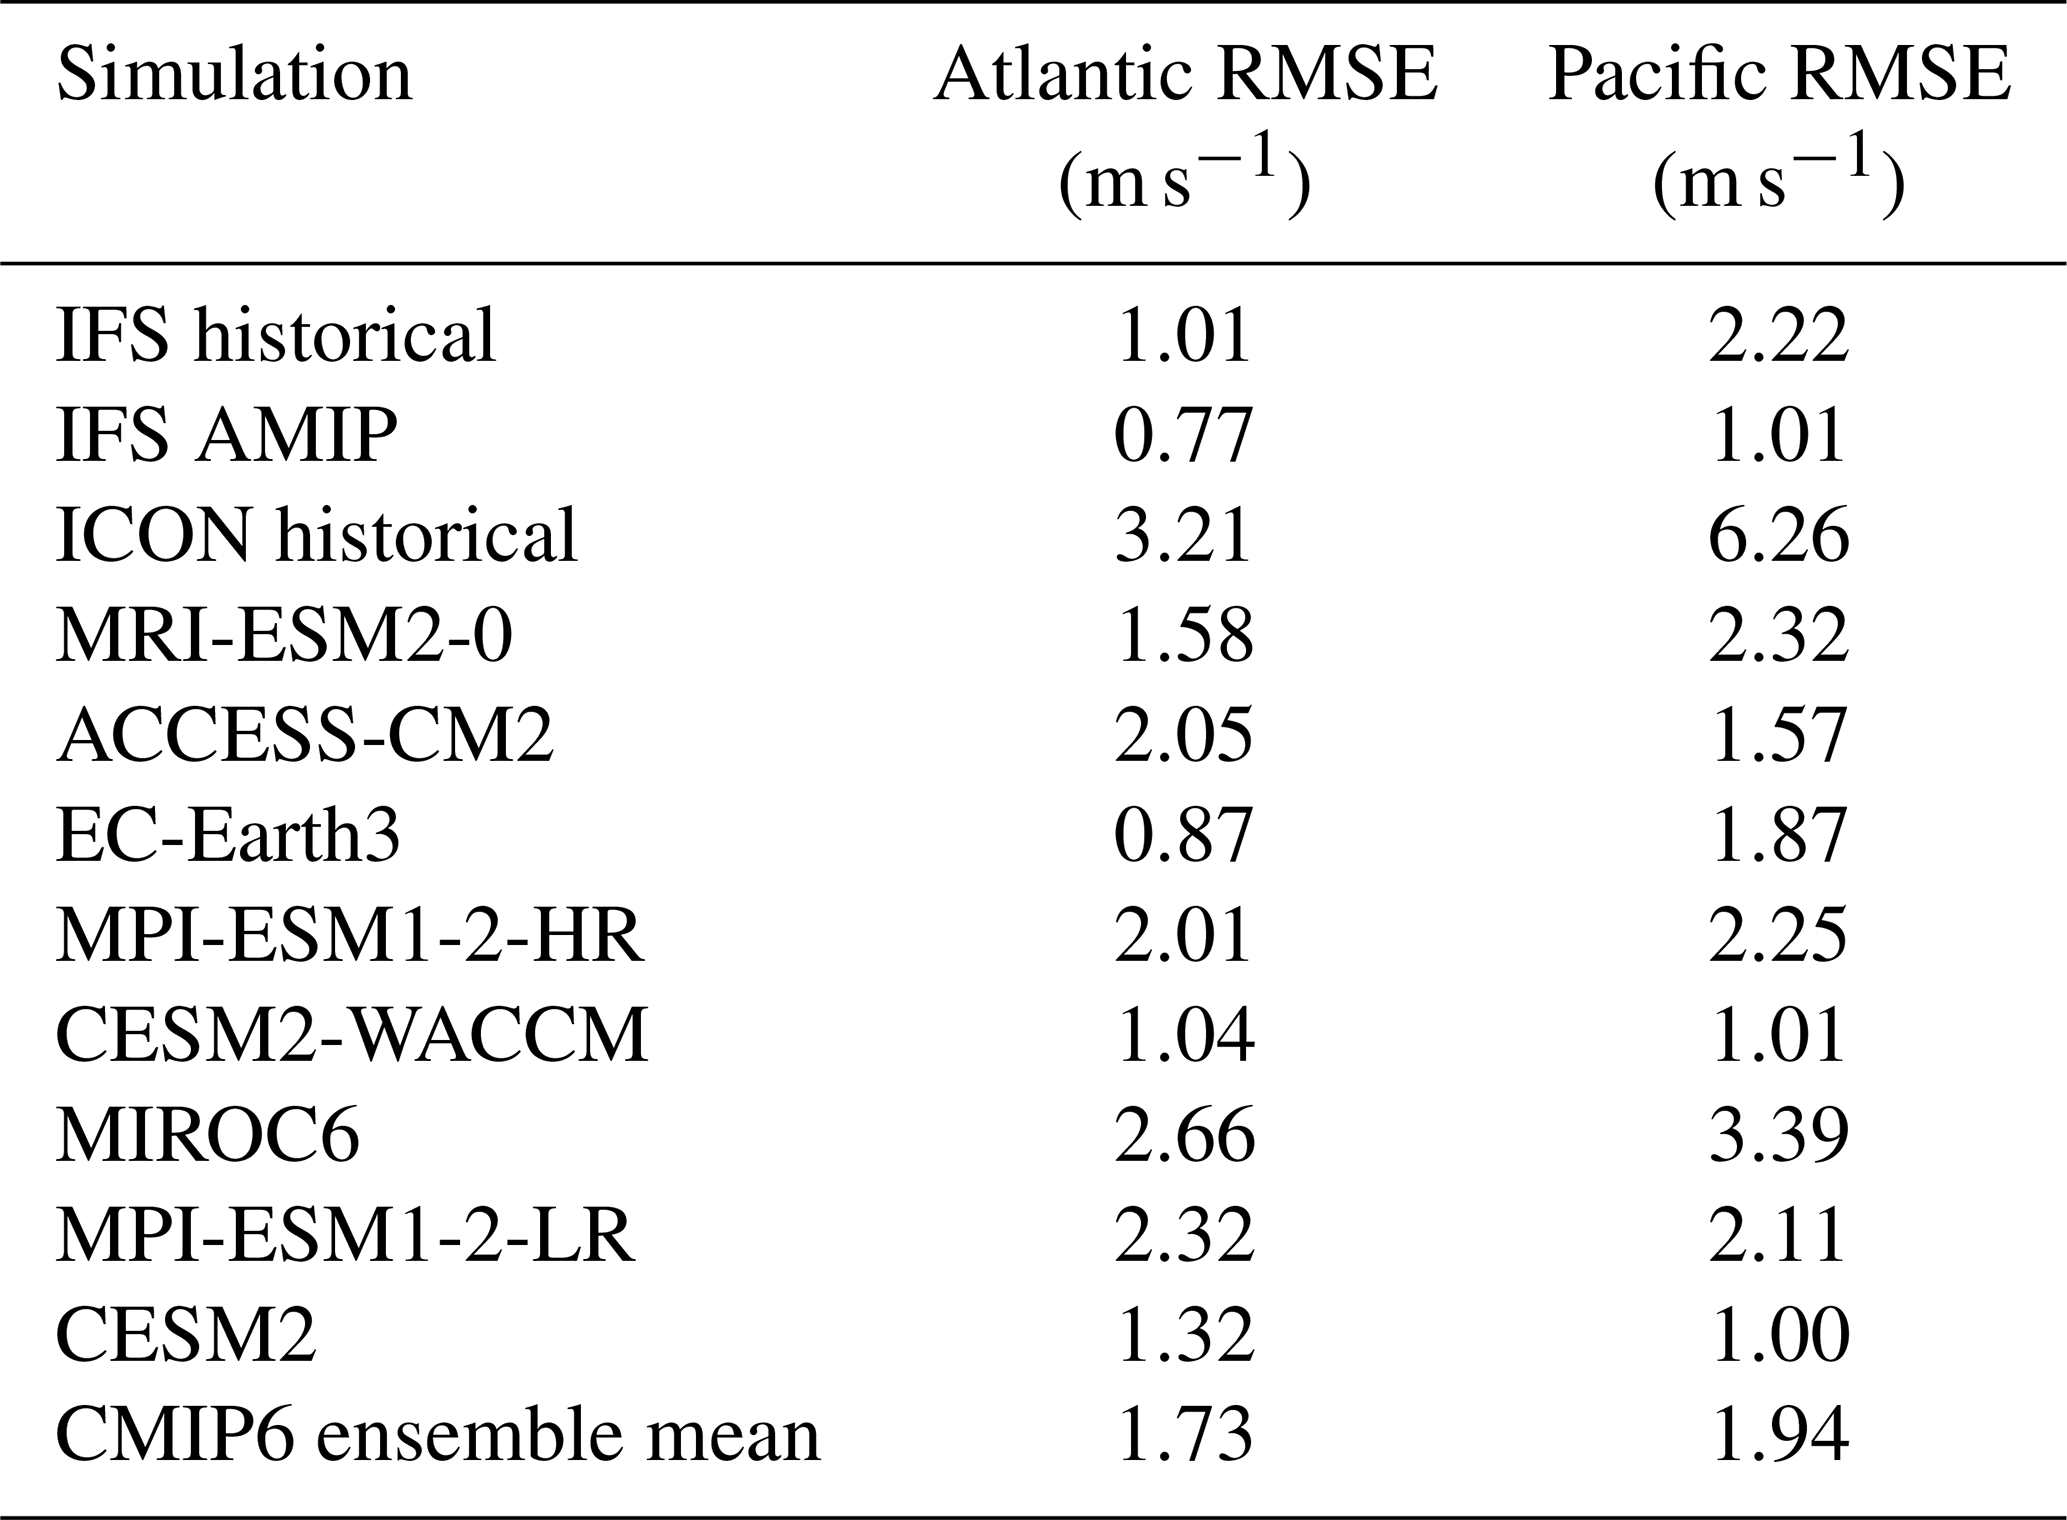
IFS storm-resolving simulations overcome a common limitation of CMIP6 models – namely, the equatorward bias in jet latitude (e.g., Dolores-Tesillos et al., 2025). IFS captures the latitudinal jet position better over the North Atlantic than CMIP6 (Fig. S3). However, when evaluated using RMSE, only IFS AMIP outperforms the CMIP6 ensemble mean in both basins. The historical coupled runs of ICON and IFS show larger overall wind biases (Table 4).
4.1.2 The representation of the ocean
We compare the coupled IFS hist simulations with their atmosphere-only counterparts (IFS AMIP) to examine how SST anomalies influence the location and frequency of winter blocking. Additionally, we use ICON and CMIP6 simulations as references to contextualize the role of ocean forcing across different model frameworks. Notably, the SST biases averaged over the eight CMIP6 models used here are similar to those of the full CMIP6 and CMIP5 ensembles (Zhang et al., 2023).
In the North Atlantic, both IFS and ICON simulations exhibit pronounced SST biases during DJF, particularly in the midlatitudes (Fig. 4). Negative SST bias are found off Newfoundland and south of Greenland, enhancing the zonal SST gradient at midlatitudes. This suggests an enhancement of lower-tropospheric baroclinicity, which would support a stronger eddy-driven jet near 50–55° N. Simultaneously, warm anomalies north of the Gulf Stream tend to weaken the meridional SST gradient farther south, potentially reducing baroclinicity and limiting jet development in that region. The combined effect of these biases results in a poleward and eastward displacement of the eddy-driven jet, which favors more zonal flow and inhibits the development of persistent blocking patterns. These results are consistent with the mechanism proposed by Scaife et al. (2011) and further supported by Athanasiadis et al. (2022) and Cheung et al. (2023). Despite exhibiting similar SST-bias patterns, CMIP6 models tend to simulate an equatorward-biased jet. This discrepancy suggests that model resolution and the representation of eddy–mean-flow interactions are critical for accurately capturing the circulation response to SST anomalies.
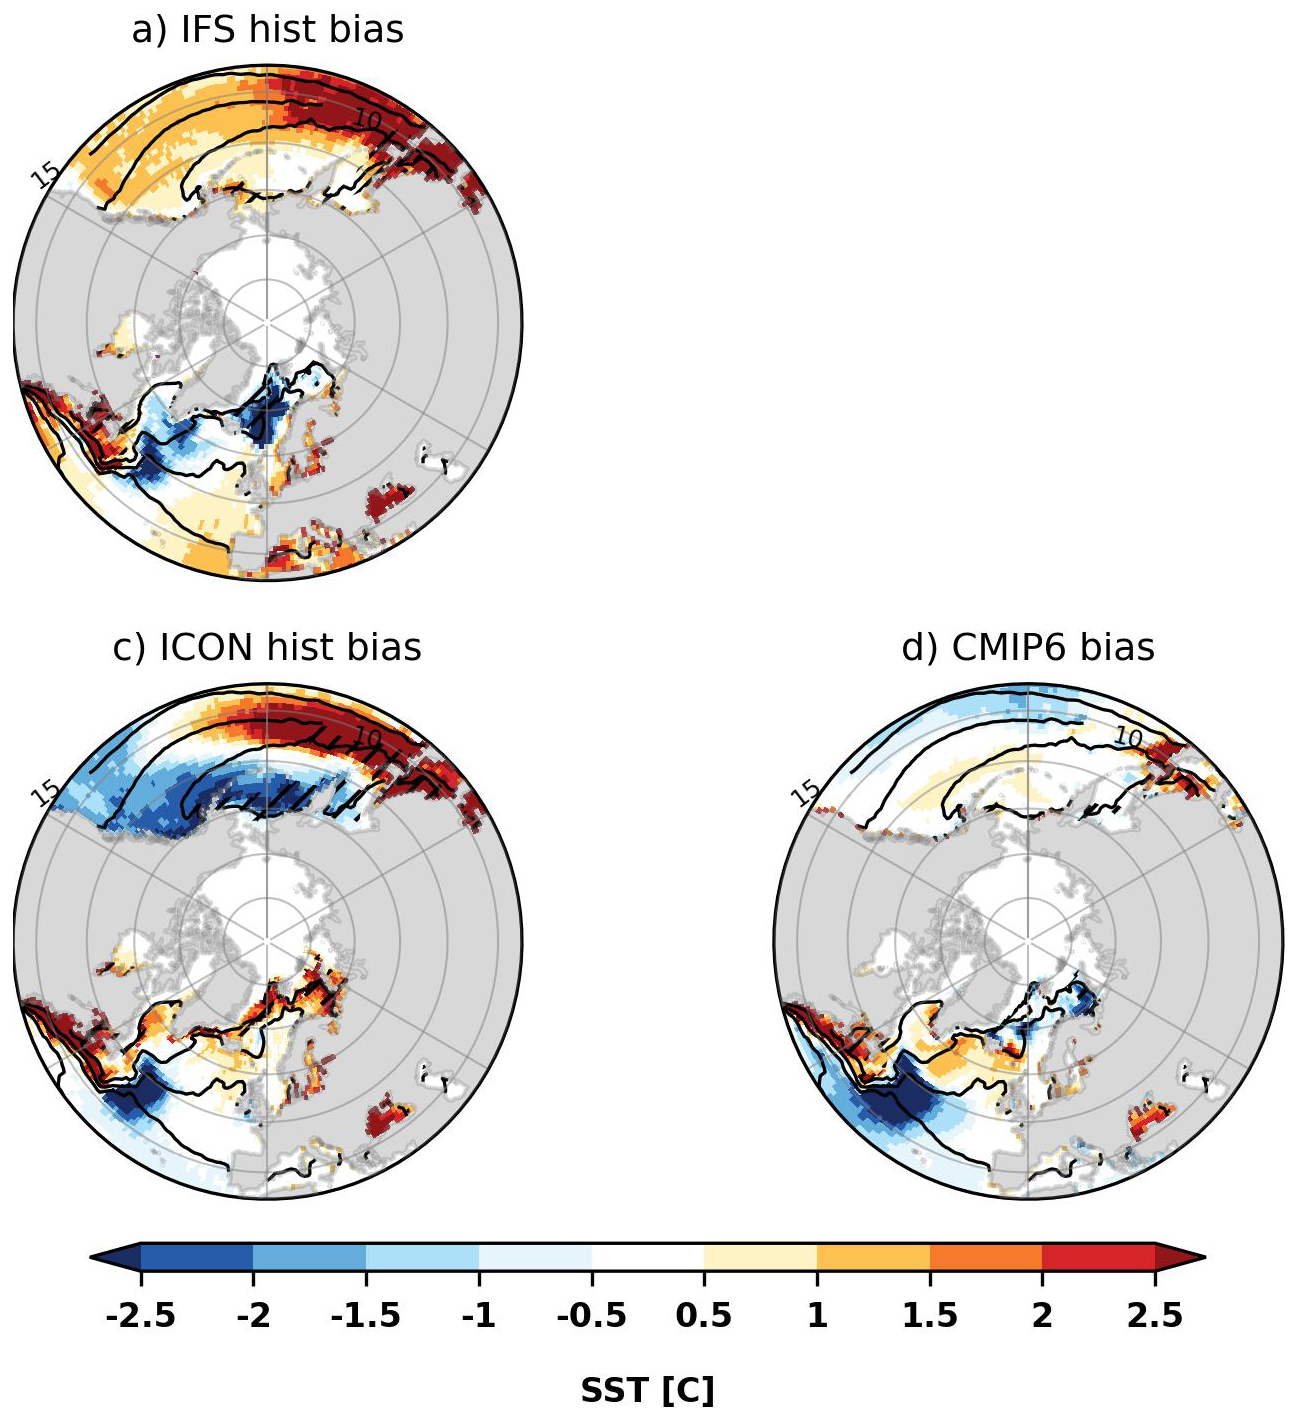
Figure 4SST biases against ERA5 in the Northern Hemisphere winter for (a) IFS historical, (c) ICON historical, and (d) the CMIP6 ensemble mean based on 8 models. The ERA5 SST is indicated by contours. Hatched areas indicate regions where the difference relative to ERA5 exceeds 80 % in degree Celsius.
In the North Pacific, IFS hist simulations exhibit positive SST biases in the midlatitudes. These biases increase the ocean–atmosphere temperature contrast, likely enhancing surface latent-heat fluxes and contributing to increased lower-tropospheric baroclinicity through moist destabilization (Hermoso et al., 2024). The primary atmospheric response is not a uniform strengthening of the jet, but a poleward shift in its position (Fig. 3a), which coincides with a poleward shift in blocking frequency.
In contrast, ICON displays a more pronounced meridional SST gradient, with warm subtropical waters and cold polar waters. This sharper thermal contrast may enhance baroclinicity and intensifies the upper-level jet. Blocking events in ICON are generally shorter-lived, supporting the interpretation that strong zonal flow suppresses both the formation and maintenance of blocks.
The intensified and zonally extended jets in ICON (coupled with short-lived blocks and downstream-shifted blocking maxima) underscore the sensitivity of large-scale circulation to SST patterns in high-resolution coupled models. These results highlight the importance of accurately representing both oceanic boundary conditions and their coupling with atmospheric dynamics when simulating extratropical variability and blocking behavior.
4.1.3 The representation of storm-tracks
Storm-track intensity biases during wintertime show that the IFS hist simulation captures the main storm-track branches over both the North Pacific and North Atlantic, but with systematic deviations from ERA5 (Fig. 5). Over the North Atlantic, the storm-track is stronger and extends farther east, consistent with an eastward extension of the jet, a shift in blocking maxima, and an underestimation of blocking over the central basin. In the Pacific, the storm-track is shifted northward, in line with the poleward displacement of the jet and blocking frequency. These spatial associations suggest a coherent relationship among storm-track, jet, and blocking biases across regions.
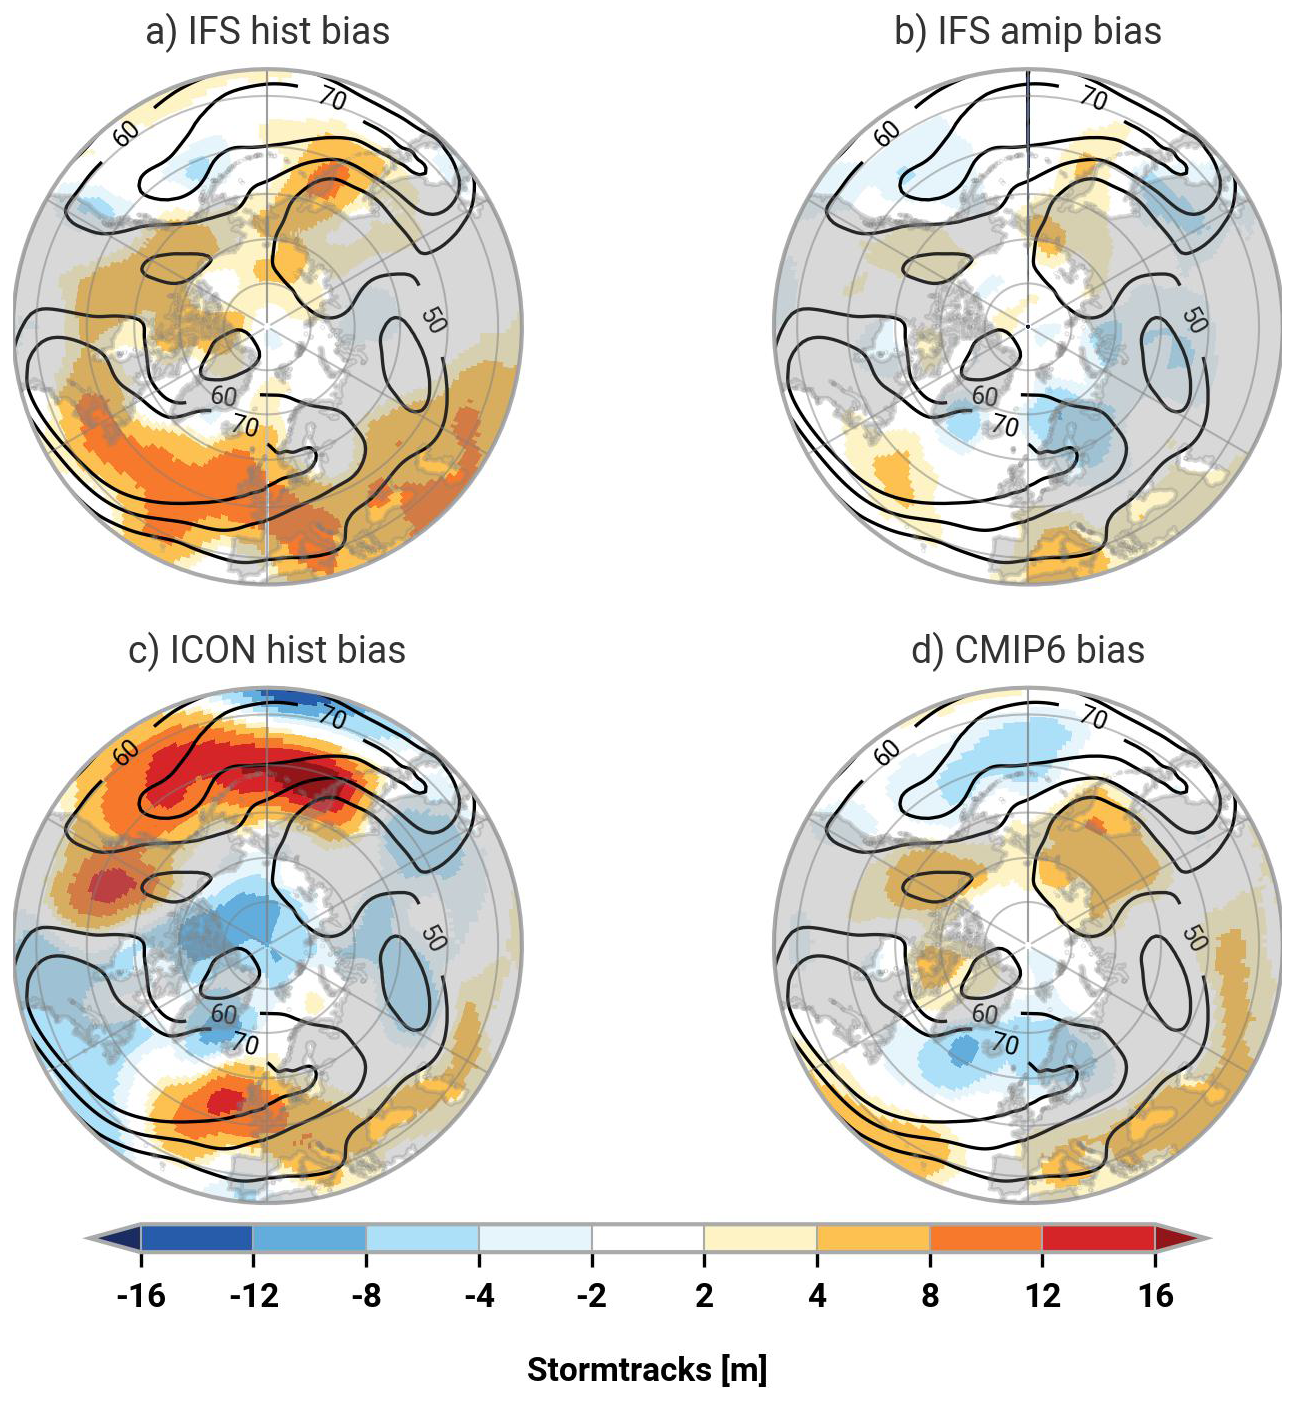
Figure 5Storm-tracks biases against ERA5 in the Northern Hemisphere winter for (a) IFS historical, (b) IFS atmosphere-only, (c) ICON historical, and (d) the CMIP6 ensemble mean. The ERA5 storm-tracks amplitude is indicated by contours. Hatched areas indicate regions where the relative difference to ERA5 exceeds 80 %.
The IFS AMIP simulation more accurately reproduces storm-track intensity in both the North Atlantic and the Mediterranean, along with a more realistic blocking distribution. ICON simulations exhibit an eastward-shifted and overly zonal storm-track in the North Atlantic (consistent with the stronger jet structure discussed earlier) and an eastward shift in blocking frequency. In the western North Pacific, the storm-track is shifted northward, similar to the jets and the blocks.
The CMIP6 ensemble mean displays weaker and more equatorward storm-tracks than ERA5, especially in the Atlantic, a long-standing bias in coarser resolution models (Zappa et al., 2013; Harvey et al., 2020; Priestley et al., 2023). This is consistent with their equatorward jet displacement and contributes to the underestimation of blocking frequency over the North Atlantic (e.g., Woollings et al., 2018).
Taken together, these results reaffirm the tight interplay between storm-tracks, jet structure, and atmospheric blocking. They underscore that realistic storm-track representation (particularly when supported by accurate ocean boundary forcing) is essential for capturing the dynamics of persistent weather regimes in the extratropics.
4.2 Summer blocking
We now turn to Northern Hemisphere summer (JJA) to assess the most robust and significant blocking biases across models. Note that summer biases (Fig. 6) are generally smaller than winter biases (Fig. 1).
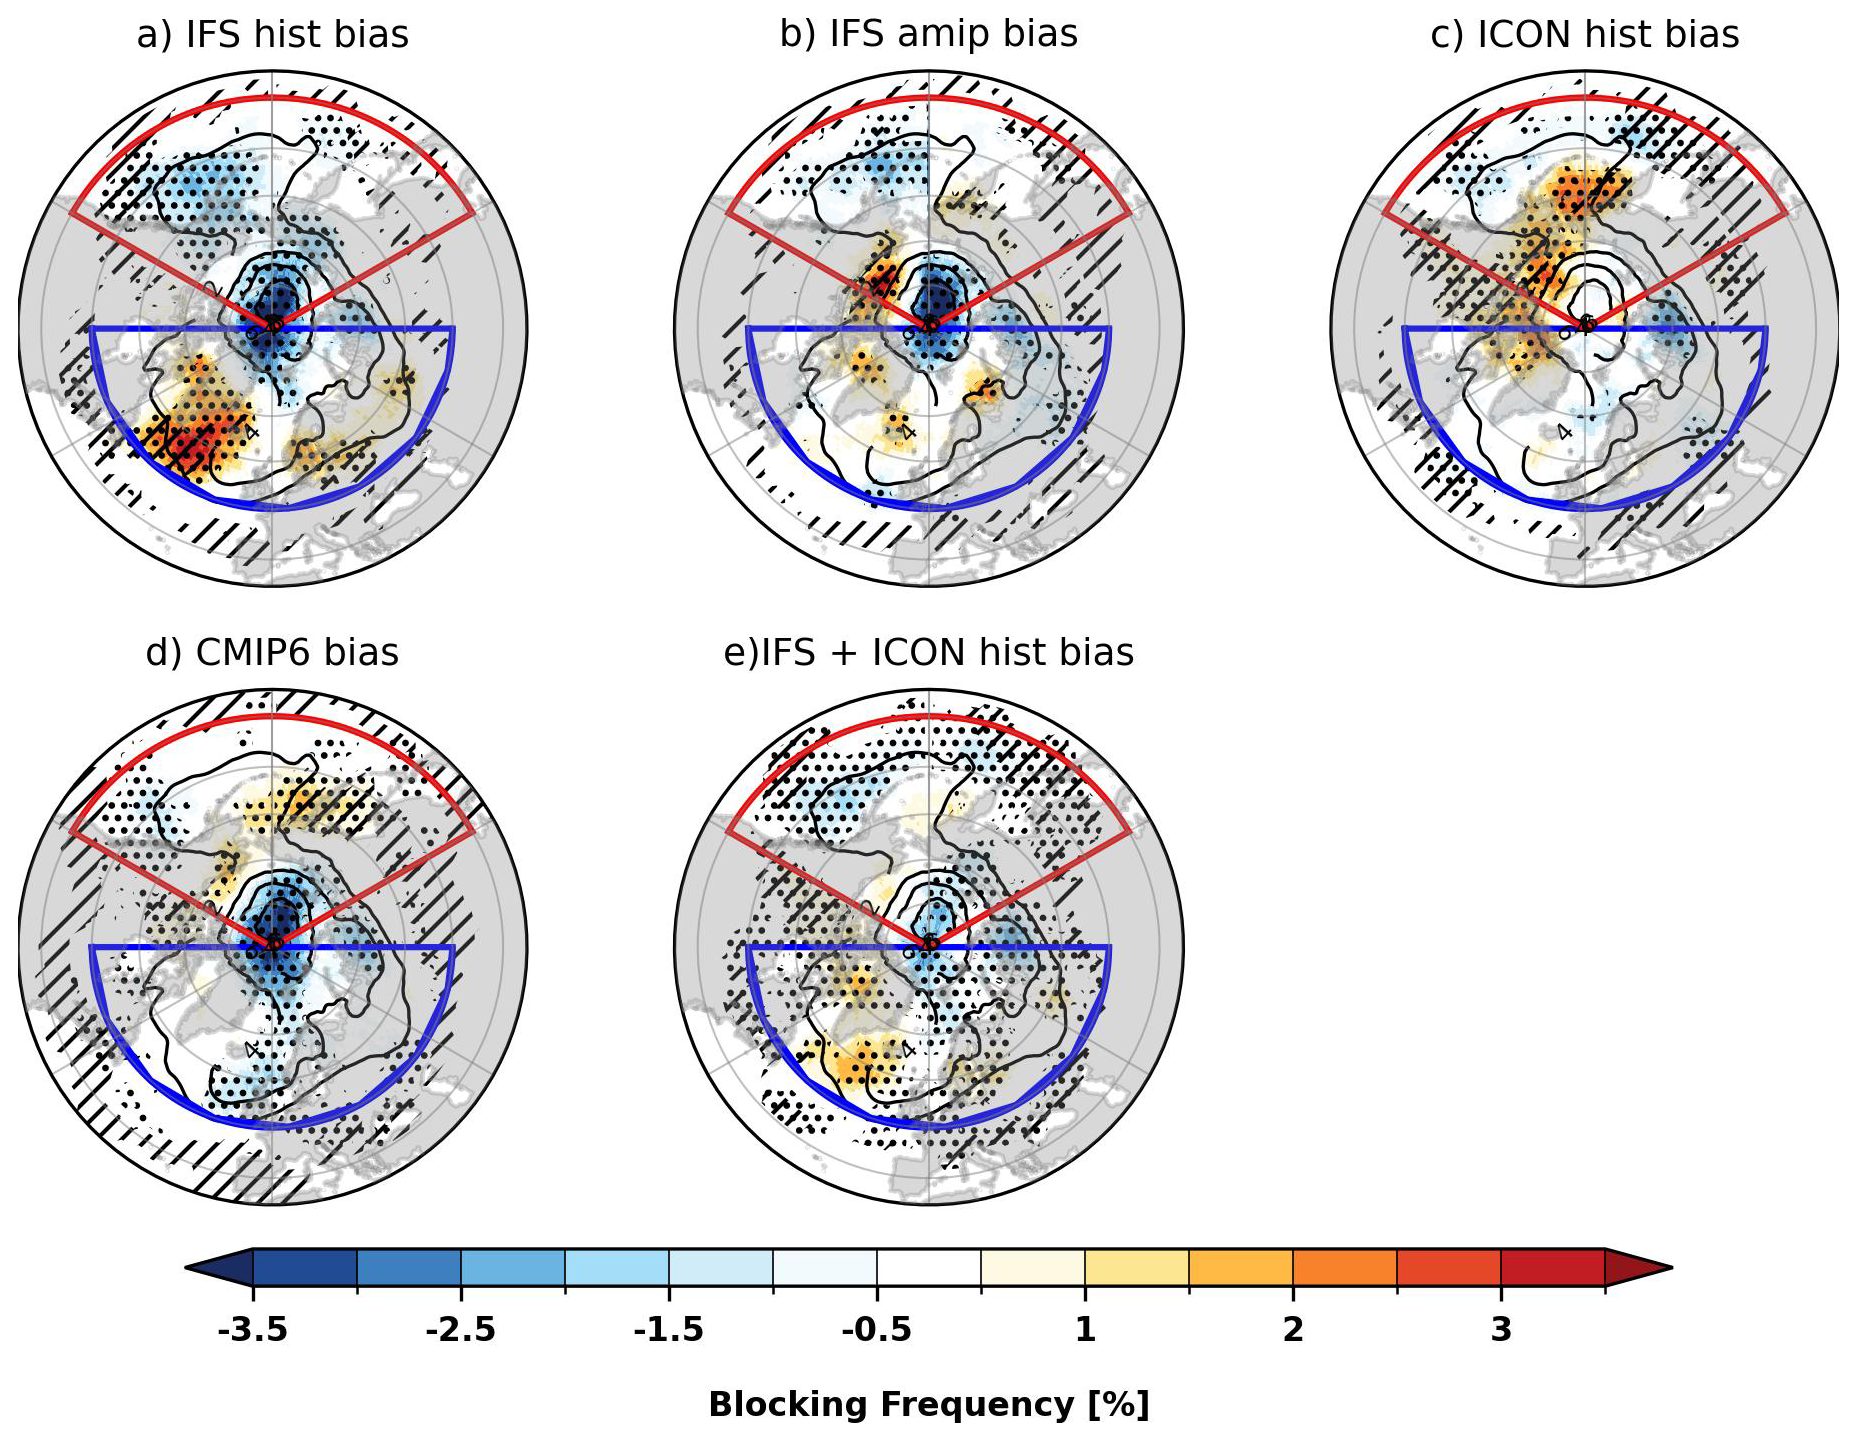
Figure 6Blocking frequency biases against ERA5 during Northern Hemisphere summer (JJA), based on the ANOM index, for (a) IFS historical, (b) IFS atmosphere-only, (c) ICON historical, (d) the CMIP6 ensemble mean based on 8 models, and (e) the mean of IFS and ICON historical simulations. Black contours indicate ERA5 blocking frequency (4 % intervals starting at 4 %). Hatched areas highlight regions with relative differences exceeding 80 %. Black dots indicate statistically significant differences (Z test in panels a, b and c; model agreement ≥ 80 % in panels d and e). Blue and red outlines indicate the North Atlantic and North Pacific basins, respectively.
In the North Atlantic, the IFS historical simulation overestimates blocking frequency, particularly south of Greenland, despite having an RMSE (1.24) similar to the CMIP6 ensemble mean (Table 5). This highlights a limitation of basin-averaged RMSE: it can mask strong localized anomalies. The pronounced overestimation of Greenland blocking in IFS hist (exceeding 80 %) is largely absent in IFS AMIP, consistent with improvements also seen in the ABS index (Fig. S2b). The atmosphere-only configuration (IFS AMIP) achieves a lower RMSE (0.85) than IFS hist. ICON hist exhibits the smallest basin-averaged blocking frequency bias over the North Atlantic, with an RMSE of 0.69 compared to 1.21 for the CMIP6 ensemble mean. This indicates good overall agreement with ERA5 at the basin scale, although ICON still shows weak regional underestimations along the eastern flank of the domain.
Table 5Root Mean Square Error (RMSE) of JJA blocking frequency in historical simulations relative to ERA5, separated for the North Atlantic and North Pacific sectors.
The number of blocking events per year (Fig. 7) shows that IFS hist produces mean and median values close to ERA5. IFS AMIP slightly underestimates the number of blocks. ICON simulations underestimate the number of blocking events, consistent with the localized regions of reduced blocking frequency. Blocking duration statistics (Fig. 7b) indicate that all models capture JJA duration reasonably well. IFS simulations show a slight positive bias in median duration, while ICON reproduces ERA5 durations closely. Blocking size (Fig. 7c) reveals that IFS AMIP produces larger blocks, whereas ICON tends to simulate smaller blocks than ERA5. Thus, ICON's low basin-averaged RMSE indicates that its gridded blocking frequency field is close to ERA5 at most locations. However, this good agreement in the frequency field does not imply a correct representation of blocking lifecycles: ICON underestimates the number of blocking events and tends to produce smaller blocks than ERA5. In contrast, IFS hist's frequency overestimation is associated with overly persistent and spatially extensive blocking south of Greenland.
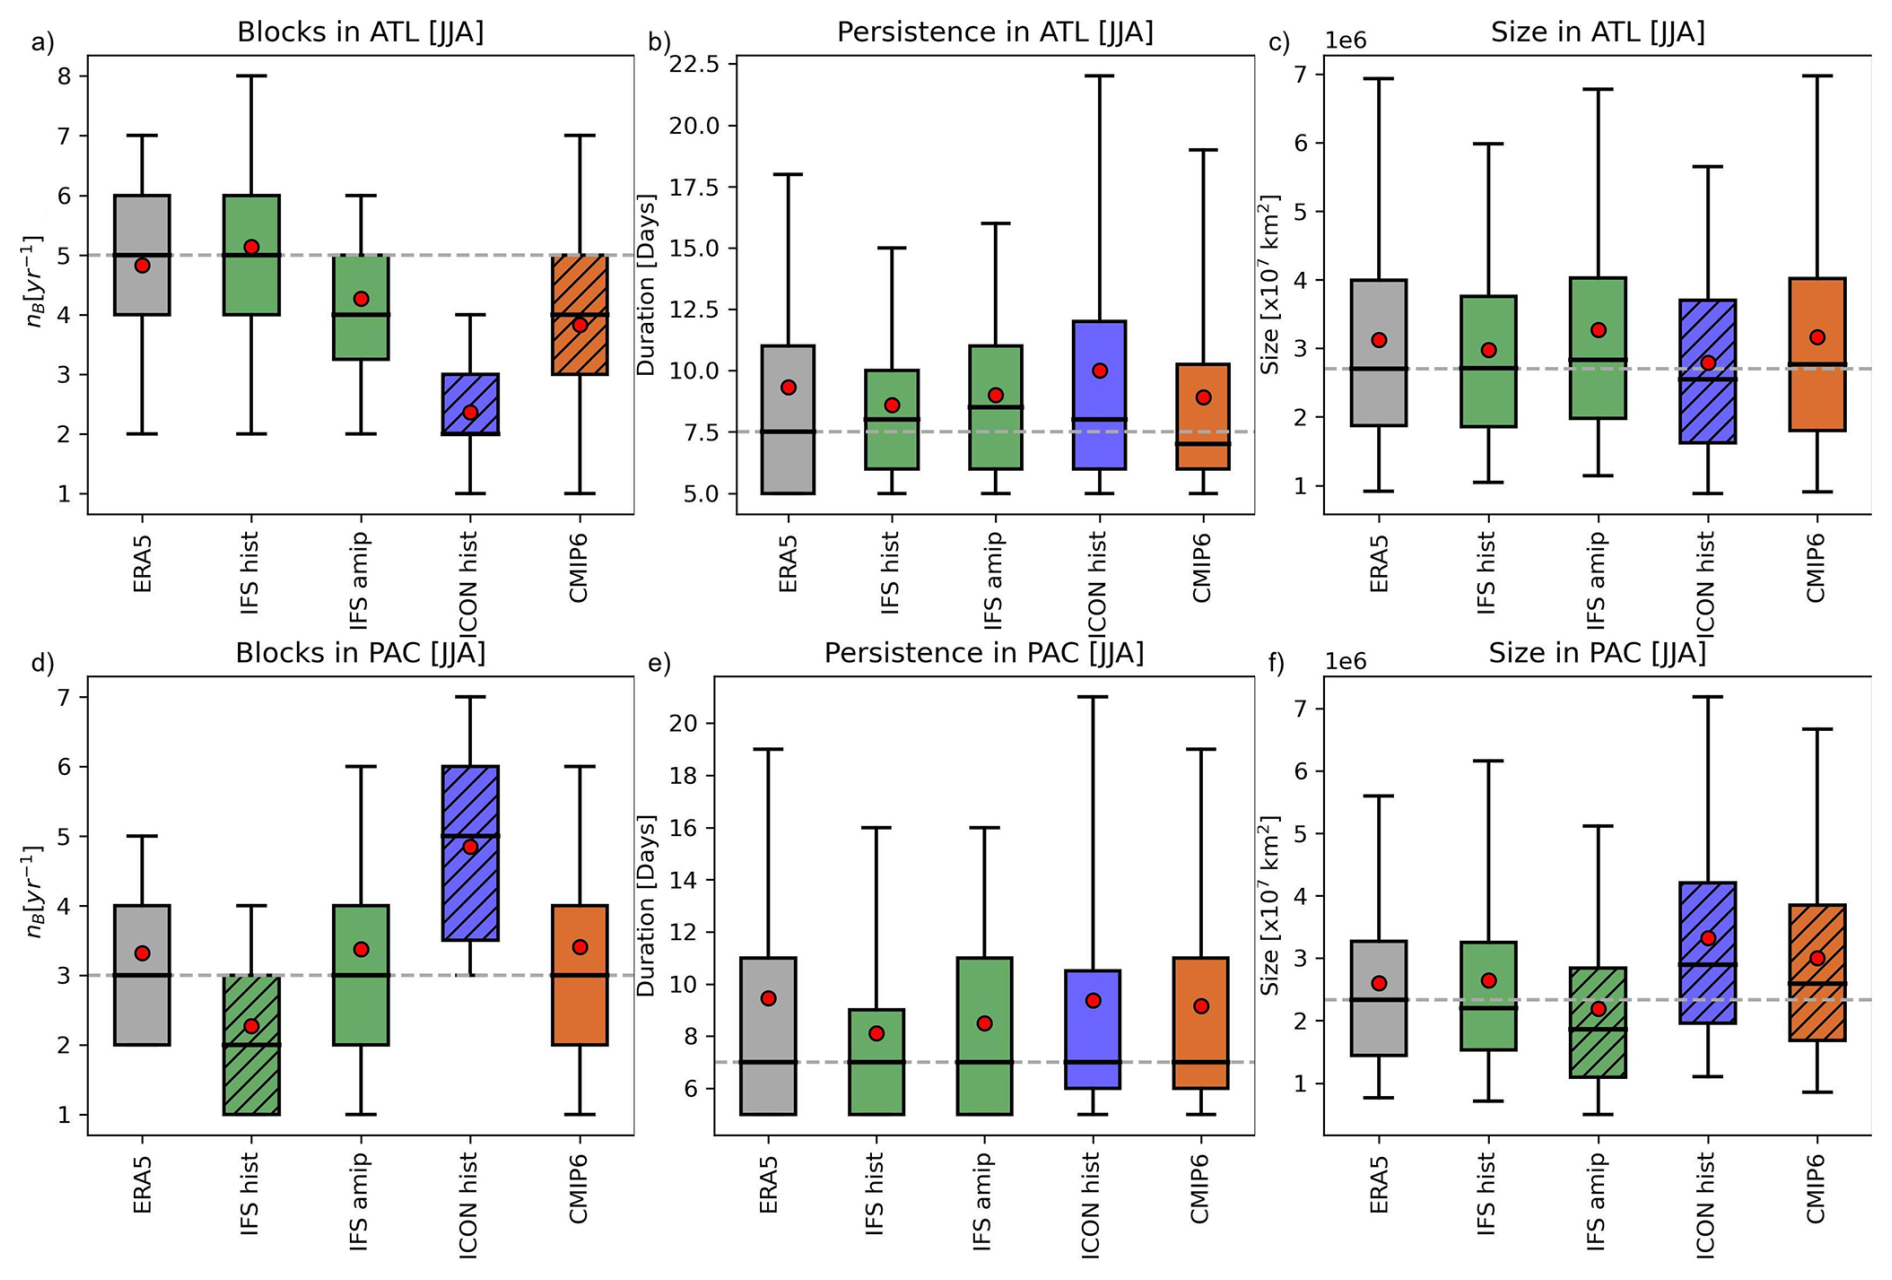
Figure 7Number of blocking events and their properties in the (a, b, c) North Atlantic basin and (d, e, f) North Pacific basin during JJA: number of events (a, d), blocking duration (b, e), and blocking size (c, f). The extent of the basins is shown as solid lines in Fig. 1, with blue representing the Atlantic and red the Pacific basin. Boxes represent the interquartile range (Q1–Q3), with the horizontal line indicating the median, whiskers extending from the 5th to the 95th percentile, and the red dot denoting the mean. Hatched boxes indicate statistically significant differences relative to ERA5 based on a Mann–Whitney U test (p < 0.05).
In the North Pacific, the IFS historical simulation underestimates the blocking frequency, while IFS AMIP shows a modest reduction in the spatial extent of the bias relative to IFS hist and substantial differences with ERA5 remain. ICON hist exhibits a northward shift in blocking activity, leading to an overestimation at higher latitudes. The CMIP6 ensemble mean shows a different bias pattern, with a westward displacement of blocking maxima and an overall smaller magnitude than that seen in ICON.
Event counts show that IFS hist underestimates the number of blocking events (Fig. 7d), whereas IFS AMIP reproduces the ERA5 mean and median well but exhibits an overestimation in the upper tail of the distribution (95th percentile). ICON hist overestimates the number of blocking events across the distribution, while the CMIP6 ensemble underestimates it. Blocking duration (Fig. 7e) is well captured by the IFS models, whereas ICON exhibits longer upper-percentile durations. Blocking size (Fig. 7f) is systematically underestimated in IFS AMIP relative to ERA5, with the entire distribution shifted toward smaller block sizes, while IFS hist reproduces the observed distribution more closely. In ICON, the Pacific blocking frequency overestimation therefore primarily arises from an excessive number of events rather than from overly large or long-lived blocks. In contrast, IFS hist biases over the Pacific are mainly associated with a deficit in the number of blocking events (blocking initiation) rather than block size.
The key findings are:
-
ICON shows realistic blocking durations but underestimates blocking frequency in the North Atlantic and overestimates it in the North Pacific. ICON tends to simulate smaller blocks than ERA5 in the North Atlantic but larger blocks than ERA5 in the North Pacific.
-
IFS AMIP achieves the second-lowest RMSE for blocking frequency in the North Atlantic and exhibits compensating biases across blocking characteristics: it underestimates the number of blocking events but produces somewhat larger and longer-lived blocks, leading to a basin-averaged frequency that is relatively close to ERA5.
-
IFS hist best reproduces ERA5 median properties in the Atlantic but its Greenland blocking frequency is too high, likely because these blocks are too persistent.
-
In the North Pacific, CMIP6 outperforms the storm-resolving models for duration, while ICON hist has the highest block count and overestimates size.
-
The CMIP6 ensemble underestimates North Atlantic blocking frequency and number of events but captures blocking duration well. In some cases, its performance is comparable to or better than the storm-resolving models.
Taken together, these results show that storm-resolving simulations can improve aspects of summer blocking, especially when coupled with realistic SST forcing. However, their performance is not consistently better than the coarse-resolution CMIP models.
4.2.1 The representation of the background flow
In boreal summer (JJA), the climatological background flow differs markedly from winter, with generally weaker westerlies and a more zonally symmetric jet structure across the midlatitudes (e.g., Coumou et al., 2018). The composite 500 hPa zonal wind indicates that all storm-resolving simulations capture the seasonal weakening of the North Atlantic jet, although regional discrepancies remain in both jet position and strength. Over the jet entrance region, the IFS historical simulation exhibits a more equatorward jet position, whereas ICON hist and IFS AMIP display a relatively more poleward jet (Fig. 8a–c). Corresponding RMSE values for the Atlantic and Pacific basins are provided in Table 6.
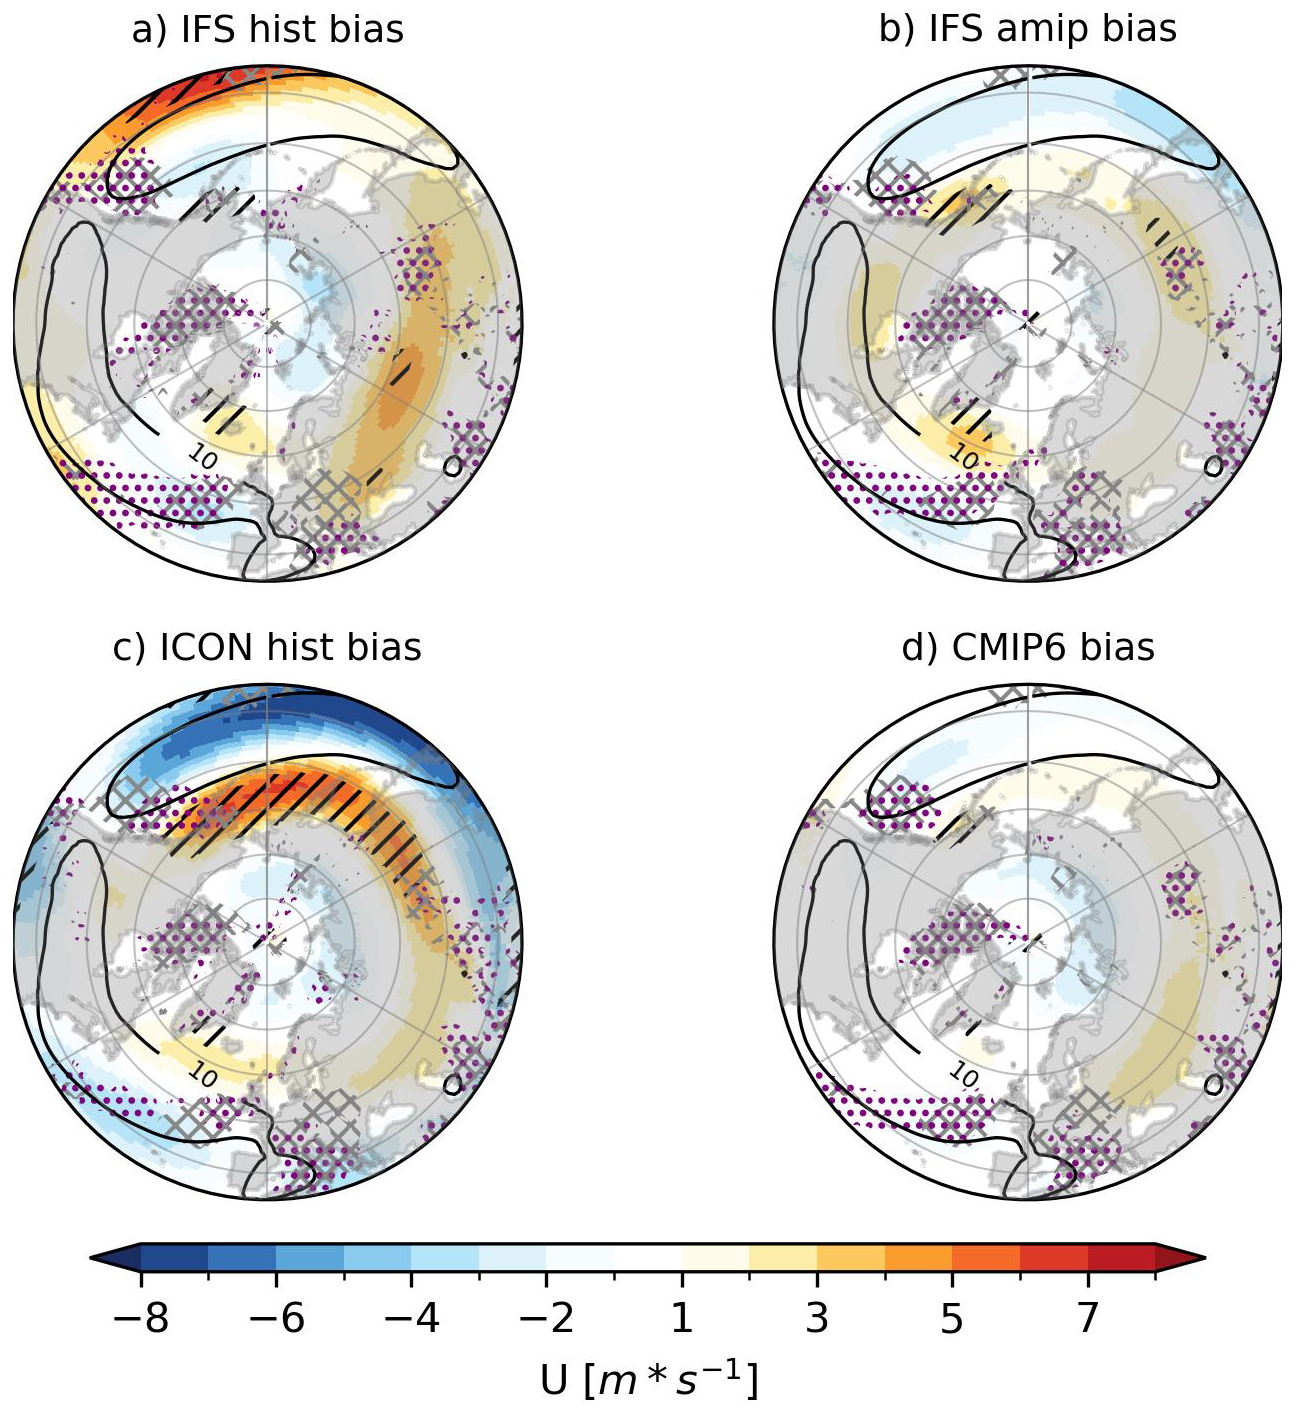
Figure 8Mid-level (500 hPa) zonal wind biases against ERA5 in the Northern Hemisphere summer for (a) IFS historical, (b) IFS atmosphere-only, (c) ICON historical, and (d) the CMIP6 ensemble mean based on 8 models. The ERA5 zonal wind is indicated by contours. Hatched areas indicate regions where the bias relative to ERA5 exceeds 80 %. Regions of strong zonal wind deceleration ( < −0.3 × 10⁻⁵ s−1) – potential jet exit zones linked to wave-breaking and blocking – are highlighted with purple stippling for each model and gray hatching for ERA5.
Table 6Root Mean Square Error (RMSE) of 500 hPa zonal wind relative to ERA5 for different historical simulations, computed over the Northern Hemisphere Atlantic and Pacific basins (JJA).
Southeast of Greenland, all storm-resolving models exhibit a positive zonal wind bias relative to ERA5 (Fig. 8a–c), which is accompanied by a poleward extension of the jet in this region, visible in both the spatial wind bias maps (Fig. 8) and the Atlantic zonal-mean distribution (Fig. S4). Among the storm-resolving models, IFS AMIP has the lowest basin-wide RMSE (1.30 m s−1) followed by ICON (1.50 m s−1) and IFS hist (1.98 m s−1), and the most accurate representation of both jet structure and blocking activity.
The CMIP6 ensemble mean exhibits weaker biases over the North Atlantic, characterized primarily by positive zonal wind biases over Eurasia and negative wind biases over the Asian arctic (Fig. 8d).
In the North Pacific, IFS hist simulates stronger seasonal-mean mid-tropospheric westerlies compared to ERA5 (Fig. 8a), together with an equatorward displacement of the zonal-wind maximum over the eastern basin, also evident in the latitudinal mean (Fig. S4). The ICON hist bias pattern is characterized by reduced winds near the climatological jet core over the central Pacific and enhanced winds on its poleward flank in the jet exit region, consistent with a broadened jet structure (Fig. 8c). This jet configuration is associated with an underestimation of blocking over Eurasia and an overestimation at higher latitudes in the Pacific (cf. Fig. 6). IFS AMIP shows a more realistic jet latitude and intensity in terms of basin-averaged RMSE (1.60 m s−1). Similar, though weaker, zonal wind biases are visible in the CMIP6 ensemble mean (Fig. 8d), with reduced winds near the jet core and modest overestimation on either side of the jet.
Regarding the entire hemisphere, IFS AMIP performs best in reproducing observed jet structure and blocking activity in JJA, with the lowest RMSE across both basins and the most realistic meridional structure of blocking. In contrast, the biases in jet latitude and intensity in ICON hist and IFS hist, particularly their poleward-displaced jets and excessive westerlies over Asia, are co-located with blocking biases in both the Atlantic and Pacific sectors.
4.2.2 The representation of the ocean
In JJA ocean–atmosphere coupling is generally weaker than in winter (e.g., Kushnir et al., 2002). This seasonal difference arises because the atmospheric circulation tends to be more barotropic and less sensitive to ocean surface anomalies. In addition, the shallower mixed layer depth reduces the ocean's thermal inertia and limits its ability to influence the atmosphere (e.g., Barsugli and Battisti, 1998). As a result, processes such as land-surface heating and convective activity often exert a stronger influence on the background flow than SST anomalies (e.g., Shaw and Voigt, 2015). Nonetheless, persistent and spatially coherent SST anomalies can still affect large-scale circulation and modulate blocking frequency during summer (e.g., Shaw and Voigt, 2015; Coumou et al., 2018; Osborne et al., 2020).
JJA SST biases relative to ERA5 show that IFS hist exhibits widespread negative anomalies in the North Atlantic, including south of Greenland where blocking frequency is overestimated (Fig. 9a). In contrast, IFS AMIP, which is forced with observed SSTs, displays substantially smaller blocking biases in this region. The CMIP6 ensemble, which exhibits weaker negative or near-neutral SST biases relative to ERA5 in the high-latitude North Atlantic, is also associated with weaker Greenland blocking. These results suggest a correspondence between negative SST biases and enhanced blocking in the high-latitude North Atlantic in IFS hist (e.g., Häkkinen et al., 2011). However, this relationship is not evident in the North Pacific and is not consistent across all models.
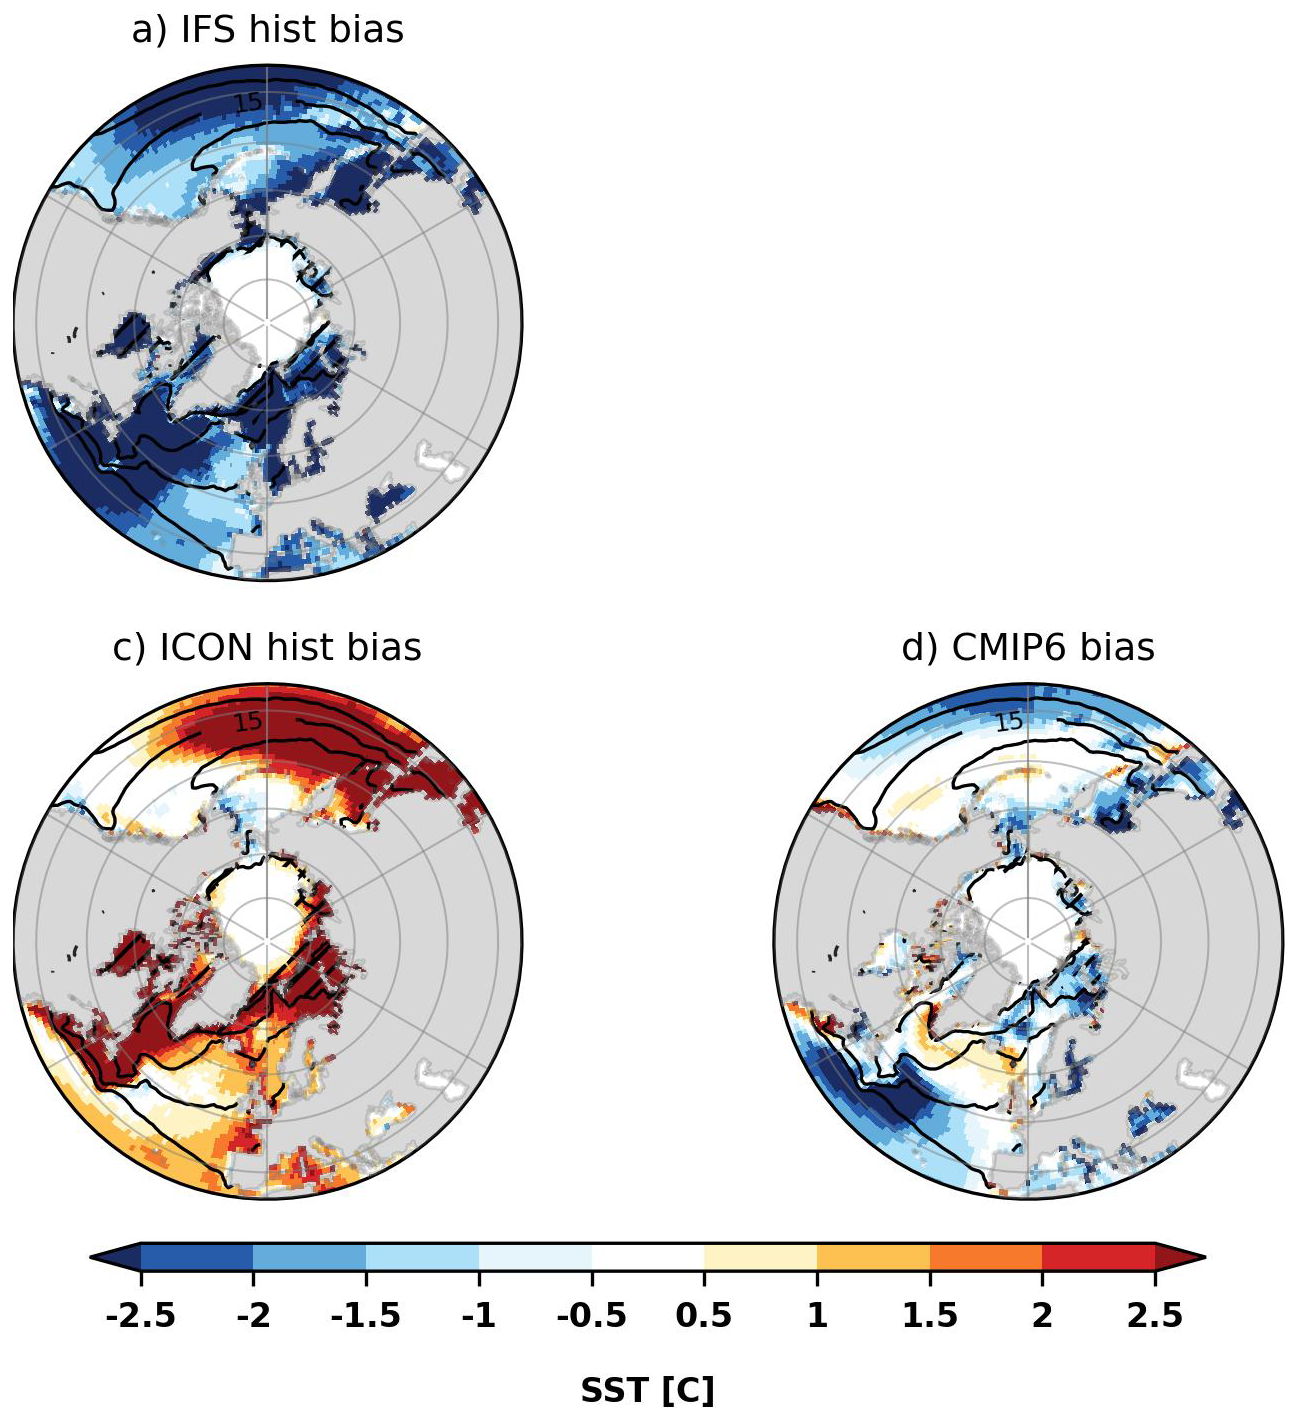
Figure 9SST biases against ERA5 in the Northern Hemisphere summer for (a) IFS historical, (c) ICON historical, and (d) the CMIP6 ensemble mean based on 8 models. The ERA5 SST is indicated by contours. Hatched areas indicate regions where the difference relative to ERA5 exceeds 80 % in degree Celsius.
In contrast, ICON hist displays positive SST biases across most of the North Atlantic with the exception of the central basin. Such positive biases may enhance surface fluxes and thereby strengthening eddies (Fig. 9c).
In the North Pacific, IFS hist simulates lower SSTs than ERA5, though the impact of this cold bias is discussed further in Sect. 5. By contrast, the ICON historical run exhibits widespread warm biases. The associated changes in baroclinicity appears linked to a poleward-shifted jet, accompanied by a northward displacement of blocking frequency. This suggests that the blocking response to SST anomalies is complex and depend on the interaction between SST patterns, the background flow, and eddy activity.
Taken together, these results suggest that even in summer, SST anomalies can influence blocking characteristics. Accurate representation of ocean surface conditions, either through coupling or prescribed SST forcing, remains important for reducing blocking biases in summer simulations.
4.2.3 The representation of the storm-tracks
Storm-track intensity biases during JJA indicate that, compared to DJF, storm-tracks are generally weaker and shifted poleward, consistent with reduced baroclinicity and a weaker jet stream (e.g., Zappa et al., 2013; Priestley et al., 2023; Harvey et al., 2020) (Fig. 10).
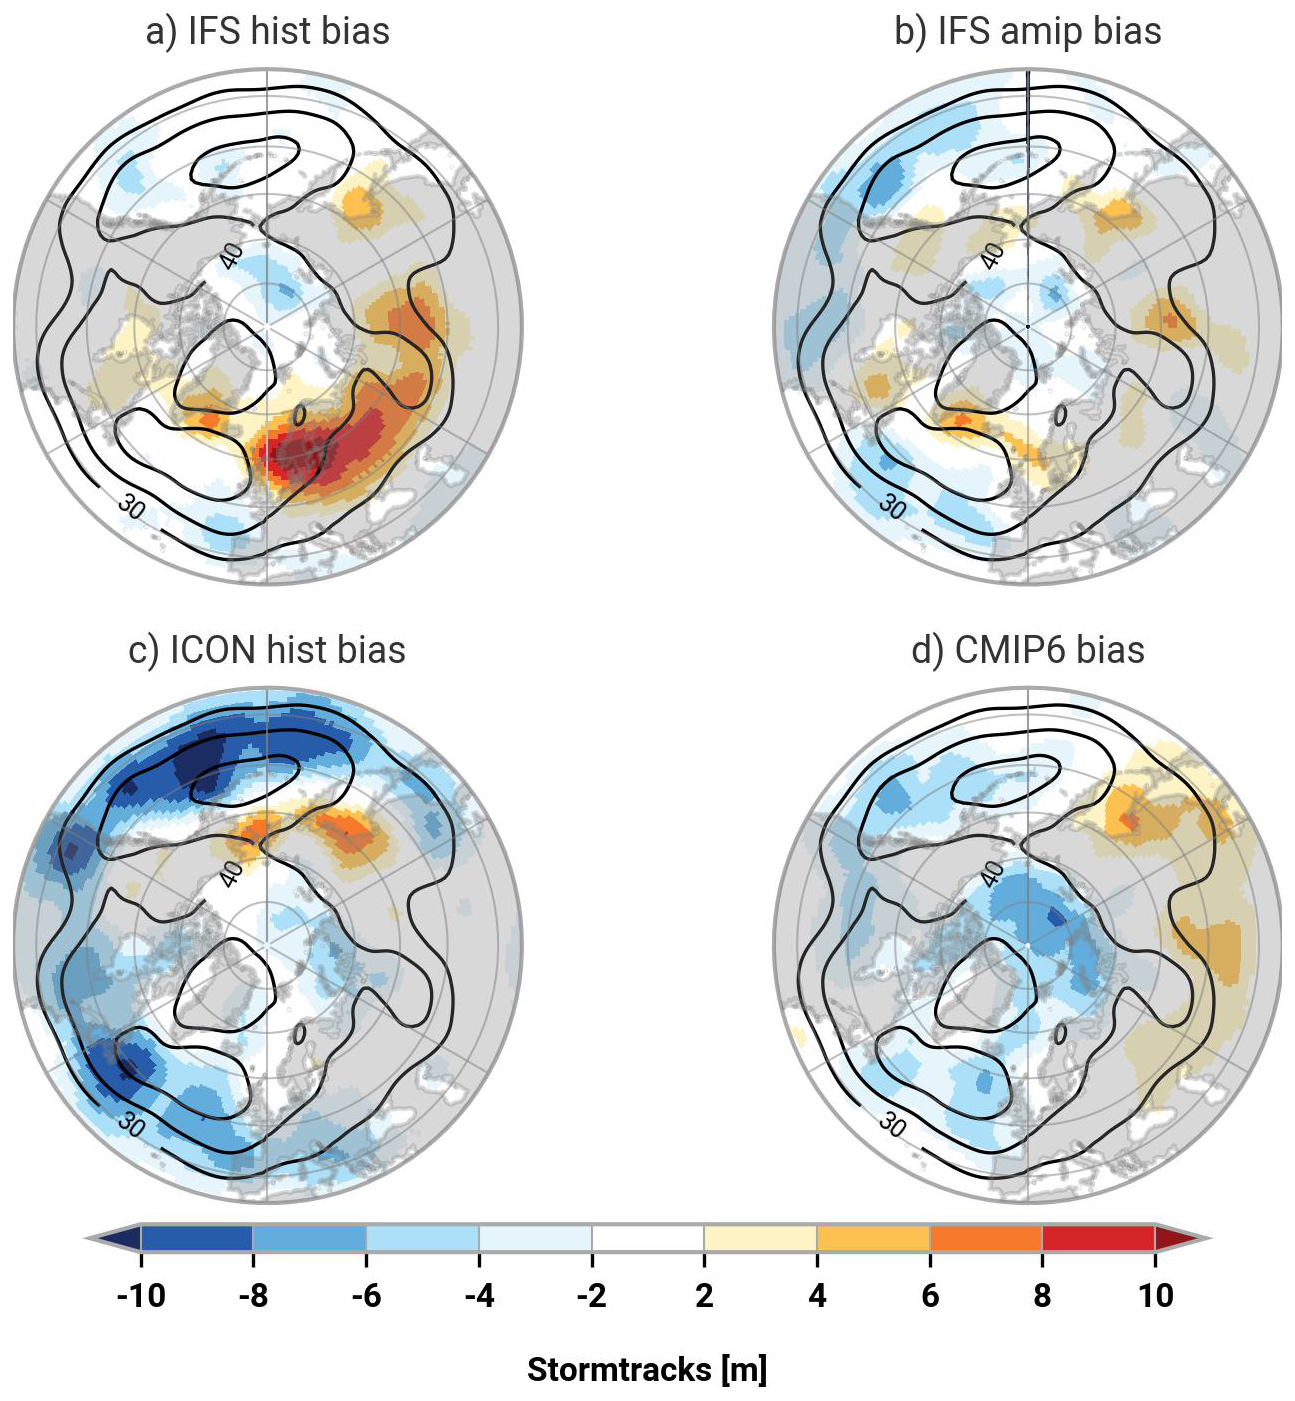
Figure 10Storm-tracks difference to ERA5 in the Northern Hemisphere summer for (a) IFS historical, (b) IFS atmosphere-only, (c) ICON historical, and (d) the CMIP6 ensemble mean. The ERA5 storm-tracks amplitude is indicated by contours. Hatched areas indicate regions where the relative difference to ERA5 exceeds 80 %.
In the North Atlantic, the IFS hist shows a storm track that extends too far east compared to ERA5, with a localized intensity bias maximum south of Greenland, coinciding with the maximum in blocking frequency bias. IFS AMIP most closely resembles ERA5 in both storm-track location and intensity over the Atlantic and outperforms the CMIP6 ensemble. These small biases align with the improved blocking representation in IFS AMIP. ICON simulations feature a weaker storm-track in the North Atlantic relative to both ERA5 and IFS AMIP.
In the North Pacific, all models simulate a storm-track that is stronger in the jet entrance and weaker at the jet exit compared to ERA5, with ICON additionally indicating a slight poleward shift. In IFS and CMIP6 simulations, the weakened storm-track over the eastern North Pacific coincides with reduced blocking. The meridional displacement in ICON is likewise reflected in the blocking patterns, with ICON overestimating blocking frequency at higher latitudes. These results suggest that the wintertime relationship – where a weaker jet corresponds to fewer blocks – does not hold universally across all seasons and regions. Overall storm-track activity biases suggest a positive correlation with blocking biases during summer.
To further explore the relationship between storm-track intensity and blocking frequency, we compute the spatial correlation of their biases relative to ERA5 (Fig. S8). In the North Pacific, CMIP6 models show a moderate positive correlation on average (ensemble mean r = 0.29), while correlations in the North Atlantic are weak and close to zero (ensemble mean r = −0.07). Storm-resolving models also exhibit region-dependent correlations. IFS hist shows positive correlations in both basins (Atlantic r = 0.57, Pacific r = 0.58), ICON hist and IFS AMIP display weaker positive correlations in the Atlantic (ICON hist r = 0.03, IFS AMIP r = 0.07) and moderate correlations in the Pacific (ICON hist r = 0.34, IFS AMIP r = 0.18). Overall, these results indicate that the spatial correspondence between storm-track and blocking biases is mostly positive but basin-dependent.
4.3 Climate change insights
After evaluating present-day blocking biases, we next examine projected changes under future climate conditions. Specifically, we analyze the IFS SSP3-7.0 simulations to explore how blocking frequency and characteristics may evolve in response to anthropogenic forcing, with attention to seasonal and regional differences. These results should be interpreted cautiously, given the substantial biases in the historical simulations – particularly regarding jet structure, SST patterns, and blocking persistence.
The ICON scenario runs were also analyzed but are shown only in the Supplement. In the ICON simulation, the absence of SST warming implies that blocking frequencies mainly reflect internal variability, although they still provide a useful illustration of how storm-resolving models simulate blocking. In the ICON DestinE simulation, the historical (10 km atmosphere/5 km ocean–ice) and future (5 km across components) runs differ in resolution, making it difficult to disentangle scenario signals from resolution effects. Nevertheless, we document these results in the Supplement, as they still provide insight into ICON’s representation of blocking (see Figs. S5 and S6).
Figure 11 presents projected changes in blocking frequency for (a) DJF and (b) JJA. Regions exceeding the 80 % threshold are highlighted to emphasize areas with pronounced relative changes in blocking frequency. This threshold is not intended as a formal measure of statistical significance, but rather as an indicator of strong changes.
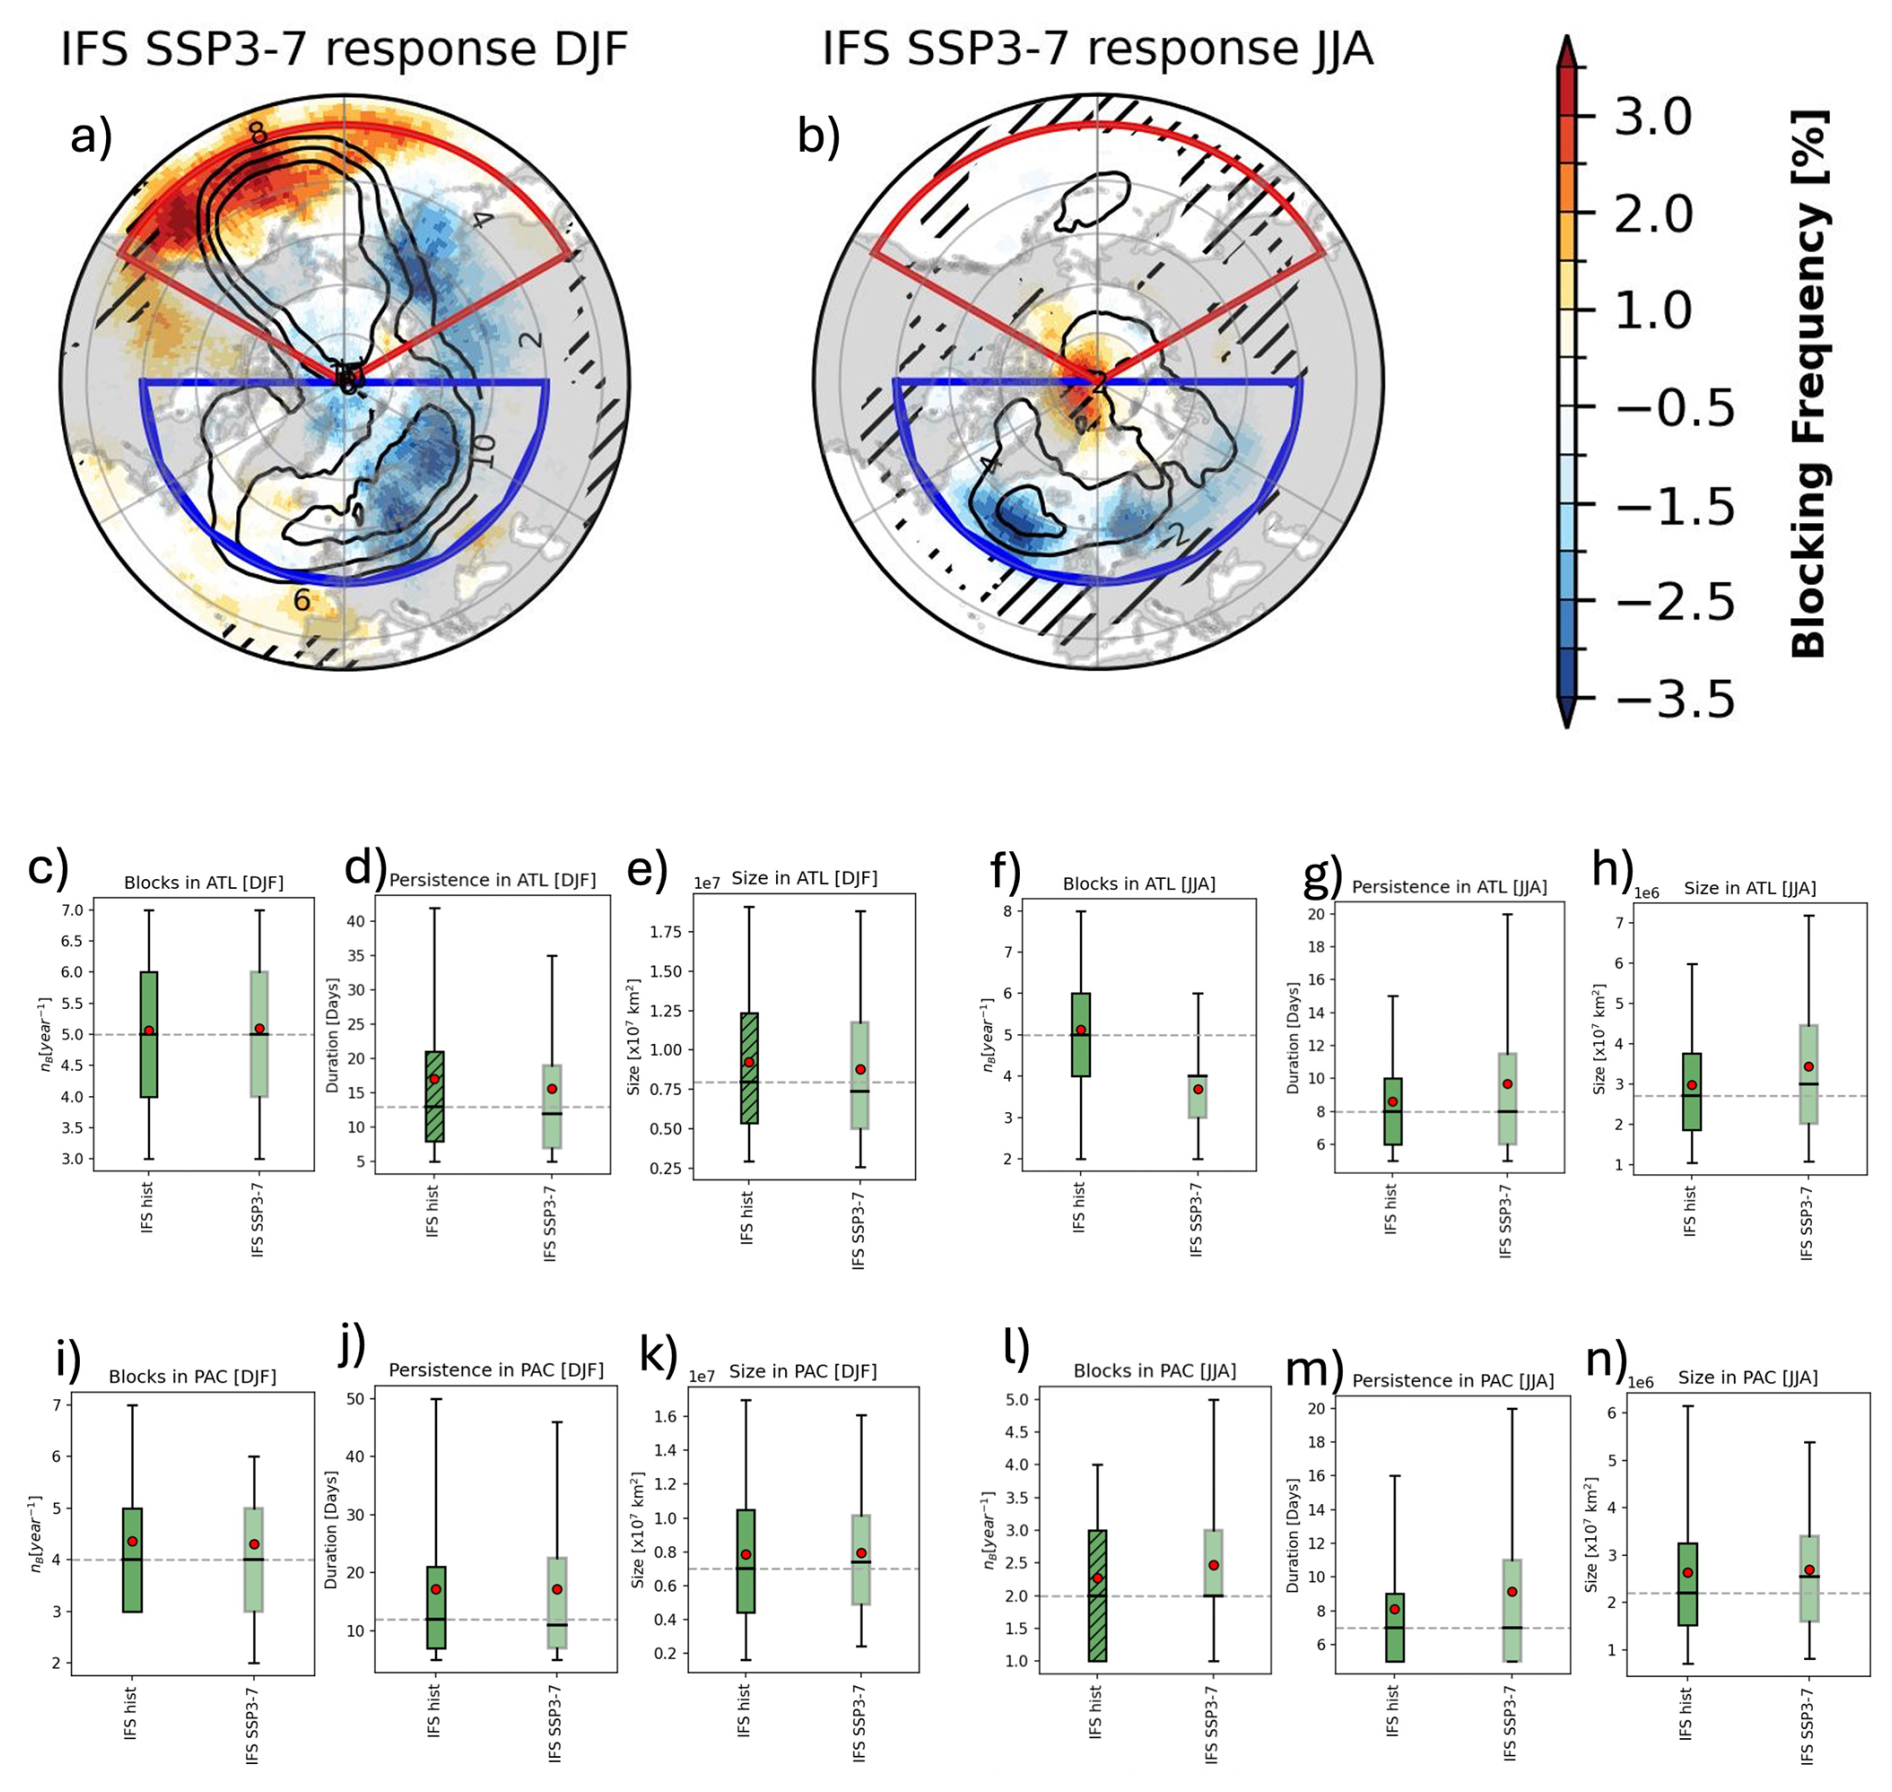
Figure 11IFS blocking response (SSP3-7.0 minus historical) during (a) winter and (b) summer. Black contours indicate IFS historical blocking frequency (2 % intervals starting at 2 %). Hatched areas highlight regions with relative differences exceeding 80 %. Blue and red dashed outlines indicate the North Atlantic and North Pacific basins, respectively. Blocking properties in the North Atlantic (blue) and North Pacific (red) basins during (c–e, i–k) winter and (f–h, l–n) summer. Boxes represent the interquartile range (Q1–Q3), horizontal lines the median, whiskers the 5th–95th percentiles, and red dots the mean. Hatched boxes denote statistically significant differences relative to ERA5 (Mann–Whitney U test, p < 0.05). SSP3-7.0 simulations are shown as gray-edged boxes.
In DJF, IFS projects a reduction in high-latitude blocking frequency, most pronounced over northern Eurasia and parts of northern Europe, consistent with previous studies (Woollings et al., 2018). At the same time, increases in blocking frequency are simulated at lower latitudes, particularly over the North Pacific, where enhanced frequencies occur south of the present-day climatological maximum. This indicates an equatorward tendency of Pacific blocking, accompanied by a zonal redistribution toward the eastern North Pacific.
The magnitude of these projected changes is comparable to the present-day blocking frequency biases in IFS. Note that the color scale in Fig. 11 differs from that in Fig. 1.
In JJA, IFS simulates a decrease in blocking frequency across the mid-latitudes most prominently over the central North Atlantic and northern Europe. IFS simulates an increase in blocking frequency at higher latitudes, particularly northern Greenland. The reduced blocking south of Greenland is spatially co-located with SST anomalies in the North Atlantic (Fig. 12d), including the region of the North Atlantic warming hole.
Although the IFS response broadly follows that of CMIP6, some discrepancies remain. In winter, CMIP6 projects an increase in blocking frequency over eastern Europe and western Asia that is not found in the IFS projections. In summer, IFS likewise does not project the decrease in blocking frequency over the North Pacific seen in CMIP6 (Woollings et al., 2018).
Beyond frequency, we also assess projected changes in blocking characteristics such as duration, size, and event count (Figs. 11). Overall, these properties do not differ significantly from historical values across most regions, but contrasting seasonal tendencies emerge. In summer, IFS projects slightly larger and longer-lived blocks, particularly over the Atlantic, accompanied by a decrease in the number of blocking events in this basin. In winter, blocking events tend to be smaller and shorter-lived over the Atlantic, while blocking counts remain broadly similar to historical values. Over the North Pacific, blocking counts show little change in winter but a modest increase in summer, particularly in the upper percentiles, alongside relatively small changes in block size and duration.
Projected changes in jet and storm-track structure under SSP3-7.0 are small compared to the present-day model biases (Fig. 12). In general, the winter jet becomes slightly more zonal, while in summer it shifts poleward, consistent with previous studies (e.g., Harvey et al., 2020). In summer, over the northwestern Atlantic, IFS indicates a modest strengthening of the jet. Downstream of this region, south of Greenland, IFS projects a enhancement of storm-track activity that is spatially co-located with the simulated decrease in blocking frequency. In winter, the largest circulation response occurs in the Pacific, with intensified midlatitude westerlies and storm-tracks in regions where blocking frequency increases. However, the magnitude of these circulation changes remains small, making it difficult to disentangle the relative roles of individual processes.
The projected circulation changes occur alongside distinct SST patterns (Fig. 12c, d). In the North Atlantic, a warming hole south of Greenland contrasts with pronounced warming along the Gulf Stream. These SST patterns spatially coincide with changes in jet structure and reduced summer blocking over the Atlantic, although a direct causal link cannot be established given the magnitude of the model biases. In the North Pacific, SSTs warm more uniformly, with stronger warming at midlatitudes during winter, potentially modifying meridional temperature gradients and the background flow.
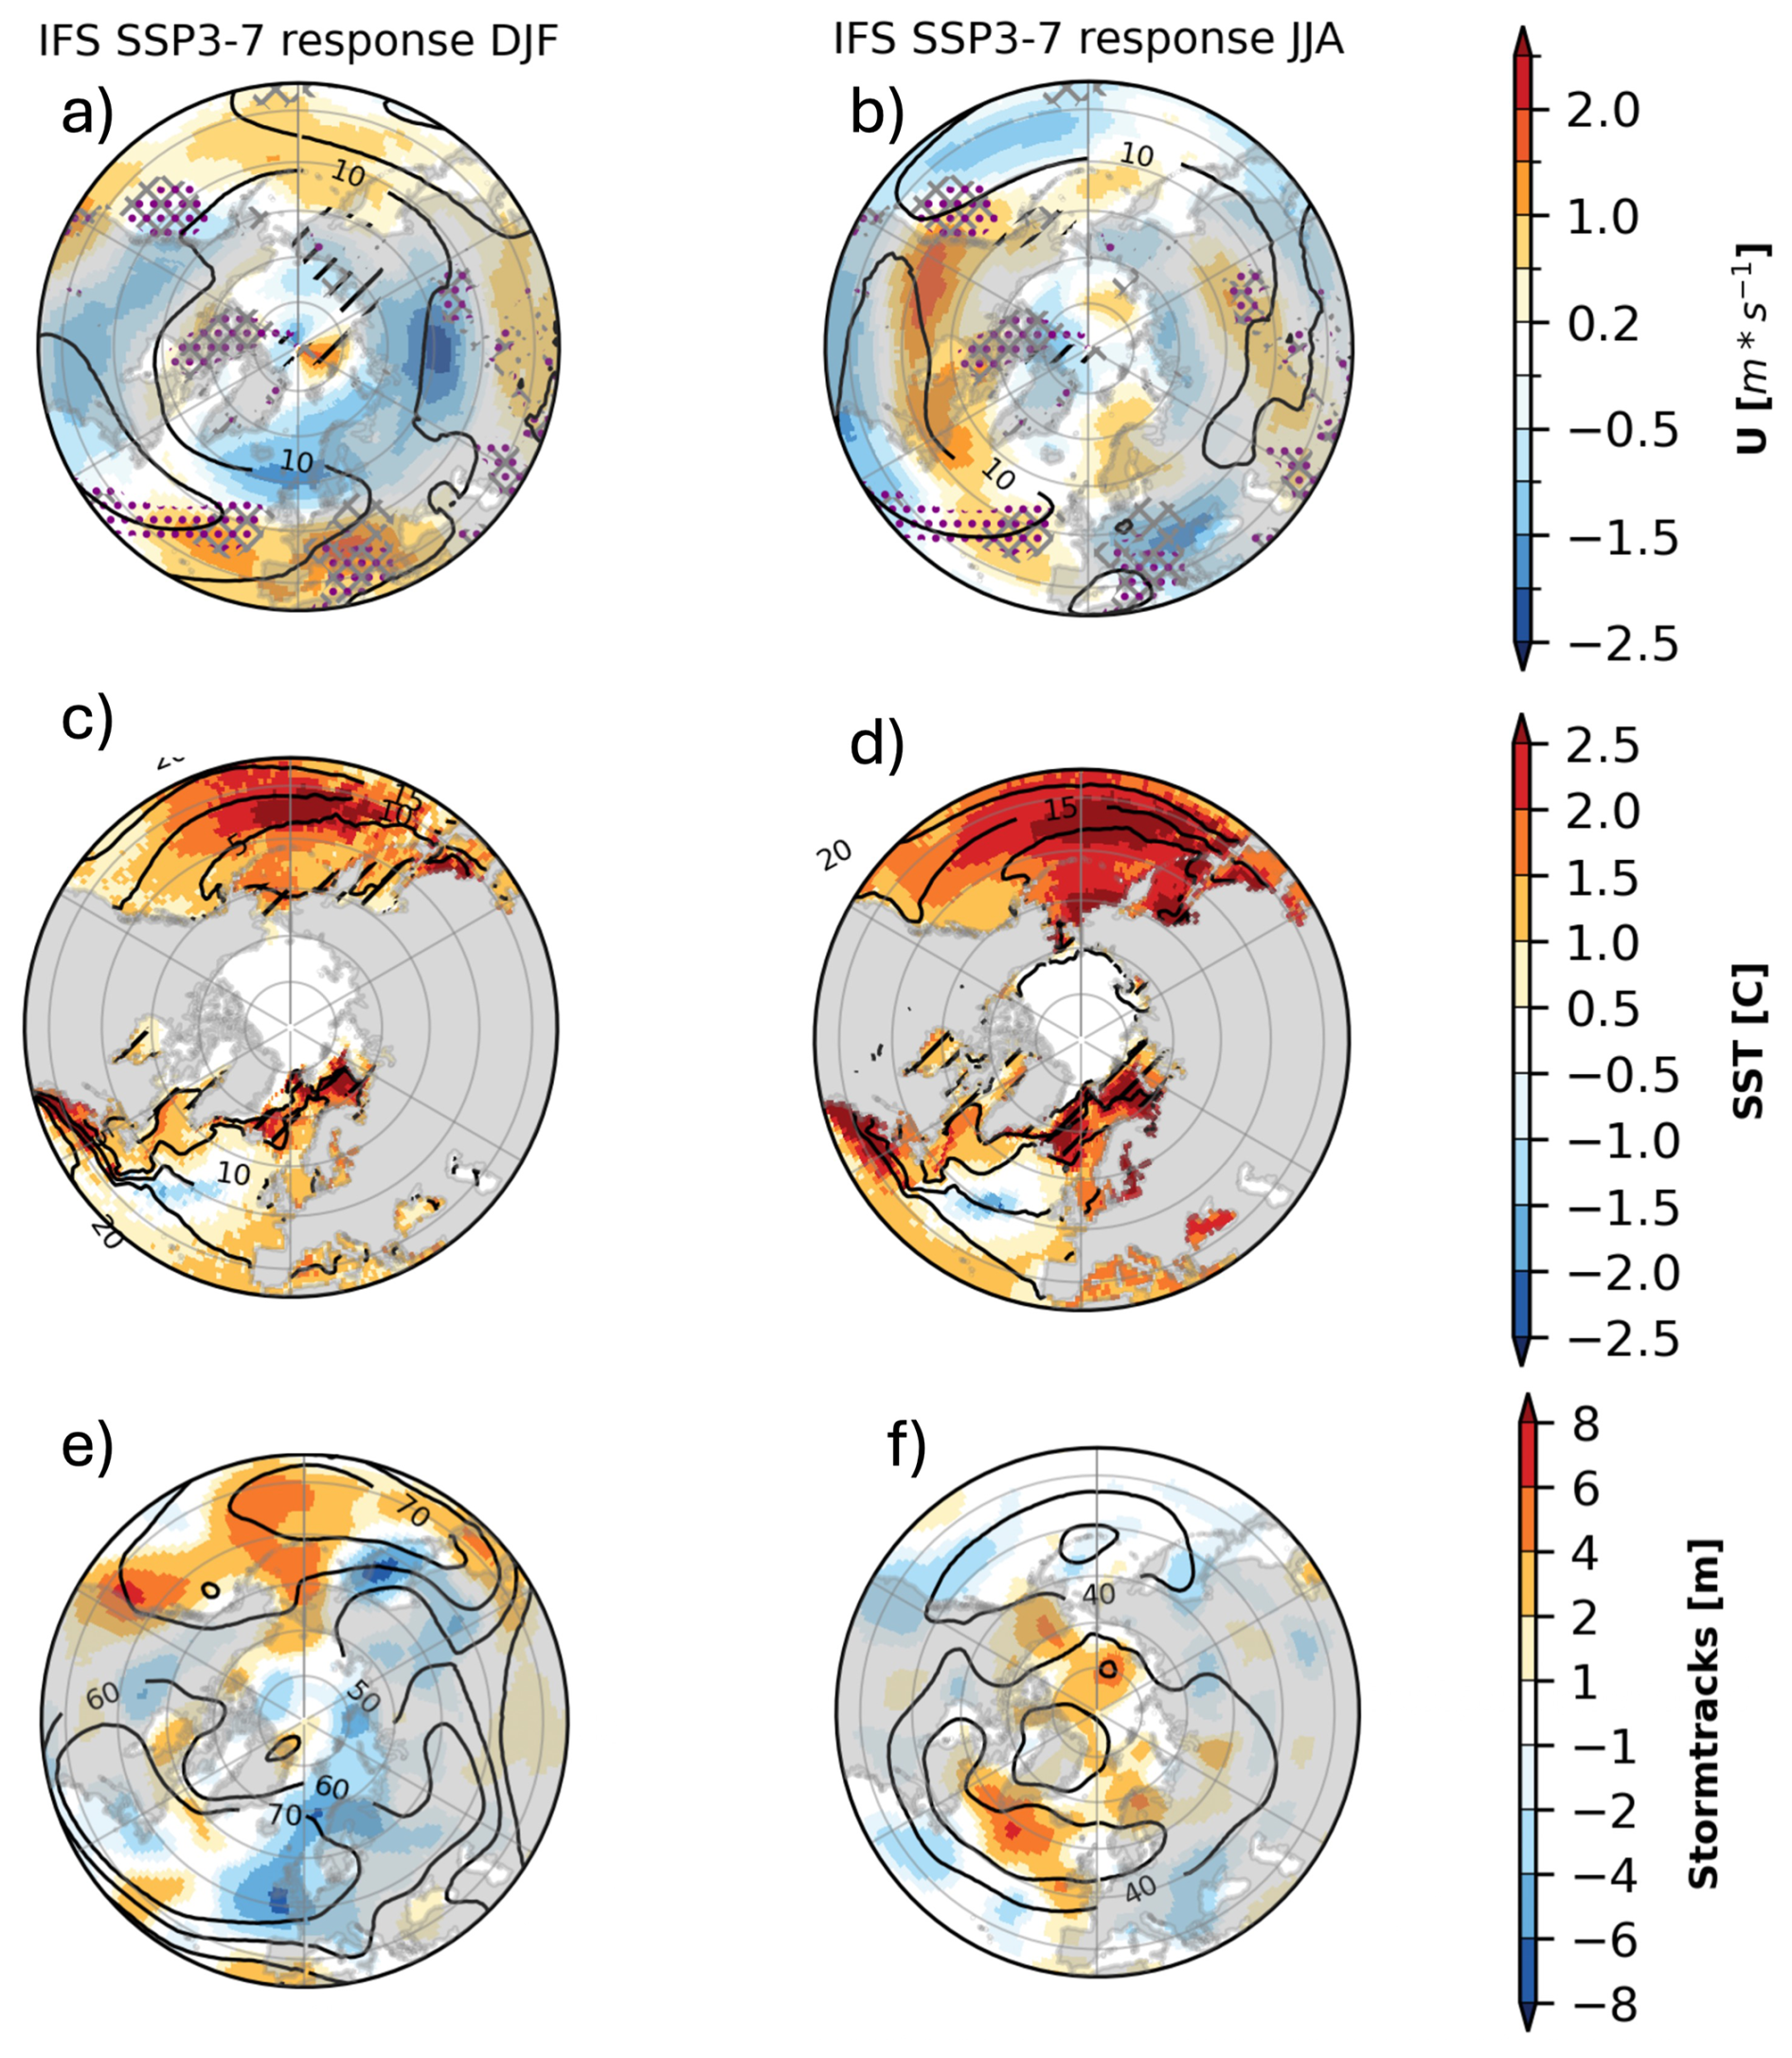
Figure 12IFS projected changes in (a, b) background flow, (c, d) SSTs, and (e, f) storm-tracks under SSP3-7.0. Contours indicate IFS historical magnitude. Regions of strong zonal wind deceleration ( < −0.3 × 10⁻⁵ s−1) – potential jet exit zones linked to wave-breaking and blocking – are highlighted with purple stippling for future climate and gray hatching for present-day are shown in panels (a) and (b). Hatched areas mark regions where the relative difference to the IFS hist exceeds 80 %.
Overall, the SSP3-7.0 simulations point to a net reduction in Atlantic blocking in summer and a net increase in North Pacific blocking in winter. However, these signals should not be interpreted as robust projections, as they are derived from a single storm-resolving model and may be influenced by biases in the mean state and circulation identified in the historical simulations. Instead, they provide an indication of the sensitivity of blocking to future forcing within this modelling framework.
These results highlight the need for process-based analyses to disentangle the interplay between SST changes, jet dynamics, and blocking, particularly in light of the differences between AMIP and coupled simulations, which suggest an important role of SST biases.
5.1 Blocking Representation in Storm-Resolving Models
Our results show that increasing horizontal resolution to the storm-resolving scale can improve certain aspects of atmospheric blocking representation, but does not systematically eliminate long-standing biases. Based on multi-decadal simulations, the storm-resolving IFS and ICON configurations reproduce several regional blocking characteristics more realistically than the CMIP6 ensemble mean, particularly when realistic sea surface temperatures (SSTs) are prescribed. For example, IFS AMIP better captures blocking duration and size during boreal winter, consistent with earlier work from idealized experiments (Schemm, 2023; De Luca et al., 2024) and high-resolution CMIP6 simulations (Schiemann et al., 2017, 2020; Gao et al., 2025) showing that higher resolution and improved forcing enhance the persistence of large-scale circulation regimes. However, these improvements are spatially and seasonally dependent and are not uniform across models.
Notably, ICON underestimates North Atlantic blocking frequency in both winter and summer, despite its explicit treatment of moist processes, while some CMIP6 models perform comparably well or better for specific blocking metrics such as duration or spatial extent. This confirms that horizontal resolution alone is not sufficient to resolve blocking biases, and that model formulation and boundary forcing remain critical. Similar conclusions have been drawn in previous studies using high-resolution CMIP and idealized model configurations, suggesting that storm-resolving models represent an important but incomplete step toward improved blocking simulation (e.g., Davini and D'Andrea, 2020).
5.2 Role of SST Biases and Air–Sea Coupling
Sea surface temperatures and ocean–atmosphere coupling play a central role in shaping midlatitude circulation and blocking behavior (e.g., Häkkinen et al., 2011; Athanasiadis et al., 2022; Cheung et al., 2023). At storm-resolving resolution, mesoscale SST gradients and frontal structures are better resolved, enhancing air–sea coupling and increasing the sensitivity of the atmosphere to SST biases (Wills et al., 2024; Vivant et al., 2025). This sensitivity is clearly reflected in the contrasting behavior of coupled and atmosphere-only simulations.
Among the IFS configurations, the AMIP simulation (forced with observed SSTs) most closely reproduces ERA5 blocking characteristics, particularly with respect to wintertime duration and North Atlantic and North Pacific blocking frequency. This highlights the importance of realistic SST boundary conditions. In contrast, IFS hist exhibits a negative SST bias in the North Atlantic, especially in summer, coinciding with regions of enhanced blocking frequency. Rather than implying a direct causal relationship, this spatial correspondence suggests that SST biases can modulate the background state in which blocking develops, consistent with earlier studies linking North Atlantic SST errors to circulation biases (Häkkinen et al., 2011; Athanasiadis et al., 2022).
ICON simulations display positive SST biases in both the North Atlantic and North Pacific mid-latitudes. In winter, these warm anomalies coincide with intensified jets and reduced blocking, broadly consistent with theoretical expectations that stronger baroclinicity suppresses blocking. In summer, however, the relationship is less robust: ICON exhibits a poleward-displaced jet without a commensurate intensification, and the associated blocking response is weak and regionally variable. This seasonal contrast indicates that the influence of SSTs on blocking depends strongly on the background flow regime.
While SST biases in IFS hist extend across much of the North Atlantic, their potential influence on blocking and storm-track behavior is unlikely to be spatially uniform. The dynamical impact of SST anomalies depends on their position relative to the climatological SST gradients and the mean storm-track location. In particular, high-latitude regions south of Greenland coincide with strong background baroclinicity and frequent storm-track activity, making blocking potentially more sensitive to SST-related modifications of surface fluxes and lower-tropospheric stability there. In contrast, SST anomalies in other parts of the basin may have a weaker or different dynamical imprint. This spatial modulation helps explain why an apparent co-occurrence between negative SST biases and enhanced blocking emerges primarily in the high-latitude North Atlantic, while similar relationships are absent in ICON and differ in the North Pacific. Studies have even shown that Pacific SST gradients can even influence wave activity and blocking downstream over the Atlantic sector (Cheung et al., 2023; Hermoso et al., 2024).
Overall, these results emphasize that an accurate representation of SSTs (both in magnitude and spatial gradients) is essential for simulating blocking, particularly in high-resolution coupled models. Storm-resolving configurations amplify the atmospheric response to SST errors, underscoring the need to reduce oceanic biases alongside increases in resolution.
5.3 Jet, Storm-Track, and Blocking Interactions
Blocking behavior is tightly coupled to the structure and variability of the midlatitude jet and storm tracks. In storm-resolving simulations, biases in blocking frequency often co-occur with errors in jet latitude and intensity relative to ERA5. During winter, the overly zonal and poleward-displaced jets in ICON hist are associated with reduced blocking, whereas the more realistic jet configuration in IFS AMIP coincides with improved blocking representation.
Jet exit regions and areas of strong diffluent flow are particularly conducive to blocking formation (Hassanzadeh et al., 2014). In both IFS and ICON, biases in jet position and strength align spatially with blocking biases in the North Atlantic and North Pacific. These interactions are further shaped by storm-track variability: enhanced transient eddy activity can promote blocking onset through wave breaking, while displaced storm tracks can be a consequence of blocked flow (Booth et al., 2017).
In summer, however, this coupling changes. Both IFS and ICON exhibit predominantly positive correlations between blocking biases and storm track biases. These findings support previous work showing that while transient eddies are crucial for blocking onset, persistence and spatial extent are strongly conditioned by the background circulation and thermodynamic state (e.g., Brayshaw et al., 2008; Hassanzadeh et al., 2014; Zappa et al., 2014).
5.4 Influence of Moist Processes
Despite the benefits of higher spatial resolution and improved SST forcing, biases in blocking representation persist in the IFS AMIP simulations, pointing to additional relevant processes. Misrepresentation of moist diabatic processes, particularly latent heat release associated with warm conveyor belts, are increasingly recognized as important contributors to blocking bias in CMIP6 (Dolores-Tesillos et al., 2025). Diabatic heating can amplify ridges, modify potential vorticity gradients, and precondition the flow for blocking development (e.g., Pfahl et al., 2015).
IFS and ICON differ substantially in their treatment of moist processes: IFS employs parameterized convection, whereas ICON explicitly resolves deep convection. These differences likely contribute also to the divergent blocking responses across models and configurations.
A more detailed process-based evaluation of moist dynamics (including vertical heating profiles, cloud–radiative feedbacks, and their interaction with large-scale flow) is required to understand and reduce persistent blocking biases in storm-resolving models.
5.5 Implications for Future Blocking Changes
In addition to present-day evaluation, our analysis provides a cautious first assessment of how blocking characteristics may evolve under future warming in storm-resolving simulations. The IFS SSP3-7.0 experiments suggest a redistribution of blocking activity, with reduced summer blocking over the North Atlantic midlatitudes and a tendency toward increased winter blocking in the southern North Pacific, consistent with an equatorward shift in this sector.
These changes occur alongside modest shifts in jet and storm-track structure. In summer, a strengthening of the Atlantic jet and downstream storm tracks coincides with reduced blocking frequency, whereas in winter the largest response is found in the Pacific, where enhanced jet and storm-track activity coincides with increased blocking. However, the magnitude of these projected changes remains small relative to present-day biases, complicating attribution and interpretation.
These results are broadly consistent with previous studies using CMIP-class models, which generally report modest and regionally dependent changes in blocking under climate change, often linked to shifts in jet position and storm-track activity (e.g., de Vries et al., 2013; Dunn-Sigouin and Son, 2013; Woollings et al., 2018; Davini and D'Andrea, 2020). At the same time, substantial inter-model spread and sensitivity to the mean state have been identified as key sources of uncertainty in these projections.
It is important to emphasize that these projected changes are derived from a single storm-resolving model and should therefore not be interpreted as robust projections. Instead, they provide an indication of the sensitivity of blocking to future forcing within this modelling framework, conditioned by the biases identified in the historical simulations.
In particular, the differences between AMIP and coupled configurations highlight the role of SST biases in shaping blocking behaviour, consistent with previous work demonstrating the sensitivity of blocking to SST gradients and air–sea coupling (e.g., Häkkinen et al., 2011; Scaife et al., 2011; Michel et al., 2023). This suggests that uncertainties in the mean state (especially in SSTs, storm tracks, and jet structure), can strongly influence the simulated response.
Projected changes in blocking duration, size, and event count are generally modest and often fall within the range of internal variability. This further underscores the need for caution when interpreting blocking trends from storm-resolving models and highlights the importance of reducing historical biases and expanding to multi-model frameworks before drawing robust conclusions about future changes.
Beyond their immediate interpretation, these results serve an important documentation purpose. They provide a baseline for evaluating future generations of storm-resolving models as larger ensembles and multi-model frameworks become available. While the projected changes are not definitive, documenting these early signals is essential for tracking the evolution of blocking responses and their sensitivity to model biases.
5.6 Broader Implications and Future Directions
To build on these advances, future research should prioritize the following directions:
-
Development and evaluation of coupled storm-resolving Earth system models, including multi-decadal simulations to assess blocking variability, climatological trends, and model stability across timescales.
-
Improvement of moist process parameterizations particularly those governing convection and cloud–radiative feedbacks to more accurately capture their role in blocking onset, maintenance, and decay.
-
Targeted diagnostics of moist dynamics, such as warm conveyor belt activity and vertical diabatic heating structures, to better understand their contributions to ridge amplification and flow reconfiguration.
-
Systematic analysis of storm-track–blocking coupling and SST–jet interactions, to clarify how transient eddies and ocean surface conditions jointly modulate blocking frequency and persistence under climate change.
-
Sensitivity experiments using perturbed SST fields, to isolate the relative contributions of oceanic versus atmospheric drivers in shaping jet structure and blocking behavior – especially in the context of high-resolution coupled models.
-
Improved representation of ocean–atmosphere coupling, with a focus on surface heat, moisture, and momentum exchange, as well as the resolution of SST gradients and mixed-layer processes critical for blocking and jet variability.
-
Reducing present-day blocking biases in multi-decadal historical simulations, as a prerequisite for more reliable assessments of regional and seasonal changes in atmospheric blocking under climate change conditions.
These research avenues will be essential for leveraging the full potential of storm-resolving modeling and for addressing the persistent uncertainties that affect our understanding and simulation of midlatitude atmospheric circulation in a warming climate.
5.7 Final Remarks
Storm-resolving modeling represents an important step toward more realistic simulations of atmospheric blocking and persistent weather extremes. However, our results show that increased spatial resolution alone is not sufficient. Meaningful improvements will require a combined approach that integrates high-resolution dynamics with accurate surface boundary conditions and targeted improvements in key physical processes. Advancing these elements together is essential for improving confidence in blocking simulations and their projected response to climate change.
This study evaluates the representation of atmospheric blocking in storm-resolving climate simulations from the nextGEMS, EERIE and DestinE projects, comparing them to ERA5 reanalysis and a CMIP6 multi-model ensemble. We assess blocking frequency, duration, and spatial extent during boreal winter (DJF) and summer (JJA) across the Northern Hemisphere. The analysis includes both coupled and atmosphere-only simulations using the IFS and ICON models, enabling a systematic examination of resolution effects, ocean boundary conditions, and large-scale dynamics. Finally, we also examined the blocking response under SSP3-7.0 in IFS.
Our key findings are:
-
Blocking biases remain in storm-resolving models. Relative to CMIP6, storm-resolving IFS and ICON simulations show both moderate improvements and deteriorations. Improvements are most apparent in the North Atlantic during winter, where the typical equatorward jet bias is reduced and blocking persistence is better captured (especially in IFS AMIP). However, in many other regions the storm-resolving simulations exhibit biases that are of comparable or even larger magnitude than those in CMIP6. Thus, higher resolution does not systematically translate into improved blocking climatologies.
-
Resolution modulates jets and blocking through competing effects. Higher resolution helps sharpen mean-flow gradients and jet structures, which can locally improve blocking representation. However, differences between IFS and ICON and across seasons reveal that these benefits depend strongly on model physics and coupling strategy rather than grid spacing alone. Some CMIP6 models still match or outperform the storm-resolving configurations in individual metrics, underlining that resolution alone is not a guarantee of better blocking.
-
Model differences are substantial. IFS simulations, particularly in the AMIP configuration, tend to agree more closely with ERA5 in terms of blocking frequency, size, and persistence. ICON, by contrast, often produces overly zonal jets and underestimates blocking in the Euro-Atlantic region. The comparison between IFS AMIP and coupled CMIP6 should be interpreted with caution, since no parallel AMIP analysis is done for CMIP6.
-
Ocean boundary conditions strongly modulate blocking. IFS AMIP simulations highlight the importance of realistic SST forcing, with reduced blocking biases compared to the coupled version. In summer, colder SSTs south to Greenland are associated with a blocking increase. Across models, warm and cold SST biases affect blocking differently depending on their location relative to climatological gradients, which in turn influences jet strength and latitude. These impacts are neither spatially uniform nor seasonally consistent.
-
Jet structure and storm-tracks shape blocking behavior. Blocking is closely linked to the configuration of the eddy-driven jet and storm-tracks. Strong, zonally aligned jets often coincide with reduced blocking, while jet curvature and jet-exit regions favor blocking occurrence. Although storm-track anomalies and blocking biases are not always co-located, positive correlations are found in some regions. Overall, their interaction is modulated by jet characteristics, baroclinicity, and seasonality.
-
Climate change projections are similar to previous studies. IFS SSP3-7.0 projects a decline in high-latitude winter blocking and reduced summer blocking over the midlatitude North Atlantic, with some indication of a poleward displacement in summer (e.g., Woollings et al., 2018). These changes are accompanied by modest jet and storm-track adjustments, though the relationship with blocking is not uniform. For example, in the winter Pacific, blocking and storm-track activity both intensify. Differences in projected block size, persistence, and spatial pattern underline the need for caution when interpreting these results. Overall, blocking appears sensitive to shifts in jet position, storm-track intensity, and SST forcing under warming, underscoring the importance of process-based evaluation and multi-model comparisons to build confidence in projections.
In summary, storm-resolving simulations provide a useful framework for a more process-based analysis of blocking by more explicitly resolving the interactions between processes, including transient eddies, jet structure, and air–sea coupling, as well as the underlying diabatic processes that are only coarsely represented in lower-resolution models. However, our findings show that increased resolution alone is not sufficient: improvements in some regions are offset by deteriorations elsewhere, reflecting persistent mean-state biases. The processes considered here are strongly coupled, and their individual contributions to blocking biases cannot be cleanly separated. For example, differences between AMIP and coupled simulations highlight the influence of SST biases, but these also feedback onto jet structure and storm-track activity, which in turn affect blocking. This coupling makes it difficult to attribute errors to a single dominant factor. Advancing the simulation of blocking therefore requires not only higher resolution but also improved representation of the coupled system, including ocean boundary conditions, diabatic processes, and their interactions across scales. Future work should prioritize coupled storm-resolving Earth system models, targeted sensitivity experiments, and process-based evaluation across multiple models. These efforts are essential to reduce uncertainty, improve confidence in climate projections, and better assess the risks of persistent weather extremes in a warming climate.
The code of blocking identification is available from https://github.com/steidani/ConTrack (Steinfeld, 2020).
CMIP6, nextGEMS and EERIE data are available via https://easy.gems.dkrz.de/ (last access: 20 December 2025). DesitinE runs can be retrieved from the DestinE Platform (https://platform.destine.eu, last access: 7 October 2025).
The supplement related to this article is available online at https://doi.org/10.5194/wcd-7-1089-2026-supplement.
OM, SP and EDT designed the study. EDT performed the analysis, produced the figures, and drafted the manuscript. All authors discussed the results and edited the manuscript.
At least one of the (co-)authors is a member of the editorial board of Weather and Climate Dynamics. The peer-review process was guided by an independent editor, and the authors also have no other competing interests to declare.
Publisher's note: Copernicus Publications remains neutral with regard to jurisdictional claims made in the text, published maps, institutional affiliations, or any other geographical representation in this paper. The authors bear the ultimate responsibility for providing appropriate place names. Views expressed in the text are those of the authors and do not necessarily reflect the views of the publisher.
This work was supported by the EU Horizon 2020 Project nextGEMS, Grant Agreement Number 101003470. This work used resources of the Deutsches Klimarechenzentrum (DKRZ) granted by its Scientific Steering Committee (WLA) under project IDs bb1153 and bm1235. This work builds on analyses conducted as part of the Next Generation Earth Modelling Systems (nextGEMS) project. Portions of the manuscript are adapted from Deliverable D46 (Deliverable Release No. D9.1), titled “Report on the evaluation of atmospheric blocking and underlying mechanisms in the SR-ESMs”. The author used OpenAI's language model (ChatGPT, https://chat.openai.com/, last access: 7 October 2025) to assist with grammar, phrasing, and consistency checks during manuscript preparation.
This research has been supported by the EU Horizon 2020 (grant no. 101003470).
This paper was edited by Juerg Schmidli and reviewed by Mika Rantanen and one anonymous referee.
Ackerley, D., Chadwick, R., Dommenget, D., and Petrelli, P.: An ensemble of AMIP simulations with prescribed land surface temperatures, Geosci. Model Dev., 11, 3865–3881, https://doi.org/10.5194/gmd-11-3865-2018, 2018. a
Ackerley, D., Catto, J. L., Dolores-Tesillos, E., Priestley, M. D., Raveh-Rubin, S., Schiemann, R., and Suitters, C. C.: Weather systems in mid-latitudes, in: Reference Module in Earth Systems and Environmental Sciences, Elsevier, ISBN 978-0-12-409548-9, https://doi.org/10.1016/B978-0-443-15748-6.00005-8, 2025. a
Athanasiadis, P. J., Ogawa, F., Omrani, N.-E., Keenlyside, N., Schiemann, R., Baker, A. J., Vidale, P. L., Bellucci, A., Ruggieri, P., Haarsma, R., Roberts, M., Roberts, C., Novak, L., and Gualdi, S.: Mitigating climate biases in the midlatitude North Atlantic by increasing model resolution: SST gradients and their relation to blocking and the jet, J. Climate, 35, 6985–7006, https://doi.org/10.1175/JCLI-D-21-0515.1, 2022. a, b, c, d, e
Barsugli, J. J. and Battisti, D. S.: The Basic Effects of Atmosphere–Ocean Thermal Coupling on Midlatitude Variability, J. Atmos. Sci., 55, 477–493, https://doi.org/10.1175/1520-0469(1998)055<0477:TBEOAO>2.0.CO;2, 1998. a
Berckmans, J., Woollings, T., Demory, M.-E., Vidale, P.-L., and Roberts, M.: Atmospheric blocking in a high resolution climate model: influences of mean state, orography and eddy forcing, Atmos. Sci. Lett., 14, 34–40, https://doi.org/10.1002/asl2.412, 2013. a, b
Booth, J. F., Dunn-Sigouin, E., and Pfahl, S.: The Relationship Between Extratropical Cyclone Steering and Blocking Along the North American East Coast, Geophys. Res. Lett., 44, 11976–11984, https://doi.org/10.1002/2017GL075941, 2017. a
Brayshaw, D. J., Hoskins, B., and Blackburn, M.: The Storm-Track Response to Idealized SST Perturbations in an Aquaplanet GCM, J. Atmos. Sci., 65, 2842–2860, https://doi.org/10.1175/2008JAS2657.1, 2008. a
Brunner, L. and Steiner, A. K.: A global perspective on atmospheric blocking using GPS radio occultation – one decade of observations, Atmos. Meas. Tech., 10, 4727–4745, https://doi.org/10.5194/amt-10-4727-2017, 2017. a
Brunner, L., Pendergrass, A. G., Lehner, F., Merrifield, A. L., Lorenz, R., and Knutti, R.: Reduced global warming from CMIP6 projections when weighting models by performance and independence, Earth Syst. Dynam., 11, 995–1012, https://doi.org/10.5194/esd-11-995-2020, 2020. a
Brunner, L., Poschlod, B., Dutra, E., Fischer, E. M., Martius, O., and Sillmann, J.: A global perspective on the spatial representation of climate extremes from km-scale models, Environ. Res. Lett., 20, 074054, https://doi.org/10.1088/1748-9326/ade1ef, 2025. a
Cheung, H.-N., Omrani, N.-E., Ogawa, F., Keenlyside, N., Nakamura, H., and Zhou, W.: Pacific oceanic front amplifies the impact of Atlantic oceanic front on North Atlantic blocking, npj Climate and Atmospheric Science, 6, 61, https://doi.org/10.1038/s41612-023-00370-x, 2023. a, b, c, d, e
Coumou, D., Di Capua, G., Vavrus, S., Wang, L., and Wang, S.: The influence of Arctic amplification on mid-latitude summer circulation, Nat. Commun., 9, 2959, https://doi.org/10.1038/s41467-018-05256-8, 2018. a, b
Davini, P. and D’Andrea, F.: Northern Hemisphere atmospheric blocking representation in global climate models: twenty years of improvements?, J. Climate, 29, 8823–8840, https://doi.org/10.1175/JCLI-D-16-0242.1, 2016. a, b
Davini, P. and D'Andrea, F.: From CMIP3 to CMIP6: Northern Hemisphere Atmospheric Blocking Simulation in Present and Future Climate, J. Climate, 33, 10021–10038, https://doi.org/10.1175/JCLI-D-19-0862.1, 2020. a, b, c, d
Davini, P., Cagnazzo, C., Gualdi, S., and Navarra, A.: Bidimensional diagnostics, variability, and trends of Northern Hemisphere blocking, J. Climate, 25, 6496–6509, https://doi.org/10.1175/JCLI-D-12-00032.1, 2012. a
Davini, P., Corti, S., D'Andrea, F., Rivière, G., and Von Hardenberg, J.: Improved Winter European Atmospheric Blocking Frequencies in High‐Resolution Global Climate Simulations, J. Adv. Model. Earth Sy., 9, 2615–2634, https://doi.org/10.1002/2017MS001082, 2017. a, b
De Luca, P., Jiménez-Esteve, B., Degenhardt, L., Schemm, S., and Pfahl, S.: Enhanced Blocking Frequencies in Very-High Resolution Idealized Climate Model Simulations, Geophys. Res. Lett., 51, e2024GL111016, https://doi.org/10.1029/2024GL111016, 2024. a, b
de Vries, H., Woollings, T., Anstey, J., Haarsma, R. J., and Hazeleger, W.: Atmospheric blocking and its relation to jet changes in a future climate, Clim. Dynam., 41, 2643–2654, https://doi.org/10.1007/s00382-013-1699-7, 2013. a
Doblas-Reyes, F. J., Kontkanen, J., Sandu, I., Acosta, M., Al Turjmam, M. H., Alsina-Ferrer, I., Andrés-Martínez, M., Anerdi, C., Arriola, L., Axness, M., Batlle Martín, M., Bauer, P., Becker, T., Beltrán, D., Beyer, S., Bockelmann, H., Bretonnière, P.-A., Cabaniols, S., Caprioli, S., Castrillo, M., Chandrasekar, A., Cheedela, S., Correal, V., Danovaro, E., Davini, P., Enkovaara, J., Frauen, C., Früh, B., Gaya Àvila, A., Ghinassi, P., Ghosh, R., Ghosh, S., González, I., Grayson, K., Griffith, M., Hadade, I., Haine, C., Hartick, C., Haus, U.-U., Hearne, S., Järvinen, H., Jiménez, B., John, A., Juchem, M., Jung, T., Kegel, J., Kelbling, M., Keller, K., Kinoshita, B., Kiszler, T., Klocke, D., Kluft, L., Koldunov, N., Kölling, T., Kolstela, J., Kornblueh, L., Kosukhin, S., Lacima-Nadolnik, A., Leal Rojas, J. J., Lehtiranta, J., Lunttila, T., Luoma, A., Manninen, P., Medvedev, A., Milinski, S., Mohammed, A., Müller, S., Naryanappa, D., Nazarova, N., Niemelä, S., Niraula, B., Nortamo, H., Nummelin, A., Nurisso, M., Ortega, P., Paronuzzi, S., Pedruzo-Bagazgoitia, X., Pelletier, C., Peña, C., Polade, S., Pradhan, H. K., Quintanilla, R., Quintino, T., Rackow, T., Räisänen, J., Rajput, M. M., Redler, R., Reuter, B., Rocha Monteiro, N., Roura-Adserias, F., Ruppert, S., Sayed, S., Schnur, R., Sharma, T., Sidorenko, D., Sievi-Korte, O., Soret, A., Steger, C., Stevens, B., Streffing, J., Sunny, J., Tenorio, L., Thober, S., Tigerstedt, U., Tinto, O., Tonttila, J., Tuomenvirta, H., Tuppi, L., Van Thielen, G., Vitali, E., von Hardenberg, J., Wagner, I., Wedi, N., Wehner, J., Willner, S., Yepes-Arbós, X., Ziemen, F., and Zimmermann, J.: The Destination Earth digital twin for climate change adaptation, Geosci. Model Dev., 19, 2821–2848, https://doi.org/10.5194/gmd-19-2821-2026, 2026. a
Dolores-Tesillos, E. and Pfahl, S.: Future changes in North Atlantic winter cyclones in CESM-LE – Part 2: A Lagrangian analysis, Weather Clim. Dynam., 5, 163–179, https://doi.org/10.5194/wcd-5-163-2024, 2024. a
Dolores-Tesillos, E., Teubler, F., and Pfahl, S.: Future changes in North Atlantic winter cyclones in CESM-LE – Part 1: Cyclone intensity, potential vorticity anomalies, and horizontal wind speed, Weather Clim. Dynam., 3, 429–448, https://doi.org/10.5194/wcd-3-429-2022, 2022. a
Dolores-Tesillos, E., Martius, O., and Quinting, J.: On the role of moist and dry processes in atmospheric blocking biases in the Euro-Atlantic region in CMIP6, Weather Clim. Dynam., 6, 471–487, https://doi.org/10.5194/wcd-6-471-2025, 2025. a, b, c, d, e, f, g, h, i
Dunn-Sigouin, E. and Son, S.-W.: Northern Hemisphere blocking frequency and duration in the CMIP5 models, J. Geophys. Res.-Atmos., 118, 1179–1188, https://doi.org/10.1002/jgrd.50143, 2013. a
Elliott, R. D. and Smith, T. B.: A study of the effects of large blocking highs on the general circulation in the northern-hemisphere westerlies, J. Atmos. Sci., 6, 68–85, https://doi.org/10.1175/1520-0469(1949)006<0068:ASOTEO>2.0.CO;2, 1949. a
Embury, O., Merchant, C. J., Good, S. A., Rayner, N. A., Høyer, J. L., Atkinson, C., Block, T., Alerskans, E., Pearson, K. J., Worsfold, M., McCarroll, N., and Donlon, C.: Satellite-based time-series of sea-surface temperature since 1980 for climate applications, Scientific Data, 11, 326, https://doi.org/10.1038/s41597-024-03147-w, 2024. a
Eyring, V., Bony, S., Meehl, G. A., Senior, C. A., Stevens, B., Stouffer, R. J., and Taylor, K. E.: Overview of the Coupled Model Intercomparison Project Phase 6 (CMIP6) experimental design and organization, Geosci. Model Dev., 9, 1937–1958, https://doi.org/10.5194/gmd-9-1937-2016, 2016. a
Gao, Y., Guo, X., Lu, J., Woolings, T., Chen, D., Guo, X., Kou, W., Zhang, S., Leung, L. R., Schiemann, R., O'Reilly, C. H., Guo, C., Li, J., Gao, H., and Wu, L.: Enhanced Simulation of Atmospheric Blocking in a High-Resolution Earth System Model: Projected Changes and Implications for Extreme Weather Events, J. Geophys. Res.-Atmos., 130, e2024JD042045, https://doi.org/10.1029/2024JD042045, 2025. a, b, c
Gates, W. L., Boyle, J. S., Covey, C., Dease, C. G., Doutriaux, C. M., Drach, R. S., Fiorino, M., Gleckler, P. J., Hnilo, J. J., Marlais, S. M., Phillips, T. J., Potter, G. L., Santer, B. D., Sperber, K. R., Taylor, K. E., and Williams, D. N.: An Overview of the Results of the Atmospheric Model Intercomparison Project (AMIP I), B. Am. Meteorol. Soc., 80, 29–56, https://doi.org/10.1175/1520-0477(1999)080<0029:AOOTRO>2.0.CO;2, 1999. a
Grams, C., Beerli, R., Pfenninger, R., Staffell, I., and Wernli, H.: Balancing Europe's wind-power output through spatial deployment informed by weather regimes, Nat. Clim. Change, 7, 557–562, https://doi.org/10.1038/nclimate3338, 2017. a
Greeves, C., Pope, V., Stratton, R., and Martin, G.: Representation of Northern Hemisphere winter storm tracks in climate models, Clim. Dynam., 28, 683–702, https://doi.org/10.1007/s00382-006-0205-x, 2007. a
Harvey, B., Cook, P., Shaffrey, L., and Schiemann, R.: The response of the northern hemisphere storm tracks and jet streams to climate change in the CMIP3, CMIP5, and CMIP6 climate models, J. Geophys. Res.-Atmos., 125, e2020JD032701, https://doi.org/10.1029/2020JD032701, 2020. a, b, c
Hassanzadeh, P., Kuang, Z., and Farrell, B. F.: Responses of midlatitude blocks and wave amplitude to changes in the meridional temperature gradient in an idealized dry GCM, Geophys. Res. Lett., 41, 5223–5232, https://doi.org/10.1002/2014GL060764, 2014. a, b
Hermoso, A., Rivière, G., Harvey, B., Methven, J., and Schemm, S.: A Dynamical Interpretation of the Intensification of the Winter North Atlantic Jet Stream in Reanalysis, J. Climate, 37, 5853–5881, https://doi.org/10.1175/JCLI-D-23-0757.1, 2024. a, b, c
Hersbach, H., Bell, B., Berrisford, P., Hirahara, S., Horányi, A., Muñoz-Sabater, J., Nicolas, J., Peubey, C., Radu, R., Schepers, D., Simmons, A., Soci, C., Abdalla, S., Abellan, X., Balsamo, G., Bechtold, P., Biavati, G., Bidlot, J., Bonavita, M., De Chiara, G., Dahlgren, P., Dee, D., Diamantakis, M., Dragani, R., Flemming, J., Forbes, R., Fuentes, M., Geer, A., Haimberger, L., Healy, S., Hogan, R. J., Hólm, E., Janisková, M., Keeley, S., Laloyaux, P., Lopez, P., Lupu, C., Radnoti, G., de Rosnay, P., Rozum, I., Vamborg, F., Villaume, S., and Thépaut, J.-N.: The ERA5 global reanalysis, Q. J. Roy. Meteor. Soc., 146, 1999–2049, https://doi.org/10.1002/qj.3803, 2020. a
Hinton, T., Hoskins, B., and Martin, G.: The influence of tropical sea surface temperatures and precipitation on north Pacific atmospheric blocking, Clim. Dynam., 33, 549–563, https://doi.org/10.1007/s00382-009-0542-7, 2009. a
Hoffmann, J., Bauer, P., Sandu, I., Wedi, N., Geenen, T., and Thiemert, D.: Destination Earth – A digital twin in support of climate services, Climate Services, 30, 100394, https://doi.org/10.1016/j.cliser.2023.100394, 2023. a
Hohenegger, C., Korn, P., Linardakis, L., Redler, R., Schnur, R., Adamidis, P., Bao, J., Bastin, S., Behravesh, M., Bergemann, M., Biercamp, J., Bockelmann, H., Brokopf, R., Brüggemann, N., Casaroli, L., Chegini, F., Datseris, G., Esch, M., George, G., Giorgetta, M., Gutjahr, O., Haak, H., Hanke, M., Ilyina, T., Jahns, T., Jungclaus, J., Kern, M., Klocke, D., Kluft, L., Kölling, T., Kornblueh, L., Kosukhin, S., Kroll, C., Lee, J., Mauritsen, T., Mehlmann, C., Mieslinger, T., Naumann, A. K., Paccini, L., Peinado, A., Praturi, D. S., Putrasahan, D., Rast, S., Riddick, T., Roeber, N., Schmidt, H., Schulzweida, U., Schütte, F., Segura, H., Shevchenko, R., Singh, V., Specht, M., Stephan, C. C., von Storch, J.-S., Vogel, R., Wengel, C., Winkler, M., Ziemen, F., Marotzke, J., and Stevens, B.: ICON-Sapphire: simulating the components of the Earth system and their interactions at kilometer and subkilometer scales, Geosci. Model Dev., 16, 779–811, https://doi.org/10.5194/gmd-16-779-2023, 2023. a, b
Hoskins, B. J. and Hodges, K. I.: New perspectives on the Northern Hemisphere winter storm tracks, J. Atmos. Sci., 59, 1041–1061, https://doi.org/10.1175/1520-0469(2002)059<1041:NPOTNH>2.0.CO;2, 2002. a
Häkkinen, S., Rhines, P. B., and Worthen, D. L.: Atmospheric Blocking and Atlantic Multidecadal Ocean Variability, Science, 334, 655–659, https://doi.org/10.1126/science.1205683, 2011. a, b, c, d
Kautz, L.-A., Martius, O., Pfahl, S., Pinto, J. G., Ramos, A. M., Sousa, P. M., and Woollings, T.: Atmospheric blocking and weather extremes over the Euro-Atlantic sector – a review, Weather Clim. Dynam., 3, 305–336, https://doi.org/10.5194/wcd-3-305-2022, 2022. a
Koldunov, N., Kölling, T., Pedruzo-Bagazgoitia, X., Rackow, T., Redler, R., Sidorenko, D., Wieners, K.-H., and Ziemen, F. A.: nextGEMS: output of the model development cycle 3 simulations for ICON and IFS, World Data Center for Climate (WDCC) at DKRZ [data set], https://doi.org/10.26050/WDCC/nextGEMS_cyc3, 2023. a
Kushnir, Y., Robinson, W. A., Bladé, I., Hall, N. M. J., Peng, S., and Sutton, R.: Atmospheric GCM Response to Extratropical SST Anomalies: Synthesis and Evaluation, J. Climate, 15, 2233–2256, https://doi.org/10.1175/1520-0442(2002)015<2233:AGRTES>2.0.CO;2, 2002. a
Michel, S. L. L., von der Heydt, A. S., van Westen, R. M., Baatsen, M. L. J., and Dijkstra, H. A.: Increased wintertime European atmospheric blocking frequencies in General Circulation Models with an eddy-permitting ocean, npj Climate and Atmospheric Science, 6, 50, https://doi.org/10.1038/s41612-023-00372-9, 2023. a
Nakamura, N. and Huang, C. S. Y.: Atmospheric blocking as a traffic jam in the jet stream, Science, 361, 42–47, https://doi.org/10.1126/science.aat0721, 2018. a, b, c
Namias, J.: Seasonal persistence and recurrence of European blocking during 1958–1960, Tellus, 16, 394–407, https://doi.org/10.1111/j.2153-3490.1964.tb00176.x, 1964. a
O'Neill, B. C., Tebaldi, C., van Vuuren, D. P., Eyring, V., Friedlingstein, P., Hurtt, G., Knutti, R., Kriegler, E., Lamarque, J.-F., Lowe, J., Meehl, G. A., Moss, R., Riahi, K., and Sanderson, B. M.: The Scenario Model Intercomparison Project (ScenarioMIP) for CMIP6, Geosci. Model Dev., 9, 3461–3482, https://doi.org/10.5194/gmd-9-3461-2016, 2016. a
Ormanova, G., Karaca, F., and Kononova, N.: Analysis of the impacts of atmospheric circulation patterns on the regional air quality over the geographical center of the Eurasian continent, Atmos. Res., 237, 104858, https://doi.org/10.1016/j.atmosres.2020.104858, 2020. a
Osborne, J. M., Collins, M., Screen, J. A., Thomson, S. I., and Dunstone, N.: The North Atlantic as a Driver of Summer Atmospheric Circulation, J. Climate, 33, 7335–7351, https://doi.org/10.1175/JCLI-D-19-0423.1, 2020. a
Palmer, T. E., McSweeney, C. F., Booth, B. B. B., Priestley, M. D. K., Davini, P., Brunner, L., Borchert, L., and Menary, M. B.: Performance-based sub-selection of CMIP6 models for impact assessments in Europe, Earth Syst. Dynam., 14, 457–483, https://doi.org/10.5194/esd-14-457-2023, 2023. a
Pfahl, S., Schwierz, C., Croci-Maspoli, M., Grams, C. M., and Wernli, H.: Importance of latent heat release in ascending air streams for atmospheric blocking, Nat. Geosci., 8, 610–614, https://doi.org/10.1038/ngeo2487, 2015. a
Planchon, O., Quénol, H., Irimia, L., and Patriche, C.: European cold wave during February 2012 and impacts in wine growing regions of Moldavia (Romania), Theor. Appl. Climatol., 120, 469–478, https://doi.org/10.1007/s00704-014-1191-2, 2015. a
Poujol, B., Lee, J., Rackow, T., Rotach, M. W., and Ban, N.: Are the Largest Benefits of Kilometer-Scale Climate Models Over Mountains or Over Flatland?, Geophys. Res. Lett., 52, e2024GL113937, https://doi.org/10.1029/2024GL113937, 2025. a
Prein, A. F., Langhans, W., Fosser, G., Ferrone, A., Ban, N., Goergen, K., Keller, M., Tölle, M., Gutjahr, O., Feser, F., Brisson, E., Kollet, S., Schmidli, J., van Lipzig, N. P. M., and Leung, R.: A review on regional convection-permitting climate modeling: Demonstrations, prospects, and challenges, Rev. Geophys., 53, 323–361, https://doi.org/10.1002/2014RG000475, 2015. a
Priestley, M. D. K., Ackerley, D., Catto, J. L., and Hodges, K. I.: Drivers of Biases in the CMIP6 Extratropical Storm Tracks. Part I: Northern Hemisphere, J. Climate, 36, 1451–1467, https://doi.org/10.1175/JCLI-D-20-0976.1, 2023. a, b, c
Prodhomme, C., Batté, L., Massonnet, F., Davini, P., Bellprat, O., Guemas, V., and Doblas-Reyes, F. J.: Benefits of Increasing the Model Resolution for the Seasonal Forecast Quality in EC-Earth, J. Climate, 29, 9141–9162, https://doi.org/10.1175/JCLI-D-16-0117.1, 2016. a
Rackow, T., Pedruzo-Bagazgoitia, X., Becker, T., Milinski, S., Sandu, I., Aguridan, R., Bechtold, P., Beyer, S., Bidlot, J., Boussetta, S., Deconinck, W., Diamantakis, M., Dueben, P., Dutra, E., Forbes, R., Ghosh, R., Goessling, H. F., Hadade, I., Hegewald, J., Jung, T., Keeley, S., Kluft, L., Koldunov, N., Koldunov, A., Kölling, T., Kousal, J., Kühnlein, C., Maciel, P., Mogensen, K., Quintino, T., Polichtchouk, I., Reuter, B., Sármány, D., Scholz, P., Sidorenko, D., Streffing, J., Sützl, B., Takasuka, D., Tietsche, S., Valentini, M., Vannière, B., Wedi, N., Zampieri, L., and Ziemen, F.: Multi-year simulations at kilometre scale with the Integrated Forecasting System coupled to FESOM2.5 and NEMOv3.4, Geosci. Model Dev., 18, 33–69, https://doi.org/10.5194/gmd-18-33-2025, 2025. a, b
Rex, D. F.: Blocking action in the middle troposphere and its effect upon regional climate, Tellus, 2, 275–301, https://doi.org/10.3402/tellusa.v2i4.8603, 1950. a
Rohrer, M., Brönnimann, S., Martius, O., Raible, C. C., Wild, M., and Compo, G. P.: Representation of extratropical cyclones, blocking anticyclones, and Alpine circulation types in multiple reanalyses and model simulations, J. Climate, 31, 3009–3031, https://doi.org/10.1175/JCLI-D-17-0350.1, 2018. a
Sandu, I.: Destination Earth's digital twins and Digital Twin Engine – state of play, ECMWF Newsletter, 180, 14–23, https://doi.org/10.21957/is1fc736jx, 2024. a
Scaife, A. A., Copsey, D., Gordon, C., Harris, C., Hinton, T., Keeley, S., O'Neill, A., Roberts, M., and Williams, K.: Improved Atlantic winter blocking in a climate model, Geophys. Res. Lett., 38, https://doi.org/10.1029/2011GL049573, 2011. a, b, c
Schemm, S.: Toward Eliminating the Decades-Old “Too Zonal and Too Equatorward” Storm-Track Bias in Climate Models, J. Adv. Model. Earth Sy., 15, e2022MS003482, https://doi.org/10.1029/2022MS003482, 2023. a, b
Scherrer, S. C., Croci-Maspoli, M., Schwierz, C., and Appenzeller, C.: Two-dimensional indices of atmospheric blocking and their statistical relationship with winter climate patterns in the Euro-Atlantic region, Int. J. Climatol., 26, 233–249, https://doi.org/10.1002/joc.1250, 2006. a
Schiemann, R., Demory, M.-E., Shaffrey, L. C., Strachan, J., Vidale, P. L., Mizielinski, M. S., Roberts, M. J., Matsueda, M., Wehner, M. F., and Jung, T.: The resolution sensitivity of Northern Hemisphere blocking in four 25-km atmospheric global circulation models, J. Climate, 30, 337–358, https://doi.org/10.1175/JCLI-D-16-0100.1, 2017. a, b
Schiemann, R., Athanasiadis, P., Barriopedro, D., Doblas-Reyes, F., Lohmann, K., Roberts, M. J., Sein, D. V., Roberts, C. D., Terray, L., and Vidale, P. L.: Northern Hemisphere blocking simulation in current climate models: evaluating progress from the Climate Model Intercomparison Project Phase 5 to 6 and sensitivity to resolution, Weather Clim. Dynam., 1, 277–292, https://doi.org/10.5194/wcd-1-277-2020, 2020. a, b, c
Schwierz, C., Croci-Maspoli, M., and Davies, H. C.: Perspicacious indicators of atmospheric blocking, Geophys. Res. Lett., 31, https://doi.org/10.1029/2003GL019341, 2004. a
Segura, H., Pedruzo-Bagazgoitia, X., Weiss, P., Müller, S. K., Rackow, T., Lee, J., Dolores-Tesillos, E., Benedict, I., Aengenheyster, M., Aguridan, R., Arduini, G., Baker, A. J., Bao, J., Bastin, S., Baulenas, E., Becker, T., Beyer, S., Bockelmann, H., Brüggemann, N., Brunner, L., Cheedela, S. K., Das, S., Denissen, J., Dragaud, I., Dziekan, P., Ekblom, M., Engels, J. F., Esch, M., Forbes, R., Frauen, C., Freischem, L., García-Maroto, D., Geier, P., Gierz, P., González-Cervera, Á., Grayson, K., Griffith, M., Gutjahr, O., Haak, H., Hadade, I., Haslehner, K., ul Hasson, S., Hegewald, J., Kluft, L., Koldunov, A., Koldunov, N., Kölling, T., Koseki, S., Kosukhin, S., Kousal, J., Kuma, P., Kumar, A. U., Li, R., Maury, N., Meindl, M., Milinski, S., Mogensen, K., Niraula, B., Nowak, J., Praturi, D. S., Proske, U., Putrasahan, D., Redler, R., Santuy, D., Sármány, D., Schnur, R., Scholz, P., Sidorenko, D., Spät, D., Sützl, B., Takasuka, D., Tompkins, A., Uribe, A., Valentini, M., Veerman, M., Voigt, A., Warnau, S., Wachsmann, F., Wacławczyk, M., Wedi, N., Wieners, K.-H., Wille, J., Winkler, M., Wu, Y., Ziemen, F., Zimmermann, J., Bender, F. A.-M., Bojovic, D., Bony, S., Bordoni, S., Brehmer, P., Dengler, M., Dutra, E., Faye, S., Fischer, E., van Heerwaarden, C., Hohenegger, C., Järvinen, H., Jochum, M., Jung, T., Jungclaus, J. H., Keenlyside, N. S., Klocke, D., Konow, H., Klose, M., Malinowski, S., Martius, O., Mauritsen, T., Mellado, J. P., Mieslinger, T., Mohino, E., Pawłowska, H., Peters-von Gehlen, K., Sarré, A., Sobhani, P., Stier, P., Tuppi, L., Vidale, P. L., Sandu, I., and Stevens, B.: nextGEMS: entering the era of kilometer-scale Earth system modeling, Geosci. Model Dev., 18, 7735–7761, https://doi.org/10.5194/gmd-18-7735-2025, 2025. a, b, c
Shaw, T. A. and Voigt, A.: Tug of war on summertime circulation between radiative forcing and sea surface warming, Nat. Geosci., 8, 560–566, https://doi.org/10.1038/ngeo2449, 2015. a, b
Shutts, G.: The propagation of eddies in diffluent jetstreams: Eddy vorticity forcing of 'blocking'flow fields, Q. J. Roy. Meteor. Soc., 109, 737–761, https://doi.org/10.1002/qj.49710946204, 1983. a, b
Steinfeld, D.: ConTrack – Contour Tracking, gitHub [code], https://github.com/steidani/ConTrack (last access: 20 December 2025), 2020. a
Steinfeld, D. and Pfahl, S.: The role of latent heating in atmospheric blocking dynamics: a global climatology, Clim. Dynam., 53, 6159–6180, https://doi.org/10.1007/s00382-019-04919-6, 2019. a
Steinfeld, D., Boettcher, M., Forbes, R., and Pfahl, S.: The sensitivity of atmospheric blocking to upstream latent heating – numerical experiments, Weather Clim. Dynam., 1, 405–426, https://doi.org/10.5194/wcd-1-405-2020, 2020. a
Steinfeld, D., Sprenger, M., Beyerle, U., and Pfahl, S.: Response of moist and dry processes in atmospheric blocking to climate change, Environ. Res. Lett., 17, 084020, https://doi.org/10.1088/1748-9326/ac81af, 2022. a
Takasuka, D., Satoh, M., Miyakawa, T., Kodama, C., Klocke, D., Stevens, B., Vidale, P. L., and Terai, C. R.: A protocol and analysis of year-long simulations of global storm-resolving models and beyond, Prog. Earth Planet. Sci., 11, 66, https://doi.org/10.1186/s40645-024-00668-1, 2024. a
Tibaldi, S. and Molteni, F.: On the operational predictability of blocking, Tellus A, 42, 343–365, https://doi.org/10.1034/j.1600-0870.1990.t01-2-00003.x, 1990. a, b
Vivant, F., Siegelman, L., Klein, P., Torres, H. S., Menemenlis, D., and Molod, A. M.: Ocean submesoscale fronts induce diabatic heating and convective precipitation within storms, Communications Earth & Environment, 6, 69, https://doi.org/10.1038/s43247-025-02002-z, 2025. a, b
Wieners, K.-H., Rackow, T., Aguridan, R., Becker, T., Beyer, S., Cheedela, S. K., Dreier, N.-A., Engels, J. F., Esch, M., Frauen, C., Klocke, D., Kölling, T., Pedruzo-Bagazgoitia, X., Putrasahan, D., Sidorenko, D., Schnur, R., Stevens, B., and Zimmermann, J.: nextGEMS: output of the production simulations for ICON and IFS, World Data Center for Climate (WDCC) at DKRZ [data set], https://doi.org/10.35095/WDCC/nextGEMS_prod_addinfov1, 2024. a
Wille, J. D., Koch, R., Becker, T., and Fischer, E.: Extreme Precipitation Depiction in Convection-Permitting Earth System Models Within the nextGEMS Project, J. Adv. Model. Earth Sy., https://doi.org/10.1029/2024MS004840, 2025. a, b
Willison, J., Robinson, W. A., and Lackmann, G. M.: The importance of resolving mesoscale latent heating in the North Atlantic storm track, J. Atmos. Sci., 70, 2234–2250, https://doi.org/10.1175/JAS-D-12-0226.1, 2013. a
Wills, R. C. J., Herrington, A. R., Simpson, I. R., and Battisti, D. S.: Resolving Weather Fronts Increases the Large-Scale Circulation Response to Gulf Stream SST Anomalies in Variable-Resolution CESM2 Simulations, J. Adv. Model. Earth Sy., 16, e2023MS004123, https://doi.org/10.1029/2023MS004123, 2024. a, b
Wirth, V., Riemer, M., Chang, E. K., and Martius, O.: Rossby wave packets on the midlatitude waveguide – A review, Mon. Weather Rev., 146, 1965–2001, 2018. a
Woollings, T., Barriopedro, D., Methven, J., Son, S.-W., Martius, O., Harvey, B., Sillmann, J., Lupo, A. R., and Seneviratne, S.: Blocking and its response to climate change, Current Climate Change Reports, 4, 287–300, https://doi.org/10.1007/s40641-018-0108-z, 2018. a, b, c, d, e, f, g
Woollings, T., Drouard, M., Sexton, D. M. H., and McSweeney, C. F.: Sensitivity of European blocking to physical parameters in a large ensemble climate model experiment, Atmos. Sci. Lett., 26, e1295, https://doi.org/10.1002/asl.1295, 2025. a
Zappa, G., Shaffrey, L. C., Hodges, K. I., Sansom, P. G., and Stephenson, D. B.: A multimodel assessment of future projections of North Atlantic and European extratropical cyclones in the CMIP5 climate models, J. Climate, 26, 5846–5862, https://doi.org/10.1175/JCLI-D-12-00573.1, 2013. a, b
Zappa, G., Masato, G., Shaffrey, L., Woollings, T., and Hodges, K.: Linking Northern Hemisphere blocking and storm track biases in the CMIP5 climate models, Geophys. Res. Lett., 41, 135–139, https://doi.org/10.1002/2013GL058480, 2014. a, b
Zhang, Q., Liu, B., Li, S., and Zhou, T.: Understanding Models' Global Sea Surface Temperature Bias in Mean State: From CMIP5 to CMIP6, Geophys. Res. Lett., 50, e2022GL100888, https://doi.org/10.1029/2022GL100888, 2023. a