
the Creative Commons Attribution 4.0 License.
the Creative Commons Attribution 4.0 License.
 | 16 Jul 2026
Identifying the diabatic processes driving the evolution of a sting jet: the case of Storm Ciarán
Ming Hon Franco Lee
Richard Forbes
Rémi Bouffet-Klein
Sting jets (SJs) are airstreams that can lead to exceptionally strong and damaging winds in intense extratropical cyclones. Whilst there is extensive evidence that SJ descent can be associated with the release of symmetric instability (SI), the individual diabatic processes driving the onset of this instability have not yet been identified and characterised. In our study we tackle this question by analysing a near-operational numerical weather prediction model simulation of Storm Ciarán (1 November 2023), that featured a SJ associated with damaging winds and characterised by the development of SI (indicated by negative potential vorticity, PV) during its evolution. Diabatic tendencies are included in the output of this simulation and are used in our study, including by being traced on Lagrangian trajectories, to illustrate the contributions of the individual diabatic processes to the onset of SI during the evolution of the SJ.
The SJ in our simulation is consistent in terms of magnitude, timing and structure with operational forecasts, observations and literature. This SJ develops in an environment characterised by multiple bands of negative PV in the cloud head. It becomes part of one of such filaments as it ascends near the bent-back warm front before descending off the tip of the cloud head. The decrease in PV along the SJ captured by diabatic tendencies is mainly associated with four moist processes: condensation of water vapour, evaporation of cloud water, melting of ice and snow and sublimation of snow. The first three show large variability across trajectories and, particularly for condensation, positive and negative extremes near the trajectories. The limited decrease in PV caused by the sublimation of snow is instead robust and consistent across trajectories. The reduction in buoyancy caused by the cooling from snow sublimation and melting favours the start of SJ descent, rather than the continuation of ascent. Conditions allowing the formation of SJ-like airstreams from negative PV filaments persist as the storm develops and are associated with condensation and melting. Sublimation of snow is only present when conditions are most favourable and lead to the formation of the main SJ.
The decrease in PV observed on the SJ trajectories at this time is only partially captured by diabatic tendencies. This substantial discrepancy exposes the limitations of the methodology and can be ascribed to the use of offline trajectories computed from hourly instantaneous model data in an environment characterised by fast-changing and non-linear processes and by fully three-dimensional and small-scale patterns. This is particularly true in the narrow region near the bent-back warm front and the tip of the cloud head, in which the SJ travels as SI develops along it.
In summary, in this study we analyse diabatic tendencies in a model simulation of Storm Ciarán, acknowledging their limitations, to reveal the role of different moist processes in causing the onset of instability on a SJ and therefore driving its intensification. The complex interplay between these processes highlights the unique properties of the narrow region in the cloud head in which the SJ develops before descending towards the surface and bringing damaging winds.
- Article
(13562 KB) - Full-text XML
- BibTeX
- EndNote


1.1 Sting jets in extratropical cyclones
Extratropical cyclones are a primary cause of severe impacts in the mid-latitudes, repeatedly causing extensive damage and loss of life due to extreme winds and precipitation. Strong winds in extratropical cyclones can be linked to a number of distinct airstreams, often long-lived and of synoptic-scale size, such as the widely studied warm (Browning, 1971) and cold conveyor belts (Schultz, 2001), the descending dry intrusion (Browning and Roberts, 1994). Severe gusts can also be associated with cold-frontal convection, as pointed out by Eisenstein et al. (2022). However, in Shapiro-Keyser cyclones (Shapiro and Keyser, 1990) strong surface winds can also be associated with a shorter-lived and smaller-scale airstream, called “sting jet”. A sting jet (SJ) is a mesoscale airflow that descends off the tip of the cyclone cloud head and accelerates into its frontal-fracture region. Despite their local and transient nature, SJs can lead to distinct regions of exceptionally strong and damaging near-surface winds. First identified two decades ago when re-examining the Great Storm that devastated southern England on 16 October 1987 (Browning and Field, 2004; Clark et al., 2005), SJs were since identified in some of the most damaging cyclones affecting the British Isles and continental Europe (Clark and Gray, 2018). Recent examples of notable SJ cyclones include Storm Eunice (Volonté et al., 2023a, b), Storm Ciarán (Volonté and Riboldi, 2024; Gray and Volonté, 2024; Charlton-Perez et al., 2024) and Storm Éowyn (Kendon, 2025; Suri et al., 2025), explosively deepening (Sanders and Gyakum, 1980) windstorms that justified the issuing of severe wind warnings, producing extreme or even record-breaking surface gusts and causing extensive damage and loss of life.
1.2 The roles of symmetric instability and of moist processes in the dynamics of SJs
The three storms just mentioned have all in common the development of a SJ that is associated with the onset of symmetric instability (SI) in the cloud head, as illustrated in Volonté et al. (2023a) for Storm Eunice, Gray and Volonté (2024) for Storm Ciarán and by preliminary analysis of Met Office operational forecast data for Storm Éowyn (not shown). As explained in detail in Clark and Gray (2018), SI is essentially a form of inertial instability generalised to a baroclinic flow. It is indicated by negative values of Ertel potential vorticity (PV hereafter), which is defined as , where ρ is the air density, ξ the absolute vorticity vector, and θ the potential temperature. SI is derived applying the semi-geostrophic approximation to a two-dimensional base state that is in thermal wind balance and has a uniform thermal gradient. SI is released as a consequence of slantwise displacements happening at angles between the slopes of absolute geostrophic momentum and θ. The moist counterpart of SI is conditional symmetric instability (CSI, indicated by negative values of moist saturated PV, MPV*), that is defined by replacing θ with saturated equivalent potential temperature (). As surfaces of are more sloped than those of θ, CSI is more common than SI. However, CSI is a conditional instability and requires saturation to be released, while SI does not and can be released as soon as it forms. In recent years consensus grew on the presence of SI in intense SJ cases, as explained in the following paragraph. We therefore focus our analysis on SI, and on regions of negative PV, rather than on its moist and conditional counterpart.
The hypothesis that the acceleration and descent of SJs could be at least partly associated with the release of CSI or even SI dates back to the pioneering works of Browning (2004); Browning and Field (2004). In their analysis of the Great Storm, they highlighted the banded structure of the cloud-head tip and illustrated it as an indication of multiple slantwise circulations, with descending cloud-free branches associated with the acceleration of the sting jet out of the cloud head. The associated seminal modelling work by Clark et al. (2005) confirmed the presence of these slantwise circulations, with the SJ appearing within their descending part. Subsequent studies added further evidence to the hypothesis that SJ descent and acceleration is associated with slantwise circulations caused by mesoscale instability in cloud-head frontal circulations (Gray et al., 2011; Martínez-Alvarado et al., 2014) or at least reduced or neutral stability, as in Coronel et al. (2016). The review by Clark and Gray (2018) stresses the likelihood of a continuum of behaviours, “from balanced descent partly associated with frontolysis in the frontal-fracture region, through horizontally smaller scale and stronger frontolytic descent associated with weak stability to slantwise convective downdraughts, to multiple slantwise convective downdraughts associated with the release of CSI and even, possibly, SI.” They also highlight the evidence that this release of instability is associated with substantial acceleration, on top of the speed-up caused by the quasi-geostrophic frontolytic descent highlighted in Schultz et al. (2013) and in a region of the cyclone that is already prone to strong winds, which would usually be aligned with cyclone propagation.
Volonté et al. (2018) used model simulations of Storm Tini to develop a conceptual model illustrating the primary role of vorticity tilting via slantwise circulations and its close link to the generation of negative PV. This conceptual model was confirmed by the idealised simulations in Volonté et al. (2020), showing bands of strongly positive and negative horizontal vorticity being associated with tight frontal circulations in the cloud head. Large negative values of the tilting term in the vertical vorticity budget were diagnosed along SJ trajectories travelling towards the tip of the cloud head, where the formation of a narrow filament of negative PV just outside the bent-back warm front was observed. This formation of negative PV filaments along the SJ as it travels in a narrow region in the cloud head and near the bent-back front has also been confirmed by the most recent studies of intense sting jet storms, such as Eunice and Ciarán, as explained in Sect. 1.1 (Volonté et al., 2023b; Gray and Volonté, 2024). It can thus confidently be stated that intense SJ are normally characterised by the presence of SI.
SJ cyclones are often characterised by banding in the cloud head (Clark and Gray, 2018), although caution might be exerted, as discussed in Schultz and Schumacher (1999), in associating it to slantwise circulations and mesoscale instability. Slantwise circulations in the cloud head have been observed in rapidly developing cyclones, such as the FASTEX IOP16 cyclone described in Roberts and Forbes (2002) and Lean and Clark (2003), in which the strength of the circulations led to describing them as forming “multiple cloud heads.” Clough and Franks (1991) highlighted the importance of sublimation of ice as an effective mechanism for the maintenance of slantwise descent, thanks to the associated cooling. The role of latent cooling caused by precipitation (liquid or solid) falling from above and helping to maintain descending motions is stressed also by Forbes and Clark (2003). Focusing on SJs, Clark et al. (2005) found a strong correlation between evaporative cooling and SJ descent. Subsequent studies, such as Baker et al. (2014) and Coronel et al. (2016) among others, provided differing results on the importance of latent cooling for the descent and acceleration of SJs, as summarised in Clark and Gray (2018). It is worth noting that, given that the presence of a precipitating cloud above the airstream is a necessary condition for the cooling to take place on it, these processes become less likely as the SJ progresses in its journey off the tip of the cloud head and into the frontal-fracture region.
In summary, the link between SJ dynamics and the presence of SI, or of reduced stability, has now been established. The onset of this instability, indicated by negative PV, is driven by tight frontal circulations in the cloud head, near the bent-back warm front. This suggests the likely involvement of moist processes, that can help to initiate and maintain the descent via latent cooling. However, the distinct roles of individual diabatic processes in reducing PV along the SJ as it travels in the cloud head, before starting its descent and acceleration out of it, have not been identified yet.
1.3 Identifying individual diabatic processes in extratropical cyclones
In the last couple of decades two methods have been mainly used to investigate the role of individual diabatic processes in the evolution of extratropical cyclones and associated features, such as SJs, assessing the related changes in PV and/or potential temperature (θ). These are passive tracers and tendency diagnostics. We summarise the two approaches here, while a more comprehensive description, also featuring a variety of examples from the literature, can be found in Sect. 5.4 of Wernli and Gray (2024).
The use of tracers follows from the seminal work by Stoelinga (1996), in which the accumulation of PV increments caused by the different non-conservative model processes was partitioned using the routines and parameterisation schemes of the model and advected at every time step, together with the conserved component, using the model advection scheme. Since then, most diabatic tracers studies have been performed using the Met Office Unified Model (MetUM). Particularly relevant for our study are the works by Chagnon et al. (2013) and Chagnon and Gray (2015), focusing on the role of different diabatic processes in modifying PV in several regions of extratropical cyclones. The requirement of tracers to be incorporated in the model code represents an obstacle towards easy use and portability. After around three decades since pioneering works, studies implementing diabatic tracers in models other than the MetUM are still limited, one example being the analysis by Flaounas et al. (2021) of diabatic and baroclinic contributions to the evolution of intense Mediterranean cyclones using the WRF model.
An alternative approach is the use of tendency diagnostics. In this case tendencies from the different diabatic and frictional processes are included in the model output. These tendencies are then traced along trajectories, normally computed offline using the resolved wind. This is what was done by Joos and Wernli (2012), who showed that it was possible to use the heating tendencies available in the output of the COSMO model to provide a detailed breakdown of the role of individual diabatic processes in modifying PV in a warm conveyor belt. This study was followed by further work using diabatic tendencies to reveal the role of non-conservative processes on the structure and evolution of warm conveyor belts using the IFS model (Joos and Forbes, 2016) and, more recently, the ICON model (Oertel et al., 2023). Other main features of extratropical weather have also recently been analysed using diabatic tendencies in the IFS, such as the jet stream and the tropopause (Spreitzer et al., 2019) and, of particular relevance to our study, tropospheric fronts in extratropical cyclones (Attinger et al., 2019, 2021). In Attinger et al. (2019), the analysis of diabatic tendencies in an extratropical cyclone case study showed that PV increase along the warm front was mainly generated by condensation and turbulence, with PV decrease primarily caused by snow melting and sublimation. Condensation, convection, snow melting and sublimation were found to be the most important contributors to PV increases at the cyclone centre and at the bent-back end of the warm front. The same approach was extended to a series of month-long global free-running simulations in Attinger et al. (2021), providing a systematic analysis of low-level PV modification along the different fronts characterising extratropical cyclones. This analysis confirms that at the warm front high PV is mainly caused by condensation (in the cold season) and turbulent mixing of momentum (in the warm season) while melting and snow sublimation play a role in the generation of low PV, particularly to the north of the front. At the bent-back front and at the cyclone centre, condensation is still the main contributor to PV increase.
Both the passive tracers and tendency diagnostics methods are based on model parameterisation schemes. Both methods also highlight the Lagrangian nature of modifications to PV and θ, as non-conservative processes are integrated (online or offline) along the flow. For this study we choose to use the tendency diagnostics methods, so that we can take advantage of an established set up that has already proven to be effective for the identification of individual diabatic processes when applied on fronts and other features characterising extratropical cyclones.
1.4 Our plan
Therefore, in this study we follow the same diabatic tendency methodology as in Attinger et al. (2021) and we apply it to a model simulation of Storm Ciarán. As described at the beginning of this introduction, Ciarán was a highly diabatic high-impact windstorm that featured a SJ displaying a clear SI signal (Gray and Volonté, 2024). Hence, it is an appropriate case study to investigate the role of diabatic processes in the evolution of SJs and the related onset of SI.
The remainder of this article is structured as follows. The model simulation, use of diabatic tendencies and tracing along Lagrangian trajectories are described in Sect. 2. The results section (Sect. 3) begins with the illustration of the presence of a symmetrically unstable SJ and a description of the evolution of PV along SJ trajectories. This is followed by a detailed analysis of the diabatic processes modifying PV along the trajectories and in the environment around them. The section ends by focusing on airstreams associated with additional regions of negative PV. Section 4 completes the article, as it contains a discussion of the results and the overall conclusions.
2.1 IFS model and use of diabatic tendencies
The simulation analysed in this study is performed using the Cycle 47r3 version of the Integrated Forecasting System (IFS) model of the European Centre for Medium-Range Weather Forecasts (ECMWF), which was operational from October 2021 to June 2023 at ECMWF. A 2 d forecast is initialised with ECMWF analysis field at 00:00 UTC on 1 November 2023 and it is run at a cubic-octahedral spectral transform discretisation of TCo1279 with 137 vertical levels, the same as the operational forecast. The corresponding horizontal resolution is approximately 9 km and the hourly output fields are interpolated to a regular grid at 0.1° resolution.
Table 1Abbreviations and description of the non-conservative processes studied. PVR and APV stand for instantaneous and time-accumulated PV tendency, respectively, while Q stands for instantaneous potential temperature tendency and F for instantaneous momentum tendency. All PV tendencies are based on θ tendencies unless explicitly mentioned. All cloud processes, listed under the solid black line, are included in APVcloud.
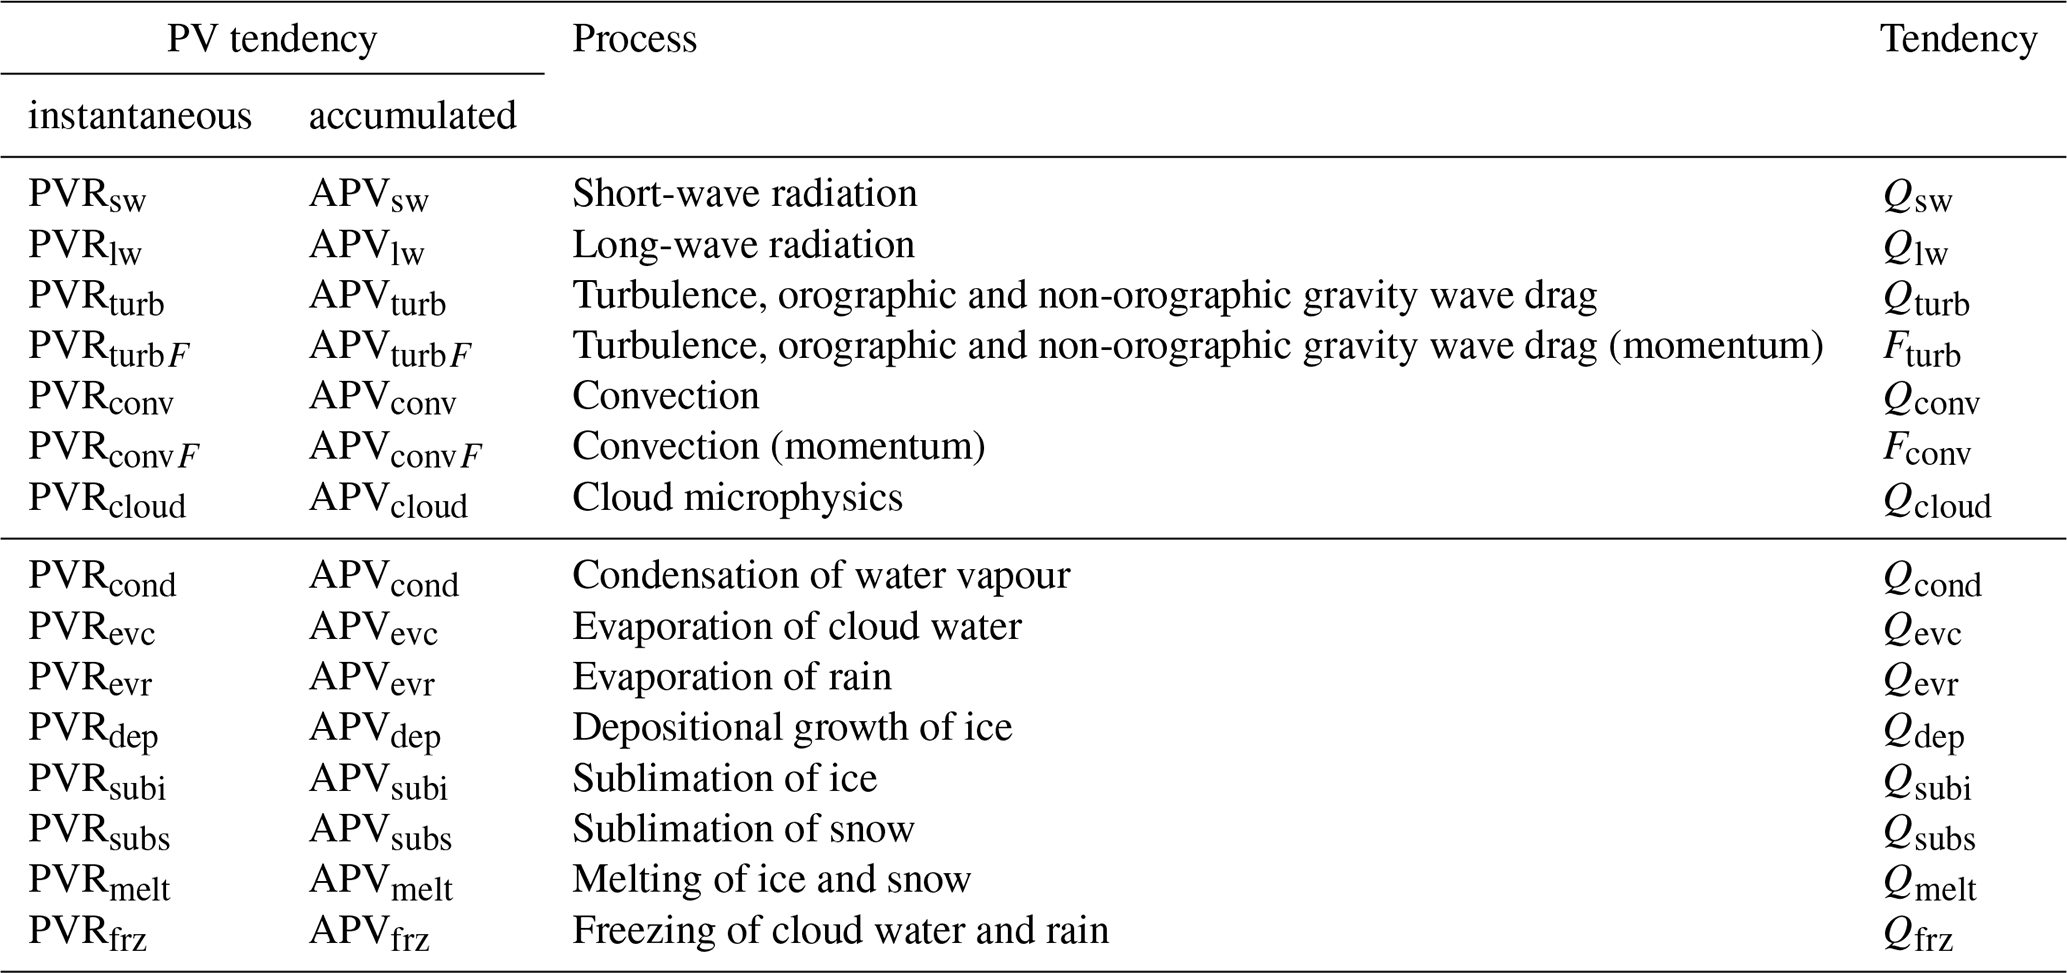
Apart from the standard model outputs, the temperature, moisture, and momentum tendencies associated with individual parametrised subgrid-scale processes are retrieved, similar to Spreitzer et al. (2019) and Attinger et al. (2019, 2021). Using these tendencies, the PV framework is applied to evaluate the effect of diabatic processes on the formation of sting jets. As PV is materially conserved under adiabatic and frictionless flow, any changes in PV can be linked to potential temperature (Qi) and momentum tendencies (Fi) imposed by the non-conservative processes i, shown in Table 1. The material change rate of PV (PVR) can be described by
where again ρ is the air density, ξ the absolute vorticity vector, and θ the potential temperature. Compared to Attinger et al. (2021), the cloud microphysical processes considered in this study are slightly modified, with a major update of the moist physics (Bechtold et al., 2020) applied on Cycle 47r3 of the IFS. In particular, melting of ice and snow is grouped into a single process “melting” and the freezing and riming of cloud droplets are grouped into a single process “freezing”, as detailed in Table 1.
2.2 Lagrangian perspective on PV modification
In order to evaluate the influence of diabatic processes on the evolution of the sting jet, backward trajectories are calculated with the Lagrangian Analysis Tool LAGRANTO (Sprenger and Wernli, 2015). The release region of the backward trajectories is described in detail in Sect. 3.1.2. All momentum and potential temperature tendencies are traced along the trajectories of interest. With this approach we can quantify the instantaneous rate of change in PV due to every process separately (PVR) and then calculate the time-accumulated PV tendency (APV) along the flow. The net PV modification is described by the sum of large-scale microphysics, radiation, convection and turbulence, plus a residual term:
where RES denotes the residual. This Lagrangian method of tracing diabatic tendencies along trajectories has already been successfully applied to a range of weather features, as detailed in Sect. 1.3. A more detailed description of the method can be found in Spreitzer et al. (2019) and Attinger et al. (2019).
3.1 Evidence of a SJ associated with symmetric instability
Storm Ciarán was, as described in the introduction, a severe and highly diabatic windstorm that featured SJ development. In this section we show that a clear SJ is identified in the IFS simulation performed and used in this study, illustrate its properties and highlight that this SJ is associated with SI.
3.1.1 Eulerian overview
Figure 1 contains a map (Fig. 1a) that shows Storm Ciarán at 15:00 UTC on 1 November 2023, the time at which the highest wind speed at 850 hPa was simulated. At this time, Ciarán is undergoing explosive deepening (not shown) whilst developing into a severe Shapiro-Keyser extratropical cyclone. This is indicated by the presence of a bent-back warm front (BBF in the figure), on the western side of the warm front (WF), wrapping around the cyclone centre (see equivalent potential temperature, θe, contours) and by the south-eastward displacement of the cold front (CF), leading to the opening of a frontal-fracture region (FF) in between the two fronts, just south of the cyclone centre. Given the fast eastward movement of Storm Ciarán, is not surprising to see that the highest wind speeds at 850 hPa are found on the southern side of the cyclone, where cyclonic circulation and system translation add up. The maximum values, substantially higher than those near the cold front and in the warm sector, are limited to a small and distinct area in the frontal-fracture region,just off the tip of the cloud head. This is where SJs are expected to be located at the end of their descent and acceleration.
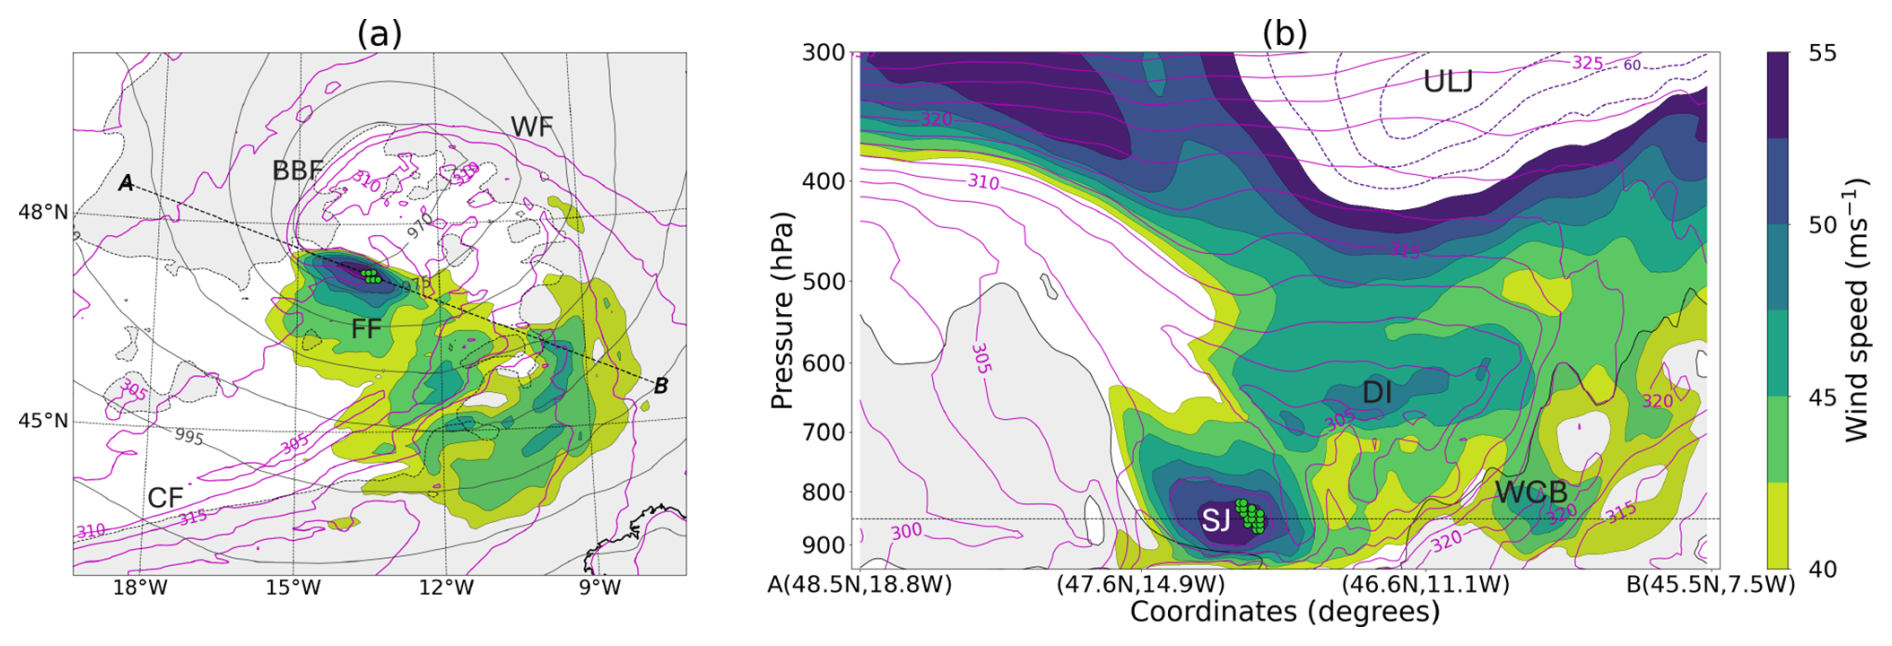
Figure 1(a) Wind speed (every 2.5 m s−1, shading from 40 to 55 m s−1 and dark purple dashed contours above 55 m s−1) and equivalent potential temperature (θe, magenta contours, K) at 850 hPa, relative humidity at 700 hPa (grey shading, > 80 %) and mean sea level pressure (black contours) at 15:00 UTC on 1 November 2023. Green dots show the location of the release points of the Lagrangian trajectories described in Sect. 3.1.2. (b) As in panel (a), but on the vertical cross-section along transect AB. The dashed horizontal line shows the pressure level at which the map in panel (a) is plotted. Main (a) frontal features (warm front, WF, cold front, CF, bent-back front, BBF, frontal-fracture region, FF) and (b) wind features (sting jet, SJ, warm conveyor belt, WCB, dry intrusion, DI, upper-level jet, ULJ) are marked in the figure.
A vertical cross-section cutting through the wind maximum in the frontal-fracture region (Fig. 1b) can be used together with the map just described to understand the vertical structure of the cyclone near the tip of the cloud head and across the frontal-fracture region, the cold front and the warm sector. The low-level wind maximum in the frontal-fracture region, characterised by values nearing 55 m s−1 is centred at around 850 hPa and located just outside the tip of the cloud head and at the bottom of an area of downward moist isentropes, consistent with the presence of a descending SJ airstream. Above it, wind values close to 50 m s−1 are found at around 600 hPa near a local minimum in θe, pointing at the presence of the dry intrusion (DI), with the core of the upper-level jet (ULJ), exceeding 60 m s−1 near 300 hPa, above it. Winds exceeding 40 m s−1 are found at low-levels at either side of the frontal-fracture region, with the area above 45ms−1 in the warm sector, ahead of the cold front, indicating the warm conveyor belt (WCB), and the small near-surface local maximum just above 40 m s−1 on the cold side of the bent-back front showing the front-edge of the cold conveyor belt.
The three-dimensional structure and timing of the airstreams just described are consistent with those displayed in the Met Office operational forecasts illustrated in Gray and Volonté (2024) and also with the satellite imagery presented there. This provides the necessary confidence that the IFS simulation analysed in this study is a realistic representation of Storm Ciarán, justifying its use when investigating SJ dynamics.
3.1.2 Lagrangian trajectories
Backward trajectories are computed from the wind speed maximum in the frontal-fracture region that indicates the SJ. Constraints are applied to these trajectories, a well-established technique when identifying SJs and other airstreams via Lagrangian trajectories (see Volonté et al., 2023b among others). These constraints, listed below, are consistent with the general evolution of SJs associated with the onset of SI (i.e., negative PV) and in particular with the properties of the SJs identified in the simulations of Storm Ciáran presented in Gray and Volonté (2024), such as the relatively small descent and the quick ascent/descent pattern.
In detail, the horizontal boundaries of the initial domain are 15, 12.5° W, 46.5 and 48° N (with a 0.1° grid spacing) and the vertical extent goes from 950 to 700 hPa (every 10 hPa). The release time is 15:00 UTC on 1 November, when the low-level wind speed reaches its highest maximum value, and are computed backwards for 15 h. Trajectories are retained if meeting the following criteria, designed so that they are all part of the SJ core:
-
wind speed exceeding 53 m s−1 at release time;
-
pressure increase (i.e., descent) exceeding 50 hPa in the 3 h before the release time;
-
negative PV 4 h before the release time.
Hence, while 10 816 trajectories are initially calculated, the number of those that are retained decreases to only 18 as those three criteria are applied in succession. The release points of these trajectories are displayed in both panels of Fig. 1. The limited number of trajectories retained is a consequence of restricting the trajectory set to the core of the SJ, characterised by the onset of SI, followed by descent and by the generation of the highest low-level wind speed present in our IFS simulation of Storm Ciarán. This strict selection process is made necessary by the nature of the fast-evolving regions the SJ travels in, characterised by tight curvature, steep gradients and large process variability. As explained in detail in Sect. 3.3–3.5, allowing more trajectories to be part of the retained set, including those at the edges of the SJ, would result in larger variability in their evolution and ultimately larger noise in the results analysed.
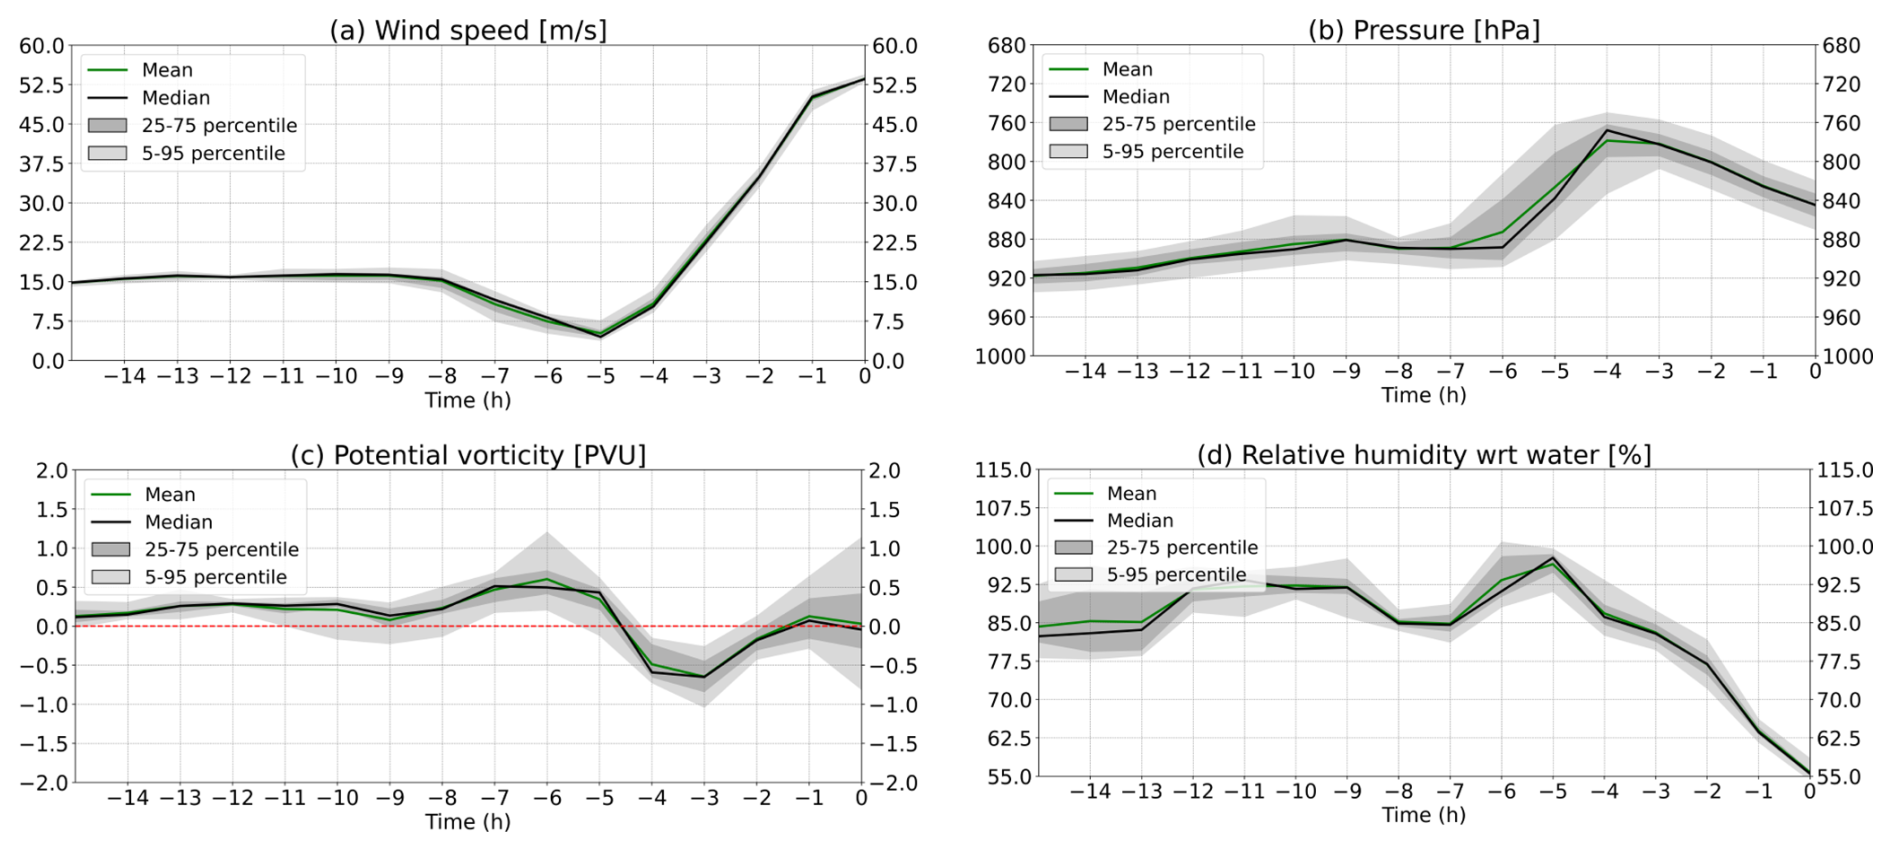
Figure 2Time evolution of (a) wind speed (m s−1), (b) pressure (hPa), (c) potential vorticity (PVU), and (d) relative humidity with respect to water (%) along SJ backward trajectories (see details of identification criteria in the text). Black and green solid lines in these panels indicate the median and mean of each field, respectively. Dark grey shading covers the values between the 25th and 75th percentiles and light grey shading covers the values between the 5th and 95th percentiles. Percentiles are calculated independently at each time, hence a single percentile line can refer to different trajectories at different times.
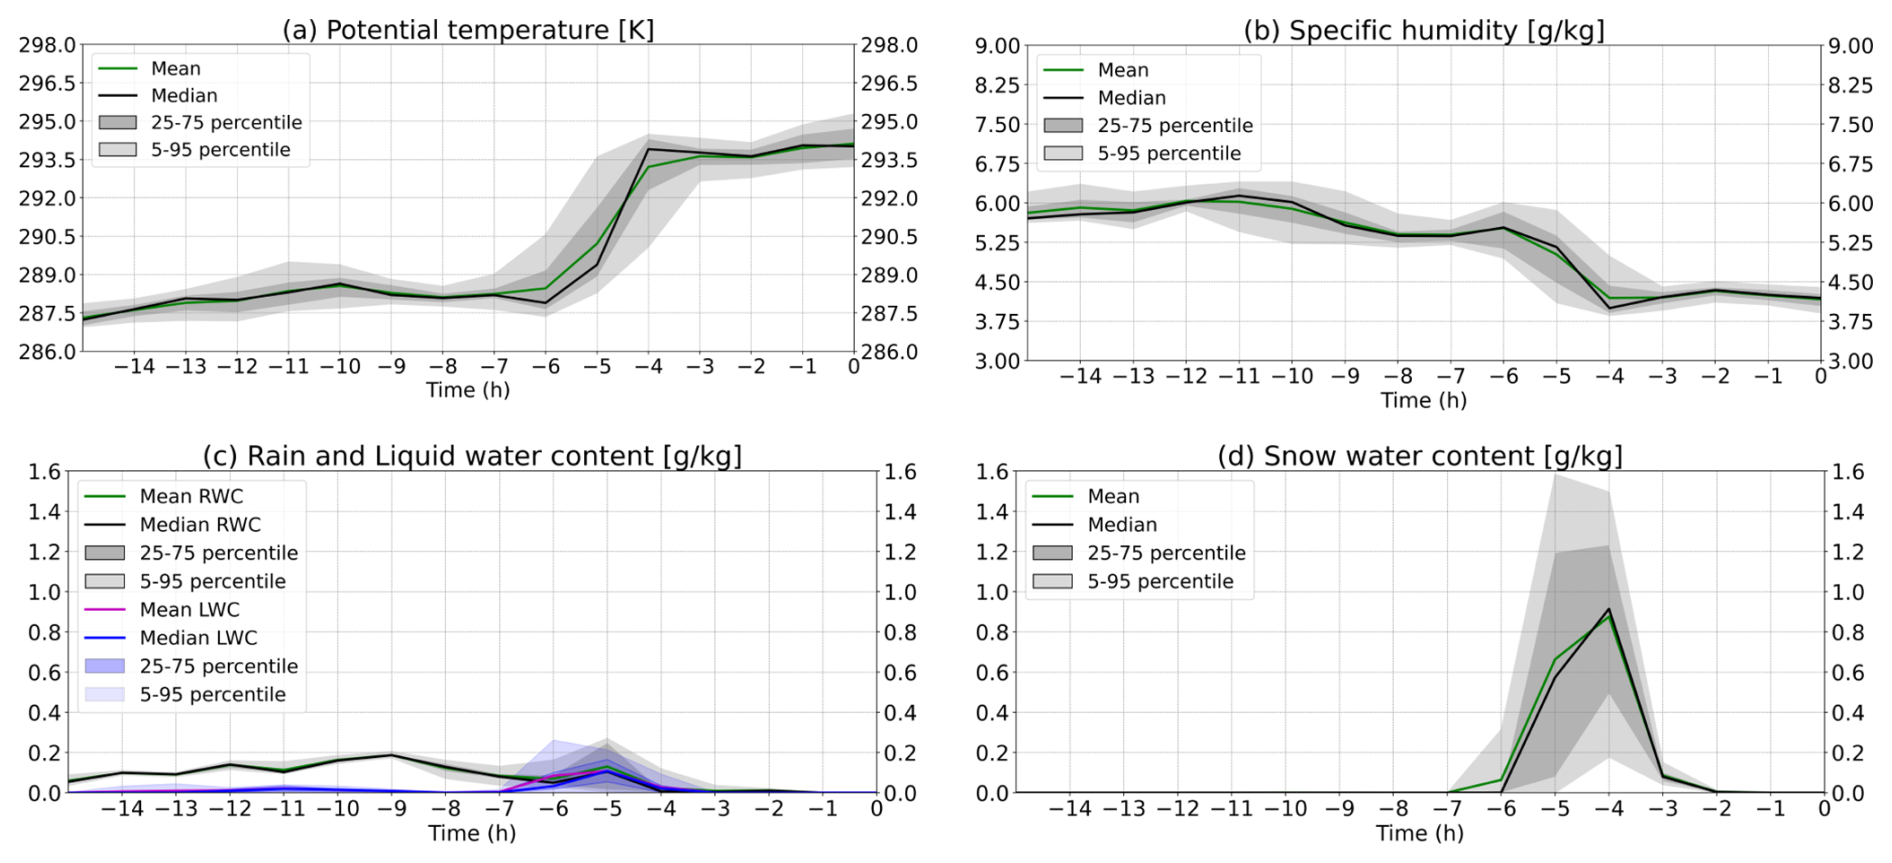
Figure 3As Fig. 2 but for (a) θ (K), (b) specific humidity (g kg−1), (c) rain and liquid water content (black and blue, respectively, g kg−1) and (d) snow water content (g kg−1).
The time evolution of the key properties of the SJ trajectories is illustrated in Figs. 2 and 3. Figure 2 contains time profiles of wind speed, pressure, PV and relative humidity (RH) with respect to water along the selected SJ trajectories. Figure 2a shows that all the acceleration along the trajectories occurs in the latest 5 h (i.e., from 10:00 UTC), when the airstream starts being aligned with the storm propagation and, on top of it, accelerates relative to the cyclone centre (not shown). Figure 2b shows that most of this increase in wind speed happens when the SJ is descending. The trajectories stay in the boundary layer, with their median pressure higher than 880 hPa until 6 h before the release time ( h, 09:00 UTC), they then ascend close to 760 hPa at h, before descending and crossing the 840 hPa pressure level.
Figure 2c illustrates the evolution of PV along the trajectories, with values initially slightly above zero and a temporary increase to roughly 0.5 PVU at h. This is followed by a rapid decrease, particularly between h and h, with the mean and median PV values reaching around −0.5 PVU by h, i.e. by the end of the ascent. As PV returns back towards zero during the final descent, variability across trajectories increases substantially, with almost 2 PVU separating the 5th and 95th PV percentiles at release time. Looking at Fig. 2d we can see that RH hovers around 85 %–90 % in the hours before the SJ descent, with a minor increase up towards 100 % peaking at h. This is followed by a rapid drying up during the descent with values decreasing sharply towards 50 %. In summary, Fig. 2 highlights the typical SJ behaviour of the selected trajectories, displaying at first the onset of SI during the ascent in near-saturated air and then its release as the airstream descends, accelerates and dries up.
Figure 3 allows us to have a closer look at the moist processes associated with the SJ evolution just described. Fig. 3a highlights the marked increase in potential temperature, θ, from around 288 to 294 K, that characterises the ascent of the SJ, from h to h. There is instead minimal change in θ during the following descent, which can thus be characterised as mostly adiabatic. The increase in dry θ during the ascent is not mirrored by its equivalent counterpart (θe, not shown), hence indicating that it is primarily driven by diabatic processes acting on the trajectories rather than mixing with warmer air. This diabatic warming during the SJ ascent is associated with a clear decrease of around 1.5–2 g kg−1 in specific humidity, displayed in Fig. 3b, and, initially, a slight increase in RH. This suggests the occurrence of condensation. Changes in specific humidity during the final descent are negligible, confirming its predominantly adiabatic character.
Figure 3c contains time series of cloud liquid water content (black line and grey bands) and rain water content (blue line and bands). There is a small and near-constant rain water content on the trajectories while they travel in the low levels, then becoming negligible, but with increased variability as the airstream ascends, between h and h. At the same time, the variability across trajectories of liquid water content, on average close to zero, also increases. This enhanced variability with little change in mean and median values suggests that water content in different species is being added and removed from the trajectories at similar rates, for instance by condensation and rain steadily acting during the SJ ascent. Snow water content is displayed separately in Fig. 3d. Snow water content is equal to zero for all trajectories until the start of the ascent at h. It then increases abruptly, with the mean and median trajectories peaking at close to 1 g kg−1 at h and the 95th percentile at 1.6 g kg−1 at h. These values are substantially higher than the roughly 0.3 g kg−1 95th percentile peak reached by rain and liquid water content. This large increase in snow water content happens as trajectories ascend towards the freezing level, with mean and median temperature values decreasing from around 5 °C (278 K) at h to just below zero at h, before warming again during the final descent (Fig. A1a). This behaviour thus suggests that substantial snow is falling into the airstream.
To summarise, this section shows that the selected trajectories display a behaviour that is typical of a SJ, descending and accelerating off the tip of the cloud head to generate strong low-level winds into the frontal-fracture region. The identified SJ is associated with SI and the onset of this instability, as the airstream ascends, is characterised by the joint action of liquid and solid moist processes, with snow becoming more important as the SJ moves closer to the freezing level. To better understand how these processes drive the dynamics of the SJ, in the next sections we first analyse the three-dimensional evolution of PV and then identify the diabatic processes (starting from the indications from the profiles just described) playing a role in changing PV.
3.2 PV evolution along SJ trajectories
In this section we use the horizontal maps in Fig. 4 and vertical cross-sections in Fig. 5 to detail the evolution of PV along SJ trajectories and in the environment around them, focusing in particular on the cloud head and the bent-back warm front. The different panels of Fig. 4 cover the evolution of the rapidly deepening cyclone from before the start of the SJ ascent all the way towards the end of its descent. At each of these times they illustrate the structure of the storm at the pressure level that is nearest to the mean pressure of the trajectories. The two vertical cross-sections in Fig. 5 are generated using the transects in Fig. 4e. They refer to 11:00 UTC ( h), the end of the SJ ascent when PV has decreased below zero on all trajectories. They are orientated along and across the SJ and the negative PV filament associated with it.
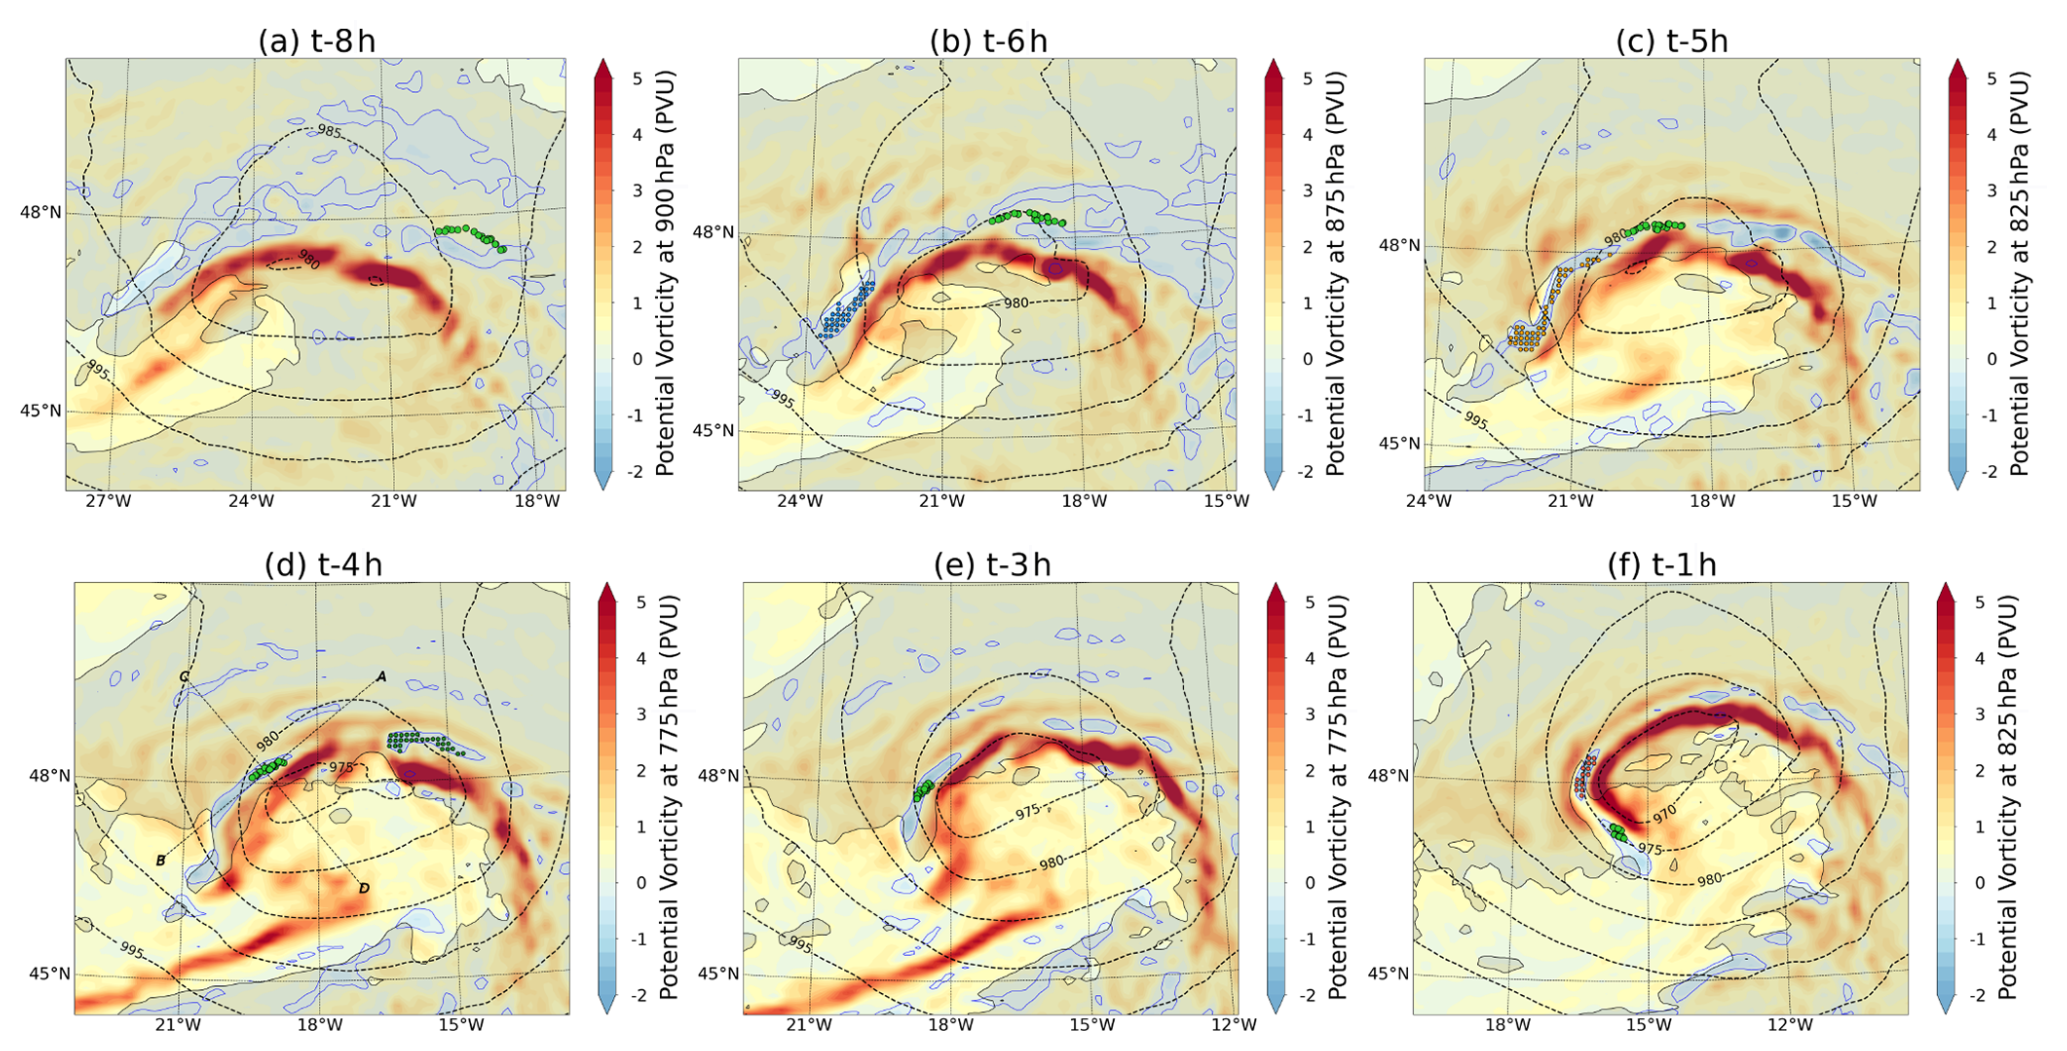
Figure 4PV (shading) and RH with respect to water (grey shading, > 80 %) at the pressure levels indicated and mean sea level pressure (dashed black contours) at the times indicated (hours relative to the trajectory release time, i.e., 15:00 UTC on 1 November 2023). Green dots show the location of SJ trajectories at the related times, while other coloured dots indicate the release points of the additional trajectories presented in Sect. 3.6. In each panel the pressure level chosen is the closest to the mean pressure of the trajectories.
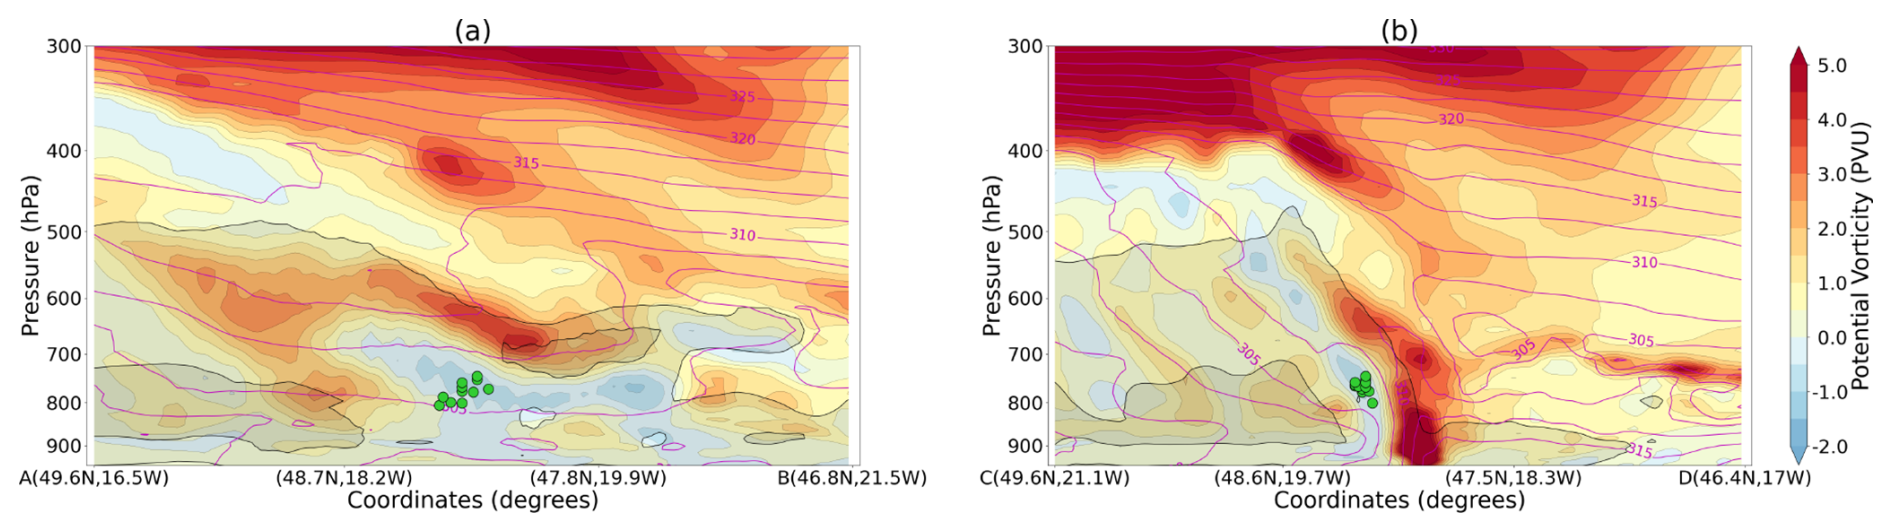
Figure 5Vertical cross-sections of PV (shading), RH with respect to water (grey shading, > 80 %) and θe (magenta contours) along the (a) AB and (b) CD transects shown in Fig. 4d, referring to h. Individual trajectories are projected on the section and shown only if less than (a) 5 km or (b) 20 km away from it, consistent with the elongated shape of the PV < 0 filament in which the trajectories are located (Fig. 4d).
Figure 4a refers to when the SJ trajectories are yet to start ascending, and are found at low levels on the outer (i.e. cold) side of the warm front, with widespread low or negative PV around them. Figs. 4b–d show that as the SJ trajectories ascend up to above 775 hPa by h, the cyclone continues to evolve following the Shapiro-Keyser conceptual model, with the cold front detached from the bending-back warm front. The SJ trajectories rotate cyclonically around the warm front and at h are located at the rear end of a narrow filament of negative PV found just on the cold side of the front and roughly parallel to it. The structure and location of this filament is consistent with the results from the idealised simulations shown in Volonté et al. (2020) and thus with the conceptual model of SJ evolution there verified, after being introduced in Volonté et al. (2018), highlighting the role of vorticity tilting via slantwise circulations in the generation of negative PV (Sect. 1.2). Other negative-PV filaments are visible throughout these times ahead of the one in which the SJ is shown. This suggests the presence of earlier SJ activity in the cloud head, in the same way as the presence of another negative-PV filament behind the trajectories points at the potential for later sting-jet activity. This potential additional SJ activity will be investigated in Sect. 3.6, using the trajectories calculated from the release points included in these panels. Additional weaker high-low PV bands (with some pockets of negative PV) are present to the outside of the warm front and the SJ negative-PV filament. These bands, also oriented along the front and sitting within the cloud head, suggest the presence of multiple secondary circulations around the main frontal zone and indicate potential for SI even in outer regions.
Figure 4e shows the SJ trajectories travelling as a compact group in the initial stages of their descent while leaving the tip of the cloud head. At h the negative-PV region in which they travel is starting to be associated with the cloud gap characterising the tip of the cloud head, further confirming that descent, with its consequent decrease in relative humidity, is taking place around the trajectories. Figure 4f shows the trajectories entering the frontal-fracture region while in the late stages of their descent. The bent-back front is continuing its wrapping process and the trajectories are now ahead of the cloud-head tip and are reaching their maximum speed, as shown in Figs. 1 and 2a). There is now another negative-PV filament behind the main SJ, that is reaching the tip of the cloud head and opening a gap in the cloud head as it presumably descends and accelerates as a later SJ, also investigated in Sect. 3.6.
The two vertical cross-sections in Fig. 5 display the environment around the SJ trajectories at h, the end of the ascent. Section AB, in Fig. 5a, is oriented along the negative-PV filament and shows that the trajectories are found in an elongated area of negative PV centred between 700 and 800 hPa. Whilst the SJ trajectories are still in the final stages of their ascent, the negative-PV filament is generally oriented downward, with some regions extending down towards the surface. The area of markedly positive PV, with widespread values exceeding 3 PVU above the negative-PV filament is part of the outward-slanted bent-back warm front, intercepted by the section between 600 and 700 hPa. Section CD, in Fig. 5b, is oriented across the bent-back warm front and the negative-PV filament. It confirms the slanted structure of the warm front from around 750 hPa upwards, whilst the intense front is upright at lower levels. The same slanted structure is displayed by the several PV bands present in the cloud head that are located on the outer side of the most intense positive-negative PV dipole, associated with the bent-back front and of which the SJ negative-PV filament is part. This multipole PV pattern is consistent with the results in Chagnon et al. (2013), in which a tripole PV pattern was found to be associated with a thermally direct frontal circulation (in their case associated with a single cold front), with enhanced PV at the front and reduced PV on the outer sides of the warm-sector condensational heating and cold-sector evaporative cooling. This PV pattern is also consistent with the results from the idealised simulations in Volonté et al. (2020), also showing strong PV bands located in correspondence with frontal circulations in the cloud head. The results from this section therefore suggests the presence of multiple thermally direct circulations in the cloud head, particularly intense at the bent-back front, driven by moist processes and by the associated heating and cooling.
Overall, the results presented up to this point give extensive evidence that the selected trajectories are associated with the evolution of a SJ displaying the development and subsequent release of SI (indicated by negative PV), as the SJ ascends into the cloud head and then descends and accelerates out of its tip, respectively. At the same time, intense frontal circulations and associated moist processes drive the evolution of PV in the environment around the trajectories. This case can therefore be used to investigate the diabatic processes at play during the decrease in PV along the ascending SJ, ultimately tackling the question of identifying the processes acting to make the SJ symmetrically unstable and thus enabling further acceleration during its descent.
3.3 Identification of diabatic processes along SJ trajectories
Figure 6 contains a box-and-whisker plot displaying the change in PV and the accumulation of the different PV tendencies in the time characterised by SJ ascent, h to h (09:00 to 11:00 UTC). The total change in PV is shown by the leftmost box and whiskers (ΔPV), illustrating the generalised decrease in PV during SJ ascent, with both mean and median value around −1.1 PVU in 2 h. Only part of this PV decrease is captured by the tendencies, with mean and median of the sum all of PV tendencies (∑APVall in Fig. 6) showing a decrease of around −0.35 PVU (roughly a third of the actual PV decrease) and the extension of the whiskers indicating large variability across different trajectories. This substantial discrepancy between the actual change in PV and that captured by the sum of the accumulated PV tendencies can be ascribed to mainly two factors that must be acknowledged as limitations of this study.
-
When processes are fast-changing and non-linear, as is the case with SJ dynamics, instantaneous hourly output (used in this study, meaning that the ascent is described by only three instantaneous output values for each tendency) can differ greatly from timestep-by-timestep data.
-
In a small-scale, fully three-dimensional environment with steep gradients, as is the case on the cold side of the bent-back warm front, small inaccuracies in trajectory locations can result in large errors.
This second point explains why the agreement between PV modification and the accumulated PV tendencies becomes even worse during the final SJ descent (not shown), when small-scale processes like turbulence become more important as SI is released. Similar issues have recently been described in other works, such as Wimmer et al. (2022) and Oertel et al. (2023). In particular, it is important to stress that in these fast-changing and small-scale environments, finer resolution simulations can show even larger and inaccurate tendencies, caused by localised and short-lived very large values of diabatic heating gradients, as noted by Oertel et al. (2023) when analysing their simulations, with grid spacing ranging from 3 to 13 km. In such environments the use of higher frequency trajectory input data is markedly beneficial, such as 15-minute vs hourly as in Volonté et al. (2018). However, Oertel et al. (2023) show that in these situations even the use of all-time-steps online trajectories might not guarantee a complete disappearance of the discrepancies between full PV modification and the sum of accumulated PV tendencies.
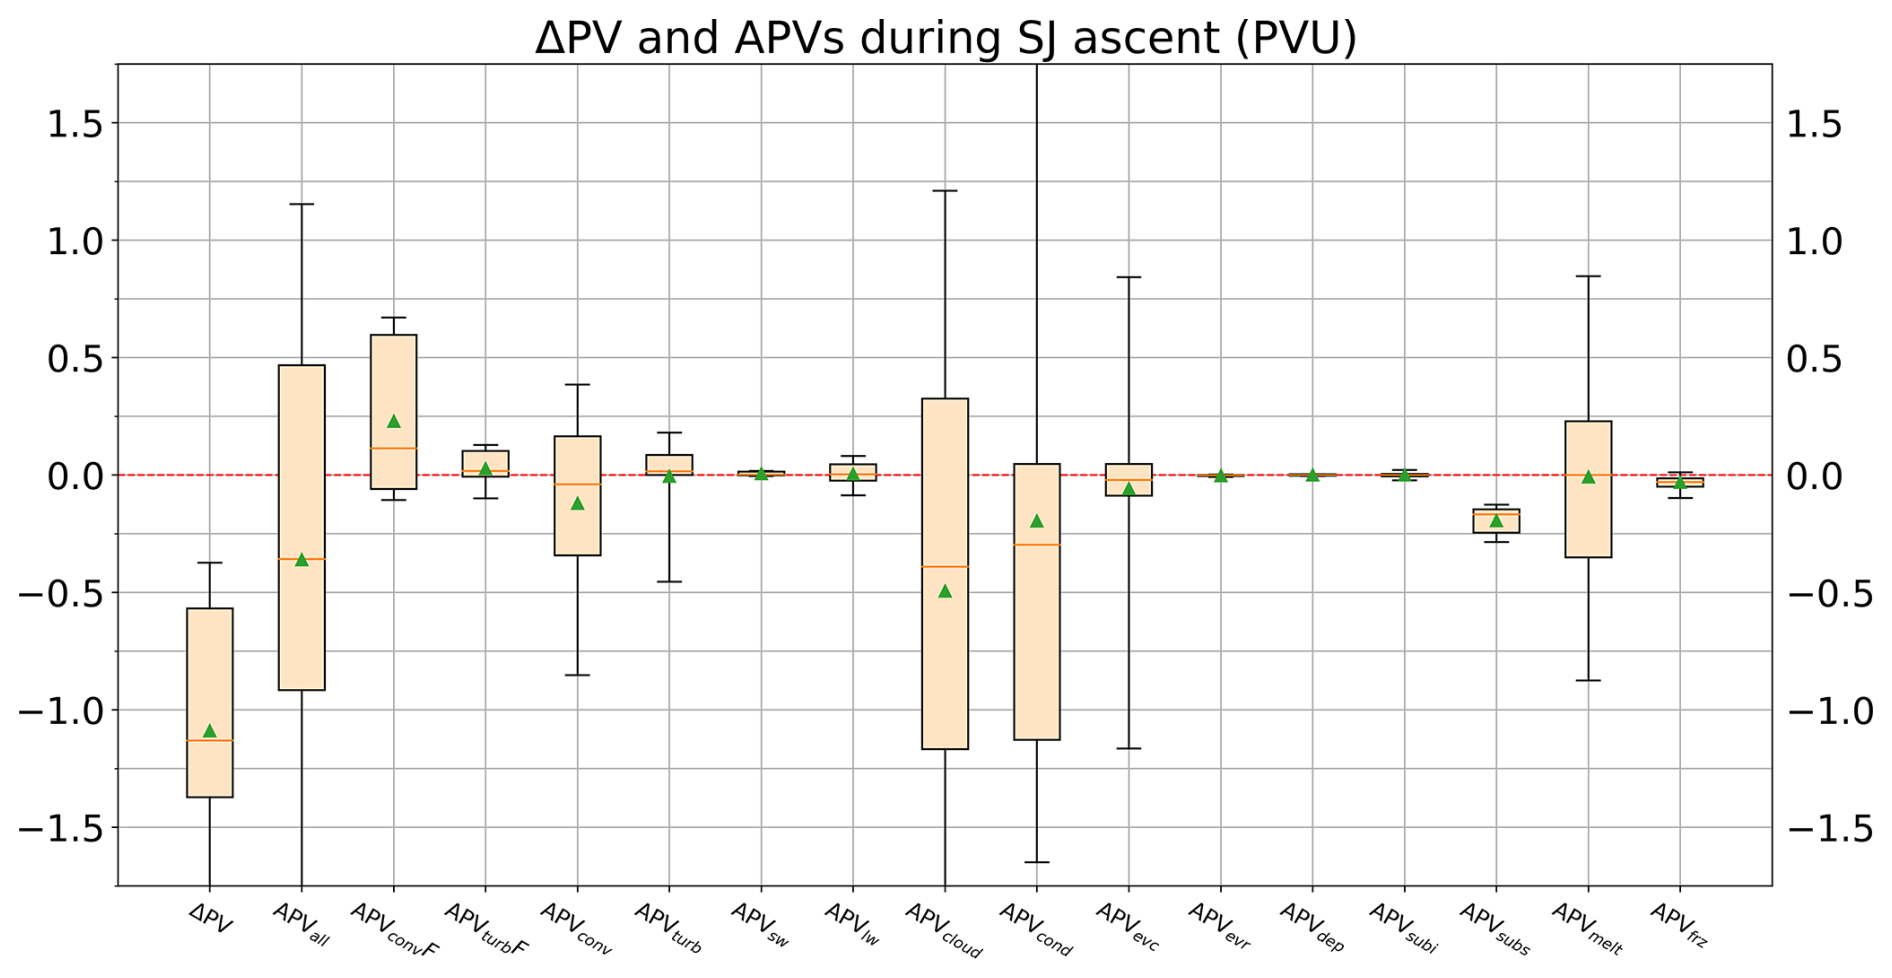
Figure 6Box-and-whisker plot of the total change in PV (ΔPV) and the accumulation of individual PV tendencies (APVi, see Table 1) along SJ trajectories from h to h (09:00 to 11:00 UTC). Each box covers the interquartile range of the trajectory distribution, while whiskers extend to the 5th and 95th percentiles. Orange lines and green triangles indicate median and mean values, respectively.
Despite these inherent limitations, it is still possible to use the individual PV tendencies to identify and describe the diabatic processes at play in the decrease of PV to negative values, i.e., the onset of SI, along the SJ. This is because, while there is considerable variability and little net accumulation from momentum tendencies and fast physics processes (convection and turbulence) and while radiative processes do not seem to be playing a relevant role, most of the contribution to PV decrease captured by PV tendencies can be ascribed to cloud processes, albeit with large variability. This is indicated by the sum of all the tendency accumulations associated with cloud processes (APVcloud, see Table 1), which is negative for most (at least three quarters) of the trajectories and with a median decrease around −0.4 PVU and a mean decrease of −0.5 PVU.
Figure 6 contains also the boxes and whiskers associated with the individual cloud processes included in APVcloud, displayed on its right-hand-side in the figure. There are four processes showing non-negligible contributions: condensation of water vapour (APVcond), evaporation of cloud water (APVevc), melting of ice and snow (APVmelt) and sublimation of snow (APVsubs). APVcond is characterised by the largest variability and by most trajectories experiencing PV decrease, near −0.25 PVU for both mean and median. The cloud evaporation and melting tendency accumulations show smaller but still considerable variability and have mean and median values near zero. The snow sublimation PV tendency accumulation is instead much better constrained, showing a limited but fully coherent PV decrease, as the mean and median values are around −0.2 PVU and the 5 %–95 % percentile range is all contained between −0.1 and −0.3 PVU.
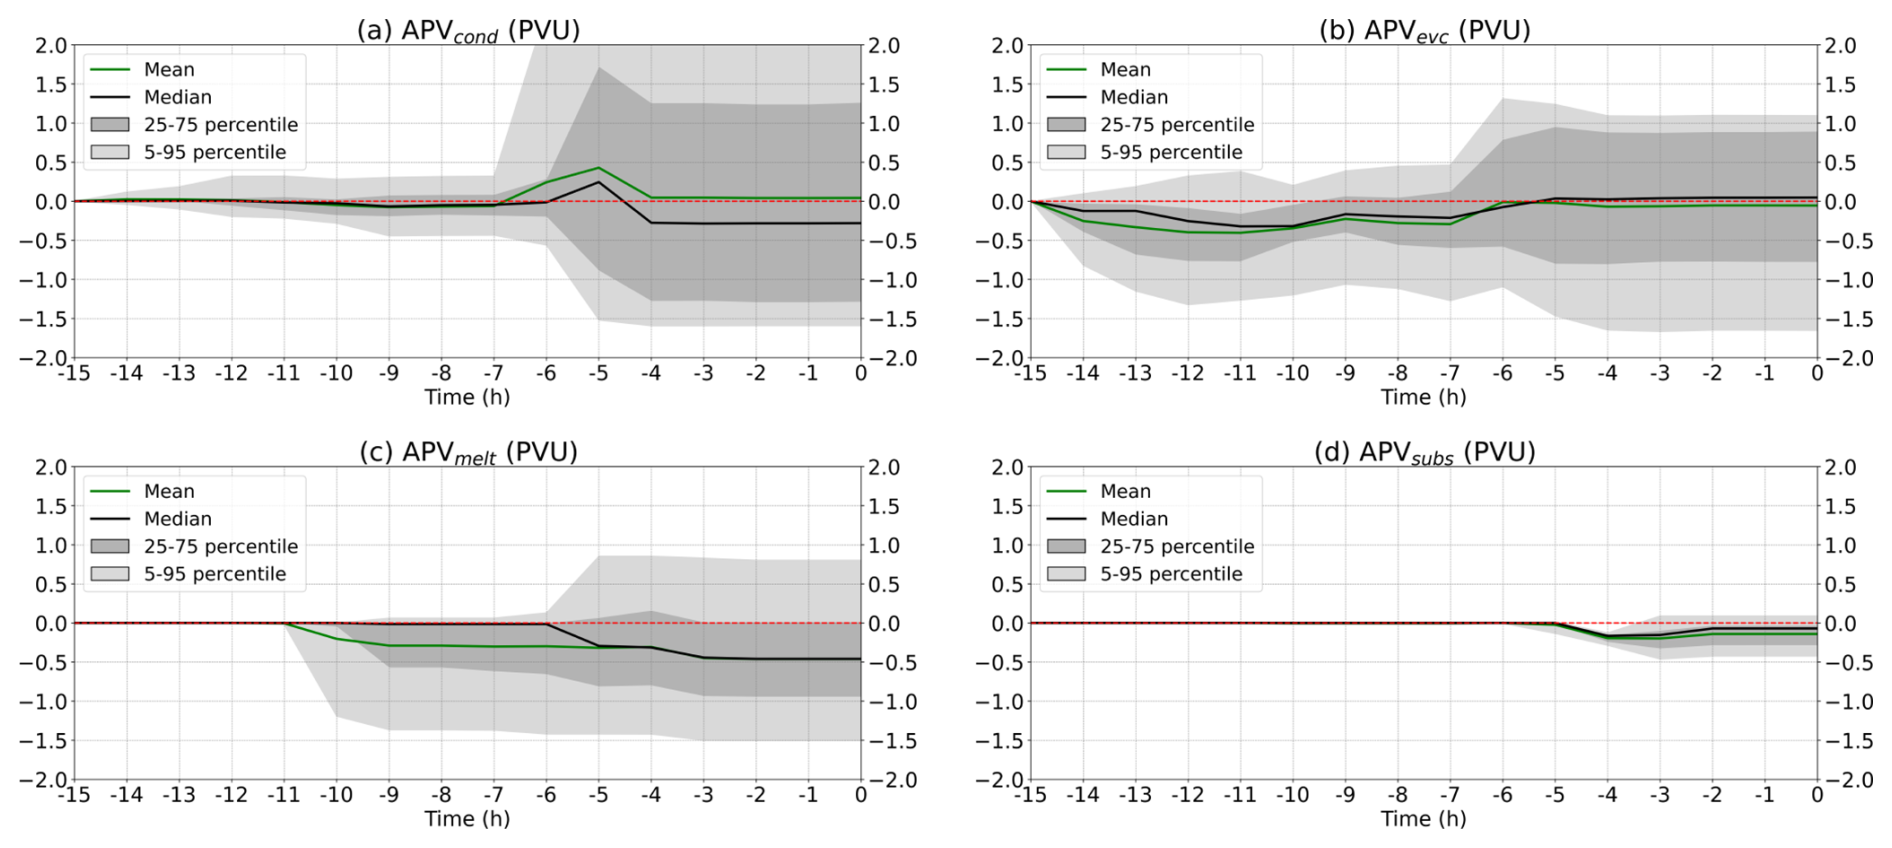
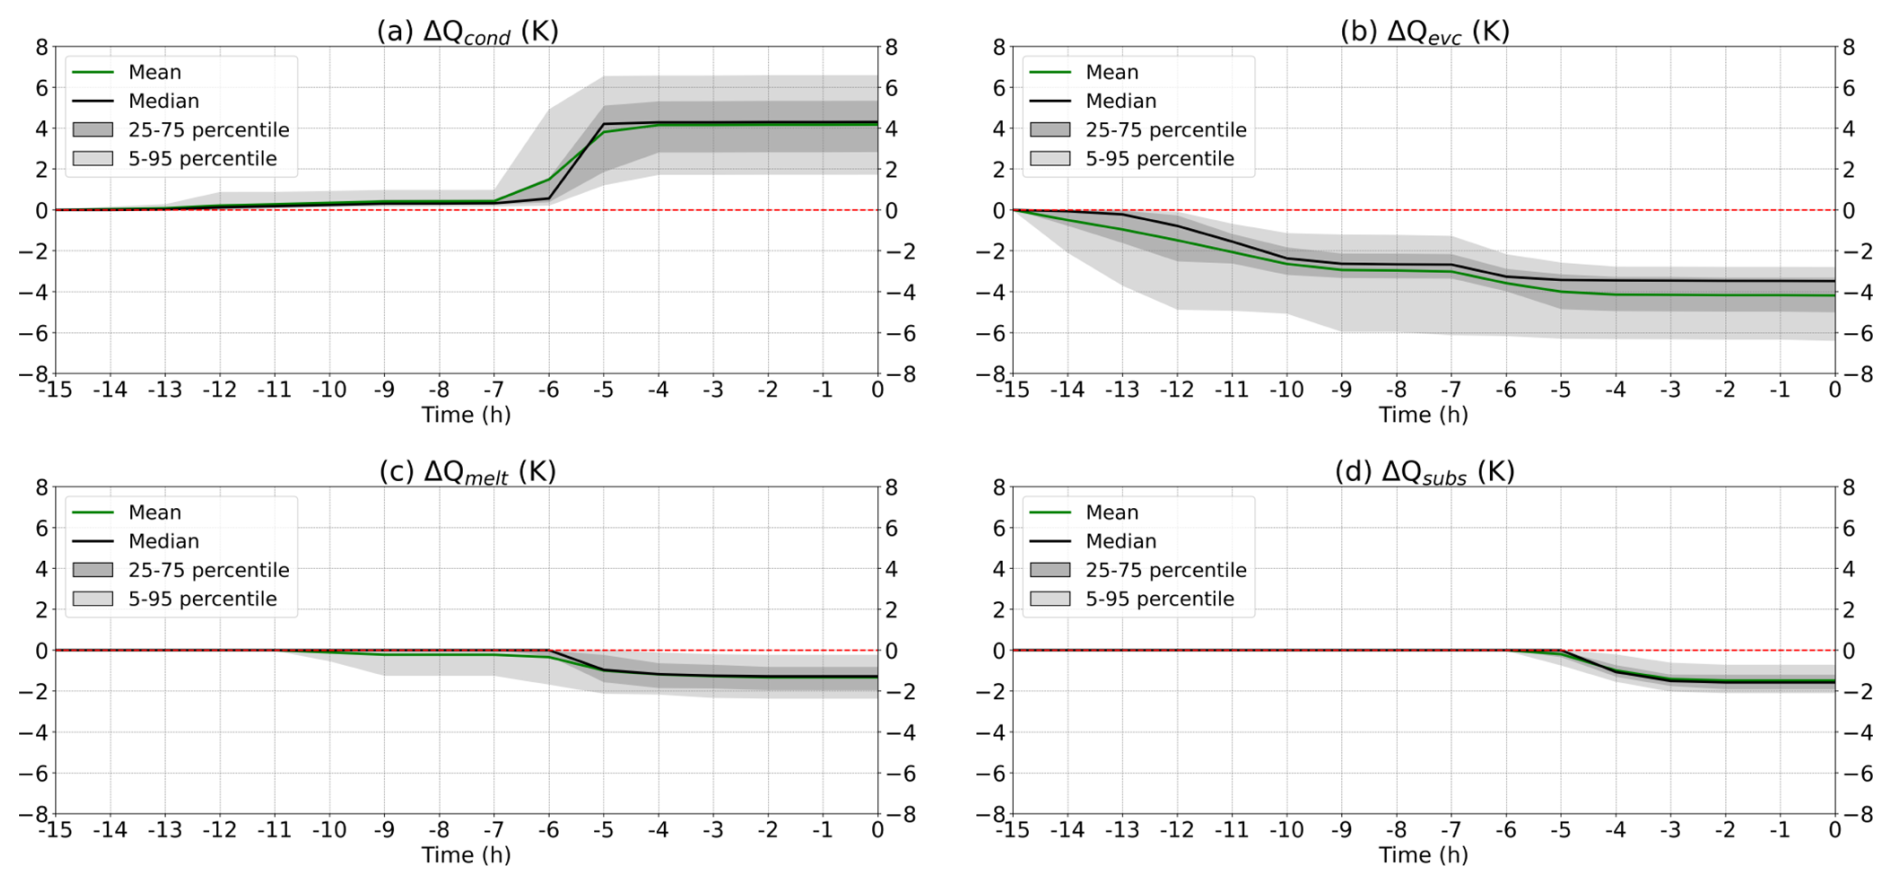
Figure 8As Fig. 2 but for the accumulated θ tendencies due to (a) condensation of water vapour, (b) evaporation of cloud water, (c) melting of ice and snow, (d) sublimation of snow.
Figures 7 and 8 illustrate the evolution over time of PV and θ tendency accumulations traced along the SJ trajectories. Focusing on the four individual cloud processes identified in the analysis of Fig. 6, Figs. 7a and 8a show, respectively, the accumulation of PV and θ tendencies due to condensation of water vapour. These timeseries show that condensation only starts having a noticeable effect from around t=-7h, when the SJ trajectories are about to start their ascent and have moved close to the bent-back warm front (Fig. 4b–c). It is at this point that most of the condensation occurs on the trajectories, as confirmed by the heating, on average exceeding 4 K, experienced during the first part of the ascent ( h to h). At the same time, PV tendencies display large variability, suggesting that the trajectories are now in a highly complex environment, and the mean and median timeseries show a pattern of an increase followed by a decrease . This decrease occurs in the second part of the ascent and is consistently shown across percentiles, indicating that is experienced by most of the trajectories. Figures 7b and 8b show the accumulation of tendencies due to evaporation of cloud water. In this case, gradual cooling and general PV decrease are present at early stages, when the trajectories are in the boundary layer and likely below the evaporative cooling core. Additional cooling, up to around 1.5 K, occurs during the first part of the ascent. This cooling is associated with a small increase in PV median and mean timeseries, although a substantial portion of the trajectories experience changes of at least 0.5 PVU, either increasing or decreasing. This behaviour points at a situation where small spatial differences can lead to opposite changes in PV.
Figures 7c and 8c contain the accumulation of tendencies due to melting of ice and snow. At h they show a PV decrease that is experienced by a substantial minority of trajectories, down to near −1.5 PVU at the 5th percentile. This decrease is associated with generally small cooling. Additional limited cooling is experienced by most trajectories during their ascent, at around h. This is associated with both positive and negative changes in PV and with the median and mean timeseries reaching around −0.5 PVU. The different consequences in terms of PV modification associated with cooling is consistent with the trajectories moving from a situation of widespread cooling under the cloud head (with the cooling maximum above them) to a frontal environment characterised by tighter gradients. Figures 7d and 8d show the accumulation of tendencies due to sublimation of snow. This process only takes place along the trajectories during the second part of the ascent ( h to h). While it is associated with limited changes in PV, it also has across-trajectories variability much smaller than the other three cloud processes considered. More than 95 % of the trajectories experience a small (less than 0.5 PVU) PV decrease, associated with a 1–2 K cooling. It is worth noting that both melting and sublimation of snow occur just before the end of the ascent. The cooling associated with these processes, in addition to being responsible of part of the PV decrease leading to the onset of SI, contributes also to the reduction of buoyancy, thus favouring the start of SJ descent.
In general, it is important to remember that fairly straightforward heating/cooling timeseries can be associated with far more complex PV modifications. This is a direct consequence of the definition of PV containing a scalar product between absolute vorticity and the gradient of θ (Sect. 1.2). Changes in PV are more directly associated with spatial heating/cooling gradients rather than local temperature changes along the trajectories. This is particularly evident during SJ ascent, as trajectories travel in an environment characterised by a steep front and fully three-dimensional sharp gradients in temperature and winds. In this environment, characterised by tight frontal circulations, the evolution of vorticity is also conducive to complex, multi-scale and fast-varying patterns of PV modification. Relative vorticity varies fast in the region, with its vertical component (ζz) becoming negative along the trajectories during SJ ascent and decreasing down to the point that at h also the vertical component of absolute vorticity (, where f indicates planetary vorticity) is negative for most trajectories (see Fig. A1b, considering that at the latitudes at which this evolution is taking place f is around 1.1 × 10⁻⁴ s−1). This is also consistent with the conceptual model of SJ evolution presented in Volonté et al. (2018) (see their Figs. 9 and 16 and further details in Sect. 1) highlighting the role of tight frontal circulations in the generation of negative absolute vorticity and PV.
Therefore, to fully understand the role in the PV decrease along SJ trajectories of the different moist processes illustrated up to this point, we need to use a non-local and three-dimensional perspective, looking at the horizontal maps, vertical cross-sections and time profiles shown in Sect. 3.4 and 3.5.
3.4 Identification of diabatic processes in the environment around SJ trajectories
Figure 9 contains maps of instantaneous PV tendencies for the four moist processes contributing to PV modification during SJ ascent. These maps are generated at 11:00 UTC ( h), the end of SJ ascent, showing the tendencies at the level nearest to the mean pressure of the trajectories (775 hPa).
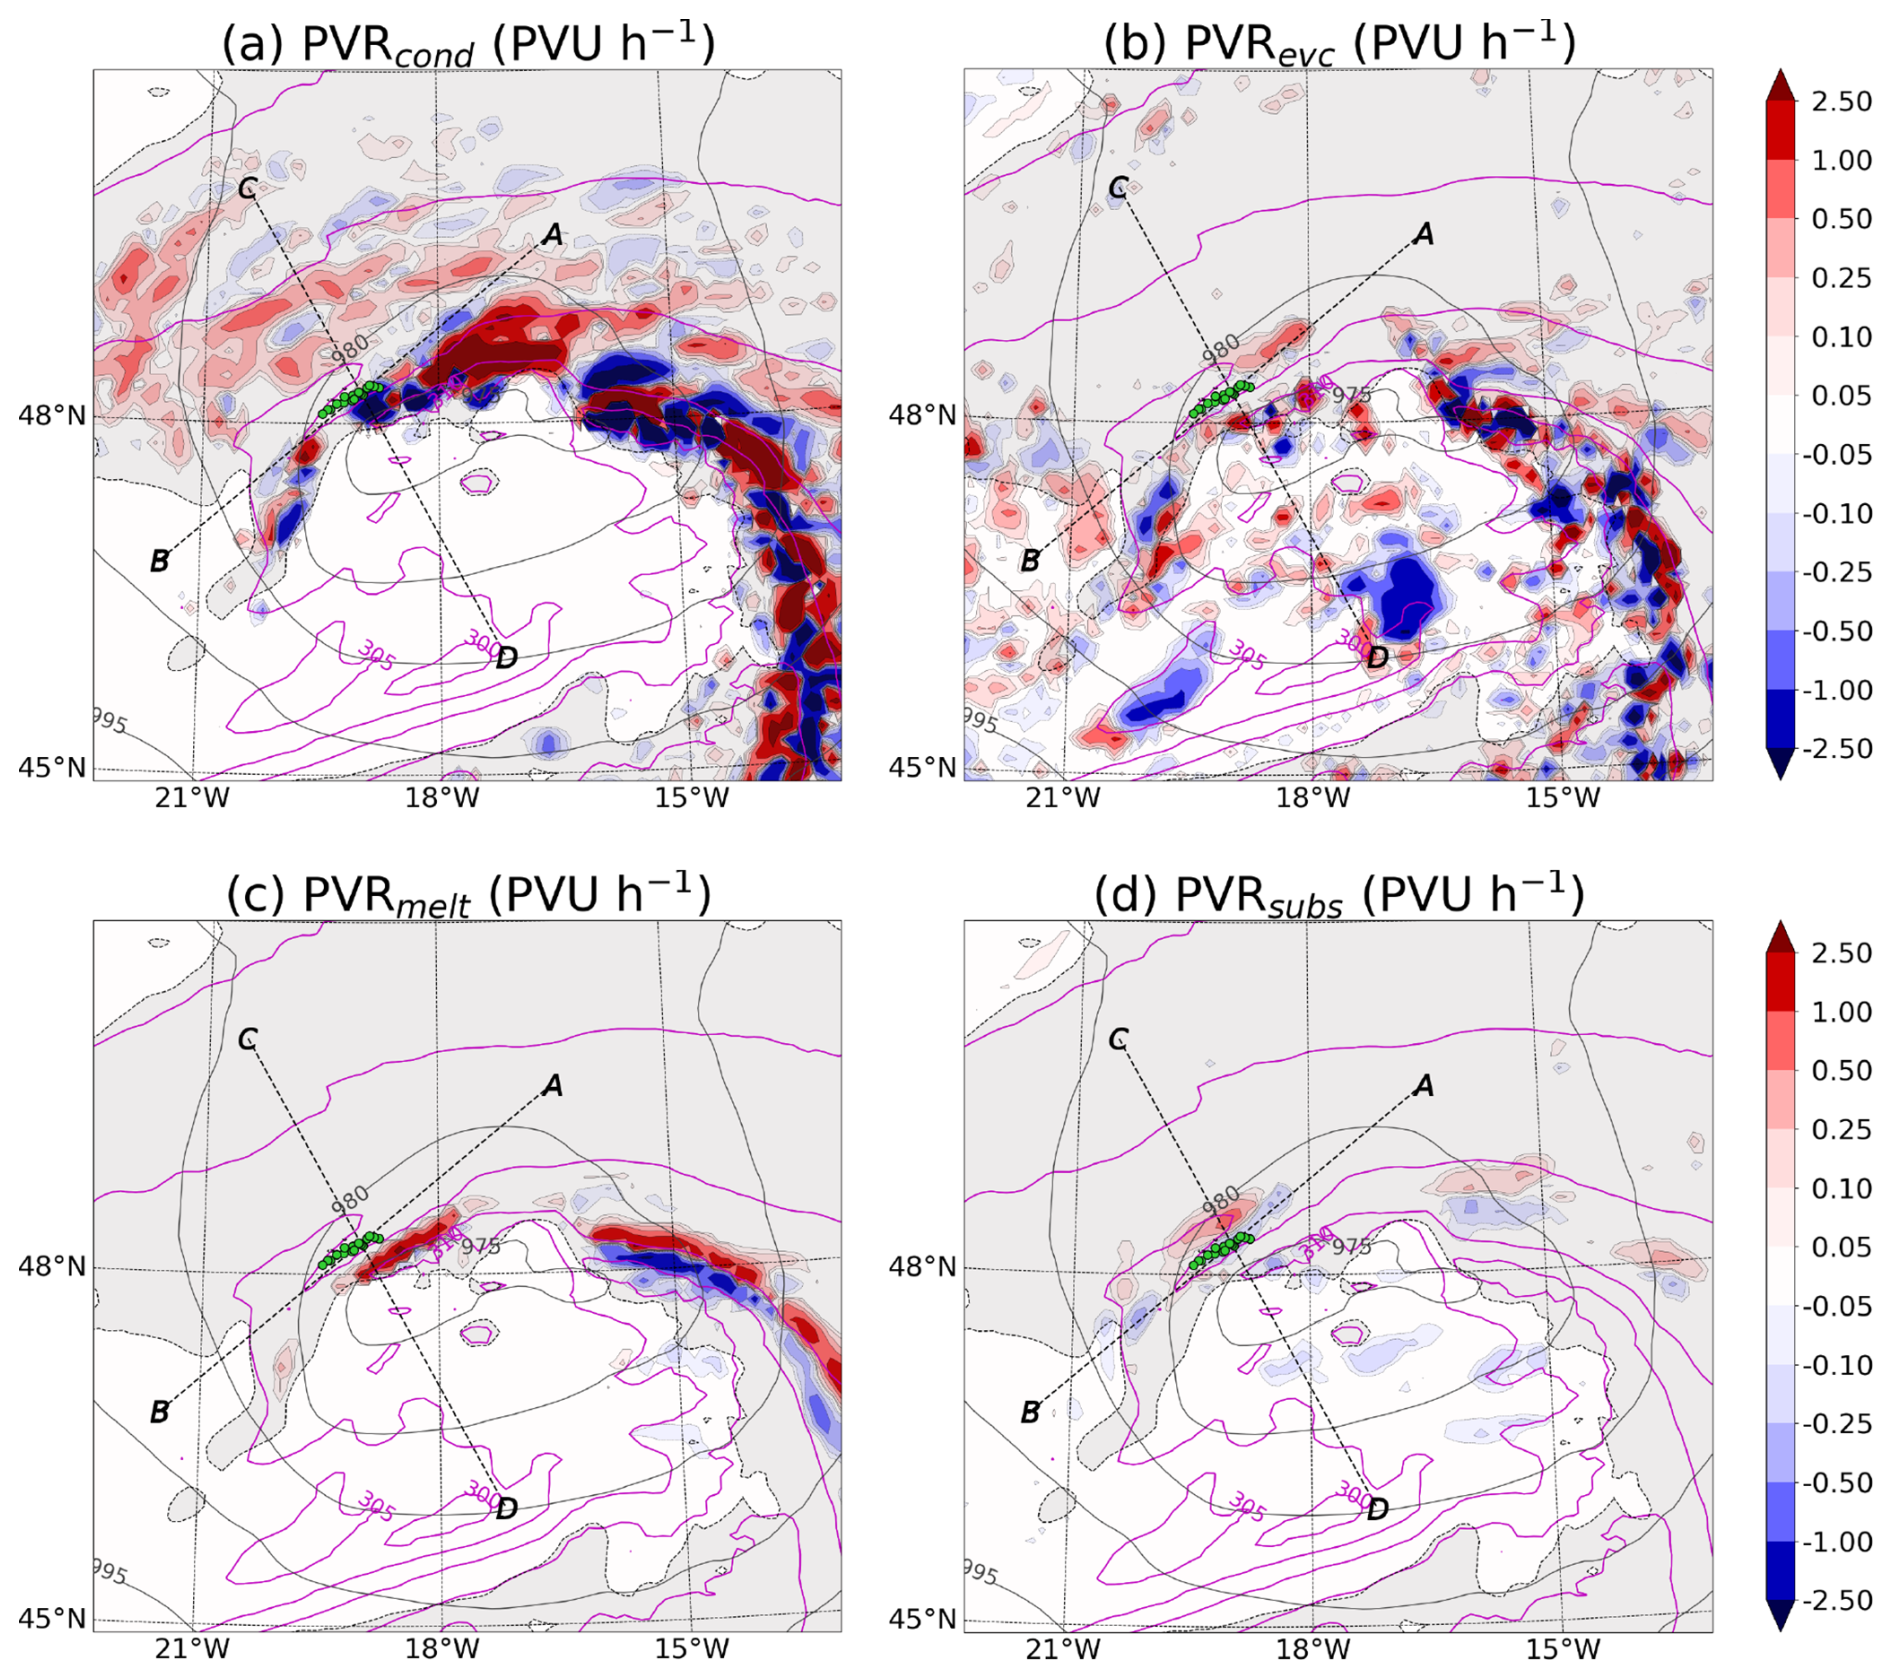
Figure 9Maps of instantaneous PV tendencies due to (a) condensation of water vapour, (b) evaporation of cloud water, (c) melting of ice and snow, (d) sublimation of snow, indicated by the colour shading, θe (magenta contours) and RH with respect to water (grey shading, > 80 %) at 775 hPa and mean sea level pressure (dashed black contours) at 11:00 UTC on 1 November. Green dots show the location of trajectories. The pressure level chosen is the closest to the mean pressure of the trajectories.
Figure 9a shows the instantaneous PV tendency due to condensation of water vapour, PVRcond. Large values of PVRcond, both positive and negative are present throughout the extent of the warm front, mainly on its warm side, and at the bent-back warm front. Moderate values also cover part of the cloud head, on the cold side of the bent-back warm front. Some gaps exist between the large values near the front and the SJ trajectories lie in one of these gaps, characterised by near-zero PVRcond but immediately next to an area of large negative values. These features are consistent with the results in Attinger et al. (2019, 2021), with the caveat that their composite of more than 100 rapidly developing cyclones is much less noisy than our single-case analysis of Storm Ciarán. They show positive PVRcond throughout the length of the warm front and a PVRcond dipole, with negative values inside, at the bent-back front. As in our study, their results highlight the primary role of PVRcond in regions characterised by ascent and indicate that the pattern of PVRcond becomes less straightforward as frontal environments increase their curvature and heating gradients are no longer vertically oriented, such as in bent-back fronts. The PV tendency due to the evaporation of cloud water, PVRevc, is displayed in Fig. 9b. Its pattern is also characterised by a large number of local maxima and minima, mainly near the warm front and along its bent-back part, but also scattered around the cold sector and in the frontal-fracture region. SJ trajectories lie again in an area of negligible tendency, this time near multiple local maxima.
Figure 9c and d contain, respectively, the instantaneous PV tendencies due to melting of snow and ice (PVRmelt) and sublimation of snow (PVRsubs). Values in both panels are substantially better spatially constrained than for PVRcond and PVRevc, with non-negligible tendencies only present at the warm and bent-back warm fronts. PVRmelt is characterised by a clear along-front dipole band on the eastern part of the warm front, with positive values on the cold side, and a small elongated positive patch covering part of the bent-back warm front. This patch is separated from the warm-front dipole by a clear gap and the SJ trajectories are located just outside it, in an area of near-zero PVRmelt. The primary role of melting of snow in generating an overall negative PV anomaly at the warm front is shown in Attinger et al. (2021), consistent with these results, with Attinger et al. (2019) highlighting its positive effect at the bent-back front. The dipole visible here along the warm front suggests that the height of the melting core decreases going outward, thus crossing the pressure level the map refers to. Focusing on sublimation of snow, the largest values of PVRsubs (Fig. 9d) only reach around ±0.5 PVU h−1, much less than for all the other tendencies shown in Fig. 9. These limited PVRsubs values are located in a handful of small-scale dipole bands oriented along the warm and bent-back warm front, again with positive values on the cold side. This highlights the localised nature of PV-changing snowfall and is consistent with Attinger et al. (2019) mentioning the role of sublimation only at the bent-back front. Despite the reduced magnitude and spatial extent of PVRsubs values, in this case SJ trajectories are located in area with clearly negative tendencies. This is in contrast with all the other tendencies shown in this figure, that have trajectories located in regions of negligible change.
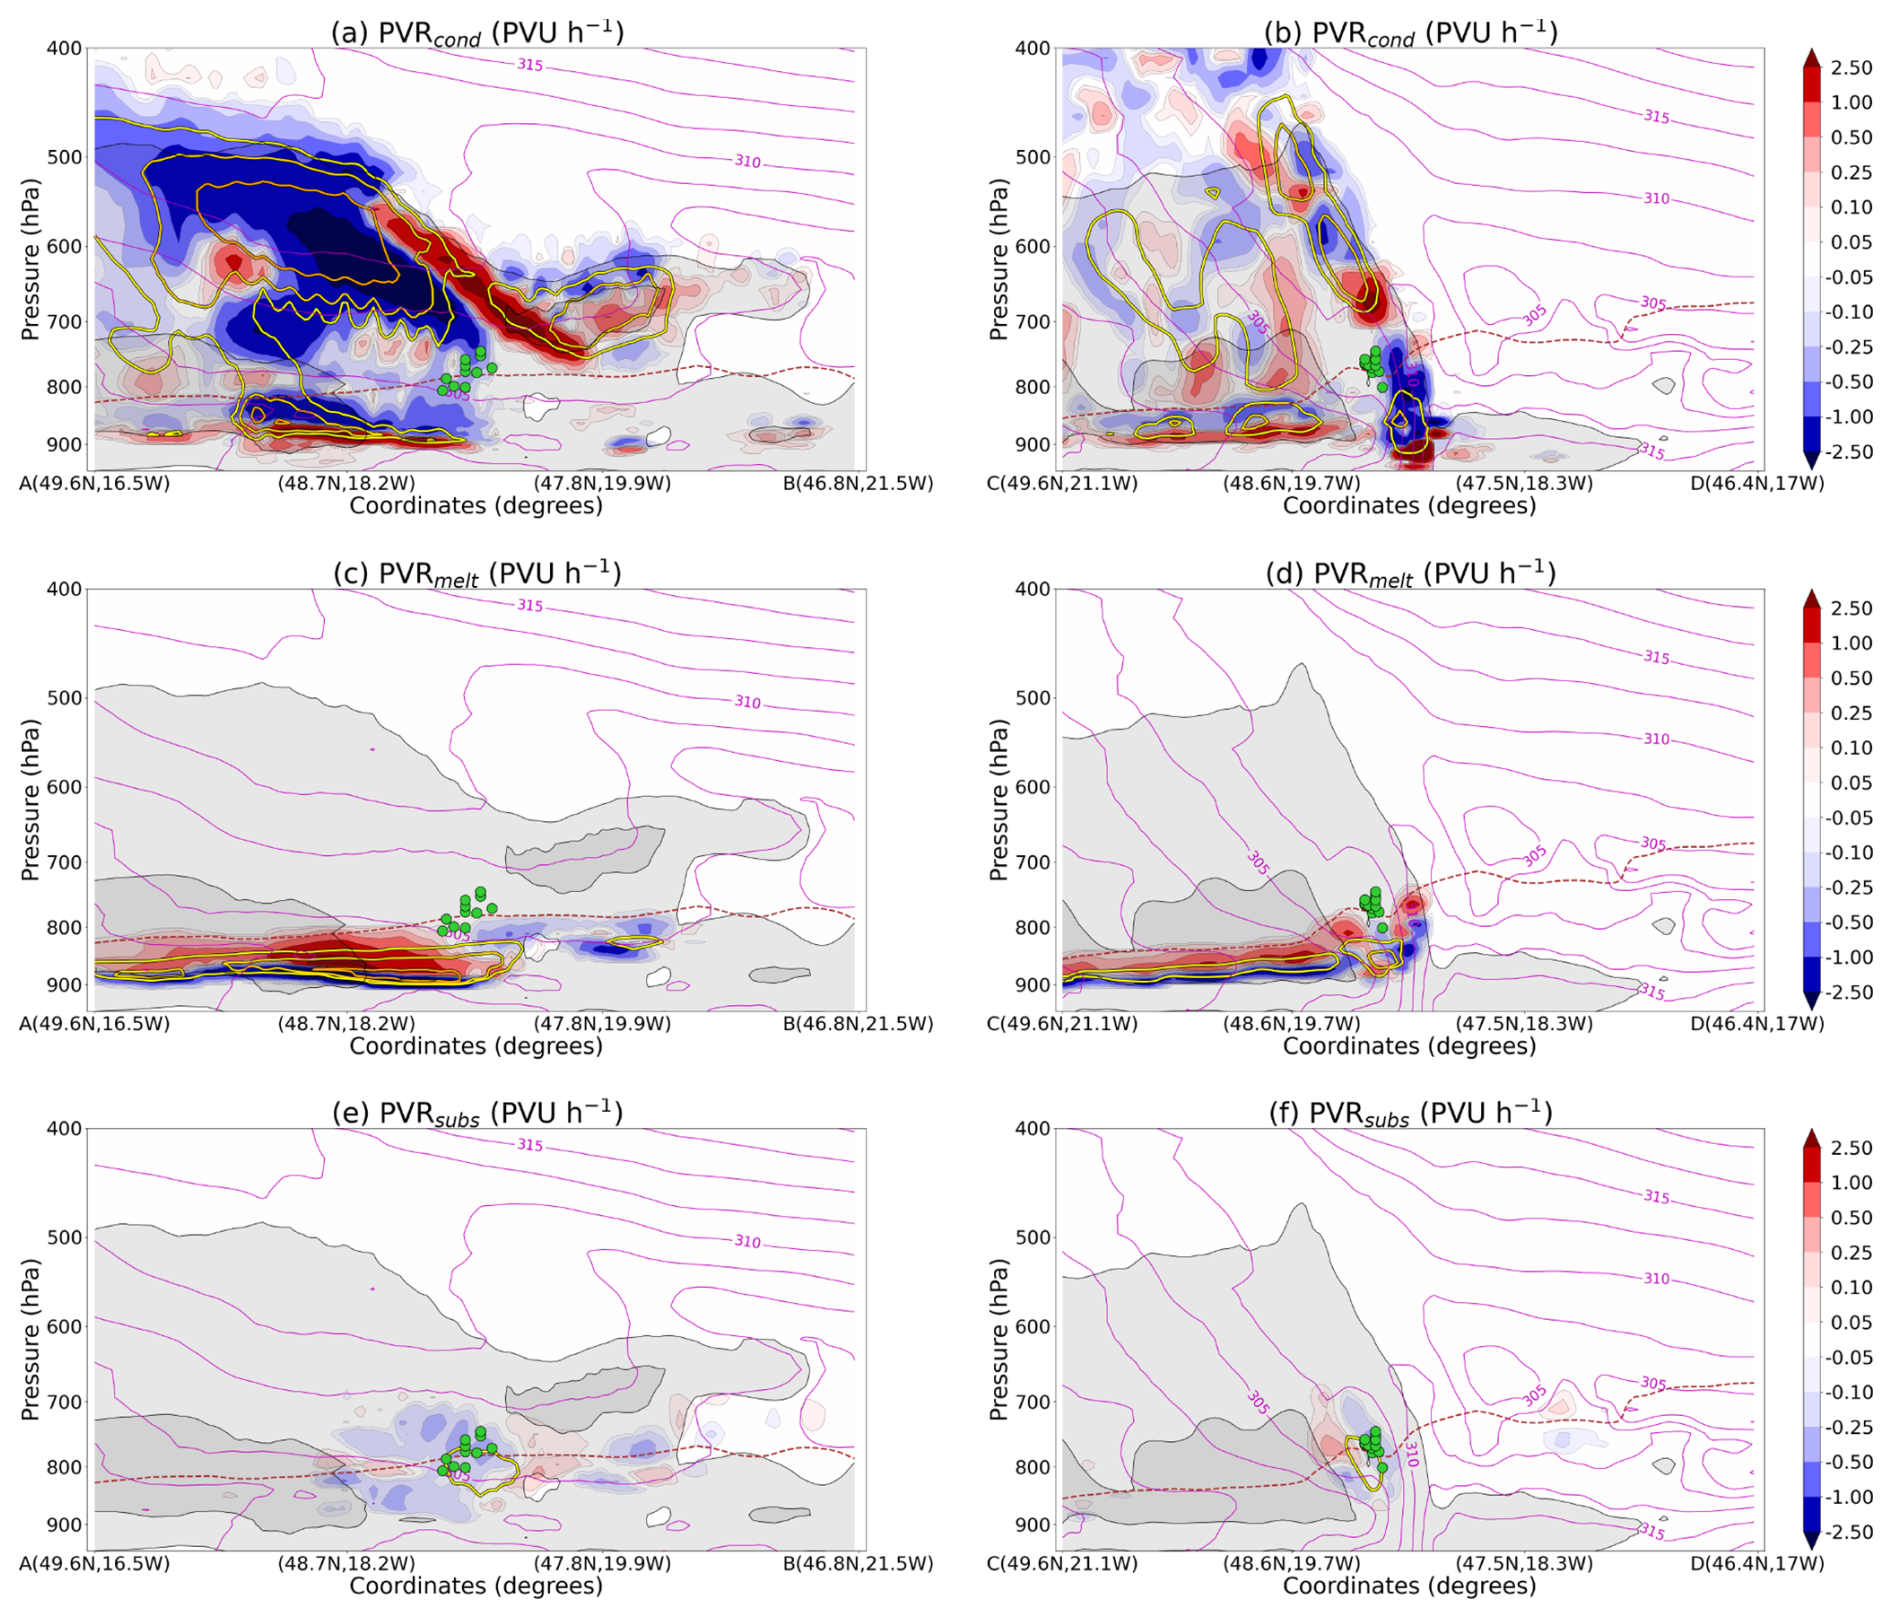
Figure 10Vertical cross-sections of instantaneous PV tendencies (shading) and θ tendencies (yellow, gold and orange contours, respectively at ±1, ±2 and ±4 K h−1) due to (a, b) condensation of water vapour, (c, d) melting of ice and snow, (e, f) sublimation of snow. Also shown are RH with respect to water (light grey shading when > 80 % and darker grey shading when > 98 %), θe (magenta contours) and freezing level (dashed brown contour) along the (a, c, e) AB and (b, d, f) CD transects shown in Fig. 9, referring to 11:00 UTC on 1 November. Individual trajectories are projected on the section and shown only if less than (a, c, e) 5 km or (b, d, f) 20 km away from it.
In summary, large values of PVRcond, PVRevc and PVRmelt (with large variability and noise for the first two) are present near or along the warm and bent-back fronts. Values of PVRsubs are smaller and more localised and, as for PVRmelt, they are oriented in along-front dipoles (positive values outside). However, at this time, SJ trajectories are located in an area of non-zero (negative) tendencies only for PVRsubs. The maps shown in Fig. 9 also highlight the complexity of the bent-back front area, hinting at its three-dimensional nature and therefore stressing the importance of analysing its vertical structure. We do this by looking at the vertical sections in Fig. 10. These sections are generated following the along-front and across-front transects shown in Figs. 4d and 9, used also for the sections in Fig. 5. Like all those figures, they refer to 11:00 UTC ( h), when SJ trajectories are reaching the end of their ascent and PV along them is decreasing fast.
The vertical cross-sections in Fig. 10a–b show the instantaneous PV and theta tendencies due to the condensation of water vapour. The presence of large values of PVRcond along the front, both positive and negative, highlighted by the map in Fig. 9a, is confirmed by these sections. Two heating cores are present at the front, centred at around 850 and 600 hPa, leading to multiple positive and negative local extremes in PVRcond, alternating in an almost-vertical direction (Fig. 10b). The presence of additional frontal bands in the cloud head (see also Fig. 5b) is associated with a heating structure with gradients in both vertical and across-front directions and thus a complex PVRcond pattern. The heating cores shown by the across-front section are also visible in the along-front one (Fig. 10a), in the low levels and near the cloud top, in some places coinciding with regions particularly close to saturation. The low-level heating core is associated as expected with a PVRcond dipole that has negative values above the heating maximum and positive below it. However, due to the complex three-dimensional structure of condensational heating, the PVRcond dipole associated with the intense mid-tropospheric Qcond maximum is not oriented in a negative-above-positive direction. The region of mid-tropospheric heating is tilted with height, as shown in the across-front section (Fig. 10b). The area with large PVRcond values along the bent-back front, shown in Fig. 9a, is also tightly curved. There is thus a mix of multiple heating cores located next to each other in a fully three-dimensional pattern. In addition to this, at this time the vertical component of absolute vorticity is negative along the SJ trajectories, as explained in Sect. 3.3, and in the immediate surroundings, further complicating the relationship between heating and PV modification (Sect. 1.2). This complex PVRcond pattern is therefore inherently associated with the local structure of the bent-back front displayed by the chosen vertical sections. Additional sections computed further north or south display a simpler dipole structure in PVRcond (not shown), markedly different from that just described. As a final remark on Fig. 10a–b, it is important to note that, whilst being closely surrounded by nearby large positive and negative values, the SJ trajectories lie in a localised region of small negative PVRcond. This further highlights the importance of the exact location in which the trajectories travel in their PV evolution, further motivating the presence of large variability in PVRcond across trajectories and the large discrepancy between the actual change in PV and the sum of the time-accumulated tendencies.
Vertical sections of the tendencies due to evaporation of cloud water, PVRevc and Qevc show complex patterns similar to those of PVRcond and Qcond and are not included in the article. Figure 10c–d display vertical cross-sections of the tendencies of PV and θ due to melting of ice and snow. The related PVRmelt map, shown in Fig. 9c, is characterised by a clear dipole at the warm front and a positive patch at the bent-back front, with the SJ trajectories just to the outside. These sections display a simple positive-above-negative PVRmelt dipole pattern where cooling due to melting occurs away from frontal zones and moist isentropes (i.e., θe contours) are near-horizontal. In these regions, the height of the cooling core and thus also of the dipole is set by the freezing level. The pattern becomes more complex and three-dimensional closer to the bent-back front, where moist isentropes tighten and become slanted or even, locally, vertical. This is the region in which SJ trajectories travel during their ascent, also characterised by a dip in the inward-ascending freezing level. Figure 10e–f show vertical cross-sections of the tendencies of PV and θ due to the sublimation of snow. As already illustrated by the related map (Fig. 9d), non-negligible values of PVRsubs are present only in local regions, including near the bent-back front, where SJ trajectories are located. Sublimational cooling exceeding −1 K h−1 occurs on the trajectories, consistent with the presence of large snow water content along the trajectories at this time (Fig. 3d) and the local dip in freezing level. It is worth noting that the local cooling experienced by the SJ trajectories has also the effect of reducing their buoyancy against the surrounding environment, thus favouring the start of their descent over a continuation of their ascent. Due to tight and slanted-to-vertical moist isentropes and a curved frontal environment, the PVRsubs structure is closer to a horizontal dipole (both in the along- and across-front directions) rather than a vertical one. The trajectories lie near the core of the negative side of this dipole. While for all the other processes examined, PV modification along the trajectories was close to zero, sublimation of snow provides a clear, albeit limited, contribution to PV decrease along SJ trajectories, as they ascend in this narrow zone located just to the outside of the bent-back front and near the freezing level.
3.5 Time evolution of diabatic processes around SJ trajectories
In Sect. 3.4 we use maps and vertical cross-sections to fully characterise the three-dimensional structures of the moist processes identified in Sect. 3.3 as playing a role in the PV decrease along ascending SJ trajectories. However, this characterisation is performed at a single time, 11:00 UTC ( h), near the end of the SJ ascent. To analyse the evolution in time of these processes we complement this analysis by looking at time-pressure profiles, or “Lidar plots”. These mean profiles are constructed by averaging the troposphere above and below the locations of all the trajectories at each time, hence mimicking what would be the output of an imaginary lidar or radar scanner moving with the trajectories. The large variability across trajectories and the especially complex structure of the tendencies associated with condensation and evaporation can lead to substantial inaccuracies and possibly misleading results in time-pressure profiles. This is particularly true when using the mean location of the trajectories and instantaneous hourly data, as in this study. Therefore, in this section we focus on time profiles of the tendencies associated with melting and sublimation of snow, displayed in Fig. 11.
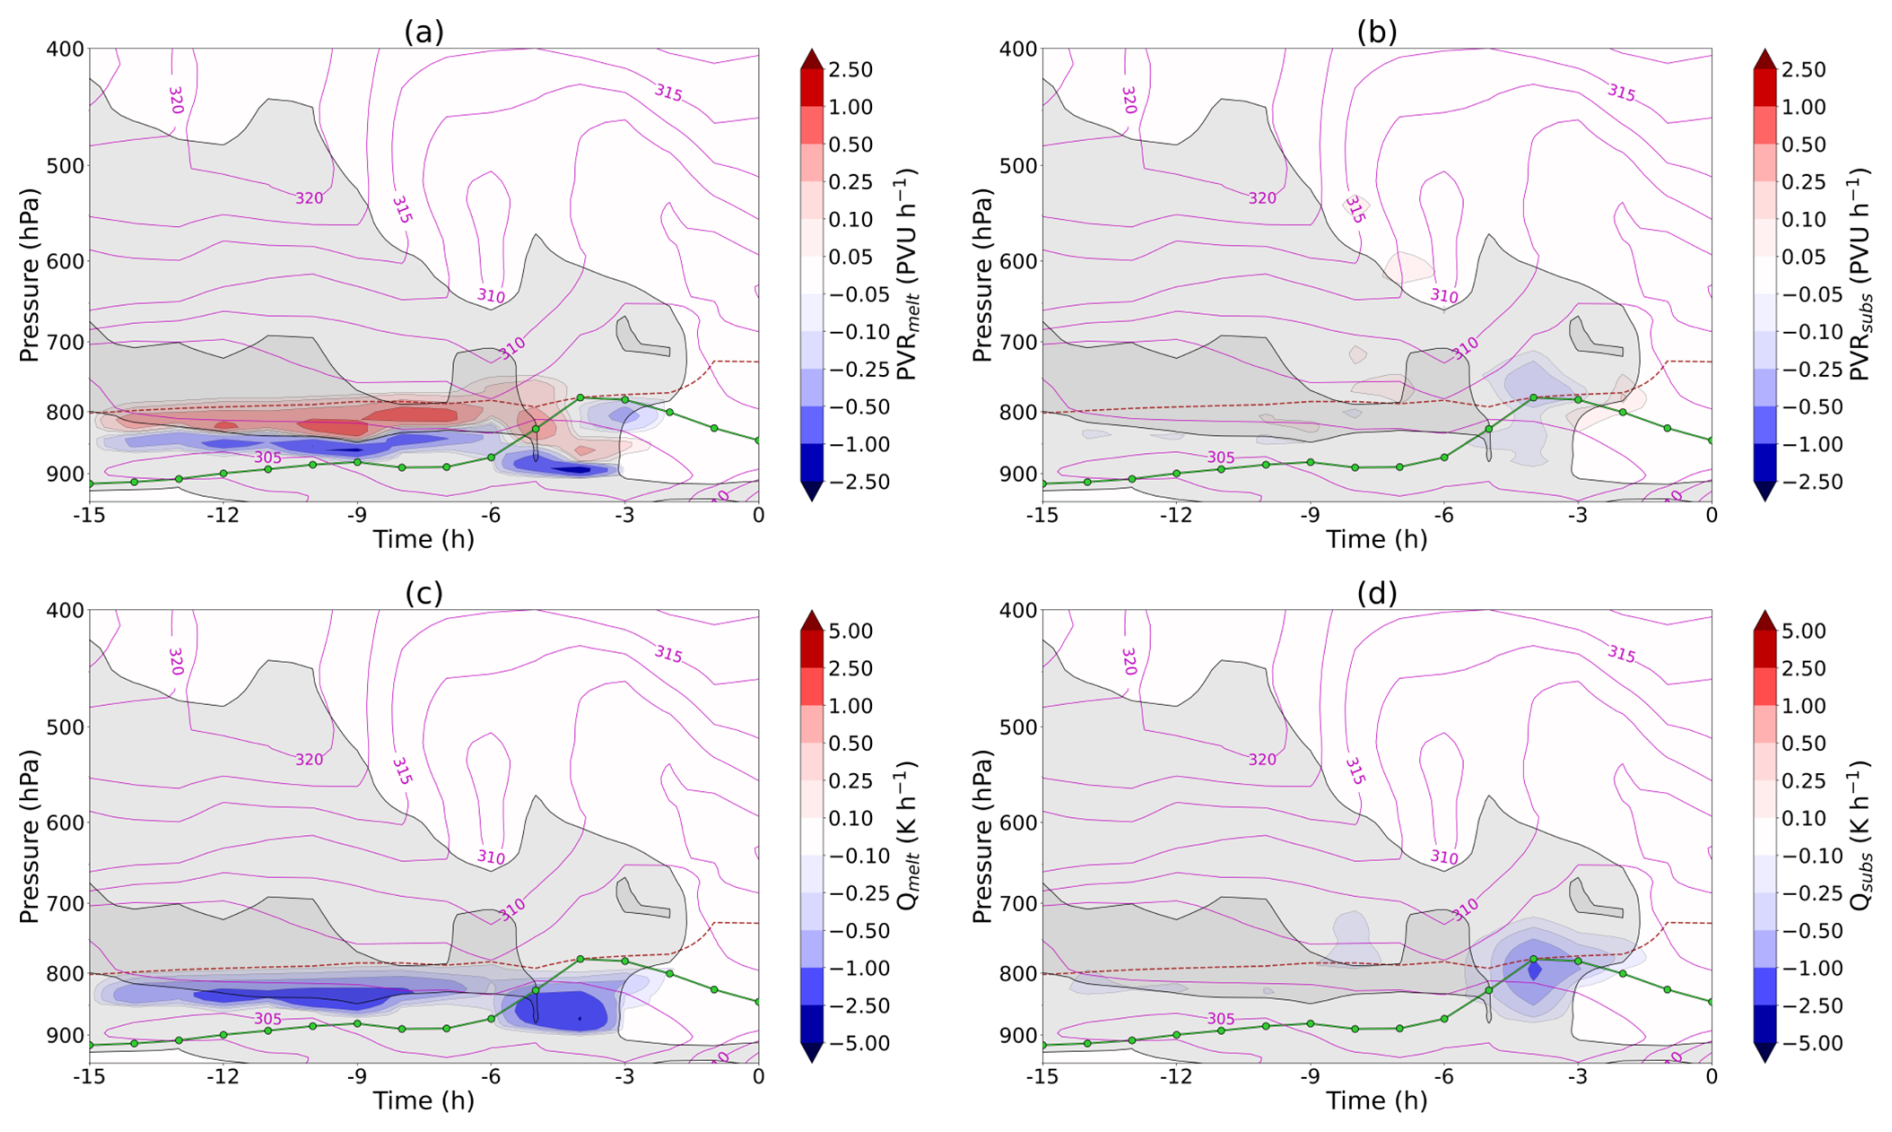
Figure 11Time-pressure mean profiles (“Lidar plots”, see text) of PV tendencies due to (a) melting of ice and snow and (b) sublimation of snow and of θ tendencies due to (c) melting of ice and snow and (d) sublimation of snow. The horizontal location and pressure level of the profiles are computed at each time by averaging over all the SJ trajectories. Grey shading indicates RH with respect to water (light when > 80 % and darker when > 98 %), while magenta contours indicate θe and the dashed brown contour shows the freezing level.
Time-pressure profiles of PV and θ tendencies due to melting of ice and snow (Fig. 11a and c) show that until the start of their ascent the SJ trajectories travel, with no appreciable PV tendency, underneath a region of cooling and the associated positive-above-negative dipole in PV tendency. This dipole is located just below the freezing level, with the core of the cooling being at the bottom of a region particularly close to saturation. As they start ascending, the trajectories cross an area with reduced cooling and then find themselves above the cooling core as its magnitude increases again. This, together with the transition to the more complex PVRmelt structure described when looking at Fig. 10d, results in generally little net PV modification, but with considerable variability across trajectories (Fig. 7c), caused by the several regions of positive and negative PVRmelt encountered during the ascent. Time-pressure profiles of PV and θ tendencies due to sublimation of snow (Fig. 11b and d) confirm that sublimational cooling appears only in the second part of the ascent when substantial snowfall occurs near the tip of the bent-back front and SJ trajectories reach the freezing level (Fig. 3d). SJ trajectories travel close to the core of the cooling, with values down to near −1 K h−1 at the end of the ascent. The PV decrease is limited but non-negligible, with the mean trajectory exceeding −0.1 PVU h−1 at the same time, consistent with the pattern shown in Figs. 7f, 9d and 10d.
3.6 Additional sets of PV < 0 trajectories
The PV maps presented in Fig. 4 highlight the presence of PV < 0 filaments in the cloud head, just outside the bent-back front, for an extended period of time. This continued presence of PV < 0 filaments points at the potential for additional SJ activity, before and after the formation of the main SJ airstream analysed in this study. Late SJ activity would also be consistent with the results in Gray and Volonté (2024), highlighting the presence of a later SJ pulse after the main one, with peak 850 hPa wind speed reached at 13:00 and 17:00 UTC, in Met Office operational forecasts. To verify whether these early and late PV < 0 filaments are associated with additional SJ airstreams, we calculate four additional trajectory sets and assess their properties. These four sets of trajectories are named after their release time and pressure level, listed below.
-
09UTC ( h) 875 hPa (Fig. 4b, blue dots, 34 trajectories)
-
10UTC ( h) 825 hPa (Fig. 4c, orange dots, 46 trajectories)
-
11UTC ( h) 775 hPa (Fig. 4d, dark green dots, 29 trajectories)
-
14UTC ( h) 825 hPa (Fig. 4f, red dots, 16 trajectories)
Trajectory release points are selected by considering PV < 0 filaments, ahead or behind the filament associated with the main SJ analysed, and by identifying grid points with PV < −0.25 PVU, representative of the core of those filaments. In addition to being computed back to the start of the simulation at 00:00 UTC, trajectories are also calculated forward in time for 6 h, to illustrate the evolution of the PV < 0 filaments here investigated and the possible SJ formation and descent.
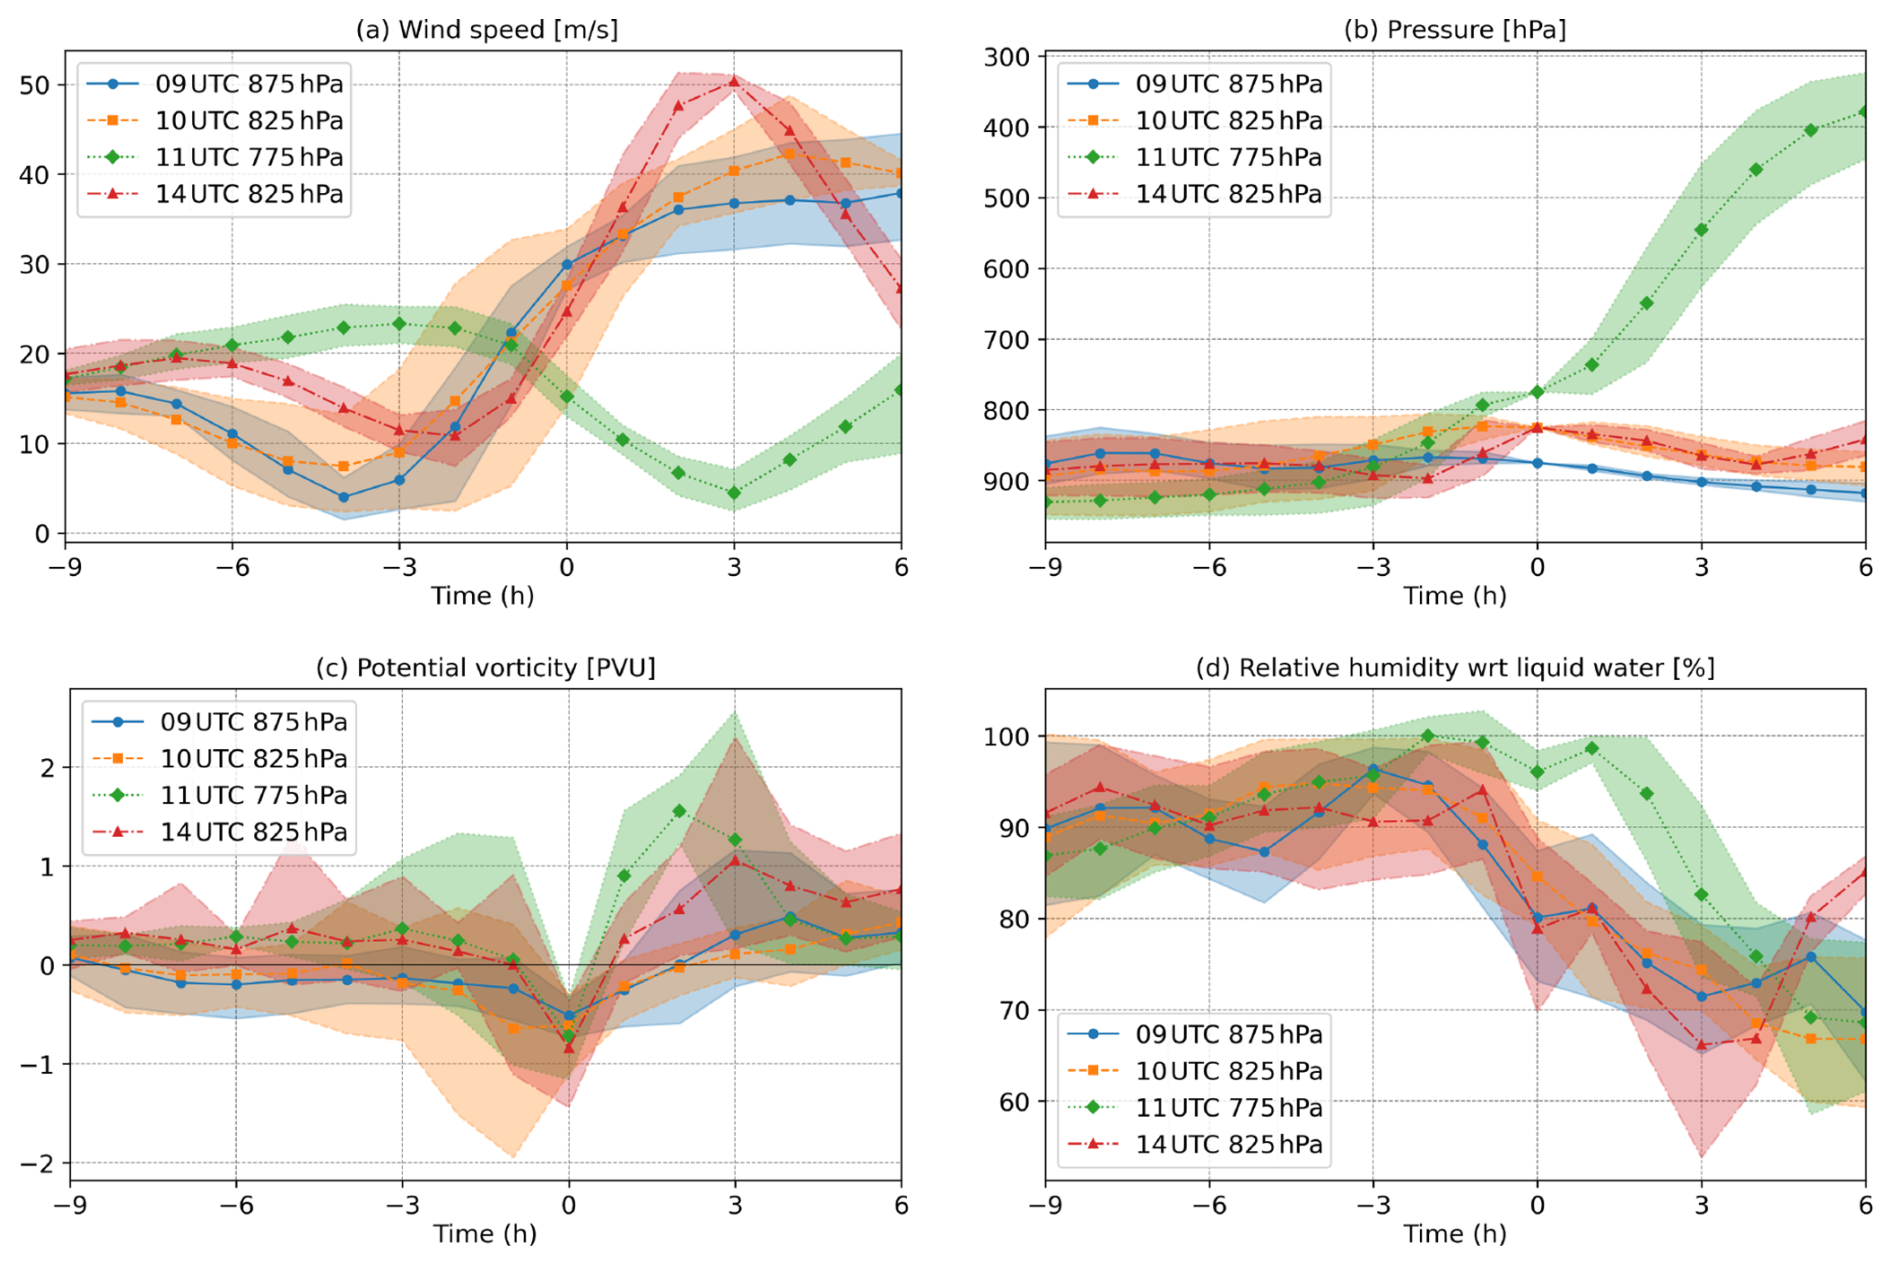
Figure 12Time evolution of (a) wind speed (m s−1), (b) pressure (hPa), (c) potential vorticity (PVU), and (d) relative humidity with respect to water (%) along the additional trajectory sets (see details in the text and release points in Fig. 4). Coloured solid lines indicate the mean of each field and for each trajectory set. Shading covers the values between the 10th and 90th percentiles. Percentiles are calculated independently at each time, hence a single percentile line can refer to different trajectories at different times.
Figure 12 contains timeseries of wind speed, pressure, PV and relative humidity for the four additional trajectory sets. Three of these sets, released at 09:00, 10:00 and 14:00 UTC, display a substantial increase in wind speed after release time, associated with weak descent, an increase in PV back to positive values and a gradual decrease in relative humidity. The maps in Fig. A2 show that this evolution occurs while the trajectories, having “turned the corner” off the cloud head, become roughly aligned with the direction of propagation of the storm and move eastward, towards an incipient (for the early sets) or mature (for the late set) frontal-fracture region. All these features are commonly observed in SJs, including in the main SJ analysed in this study, despite acceleration in the two early sets and the descent in all sets being less intense than what is normally shown by well-developed SJs. This means that the two early trajectory sets display airstreams that behave as weak SJ-like airstreams, while the late set contains an airstream that is more comparable to the main SJ in terms of intensity, with its trajectories reaching 50 m s−1, despite only showing a very limited descent after a clearer ascent from the boundary layer. This points at the occurrence of a well-developed SJ (which would be consistent with Gray and Volonté, 2024), that, due to the later stage of evolution of the cyclone, is not able to fully descend towards the surface as the main SJ.
The trajectory set released at 11:00 UTC instead shows a completely different behaviour, with trajectories progressing northward while rapidly ascending from the boundary layer to the upper troposphere. These features are consistent with the behaviour of WCBs (Madonna et al., 2014), although it is surprising to see them in trajectories released from a PV < 0 filament just north of the main PV signature of the warm front, rather than fully within the warm sector. A deeper investigation of the characteristics and evolution of these trajectories would be necessary to fully identify their origin and potential belonging to a WCB airstream. Such an investigation would go beyond the scope of this article and we therefore leave it to future studies.
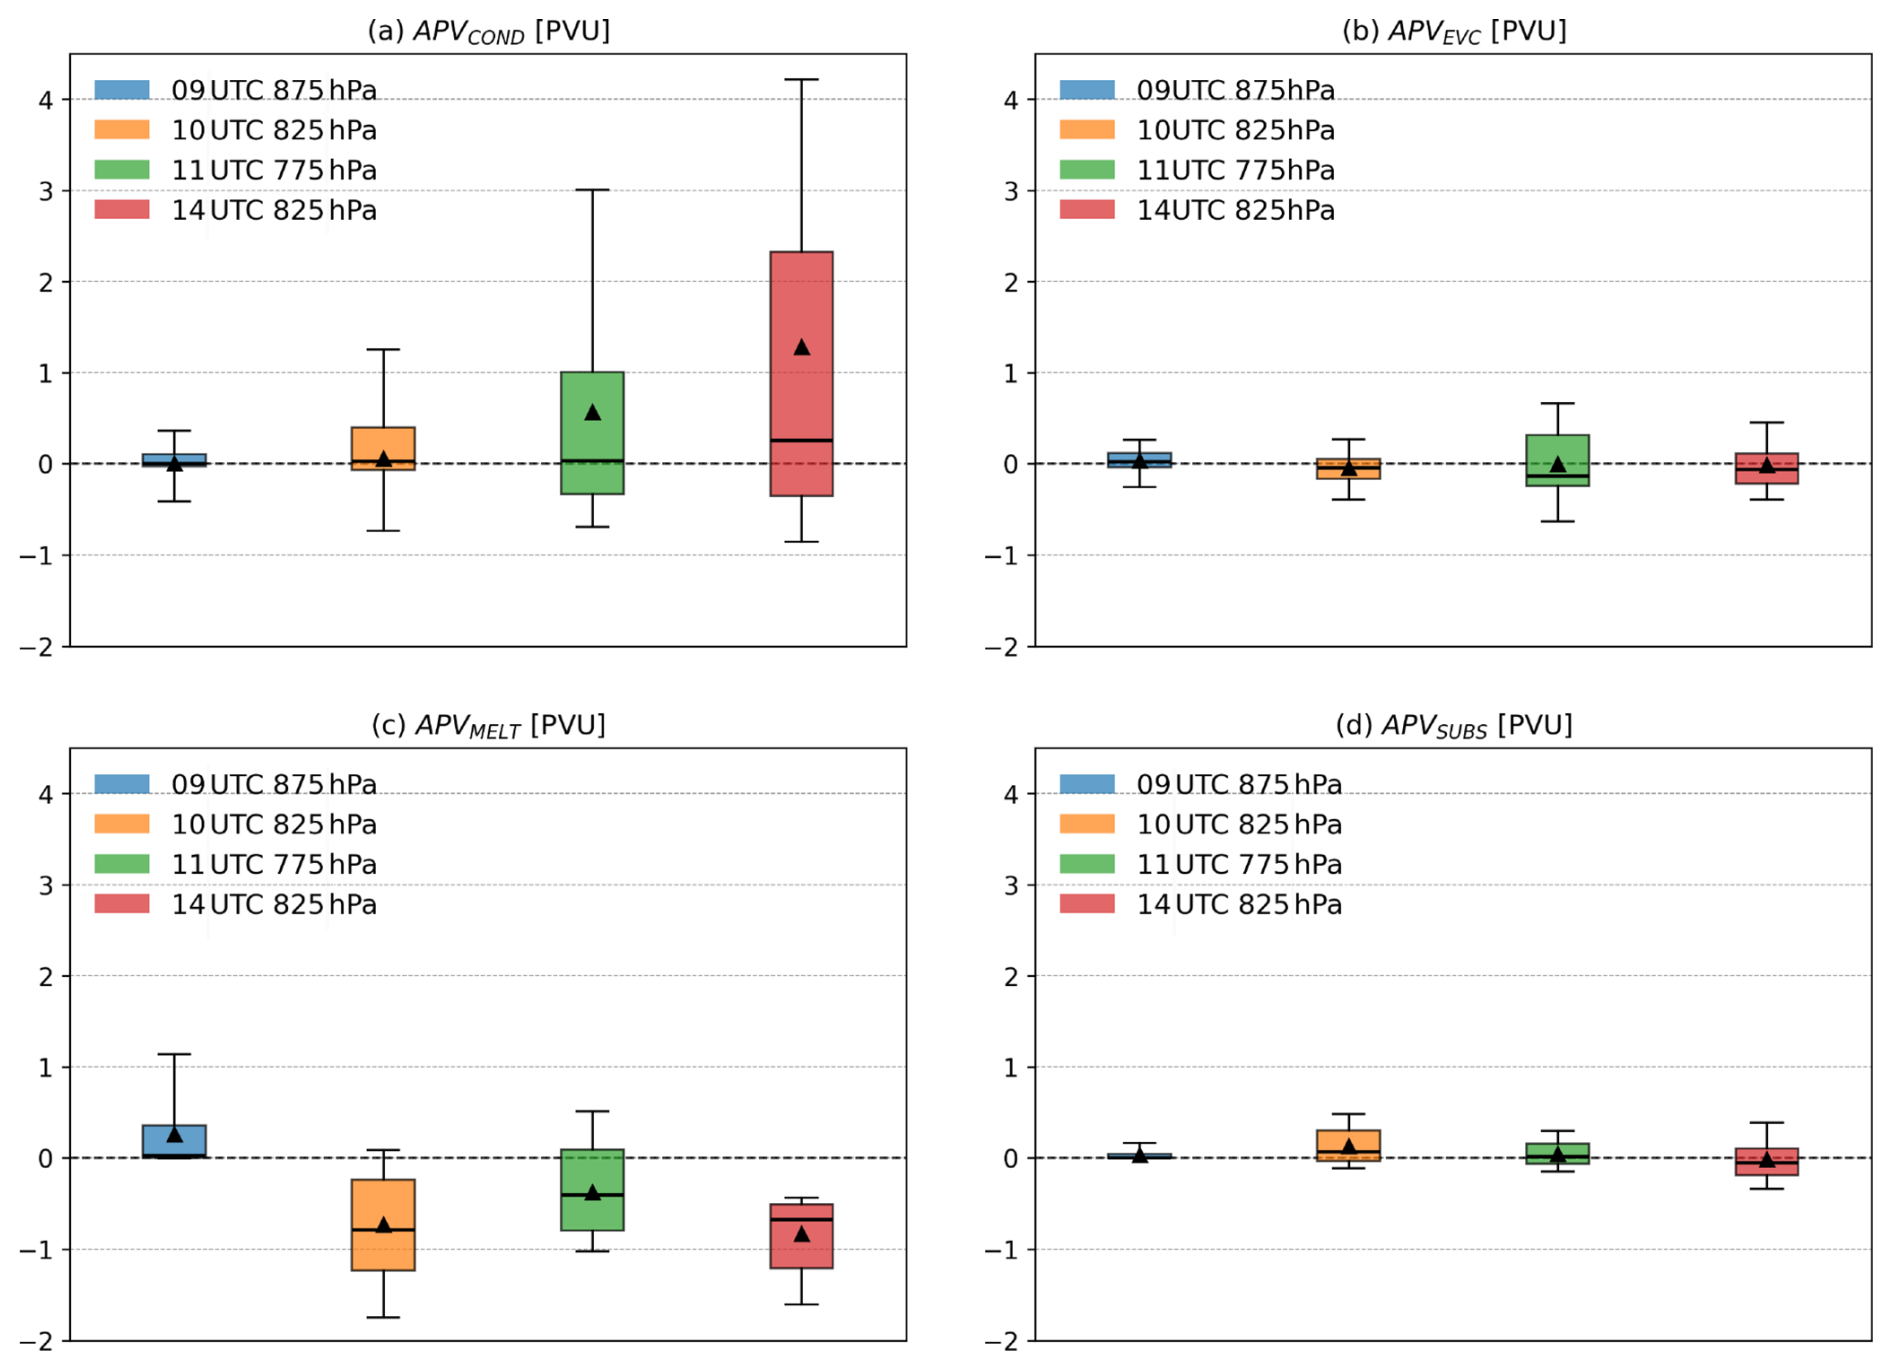
Figure 13Box-and-whisker plot of the accumulation of individual PV tendencies from (a) condensation of water vapour, (b) evaporation of cloud water, (c) melting of snow and ice and (d) sublimation of snow along the additional trajectory sets. The accumulations are calculated over the 3 h before the time of minimum PV, i.e., the time in the legend (apart from set “10UTC 825 hPa”, for which is 09:00 UTC, see related profile in Fig. 12c). Each box covers the interquartile range of the trajectory distribution, while whiskers extend to the 5th and 95th percentiles. Lines and triangles indicate median and mean values, respectively.
The box-and-whiskers plots in Fig. 13 show the accumulated change in PV, in the 3 h leading up to minimum PV, displayed by the tendencies associated with the four cloud processes playing a role in the evolution of PV of the main SJ: condensation of water vapour (APVcond), evaporation of cloud water (APVevc), melting of ice and snow (APVmelt) and sublimation of snow (APVsubs). Focusing on the three SJ-like airstreams (sets released at 09:00, 10:00 and 14:00 UTC), we see large variability across trajectories in APVcond in the 14:00 UTC set and a more limited range in the 10:00 UTC and, particularly, 09:00 UTC sets. This confirms the clear role of condensation in causing large variations in PV near the warm and bent-back fronts, increasing in magnitude as the cyclone intensifies. The role of melting is also highlighted, with a negative APVmelt signal in the 10:00 UTC and, particularly clearly given the limited variability, 14:00 UTC sets. These results, and the fact that they are clearer for the late and more intense trajectory set, are consistent with those described for the main SJ. This is not the case when looking at APVsubs, as the limited but robust decrease in PV experienced by the main SJ is not shown by any of the three SJ-like airstreams. Overall, these results highlight that conditions leading to the formation of PV < 0 filaments in the cloud head and subsequent SJ-like airstream generation are present for a sustained period of time during the explosive intensification of the cyclone, with condensation and melting actively changing PV. However, the most favourable conditions, leading to a fully-developed SJ able to accelerate up to 50 m s−1 and beyond while descending towards the boundary layer, are only present for a limited time. As a result, the additional airstreams identified do not reach the intensity of the main SJ, with only the latest airstream displaying comparable wind speed. The role of snow sublimation, localised in time and space, is only limited to the main SJ, which thus benefits from additional PV decrease and cooling while accelerating into the frontal-fracture region at the optimal time.
Sting jets (SJs) are airstreams that can form in intense extratropical cyclones and lead to exceptionally strong and damaging winds as they accelerate and descend towards the surface. There is now extensive evidence from case studies and idealised model simulations that SJ descent is often characterised by the release of (conditional or even dry) symmetric instability (SI), whose presence is indicated by negative potential vorticity (PV). The onset of this instability is driven by tight frontal circulations in the cloud head, near the bent-back warm front (Volonté et al., 2018; Clark and Gray, 2018), suggesting the likely involvement of moist processes. However, the distinct roles of individual diabatic processes have not been identified yet.
The aim of this study was therefore to identify the diabatic processes driving the onset of SI along SJs and thus enhancing the descent and acceleration of these transient mesoscale wind jets found in intense Shapiro-Keyser extratropical cyclones. To do so, we performed a model simulation of Storm Ciarán, a highly diabatic windstorm that hit the UK and western Europe on 1–2 November causing multiple fatalities and severe damage, using the ECMWF's numerical weather prediction model, the IFS. We ran the IFS using near-operational settings and adding tendencies from the individual parametrised processes to the output. In this way, having identified a SJ in this simulation and having computed Lagrangian trajectories following its path, we were able to evaluate the separate effects of individual diabatic processes on the evolution of PV and thus the onset of SI along the SJ. A primary result of this analysis is the positive answer to the question on whether diabatic tendencies can be used to identify the moist processes driving the onset of SI in SJs, although with substantial caveats. We expand on this finding and provide a point-by-point list of the key results of the study in the following.
-
The first clear result of this analysis is that our near-operational IFS simulation of Storm Ciarán contains a SJ that is characterised by: (a) damaging winds near the surface after its descent and (b) the development of SI (indicated by negative PV) earlier during its evolution.
-
This SJ is consistent, in terms of spatial structure and time evolution, not only with those displayed by the Met Office operational forecasts illustrated in Gray and Volonté (2024), but also with satellite imagery there presented. This consistency provides the necessary confidence in treating the evolution of the SJ identified in our simulation as fully plausible and realistic.
-
Storm Ciarán develops multiple outward-slanted PV dipoles in its cloud head, in addition to the primary dipole associated with the bent-back warm front. The SJ becomes part of a negative-PV filament in this narrow frontal zone as it ascends while flowing towards the tip of the cloud head. The evolution of PV along the SJ, including the formation of the filament described, is consistent with what shown in previous case studies (e.g., Storm Eunice; Volonté et al., 2023b) and idealised simulations (Volonté et al., 2020), providing further evidence that the formation of intense SJs is associated with the onset of SI (or at least one of its moist counterparts, see Sect. 1 and Clark and Gray, 2018 for more details).
-
-
Diabatic tendencies can be used to identify and characterise the moist processes that play a role in PV decrease and consequent onset of SI along a SJs, but caution needs to be exercised when using them, fully acknowledging their limitations. In this study, the sum of all the time-accumulated tendencies captures only part of the PV decrease experienced by the SJ during its ascent. This substantial discrepancy can be ascribed to two main factors, highlighting the special characteristics and complex environment in which SJs evolve.
-
When processes are fast-changing and non-linear, instantaneous values available at frequencies that would be considered high for most synoptic-scale and cyclone-feature analyses, such as the hourly output used in this study, can still greatly differ from averages and sums computed with data available at every model timestep.
-
In a small-scale and fully three-dimensional environment characterised by steep gradients, such as the narrow region just on the cold side of the bent-back front where the SJ ascends, small spatial inaccuracies in the calculation of trajectories can result in large errors on the values of the variables traced along them.
-
-
With this methodology we are able to identify four moist processes playing a non-negligible role in the PV decrease experienced by the SJ as it ascends: condensation of water vapour, evaporation of cloud water, melting of ice and snow and sublimation of snow. The first three show large variability across trajectories and, particularly for the condensation, positive and negative extremes in PV modification in the environment surrounding the trajectories. The limited PV decrease caused by the sublimation of snow is instead consistent across trajectories.
-
These results, despite the limitations of a single case study, are consistent with recent literature (Attinger et al., 2019, 2021) pointing at the primary role of condensation in generating positive PV anomalies along the warm front and on the increasing importance of melting and sublimation at the bent-back end of the warm front, where the SJ ascends.
-
The complex and fully three-dimensional patterns of PV tendencies caused by condensation, evaporation and melting are inherently linked with the dynamics of the bent-back front, including its outward slanted and tightly curved nature. The SJ travels in a special region in which net PV modifications from these processes, and condensation in particular, are on average limited despite the presence of large extremes nearby.
-
Changes in PV caused by sublimation of snow in the environment around the SJ are mostly confined to the local region near the bent-back warm front and the tip of the cloud head, associated with substantial snowfall. The consequent limited PV decrease along the ascending SJ is consistent across trajectories.
-
Changes in PV are a consequence of the heating and cooling patterns associated with moist processes. A direct effect of the cooling caused by melting and sublimation of snow is the reduction in buoyancy of the SJ, which favours the start of its descent, rather than the continuation of its ascent.
-
-
Analysis of trajectories released from additional PV < 0 filaments present in the cloud head, ahead or behind the one associated with the main SJ, show that conditions allowing the generation of SJ-like airstreams are present for a sustained period of time and are characterised by an active role of condensation and melting. However, only the most favourable conditions lead to the formation of a fully-developed SJ, which benefits also from PV decrease and cooling associated with snow sublimation.
In summary, in this study we use a near-operational model simulation of Storm Ciarán to illustrate the moist processes contributing to the onset of SI along a SJ and thus driving its subsequent intensification and generation of damaging winds.
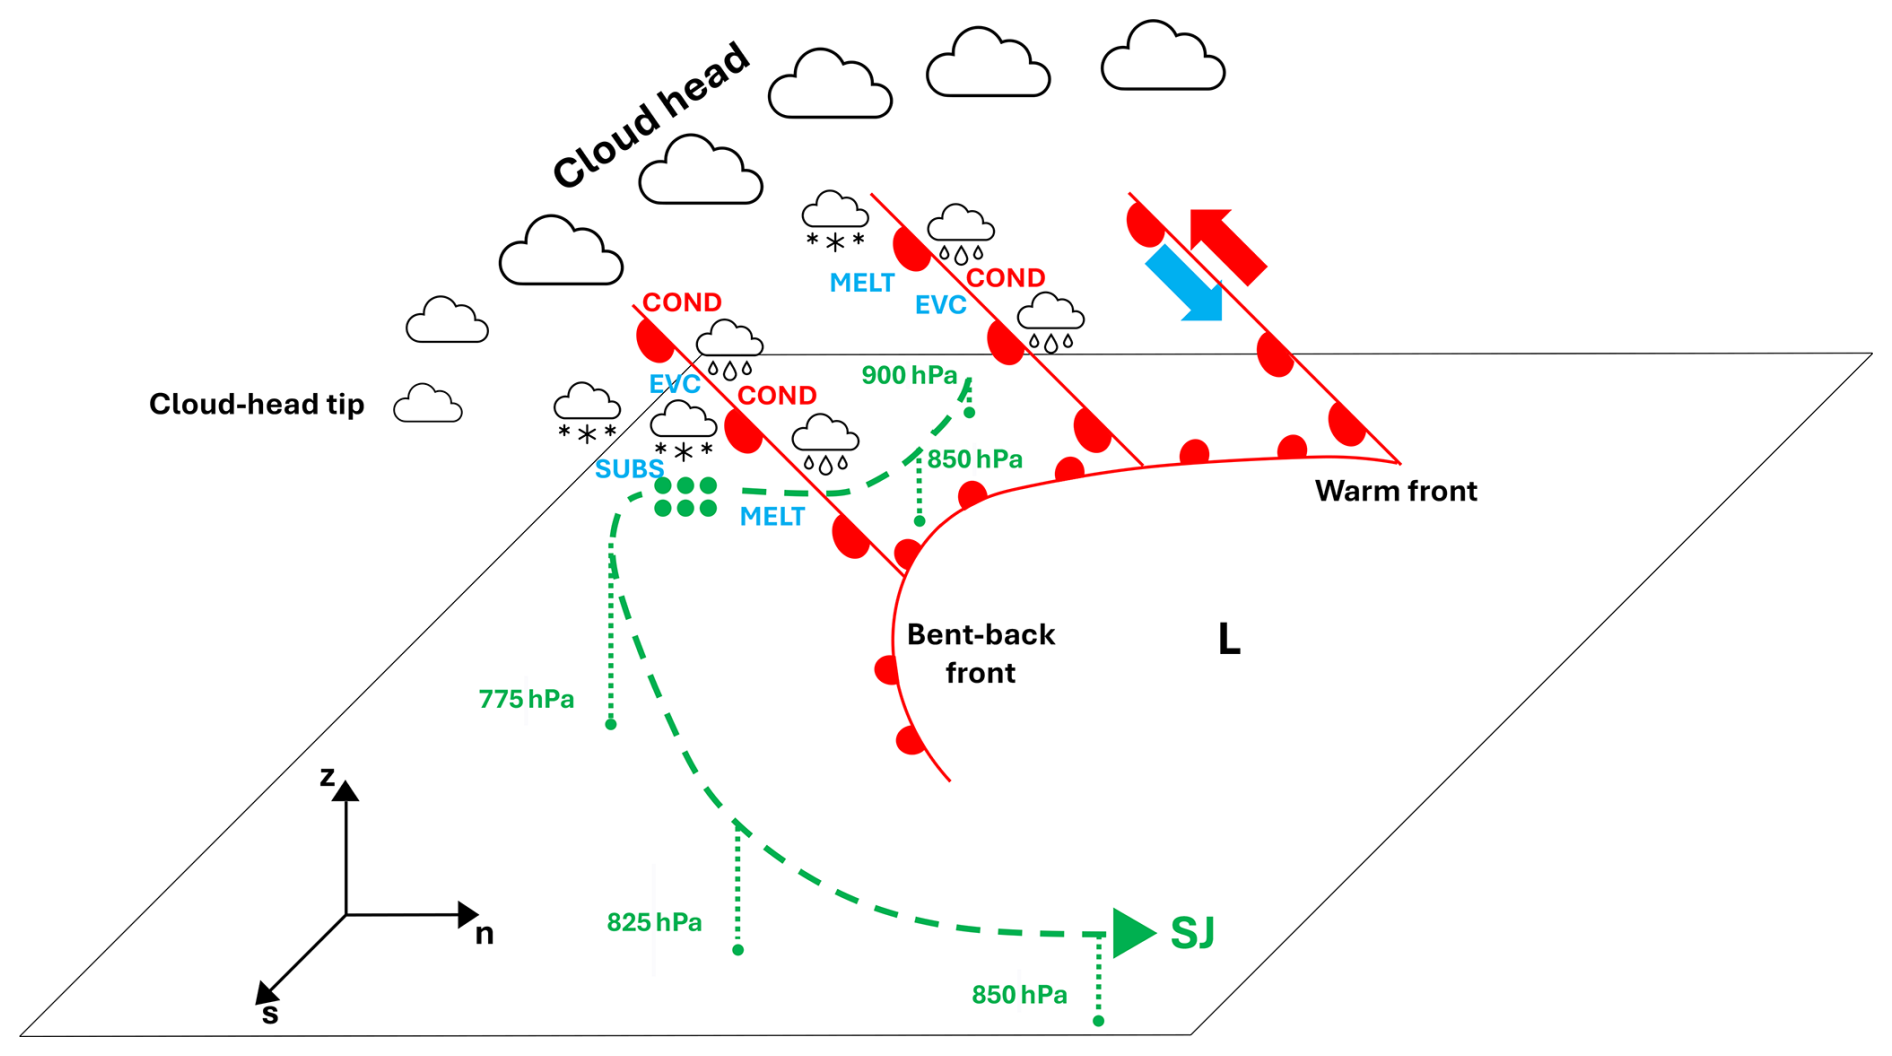
Figure 14Schematic representation of the path of SJ trajectories during their ascent in the cloud head and subsequent descent (green dashed lines, with pressure indication and projection on the ground shown by green dotted lines). Green dots indicate the location of SJ trajectories near the end of their ascent. s and n coordinates are oriented along and across the direction of travel of the trajectories at the end of their ascent, with z indicating the vertical direction. Warm and bent-back warm fronts are indicated at the surface and up towards the upper-troposphere. The extent of the cloud head is indicated, together with the type of precipitation taking place, by cloud icons. Red and blue arrows indicate heating and cooling, respectively, on each side of the front. Condensation of water vapour (COND), evaporation of cloud water (EVC), melting of snow and ice (MELT) and sublimation of snow (SUBS) are indicated (in red or blue depending on whether they are associated to heating or cooling) near the locations where they are taking place.
We show that, despite substantial limitations in their accuracy, diabatic tendencies can be used for this purpose. Figure 14 provides a schematic representation of a key result of this analysis, i.e., the complex interplay of condensation, evaporation, melting and sublimation, all acting around the SJ as it ascends in a curved and narrow region in the cloud head, just outside the bent-back front. The fully three-dimensional structure of frontal circulations leads to complex PV tendency patterns and, excluding sublimation, the large variability across SJ trajectories. A limited but robust signal of PV decrease on the SJ is ascribed to sublimation, with the associated cooling also favouring the end of SJ ascent.
This study can also be regarded as a proof-of-concept analysis, leading naturally to further work on the role of diabatic processes, including but not limited to moist processes, in the evolution of SJs. In terms of analysis setup, the assessment of the accuracy improvements associated with having relevant variables provided or calculated at all timesteps, e.g. by using online trajectories as in Oertel et al. (2023), has the highest priority. Apart from addressing the accuracy issue, key open questions mainly concern the generalisation of the results from this study. In particular, this analysis could be extended to include:
-
Events where the SJ does not show a clear ascent before starting its descent and acceleration into the frontal-fracture region, such as the SJ identified in Storm Tini (Volonté et al., 2018). In this study, the presence of an already-extended negative-PV filament near the bent-back front, of which the SJ becomes part as it completes its ascent, suggests that this behaviour could be identified even in Storm Ciarán by broadening our trajectory set. SJs that do not show an ascent from low levels before their final descent could likely spend more time in regions where the moist processes associated with bent-back front circulation cause substantial PV modification.
-
Cyclones covering a range of (bent-back) frontal strengths, freezing level heights and rates of snowfall and rainfall. Doing so would allow us to explore the dependence of the PV modification caused by the individual moist processes examined here to different environmental conditions.
-
Additional focus on the role of momentum tendencies, subject to substantial improvement in small-scale tendency accuracy. This analysis would not only cover the period of SJ ascent, but also its subsequent descent, in which moist processes play a secondary role compared to momentum-based diabatic processes.
A final implication, particularly relevant to the current warming of the North Atlantic Ocean (Kuhlbrodt et al., 2024) and thus of the environment in which these storms develop, concerns the freezing level. In this study we show the clear role of melting and particularly sublimation of snow over buoyancy and instability of the SJ. These processes are inherently tied to the height of the freezing level, which could thus exert some control on the height at which the ascent of the SJ ends and its descent starts. This hypothesis is worth being investigated, particularly as if it is verified, then it could be also inferred that warmer storms are likely to contain SJs with more extended descent and thus, possibly, larger acceleration and higher impact.
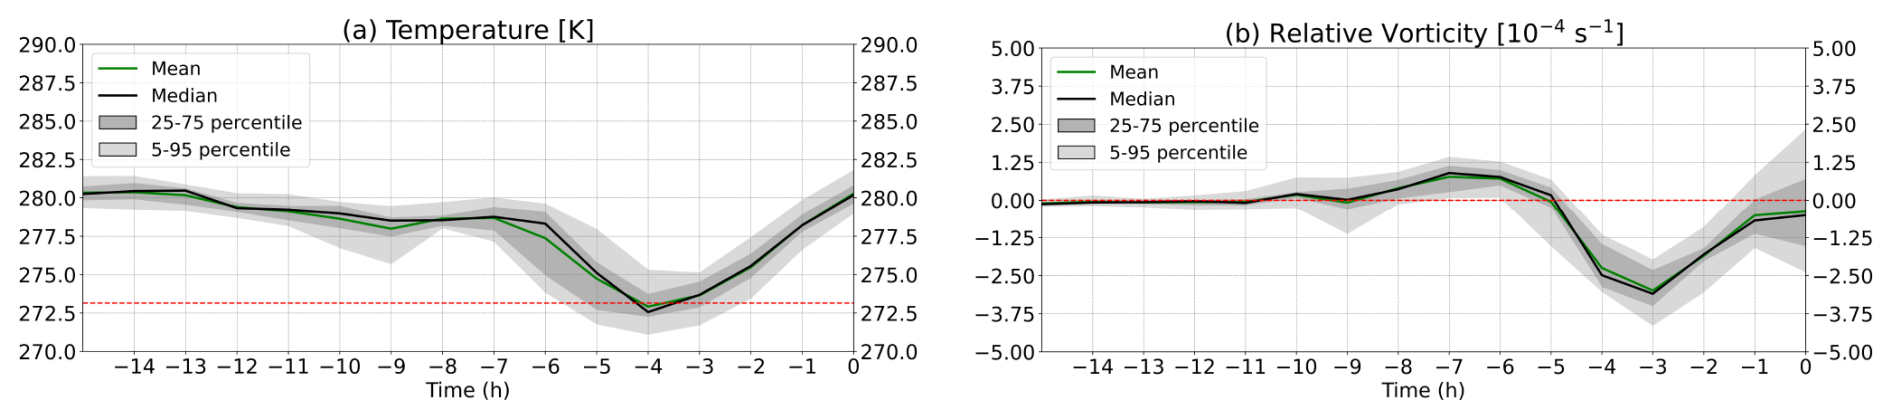
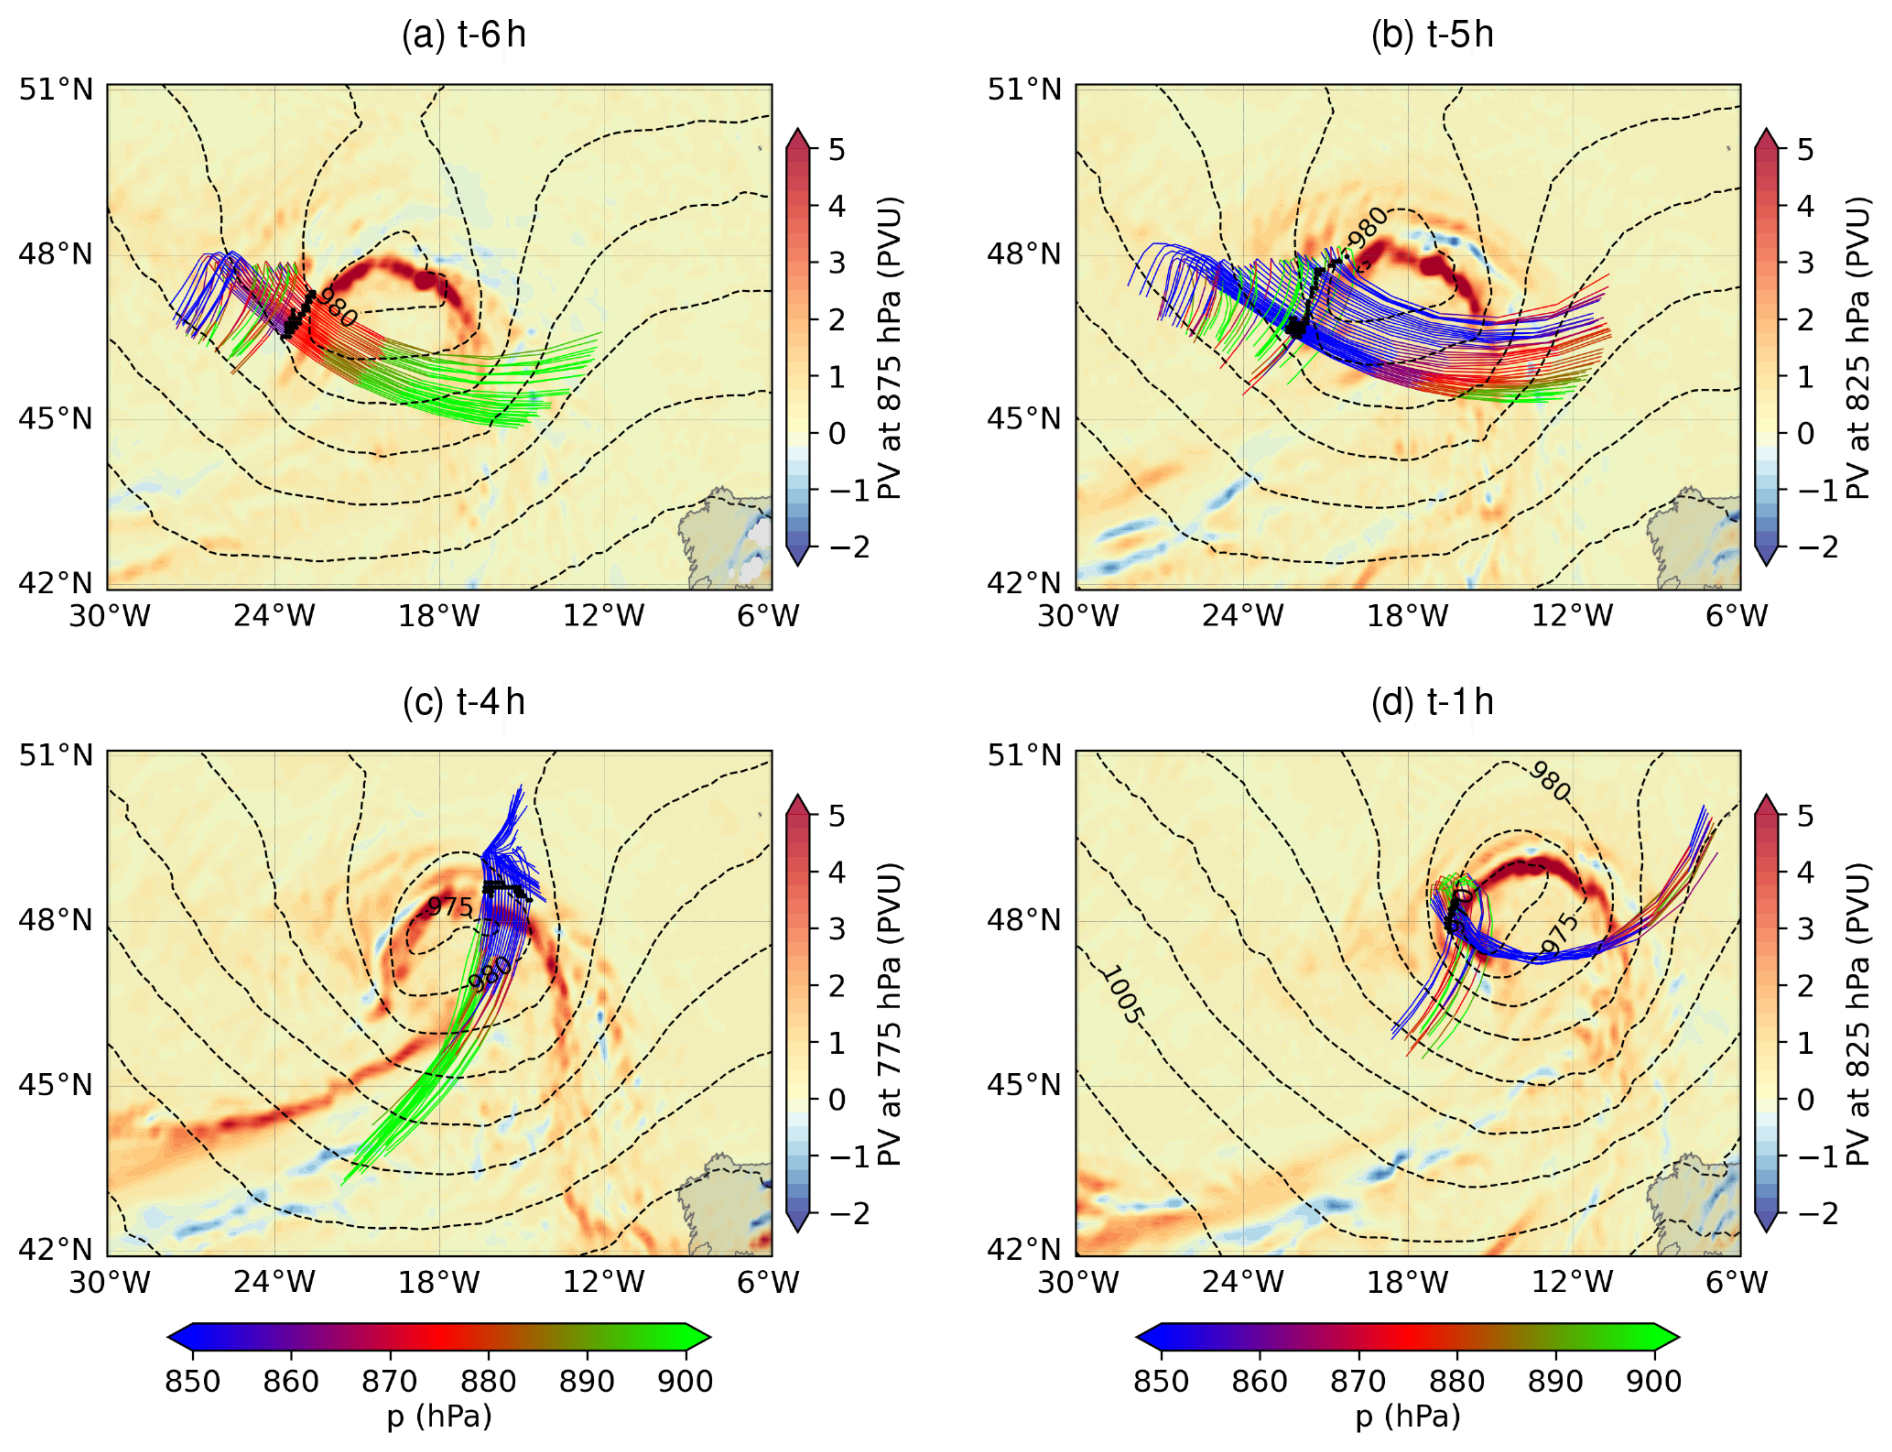
Figure A2PV (shading) and mean sea level pressure (dashed black contours) at the times indicated, as in Fig. 4, with additional trajectory sets overlaid. Each panel contains the trajectories released at the respective time (“09UTC 875 hPa” in (a), “10UTC 825 hPa” in (b), “11UTC 775 hPa” in (c), and “14UTC 825 hPa” in (d)), and each trajectory shown extends 9 h backward and 6 h forward from the release time. The release points are indicated by black dots and the trajectories are coloured according to their pressure.
The IFS simulation was produced using ECMWF computing facilities. Output data could be shared upon reasonable request. Lagrangian trajectories are calculated using LAGRANTO, referenced in the article and available at https://iacweb.ethz.ch/staff/sprenger/lagranto/ (last access: 9 July 2026). The code used to generate figures in this article can be made available upon request.
AV suggested the original idea to HJ. AV and HJ conceptualised the study and acquired funding for it. MHFL performed the model simulation, including diagnostics developed by HJ and implemented by RF. AV led the analysis of the data, to which HJ and MHFL contributed substantially, later joined by RBK. AV led the paper writing, with particular sections written by HJ and MHFL. All authors provided regular feedback throughout the writing process.
At least one of the (co-)authors is a member of the editorial board of Weather and Climate Dynamics. The peer-review process was guided by an independent editor, and the authors also have no other competing interests to declare.
Publisher's note: Copernicus Publications remains neutral with regard to jurisdictional claims made in the text, published maps, institutional affiliations, or any other geographical representation in this paper. The authors bear the ultimate responsibility for providing appropriate place names. Views expressed in the text are those of the authors and do not necessarily reflect the views of the publisher.
Many thanks to handling co-editor Peter Knippertz and to two anonymous reviewers for the time spent on this submission. Peter Knippertz's careful and patient guidance and the thorough and fair comments by the reviewers allowed the final article to be a considerable improvement from the original manuscript. The authors would like to thank Roman Attinger and Elisa Spreitzer for their extensive discussions with AV and for the preliminary work that led to the idea of this study. The authors would also like to thank members of the Mesoscale Meteorology group at University of Reading and of the Atmospheric Dynamics group at ETH Zurich for their interest and valuable feedback on this study. This work is part of the ECMWF special project “Diabatic processes and their impact on extratropical dynamics and the hydrological cycle”. We acknowledge MeteoSwiss and ECMWF for access to the ECMWF computing and archive facilities.
The work performed by AV was initially funded by the 2023 NCAS Visiting Scientist scheme and by the 2024 pump-priming fund of the Department of Meteorology at University of Reading. The work by MHFL was supported by an ETH Zurich Research Grant (ETH-06 21-1).
This paper was edited by Peter Knippertz and reviewed by two anonymous referees.
Attinger, R., Spreitzer, E., Boettcher, M., Forbes, R., Wernli, H., and Joos, H.: Quantifying the role of individual diabatic processes for the formation of PV anomalies in a North Pacific cyclone, Q. J. Roy. Meteor. Soc., 145, 2454–2476, https://doi.org/10.1002/qj.3573, 2019. a, b, c, d, e, f, g, h
Attinger, R., Spreitzer, E., Boettcher, M., Wernli, H., and Joos, H.: Systematic assessment of the diabatic processes that modify low-level potential vorticity in extratropical cyclones, Weather Clim. Dynam., 2, 1073–1091, https://doi.org/10.5194/wcd-2-1073-2021, 2021. a, b, c, d, e, f, g, h
Baker, L. H., Gray, S. L., and Clark, P. A.: Idealised simulations of sting-jet cyclones, Q. J. Roy. Meteor. Soc., 140, 96–110, https://doi.org/10.1002/QJ.2131, 2014. a
Bechtold, P., Forbes, R., Sandu, I., Lang, S., and Ahlgrimm, M.: A major moist physics upgrade for the IFS, ECMWF Newsletter, https://doi.org/10.21957/3gt59vx1pb, 2020. a
Browning, K. A.: Radar Measurements of Air Motion Near Fronts, Weather, 26, 320–340, https://doi.org/10.1002/j.1477-8696.1971.tb04211.x, 1971. a
Browning, K. A.: The sting at the end of the tail: Damaging winds associated with extratropical cyclones, Q. J. Roy. Meteor. Soc., 130, 375–399, https://doi.org/10.1256/qj.02.143, 2004. a
Browning, K. A. and Field, M.: Evidence from Meteosat imagery of the interaction of sting jets with the boundary layer, Met. Apps., 11, 277–289, https://doi.org/10.1017/S1350482704001379, 2004. a, b
Browning, K. A. and Roberts, N. M.: Structure of a frontal cyclone, Q. J. Roy. Meteor. Soc., 120, 1535–1557, https://doi.org/10.1002/qj.49712052006, 1994. a
Chagnon, J. M. and Gray, S. L.: A Diabatically Generated Potential Vorticity Structure near the Extratropical Tropopause in Three Simulated Extratropical Cyclones, Mon. Weather Rev., 143, 2337–2347, https://doi.org/10.1175/MWR-D-14-00092.1, 2015. a
Chagnon, J. M., Gray, S. L., and Methven, J.: Diabatic processes modifying potential vorticity in a North Atlantic cyclone, Q. J. Roy. Meteor. Soc., 139, 1270–1282, https://doi.org/10.1002/qj.2037, 2013. a, b
Charlton-Perez, A. J., Dacre, H. F., Driscoll, S., Gray, S. L., Harvey, B., Harvey, N. J., Hunt, K. M. R., Lee, R. W., Swaminathan, R., Vandaele, R., and Volonté, A.: Do AI models produce better weather forecasts than physics-based models? A quantitative evaluation case study of Storm Ciarán, npj Clim. Atmos. Sci., 7, 1–11, https://doi.org/10.1038/s41612-024-00638-w, 2024. a
Clark, P. A. and Gray, S. L.: Sting jets in extratropical cyclones: a review, Q. J. Roy. Meteor. Soc., 144, 943–969, https://doi.org/10.1002/QJ.3267, 2018. a, b, c, d, e, f, g
Clark, P. A., Browning, K. A., and Wang, C.: The sting at the end of the tail: Model diagnostics of fine-scale three-dimensional structure of the cloud head, Q. J. Roy. Meteor. Soc., 131, 2263–2292, https://doi.org/10.1256/qj.04.36, 2005. a, b, c
Clough, S. A. and Franks, R. A. A.: The evaporation of frontal and other stratiform precipitation, Q. J. Roy. Meteor. Soc., 117, 1057–1080, https://doi.org/10.1002/qj.49711750109, 1991. a
Coronel, B., Ricard, D., Rivière, G., and Arbogast, P.: Cold-conveyor-belt jet, sting jet and slantwise circulations in idealized simulations of extratropical cyclones, Q. J. Roy. Meteor. Soc., 142, 1781–1796, https://doi.org/10.1002/qj.2775, 2016. a, b
Eisenstein, L., Schulz, B., Qadir, G. A., Pinto, J. G., and Knippertz, P.: Identification of high-wind features within extratropical cyclones using a probabilistic random forest – Part 1: Method and case studies, Weather Clim. Dynam., 3, 1157–1182, https://doi.org/10.5194/wcd-3-1157-2022, 2022. a
Flaounas, E., Gray, S. L., and Teubler, F.: A process-based anatomy of Mediterranean cyclones: from baroclinic lows to tropical-like systems, Weather Clim. Dynam., 2, 255–279, https://doi.org/10.5194/wcd-2-255-2021, 2021. a
Forbes, R. M. and Clark, P. A.: Sensitivity of extratropical cyclone mesoscale structure to the parametrization of ice microphysical processes, Q. J. Roy. Meteor. Soc., 129, 1123–1148, https://doi.org/10.1256/qj.01.171, 2003. a
Gray, S. L. and Volonté, A.: Extreme low-level wind jets in Storm Ciarán, Weather, 79, 384–389, https://doi.org/10.1002/wea.7620, 2024. a, b, c, d, e, f, g, h, i
Gray, S. L., Martínez-Alvarado, O., Baker, L. H., and Clark, P. A.: Conditional symmetric instability in sting-jet storms, Q. J. Roy. Meteor. Soc., 137, 1482–1500, https://doi.org/10.1002/qj.859, 2011. a
Joos, H. and Forbes, R. M.: Impact of different IFS microphysics on a warm conveyor belt and the downstream flow evolution, Q. J. Roy. Meteor. Soc., 142, 2727–2739, https://doi.org/10.1002/qj.2863, 2016. a
Joos, H. and Wernli, H.: Influence of microphysical processes on the potential vorticity development in a warm conveyor belt: a case-study with the limited-area model COSMO, Q. J. Roy. Meteor. Soc., 138, 407–418, https://doi.org/10.1002/qj.934, 2012. a
Kendon, M.: Storm Éowyn, 24 January 2025, Analysis by Met Office Climate Information Centre, https://www.metoffice.gov.uk/binaries/content/assets/metofficegovuk/pdf/weather/learn-about/uk-past-events/interesting/2025/2025_02_storm_eowyn.pdf (last access: 29 April 2025), 2025. a
Kuhlbrodt, T., Swaminathan, R., Ceppi, P., and Wilder, T.: A Glimpse into the Future: The 2023 Ocean Temperature and Sea Ice Extremes in the Context of Longer-Term Climate Change, B. Am. Meteorol. Soc., 105, E474–E485, https://doi.org/10.1175/BAMS-D-23-0209.1, 2024. a
Lean, H. W. and Clark, P. A.: The effects of changing resolution on mesocale modelling of line convection and slantwise circulations in FASTEX IOP16, Q. J. Roy. Meteor. Soc., 129, 2255–2278, https://doi.org/10.1256/qj.02.57, 2003. a
Madonna, E., Wernli, H., Joos, H., and Martius, O.: Warm Conveyor Belts in the ERA-Interim Dataset (1979–2010). Part I: Climatology and Potential Vorticity Evolution, J. Climate, 27, 3–26, https://doi.org/10.1175/JCLI-D-12-00720.1, 2014. a
Martínez-Alvarado, O., Baker, L. H., Gray, S. L., Methven, J., and Plant, R. S.: Distinguishing the Cold Conveyor Belt and Sting Jet Airstreams in an Intense Extratropical Cyclone, Mon. Weather Rev., 142, 2571–2595, https://doi.org/10.1175/MWR-D-13-00348.1, 2014. a
Oertel, A., Miltenberger, A. K., Grams, C. M., and Hoose, C.: Interaction of microphysics and dynamics in a warm conveyor belt simulated with the ICOsahedral Nonhydrostatic (ICON) model , Atmos. Chem. Phys., 23, 8553–8581, https://doi.org/10.5194/acp-23-8553-2023, 2023. a, b, c, d, e
Roberts, N. M. and Forbes, R. M.: An observational study of multiple cloud head structure in the FASTEX IOP 16 cyclone, Atmos. Sci. Lett., 3, 59–70, https://doi.org/10.1006/asle.2002.0048, 2002. a
Sanders, F. and Gyakum, J. R.: Synoptic-Dynamic Climatology of the “Bomb”, Mon. Weather Rev., 108, 1589–1606, https://doi.org/10.1175/1520-0493(1980)108<1589:SDCOT>2.0.CO;2, 1980. a
Schultz, D. M.: Reexamining the Cold Conveyor Belt, Mon. Weather Rev., 129, 2205–2225, https://doi.org/10.1175/1520-0493(2001)129<2205:RTCCB>2.0.CO;2, 2001. a
Schultz, D. M. and Schumacher, P. N.: The Use and Misuse of Conditional Symmetric Instability, Mon. Weather Rev., 127, 2709–2732, https://doi.org/10.1175/1520-0493(1999)127<2709:TUAMOC>2.0.CO;2, 1999. a
Schultz, D. M., Sienkiewicz, J. M., Schultz, D. M., and Sienkiewicz, J. M.: Using Frontogenesis to Identify Sting Jets in Extratropical Cyclones, Weather Forecast., 28, 603–613, https://doi.org/10.1175/WAF-D-12-00126.1, 2013. a
Shapiro, M. A. and Keyser, D.: Fronts, Jet Streams and the Tropopause, in: Extratropical Cyclones, edited by: Newton, C. W. and Holopainen, E. O., American Meteorological Society, Boston, MA, 167–191, https://doi.org/10.1007/978-1-944970-33-8_10, 1990. a
Spreitzer, E., Attinger, R., Boettcher, M., Forbes, R., Wernli, H., and Joos, H.: Modification of Potential Vorticity near the Tropopause by Nonconservative Processes in the ECMWF Model, J. Atmos. Sci., 76, 1709–1726, https://doi.org/10.1175/JAS-D-18-0295.1, 2019. a, b, c
Sprenger, M. and Wernli, H.: The LAGRANTO Lagrangian analysis tool – version 2.0, Geosci. Model Dev., 8, 2569–2586, https://doi.org/10.5194/gmd-8-2569-2015, 2015. a
Stoelinga, M. T.: A Potential Vorticity-Based Study of the Role of Diabatic Heating and Friction in a Numerically Simulated Baroclinic Cyclone, Mon. Weather Rev., 124, 849–874, https://doi.org/10.1175/1520-0493(1996)124<0849:APVBSO>2.0.CO;2, 1996. a
Suri, D., Keates, S., and Sidaway, M.: Storm Éowyn, 24 January 2025, Weather, https://doi.org/10.1002/wea.7725, 2025. a
Volonté, A. and Riboldi, J.: The origins of Storm Ciarán: From diabatic Rossby wave to warm-seclusion cyclone with a sting jet, Weather, 79, 390–396, https://doi.org/10.1002/wea.7632, 2024. a
Volonté, A., Clark, P. A., and Gray, S. L.: The role of mesoscale instabilities in the sting-jet dynamics of windstorm Tini, Q. J. Roy. Meteor. Soc., 144, 877–899, https://doi.org/10.1002/QJ.3264, 2018. a, b, c, d, e, f
Volonté, A., Clark, P. A., and Gray, S. L.: Idealised simulations of cyclones with robust symmetrically unstable sting jets, Weather Clim. Dynam., 1, 63–91, https://doi.org/10.5194/wcd-1-63-2020, 2020. a, b, c, d
Volonté, A., Gray, S. L., Clark, P. A., Martínez-Alvarado, O., and Ackerley, D.: Strong surface winds in Storm Eunice. Part 1: storm overview and indications of sting jet activity from observations and model data, Weather, 79, 40–45, https://doi.org/10.1002/WEA.4402, 2023a. a, b
Volonté, A., Gray, S. L., Clark, P. A., Martínez-Alvarado, O., and Ackerley, D.: Strong surface winds in Storm Eunice. Part 2: airstream analysis, Weather, 79, 54–59, https://doi.org/10.1002/WEA.4401, 2023b. a, b, c, d
Wernli, H. and Gray, S. L.: The importance of diabatic processes for the dynamics of synoptic-scale extratropical weather systems – a review, Weather Clim. Dynam., 5, 1299–1408, https://doi.org/10.5194/wcd-5-1299-2024, 2024. a
Wimmer, M., Rivière, G., Arbogast, P., Piriou, J.-M., Delanoë, J., Labadie, C., Cazenave, Q., and Pelon, J.: Diabatic processes modulating the vertical structure of the jet stream above the cold front of an extratropical cyclone: sensitivity to deep convection schemes, Weather Clim. Dynam., 3, 863–882, https://doi.org/10.5194/wcd-3-863-2022, 2022. a