
the Creative Commons Attribution 4.0 License.
the Creative Commons Attribution 4.0 License.
 | 05 Aug 2026
Austral summer MJO forecast skill in S2S models: decadal shifts and their drivers
Julie M. Arblaster
Matthew C. Wheeler
Eun-Pa Lim
Jadwiga H. Richter
The Madden–Julian Oscillation (MJO) is a key driver of global subseasonal-to-seasonal (S2S) climate variability, initiating teleconnections that affect weather patterns worldwide. Improving understanding of the factors that modulate MJO predictability is therefore critical for advancing S2S forecasting systems. Using a multi-model framework, we evaluate changes in MJO prediction skill between two periods (1981–1998 and 1999–2018) during austral summer (December–February) and examine the processes underpinning these differences. Our analysis reveals a pronounced decadal variation in MJO forecast skill, with high-skill years in 1981–1998 showing prediction lead times of around 10 d longer (based on the bivariate correlation of the Real-Time Multivariate MJO (RMM) index) than in 1999–2018, while low-skill years show little change. This asymmetric reduction coincides with stronger MJO amplitude in the earlier period, despite relatively stable model mean-state biases in tropical sea surface temperatures (SSTs) and lower-tropospheric moisture. Key findings include: (1) persistent moisture biases across both periods, yet higher skill in 1981–1998, suggesting that model systematic errors alone cannot explain the differences; (2) a stronger relationship between Quasi-Biennial Oscillation (QBO) and MJO forecast skill in the first period, independent of stratospheric resolution in the models; and (3) weakened coupling between the MJO and large-scale climate modes, including the QBO, El Niño–Southern Oscillation (ENSO), and Indian Ocean Dipole (IOD), in 1999–2018, indicating reduced dynamical support for prediction. These results suggest that decadal variations in MJO forecast skill are strongly influenced by changes in the background dynamical environment.
- Article
(4858 KB) - Full-text XML
-
Supplement
(1385 KB) - BibTeX
- EndNote


-
The MJO exhibits greater inherent predictability in 1981–1998 compared to 1999–2018, primarily due to stronger MJO amplitude (higher signal-to-noise ratio).
-
Climate forcings such as QBO, IOD, and ENSO play a primary role in modulating MJO skill in the models, overcoming model mean state biases.
-
Peak skill in MJO prediction is found when easterly QBO (EQBO) coincides with negative IOD or La Niña, a synergy that weakened after 1998.
The Madden-Julian Oscillation (MJO), first identified by Madden and Julian (1971, 1972), is the dominant mode of intraseasonal tropical climate variability. Through its planetary-scale coupling of convection and circulation, the MJO modulates global weather systems via teleconnections and directly influences monsoons, extreme weather events, and tropical to polar teleconnections (Tseng et al., 2018; Rondanelli et al., 2019; Lim et al., 2021a; Stan et al., 2022; Roy et al., 2025; Wille et al., 2024). These far-reaching impacts make MJO prediction vital for subseasonal-to-seasonal (S2S) forecasting (Zhang, 2013; Jiang et al., 2020). Despite its critical role in S2S predictability, accurately forecasting the MJO remains a persistent challenge for state-of-the-art dynamical models (Kim et al., 2019a). Since the landmark Intraseasonal Variability Hindcast Experiment (ISVHE) in 2014, coordinated multi-model efforts have systematically advanced MJO prediction capabilities through improved model physics, initialisation, and ensemble strategies (Neena et al., 2014; Vitart, 2017; Pegion et al., 2019). These advances have extended MJO prediction skill to approximately 25–30 d in leading systems (Kim et al., 2019a).
Despite modelling improvements, persistent deficiencies in simulating MJO propagation across the Maritime Continent (MC) continue to limit prediction skill, particularly for MC-terminating events compared to those propagating beyond (Abhik et al., 2023). This persistent “MC barrier effect” (Zhang and Ling, 2017) arises primarily from model deficiencies in representing the region's complex orography, diurnal precipitation cycles, and lower-tropospheric moisture preconditioning (e.g., Peatman et al., 2014; Gonzalez and Jiang, 2017; Ling et al., 2019; Savarin and Chen, 2023). These issues are compounded by systematic mean-state biases across the tropical Indo-Pacific, including an overly dry lower troposphere and erroneous circulation patterns over the MC region (Kim et al., 2019a; Zavadoff et al., 2023). Furthermore, MJO prediction skill exhibits strong sensitivity to initial conditions, with forecast reliability depending on the event's initial amplitude and genesis location, particularly for Indian Ocean-initiated events (Rashid et al., 2011; Lim et al., 2018; Wu et al., 2023).
While these tropospheric factors dominate MJO predictability and representation in models (e.g., Kim et al., 2014; Lin et al., 2024), stratospheric influences also play a critical role. In particular, the Quasi-Biennial Oscillation (QBO) modulates MJO amplitude and propagation through stratosphere–troposphere interactions (Son et al., 2017; Nishimoto and Yoden, 2017). This modulation also extends MJO forecast skill, with S2S models consistently showing higher predictability during the easterly QBO (EQBO) phases, when equatorial stratospheric winds blow from east to west (Abhik and Hendon, 2019). The physical mechanisms underlying this modulation involve two key processes: (1) EQBO-induced cold anomalies in the upper troposphere-lower stratosphere (UTLS) that reduce static stability and promote deep convection, and (2) more effective cloud-radiative feedback that amplifies and sustains MJO circulation (Marshall et al., 2017; Hendon and Abhik, 2018; Sakaeda et al., 2020; Jin et al., 2023). Notably, the observed QBO–MJO relationship has intensified in recent decades, likely linked to stratospheric cooling and tropospheric warming trends (Klotzbach et al., 2019). Despite this well-documented connection, most global forecast models struggle to replicate the QBO—MJO relationship (e.g., Kim et al., 2019b; Martin et al., 2021). Kim et al. (2019b) demonstrated only a weak QBO–MJO relationship reproduced by most forecast systems during the 1999–2015 period.
While the QBO's role in MJO predictability is well established, the impacts of tropical sea surface temperature (SST) variability remain less understood and appear to be model-dependent. Zhou et al. (2024) recently identified enhanced MJO prediction skill during basin-wide warm Indian Ocean SST events in boreal winter, mediated through intensified convective instability. However, their analysis was restricted to model simulations from the post-1999 period. This finding suggests a potentially essential but underexplored connection between the Indian Ocean Basin Mode (IOBM) and MJO predictability, consistent with known thermodynamic controls on MJO propagation.
Similarly, Liu et al. (2017) demonstrated that Indian Ocean variability (particularly positive Indian Ocean Dipole phases) might govern the upper limit of MJO predictability in the forecast system. However, they cautioned about the potential model overestimation of this relationship. Notably, both analyses were restricted to shorter periods (about ∼20 years), leaving open questions about the robustness of these relationships across different climate states and longer timescales. The El Niño Southern Oscillation (ENSO)–MJO relationship exhibits complexity in particular, with studies reporting improved skill during both El Niño (via strengthened air-sea coupling; DeMott et al., 2018; Wu et al., 2023) and La Niña conditions (Kim et al., 2018; Mengist and Seo, 2022). This suggests that oceanic mode–MJO relationships are non-stationary, likely reflecting their sensitivity to evolving background climate states on decadal timescales (Zhao et al., 2016). MJO characteristics and predictability have also been shown to undergo decadal shifts associated with a phase change of the Interdecadal Pacific Oscillation (IPO) around 1999 (Wang and Wang, 2023; Skinner et al., 2023; Dong et al., 2025).
This study addresses these knowledge gaps through a multi-model framework examining decadal shifts in MJO predictability during boreal winter/austral summer – December–February (DJF) –, the season of peak MJO activity and strongest coupling with major climate modes (ENSO, QBO, IOD, IOBM). Using four S2S hindcast datasets, together with observational verification and statistical benchmarking, we:
-
disentangle intrinsic MJO predictability from model-specific biases;
-
quantify how the influence of large-scale climate modes on predictability varies between IPO phases of 1981–1998 and 1999–2018; and
-
diagnose the role of evolving background states in shaping the mechanisms and thresholds of MJO predictability.
For the rest of the paper, we will describe forecast model configurations, forecast and verification data, and analysis methods in Sect. 2 and present results with discussion in Sect. 3. Then, we will provide concluding remarks in Sect. 4.
2.1 Datasets
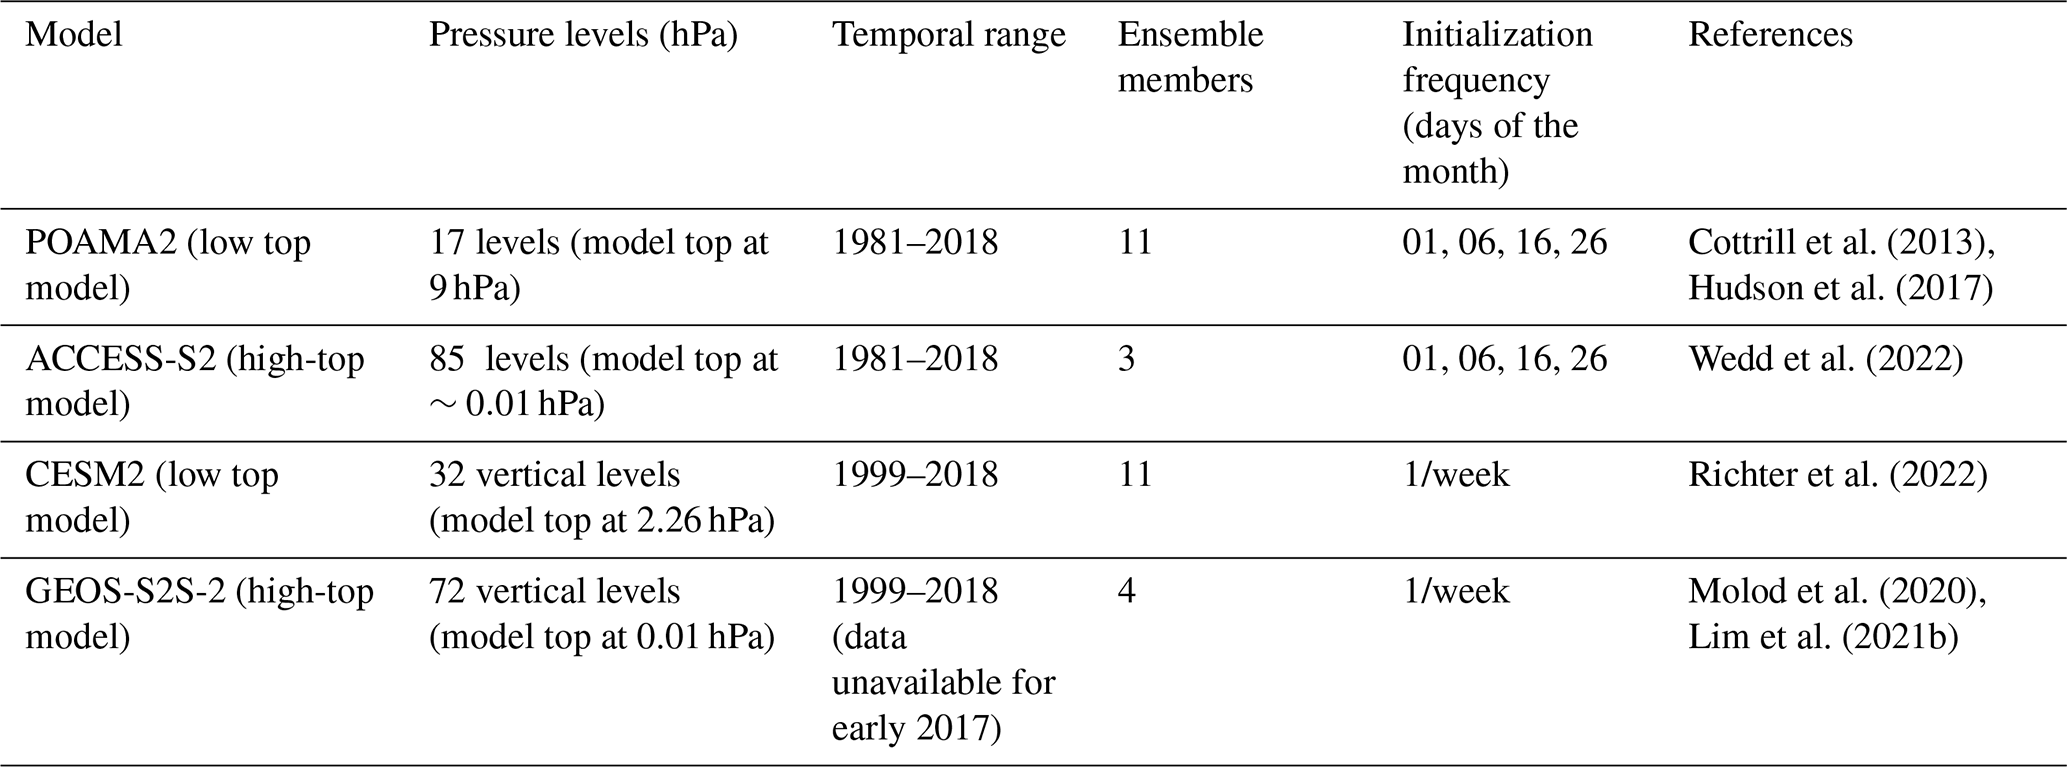
This study analyses four independent subseasonal-to-seasonal (S2S) hindcast datasets to evaluate MJO prediction skills across different modelling systems: the Predictive Ocean-Atmosphere Model for Australia version 2 (POAMA2, Cottrill et al. 2013), the Australian Community Climate and Earth-System Simulator–Seasonal (ACCESS-S2, Wedd et al., 2022), the Community Earth System Model Version 2 (CESM2, Richter et al., 2022), and the Global Earth Observing System S2S model Version 2 (GEOS-S2S-2, Molod et al., 2020). These models were selected based on the availability of sufficiently long hindcasts, ensemble sizes, and initialisation frequencies to permit robust skill assessment. In particular, POAMA2 and ACCESS-S2 provide extended archives (1981–2018), forming the core of our decadal comparison, while CESM2 and GEOS-S2S-2, available for the later period (1999–2018), are incorporated to broaden the analysis to more recent state-of-the-art systems and to test the robustness of the identified mechanisms across diverse model configurations. Although both POAMA2 and ACCESS-S2 are the Bureau of Meteorology's systems, they are independent of each other with different component models, data assimilation (DA) frameworks and initial condition generation strategies (Hudson et al., 2017; Wedd et al., 2022). As a result, differences in MJO forecast skill between the two systems reflect a combination of model formulation and initial-condition differences. Importantly, there were no changes to the DA configuration within each model between 1981–1998 and 1999–2018, ensuring internal consistency for interdecadal comparisons. POAMA2 has a relatively low model top (∼9–10 hPa), so it does not fully resolve the stratospheric column and associated QBO dynamics. However, owing to high-quality observed initial conditions, the observed QBO state is well represented at forecast start, and the vertical resolution in the upper troposphere–lower stratosphere, where QBO–MJO interactions are thought to operate, is considerably finer than in the upper stratosphere.
Key features of the hindcast set of each forecast system – including vertical resolutions, ensemble sizes, initialisation frequencies, and hindcast durations are summarised in Table 1. The study employs three primary observational datasets for verification: (1) NCEP/DOE Reanalysis II (NCEP2) for atmospheric variables (Kanamitsu et al., 2002), (2) NOAA AVHRR Outgoing Longwave Radiation (OLR) as a proxy for tropical convection (Liebmann and Smith, 1996), and (3) the NOAA OISST V2 SST dataset (Huang et al., 2021). These datasets span the 1981–2018 study period and were regridded to a consistent 2.5°×2.5° global grid to facilitate comparison with model outputs. All model hindcasts (POAMA2, ACCESS-S2, CESM2, GEOS-S2S-2) are regridded to match the observational 2.5°×2.5° grid.
Table 1Summary of the hindcast datasets analysed in this study.
Climate indices
MJO activity is quantified using the Real-Time Multivariate MJO (RMM) index (Wheeler and Hendon, 2004), which is derived from the combined anomalies of OLR and zonal winds at 200 and 850 hPa. Anomalies are computed relative to the climatology for each corresponding period (1981–1998 and 1999–2018). For climate mode classification, ENSO phases are identified using the Niño 3.4 index (Trenberth, 1997), with El Niño (La Niña) defined when the 5-month running mean of SST anomalies in the Niño 3.4 region (5° S–5° N, 170–120° W) exceeds +0.5σ (falls below −0.5σ). The running mean is applied continuously throughout the year, ensuring that phase classification captures the persistence of ENSO anomalies relevant to the DJF period under analysis. IOD events are tracked using the Dipole Mode Index (DMI) (Saji et al., 1999), which is calculated as the difference in SST anomalies between the tropical western (50–70° E, 10° S–10° N) and eastern (90–110° E, equator–10° S) Indian Ocean (i.e., the western pole minus the eastern pole). Events are classified as positive or negative IOD based on the DJF mean of the DMI. A positive IOD event is defined when the DJF-averaged DMI exceeds +0.5σ (relative to the DJF climatology), and a negative IOD when it falls below −0.5σ. The Indian Ocean Basin Mode (IOBM) index is computed as the area-weighted average of SST anomalies across the tropical Indian Ocean (20° S–20° N, 40–110° E), following Xie et al. (2009). Warm (cold) IOBM events are identified when the standardised index exceeds +0.5σ (falls below −0.5σ). QBO phases are determined using 50 hPa zonal wind anomalies averaged over 5° S–5° N (U50) from NCEP2, with easterly (westerly) phases defined as () (Son et al., 2017).
To evaluate MJO prediction skill, we compare dynamical model forecasts against both observations and predictions from the Vector Autoregression (VAR) model developed by Maharaj and Wheeler (2005). This statistical approach serves as a key benchmark for assessing the performance of dynamical models, as established in previous studies (Rashid et al., 2011). The VAR model predicts MJO evolution using initial values of the RMM indices (RMM1 and RMM2) along with their lagged temporal variations, effectively functioning as an advanced bivariate persistence forecast. The VAR model is calibrated separately for each period, using all available DJF seasons in 1981–1998 for Period 1 and 1999–2018 for Period 2. In this study, the VAR is used as a diagnostic tool to characterise the dominant linear lead–lag relationships between the MJO and large-scale climate modes within each decadal regime, rather than to generate independent year-by-year forecasts.
Further details of the VAR model's mathematical formulation and training procedures are provided in Marshall et al. (2016). This statistical benchmark enables systematic evaluation of whether dynamical models outperform a simple empirical statistical model. This study employs a period-stratified approach, analysing all observational data, dynamical model outputs (POAMA2, ACCESS-S2, CESM2, GEOS-S2S-2), and statistical benchmarks exclusively within two independent periods (1981–1998 and 1999–2018) to address potential non-stationarities in MJO behaviour. The VAR model is separately calibrated for each period through distinct regression coefficients (see text in the Supplement). By maintaining identical period divisions across all components (models, observations, and VAR), we control for background state variability and accurately quantify the evolution of skill across different periods.
2.2 Methods
Our analysis employs bivariate correlation (B. Corr) between observed and forecasted MJO RMM indices (Rashid et al., 2011) to quantify MJO prediction skill during austral summer (DJF), focusing specifically on the subseasonal window (15–25 d leads) where operational forecasting transitions from weather to climate timescales (see text in the Supplement). This subseasonal window is used to compute an interannually varying skill index. A 15–25 d window to calculate the skill index is selected for two key reasons:
-
Subseasonal focus: this window captures the critical transition period where deterministic weather forecasts lose skill, but MJO predictability remains viable, addressing the core S2S prediction challenge.
-
Signal clarity: in this range, interannual variations in MJO prediction skill are physically coherent and consistent across models, unlike at shorter leads (dominated by initial conditions) or longer leads (where noise overwhelms the signal). Broader windows (e.g., 10–30 d) were also tested, but these either biased the index toward initial-condition dependence or introduced substantial noise, reducing cross-model consistency.
To examine decadal changes in MJO predictability, we classified years into high- versus low-skill categories for each of ACCESS-S2, POAMA-2, CESM2, GEOS-S2S-2 and for 1981–1998 (ACCESS-S2 and POAMA2 only) and 1999–2018 using the 15–25 d bivariate correlation MJO skill index (see text in the Supplement for detailed methodology). We identified the top seven highest-scoring years as “Good MJO prediction years” (high-skill) and the bottom seven years as “Poor MJO prediction years” (low-skill) for each model-period combination. This comparison approach provides maximum diagnostic contrast between high- and low-skill regimes, allowing us to isolate the specific climate conditions (e.g., ENSO, QBO, IOD phases) and model characteristics that enhance or degrade MJO forecast skill. Selecting 7 years per category corresponds approximately to the top and bottom 40 % of cases in each period, providing a balance between statistical robustness and clear separation of skill levels.
To investigate drivers of MJO predictability, we correlate each model's MJO skill index with key climate indices: Niño 3.4 (ENSO), Zonal wind anomalies at 50 hPa (QBO), DMI (IOD), and the IOBM Index. The climate indices are derived from observed datasets. The MJO amplitude and phase are derived following Rashid et al. (2011), ensuring compatibility with established verification frameworks. We detect and track MJO events using a modified version of the Wei and Ren (2019) methodology. While their original approach focused solely on Indian Ocean-initiated events, our implementation extends coverage to all MJO phases (1–8). This adaptation provides three advantages: (1) it captures the full spectrum of observed MJO behaviour, including Pacific-originating events; (2) it eliminates geographical selection biases that could skew model verification; and (3) it increases the sample size of detectable events, enhancing statistical robustness. The steps for classifying MJO events are discussed in detail in the text in the Supplement. We also employ linear regression between the MJO skill indices and key variables (OLR and 850 hPa specific humidity anomalies) for both observations and model forecasts to examine the background state changes associated with high MJO skill years versus low MJO skill years. Observational data are restructured to match forecast conventions, with four monthly start dates, and MJO evolution time is calculated accordingly, ensuring consistent comparison with model outputs.
3.1 Observed MJO characteristics
Figure 1 highlights apparent epochal differences in the modulation of observed MJO amplitude by key climate modes. The table listing the years used in each composite is provided in the Supplement (Table S1). During the earlier period (1981–1998; Fig. 1, top row panels), MJO amplitude is significantly higher during negative Indian Ocean Dipole (N-IOD) compared to positive IOD, as indicated by stippling.
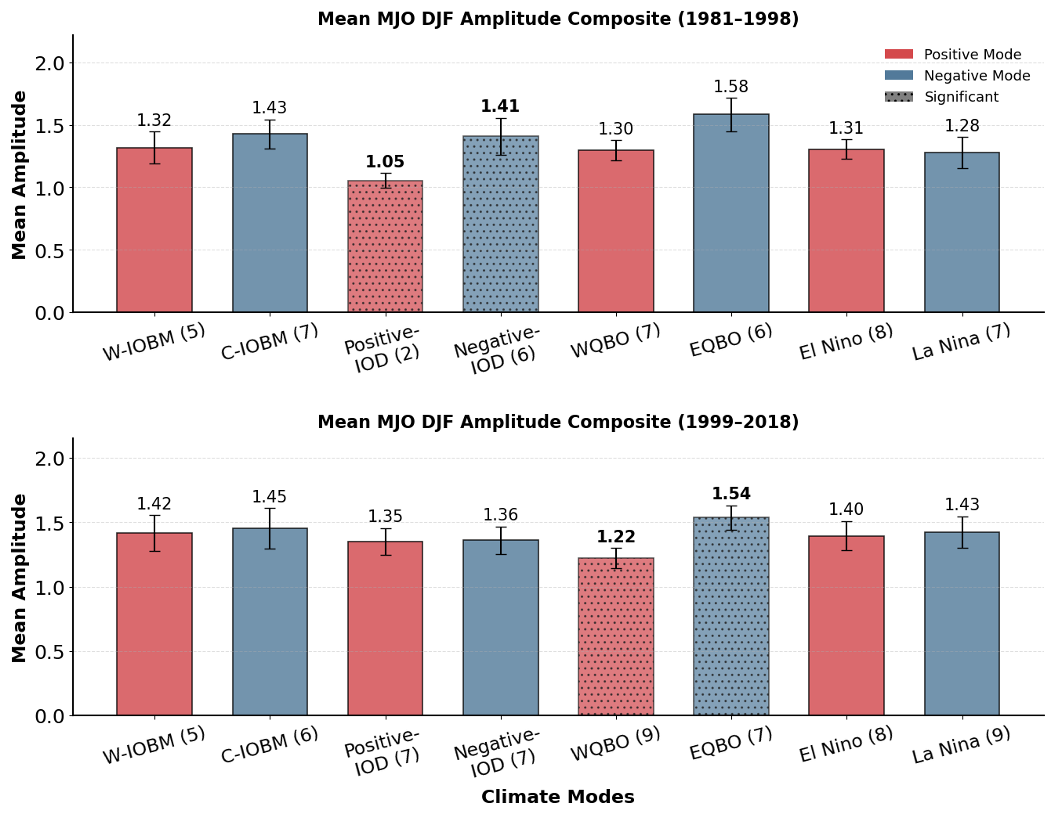
Figure 1Composite mean amplitude of the MJO across different phases of climate indices IOBM, IOD, QBO, and Niño 3.4 during austral summer. The top row displays results for the period 1981–1998, while the bottom row shows the same for 1999–2018. Numbers in parentheses denote the number of years included in each composite phase. The statistical significance of MJO amplitude differences between positive and negative phases of each index was assessed using a bootstrapping approach (10 000 iterations), where years were randomly resampled (7 per phase). Stippled bars/bold text above the bars indicate differences exceeding the 90th percentile confidence threshold. Error bars denote the standard error of the mean amplitude in each composite, illustrating the increased uncertainty for sparsely sampled phases (e.g. positive IOD in 1981–1998).
Amplitude is also higher during Easterly Quasi-Biennial Oscillation (EQBO) and cold Indian Ocean Basin Mode (C-IOBM) years, although this difference is not statistically significant at the 90 % confidence level. In contrast, during the later period (1999–2018; Fig. 1, bottom row panels), these phase-dependent relationships undergo a marked reorganisation: the EQBO–WQBO contrast becomes statistically significant, driven primarily by a substantial reduction in MJO amplitude during WQBO rather than an increase during EQBO, while the previously significant IOD contrast weakens and falls below statistical significance, and C-IOBM differences remain non-significant.
A limitation of this analysis is the relatively small number of years available for some climate-mode phases, particularly positive IOD events in 1981–1998 (only two DJF seasons meet the DMI threshold). As a result, phase composites in this period are sensitive to sampling variability, and bootstrap confidence intervals should be interpreted with caution for sparsely populated categories. To highlight this, Fig. 1 displays error bars (standard errors) on all composites, allowing the uncertainty associated with each climate-mode phase to be directly assessed, including sparsely sampled categories such as positive IOD years in 1981–1998. The strong apparent contrast between negative and positive IOD phases in 1981–1998 should therefore be viewed as suggestive rather than definitive, because the positive IOD composite is based on a very small sample.
To assess the robustness of these relationships, we additionally computed MJO amplitude composites over the whole 40-year period (1981–2018), without epochal subdivision (Fig. S1 in the Supplement). This Supplement figure shows smoother, more statistically stable signals, consistent with the expectation that longer sampling reduces uncertainty, and indicates that the enhanced MJO amplitude during EQBO relative to WQBO remains robust, whereas the IOD phase contrasts are no longer statistically significant when all years are combined. This suggests that the pronounced MJO–IOD contrast seen in 1981–1998 may partly reflect sampling variability, while the QBO–MJO relationship is more stable across periods.
In the earlier period, enhanced MJO amplitude during specific IOD and IOBM years may be partly associated with concurrent EQBO conditions. Moderate correlations between the QBO and IOD (r=0.32) and IOBM (r=0.34) indices suggest some co-variability between stratospheric and Indian Ocean conditions. Using the phase classifications listed in Table S1, EQBO coincides with negative IOD in 3 years during 1981–1998 versus 3 years during 1999–2018, with La Niña in 3 years versus 2 years, and with negative IOBM in 3 years versus 3 years. Notably, IOD and IOBM are significantly correlated (r=0.39), indicating shared variability between these two Indian Ocean modes, while a weaker correlation exists between QBO and ENSO (r=0.19).
These relationships are further illustrated in Fig. S2, which summarizes the pairwise correlations among the climate indices for the two 20-year subperiods (1981–1998 and 1999–2018) and the full 40-year period (1981–2018). The comparison reveals that correlations among Indian Ocean modes (IOD and IOBM) are statistically significant during 1981–1998 but weaken and fall below significance in the later period (1999–2018), indicating that the co-variability of these modes is not stationary across decadal timescales. Similarly, correlations involving the QBO (particularly QBO–IOD and QBO–IOBM) are stronger and significant during the earlier period but weaken or disappear in the later period, suggesting episodic rather than continuous stratosphere–troposphere coupling. Together, these patterns imply that MJO amplitude during the earlier period was likely influenced by a combination of stratospheric (QBO) and tropospheric (Indian and Pacific Ocean SST) factors, with the relative contribution of each varying across decadal background states.
While previous studies (e.g., Sun et al., 2019; Mengist and Seo, 2022; Takasuka et al., 2025) have emphasised the role of EQBO–La Niña co-occurrence in enhancing MJO convection and reducing the blocking effect of the Maritime Continent, it is notable that La Niña events frequently coincide with negative IOD- and IOBM-like states (Schott et al., 2009; Cai et al., 2011; Lim et al., 2017). The negative phase of the IOD, characterised by enhanced low-level moisture and reduced atmospheric stability over the eastern Indian Ocean (Kug et al., 2009; Wilson et al., 2013), provides a thermodynamic environment favourable for MJO development, particularly in phases 1 and 2. These conditions likely acted in concert with EQBO to strengthen MJO amplitude during the 1981–1998 period, highlighting a synergistic interaction between stratospheric and tropospheric drivers.
In contrast, the 1999–2018 period exhibited intensified EQBO–MJO coupling (Klotzbach et al., 2019) but a breakdown of tropospheric linkages, with QBO–IOD/IOBM correlations weakening to r=0.15–0.13 and QBO–ENSO becoming slightly anti-correlated (). This breakdown reflects a fundamental shift in the background state, where the loss of combined stratospheric-tropospheric forcing exacerbated by a weakened N-IOD–La Niña relationship post-1999 (Lim et al. 2017; Zu et al., 2024) diminished MJO amplitude modulation. Notably, the two analysis periods roughly coincide with opposite phases of the Interdecadal Pacific Oscillation (IPO), with 1981–1998 dominated by positive IPO values and 1999–2018 by predominantly negative IPO conditions (Zhao et al., 2016; Henley, 2017). This decadal IPO shift provides an additional large-scale constraint on the Indo-Pacific mean state and may contribute to the non-stationarity of the MJO–climate mode relationships examined here. This is further supported with the findings of Skinner et al. (2023), who showed that boreal winter MJO teleconnection patterns undergo pronounced decadal changes linked to shifts in the IPO and Atlantic Multidecadal Variability. These changes arise primarily from alterations in the background mean state rather than ENSO aliasing (i.e., uneven sampling of El Niño and La Niña events across periods), reinforcing the idea that decadal variability plays a key role in modulating MJO amplitude and teleconnections.
To further characterise MJO variability, we examined relationships between interannual MJO event properties (mean DJF duration and total yearly event count for DJF; see text in the Supplement for the event definition and calculation) and climate mode indices. The QBO exerted the most substantial and most persistent influence on MJO event duration by showing robust negative correlations (1981–1998: ; 1999–2018: ). Composite analysis (Fig. S3) illustrates the frequency distribution of MJO phases, showing that in EQBO years, particularly during 1981–1998, the MJO spends more days in phases 3–6. Although the figure does not directly plot event duration, this higher phase occupancy reflects longer-lived events, consistent with the negative correlation between QBO and mean DJF event duration (). In contrast, MJO event count exhibited weaker associations with QBO ( to −0.20).
The tropospheric modes exhibited decadally varying relationships with MJO frequency. In 1981–1998, the DMI correlated negatively with event count (), indicating more frequent MJO events during N-IOD years. In 1999–2018, this relationship reversed sign and weakened (r=0.29), implying a modest shift toward slightly higher event counts during positive IOD years, but with much smaller amplitude than the strong N-IOD enhancement seen in the earlier period (also see Table S2). The IOBM index developed a positive correlation (r=0.38) in the later period, indicating more events during W-IOBM years. This weakening of tropospheric mode relationships in the second period may stem from reduced co-occurrence of favourable QBO and tropospheric climate mode phases. Notably, none of the tropospheric indices (IOD, IOBM, ENSO) significantly correlated with MJO duration, underscoring that while they modulate initiation frequency, event longevity is governed primarily by stratospheric (QBO) processes. Figure S4 composites illustrate these dynamics: EQBO years in 1981–1998 featured both greater total MJO days and more substantial phase-specific enhancement (phases 3–6), whereas tropospheric influences (e.g., El Niño/N-IOD/W-IOBM linkages to MJO frequency) weakened or reversed in the later period. During both 1981–1998 and 1999–2018, Niño 3.4 exhibited only a weak relationship with total DJF MJO event counts and event durations (Table S2). Nevertheless, during 1981–1998, total phase counts were generally higher in El Niño years, with a disproportionate frequency in phases 3–6, reflecting more eastward-propagating events. In contrast, phase-resolved composites for 1999–2018 (Fig. S4) indicate that La Niña continued to exert a strong influence on the MJO phase distribution, favouring increased occurrence in phases 7–2 and a relative reduction in eastward-propagating events. These results suggest that while the overall relationship between Niño 3.4 and MJO activity remained weak, interannual ENSO conditions still modulated the spatial–temporal structure of MJO events differently across the two periods. Collectively, these results show that while the QBO continues to exert a strong and statistically robust influence on MJO event duration across both periods ( and −0.50), its impact on the phase distribution and spatial structure of MJO activity is not fully stationary and exhibits reversals between EQBO and WQBO, comparable in magnitude to the temporal variability seen for tropospheric climate modes (Fig. S4).
3.2 MJO skill indices in the models
As found in previous studies, all dynamical models exhibit appreciable skill for the 15–25 d lead time in most years, with bivariate correlations generally above ∼0.5, indicating meaningful predictability of the MJO at subseasonal timescales. Figure 2 reveals systematic differences in MJO forecast skill between models and across the two periods. Dynamical models show strong inter-model agreement in skill indices during both 1981–1998 (Fig. 2a) and 1999–2018 (Fig. 2b), while the statistical VAR model (yellow line) consistently underperforms – a pattern confirmed also by the mean skill comparison with lead time (Fig. 2c, yellow line). The agreement in MJO skill across individual models and with the multi-model mean is illustrated in Fig. S4. POAMA2 emerges as the highest-skill dynamical model (green solid line; ∼26 d skill) (Fig. 2c), potentially attributable to its enhanced MJO amplitude relative to observations (compare green and black solid lines; Fig. 2d). It is also noteworthy that the MJO amplitude is substantially underestimated in ACCESS-S2 (blue lines), particularly during the second period, compared to the other models and observations. This amplitude deficiency, however, does not translate to proportionally reduced forecast skill; the model maintains skill levels comparable to those of other dynamical models for this period. This apparent discrepancy suggests that while accurate amplitude representation may contribute to forecast skill (as seen in POAMA2's strong first-period performance), other factors may play compensatory roles in maintaining usable skill despite amplitude biases in ACCESS-S2.
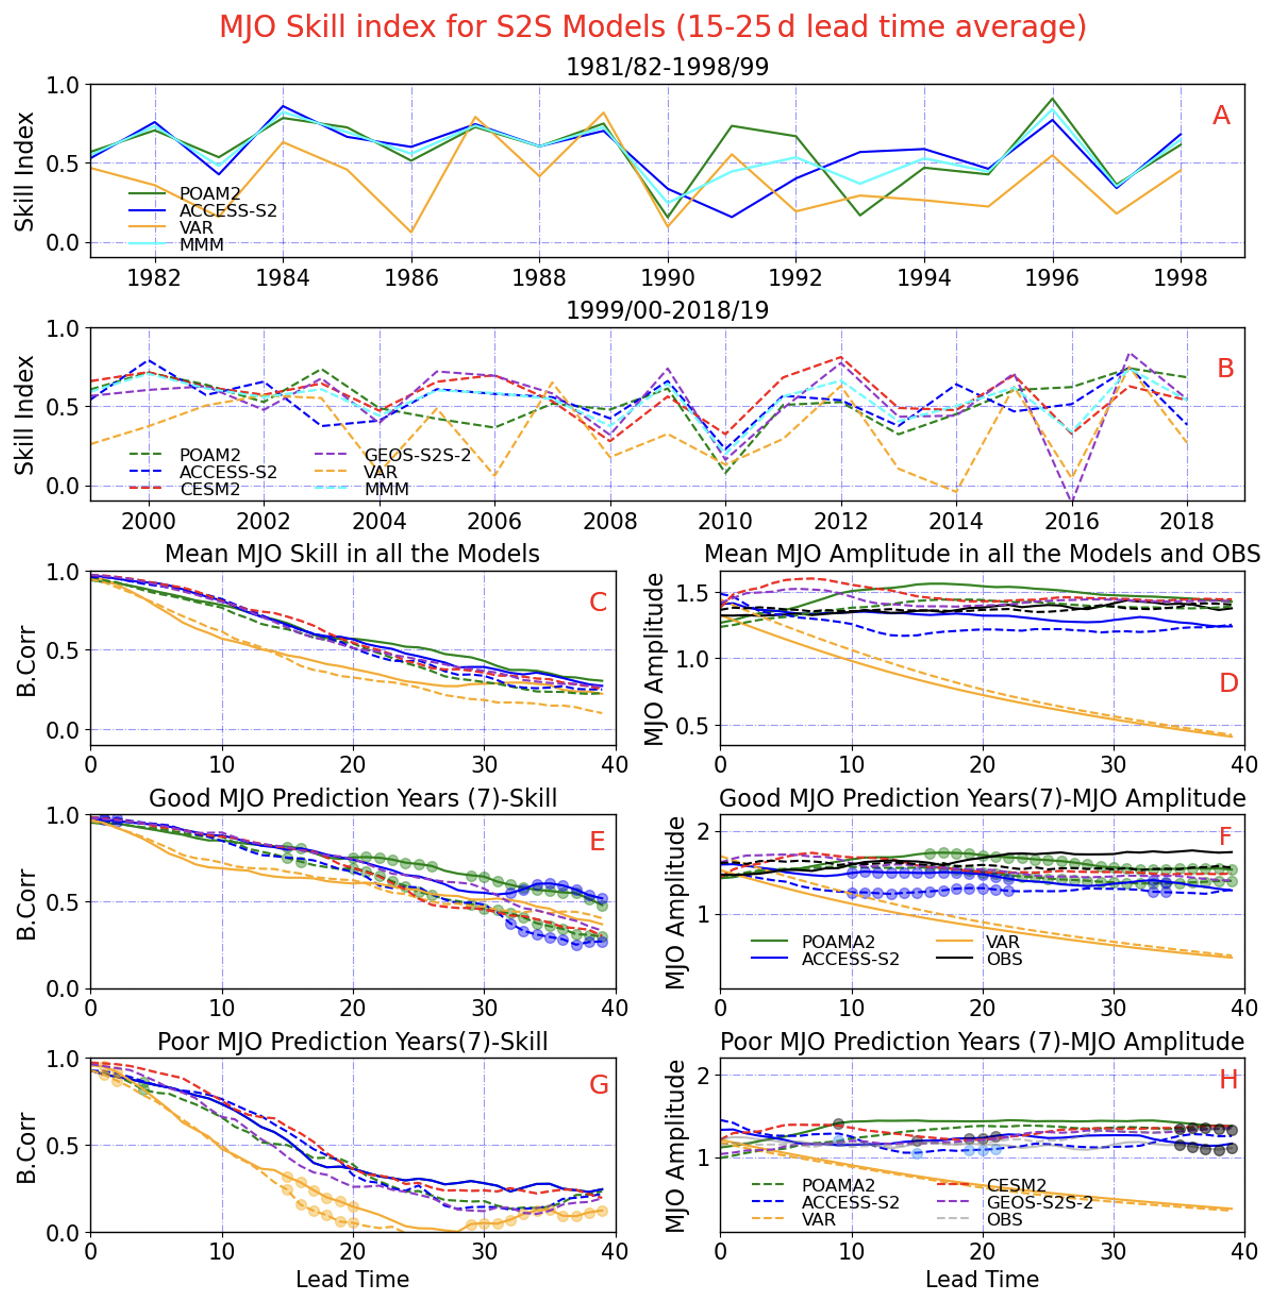
Figure 2Comparison of MJO forecast skill metrics between 1981–1998 (solid lines) and 1999–2018 (dashed lines). (a, b) Skill indices at 15–25 d lead times across models (VAR, POAMA2, ACCESS-S2 in 1981–1998; CESM2 and GEOS-S2S-2 added in 1999–2018). (c, d) Composite mean skill and amplitude displayed as a function of lead time. (e, f) Results for the seven highest-skill years (good MJO prediction); (g, h) the seven lowest-skill years (poor prediction years). Dots in panels (f) and (h) indicate statistically significant differences (p<0.05) between periods for models present in both eras (ACCESS-S2, POAMA2, VAR). The comparison of good and poor MJO prediction years for the observed MJO amplitude is obtained using the multi-model mean skill index of the dynamical models for each period. The multimodel mean skill index is constructed from POAMA2 and ACCESS-S2 in 1981–1998, and from POAMA2, ACCESS-S2, CESM2, and GEOS-S2S-2 in 1999–2018, reflecting the differing hindcast availability. As a result, direct quantitative comparisons of the multi-model mean skill between periods should be interpreted with caution, and our most robust inter-epoch comparisons are based on POAMA2 and ACCESS-S2, which are present in both periods.
A comparison of good MJO prediction years reveals substantial differences between periods (Fig. 2e, compare the solid and dashed lines) (also see Fig. S5, left panel). ACCESS-S2 and POAMA2 demonstrate approximately 10 d greater forecast skill during 1981–1998 compared to 1999–2018, with this enhancement directly attributable to stronger MJO amplitudes in the earlier period (Fig. 2f, compare solid and dashed lines). The statistical VAR model shows a similar, though statistically insignificant (p>0.05), first-period skill advantage. In contrast, the skill difference between the first and second periods disappears in years with poor MJO predictions (Fig. 2g, compare solid and dashed lines), where all models exhibit comparable performance across periods. Importantly, there is strong consistency across models in the classification of good- and poor-prediction years, with most years falling into the same category across systems, reinforcing the robustness of the inter-model signal. These results suggest that recent changes in tropical climate dynamics such as changes in the background state have disproportionately affected MJO prediction skill in good MJO prediction years, while leaving poor-prediction years relatively unchanged.
3.3 Mean state biases in the models
Figure 3 illustrates model mean state-specific humidity at 850 hPa and SST biases in the MJO forecast models across both study periods. All models exhibit an intense warming pattern in the far eastern Pacific along the west coast of South America, with POAMA2 and CESM2 showing the most substantial biases (exceeding +1.5 °C) and ACCESS-S2 showing the weakest bias ( °C). The second period (1999–2018) exhibits notable Indian Ocean warming in CESM2 and GEOS-S2S-2, contrasting with the first period (1981–1998), during which POAMA2 and ACCESS-S2 display more localised eastern Indian Ocean warming, accompanied by a characteristic negative IOD-like pattern. The identified SST biases likely affect MJO skill by modifying the background state through which the MJO propagates. The erroneous eastern Pacific warming may alter the mean-state moisture gradients and Walker circulation, potentially influencing MJO propagation characteristics, though the net effect on forecast skill depends on how models represent MJO dynamics in this biased background state. In the first period, negative IOD-like patterns in POAMA2/ACCESS-S2 could promote more realistic MJO initiation in phases 3 and 4.
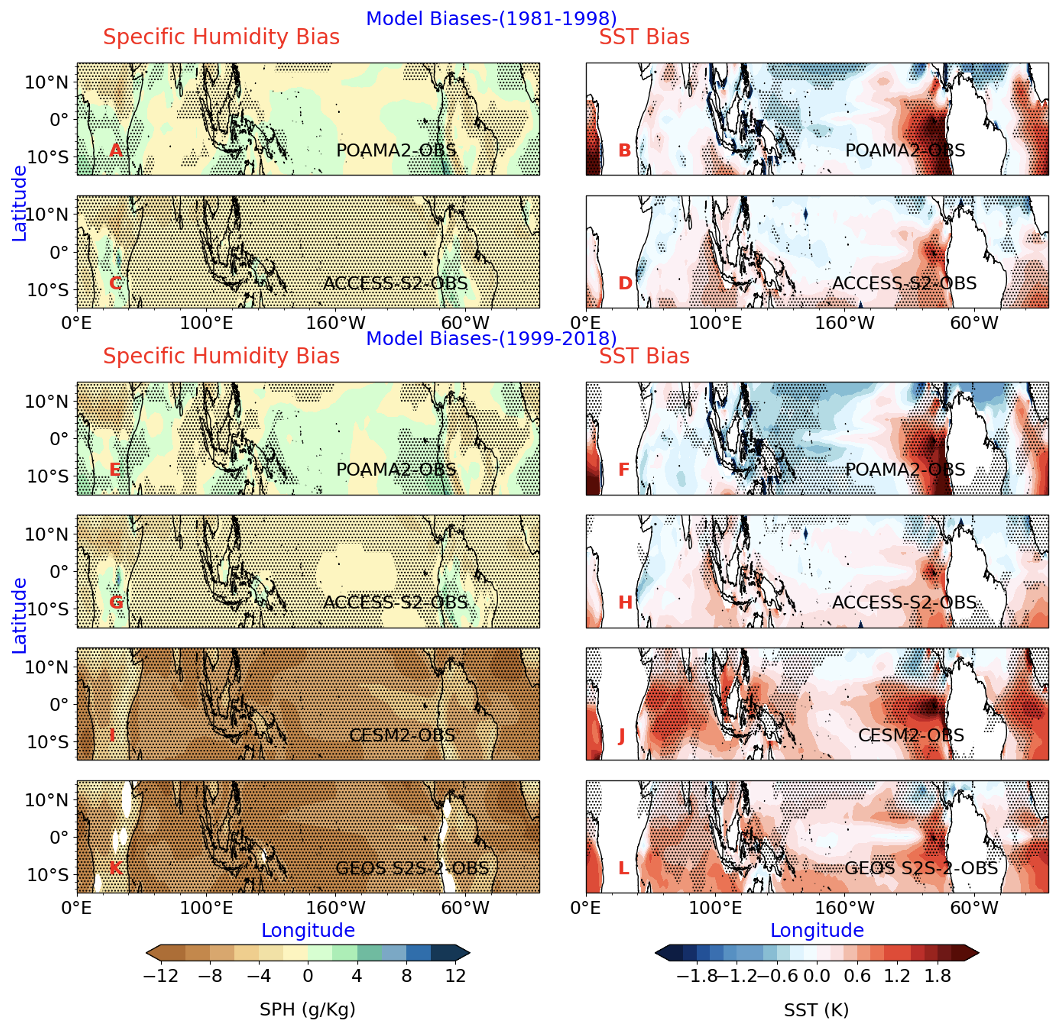
Figure 3Mean state biases in MJO forecast models for 40 d integrations from the initialisation dates, showing differences between modelled and observed climatologies for (a, c, e, g, i, k) specific humidity at 850 hPa and (b, d, f, h, j, l) SST. Top panels (a–d) display biases for 1981–1998 from the model ensemble (POAMA2, ACCESS-S2), while bottom panels (e–l) show 1999–2018 results, including models (CESM2, GEOS-S2S-2). Positive values indicate that the model overestimates the value of the variable relative to the observations. The stippling in the figure suggests significant biases estimated using the bootstrapping method.
Inter-model and period comparisons reveal no strong or consistent relationship between dry biases and MJO forecast skill. While POAMA2 and ACCESS-S2 maintain consistently weaker dry biases than CESM2 and GEOS-S2S-2, their skill characteristics show period-dependent behaviour: both models achieve superior performance during high-skill years in the first period (1981–1998; Fig. 2e) but experience notable skill reduction in the second period (1999–2018) without corresponding increases in moisture bias.
Crucially, mean skill levels remain comparable across all models despite their divergent dry bias magnitudes (e.g., CESM2/GEOS-S2S-2 versus POAMA2). This apparent disconnect suggests that moisture biases alone are insufficient to explain variations in MJO forecast skill. Supporting this, Fig. 3 shows positive SST biases over the Maritime Continent and eastern Indian Ocean in some models that do not translate into corresponding positive moisture anomalies at 850 hPa. This mismatch points to a possible decoupling between SST anomalies and moisture–convection feedback, potentially linked to weak surface wind anomalies or limitations in convection parameterisation. Thus, while dry biases do not directly correlate with skill differences, improving convection schemes and their coupling with large-scale dynamics could still be beneficial for enhancing MJO skill (Zhu and Hendon, 2015), consistent with Jiang et al. (2015), who showed that realistic feedback between moist convection and large-scale circulation is critical for simulating MJO propagation and organisation. We investigate the influence of large-scale dynamics in the following section.
3.4 Large-scale dynamics influencing MJO skill in the models
Figure 4 elucidates the large-scale atmospheric controls on MJO forecast skill by analysing regression patterns between model (right-hand panels) and observed (left-hand panels) state variables and the MJO skill index computed for each model during its respective period. For this analysis, OLR and 850 hPa specific humidity anomalies are averaged over leads 0–30 d and then regressed onto the MJO skill index (defined from 15–25 d bivariate correlations; Sect. 2.2). This broader window is used because OLR and low-level moisture act as slowly varying background-state fields that precondition the large-scale environment for MJO evolution, so a 0–30 d mean provides a more representative measure of the mean state influencing subseasonal convection, whereas the 15–25 d window is reserved for defining the skill index itself. This approach identifies characteristic patterns associated with high-skill/low-skill MJO prediction years while enabling direct model-observation comparisons.
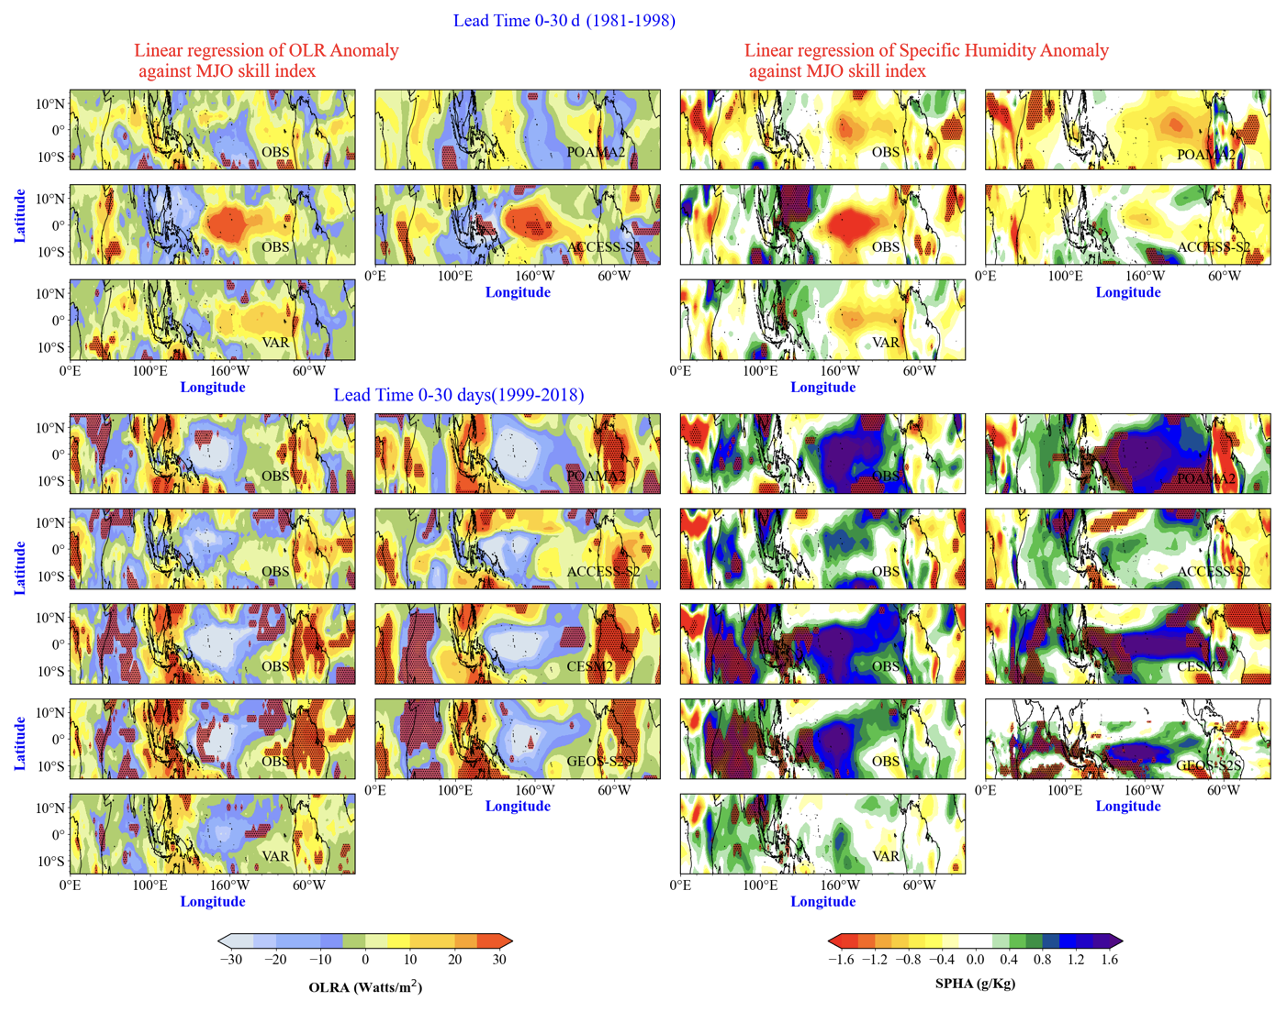
Figure 4Linear regression of OLR anomalies and 850 hPa specific humidity anomalies onto MJO skill indices computed for individual models and periods. The top panels display results for the period from 1981 to 1998, while the bottom panels show results for the period from 1999 to 2018. Left-hand panels show regressions of observed OLR (top panels) and 850 hPa specific humidity (bottom panels anomalies onto the model-derived MJO skill index; right-hand panels show regressions of model-simulated OLR and specific humidity anomalies onto the same skill index. In all cases, anomalies are averaged over 0–30 d lead times before regression. Stippling marks regions where regression coefficients are statistically significant (p<0.10).
During the first period (1981–1998; Fig. 4, top panels), POAMA2, ACCESS-S2, and VAR simulate a negative IOD-like pattern in the Indian Ocean, marked by lower-tropospheric moistening in the eastern Indian Ocean (EIO) and drying in the western Indian Ocean (WIO), alongside collocated OLR anomalies showing enhanced EIO convection and WIO suppression. This dipole structure suggests that higher MJO skill coincides with a background state replicating negative IOD-driven moisture-convection feedback. In the Pacific, models exhibit weak La Niña-like signatures in humidity and OLR, although these are statistically insignificant (p>0.10). ACCESS-S2 shows the strongest La Niña signal, while VAR captures only marginal Pacific anomalies. Collectively, these patterns indicate that first-period MJO skill is optimised when models simulate (1) a negative IOD-like regime in the Indian Ocean, enhancing moisture convergence, and (2) weak La Niña-like Pacific Ocean conditions, supporting a stronger Walker circulation.
During the second period (1999–2018; Fig. 4, bottom panels), the models (right-hand panels) simulate distinct shifts in the relationships with the background states. POAMA2, CESM2, and GEOS-S2S-2 exhibit strong moistening in the central Pacific, resembling a central Pacific El Niño pattern (Ashok et al., 2007), with collocated OLR anomalies showing enhanced convection; however, these linkages remain statistically insignificant (p>0.10). In contrast, ACCESS-S2 and VAR lack a clear El Niño-like signature. The Indian Ocean displays divergent model behaviours: CESM2 and GEOS-S2S-2 align with a warm IOBM regime, marked by basin-wide moistening and convection, while POAMA2, ACCESS-S2, and VAR instead reflect a positive IOD-like dipole pattern. Notably, all models systematically underestimate the observed (left-hand panels) magnitudes of moistening in the Indian Ocean across both periods, suggesting a pervasive bias in representing moisture convergence dynamics in the Indian Ocean region. These results highlight how epochal changes in tropical climate modes differentially influence model skill, with central Pacific El Niño, warm-IOBM and positive IOD-like regimes emerging as competing controls on MJO predictability in the most recent period.
Our analysis reveals fundamental differences in how tropospheric background states modulate MJO predictability across periods. Between 1981 and 1998, the period characterised by a positive phase of the IPO, both dynamical and statistical models demonstrated higher skill under consistent background conditions, a negative IOD-like pattern in the Indian Ocean, coupled with weak La Niña-like Pacific anomalies, suggesting robust tropospheric control of MJO predictability. In the second period (1999–2018), when the IPO phase was negative, the background state no longer exhibited the same coherent negative-IOD–weak-La-Niña pattern. Instead, the Indo-Pacific fields show greater structural diversity, including more frequent central Pacific El Niño events, pronounced Indian Ocean warming, and altered IOD behaviour so that models respond less uniformly to tropospheric conditions. Furthermore, during this later period, models diverge in their responses to background states, with POAMA2, CESM2, and GEOS-S2S-2 tracking central Pacific (CP) El Niño-like conditions, while ACCESS-S2 and VAR exhibit either positive IOD linkages or weak tropical Pacific connections. This reduced tropospheric influence likely stems from the following:
-
Increased sensitivity to Indian Ocean warming in recent years in some models (Dalpadado et al., 2021).
-
ENSO diversity, particularly increased CP El Niño events (Lee and McPhaden, 2010; Freund et al., 2019), which alter MJO propagation pathways (Chen et al., 2015) and
-
Stratospheric dominance, as the QBO's role in MJO skill intensifies due to the absence of coherent tropospheric drivers.
The declining inter-model agreement further underscores that contemporary MJO prediction skill may depend more on interannual variability in stratospheric processes (e.g., QBO) than on the tropospheric background state. This has important implications for model development.
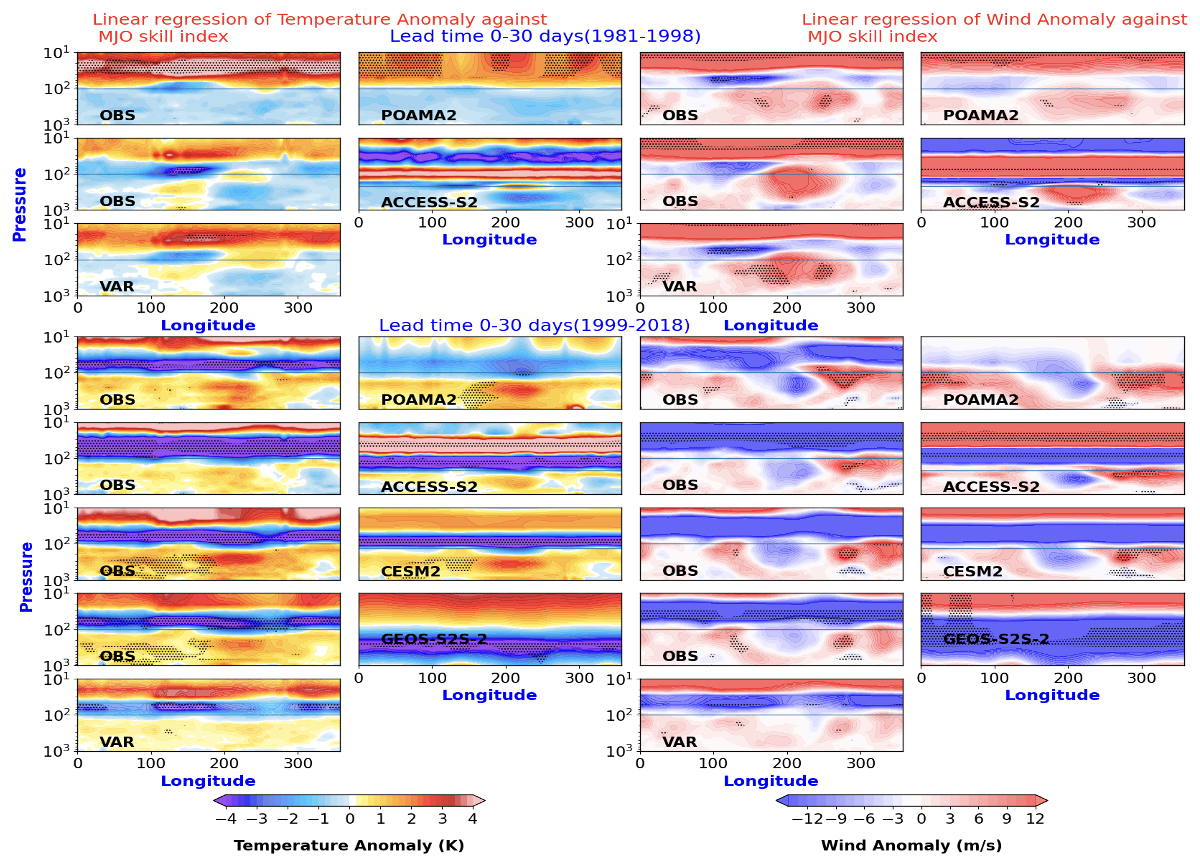
Figure 5Linear regressions of observed and modelled vertical profiles of (left) temperature and (right) zonal wind anomalies onto each model's MJO skill index for both periods (1981–1998 and 1999–2018). The top panels present regression patterns for the earlier period (1981–1998), while the bottom panels show results for the later period (1999–2018). Stippling indicates regions where regression coefficients are statistically significant at the 90 % confidence level (p<0.10).
To elucidate the evolving relationship between large-scale drivers and MJO predictability, we computed correlations between the multi-model mean skill index and the climate mode indices (averaged across dynamical models) during austral summer (December–February) for each period separately. This analysis reveals how the MJO-climate mode linkage has changed between 1981–1998 and 1999–2018, identifying which climate condition became more or less influential on MJO forecast skill over time. During 1981–1998, the multi-model mean skill index exhibited the strongest correlation with the QBO index (, p<0.01), demonstrating enhanced predictability during EQBO years, with EQBO conditions supporting extended predictability windows of 25–35 d (see Table S3). This was complemented by weaker but consistent relationships with negative phases of the ocean–atmosphere coupled modes: IOD (, p<0.01), ENSO (), and IOBM (), indicating that La Niña and negative IOD/IOBM conditions further enhanced predictability when coincident with EQBO. These correlation patterns strongly support our earlier findings that optimal MJO predictability occurred during periods when negative IOD/IOBM/ENSO phases coincided with EQBO conditions. This enhanced predictability primarily results from strengthened MJO convection during phases 3–6, when the MJO's convective envelope interacts most strongly with the Indian Ocean-western Pacific warm pool. The combined effects of (1) EQBO-induced stratospheric wind modulation and (2) warmer SSTs under negative IOD/IOBM/ENSO phases create favourable conditions for enhanced lower-tropospheric moisture convergence and deep convection. Both observational composites (Fig. S3) and model simulations confirm this amplification mechanism, demonstrating more vigorous MJO activity in phases 3–6 during these co-occurring climate mode conditions (not shown). Here, the combined effect refers to the pairing of EQBO with individual oceanic modes (negative IOD, La Niña, or cold-phase IOBM), rather than the simultaneous co-occurrence of all four climate modes. Within each 20-year period, the number of seasons in which EQBO coincides with a given oceanic mode is modest (typically 4–6 years per EQBO–IOD or EQBO–ENSO pairing in 1981–1998, and fewer such coincidences after 1998), underscoring that these pairwise composites should be interpreted as indicative rather than definitive statistics. Post-1998, although the EQBO–WQBO contrast became statistically stronger (, p<0.01), this was driven primarily by a substantial decline in MJO skill during WQBO years rather than any improvement during EQBO; predictability windows during EQBO remained modest at 21–26 d, and MJO amplitude during EQBO actually decreased slightly compared to the earlier period (Fig. 1). The practical impact of the QBO on MJO skill thus diminished as the previously synergistic QBO–ocean–atmosphere coupling broke down, evidenced by reversed correlations with IOD (), ENSO (), and IOBM () and weakened phase alignments (QBO–tropospheric mode correlations < 0.15), leaving no coherent multiscale forcing regime. This paradox stems from a breakdown in the previously synergistic QBO–ocean–atmosphere coupling, as evidenced by reversed correlations with IOD (), ENSO (), and IOBM () and weakened phase alignments. This reversal occurred alongside a breakdown in favourable phase alignments (QBO-tropospheric mode correlations < 0.15), leaving no coherent multiscale forcing regime. The marked decline in the frequency of EQBO–La-Niña and EQBO–negative-IOD combinations in the later period is itself a key result, consistent with the observed breakdown of coherent EQBO–ocean coupling and the corresponding deterioration and increased year-to-year variability in MJO forecast skill.
Figure 5 validates the identified MJO skill-background state relationships through vertical structure analysis, examining temperature and zonal wind anomaly profiles via linear regression with model skill indices. During 1981–1998 (top panel), all models simulate EQBO-like zonal wind patterns (easterly anomalies < −5 m s−1 in the lower stratosphere) which results in tropopause-level (100–200 hPa) temperature instability ( to −1.2 K), though with notable inter-model differences: ACCESS-S2 better resolves these stratospheric signatures compared to POAMA2, which exhibits weaker vertical coherence due to its poor stratospheric representation. These patterns intensify post-1998, with wind anomalies strengthening and temperature instability increasing by ∼1–2 K, indicating enhanced QBO-MJO coupling. This vertical structure analysis aligns with our skill-index correlations, where the QBO relationship strengthened ( to −0.46). The consistency between these independent diagnostics (regressions and correlations) demonstrates that MJO predictability has shifted from being significantly coordinated by tropospheric-stratospheric drivers in the first period to increasingly stratosphere-dominated controls in the second period, with model skill strongly dependent on faithful representation of QBO-related vertical coupling processes.
3.5 Relationship between MJO event characteristics in the models and the climate indices
Figure 6 displays the correlation coefficients between interannual MJO characteristics in the models (mean MJO event duration and total MJO event count for every DJF) and observed climate indices. In the first period, ACCESS-S2 (compared to POAMA2 and VAR) shows a significant negative correlation (−0.48) between the QBO index and MJO event count, a stronger relationship than observed.
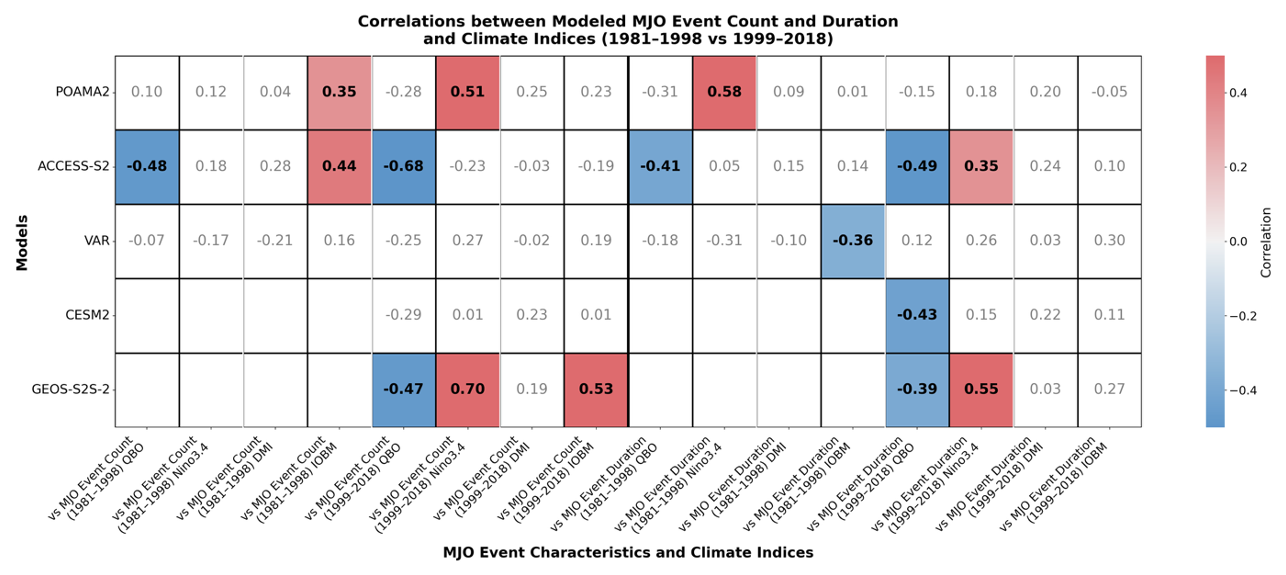
Figure 6Correlation between MJO event characteristics (total MJO event count in the left half of the table and mean annual event duration in the right half of the table) against various climate indices (QBO, Niño 3.4, DMI and IOBM for different periods. Filled (coloured) boxes indicate differences between periods that are statistically significant at the 90 % confidence level (p<0.10), while unfilled boxes denote non-significant differences.
In the second period, the relationship between MJO event counts and the QBO index strengthens in ACCESS-S2 (−0.68) and is also evident in GEOS-S2S-2 (−0.47). This suggests a higher MJO event count during EQBO years. This is unlike the case in the observations. Additionally, moderate negative correlations (−0.39 to −0.49) emerge between MJO event durations and QBO indices in CESM2, ACCESS-S2, and GEOS-S2S-2. However, these model-simulated relationships underestimate the observed relationships between the QBO and MJO duration linkages, except for ACCESS-S2. Because the QBO is skilfully predicted by the models (Table 2), these model-dependent relationships between the MJO characteristics and the QBO appear to originate not from stratospheric forecast errors, but from misrepresented tropospheric responses.
Table 2Correlations between model and observed climate indices are computed from anomalies averaged over 0–30 d lead times with respect to forecast initialisation.
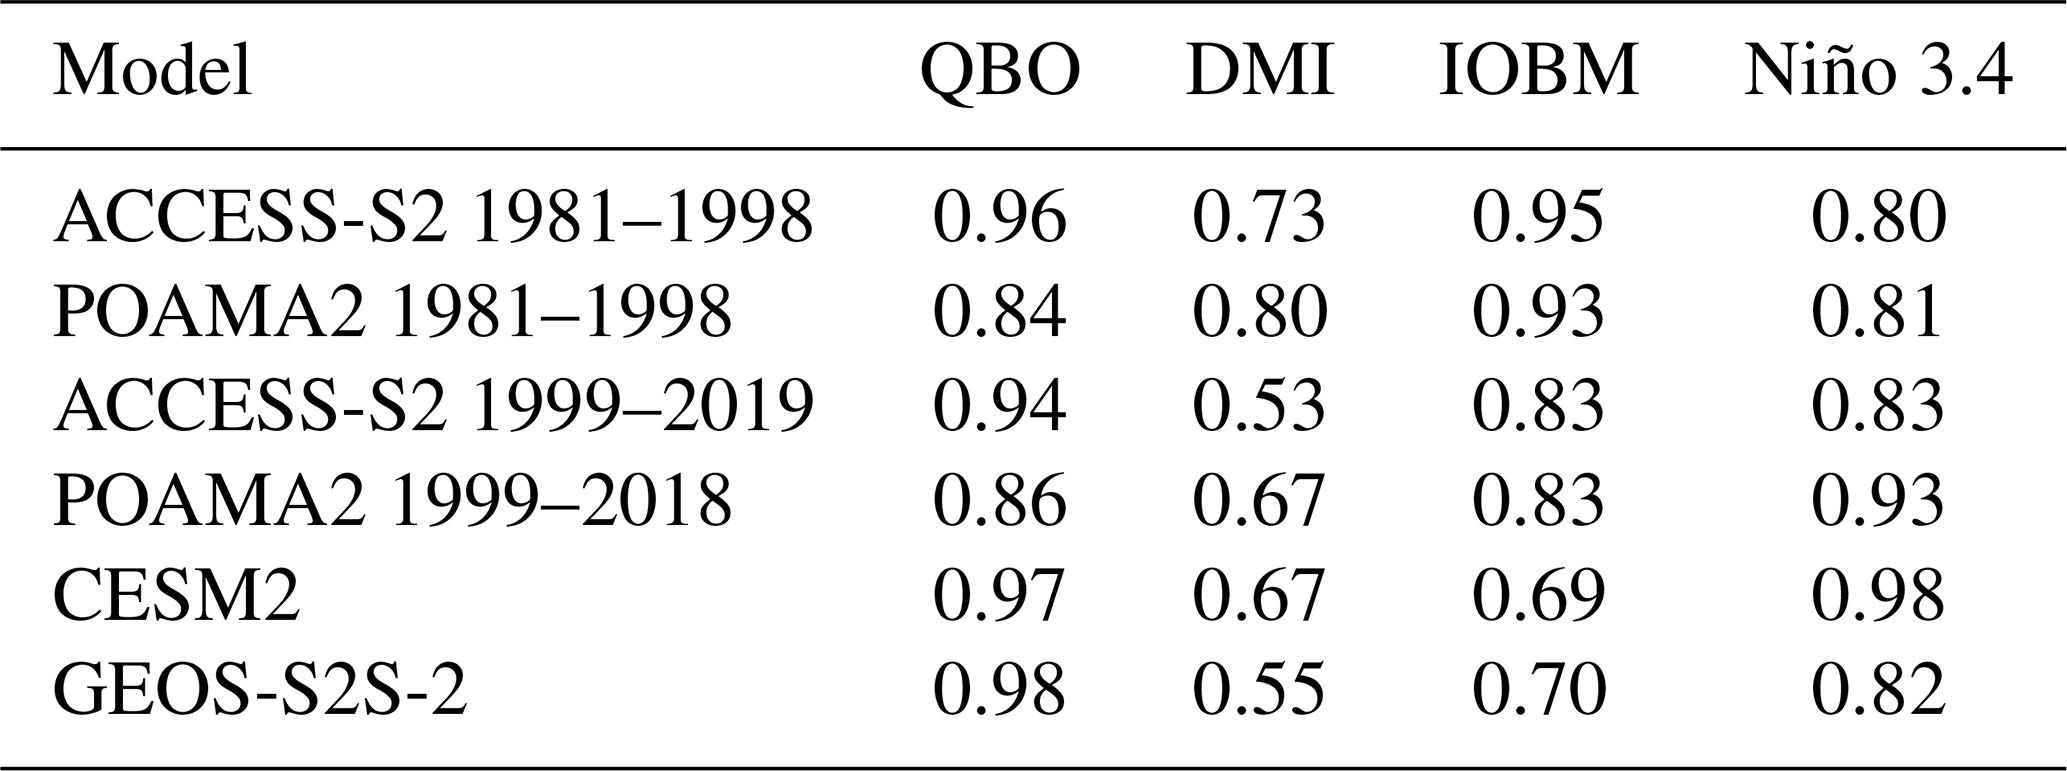
During the second period, both POAMA2 and GEOS-S2S-2 exhibit significant positive correlations between the Niño 3.4 index and MJO event count (0.51 and 0.70, respectively), in contrast to observations, which show no such relationship. This discrepancy is also evident in the first period, as neither model captures the observed moderate positive MJO event count-ENSO connection (see Sect. 3.1). Additionally, these models overestimate the relationship between MJO event duration and the ENSO index, suggesting that simulated MJO events persist longer during El Niño years or that the models exhibit a bias toward El Niño-like conditions. The El Niño-like warming bias in the Pacific Ocean region observed in Sect. 3.3 may be indicative of the same phenomenon. Klingaman and DeMott (2020) reported a similar result, finding increased MJO activity during El Niño years in CMIP-class models (specifically SPCAM3 and SPCCSM3), a pattern largely attributed to the East Pacific warming bias present in these climate models.
The relationship between MJO event count and the DMI index during the first period differs substantially from observations in all models except VAR. While observations indicate an increase in MJO event frequency during negative IOD years, models generally fail to capture this association. In the second period, some models produce weak correlations between MJO event frequency and positive DMI, unlike in the observations. Notably, observations reveal no significant relationship between MJO event duration and IOD phases in either period. However, during the second period, most models generate weak (albeit non-significant) positive correlations between MJO duration and DMI, suggesting a potential positive IOD-like bias, with VAR and GEOS-S2S-2 as notable exceptions. The moderate skill in representing DMI variability across models (Table 2) further implies that the fidelity of MJO-IOD linkages in models may be tied to their ability to simulate IOD behaviour realistically.
A moderate positive correlation exists between MJO event count and the IOBM index during the first period, suggesting that warm IOBM phases (W-IOBM years) are associated with enhanced MJO activity in model simulations. However, observational records show no significant MJO-IOBM relationship, implying this connection may be a modelling artifact rather than a genuine climate feature. While Table 2 indicates that most models reproduce the IOBM index with reasonable accuracy, this apparent skill in representing Indian Ocean variability does not extend to the MJO-IOBM linkage, suggesting potential oversimplifications or errors in the modelled physical mechanisms. During the second period, models generally underestimate MJO event frequency during warm IOBM phases, with GEOS-S2S-2 being the notable exception – its overestimation of this relationship may stem from the warm bias in its Indian Ocean simulation (Sect. 3.3). Additionally, CESM2 exhibits a slightly lower correlation than other models in simulating IOBM-like conditions, as evidenced by its lower correlation (0.69) between observed and modelled IOBM indices. The Indian Ocean warming bias identified in CESM2 in Sect. 3.3 also supports the lower correlation.
To further assess whether these relationships are robust to the source of the climate indices, we repeat the analysis using model-derived climate modes (Fig. S6). Compared with the observation-based results (Fig. 6), Fig. S6 shows that several models substantially amplify the apparent influence of large-scale modes on MJO characteristics. In particular, while observations indicate weak and inconsistent links between the QBO and MJO event properties, model-based correlations show stronger, more systematic QBO–MJO relationships, especially for event counts, suggesting an overly sensitive tropospheric response to stratospheric variability. Likewise, the ENSO–MJO relationships are generally stronger in Fig. S6 than in the observational analysis, with some models exhibiting enhanced correlations between Niño 3.4 and both MJO event frequency and duration. This points to a dominant role of model mean-state biases rather than predictable climate modes alone in shaping the simulated MJO–climate mode connections.
Accurate prediction of the MJO is crucial for advancing S2S forecasting capabilities, given its global impact on tropical convection and extratropical teleconnections (Vitart and Robertson, 2018). Our analysis of four S2S models (POAMA2, ACCESS-S2, GEOS-S2S-2, CESM2) and a statistical benchmark (VAR) during austral summer (December–February) across two periods (1981–1998; POAMA2, ACCESS-S2) versus 1999–2018 (POAMA2, ACCESS-S2, GEOS-S2S-2, CESM2)) highlights three key findings.
First, we assessed how the MJO interacts with various climate modes by conducting a composite analysis of observed MJO amplitude during different phases of the climate modes. In the earlier period, the IOD exhibited a pronounced influence on MJO amplitude, with the negative phase associated with more vigorous MJO activity. This enhancement was further supported by increased MJO amplitude during EQBO years and cold phases of the IOBM. However, in the later period, the relationship between the negative phase of the IOD and MJO amplitude disappears, leaving the MJO modulation primarily associated with the EQBO.
Additionally, during the first period, EQBO–MJO events tended to coincide with favourable tropospheric states, such as negative IOD, cold IOBM, or La Niña-like conditions, suggesting a coherent multi-mode influence. By contrast, in the second period, the connection between stratospheric and tropospheric climate modes is diminished, and QBO–MJO events occur largely independently of favourable tropospheric forcings. The annual count of MJO events in observations shows a moderate correlation with coupled ocean–atmosphere modes, while the mean yearly event duration correlates directly with EQBO conditions.
In the second part of our study, we analysed the relationship between MJO prediction skill and large-scale climate modes to verify the characteristics identified in observational records. When averaged over all years, the mean 15–25 d MJO forecast skill differs only modestly between 1981–1998 and 1999–2018, but in the subset of high-skill years, the difference is substantial: ACCESS-S2 and POAMA2 both gain roughly 10 additional days of useful skill in the earlier period. This difference between the periods, however, is not observed in the years with poor MJO predictions. The elevated skill observed in the high-skill years of the first (earlier) period was primarily linked to higher MJO amplitude. These years showed a clear association with EQBO-like signatures in the stratosphere, a negative IOD-like pattern or cold IOBM-like pattern in the Indian Ocean sector, and, to a lesser extent, La Niña-like conditions in the Pacific. This phase alignment among the stratospheric process, processes in the Indian and the Pacific Oceans provided a favourable multi-scale environment that enhanced both MJO amplitude and model skill. By contrast, in the second (later) period, high-skill MJO years exhibited distinctly different background conditions. For these years, Indian Ocean SST patterns resembled positive phases of IOD/IOBM, and the Pacific showed El Niño-like features – conditions less conducive to amplified MJO activity. As a result, the previously robust synergistic connection between different climate modes appeared to break down, resulting in diminished MJO predictability even in otherwise “high-skill” years. Notably, EQBO remained the only significant and persistent modulator of MJO skill in the second period, but its overall impact was weaker without concurrent favourable patterns in other climate modes.
We speculate that in the later period, the weaker QBO–MJO relationship in model forecasts – despite the QBO being reasonably well represented in both high-top (ACCESS-S2, GEOS-S2S-2) and low-top (POAMA2) models, and consistent with the earlier period – likely reflects changes in the tropospheric background state. Despite its low stratospheric resolution, POAMA2 is included to provide continuity across 1981–2018 in a single forecast system, enabling a cleaner assessment of decadal changes in MJO skill under a constant model framework. In the second period, the models struggle to capture stratosphere–troposphere coupling, particularly in the absence of strong SST forcing, which was more common during the first period. Additionally, key processes in the troposphere are often poorly represented in models. For example, models analysed in this study fail to accurately replicate the observed relationship between MJO event frequency and duration and the ENSO index. This limitation suggests an underlying Pacific bias, with many models skewing toward El Niño-like conditions, potentially linked to a known warm bias in the eastern Pacific. Moreover, models (notably POAMA2, CESM2, and GEOS-S2S-2) tend to exhibit a bias toward warm phases of the IOD and IOBM, in contrast to the observed variability. These systematic biases in representing coupled ocean–atmosphere background states may limit the models' ability to simulate realistic MJO behaviour. Therefore, future modelling efforts would likely benefit from improved representation of tropospheric circulation patterns, reduced SST-related biases, particularly in the Indo-Pacific region, and enhanced stratospheric resolution. Such improvements may provide a pathway to enhancing MJO prediction skill, especially during periods lacking strong multi-scale lower-boundary forcing.
A key limitation of this study is the relatively short hindcast record, particularly for some models and for specific climate-mode phases, which constrains the robustness of inferred relationships between the MJO and ENSO, IOD, IOBM, and the QBO. In particular, the small number of positive IOD events in 1981–1998 means that the apparent epochal differences in MJO–IOD coupling could in part reflect sampling noise. Nevertheless, our aim is not to estimate long-term climatological relationships, but to diagnose non-stationarity in MJO characteristics and forecast skill on interdecadal timescales, motivated by the observed decline in MJO predictive skill after the late 1990s and concurrent changes in the tropical background state. Consistent with this interpretation, recent work by Kim et al. (2025) has shown that asymmetric tropical ocean warming in recent decades has altered the mean state and regional propagation characteristics of the MJO, implying that MJO behaviour is not stationary across periods. This independent evidence supports treating 1981–1998 and 1999–2018 as dynamically distinct regimes, even while recognising the sampling limitations of each period.
The model data analysed during this study are available from the corresponding author upon reasonable request. All publicly available observational and reanalysis datasets are provided by the NOAA Physical Sciences Laboratory (PSL) and the Australian Bureau of Meteorology (BOM) as follows:
-
The NCEP-DOE Reanalysis 2 data: https://psl.noaa.gov/data/gridded/data.ncep.reanalysis2.html (last access: 22 June 2026)
-
The High-Resolution OISST Version 2 data: https://psl.noaa.gov/data/gridded/data.noaa.oisst.v2.highres.html (last access: 22 June 2026)
-
The Real-time Multivariate MJO (RMM) index (Wheeler and Hendon, 2004): http://www.bom.gov.au/climate/mjo/graphics/rmm.74toRealtime.txt (last access: 22 June 2026). The analysis codes and scripts used in this study are available from the corresponding author upon reasonable request.
The supplement related to this article is available online at https://doi.org/10.5194/wcd-7-1385-2026-supplement.
RR conducted the formal analysis and led the original manuscript preparation. JA, EL, MW, and JR provided supervision, critical guidance, and feedback. All authors contributed to the study's design, interpretation of results, and manuscript review.
The contact author has declared that none of the authors has any competing interests.
Publisher's note: Copernicus Publications remains neutral with regard to jurisdictional claims made in the text, published maps, institutional affiliations, or any other geographical representation in this paper. The authors bear the ultimate responsibility for providing appropriate place names. Views expressed in the text are those of the authors and do not necessarily reflect the views of the publisher.
This article is part of the special issue “Stratospheric impacts on climate variability and predictability in nudging experiments”. It is not associated with a conference.
The numerical analysis was conducted using Python (version 3.9). We acknowledge the National Computational Infrastructure (NCI), supported by the Australian Government, for providing computational resources and services. We thank the NOAA Physical Sciences Laboratory for producing and making the NCEP-DOE Reanalysis II dataset publicly available. We are also grateful to Zoe Gillett and Hongyan Zhu at the Bureau of Meteorology for their valuable feedback.
This work was supported by Securing Antarctica's Environmental Future, funded by the Australian Research Council (ARC) Special Research Initiative in Excellence in Antarctic Science grant SR200100005. Eun-Pa Lim received partial support from the Victorian Water and Climate Initiative (VicWaCI) phase 2 and the National Environmental Science Program (NESP) phase 2.
This paper was edited by Daniela Domeisen and reviewed by two anonymous referees.
Abhik, S. and Hendon, H. H.: Influence of the QBO on the MJO during coupled model multiweek forecasts, Geophys. Res. Lett., 46, 9213–9221, https://doi.org/10.1029/2019gl083152, 2019.
Abhik, S., Zhang, C., and Hendon, H. H.: The Indo-Pacific Maritime Continent barrier effect on MJO ensemble prediction, Geophys. Res. Lett., 50, e2023GL105462, https://doi.org/10.1029/2023GL105462, 2023.
Ashok, K., Behera, S. K., Rao, S. A., Weng, H., and Yamagata, T.: El Niño Modoki and its possible teleconnection, J. Geophys. Res., 112, C11007, https://doi.org/10.1029/2006JC003798, 2007.
Cai, W., van Rensch, P., Cowan, T., and Hendon, H. H.: Teleconnection pathways of ENSO and the IOD and the mechanisms for impacts on Australian rainfall, J, Climate, 24, 3910–3923, https://doi.org/10.1175/2011jcli4129.1, 2011.
Chen, X., Ling, J., and Li, C.: Evolution of Madden-Julian Oscillation in two types of El Niño, J. Climate, 29, 151229065042007, https://doi.org/10.1175/JCLI-D-15-0486.1, 2015.
Cottrill, A., Hendon, H. H., Lim, E., Langford, S., Shelton, K., Charles, A., McClymont, D., Jones, D., and Kuleshov, Y.: Seasonal Forecasting in the Pacific Using the Coupled Model POAMA-2, Weather Forecast., 28, 668–680, https://doi.org/10.1175/WAF-D-12-00072.1, 2013.
Dalpadado, P., Arrigo, K. R., van Dijken, G. L., Gunasekara, S. S., Ostrowski, M., Bianchi, G., and Sperfeld, E.: Warming of the Indian Ocean and its impact on temporal and spatial dynamics of primary production, Prog. Oceanogr., 198, 102688, https://doi.org/10.1016/j.pocean.2021.102688, 2021.
DeMott, C. A., Wolding, B. O., Maloney, E. D., and Randall, D. A.: Atmospheric mechanisms for MJO decay over the Maritime Continent, J. Geophys. Res.-Atmos., 123, 5188–5204, https://doi.org/10.1029/2017JD026979, 2018.
Dong, C., Peings, Y., and Magnusdottir, G.: Decadal variability of the MJO and implications for southwestern united states wintertime precipitation predictability, Geophys. Res. Lett., 52, e2024GL113956, https://doi.org/10.1029/2024GL113956, 2025.
Freund, M. B., Henley, B. J., Karoly, D. J., McGregor, H. V., Kiem, A. S., and Nicholls, N.: Higher frequency of Central Pacific El Niño events in recent decades relative to past centuries, Nat. Geosci., 12, 450–455, https://doi.org/10.1038/s41561-019-0353-3, 2019.
Gonzalez, A. O. and Jiang, X.: Winter mean lower tropospheric moisture over the Maritime Continent as a climate model diagnostic metric for the propagation of the Madden-Julian oscillation, Geophys. Res. Lett., 44, 2588–2596, https://doi.org/10.1002/2016GL072430, 2017.
Hendon, H. H. and Abhik, S.: Differences in vertical structure of the Madden-Julian oscillation associated with the quasi-biennial oscillation, Geophys. Res. Lett., 45, 4419–4428, https://doi.org/10.1029/2018GL077207, 2018.
Henley, B. J.: Pacific decadal climate variability: Indices, patterns and tropical-extratropical interactions, Global Planet. Change, 155, 42–55, 2017.
Huang, B., Liu, C., Banzon, V., Freeman, E., Graham, G., Hankins, B., Smith, T., and Zhang, H.-M.: Improvements of the Daily Optimum Interpolation Sea Surface Temperature (DOISST) Version 2.1, J. Climate, 34, 2923–2939, https://doi.org/10.1175/JCLI-D-20-0166.1, 2021.
Hudson, D., Alves, O., Hendon, H. H., Lim, E.-P., Liu, G., Luo, J.-J., MacLachlan, C., Marshall, A. G., Shi, L., Wang, G., Wedd, R., Young, G., Zhao, M., and Zhou, X.: ACCESS-S1: The new Bureau of Meteorology multi-week to seasonal prediction system, J. S. Hemisph. Earth Syst. Sci., 67, 132–159, https://doi.org/10.22499/3.6703.001, 2017.
Jiang, X., Waliser, D. E., Xavier, P. K., Zhu, J., and Sperber, K. R.: Vertical structure and physical processes of the Madden-Julian oscillation: Exploring key model physics in climate simulations, J. Geophys. Res.-Atmos., 120, 4718–4748, https://doi.org/10.1002/2014JD022375, 2015.
Jiang, X., Adames, Á. F., Kim, D., Maloney, E. D., Lin, H., Kim, H., Waliser, D. E., Sperber, K. R., Zhang, C., and Ahn, M.-S.: Fifty years of research on the Madden-Julian Oscillation: Recent progress, challenges, and perspectives, J. Geophys. Res.-Atmos., 125, e2019JD030911, https://doi.org/10.1029/2019JD030911, 2020.
Jin, D., Kim, D., Son, S.-W., Song, J., Kim, H.-M., and Kug, J.-S.: QBO deepens MJO convection, Nat. Commun., 14, 4088, https://doi.org/10.1038/s41467-023-39465-7, 2023.
Kanamitsu, M., Ebisuzaki, W., Woollen, J., Yang, S.-K., Hnilo, J. J., Fiorino, M., and Potter, G. L.: NCEP-DOE AMIP-II reanalysis (R-2), B. Am. Meteorol. Soc., 83, 1631–1643, https://doi.org/10.1175/BAMS-83-11-1631, 2002.
Kim, D., Xavier, P., Maloney, E., Wheeler, M., Waliser, D., Sperber, K., Hendon, H., Zhang, C., Neale, R., Hwang, Y.-T., and Liu, H.: Process-Oriented MJO Simulation Diagnostic: Moisture Sensitivity of Simulated Convection, J. Climate, 27, 5379–5395, https://doi.org/10.1175/JCLI-D-13-00497.1, 2014.
Kim, H., Lee, M., Kim, D., Kang, H., and Hyun, Y.: Representation of Boreal Winter MJO and Its Teleconnection in a Dynamical Ensemble Seasonal Prediction System, J. Climate, 31, 8803–8818, https://doi.org/10.1175/JCLI-D-18-0039.1, 2018.
Kim, H., Janiga, M. A., and Pegion, K.: MJO propagation processes and mean biases in the SubX and S2S reforecasts, J. Geophys. Res.-Atmos., 124, 9314–9331, https://doi.org/10.1029/2019JD031139, 2019a.
Kim, H., Richter, J. H., and Martin, Z.: Insignificant QBO-MJO prediction skill relationship in the SubX and S2S subseasonal reforecasts, J. Geophys. Res.-Atmos., 124, 12655–12666, https://doi.org/10.1029/2019JD031416, 2019b.
Kim, H. R., Ha, K.-J., Roxy, M. K., and Kim, H.-M.: Recent asymmetric tropical ocean warming has altered regional propagation of Madden-Julian Oscillation, Commun. Earth Environ., 6, 663, https://doi.org/10.1038/s43247-025-02652-z, 2025.
Klingaman, N. P. and DeMott, C. A.: Mean-state biases and interannual variability affect perceived sensitivities of the Madden–Julian oscillation to air–sea coupling, J. Adv. Model. Earth Syst., 12, e2019MS001799, https://doi.org/10.1029/2019MS001799, 2020.
Klotzbach, P. J., Abhik, S., Hendon, H. H., and Schreck, C. J.: On the emerging relationship between the stratospheric Quasi-Biennial oscillation and the Madden-Julian oscillation, Sci. Rep., 9, 2981, https://doi.org/10.1038/s41598-019-40034-6, 2019.
Kug, J.-S., Sooraj, K., Jin, F.-F., Luo, J.-J., and Kwon, M.: Impact of Indian Ocean Dipole on high-frequency variability over the Indian Ocean, Atmos. Res., 94, 134–139, https://doi.org/10.1016/j.atmosres.2008.10.022, 2009.
Lee, T. and McPhaden, M. J.: Increasing intensity of El Niño in the central-equatorial Pacific, Geophys. Res. Lett., 37, L14603, https://doi.org/10.1029/2010GL044007, 2010.
Liebmann, B. and Smith, C. A.: Description of a complete (interpolated) outgoing longwave radiation dataset, B. Am. Meteorol. Soc., 77, 1275–1277, 1996.
Lim, E. P., Hendon, H. H., Zhao, M., and Thompson, D. W. J.: Inter-decadal variations in the linkages between ENSO, the IOD and south-eastern Australian springtime rainfall in the past 30 years, Clim. Dynam., 49, 97–112, https://doi.org/10.1007/s00382-016-3328-8, 2017.
Lim, E.-P., Zhao, M., Hendon, H. H., Cowan, T., Wheeler, M. C., and Wang, G.: Why Australia was not wet during spring 020 despite La Niña, Sci. Rep., 11, 18423, https://doi.org/10.1038/s41598-021-97690-w, 2021a.
Lim, Y., Son, S.-W., and Kim, D.: MJO prediction skill of the subseasonal-to-seasonal prediction models, J. Climate, 31, 4075–4094, https://doi.org/10.1175/JCLI-D-17-0545.1, 2018.
Lim, Y.-K., Arnold, N. P., Molod, A. M., and Pawson, S.: Seasonality in prediction skill of the Madden-Julian Oscillation and associated dynamics in Version 2 of NASA's GEOS-S2S forecast system, J. Geophys. Res.-Atmos., 126, e2021JD034961, https://doi.org/10.1029/2021JD034961, 2021b.
Lin, Q.-J., Mayta, V. C., and Adames Corraliza, Á. F.: Assessment of the Madden-Julian Oscillation in CMIP6 models based on moisture mode theory, Geophys. Res. Lett., 51, e2023GL106693, https://doi.org/10.1029/2023GL106693, 2024.
Ling, J., Zhao, Y.-S., and Chen, G.: Barrier Effect on MJO Propagation by the Maritime Continent in the MJO Task Force/GEWEX Atmospheric System Study Models, J. Climate, 32, 5529–5547, https://doi.org/10.1175/JCLI-D-18-0870.1, 2019.
Liu, X., Wu, T., Yang, S., Li, T., Jie, W., Zhang, L., Wang, Z., Liang, X., Li, Q., Cheng, Y., Ren, H., Fang, Y., and Nie, S.: MJO prediction using the sub-seasonal to seasonal forecast model of Beijing Climate Center, Clim. Dynam., 48, 3283–3307, https://doi.org/10.1007/s00382-016-3264-7, 2017.
Madden, R. A. and Julian, P. R.: Detection of a 40–50 day oscillation in the zonal wind in the tropical Pacific, J. Atmos. Sci., 28, 702–708, https://doi.org/10.1175/1520-0469(1971)028<0702:DOADOI>2.0.CO;2, 1971.
Madden, R. A. and Julian, P. R.: Description of global-scale circulation cells in the tropics with a 40–50 day period, J. Atmos. Sci., 29, 1109–1123, https://doi.org/10.1175/1520-0469(1972)029<1109:DOGSCC>2.0.CO;2, 1972.
Maharaj, E. A. and Wheeler, M. C.: Forecasting an index of the Madden-oscillation, Int. J. Climatol., 25, 1611–1618, https://doi.org/10.1002/joc.1209, 2005.
Marshall, A. G., Hendon, H. H., and Hudson, D.: Visualizing and verifying probabilistic forecasts of the Madden-Julian Oscillation, Geophys. Res. Lett., 43, 12278–12286, https://doi.org/10.1002/2016GL071423, 2016.
Marshall, A. G., Hendon, H. H., Son, S. W., and Lim, Y.: Impact of the quasi-biennial oscillation on predictability of the Madden–Julian Oscillation, Clim. Dynam., 49, 1365–1377, https://doi.org/10.1007/s00382-016-3392-0, 2017.
Martin, Z., Orbe, C., Wang, S., and Sobel, A.: The MJO–QBO relationship in a GCM with stratospheric nudging, J. Climate, 34, 4603–4624, https://doi.org/10.1175/JCLI-D-20-0636.1, 2021.
Mengist, C. K. and Seo, K.-H.: How long can the MJO be predicted during the combined phases of ENSO and QBO?, Geophys. Res. Lett., 49, e2022GL097752, https://doi.org/10.1029/2022GL097752, 2022.
Molod, A., Hackert, E., Vikhliaev, Y., Zhao, B., Barahona, D., Vernieres, G., Borovikov, A., Kovach, R. M., Marshak, J., Schubert, S., Li, Z., Lim, Y.-K., Andrews, L. C., Cullather, R., Koster, R., Achuthavarier, D., Carton, J., Coy, L., Freire, J. L. M., Longo, K. M., Nakada, K., and Pawson, S.: GEOS-S2S Version 2: The GMAO high-resolution coupled model and assimilation system for seasonal prediction, J. Geophys. Res.-Atmos., 125, e2019JD031767, https://doi.org/10.1029/2019JD031767, 2020.
Neena, J. M., Lee, J.-Y., Waliser, D. E., Wang, B., and Jiang, X.: Predictability of the Madden–Julian oscillation in the Intraseasonal Variability Hindcast Experiment (ISVHE), J. Climate, 27, 4531–4543, https://doi.org/10.1175/JCLI-D-13-00624.1, 2014.
Nishimoto, E. and Yoden, S.: Influence of the stratospheric quasi-biennial oscillation on the Madden–Julian Oscillation during austral summer, J. Atmos. Sci., 74, 1105–1125, https://doi.org/10.1175/JAS-D-16-0205.1, 2017.
Peatman, S. C., Matthews, A. J., and Stevens, D. P.: Propagation of the Madden–Julian Oscillation through the Maritime Continent and scale interaction with the diurnal cycle of precipitation, Q. J. Roy. Meteorol. Soc., 140, 814–825, https://doi.org/10.1002/qj.2161, 2014.
Pegion, K., Kirtman, B. P., Becker, E., Collins, D. C., LaJoie, E., Burgman, R., Bell, R., DelSole, T., Min, D., Zhu, Y., Li, W., Sinsky, E., Guan, H., Gottschalck, J., Metzger, E. J., Barton, N. P., Achuthavarier, D., Marshak, J., Koster, R. D., Lin, H., Gagnon, N., Bell, M., Tippett, M. K., Robertson, A. W., Sun, S., Benjamin, S. G., Green, B. W., Bleck, R., and Kim, H.: The Subseasonal Experiment (SubX): A multi-model subseasonal prediction experiment, B. Am. Meteorol. Soc., 100, 2043–2061, https://doi.org/10.1175/BAMS-D-18-0270.1, 2019.
Rashid, H. A., Hendon, H. H., Wheeler, M. C., and Alves, O.: Prediction of the Madden–Julian oscillation with the POAMA dynamical prediction system, Clim. Dynam., 36, 649–661, https://doi.org/10.1007/s00382-010-0754-x, 2011.
Richter, J. H., Glanville, A. A., Edwards, J., Kauffman, B., Davis, N. A., Jaye, A., Kim, H., Pedatella, N. M., Sun, L., Berner, J., Kim, W. M., Yeager, S. G., Danabasoglu, G., Caron, J. M., and Oleson, K. W.: Subseasonal Earth system prediction with CESM2, Weather Forecast., 37, 797–815, https://doi.org/10.1175/WAF-D-21-0163.1, 2022.
Rondanelli, R., Hatchett, B., Rutllant, J., Bozkurt, D., and Garreaud, R.: Strongest MJO on record triggers extreme Atacama rainfall and warmth in Antarctica, Geophys. Res. Lett., 46, 3482–3491, https://doi.org/10.1029/2018GL081475, 2019.
Roy, R., Arblaster, J. M., Wheeler, M. C., and Lim, E.-P.: Understanding MJO teleconnections to the Southern Hemisphere extratropics during El Niño, La Niña, and neutral years, Geophys. Res. Lett., 52, e2024GL113395, https://doi.org/10.1029/2024GL113395, 2025.
Saji, N. H., Goswami, B. N., Vinayachandran, P. N., and Yamagata, T.: A dipole mode in the tropical Indian Ocean, Nature, 401, 360–363, 1999.
Sakaeda, N., Dias, J., and Kiladis, G. N.: The unique characteristics and potential mechanisms of the MJO–QBO relationship, J. Geophys. Res.-Atmos., 125, e2020JD033196, https://doi.org/10.1029/2020JD033196, 2020.
Savarin, A. and Chen, S. S.: Land-locked convection as a barrier to MJO propagation across the Maritime Continent, J. Adv. Model. Earth Syst., 15, e2022MS003503, https://doi.org/10.1029/2022MS003503, 2023.
Schott, F. A., Xie, S.-P., and McCreary, J. P.: Indian Ocean circulation and climate variability, Rev. Geophys., 47, RG1002, https://doi.org/10.1029/2007RG000245, 2009.
Skinner, D. T., Matthews, A. J., and Stevens, D. P.: Decadal variability of the extratropical response to the Madden–Julian Oscillation, Geophys. Res. Lett., 50, e2023GL104576, https://doi.org/10.1029/2023GL104576, 2023.
Son, S.-W., Lim, Y., Yoo, C., Hendon, H. H., and Kim, J.: Stratospheric control of the Madden–Julian Oscillation, J. Climate, 30, 1909–1922, https://doi.org/10.1175/JCLI-D-16-0620.1, 2017.
Stan, C., Zheng, C., Chang, E. K. M., Domeisen, D. I. V., Garfinkel, C. I., Jenney, A. M., Kim, H., Lim, Y., Lin, H., Robertson, A. W., Schwartz, C., Vitart, F., Wang, J., and Yadav, P.: Advances in the prediction of MJO teleconnections in the S2S forecast systems, B. Am. Meteorol. Soc., 103, E1426–E1447, https://doi.org/10.1175/BAMS-D-21-0130.1, 2022.
Sun, L., Wang, H., and Liu, F.: Combined effect of the QBO and ENSO on the MJO, Atmos. Ocean Sci. Lett., 12, 170–176, https://doi.org/10.1080/16742834.2019.1588064, 2019.
Takasuka, D., Kohyama, T., Suematsu, T., and Miura, H.: ENSO and QBO control the favorableness of the MJO realization cooperatively, J. Geophys. Res.-Atmos., 130, e2024JD042116, https://doi.org/10.1029/2024JD042116, 2025.
Trenberth, K. E.: The definition of El Niño, B. Am. Meteorol. Soc., 78, 2771–2777, https://doi.org/10.1175/1520-0477(1997)078<2771:TDOENO>2.0.CO;2, 1997.
Tseng, K.-C., Barnes, E. A., and Maloney, E. D.: Prediction of the midlatitude response to strong Madden-Julian oscillation events on S2S time scales, Geophys. Res. Lett., 45, 463–470, https://doi.org/10.1002/2017GL075734, 2018.
Vitart, F.: Madden–Julian Oscillation prediction and teleconnections in the S2S database, Q. J. Roy. Meteorol. Soc., 143, 2210–2220, https://doi.org/10.1002/qj.3079, 2017.
Vitart, F. and Robertson, A. W.: The sub-seasonal to seasonal prediction project (S2S) and the prediction of extreme events, npj Clim. Atmos. Sci., 1, 3, https://doi.org/10.1038/s41612-018-0013-0, 2018.
Wang, B. and Wang, T.: How the 1999 climate shift has changed MJO propagation diversity, J. Climate, 36, 3523–3535, https://doi.org/10.1175/JCLI-D-22-0749.1, 2023.
Wedd, R., Alves, O., de Burgh-Day, C., Down, C., Griffiths, M., Hendon, H. H., Hudson, D., Li, S., Lim, E. P., Marshall, A. G., and Shi, L.: ACCESS-S2: the upgraded Bureau of Meteorology multi-week to seasonal prediction system, J. S. Hemisph. Earth Syst. Sci., 72, 213–233, https://doi.org/10.1071/ES22026, 2022.
Wei, Y. and Ren, H.-L.: Modulation of ENSO on fast and slow MJO modes during boreal winter, J. Climate, 32, 7483–7506, https://doi.org/10.1175/JCLI-D-19-0013.1, 2019.
Wheeler, M. C. and Hendon, H. H.: An all-season real-time multivariate MJO index: Development of an index for monitoring and prediction, Mon. Weather Rev., 132, 1917–1932, https://doi.org/10.1175/1520-0493(2004)132<1917:AARMMI>2.0.CO;2, 2004.
Wille, J. D., Alexander, S. P., Amory, C., Baiman, R., Barthélemy, L., Bergstrom, D. M., Berne, A., Binder, H., Blanchet, J., Bozkurt, D., Bracegirdle, T. J., Casado, M., Choi, T., Clem, K. R., Codron, F., Datta, R., Di Battista, S., Favier, V., Francis, D., Fraser, A. D., Fourré, E., Garreaud, R. D., Genthon, C., Gorodetskaya, I. V., González-Herrero, S., Heinrich, V. J., Hubert, G., Joos, H., Kim, S., King, J. C., Kittel, C., Landais, A., Lazzara, M., Leonard, G. H., Lieser, J. L., Maclennan, M., Mikolajczyk, D., Neff, P., Ollivier, I., Picard, G., Pohl, B., Ralph, F. M., Rowe, P., Schlosser, E., Shields, C. A., Smith, I. J., Sprenger, M., Trusel, L., Udy, D., Vance, T., Vignon, É., Walker, C., Wever, N., and Zou, X.: The extraordinary March 2022 East Antarctica “Heat” Wave. Part I: Observations and meteorological drivers, J. Climate, 37, 757–778, https://doi.org/10.1175/JCLI-D-23-0175.1, 2024.
Wilson, E. A., Gordon, A. L., and Kim, D.: Observations of the Madden Julian Oscillation during Indian Ocean Dipole events, J. Geophys. Res.-Atmos., 118, 2588–2599, https://doi.org/10.1002/jgrd.50241, 2013.
Wu, J., Ren, H.-L., Jia, X., and Zhang, P.: Climatological diagnostics and subseasonal-to-seasonal predictions of Madden–Julian Oscillation events, Int. J. Climatol., 43, 2449–2464, https://doi.org/10.1002/joc.7984, 2023.
Xie, S.-P., Hu, K., Hafner, J., Tokinaga, H., Du, Y., Huang, G., and Sampe, T.: Indian Ocean capacitor effect on Indo–Western Pacific climate during the summer following El Niño, J. Climate, 22, 730–747, https://doi.org/10.1175/2008JCLI2544.1, 2009.
Zavadoff, B. L., Gao, K., Lopez, H., Lee, S.-K., Kim, D., and Harris, L. M.: Improved MJO forecasts using the experimental global-nested GFDL SHiELD model, Geophys. Res. Lett., 50, e2022GL101622, https://doi.org/10.1029/2022GL101622, 2023.
Zhang, C.: Madden–Julian Oscillation: Bridging weather and climate, B. Am. Meteorol. Soc., 94, 1849–1870, https://doi.org/10.1175/BAMS-D-12-00026.1, 2013.
Zhang, C. and Ling, J.: Barrier effect of the Indo-Pacific Maritime continent on the MJO: Perspectives from tracking MJO precipitation, J. Climate, 30, 3439–3459, https://doi.org/10.1175/JCLI-D-16-0614.1, 2017.
Zhao, M., Hendon, H. H., Alves, O., Liu, G., and Wang, G.: Weakened Eastern Pacific El Niño predictability in the early twenty-first century, J. Climate, 29, 6805–6822, https://doi.org/10.1175/JCLI-D-15-0876.1, 2016.
Zhou, X., Wang, L., Hsu, P., Li, T., and Xiang, B.: Understanding the factors controlling MJO prediction skill across events, J. Climate, 37, 5323–5336, https://doi.org/10.1175/JCLI-D-23-0635.1, 2024.
Zhu, H. and Hendon, H. H.: Role of large-scale moisture advection for simulation of the MJO with increased entrainment, Q. J. Roy. Meteorol. Soc., 141, 2127–2136, https://doi.org/10.1002/qj.2510, 2015.
Zu, Y., Sun, S., Fang, Y., Liu, L., Gao, L., Guo, G., and Li, J.: Weakening of La Niña impact on negative Indian Ocean Dipole under global warming, Geophys. Res. Lett., 51, e2024GL110039, https://doi.org/10.1029/2024GL110039, 2024.