the Creative Commons Attribution 4.0 License.
the Creative Commons Attribution 4.0 License.
 | 22 Jan 2026
Assimilating WIVERN windpseudo-observations in WRF model: an application to the outstanding case of the Medicane Ianos
Rosa Claudia Torcasio
Claudio Transerici
Mario Montopoli
Cinzia Cambiotti
Francesco Manconi
Alessandro Battaglia
Maryam Pourshamsi
Accurate weather forecasts are important to our daily lives. Wind, cloud and precipitation are key drivers of the Earth's water and energy cycles, and they can also pose weather-related threats, making the task of numerical weather prediction (NWP) models particularly challenging and important.
The Wind Velocity Radar Nephoscope (WIVERN) mission will be the first space-based mission to provide global vertical profiles of winds within clouds, and to deliver simultaneous observations of winds, clouds, and precipitation with unprecedented resolution and coverage. The mission has been selected as the European Space Agency's (ESA) Earth Explorer 11 within the Future Earth Observation (FutureEO) programme. Its data could be beneficial to several sectors: improving our knowledge of weather phenomena, validate climate statistics, and enhancing NWP performance. This paper aims to contribute to the last point by analyzing the impact of assimilating WIVERN Line of Sight (LoS) winds on NWP performance for the high-impact case study of Medicane Ianos, which occurred between 15 and 21 September 2020 in the central Mediterranean and made landfall on the west coast of Greece.
To this end, we generate WIVERN pseudo-observations, that are assimilated in the Weather Research and Forecasting (WRF) model run at moderate horizontal resolution (4 km).
Results show that assimilating WIVERN into the WRF model has a positive impact on the prediction of the Medicane trajectory. Specifically, assimilating WIVERN just once reduces the trajectory forecast error by about 40 %. The data assimilation of WIVERN pseudo-observations affects not only the storm's trajectory but also its physical characteristics. It is also shown that the assimilation improves the prediction of precipitation and surface winds, and has the potential to improve our resilience to severe weather events by enabling better forecasts of storm impacts. Finally, we present the results of two sensitivity experiments in which the background and observation errors were changed. The results show greater sensitivity to changes in the background error matrix.
- Article
(11310 KB) - Full-text XML
- BibTeX
- EndNote


Numerical weather prediction (NWP) is an initial and boundary condition problem, and its performance depends, among other factors, on an accurate representation of the initial atmospheric state. The purpose of data assimilation (DA, Kalnay et al., 2024) is to find a model state that provides the best match between the most recent model prediction and the available observations. This model state, called the analysis, can then be used to start a new model forecast with improved initial conditions.
In-cloud winds and, more in general, winds are key to understanding cloud and storm processes and the coupling between water, heat, and atmospheric circulation, yet they remain one of the major gaps in the Global Observing System (GOS) (Baker et al., 2014). Indeed, wind observations are sparse and unevenly distributed, especially in cloudy regions, on the mesoscale, and in the vertical dimension. Given the importance of wind observations, the following, two specific recommendations were made to Space Agencies at the 7th World Meteorological Organisation (WMO) workshop on “The impact of Various Observing Systems on NWP” (WMO, 2020): (a) Space Agencies are encouraged to continue pursuing wind profile measurements from space; (b) effort is encouraged to assess complementary/synergies between different wind measurement systems/technologies (e.g. Aeolus and Atmospheric Motion Vectors). As winds are lacking observations, usually they show an important impact on the NWP forecast when assimilated (Horányi et al., 2015; Li et al., 2023; Rennie et al., 2021).
Between 2018 and 2023, the European Space Agency (ESA)'s Aeolus satellite provided wind observations along the Horizontal Line of Sight (HLoS) through atmospheric columns in optically thin clouds and clear sky, using a Doppler Wind Lidar (Illingworth et al., 2015). The positive impact of Aeolus data assimilation in NWP models has been demonstrated by major meteorological centers (Rani et al., 2022; Garrett et al., 2022; Martin et al., 2023; Rennie et al., 2021). Aeolus observations have also been assimilated in limited-area NWP models, showing, albeit to a lesser extent compared to global models, a positive impact (Stathopoulos et al., 2023; Matsangouras et al., 2023; Hagelin et al., 2021; Feng and Pu, 2023).
The WInd VElocity Radar Nephoscope (WIVERN) (Illingworth et al., 2018; Battaglia et al., 2022; Tridon et al., 2023) has been recommended to be launched for the 11th Earth Explorer mission. Earth Explorer missions are proposed by the scientific community to demonstrate how breakthrough technology can deliver an astounding range of scientific findings about our planet. As reported in the ESA Earth Explorer missions web page (https://www.esa.int/Enabling_Support/Operations/Earth_Explorers, last access: 12 January 2026), these missions focus on the atmosphere, biosphere, hydrosphere, cryosphere and Earth's interior with an overall emphasis on learning more about the interactions between these systems and the impact that human activity is having on Earth's natural processes. WIVERN, will carry a 94 GHz radar with a conically scanning 800 km swath. It will provide, for the first time, profiles of in-cloud winds and precipitation on a global scale, with a revisit time of 1.5 d at the equator. The implications of this unprecedented sampling capability have been recently discussed in Tridon et al. (2023) and Scarsi et al. (2025). WIVERN measurements will have a vertical resolution of approximately 600 m and an instantaneous footprint of less than 1 × 1 km2 (Illingworth et al., 2018). Wind measurements will then be averaged along the scanning direction over 5 km or more to reduce measurement noise. WIVERN will make a bridge between the synoptic scale and the mesoscale thanks to the wide swath and the high spatial resolution. In addition, WIVERN can play a synergistic role with Aeolus as the latter samples the winds in clear sky, while WIVERN will sample in-cloud winds. Although the Aeolus mission is over, the Eumetsat Polar Satellite Aeolus (https://www.eumetsat.int/eps-aeolus, last access: 12 January 2026), built on the success of the Aeolus mission, will fly with WIVERN making the synergy possible.
This is the first paper dedicated to the specific task of evaluating the impact of assimilating WIVERN in-cloud winds in the Weather Research and Forecasting (WRF) Limited Area Model (LAM) (Skamarock et al., 2019). The impact of WIVERN in-cloud winds data assimilation in the global model Action de Recherche Petite Echelle Grande Echelle (ARPEGE) has been studied in Sasso et al. (2025).
To assess robustly the impact of WIVERN wind DA on WRF forecasts, we use an Ensemble three-Dimensional Variational data assimilation (En3DVar) approach. In this approach the model error is computed (or partially computed depending if a hybrid approach is used) from the ensemble members and the model error is aware of the meteorological conditions of the day. Hamill and Snyder (2000) were the first to propose a 3DVar-based hybrid scheme in which the static background error covariance (BEC) in a 3DVar system was replaced by a linear combination of the static and ensemble-derived BEC. They also found that the analysis performs the best when BEC is estimated almost fully from the ensemble when the ensemble size was large (100 in their case). When the ensemble is smaller, the system benefits from a lesser weighting given to the ensemble-based covariances. The good performance of En3DVar data assimilation systems was studied and reported in several other studies (Zhang et al., 2013; Lorenc et al., 2015; Li et al., 2012; Pan et al., 2014; Wang et al., 2009, for example).
In contrast, in the classical 3DVar approach, a static climatological background error covariance matrix is used, usually computed for a period which is representative of the period of interest. In a sensitivity test considered in this paper, the results of the En3DVar approach are compared with the classical 3DVar to show the impact of using a background error matrix representative of error of the day compared to a background error matrix computed from the climatology.
To study the impact of WIVERN in-cloud winds data assimilation in the WRF model we selected a storm in the Mediterranean, that has long been described as a global cyclogenesis hotspot and one of the most sensitive regions in terms of global warming (Giorgi and Lionello, 2008). Mediterranean cyclones are key features of the region's climate and water cycle (Flaounas et al., 2022; Ali et al., 2023) and they have an important societal and economic impact. These cyclones are driven by the large-scale extra-tropical circulation and Rossby wave breaking, and they involve contributions from both dry dynamic and moist diabatic forcings (Flaounas et al., 2021; Raveh-Rubin and Wernli, 2016; D’Adderio et al., 2022; Lfarh et al., 2023). Among Mediterranean cyclones, a special class, known as Medicanes (Mediterranean Hurricanes, Emanuel, 2005; Miglietta et al., 2025), has attracted considerable attention of both the scientific community and the public. For the broader public, these storms are important due to their high destructive power. From a scientific point of view, they are of interest because they show tropical characteristics such as a symmetric structure, a cloud-free centre resembling an eye, and a warm core extending at least partially through the troposphere (D’Adderio et al., 2022; Di Francesca et al., 2025). There are many studies on Medicanes (Fita and Flaounas, 2018; Miglietta and Rotunno, 2019; Dafis et al., 2020; just to cite a few), that examine the physical characteristics of these storms and the key role of deep convection in the formation of the deep warm core. Among this type of storm, we selected Medicane Ianos as case study for two main reasons: (a) it was among the most intense Medicanes (Lagouvardos et al., 2022; D’Adderio et al., 2022); (b) it was used in several studies investigating various aspects of the storm, including the impact of the sea surface temperature on storm evolution (Varlas et al., 2023) and diabatic forcing and storm surge impact (Sánchez et al., 2024; Ferrarin et al., 2023; Androulidakis et al., 2023). Moreover, the performance of different NWP model settings, including the influence of convective parameterization and microphysical characteristics were studied for this Medicane (Saraceni et al., 2023; Comellas Prat et al., 2021).
Recently, Pantillon et al. (2024) published a model inter-comparison of Medicane Ianos simulations, as part of the COST Initiative CA19109 “MedCyclones: European Network for Mediterranean Cyclones in weather and climate”. They compared 10 different modeling systems, including different WRF model configurations, for storm track prediction. The study highlighted the importance of explicitly resolving convection in the simulation of the storm, which plays a fundamental role for accurately simulating cyclone track and storm deepening. The authors also found a spread among the ensemble members, with most models predicting a storm track shifted southward compared to the best a posteriori estimate (Flaounas et al., 2023). WRF was among these models. In this paper, as in Pantillon et al. (2024), we use storm track as a primary metric to study the impact of WIVERN winds DA in the WRF model.
Although the study uses the WRF model as meteorological driver, it can be useful to a much wider community of NWP users as WIVERN observations are completely new and have a great potential to impact the quality of the NWP forecast; indeed not only we lack winds observations compared to other data (Horányi et al., 2015; Sasso et al., 2025) and WIVERN will help to solve this issue, but WIVERN will take its observations within clouds, i.e. within features whose prediction plays a major role in weather forecast.
The paper is organized as follows. Section 2 presents the WRF model configuration, the ensemble framework, and the methodology used to generate pseudo-observations for the case study. Section 3 shows the results of WIVERN winds data assimilation on prediction of the Medicane Ianos trajectory and other storm parameters, as well as its impact on rainfall and surface wind prediction. This section also includes two sensitivity tests on the choice of background and observation error matrices. In Sect. 3 we also investigate the potential of WIVERN winds DA for a forecast initialized when Ianos, yet in a mature phase, was far from the landfall. Conclusions are provided in Sect. 4. Appendix A gives further details on the assimilation of WIVERN winds in the En3Dvar approach used in this paper.
2.1 WRF model settings
In this work, we use the WRF model V4.1 with 400 grid points in both the west-east and south-north directions, and 55 vertical levels extending from the surface to 50 hPa (Skamarock et al., 2019). The model horizontal grid resolution is 4 km, and the domain covers the Central Mediterranean basin. The center of the domain is located at (15° E, 40° N) (see Fig. 1). The physical parameterisation used in the model include the Thompson microphysics scheme (Thompson et al., 2008), the Mellor–Yamada–Janjic turbulent kinetic energy boundary layer scheme (Janjić, 1994), the Dudhia scheme for shortwave radiative transfer (Dudhia, 1989), and the Rapid Radiative Transfer Model (RRTM) for longwave radiation (Mlawer et al., 1997). Convection is assumed explicitly resolved and no cumulus parameterization is activated. The setting of the WRF model outlined above is the result of a compromise between the quality of the results and the computational resources. Comellas Prat et al. (2021), in a comparative study using different settings of the WRF model for the simulation of the Medicane Ianos, showed that a setting similar to that used in this paper gave the best result. In addition, the results of this model setting is well in line with the results of Pantillon et al. (2024), who used several NWP models, including WRF, to simulate the evolution of Ianos.
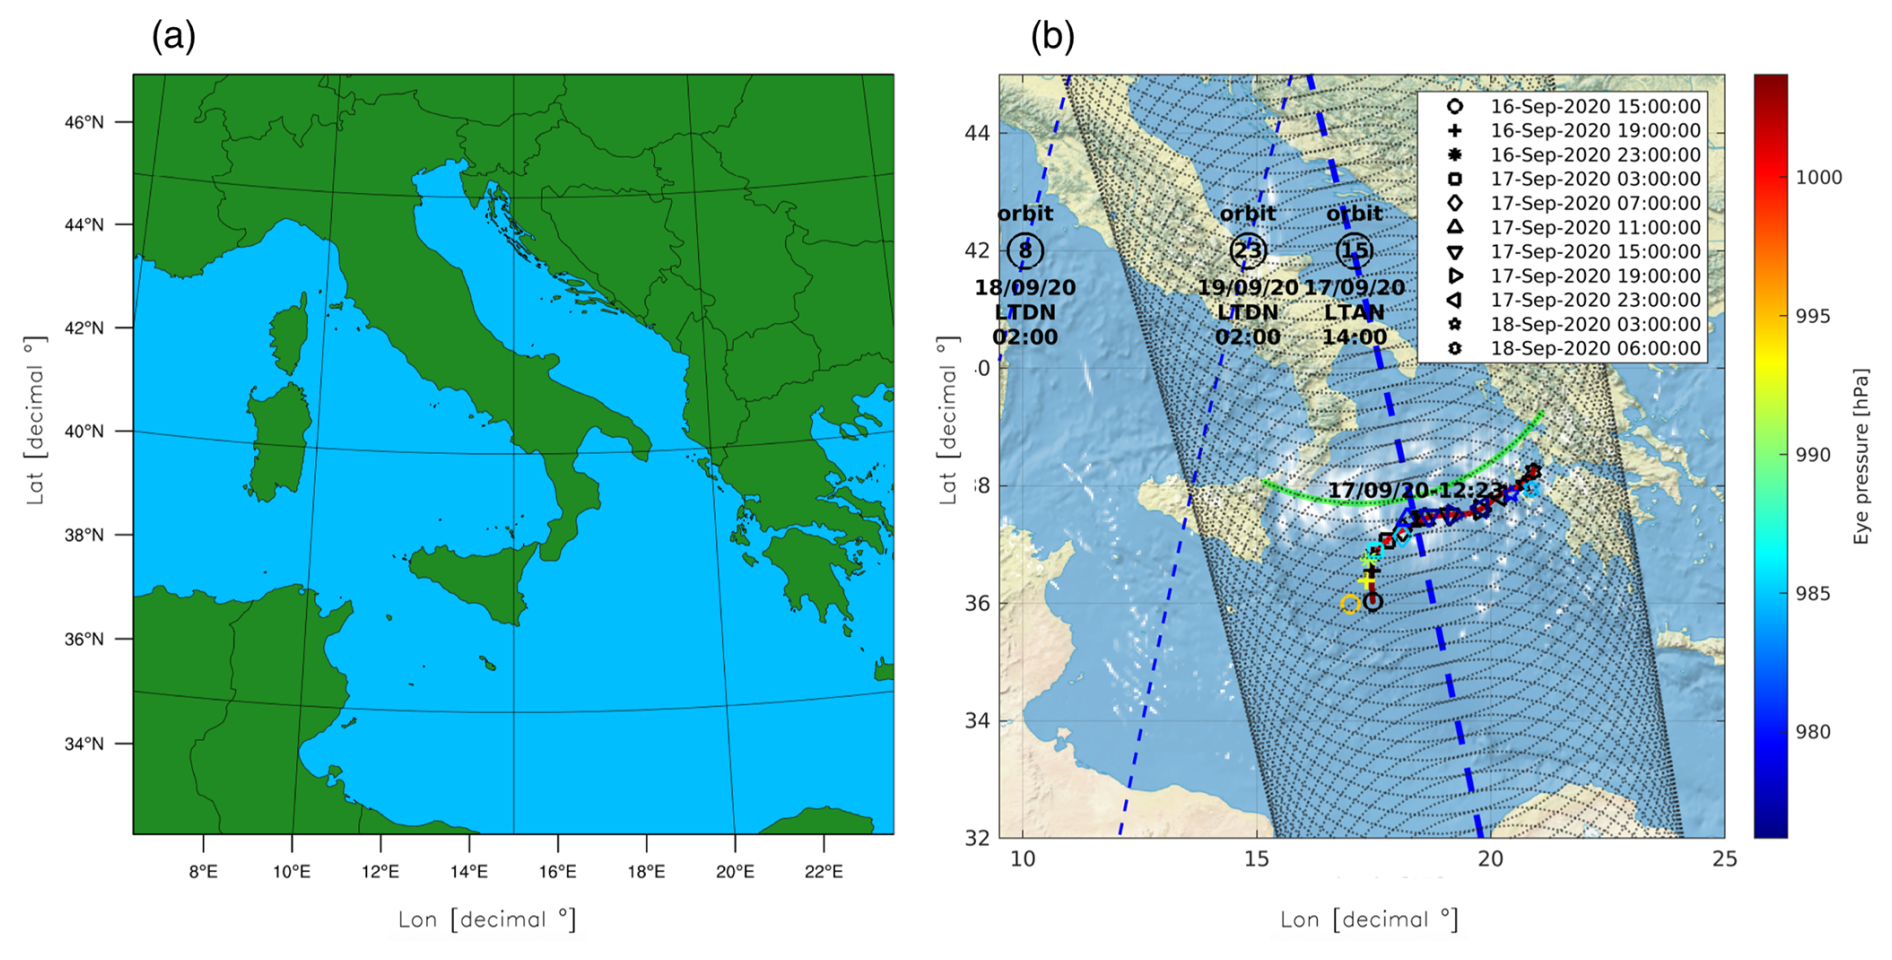
Figure 1(a) WRF domain; (b) WIVERN track for the Medicane Ianos. The a posteriori best estimated trajectory is shown by the red-line, the representative member trajectory is shown by symbols. The time range of the trajectories is indicated in the legend. The surface pressure along the track is shown by the color (both line and marks). The WIVERN sub-satellite point is represented by the blue dashed line, while the radar conical scan is shown by the gray dashed line, showing the 800 km wide swath. Times are indicated in local time (UTC+2 h) ascending/descending node. The passages of WIVERN over the area would have occurred at 00:00 UTC on 18 and 19 September 2020 and at 12:00 UTC on 17 September 2020, however, only the 12:00 UTC observations would have sampled Ianos at about the center of the scene.
The different members of the WRF ensemble are generated taking initial and boundary conditions (IC/BC) from the European Centre for Medium-range Weather Forecast – Ensemble Prediction System (ECMWF-EPS) of the Integrated Forecasting System (IFS) run issued at 12:00 UTC on 15 or 16 September 2020, depending on the numerical experiment considered. The ECMWF-EPS consists of one unperturbed (control) member and 50 perturbed members, resulting in a total of 51 WRF runs nested within the ECMWF-EPS initial and boundary conditions. As a result of this setting the WRF ensemble has 51 members and each member of the WRF ensemble is numerated following the ECMWF-EPS member that initialized WRF. The spatial horizontal grid resolution of the ECMWF-EPS for the Medicane Ianos is about 18 km.
2.2 Methodology
In the following we refer to the numerical experiment starting at 12:00 UTC on 16 September 2020, initialized from ECMWF-EPS analysis/forecast cycle issued at the same time (see Fig. 2 for a schematic of the simulations discussed in this paper). Other experiments, starting at different times are discussed in Sect. 3.4.
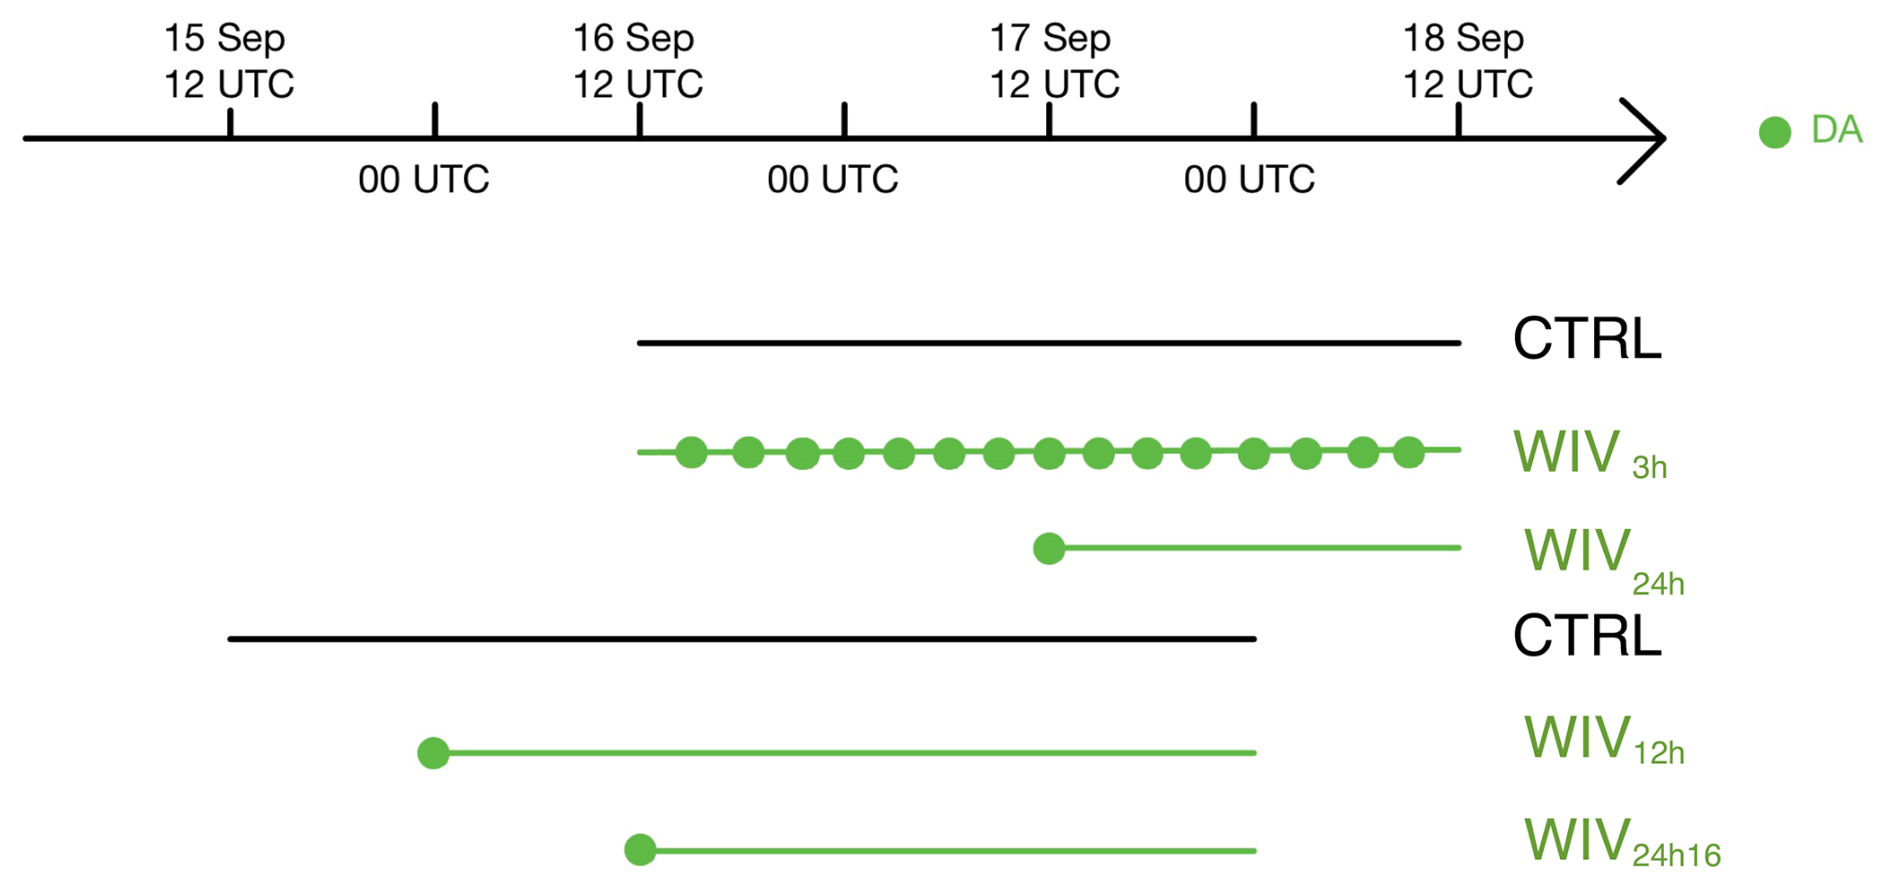
Figure 2Schematic of simulations considered in this paper. The black lines are the CTRL forecast starting at 12:00 UTC on 15 and 16 September. Green lines correspond to experiments with WIVERN winds DA. Each dot shows the assimilation time. WIVERN pseudo-observations are produced in correspondence of the assimilation time. No other observations are assimilated.
Two different data assimilation experiments are considered: a 3-hourly cycle and a 24-hourly cycle. In the 3-hourly cycle, referred to as WIV3h, WIVERN winds along the LoS are assimilated every 3 h for 48 h. Although WIVERN would have sampled Ianos less frequently, this 3 h experiment is used to assess the effectiveness of WIVERN wind data assimilation under idealized conditions, assuming the satellite operates in a constellation formation. In addition, the WIV3h experiment will be used to show some characteristics of the data assimilation. Hereafter, “WIVERN winds DA” refers to the assimilation of WIVERN in-cloud winds measured along the line of sight.
In the 24-hourly cycle, referred to as WIV24h, a single assimilation of WIVERN winds is performed at 12:00 UTC on 17 September, when Ianos was already fully developed. Finally, a control ensemble, CTRL, starting at 12:00 UTC on 16 September 2020 and running for 2 d, is included as reference. This ensemble is run without any data assimilation (no other data are assimilated in the experiments considered in this paper, except WIVERN winds), using only different initial and boundary conditions derived from the ECMWF-EPS.
For data assimilation, we use the 3DVar developed by Federico (2013), based on the work of Barker et al. (2004) (see also Torcasio et al., 2024 for recent developments of the 3DVar software). For both WIV3h and WIV24h the background error covariance matrix is computed from the CTRL ensemble members at 12:00 UTC on 17 September 2020 by:
where Nens is the number of ensemble members and is the ensemble average. Further details about the background error matrix and its implementation in the 3DVar are given in Appendix A. For a complete reference, the reader is referred to Federico (2013) and Barker et al. (2004). The date of the 12:00 UTC on 17 September was used to compute the background covariance error matrix for two main reasons: (a) the WRF forecast is far enough from the initialization time and the model has developed its own dynamic and thermodynamics characteristics; (b) the spread of the ensemble is similar to that of Pantillon et al. (2024) at the same time, and the results of this paper can be representative of more general conditions, using an ensemble of different models.
To evaluate the impact of WIVERN Doppler data assimilation on the WRF forecast, we adopted the following steps:
-
First, we generated an ensemble of the WRF model nested in the ECMWF-EPS of the IFS, starting at 12:00 UTC on 16 September 2020 (CTRL ensemble).
-
From the CTRL ensemble, we selected a representative (best) member, which is the one whose simulated storm track is in closest agreement with the best a posteriori estimate of Ianos' trajectory provided by Flaounas et al. (2023). We used the storm track only to define the representative member as the pressure of the best a posteriori estimated trajectory remains too high (> 1000 hPa), compared to the observations from the Palliki meteorological station on Kefalonia island, which recorded a minimum pressure of 984 hPa (at 05:00 UTC on 18 September).
-
We then generated pseudo-observations of WIVERN winds using the forward operator developed by Battaglia et al. (2024) (see also Battaglia et al., 2022). The simulator was applied to the output of the representative member and WIVERN pseudo-observations are generated every 3 h, from 15:00 UTC on 16 September to 09:00 UTC on 18 September, from this member. These pseudo-observations consist of WIVERN winds along the LoS.
2.3 Representative member choice
Figure 3 shows the 51 trajectories of the CTRL ensemble. Each trajectory is defined by tracking the position of minimum sea-level pressure around the area of the Medicane. The model output is saved every 1 h and two consecutive sea-level pressure minima are connected by a segment. The color bar corresponds to the colors of the segments and indicates the pressure at the initial point of each segment. The dots, plotted every 3 h for clarity, correspond to the position of the cyclone at different times (there are three segments between two dots). As expected, the trajectories are initially close to each other, but diverge with time, due to the amplification of small differences in the initial conditions by the evolving atmospheric flow. This is confirmed by the spread of the ensemble, which steadily increases from 23.2 km at 00:00 UTC on 17 September to 60.4 km at 06:00 UTC on 18 September. The red line in Fig. 3 shows the best a posteriori estimated trajectory. According to this trajectory, Medicane Ianos made landfall between the islands of Zakynthos and Kefalonia (Lagouvardos et al., 2022; Flaounas et al., 2023). As stated in Sect. 2.2 the minimum surface pressure of the best estimated trajectory remains too high compared to observations. This discrepancy is because the reference trajectory is derived from the ERA5 reanalyses, whose horizontal resolution (30 km) smears out the minimum pressure at the center of the storm. This is confirmed by the fact that the ECMWF-IFS operational analysis, having a higher horizontal resolution (9 km), is about 10 hPa lower than the ERA5 reanalysis. Therefore, we only considered the trajectory, i.e. the position of the surface minimum pressure, and not the sea level pressure values, when comparing the WRF ensemble trajectories of the Medicane Ianos with the reference trajectory.
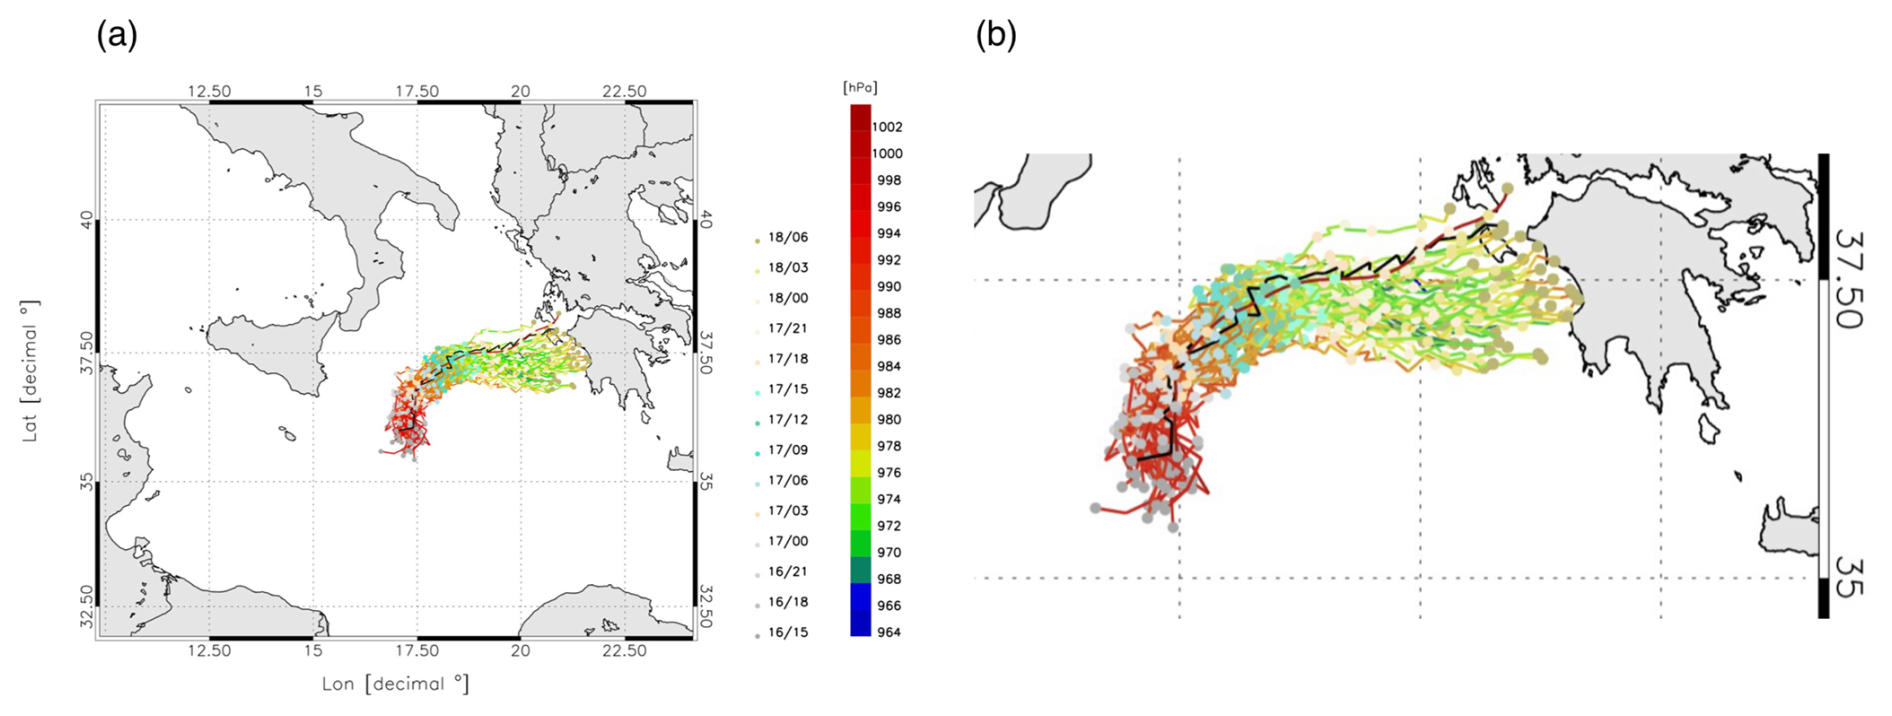
Figure 3(a) Trajectories followed by the ensemble members of the WRF CTRL ensemble. The black trajectory is the member 42; (b) zoom over the trajectories.
As shown in Fig. 3, most simulated trajectories are displaced to the south of the best a posteriori estimated trajectory. This result is in agreement with that of Pantillon et al. (2024), showing that the forecast of the Ianos trajectory of several meteorological models, including WRF, is to the south of the best estimated trajectory.
The representative member of the WRF ensemble was selected by minimizing the average distance between the members and the best estimated trajectory. This average distance is calculated as:
where rm and rbe are the position vectors of the minimum sea-level pressure of the mth ensemble member and the best estimated trajectory, respectively, at time t. The distance of the whole ensemble from the best estimated trajectory () is given by averaging dbe,m over all ensemble members M and forecast times T. The trajectory error was computed over the period from 15:00 UTC on 16 September 2020 to 06:00 UTC on 18 September 2020, based on the hourly WRF output. This time range was chosen considering two requirements: (a) the simulation starts at 12:00 UTC on 16 September, and the minimum pressure at this initial time is determined by the ECMWF-EPS initialisation rather than by the WRF evolution; (b) after 06:00 UTC on 18 September, many ensemble members made their landfall. To simplify the analysis, we consider the trajectory of the Ianos evolution over the Ionian Sea.
The distances between each member of the CTRL ensemble and best estimated trajectory from Flaounas et al. (2023) were computed. The smallest distance, 30.0 km, is achieved by member 42, while the largest, 101.2 km, is achieved by member 11. The trajectory of member 42 is shown in black in Fig. 3. It is apparent that this member follows well the best estimated trajectory of Ianos. According to the result of Fig. 3, member 42 is chosen as the representative member and is used to generate pseudo-observations of the Medicane Ianos, as if it would have been observed by WIVERN. From now on, the member 42 represents our truth, i.e. the simulation to reproduce after applying WIVERN winds DA to other ensemble members.
2.4 WIVERN pseudo-observations
WIVERN has a conically scanning geometry with the antenna pointing at 41° off nadir. The antenna does 12 rpm and the winds along the LoS are a combination of the zonal, meridional and vertical wind components. The winds along the LoS are given by:
where θ is the angle between the WIVERN antenna and the vertical direction (41°), ϕ is the azimuth, and U, V, W are the zonal, meridional and vertical wind components. Assimilation is done in stratiform areas where W is negligible. Stratiform areas are simply identified by the presence of a radar echo above a minimum threshold (−15 dBz), as the attenuation of the radar signal in deep convective areas prevents the return of the echo from these areas (see below). In addition, for the setting of the WIVERN simulator used in this paper, we are considering observations averaged over a volumes of 5 by 5 km2 in the horizontal and 500 m thickness in the vertical direction and it is not common to have W velocities comparable to U and V velocities on these large volumes. Finally, there could be occurrences where/when we assimilated the WIVERN winds in volumes where W is not negligible compared to U and V, nevertheless we assumed W negligible. For stratiform areas, the WIVERN winds along the LoS are given by:
Pseudo-observations generated applying the WIVERN simulator to the representative member 42 scene at 12:00 UTC on 17 September 2020 are shown in Fig. 4 for three different vertical levels. Figure 4 displays also the position of the Ianos minimum sea level pressure, which is well inside the WIVERN swath, showing that the storm is well sampled. The value of the pseudo-observation is the component of the wind in the direction where the antenna is pointing. As shown by Eq. (6), the wind component along the LoS are dependent on the azimuth and on the angle between the radar antenna and the vertical direction (41°) and they do not have a straightforward physical interpretation.
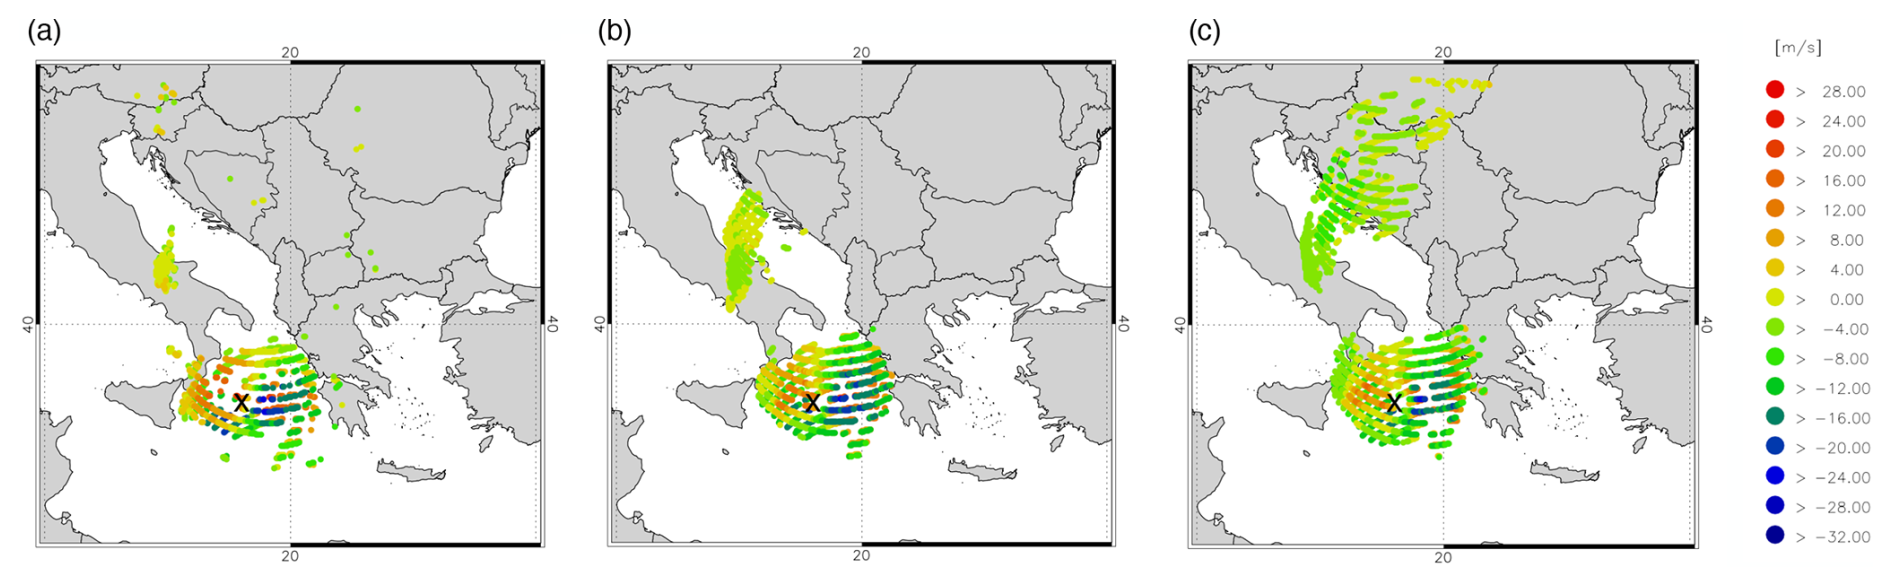
Figure 4WIVERN pseudo-observations at (a) 2, (b) 5 and (c) 7 km. Each dot represents a pseudo-observation at the specific azimuth. The position of the minimum sea level pressure is approximately indicated by a black cross. The number of pseudo-observations are 1078 at 2 km, 1821 at 5 km and 2797 at 7 km. All the panels are at 12:00 UTC on 17 September 2020.
As shown in Fig. 4, Ianos is well sampled by WIVERN at 12:00 UTC on 17 September. However, WIV3h simulation uses WIVERN pseudo-observations from 15:00 UTC on 16 September to 09:00 UTC on 18 September every 3 h. Figure 1b shows that the Ianos center is well inside the WIVERN swath for most of the times, so we can infer that the storm is well sampled. However, as Ianos approaches the land, its center is closer to the WIVERN swath edge and the sampling of Ianos becomes suboptimal.
The observation error , decreases with increasing signal to noise ratio, as discussed in Battaglia et al. (2025). For WIVERN winds along the LoS, the observation error is given by:
where λ = 3 mm is the radar wavelength, THV = 20 µs is the separation between the two polarized pulses H and V, N = 40 is the number of pulse pairs, σv = 4 m s−1 is the Doppler spectral width, vNyq is the Nyquist velocity, and Zmin = −15 dBZ. With these settings, WIVERN pseudo-observations are generated at 5 km horizontal resolution. The does not take into account errors like non uniform beam filling, wind shear, and mispointing errors (Scarsi et al., 2024). These errors are expected to be lower than 1 m s−1 (Battaglia et al., 2022; Tridon et al., 2023; Battaglia et al., 2026). However, to account for these errors the corrected observation error is:
with c1 = 1 m s−1. In summary, the error associated to each pseudo-observation is given by Eq. (8) and is a function of the signal-to-noise ratio, which is a function of the reflectivity. The observation error covariance matrix is diagonal, i.e. that observation errors are assumed uncorrelated. However, observation errors are correlated and their correlation decreases with the distance among the observations (Bennit et al., 2017; Torcasio et al., 2023). In this paper, pseudo-observations are generated at 5 km horizontal resolution, nevertheless they are thinned to 10 km distance to partially account for assuming a diagonal observation error covariance matrix.
In WIVERN simulator the winds along the LoS are generated starting from the WRF wind components of the member 42 and applying Eq. (6). The noise is added to the observation through Eq. (8), which depends on the signal-to-noise ratio. To have wind pseudo-observations along the LoS, a minimum reflectivity of −15 dBZ must be observed. The reflectivity is computed from the distribution of the WRF hydrometeors simulated by member 42. It follows that pseudo-observations are not generated if clouds are optically too thin or, as the simulator accounts for the radar signal attenuation, if the radar beam is attenuated, as in deep convective areas. Figure 5a, shows the number of pseudo-observations available at different vertical levels at 12:00 UTC on 17 September, which is particularly important as it is the time when WIVERN winds are assimilated in WRF for WIV24h experiment. The largest number of observation is at 7 km height and decreases at higher levels due to the reduced optical thickness of clouds, and at lower levels due to radar signal attenuation.
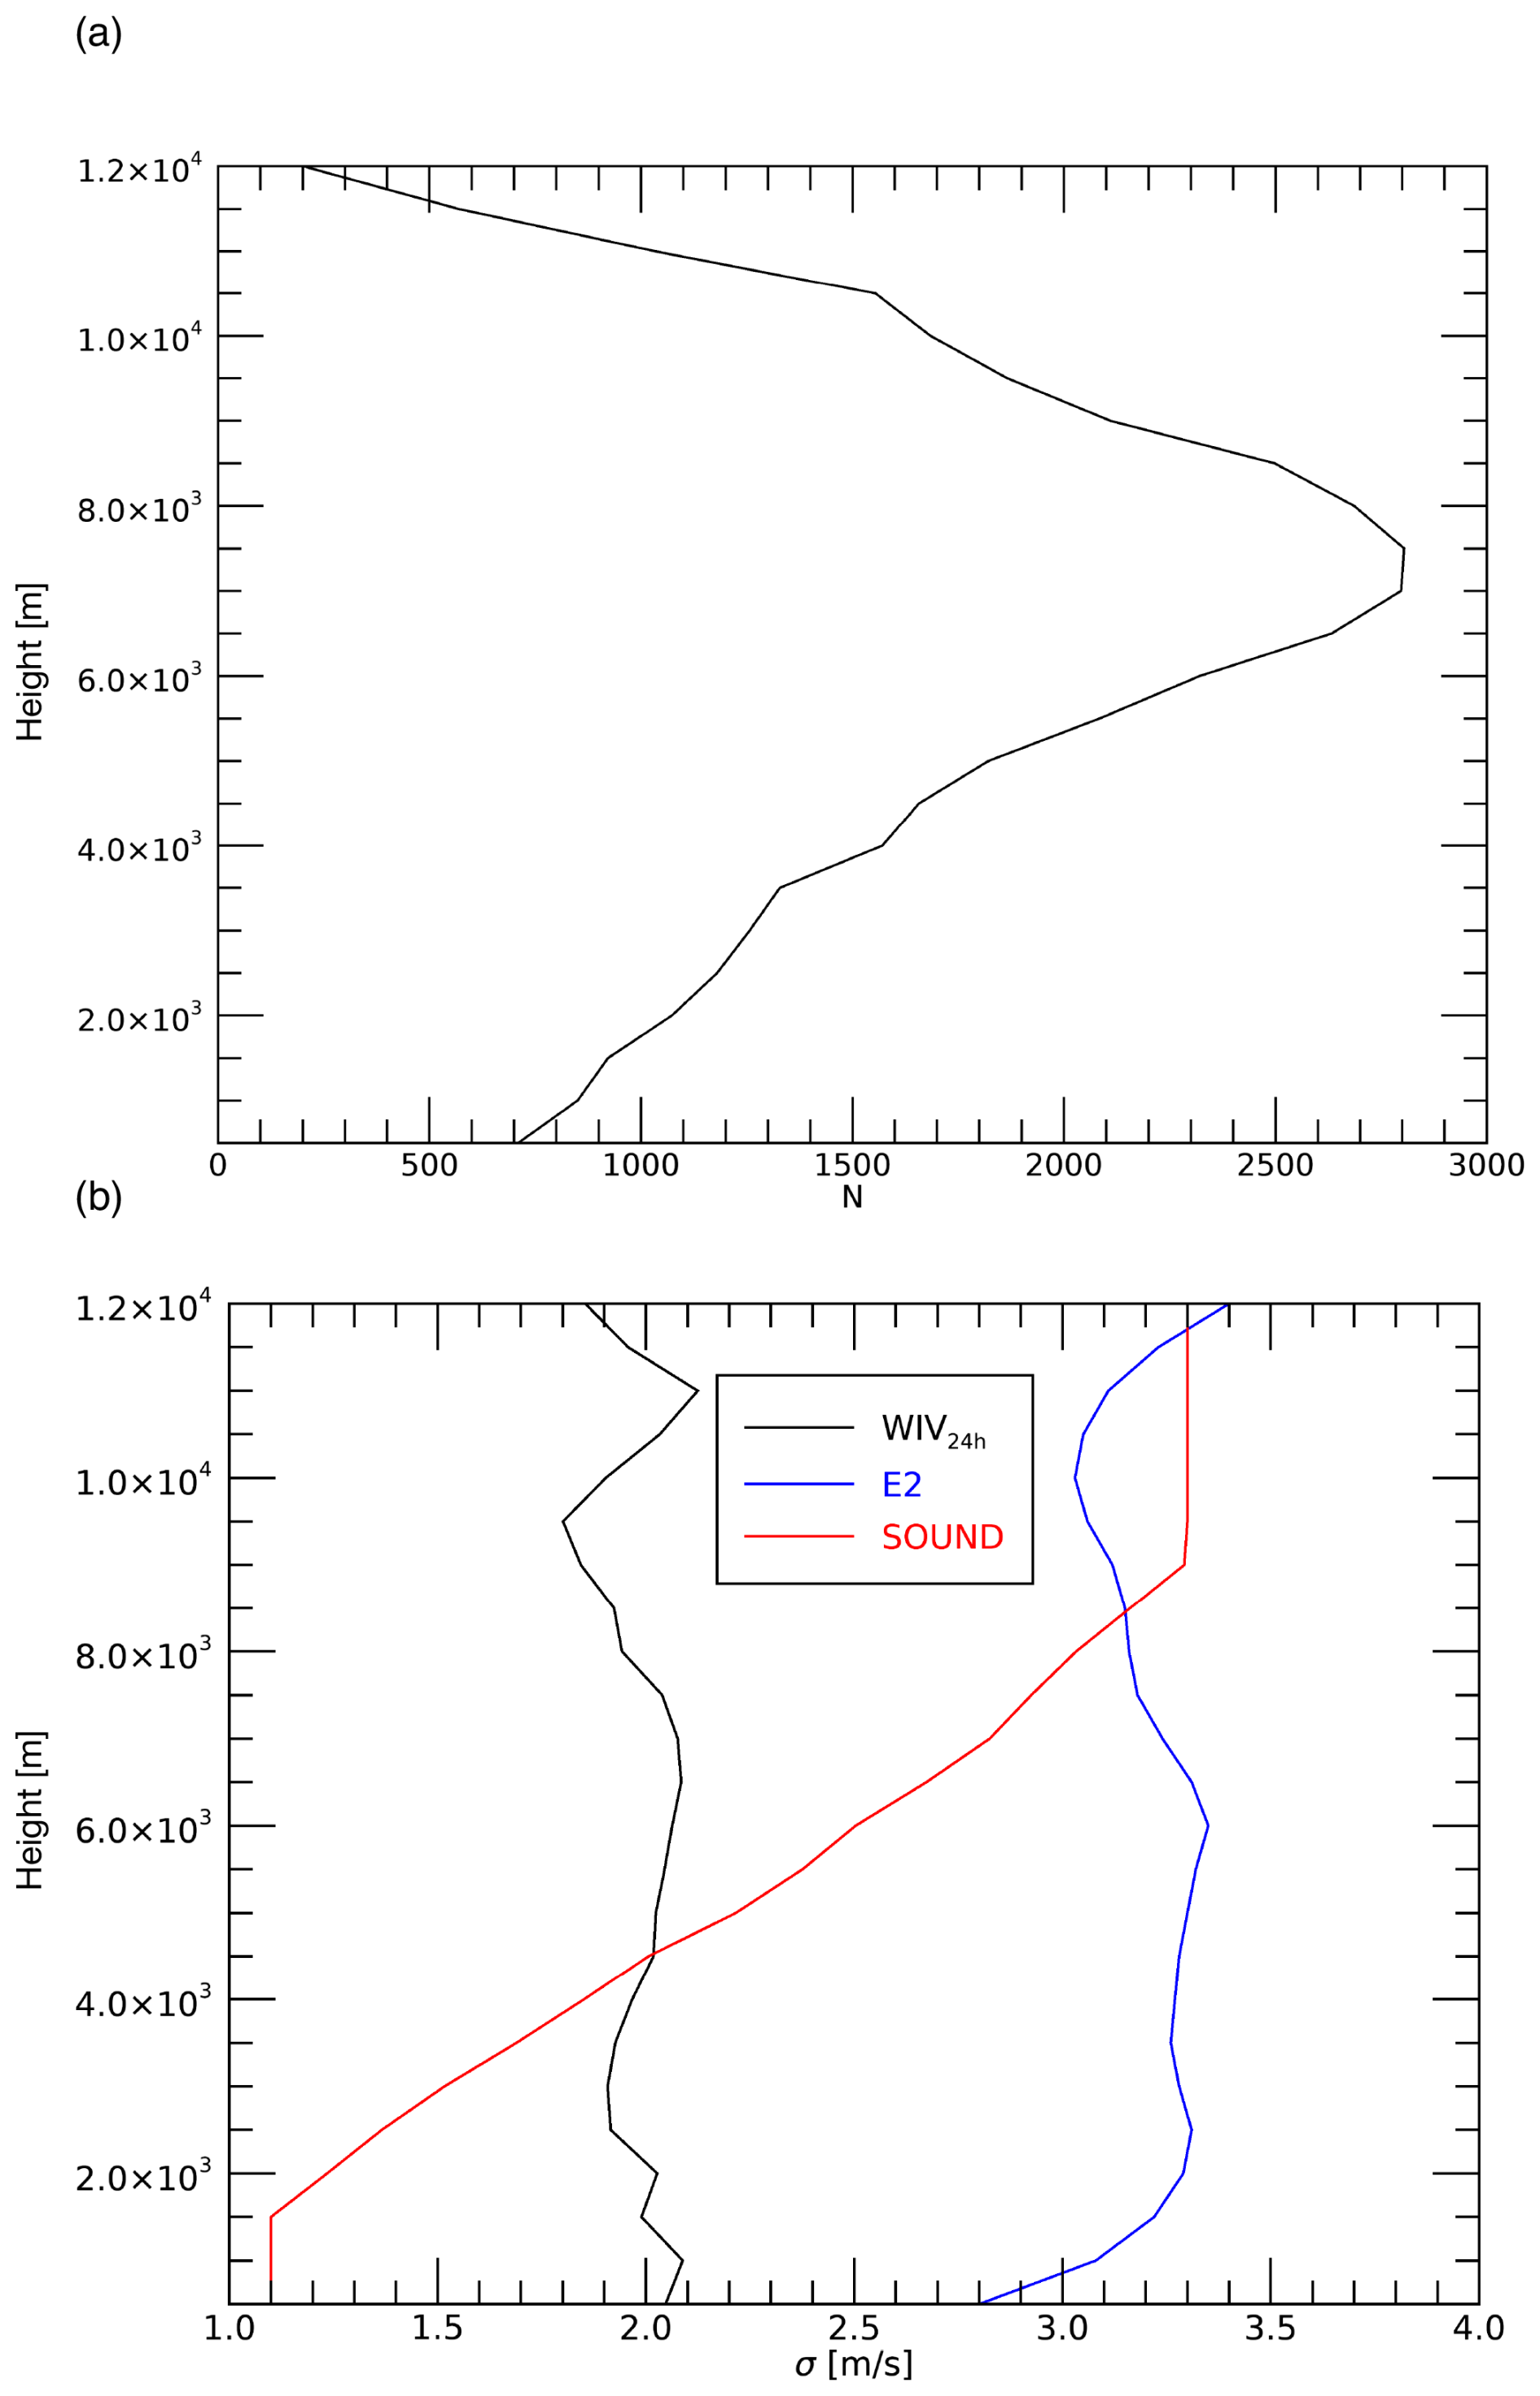
Figure 5(a) Vertical distribution of the number of WIVERN observations; (b) vertical average of the observations' error (black curve), of the model error (blue curve) and of the radiosoundings error used by the WRF data assimilation software (red curve). The model wind speed error is also used to inflate the observation error in a sensitivity experiment.
Figure 5b shows the wind observation error averaged for each vertical level (black curve), the model wind speed error (blue curve) and the radio-sounding wind errors used in the WRF data assimilation (red line) as functions of altitude. The latter was derived from the file SPD.txt available in the WRFDA tool (see https://www2.mmm.ucar.edu/wrf/users/wrfda/, last access: 12 January 2026). The comparison between the WIVERN LoS error and the radio-sounding error shows the good performance of WIVERN observations, whose error is lower than radio-sounding above 4.5 km.
The model wind speed error is given by the square root of squared error for the zonal and meridional wind components. These errors are given, for each level, by the diagonal elements of the vertical component of the background error matrix (Bz, see Appendix B of Federico, 2013 for details). The model wind speed error is larger than the observation error; this suggests a large impact of WIVERN data assimilation for the Ianos case study. To study the sensitivity of the results to the assumed observation error, Sect. 3 presents an experiment in which the observation error is inflated to match the model wind speed error.
Finally, no data thinning is applied in the vertical direction and pseudo-observations are assimilated starting from 1 km above the sea (the largest part of the pseudo-observations assimilated) and 2 km above the land, to account for ground clutter.
3.1 Impact on trajectory, surface pressure and winds forecast
After generating pseudo-observations, we performed a run of the whole ensemble assimilating WIVERN pseudo-observations every 3 h. Before showing the results of assimilating WIVERN winds on the WRF forecast, it is important to assess how WIVERN observations are being assimilated. For this purpose, we consider observation diagnostics in the form of mean innovation (e.g., bias), root-mean-square innovation (RMSI) and the total number of data assimilated for each assimilation cycle (Jones et al., 2016). Innovation and RMSI are calculated by taking the difference between prior and posterior fields H(x) and comparing against observations y:
and:
where N represents the number of pseudo-observations assimilated.
These statistics are reported in Fig. 6. The RMSI slowly increases from the start of the simulation until the end. This reflects the increase of the spread of the ensemble. Close to the end of the forecast, there is an increase of the RMSI as a consequence of the increased spread of the trajectories approaching the landfall. The RMSI is reduced by 15 % through WIVERN DA at the start of the forecast; this percentage decreases as the forecast progresses (down to 5 %) then it increases again close to the end of the forecast, when Ianos approaches the landfall (15 %–20 %). The bias remains small before and after DA, showing that WIVERN pseudo-observations are unbiased. Moreover, WIVERN DA tend to reduce this small bias. The number of pseudo-observations assimilated are about 50 % of the total number of pseudo-observations available; this is expected because a data thinning of 10 km is applied at each level and pseudo-observations are generated at 5 km horizontal resolution.
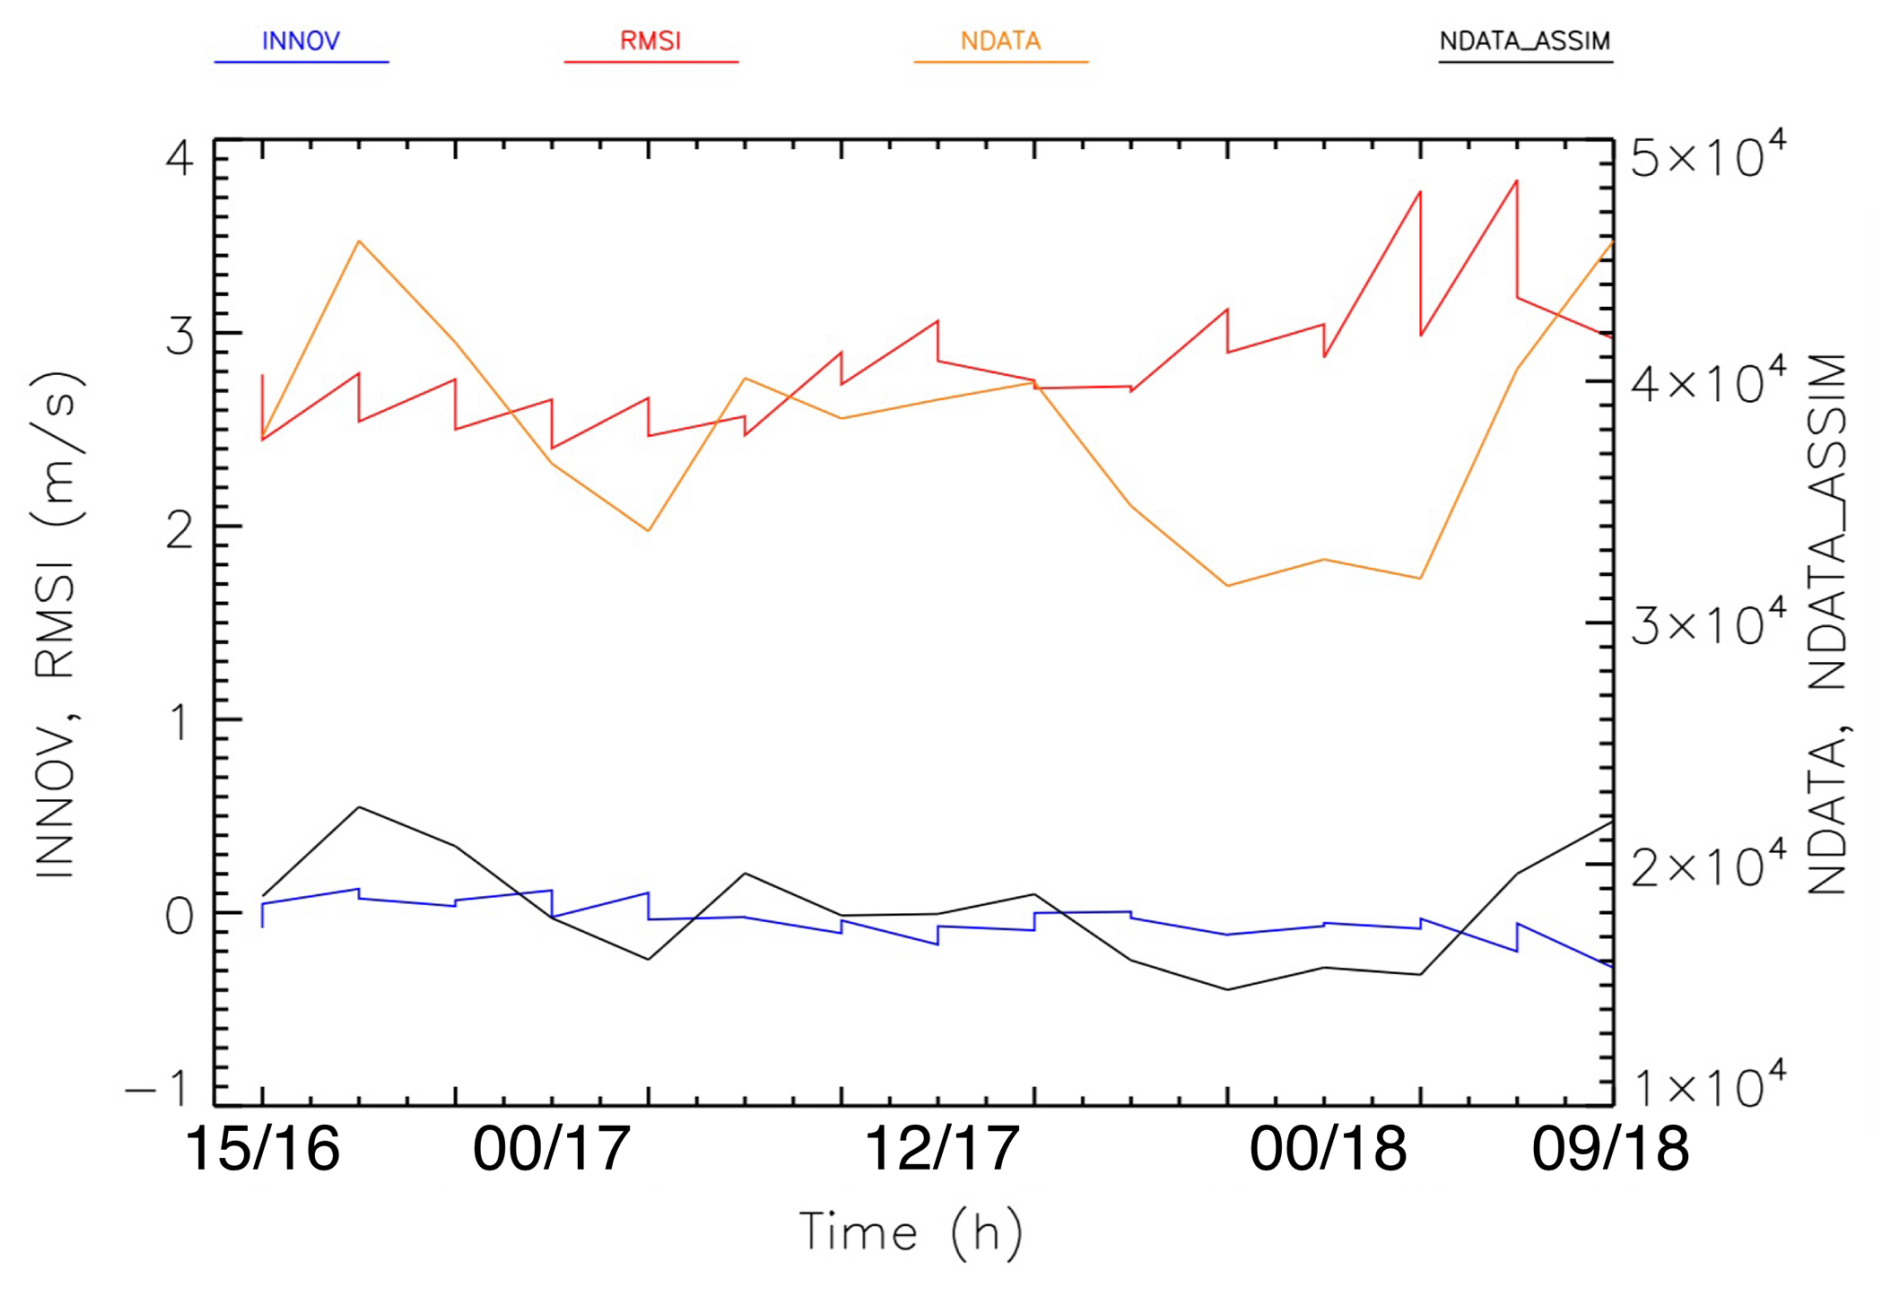
Figure 6Innovation (m s−1), RMSI (m s−1), number of pseudo-observations (NDATA) available for each assimilation cycle and number of pseudo-observations assimilated (NDATA_ASSIM) for each assimilation cycle for the WIV3h experiment. The left y axis refers to the innovation and RMSI while the right y axis refers to the number of pseudo-observations and to the number of pseudo-observations assimilated.
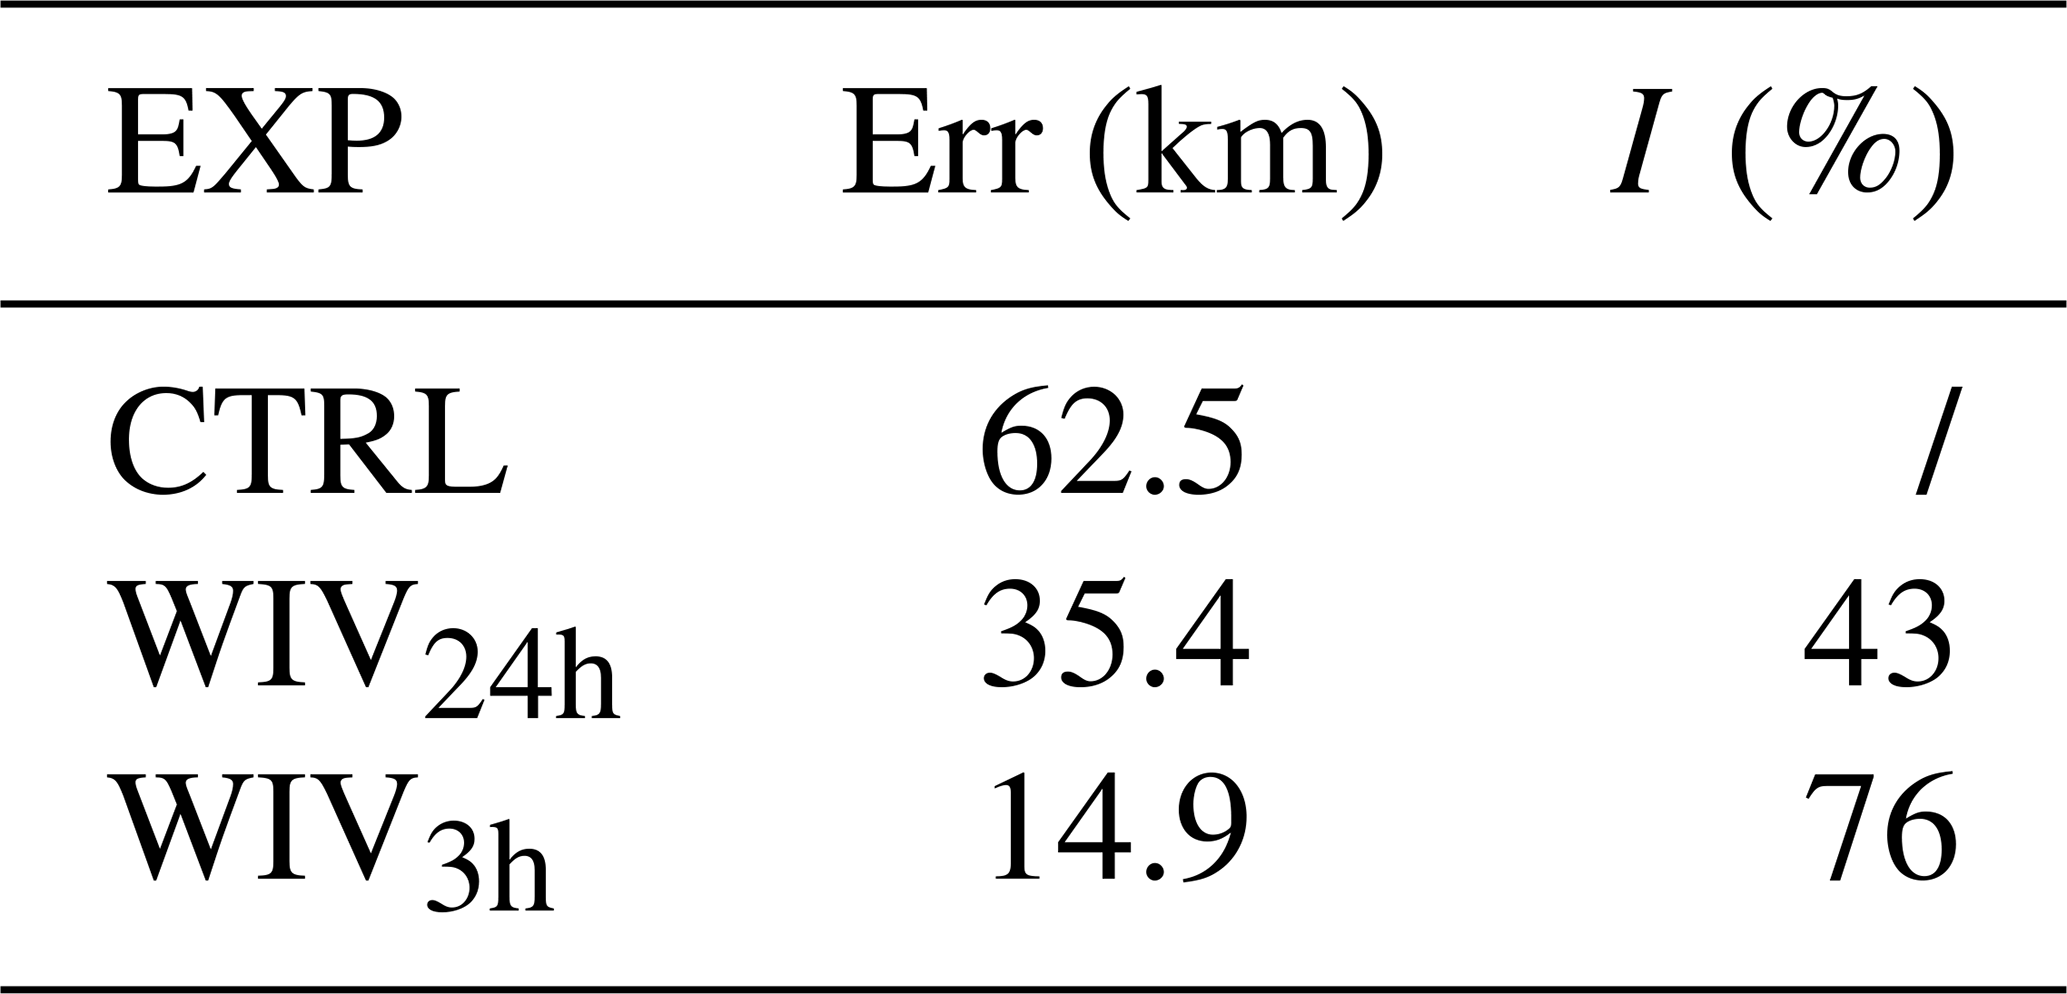
The result of assimilating WIVERN winds every 3 h is shown in Fig. 7. The assimilation of WIVERN winds every 3 h impacts the Ianos trajectory in two ways: first, all the trajectories are now focused along the trajectory of the representative member 42, which is shown in black and without dots for clarity; second, the landfall occurs in the northern part of the Peloponnese with many member crossing the Zakynthos island or passing through the gap between the Kefalonia and Zakynthos islands. The from the member 42 is 14.9 km, to be compared with 62.5 km of the CTRL ensemble (Table 1).
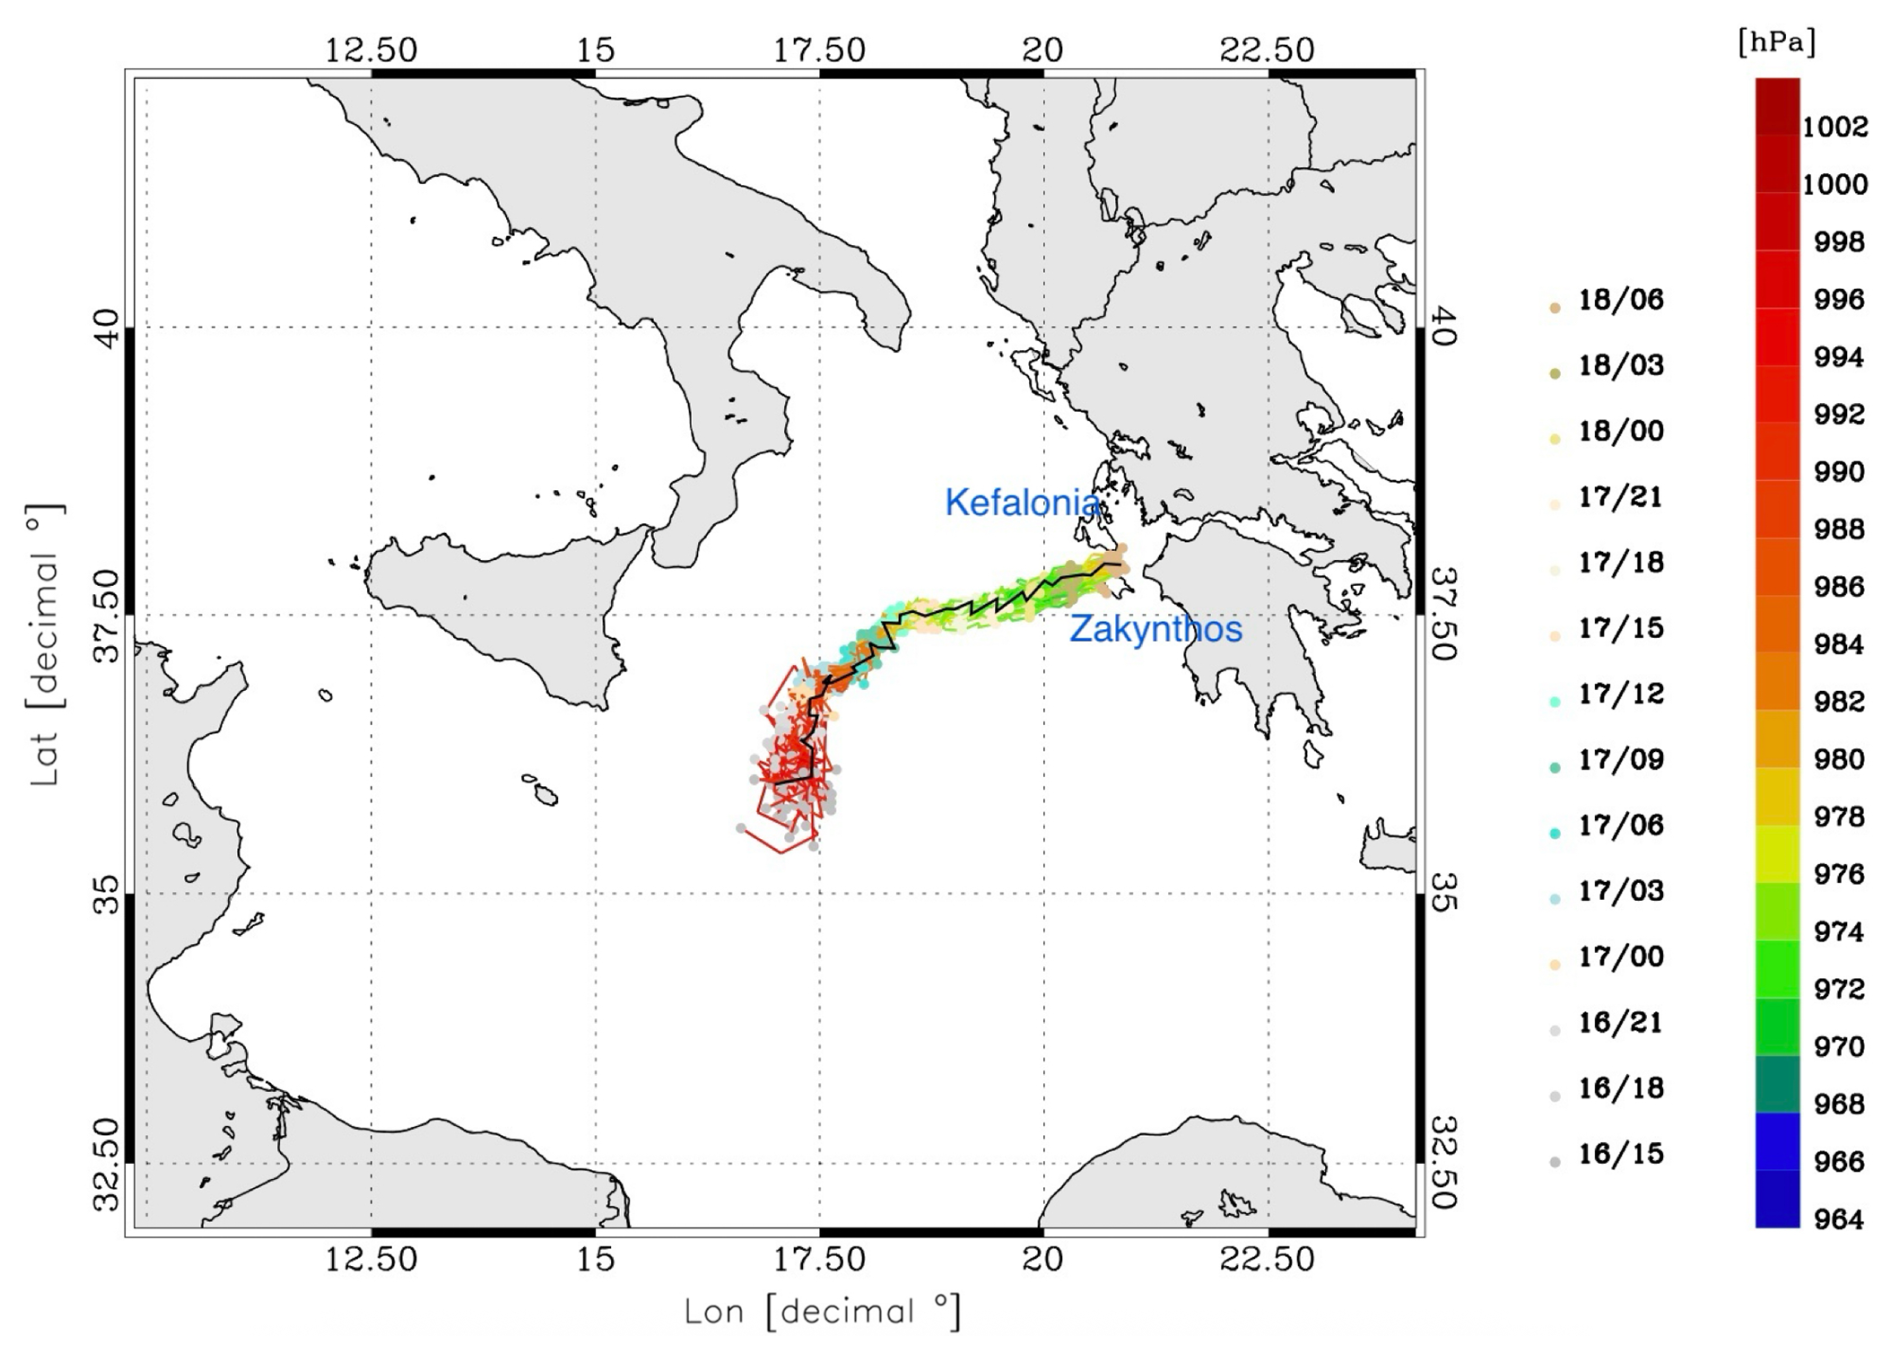
Figure 7Trajectory followed by the WRF ensemble when WIVERN DA is applied every 3 h. The member in black is the representative member 42.
Table 1Average distances of the ensemble members from the member 42, and improvement (%) with respect to CTRL ensemble.
Importantly, the En3DVar used in this paper neglects cross correlation among variables and only zonal and meridional wind components are adjusted by the DA. Nevertheless, the other atmospheric variables are adjusted by the model physics. For example, the cyclostrophic flow is important for Medicanes and, once velocities are adjusted by DA, the pressure field is adapted to the adjusted winds (Pandey and Yadav, 2025). These changes propagates to other variables through the model physics and, in general, the simulation has a different evolution. This point is demonstrated, for example, for the minimum sea level pressure in Fig. 8, with the spread of the minimum sea level pressure substantially reduced by the WIVERN winds DA. It is also noted the increase of the minimum sea level pressure of WIV3h ensemble forecast (Fig. 8b) compared to the CTRL ensemble forecast (Fig. 8) as many members of the CTRL ensemble were predicting a pressure lower than the member 42.
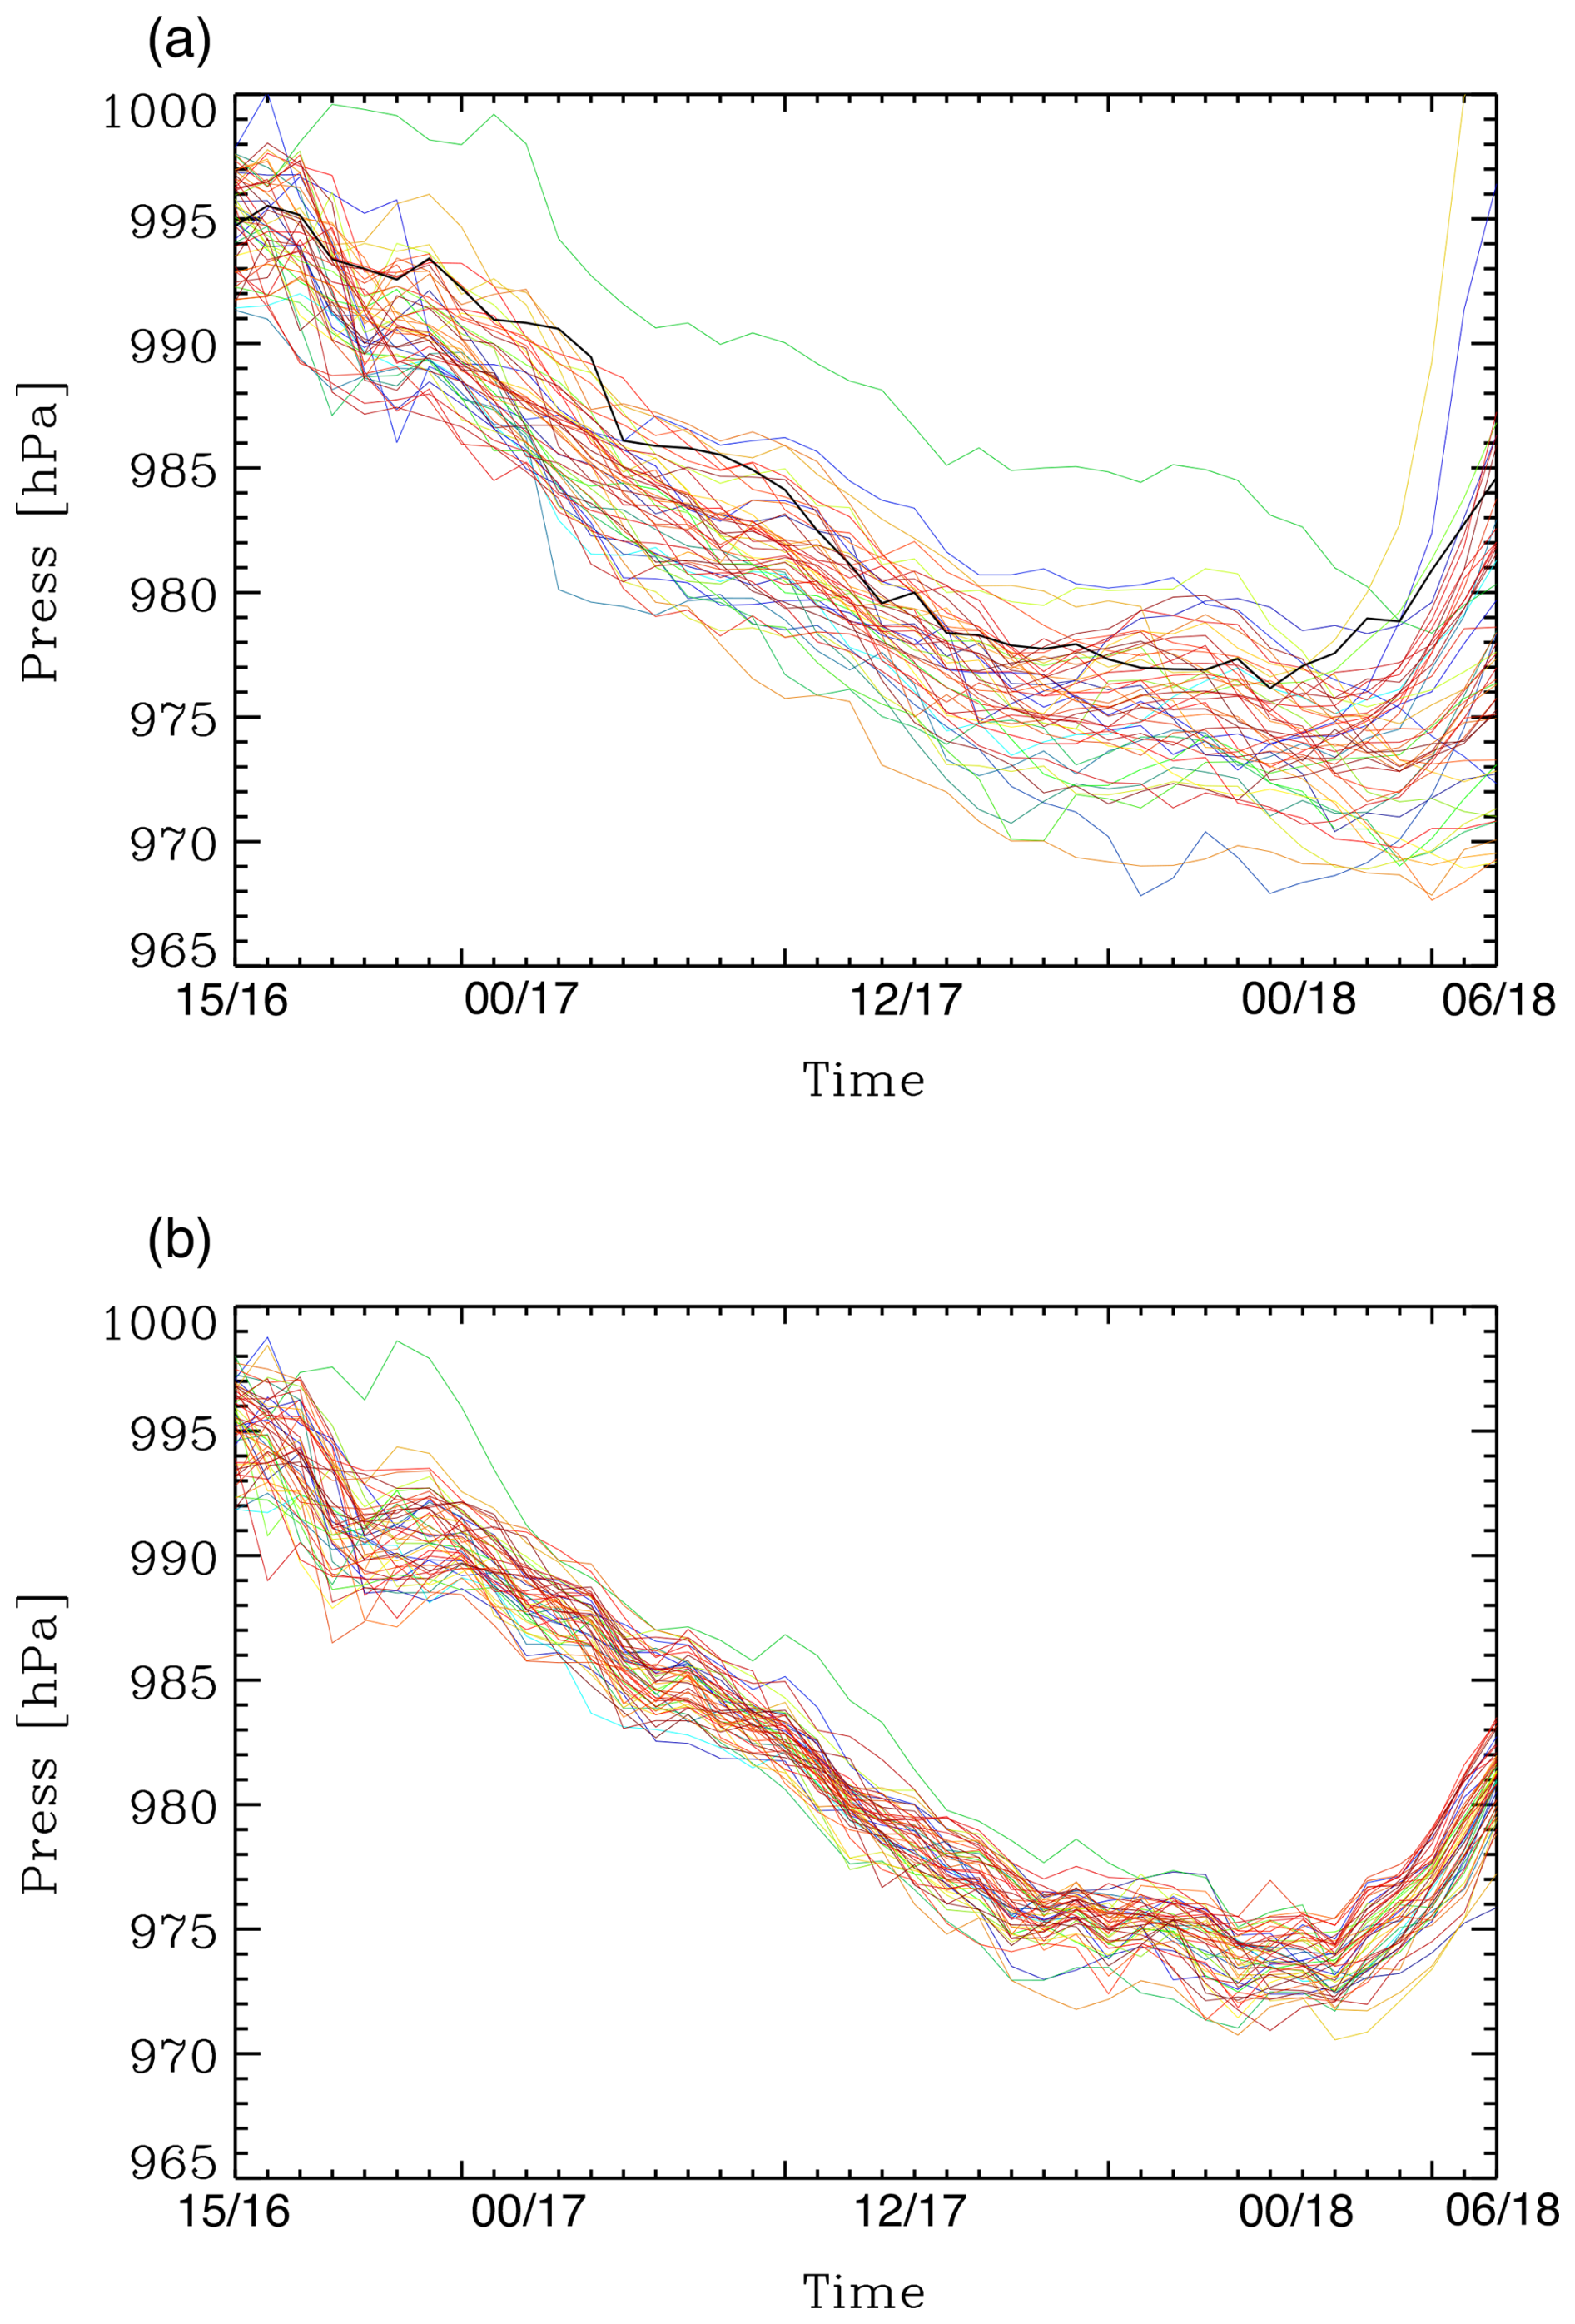
Figure 8Time variation of minimum sea level pressure for (a) the background ensemble; (b) the WIV3h experiment. The black line in panel (a) is the minimum sea level pressure of member 42.
It is important to note that the current setup of WIV3h has a very short spin-up time (3 h). Since the WRF model is run on a single, relatively small domain at convection-permitting resolution, the atmospheric fields initialized from the coarser ensemble forecast could produce imbalances in the WRF forecast, lowering its quality. While a longer spin-up time will be adopted in future studies, we did a sensitivity experiment to evaluate the impact of the short spin-up time for the WIV3h experiment. We chose randomly 20 members of the ensemble and we assimilated the WIVERN winds starting from 00:00 UTC on 17 September allowing for a 12 h spin-up time. Results for the 20 members (not shown) are similar to those of Fig. 7, in the sense that the trajectories of the ensemble strictly follow the trajectory of member 42 after 12 h from the first DA time, i.e. 12:00 UTC on 17 September. So, for the specific case study and settings of this paper, the short spin-up time used by WIV3h does not impact the quality of the results.
Hereafter we focus on the WIV24h numerical experiment. In this experiment, data assimilation is done at 12:00 UTC on 17 September for each member of the ensemble, then follows a 24 h forecast. The motivations for choosing the 12:00 UTC on 17 September are: (a) the storm is well formed, so we can generate a good pseudo-scene; (b) the landfall is far enough (18 h before the landfall) and the forecast is of practical importance. WIV24h represents a realistic scenario in which WIVERN sample Ianos one-time in the period of the simulations considered in this paper. Indeed, considering the 1.5 d revisiting time at the equator of WIVERN and the fact that Ianos lasted few days, the Ianos Medicane would have been sampled at least once. We chose the 12:00 UTC on 17 September for the reasons stated above; in this scenario, the Ianos Medicane would have been sampled two times (Fig. 1b) in the time window considered in this work, but the second time would have been too close to the landfall for the forecasting purposes of this paper.
The trajectories of WIV24h ensemble are shown in Fig. 9. The comparison of Fig. 9 and Fig. 3 shows the positive impact of WIVERN DA on the forecast of the Ianos trajectories. In particular, the CTRL forecast, Fig. 3 shows several trajectories going towards the southern part of the Peloponnese; these trajectories are shifted northward in the experiments with WIVERN DA, even if the WIV24h trajectories still tend to go to the south of the member 42 trajectory.
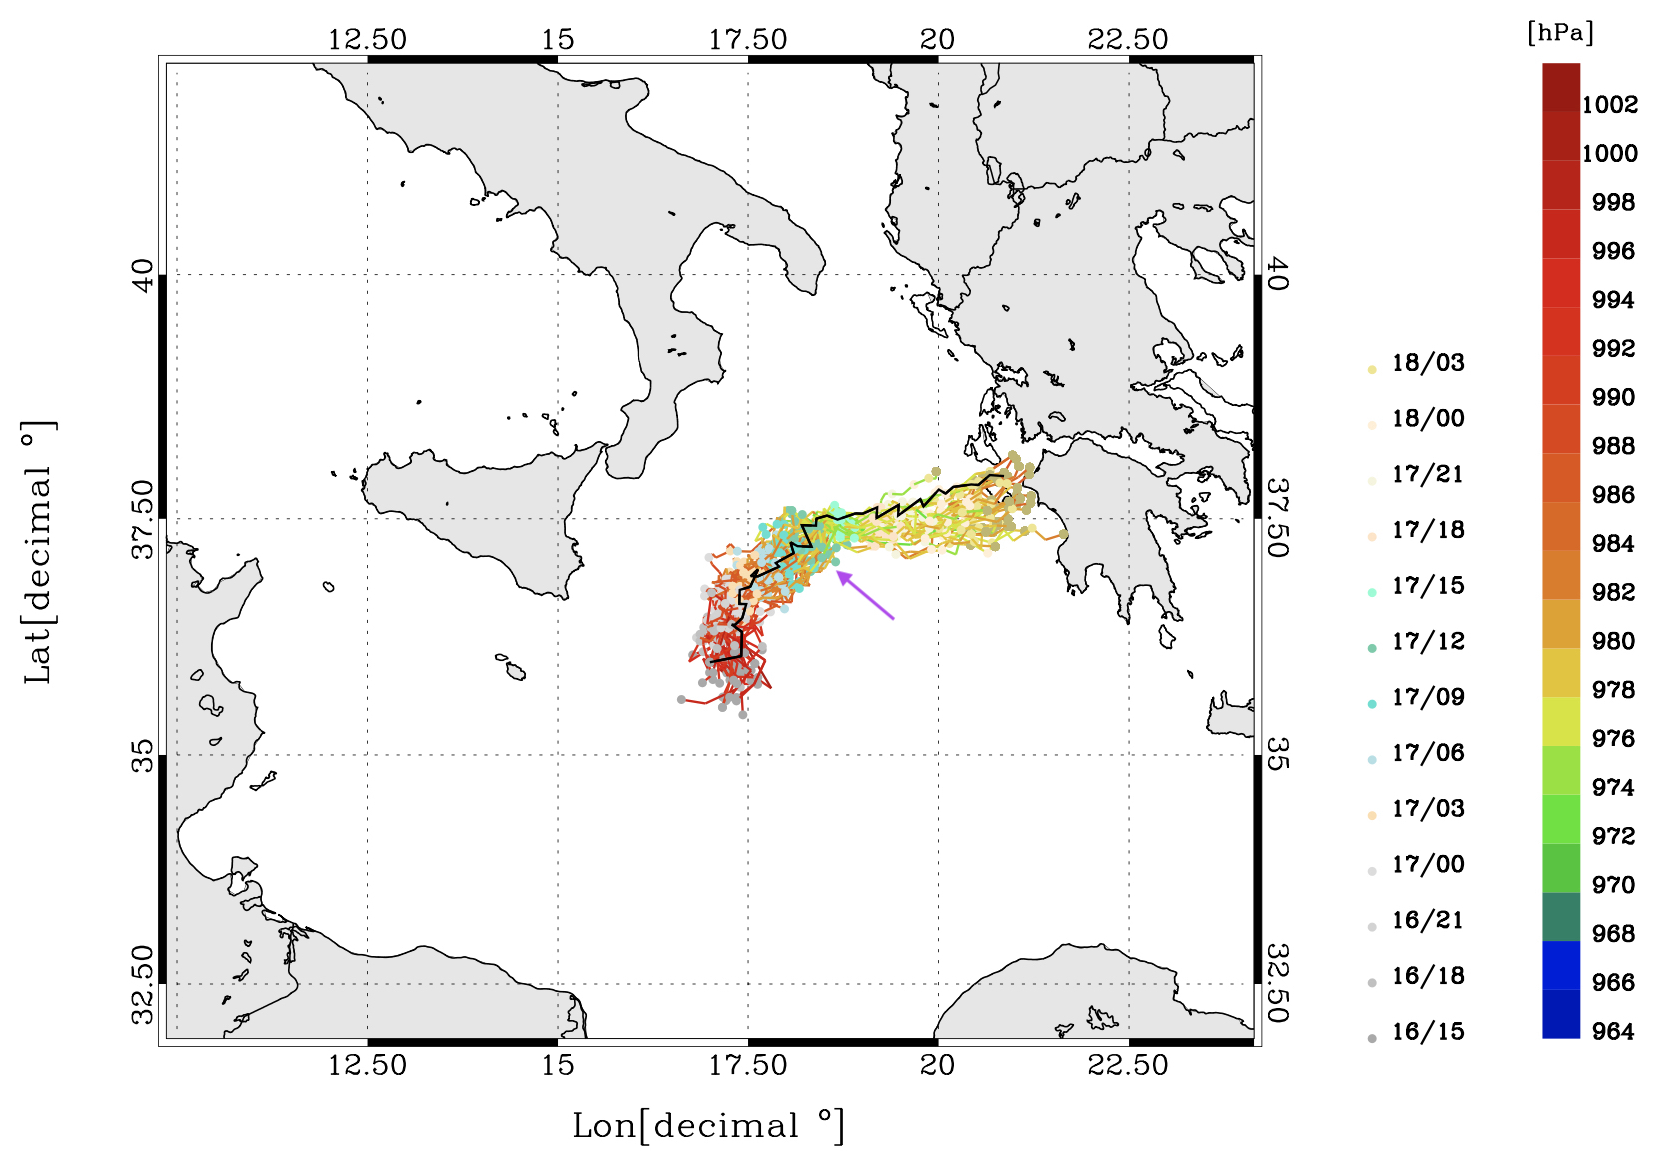
Figure 9Trajectories followed by the members of the WRF ensemble WIV24h. The trajectory in black is the representative member 42, while the violet arrow indicates the assimilation time.
In Fig. 9, the violet arrow indicates the time of analysis. It is interesting to note that the trajectories converge after the analysis, as the different ensemble members tend towards the representative member 42. These results are summarized in Table 1, for the period 12:00 UTC on 17 September to 06:00 UTC on 18 September, showing the of the ensemble from the member 42 for the CTRL, WIV3h and WIV24h ensembles. The table also includes the skill of the WIV3h and WIV24h ensembles compared to CTRL. The skill score, I(%), is given by:
where is given by Eq. (4) and exp can be 3 or 24 h.
It is interesting to examine the trajectory error as a function of the ensemble member (i.e. Eq. 4 without averaging over members) and as a function of time (i.e. Eq. 4 without averaging over time). These statistics are shown in Fig. 10. Considering the error as a function of ensemble member, Fig. 10a, there are a few points to note. First, the WIV3h ensemble performs better than CTRL across all members. This shows that assimilating WIVERN every 3 h gives a strong constraint on storm evolution for all the members. Assimilating WIVERN only once (WIV24h) still has a positive impact on the simulation of the Medicane Ianos' trajectory, with the error reduced for almost all members. Sometimes, the error is substantially reduced, as for the member 11 (and many others), sometimes the improvement of the trajectory forecast is small, as for member 47, and few times there is a negative impact of assimilating WIVERN winds, as for member 35.
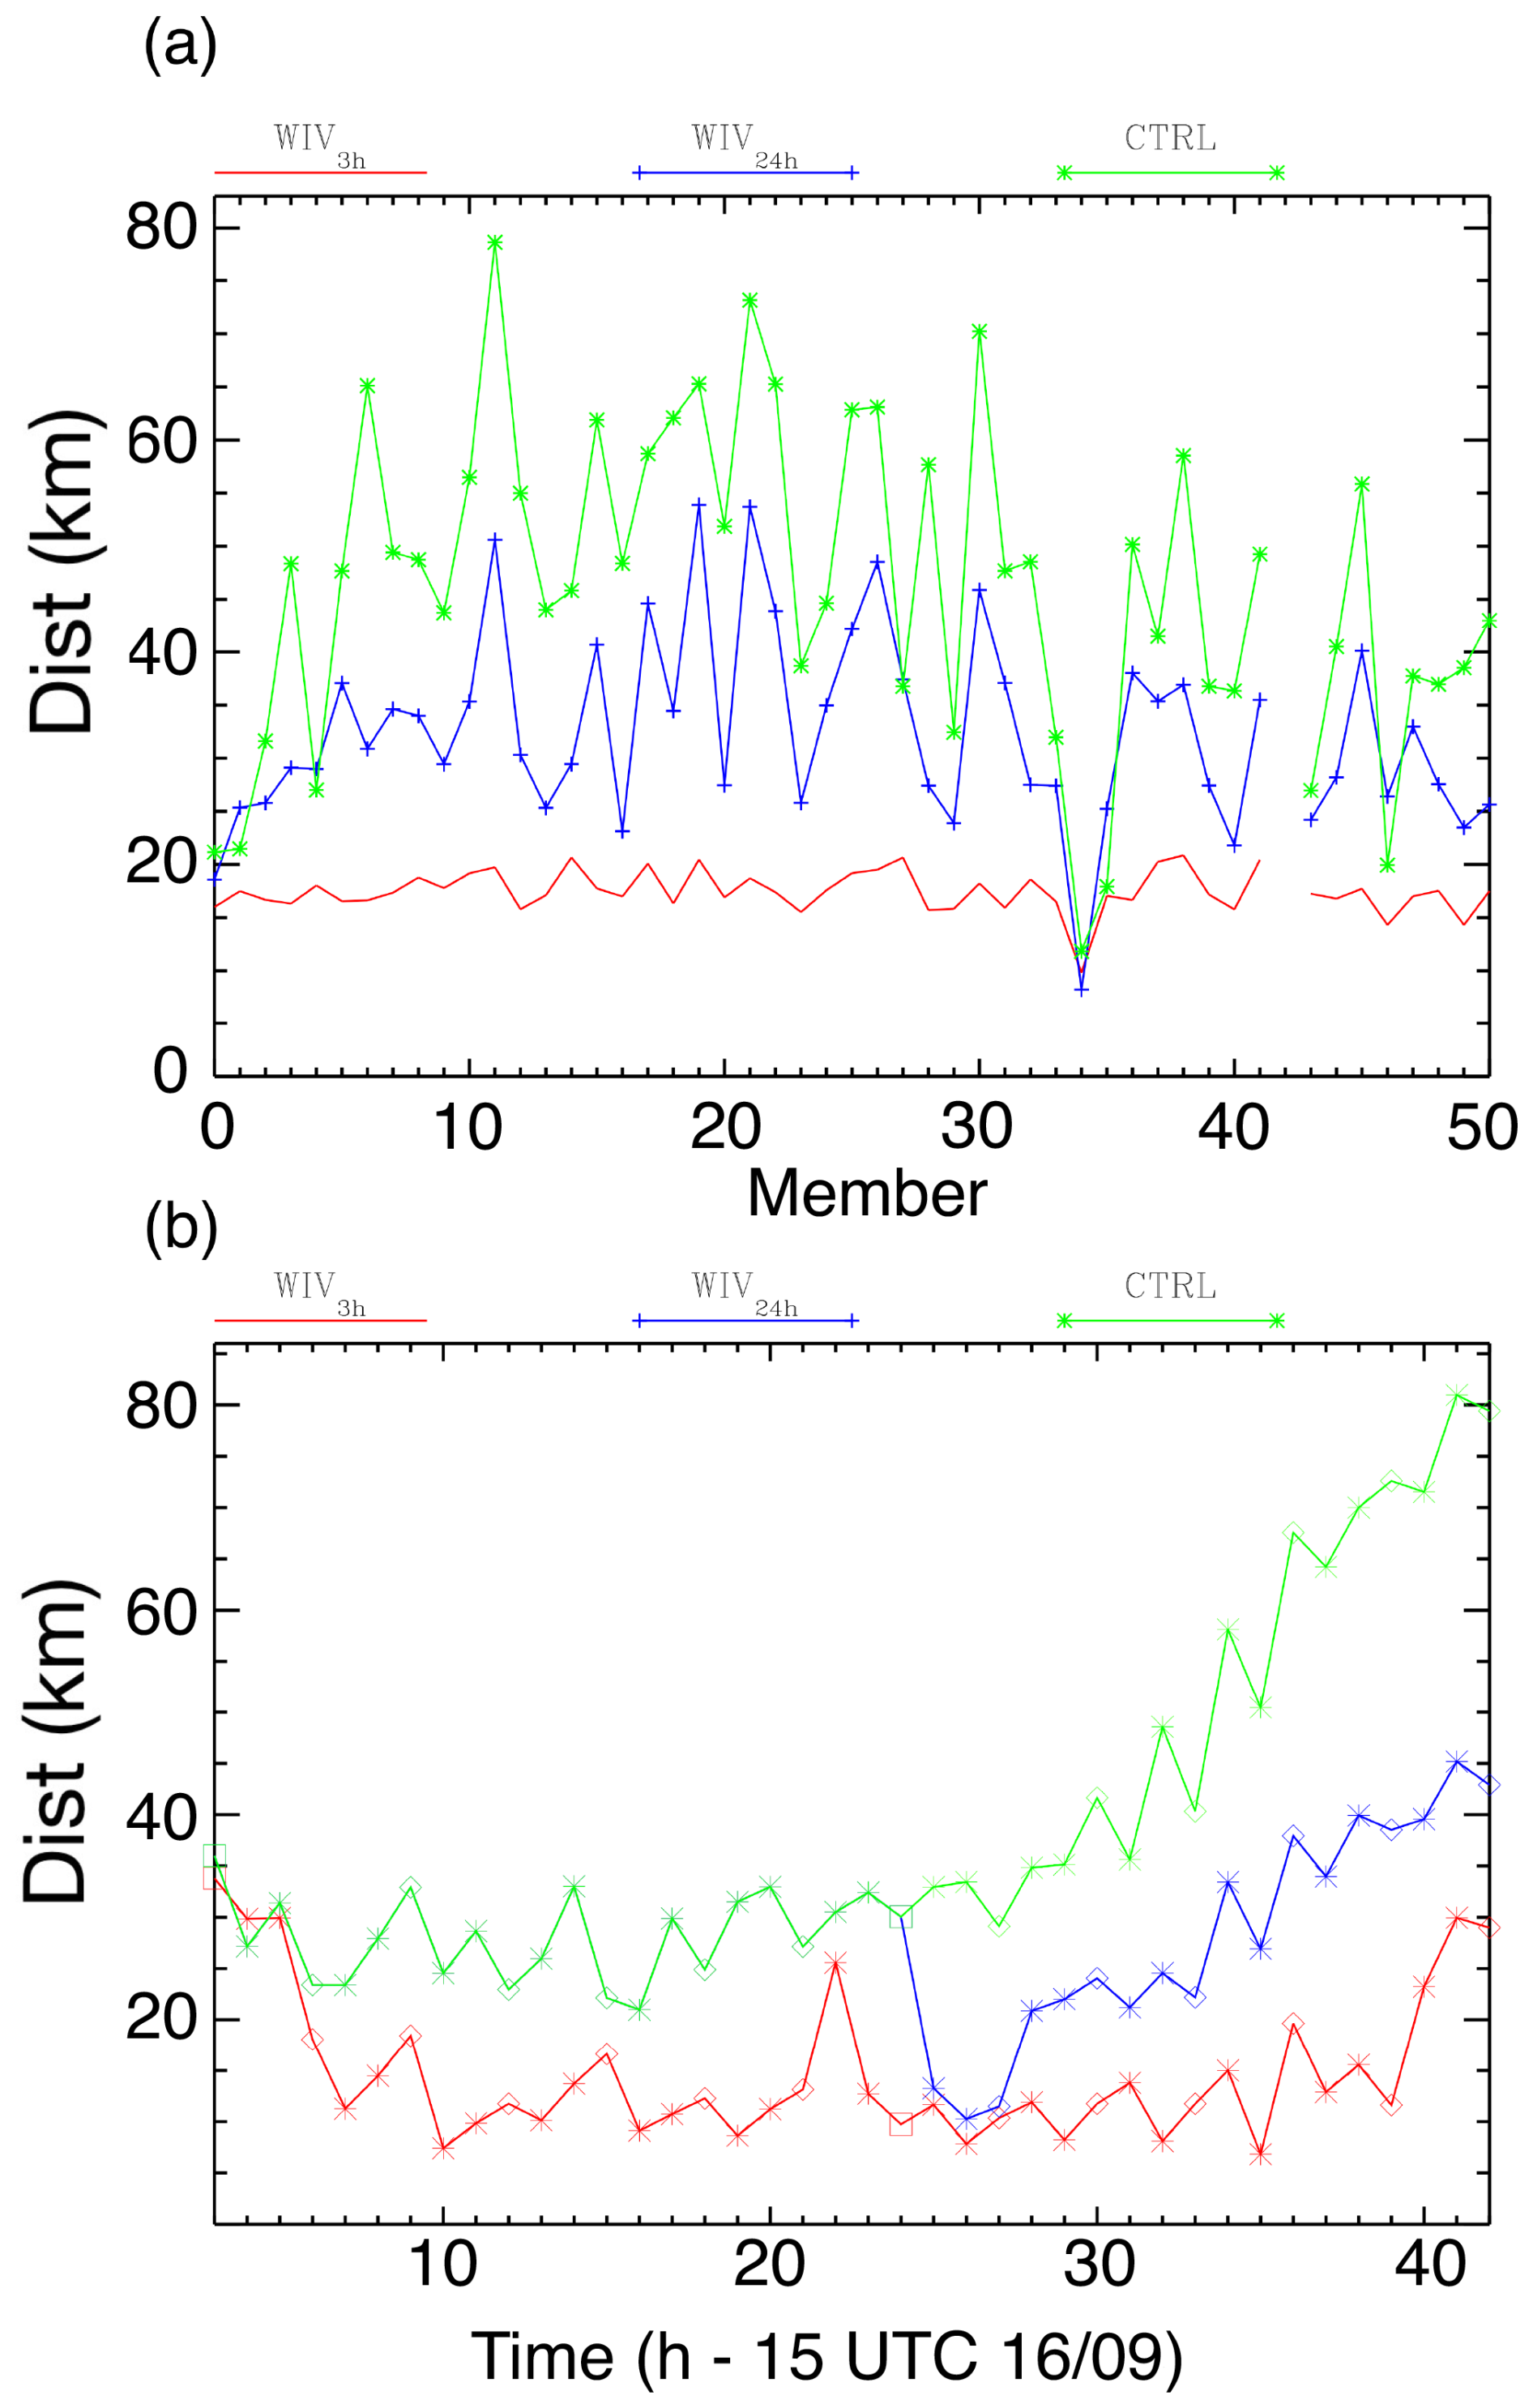
Figure 10Average error of the ensembles CTRL, WIV24h, and WIV3h as function of (a) the member; and, (b) the time. In panel (b), diamonds are shown every 3 h while the square is every 24 h from the simulation start.
Overall, the analysis of Fig. 10a, leads to three main conclusions: (a) assimilation of WIVERN winds along the LoS improves the forecast of the Ianos trajectory; (b) the magnitude of the improvement varies depending on the ensemble member; and (c) the negative impact of WIVERN DA is limited to few cases and less than 10 km, while the positive impact is often larger than 15–20 km. In addition, while the improvement of WIVERN DA is dependent on the member, this dependence is greatly reduced if WIVERN is assimilated every 3 h, showing the ability of WIVERN to substantially change the storm evolution, when frequently assimilated.
Figure 10b shows the trajectory error as a function of forecasting time from 15:00 UTC on 16 September to 06:00 UTC on 18 September. The error of the CTRL ensemble increases with the forecast time, as expected. The WIV24h forecast differs from the CTRL forecast after the analysis (12:00 UTC on 17 September). The improvement given by WIVERN winds DA is large and lasts until the end of the period considered, showing a long-lasting effect of WIVERN DA. This point will be further investigated in Sect. 3.4.
To study the impact of WIVERN DA on the WRF forecast in more detail, we focus on the member 10, one of the members showing a substantial impact of WIVERN DA. Figure 11 shows the impact of 3DVar on meridional wind component. The background (panel a) represents the strong winds associated with the Medicane Ianos, with meridional wind speeds in the lower troposphere reaching up to about 40 m s−1, and a cyclonic circulation around the storm center (bipolar structure). After assimilation (panel b), the winds are still very intense and the cyclonic circulation well represented as in the background; however, the whole circulation has shifted several tens of kilometers to the east (refer to the longitude 17.5° E).
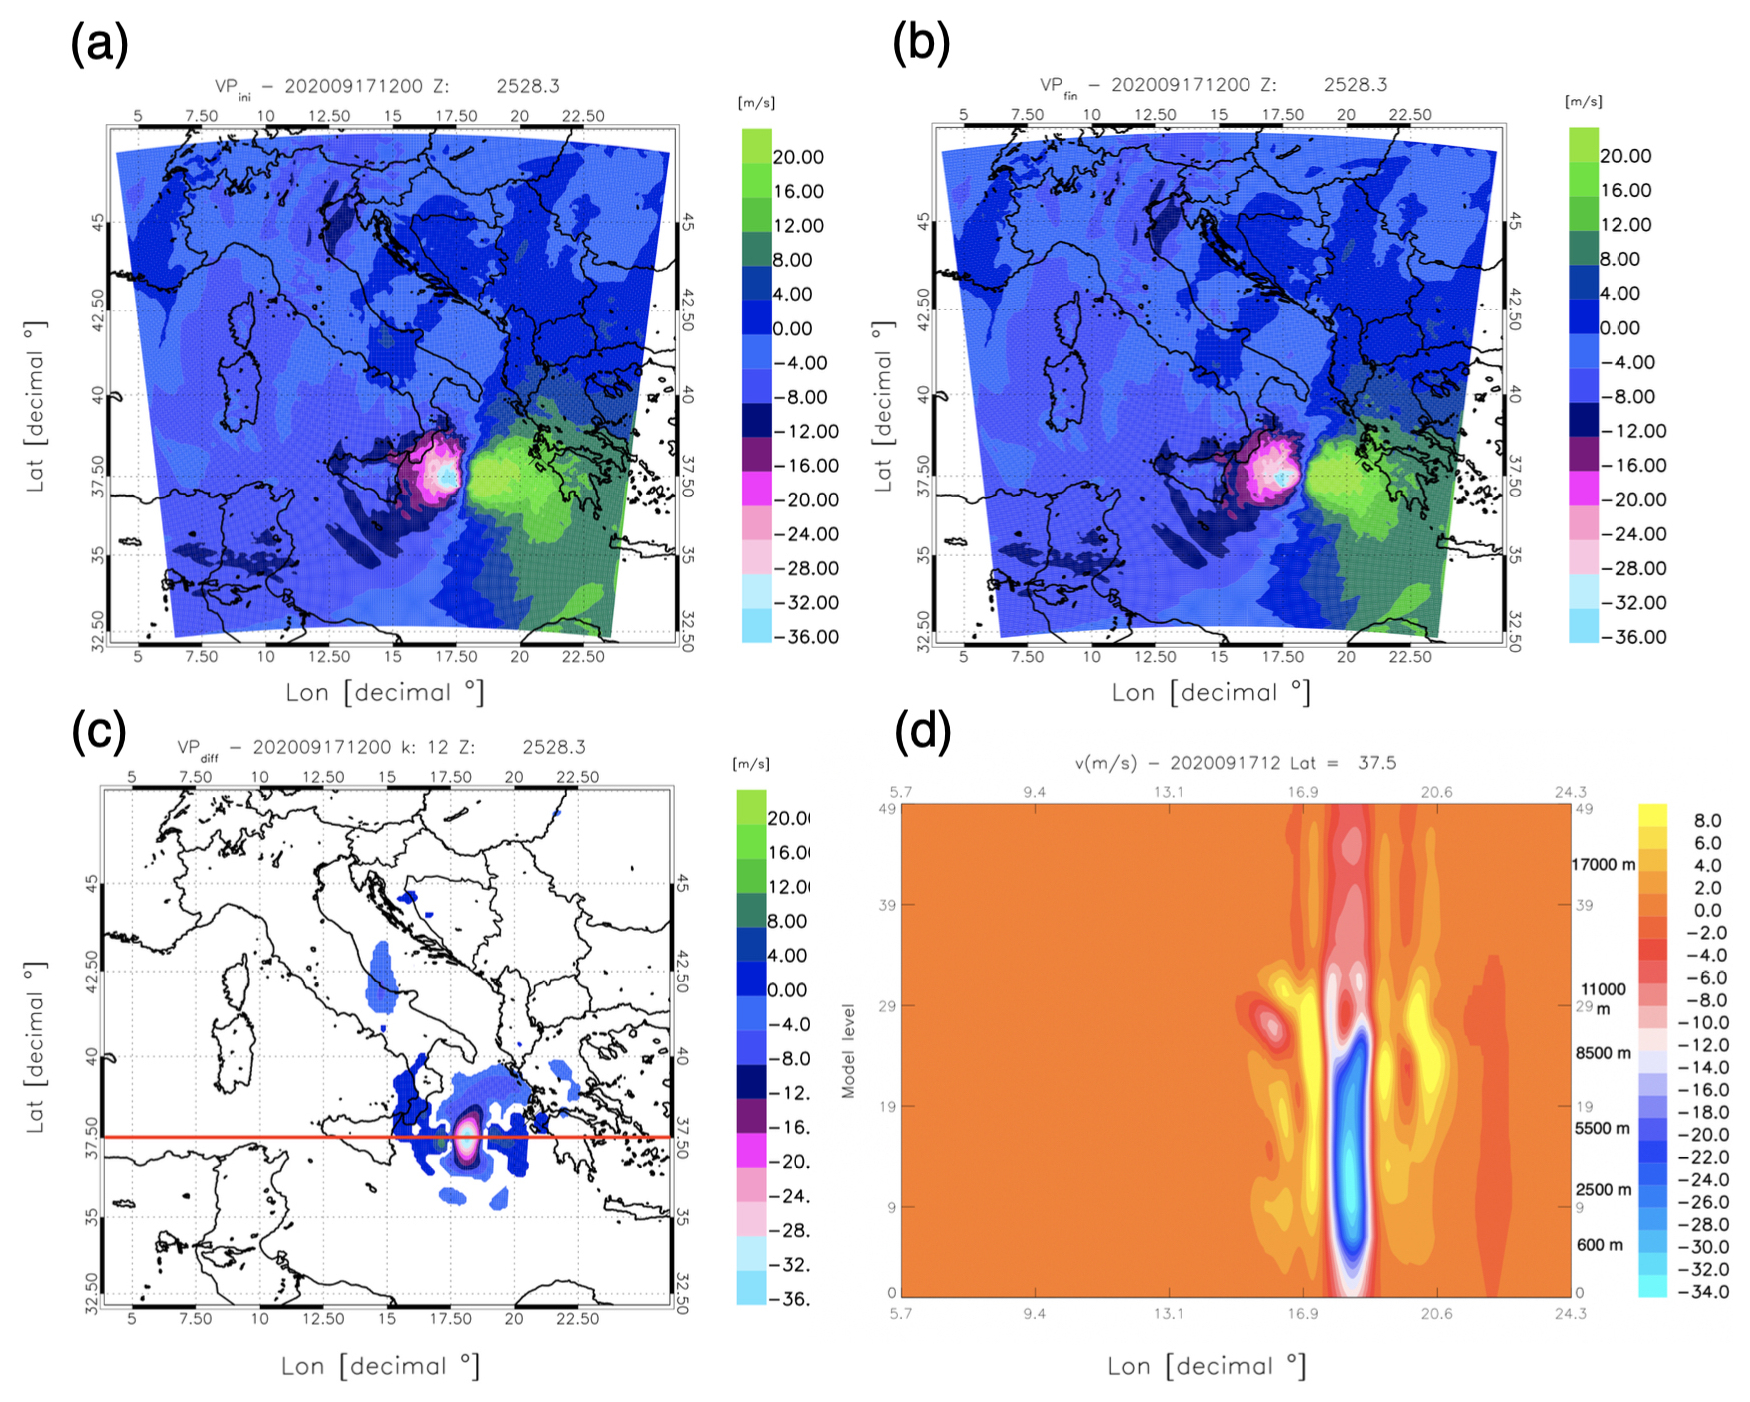
Figure 11Analysis of wind components at 12:00 UTC on 17 September 2020 for member 10: (a) background meridional wind component at about 2500 m a.s.l.; (b) analysis of the meridional wind component at about 2500 m a.s.l.; (c) difference between analysis and background fields of the meridional wind component (same level of panels a–b); (d) cross-section of the difference between the analysis and the background of the meridional wind component along the red line of panel (c). The y axis of panel (d) shows the WRF vertical levels and labels on the right y axis correspond to the approximate heights of the levels.
The difference between the two fields has a “tripolar” pattern (panel c). From west to east, the meridional wind difference is positive to the west of 17.5° E, negative between 17.5 and 19° E, and then positive again towards the east. This pattern corresponds to the net eastward shift of the storm center, and to a small reinforcement of the meridional wind component.
The vertical cross-section of the meridional wind difference (analysis minus background) is shown in Fig. 11d). It highlights a main tripolar pattern close to the storm center (around 18.0° N), with negative values reaching up to −34 m s−1 at about 2500 m a.s.l. This tripolar pattern reaches 8.5 km height and is a consequence of the eastward shift of the storm center in the analysis. Interestingly, despite a decrease of the number of pseudo-observations in the lower troposphere (Fig. 5a) caused by the attenuation of the radar signal, the number of pseudo-observations is enough to produce a substantial change of the circulation in the lower troposphere. Above 8.5 km, the difference between the analysis and background becomes more complex with several localized positive and negative differences. This pattern is determined by observations at these levels and by the vertical structure of the background error matrix.
The impact of WIVERN winds DA is long lasting; Fig. 12 shows the 18 h forecast of the sea level pressure and surface winds starting from the analysis of Fig. 11. The impact of WIVERN DA on the evolution of this member is high. First, the position of the storm is much improved by WIVERN DA; while the member 42 (panel a) has just crossed the Zakynthos island, the storm center of member 10 without WIVERN DA is in the open sea (about 100 km to the SW of Zakynthos). The storm center of the member 10 after DA is close (about 10 km) to Zakynthos. Importantly, the minimum sea level pressure is also adjusted by WIVERN DA; it is about 983 hPa for member 42 and for member 10 after DA, while it is lower than 975 hPa for member 10 without data assimilation. Similarly, the maximum wind speed at the surface of member 10 with WIVERN DA (28.1 m s−1) is much closer to the representative member 42 (31 m s−1) compared to the member 10 without WIVERN DA (39.8 m s−1). In summary, Fig. 12 shows that the assimilation of WIVERN winds changes the evolution of the storm not only for the trajectory but also for the physical characteristics, providing a representation of the Medicane Ianos closer to member 42. It is important to note that, as we assimilated WIVERN winds pseudo-observations derived from member 42, this member becomes our truth and being closer to it is equivalent to have an improvement of the forecast.
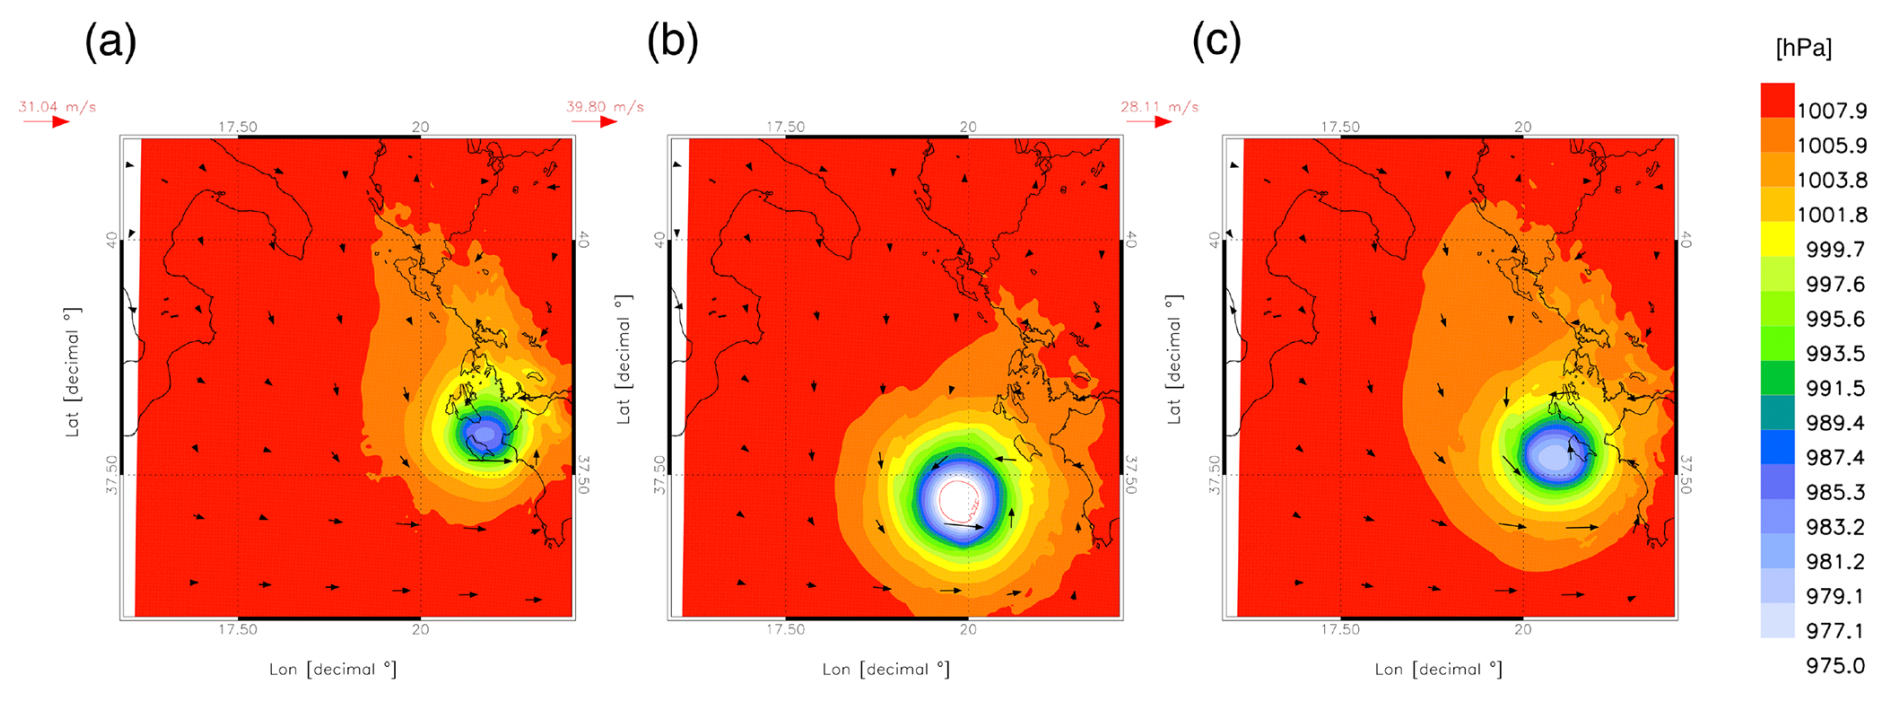
Figure 12Sea level pressure and surface winds (every 20 grid points) at 06:00 UTC on 18 September, i.e. 18 h after the assimilation time, for (a) member 42 (from the CTRL forecast, i.e. without DA); (b) member 10 (from the CTRL forecast, i.e. without DA); (c) member 10 after the assimilation of WIVERN winds at 12:00 UTC on 17 September. The contour inside the Medicane in panel (b) corresponds to the 975 hPa isobar.
3.2 Impacts on the precipitation and surface winds forecasts
In this section we discuss the impact of assimilating the WIVERN winds along the LoS on the prediction of the precipitation in Kefalonia. As stated before, member 42 represents our truth and comparison is done against its output, and no real observations are considered in this section. Figure 13 shows the precipitation accumulated from 12:00 UTC on 17 September to 12:00 UTC on 18 September for the CTRL ensemble (average), the representative member 42, and the WIV24h ensemble (average). The precipitation accumulated by the member 42 clearly mirrors the trajectory followed by the cyclone with accumulated rainfall larger than 300 mm d−1 in a swath oriented from SW to NE, ending over the Kefalonia island.
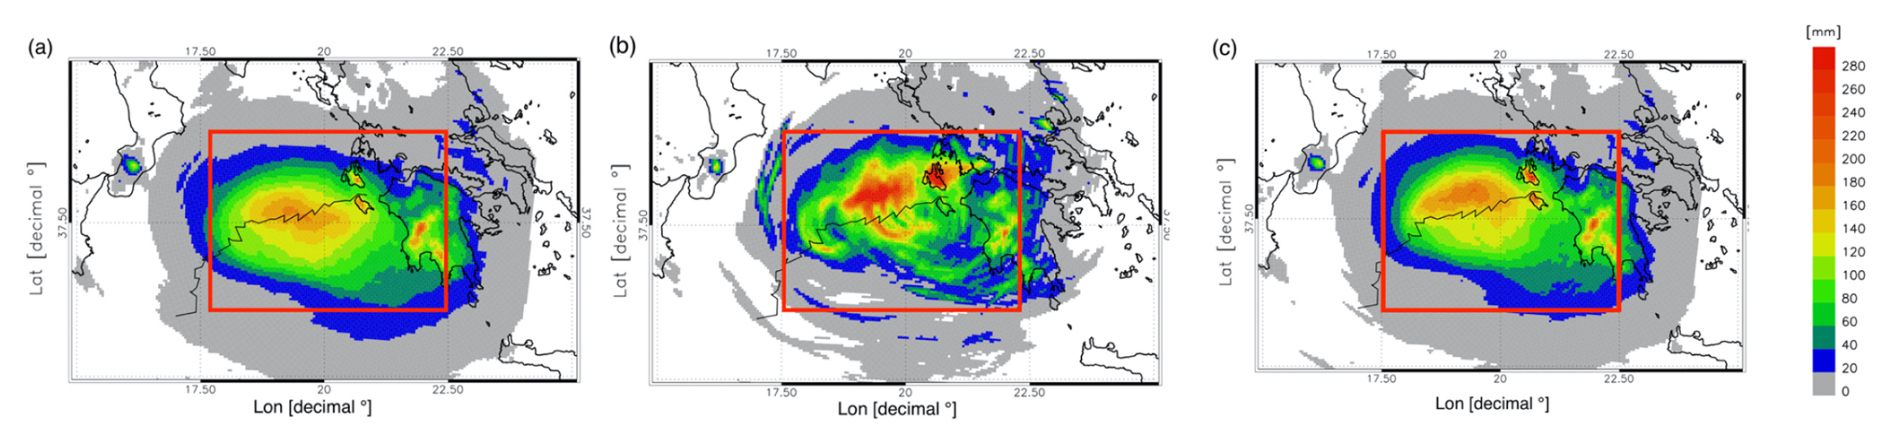
Figure 13Rainfall accumulated from the 12:00 UTC on 17 September to 12:00 UTC on 18 September by: (a) the CTRL ensemble (average); (b) the representative member 42; (c) the WIV24h ensemble (average). The trajectory of the representative member 42 is shown in black.
The CTRL ensemble shows a precipitation pattern which is oriented in the NW-SE direction, differently from the pattern of the member 42. The field of CTRL is smoothed compared to the representative member, but this feature is caused by the average operator. The precipitation on the island of Kefalonia is largely underestimated compared to member 42 because the rainfall is 150 mm d−1 for CTRL compared to more than 300 mm d−1 for the member 42.
The rainfall accumulated by the ensemble WIV24h is in better agreement with the representative member 42 compared to CTRL because the intense precipitation swath is oriented in the SW-NE direction and the rainfall predicted over Kefalonia is greater than 300 mm d−1. This is confirmed by the RMSE, calculated with respect to member 42 and averaged over the area defined by the longitudes 17.5–22.5° E and by the latitudes 36.0–39.0° N (red rectangle of Fig. 13), which decreases from 51.0 mm of CTRL to 40.5 mm of WIV24h. Although the RMSE is improved by WIVERN DA, the average precipitation over the red rectangle of Fig. 13 is slightly worsened. The average rainfall of the member 42, of the CTRL ensemble and of the WIV24h ensemble are, respectively, 59.3, 63.6, and 64.1 mm. This result, i.e. a notable improvement of the RMSE and a similar bias, confirms that the improvement of the RMSE is determined by a better representation of the location and intensity of the rainfall in the most intense part of the storm (i.e. north of the trajectory of the representative member 42).
3.3 Sensitivity to model and observations error
In this section we consider the results of two sensitivity tests: in the first test we inflated the observation error, in the second test we changed the background error covariance matrix. For the first experiment the observation error is assumed to be equal to the model wind speed error and dependent only on height. The observation error is shown in Fig. 5b (curve E2) and roughly corresponds to inflating the WIVERN error by a factor of 1.5–2; we will refer to this experiment as E2.
In the second sensitivity experiment, we changed the background error covariance matrix, which was computed applying the NMC (National Meteorological Center; Parrish and Derber, 1992) method to the period 1–30 September 2020. Specifically, the background error matrix was computed from the difference of two WRF forecasts, with lead times of 12 and 24 h, verifying at the same time, both 12:00 and 00:00 UTC, for the whole period. The WRF forecasts use the operational analysis/forecast cycle issued by the ECMWF at 00:00 and 12:00 UTC on each day of September as initial and boundary conditions. In this configuration the background error matrix is representative of the meteorological conditions of the month of September 2020, while in the approach used for the WIV24h experiment, Eq. (1), the background error matrix is representative of the error of the day. This sensitivity experiment will be referred to as NMC.
Results of both experiments are represented by the distribution of the trajectory errors of the ensemble members, i.e. without averaging over members, shown in Fig. 14. The largest error correspond to the CTRL experiment, followed by NMC, E2, and WIV24h experiments.
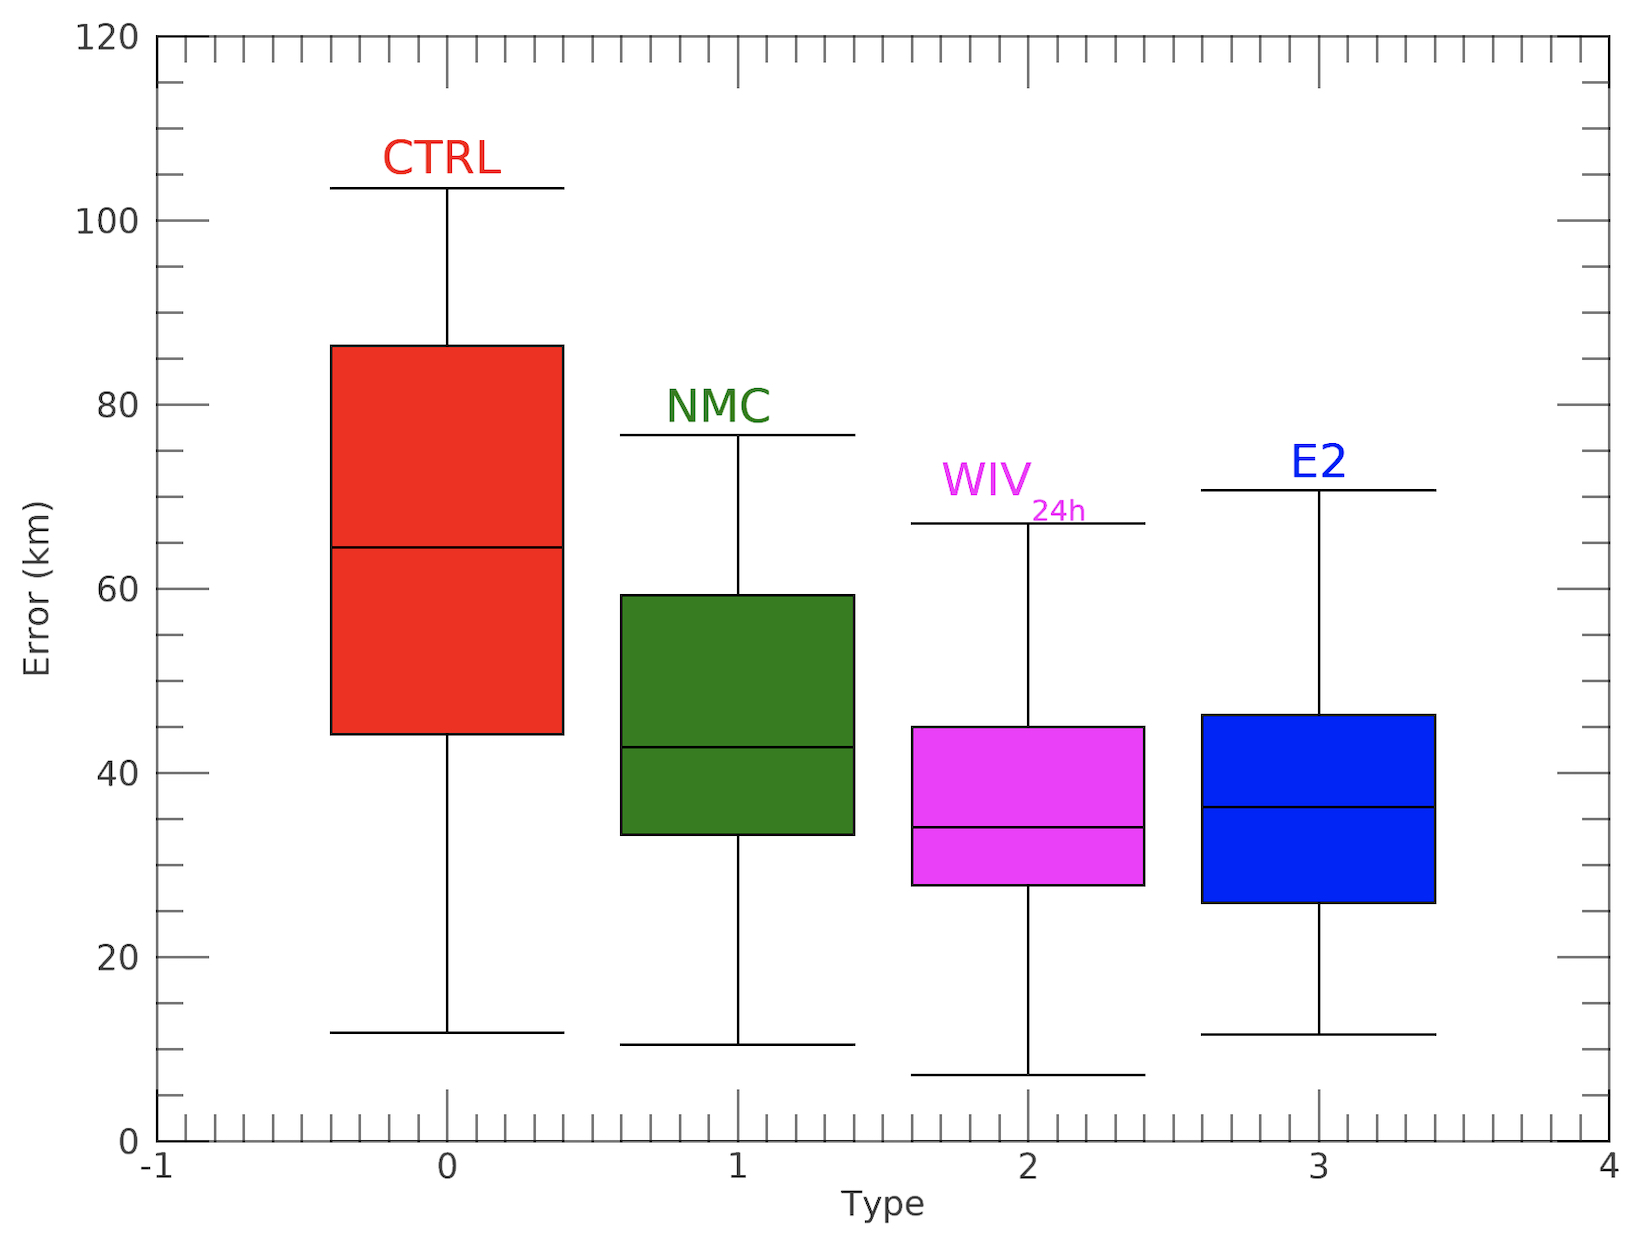
Figure 14Trajectories error distribution, respect to the representative member 42, of the ensembles CTRL, NMC, WIV24h and E2. The boxes show the 25th and the 75th percentile, the black line inside the box is the median and the maximum and minimum values are the extremes of the error bar.
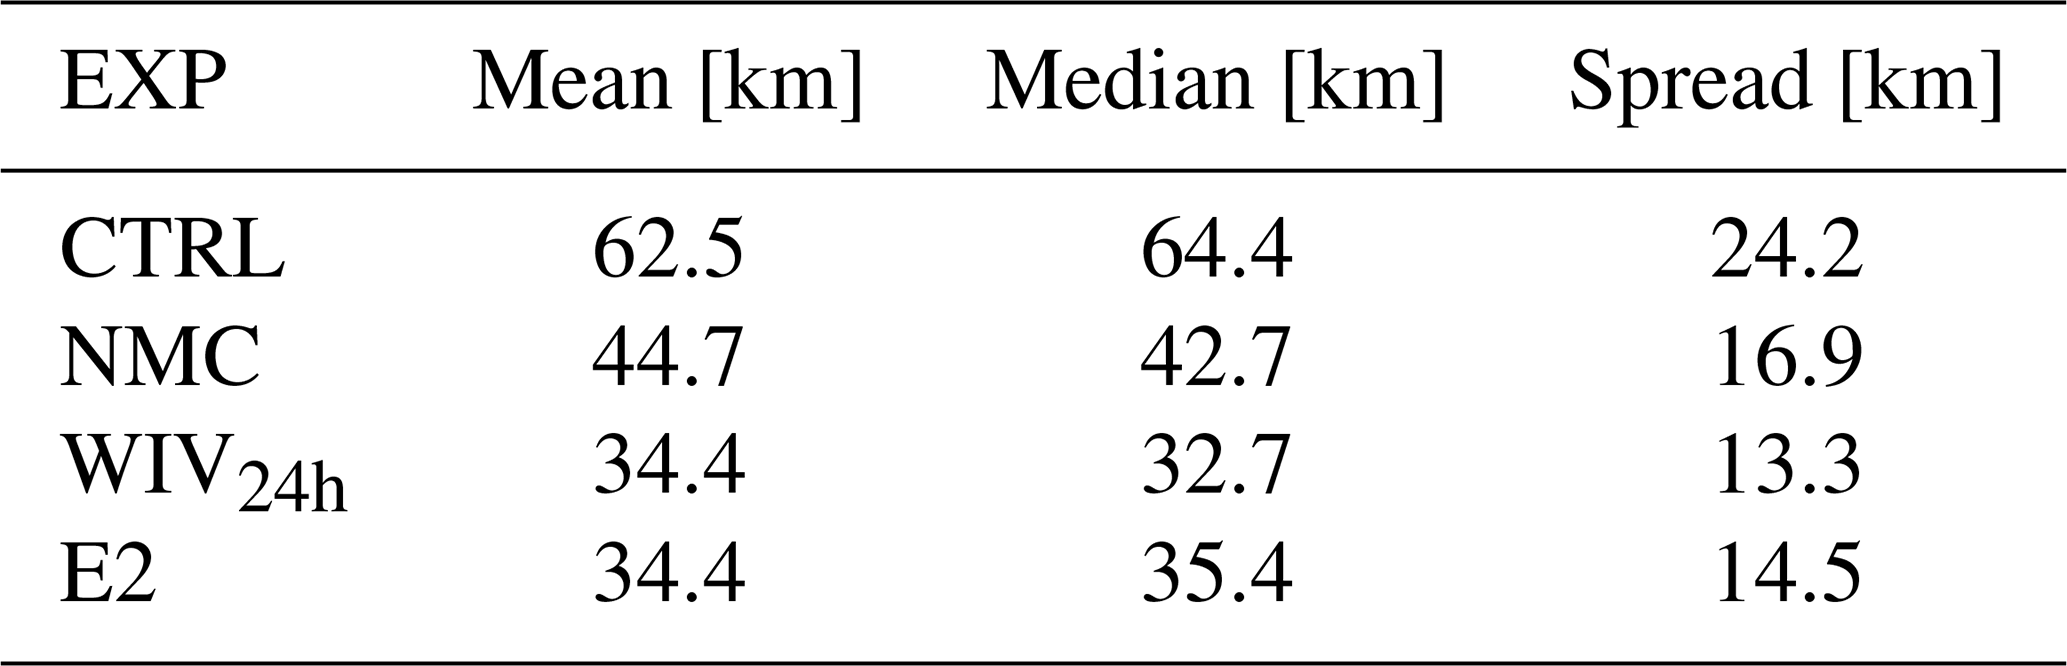
The assimilation of WIVERN winds has, in general, a positive impact on the prediction of the Medicane Ianos trajectory as the experiment with doubled observation error has a performance much closer to WIV24h than to CTRL. Specifically, the average error of the experiment E2 is very similar to that of WIV24h ensemble (both about 34.4 km), however the median error is larger (35.4 km) for E2 compared to WIV24h (32.7 km). Similarly, the spread of the ensemble error is larger for E2 (14.5 km) compared to WIV24h (13.3 km). Statistics for the trajectories error distributions are summarized in Table 2.
Table 2Statistics of the trajectories error distribution, respect to the representative member 42, of the ensembles CTRL, NMC, WIV24h and E2.
To better understand the low sensitivity of this case study to the observation error, Fig. 15 shows the bias and RMSE of CTRL as a function of the vertical level. The first guess error (RMSE) is larger than the observation error and also of the model wind speed error (Fig. 5b), and inflating the observation error has a relatively small impact on the WIVERN winds DA performance. However, it is important to point out that winds around Medicanes are very intense, and a wrong positioning of the storm results in high first-guess errors for the winds; in general it is expected that the role of the WIVERN observation error is larger than that reported for the Ianos case study.
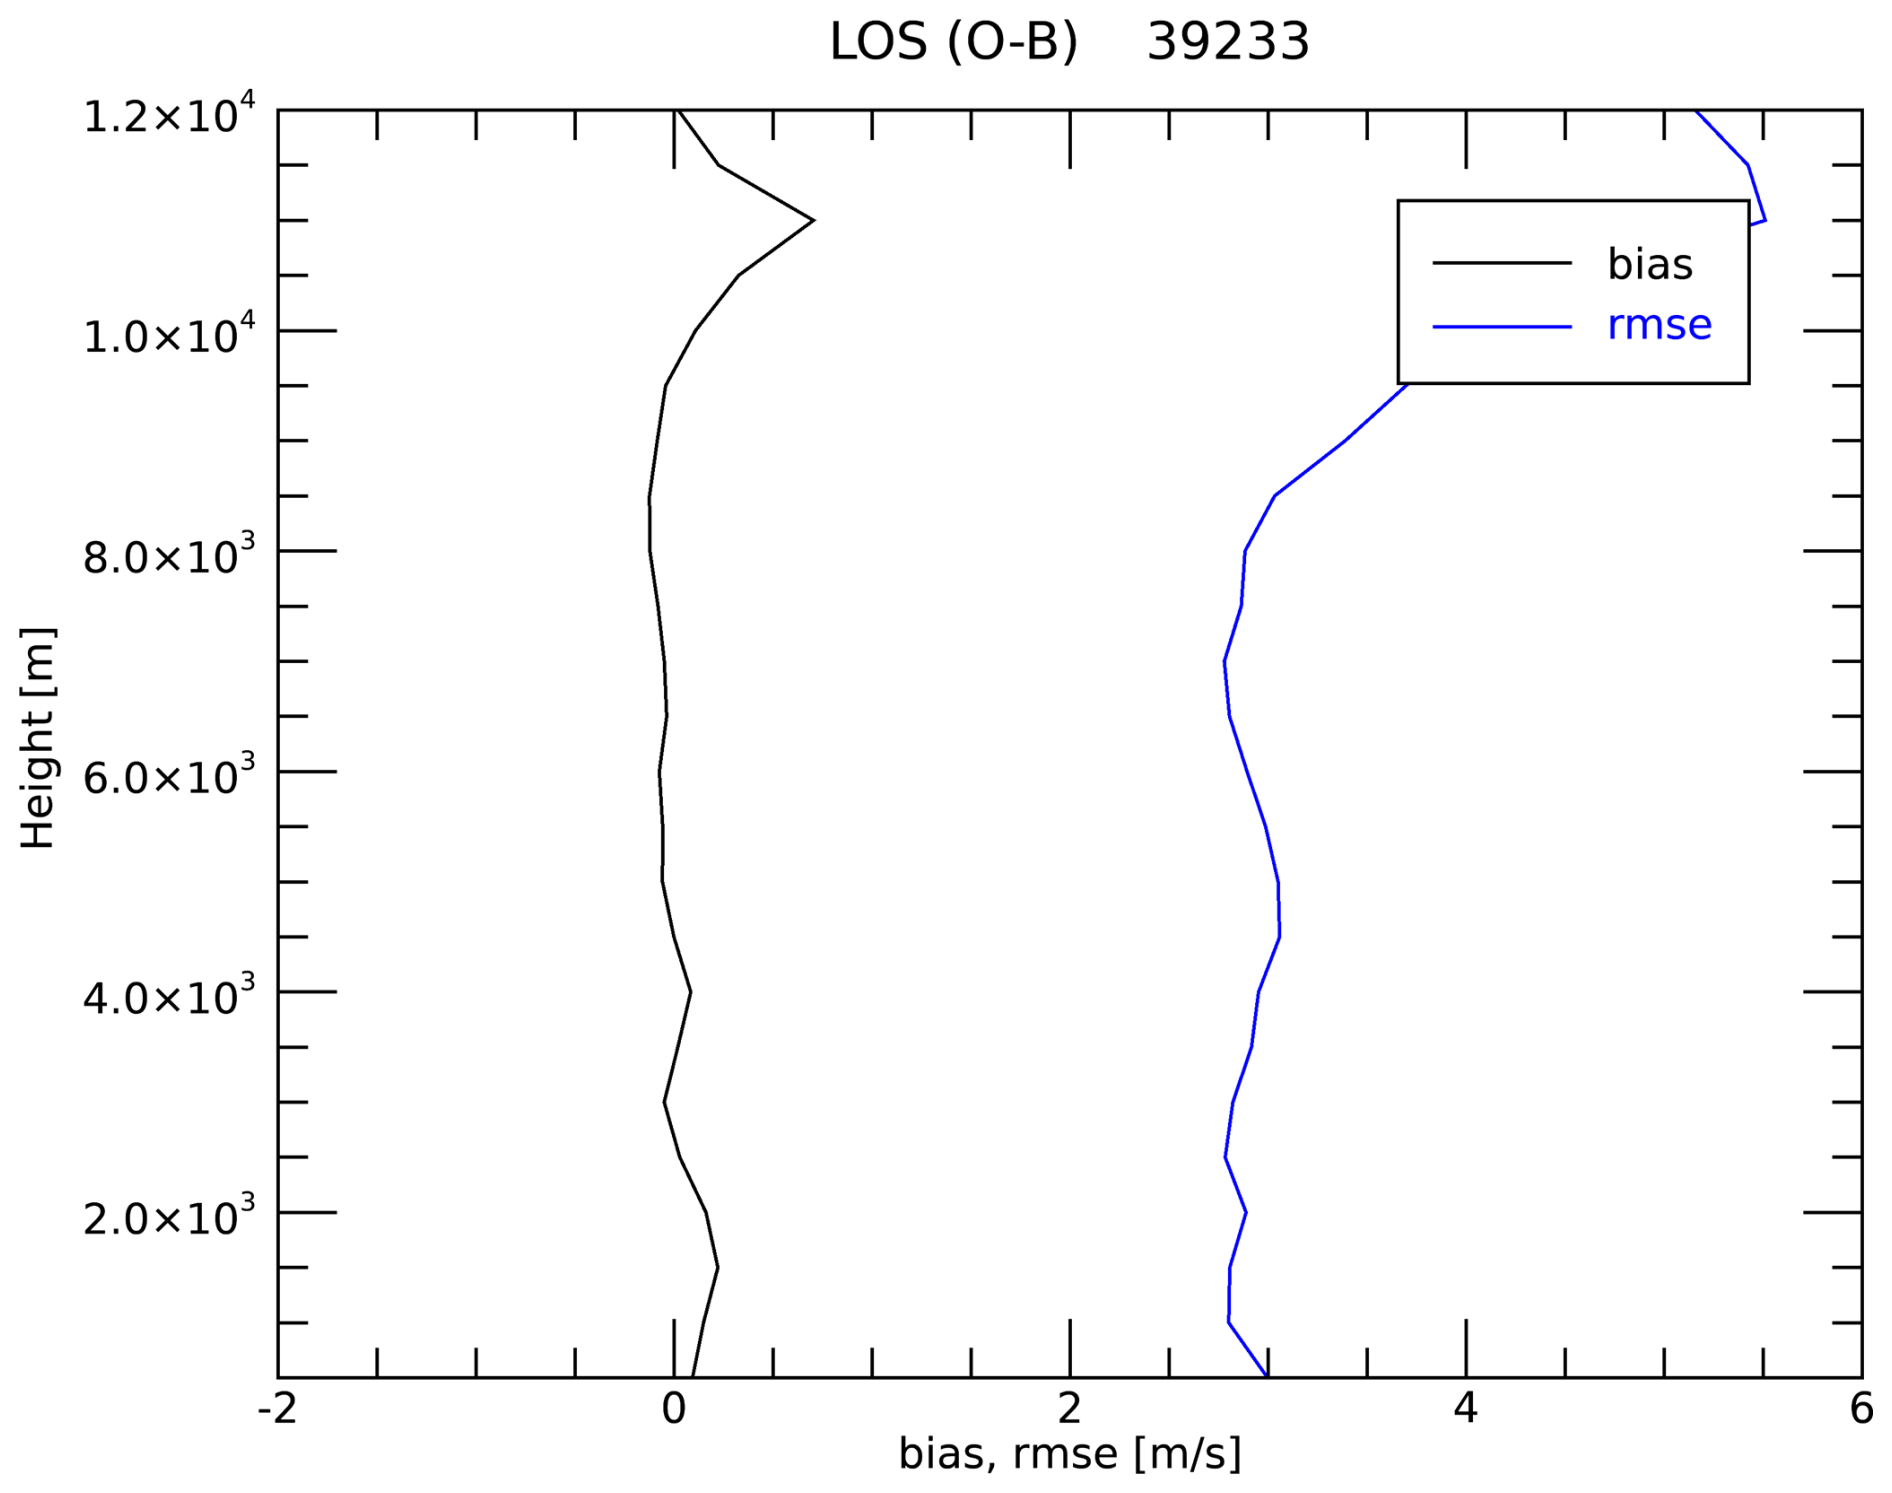
Figure 15Observation minus background errors [m s−1] for the winds along the line of sight as a function of the vertical levels.
Changing the background error matrix for this specific case has a notable impact on the trajectory forecast (Fig. 14). This is expected in some measure, as the physical characteristics of the Medicane are rather different from those of the circulation of the period, and choosing a climatological and static background error matrix is suboptimal compared to choosing a background error matrix aware of the specific error of the day. Specifically, the trajectory error averaged over the whole ensemble for the NMC experiment is 44.7 km (35.4 km for WIV24h), the median is 42.7 km (32.7 km for WIV24h) and the spread of the ensemble is 16.9 km (13.3 km for WIV24h). All these statistics show the sensitivity of the WIVERN DA impact to the choice of the background error matrix (Table 2).
3.4 Numerical experiments for different initialization times
In this section we consider the result of two experiments in which the ensemble is initialized one day before compared to that of previous sections, i.e. at 12:00 UTC on 15 September, and two analysis/forecasts are considered: (a) assimilation at 12:00 UTC on 16 September and forecast from 12:00 UTC on 16 September to 00:00 UTC on 18 October (36 h forecast, Fig. 2), experiment WIV24h16; and (b) assimilation at 00:00 UTC on 16 September and forecast from 00:00 UTC on 16 September to 00:00 UTC on 18 October (48 h forecast, Fig. 2), experiment WIV12h. The technique, the WRF and the data assimilation settings are those discussed in previous sections, with the following differences: (a) when generating pseudo-observations, the track of the WIVERN satellite (Fig. 1b) was shifted by 2° to the west to center the storm position; (b) the model output was saved every 3 h and there are two traits between two dots; (c) the background error matrix was computed at 12:00 UTC on 16 September 2020, i.e. 24 h after the ensemble initial time. We also consider the result of the CTRL forecast, starting at 12:00 UTC on 15 September 2020 (Fig. 2).
Figure 16a shows the result of the CTRL forecast. The best forecast, whose trajectory is in best agreement with the a posteriori estimated trajectory of Ianos (Flaounas et al., 2023), is that of the member 32 whose track is depicted in black. Looking to the results of Fig. 16a there are two main points to highlight: (a) the spread of the trajectory is much larger than that of Fig. 3; (b) many trajectories go south of Greece and towards the Aegean Sea and, for there trajectories, the surface pressure remains greater than 1000 hPa. These two points show the lower predictability of the Medicane Ianos on 15 September compared to 16 September; more specifically, from Fig. 16a it is not clear if the storm would have deepened, and the spread of the trajectories remains wide to take precise actions.
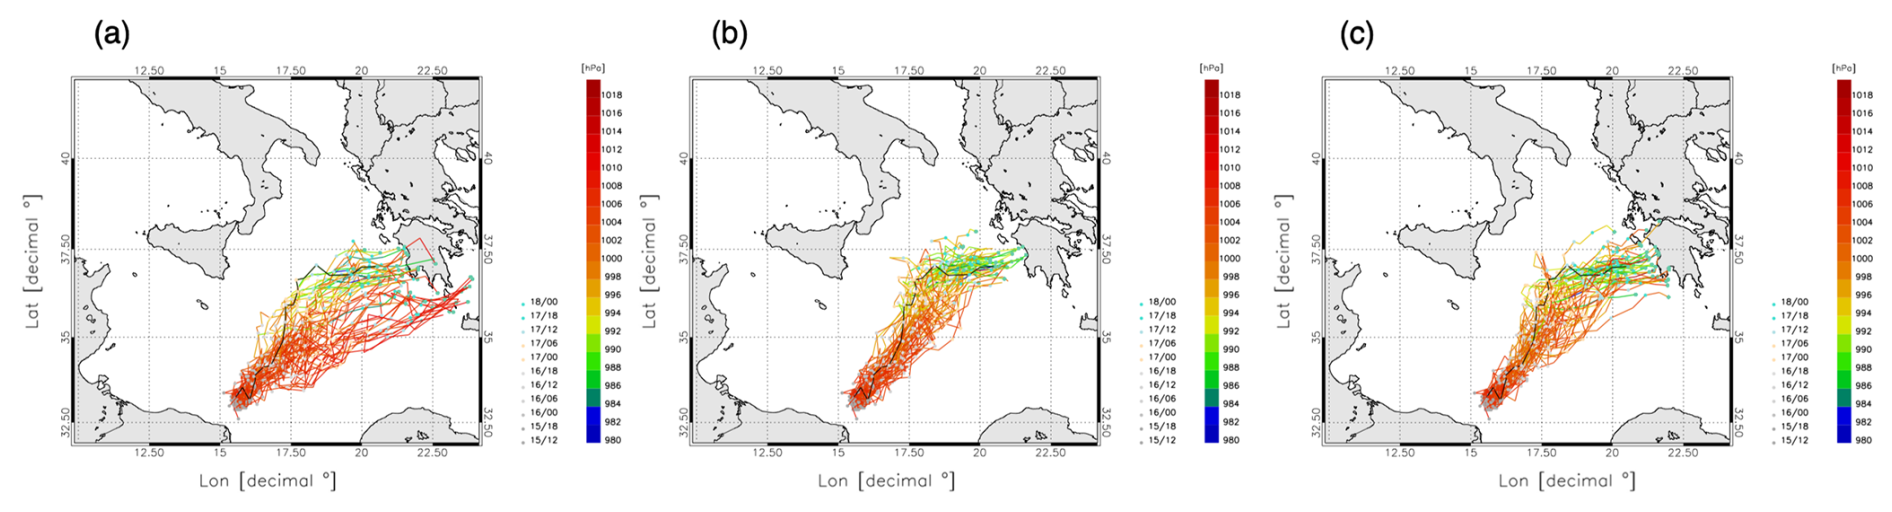
Figure 16Trajectories of the Medicane Ianos for the experiment starting at 12:00 UTC on 15 September; (a) CTRL ensemble; (b) WIV24h16; (c) WIV12h. In panel (b) the assimilation is done at 12:00 UTC on 16 September; in panel (c) the assimilation is done at 00:00 UTC on 16 September. The trajectory in black is that of the reference member 32.
Both uncertainties are solved by the assimilation of WIVERN pseudo-observations in the WIV24h16 forecast (Fig. 16b). The trajectories of this ensemble are all going towards the western Peloponnese and the storm is deepening. The trajectories of the WIV12h forecast are shown in Fig. 16c; all trajectories, with just one exception, approach the western and southern Peloponnese; again most of these trajectories show a clear deepening of the cyclone improving the forecast of the CTRL ensemble.
All in all the results of this section show that WIVERN would have been able to constrain the forecast of the Medicane Ianos also for the ensemble issued on 15 September 2020, giving a clear suggestion, with more than a day of advance, that the Medicane would have made its landfall in western/southern Peloponnese and that the storm would have deepened. It is also noticed that the forecast of the Medicane Ianos can be refined by the WIVERN wind observations DA as the Medicane is approaching the landfall; this is clearly shown by the comparison of the ensemble forecasts of Figs. 3, 9, and 16b, c.
In this paper we considered the assimilation of WIVERN winds along the Line of Sight (LoS) in the WRF model for the case study of the Medicane Ianos. The assimilation is done using the En3DVar approach and pseudo-observations are generated from one member of the ensemble whose trajectory was in best agreement with the best a posteriori estimated trajectory of Ianos.
Two En3DVar assimilation cycles are considered: 3 and 24 h. The first case, with very frequent data assimilation cycles, is used to verify the proper setting of the En3DVar and WRF model; it could represent a realistic condition if a constellation of four WIVERN satellites were operated. The second case corresponds to the realistic situation in which WIVERN samples the Ianos storm once. The WIV12h simulation also assimilated WIVERN winds once.
Results show an important impact of WIVERN wind DA on the WRF forecast. The trajectory forecast is improved by more than 40 %. The forecast improvement is not confined to the trajectories but it is transferred from the dynamic to the mass field through the model physics, as shown by the improvement of the sea level pressure forecast and surface wind speed. This consideration applies also to the rainfall forecast which, with WIVERN DA, is more in agreement with that of the representative member for both pattern and intensity. Similarly, the wind forecast for the Kefalonia island is improved for both speed and direction.
We presented the results of two sensitivity tests changing the observation and background errors. For the specific case of the Medicane Ianos, the impact of changing the background error matrix has a larger impact. This is caused by two main reasons: (a) the first guess error is similar to the background and observation errors, also when the latter is inflated and the impact of assimilating WIVERN winds is expected high; (b) Medicanes are storms with peculiar characteristics and the background error matrix derived from the ensemble and representative of the “error of the day” is more appropriate for DA than the background error matrix computed for the whole period.
We considered the results of two additional forecasts starting at 00:00 and 12:00 UTC on 16 September. For these forecasts, the background is given by the CTRL forecast starting at 12:00 UTC on 15 September, which shows a larger degree of uncertainty compared to the CTRL forecast issued on 16 September at 12:00 UTC. Indeed not only the spread of the trajectory is larger for the CTRL forecast issued at 12:00 UTC on 15 September, but there are a number of trajectories traveling south of Greece and going towards the Aegean Sea. These trajectories do not simulate the deepening of the storm. The impact of WIVERN winds DA is significant: not only the trajectories are predicted to go towards western Peloponnese, but the deepening of the storm is consistently predicted.
Recently, Pantillon et al. (2024) published a paper showing a model intercomparison for the Medicane Ianos forecast with 10 models participating to the comparison (including WRF). One of the aspects considered in the paper is the simulation of the Ianos trajectory from different models. Results show a spread of the models trajectories which is in line with the results shown by the CTRL ensemble; in addition most of the trajectories go to the south of the best a-posteriori estimated trajectory followed by Ianos, in agreement with the results of the CTRL ensemble. The results of this paper show that the WIVERN winds DA has the potential to narrow the spread among different models in the forecast of such events. In this sense, this study is of interest not only for modelers using WRF, but also for the wider community of NWP users and developers because it shows that the assimilation of WIVERN winds, when available, has a potential to improve the forecast for long time ranges (24–48 h).
While the performance of WIVERN DA for the Ianos case study is promising further research is needed. First, we considered only one case study and no general conclusions can be derived on the performance of the WIVERN DA at the regional scale. This is valid not only considering other storm types, as extra-tropical cyclones in the Mediterranean, but also Medicanes, as they are highly variable in structure, environment, and predictability, and it remains unclear whether the demonstrated benefits of WIVERN wind assimilation would hold across other cases with different dynamical regimes or forecast challenges. Second, we assimilated WIVERN data only, neglecting the global observing system, which is, however, considered indirectly from the ECMWF initialisation. This could result in an overestimation of the WIVERN impact on the forecast of the Medicane Ianos. Third we assumed that the storm is well sampled and that the Medicane is nearly at the center of the satellite swath. Considering the above limitations of this study, the results shown in this paper could represent an upper limit of what expected from the DA of WIVERN winds at the regional scale and further studies are needed to precisely quantify this point.
This Appendix provides further details about the 3DVar. We use the incremental formulation of the cost-function; let x denote the state vector and δx = x−xb the increment respect to the background state vector xb, the 3DVar cost-function is:
where B is the background error covariance matrix, R is the observations error matrix, d = yo−H(xb) are the innovations and H is the forward observation operator, transforming the state vector into the observation space, and H is the derivative of H respect to x. The B−1, due to its large dimensions, cannot be calculated directly with inversion matrix techniques and we introduce a pre-conditioning transform U such that B = UUT. With this transform the analysis control variable is ν, where δx = Uν, and 2Jb = νTν. The cost-function becomes:
The transformation U is given by a series of simpler transform in the x, y and z directions, and the order of their application is important. In the 3DVar used in this work U = UzUyUx, where Ux, Uy and Uz are computed starting from the background error matrices in the x, y and z directions, Bx, By and Bz, respectively, using eigenvalue-eigenvector decompositions. Specifically, Bx and By are specified as correlation error matrices whose length-scales are computed from the NMC (National Meteorological Center) method (see Barker et al., 2004 for details), and the transforms Ux and Uy are computed by the eigenvalue-eigenvector decomposition of the Bx and By, respectively. The transform Uz is calculated by the eigenvalue-eigenvector decomposition of the vertical background error matrix Bz (see Federico, 2013 for details). In the 3DVar formulation of this paper, the length-scales in the x and y directions are equal to each other and are functions of the vertical level. The length-scales are around 20–30 km from the surface up to 5 km height, then they increases from 30 to 50–60 km in the height range 6000–11 000 m, then the length-scales decrease again in the upper troposphere and lower stratosphere and are in the range 20–40 km for heights above 15 000 m.
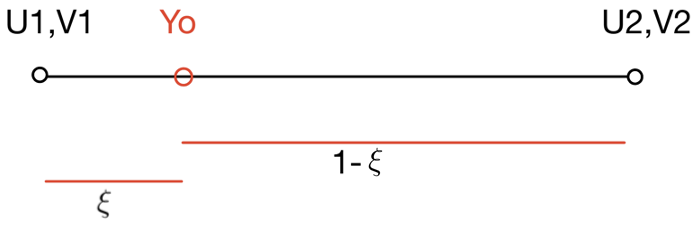
Figure A1 shows the simplest example of assimilating one WIVERN observation Yo for a one-dimensional grid formed by two grid-points (1 and 2) with wind components (U1, V1) and (U2, V2), respectively. Denoting ξ the fraction distance of the observation from the grid-point 1, the vector H(xb) and the operator H are given by:
and:
Finally, the minimization of the cost-function J is done iteratively with the conjugate gradient method by calculation of the gradient ∇νJ:
The 3DVar software with the latest updates can be downloaded from the webpage http://meteo.artov.isac.cnr.it/ (last access: 12 January 2026). Data can be requested to the corresponding author.
SF and MM coordinated the experiment; SF, RCT and CT maintain and develop the 3DVar code, SF provided the simulations; AB, CC and FM provided the WIVERN simulator; AB and MP provided feedback and information on WIVERN; SF prepared the paper and the figures. All authors contributed to the revision of the paper.
The contact author has declared that none of the authors has any competing interests.
Publisher's note: Copernicus Publications remains neutral with regard to jurisdictional claims made in the text, published maps, institutional affiliations, or any other geographical representation in this paper. The authors bear the ultimate responsibility for providing appropriate place names. Views expressed in the text are those of the authors and do not necessarily reflect the views of the publisher.
The work by Cinzia Cambiotti, Alessandro Battaglia, Mario Montopoli, Stefano Federico, and Rosa Claudia Torcasio has been partially funded by the Italian Space Agency (ASI) project “Scientific studies for the Wind Velociy Radar Nephoscope (WIVERN) mission” (project no: 2023-44-HH.0). The work by FM was carried out within the Space It Up project funded by the Italian Space Agency, ASI, and the Ministry of University and Research, MUR, under contract no. 2024-5-E.0 – CUP no. I53D24000060005. ECMWF is acknowledged for providing IC/BC for the WRF simulations, and for providing part of the computational resources.
This research has been supported by the Agenzia Spaziale Italiana (grant nos. 2023-44-HH.0 and 2024-5-E.0 – CUP no. I53D24000060005).
This paper was edited by Shira Raveh-Rubin and reviewed by two anonymous referees.
Ali, E., Cramer, W., Carnicer, J., Georgopoulou, E., Hilmi, N., Le Cozannet, G., and Lionello, P.: Cross-Chapter Paper 4: Mediterranean Region, in: Climate Change 2022: Impacts, Adaptation and Vulnerability. Contribution of Working Group II to the Sixth Assessment Report of the Intergovernmental Panel on Climate Change, edited by: Pörtner, H.-O., Roberts, D. C., Tignor, M., Poloczanska, E. S., Mintenbeck, K., Alegría, A., Craig, M., Langsdorf, S., Löschke, S., Möller, V., Okem, A., and Rama, B., Cambridge University Press, 2233–2272, https://doi.org/10.1017/9781009325844.021, 2023. a
Androulidakis, Y., Makris, C., Mallios, Z., Pytharoulis, I., Baltikas, V., and Krestenitis, Y.: Storm surges and coastal inundation during extreme events in the Mediterranean Sea: the IANOS Medicane, Nat. Hazards, 117, 939–978, https://doi.org/10.1007/s11069-023-05890-6, 2023. a
Baker, W. E., Atlas, R., Cardinali, C., Clement, A., Emmitt, G. D., Gentry, B. M., Hardesty, R. M., Källén, E., Kavaya, M. J., Langland, R., Ma, Z., Masutani, M., McCarty, W., Pierce, R. B., Pu, Z., Riishojgaard, L. P., Ryan, J., Tucker, S., Weissmann, M., and Yoe, J. G.: Lidar-Measured Wind Profiles: The Missing Link in the Global Observing System, B. Am. Meteorol. Soc., 95, 543–564, https://doi.org/10.1175/BAMS-D-12-00164.1, 2014. a
Barker, D. M., Huang, W., Guo, Y.-R., Bourgeois, A. J., and Xiao, Q. N.: A Three-Dimensional Variational Data Assimilation System for MM5: Implementation and Initial Results, Mon. Weather Rev., 132, 897–914, https://doi.org/10.1175/1520-0493(2004)132<0897:ATVDAS>2.0.CO;2, 2004. a, b, c
Battaglia, A., Martire, P., Caubet, E., Phalippou, L., Stesina, F., Kollias, P., and Illingworth, A.: Observation error analysis for the WInd VElocity Radar Nephoscope W-band Doppler conically scanning spaceborne radar via end-to-end simulations, Atmos. Meas. Tech., 15, 3011–3030, https://doi.org/10.5194/amt-15-3011-2022, 2022. a, b, c
Battaglia, A., Cambiotti, C., Carbone, A. F., and Da Silva, S.: Reconstruction of the Horizontal Wind Field Inside Weather Systems from the Sparse Sampling Envisaged for the Wind Velocity Radar Nephoscope (WIVERN) Mission, in: IGARSS 2024 - 2024 IEEE International Geoscience and Remote Sensing Symposium, 8925–8927, https://doi.org/10.1109/IGARSS53475.2024.10640420, 2024. a
Battaglia, A., Rizik, A., Sikaneta, I., and Tridon, F.: I and Qs Simulation and Processing Envisaged for Spaceborne Polarization Diversity Doppler Radars, IEEE T. Geosci. Remote, 63, 1–14, https://doi.org/10.1109/TGRS.2025.3529672, 2025. a
Battaglia, A., Rabino, R., Mroz, K., Tridon, F., and Parodi, A.: Non uniform beam filling correction for the Doppler velocity measured by the WIVERN conically scanning radar, J. Atmos. Ocean. Tech., https://doi.org/10.1175/JTECH-D-25-0050.1, in press, 2026. a
Bennitt, G. V., Johnson, H. R., Weston, P. P., Jones, J., and Pottiaux, E.: An assessment of ground-based GNSS Zenith Total Delay observation errors and their correlations using the Met Office UKV model, Q. J. Roy. Meteor. Soc., 143, 2436–2447, https://doi.org/10.1002/qj.3097, 2017. a
Comellas Prat, A., Federico, S., Torcasio, R. C., D'Adderio, L. P., Dietrich, S., and Panegrossi, G.: Evaluation of the Sensitivity of Medicane Ianos to Model Microphysics and Initial Conditions Using Satellite Measurements, Remote Sens., 13, 4984, https://doi.org/10.3390/rs13244984, 2021. a, b
D'Adderio, L. P., Casella, D., Dietrich, S., Sanò, P., and Panegrossi, G.: GPM-CO observations of Medicane Ianos: Comparative analysis of precipitation structure between development and mature phase, Atmos. Res., 273, 106174, https://doi.org/10.1016/j.atmosres.2022.106174, 2022. a, b, c
Dafis, S., Claud, C., Kotroni, V., Lagouvardos, K., and Rysman, J.-F.: Insights into the convective evolution of Mediterranean tropical-like cyclones, Q. J. Roy. Meteor. Soc., 146, 4147–4169, https://doi.org/10.1002/qj.3896, 2020. a
Di Francesca, V., D'Adderio, L. P., Sanò, P., Rysman, J.-F., Casella, D., and Panegrossi, G.: Passive microwave-based diagnostics of medicanes over the period 2000–2021, Atmos. Res., 316, 107922, https://doi.org/10.1016/j.atmosres.2025.107922, 2025. a
Dudhia, J.: Numerical Study of Convection Observed during the Winter Monsoon Experiment Using a Mesoscale Two-Dimensional Model, J. Atmos. Sci., 46, 3077–3107, https://doi.org/10.1175/1520-0469(1989)046<3077:NSOCOD>2.0.CO;2, 1989. a
Emanuel, K.: Genesis and maintenance of “Mediterranean hurricanes”, Adv. Geosci., 2, 217–220, https://doi.org/10.5194/adgeo-2-217-2005, 2005. a
Federico, S.: Implementation of a 3D-Var system for atmospheric profiling data assimilation into the RAMS model: initial results, Atmos. Meas. Tech., 6, 3563–3576, https://doi.org/10.5194/amt-6-3563-2013, 2013. a, b, c, d
Feng, C. and Pu, Z.: The impacts of assimilating Aeolus horizontal line-of-sight winds on numerical predictions of Hurricane Ida (2021) and a mesoscale convective system over the Atlantic Ocean, Atmos. Meas. Tech., 16, 2691–2708, https://doi.org/10.5194/amt-16-2691-2023, 2023. a
Ferrarin, C., Pantillon, F., Davolio, S., Bajo, M., Miglietta, M. M., Avolio, E., Carrió, D. S., Pytharoulis, I., Sanchez, C., Patlakas, P., González-Alemán, J. J., and Flaounas, E.: Assessing the coastal hazard of Medicane Ianos through ensemble modelling, Nat. Hazards Earth Syst. Sci., 23, 2273–2287, https://doi.org/10.5194/nhess-23-2273-2023, 2023. a
Fita, L. and Flaounas, E.: Medicanes as subtropical cyclones: the December 2005 case from the perspective of surface pressure tendency diagnostics and atmospheric water budget, Q. J. Roy. Meteor. Soc., 144, 1028–1044, https://doi.org/10.1002/qj.3273, 2018. a
Flaounas, E., Gray, S. L., and Teubler, F.: A process-based anatomy of Mediterranean cyclones: from baroclinic lows to tropical-like systems, Weather Clim. Dynam., 2, 255–279, https://doi.org/10.5194/wcd-2-255-2021, 2021. a
Flaounas, E., Davolio, S., Raveh-Rubin, S., Pantillon, F., Miglietta, M. M., Gaertner, M. A., Hatzaki, M., Homar, V., Khodayar, S., Korres, G., Kotroni, V., Kushta, J., Reale, M., and Ricard, D.: Mediterranean cyclones: current knowledge and open questions on dynamics, prediction, climatology and impacts, Weather Clim. Dynam., 3, 173–208, https://doi.org/10.5194/wcd-3-173-2022, 2022. a
Flaounas, E., Aragão, L., Bernini, L., Dafis, S., Doiteau, B., Flocas, H., Gray, S. L., Karwat, A., Kouroutzoglou, J., Lionello, P., Miglietta, M. M., Pantillon, F., Pasquero, C., Patlakas, P., Picornell, M. Á., Porcù, F., Priestley, M. D. K., Reale, M., Roberts, M. J., Saaroni, H., Sandler, D., Scoccimarro, E., Sprenger, M., and Ziv, B.: A composite approach to produce reference datasets for extratropical cyclone tracks: application to Mediterranean cyclones, Weather Clim. Dynam., 4, 639–661, https://doi.org/10.5194/wcd-4-639-2023, 2023. a, b, c, d, e
Garrett, K., Liu, H., Ide, K., Hoffman, R. N., and Lukens, K. E.: Optimization and impact assessment of Aeolus HLOS wind assimilation in NOAA's global forecast system, Q. J. Roy. Meteor. Soc., 148, 2703–2716, https://doi.org/10.1002/qj.4331, 2022. a
Giorgi, F. and Lionello, P.: Climate change projections for the Mediterranean region, Global Planet. Change, 63, 90–104, https://doi.org/10.1016/j.gloplacha.2007.09.005, 2008. a
Hagelin, S., Azad, R., Lindskog, M., Schyberg, H., and Körnich, H.: Evaluating the use of Aeolus satellite observations in the regional numerical weather prediction (NWP) model Harmonie–Arome, Atmos. Meas. Tech., 14, 5925–5938, https://doi.org/10.5194/amt-14-5925-2021, 2021. a
Hamill, T. M. and Snyder, C.: A Hybrid Ensemble Kalman Filter–3D Variational Analysis Scheme, Mon. Weather Rev., 128, 2905–2919, https://doi.org/10.1175/1520-0493(2000)128<2905:AHEKFV>2.0.CO;2, 2000. a
Horányi, A., Cardinali, C., Rennie, M., and Isaksen, L.: The assimilation of horizontal line-of-sight wind information into the ECMWF data assimilation and forecasting system. Part I: The assessment of wind impact, Q. J. Roy. Meteor. Soc., 141, 1223–1232, https://doi.org/10.1002/qj.2430, 2015. a, b
Illingworth, A. J., Barker, H. W., Beljaars, A., Ceccaldi, M., Chepfer, H., Clerbaux, N., Cole, J., Delanoë, J., Domenech, C., Donovan, D. P., Fukuda, S., Hirakata, M., Hogan, R. J., Huenerbein, A., Kollias, P., Kubota, T., Nakajima, T., Nakajima, T. Y., Nishizawa, T., Ohno, Y., Okamoto, H., Oki, R., Sato, K., Satoh, M., Shephard, M. W., Velázquez-Blázquez, A., Wandinger, U., Wehr, T., and van Zadelhoff, G.-J.: The EarthCARE Satellite: The Next Step Forward in Global Measurements of Clouds, Aerosols, Precipitation, and Radiation, B. Am. Meteorol. Soc., 96, 1311–1332, https://doi.org/10.1175/BAMS-D-12-00227.1, 2015. a
Illingworth, A. J., Battaglia, A., Bradford, J., Forsythe, M., Joe, P., Kollias, P., Lean, K., Lori, M., Mahfouf, J.-F., Melo, S., Midthassel, R., Munro, Y., Nicol, J., Potthast, R., Rennie, M., Stein, T. H. M., Tanelli, S., Tridon, F., Walden, C. J., and Wolde, M.: WIVERN: A New Satellite Concept to Provide Global In-Cloud Winds, Precipitation, and Cloud Properties, B. Am. Meteorol. Soc., 99, 1669–1687, https://doi.org/10.1175/BAMS-D-16-0047.1, 2018. a, b
Janjić, Z. I.: The Step-Mountain Eta Coordinate Model: Further Developments of the Convection, Viscous Sublayer, and Turbulence Closure Schemes, Mon. Weather Rev., 122, 927–945, https://doi.org/10.1175/1520-0493(1994)122<0927:TSMECM>2.0.CO;2, 1994. a
Jones, T. A., Knopfmeier, K., Wheatley, D., Creager, G., Minnis, P., and Palikonda, R.: Storm-Scale Data Assimilation and Ensemble Forecasting with the NSSL Experimental Warn-on-Forecast System. Part II: Combined Radar and Satellite Data Experiments, Weather Forecast., 31, 297–327, https://doi.org/10.1175/WAF-D-15-0107.1, 2016. a
Kalnay, E., Mote, S., and Da, C.: Earth system modeling, data assimilation and predictability: atmosphere, oceans, land and human systems, Cambridge University Press, ISBN 978-1-107-40146-4, 2024. a
Miglietta, M. M., Flaounas, E., González-Alemán, J. J., Panegrossi, G., Gaertner, M. A., Pantillon, F., Pasquero, C., Schultz, D. M., D'Adderio, L. P., Dafis, S., Husson, R., Ricchi, A., Carrió Carrió, D. S., Davolio, S., Fita, L., Picornell, M. Á., Pytharoulis, I., Raveh-Rubin, S., Scoccimarro, E., Bernini, L., Cavicchia, L., Conte, D., Ferretti, R., Flocas, H., Gutiérrez-Fernández, J., Hatzaki, M., Homar Santaner, V., Jansà, A., and Patlakas, P.: Defining Medicanes: Bridging the Knowledge Gap between Tropical and Extratropical Cyclones in the Mediterranean, B. Am. Meteorol. Soc., 106, E1955–E1971, https://doi.org/10.1175/BAMS-D-24-0289.1, 2025. a
Lagouvardos, K., Karagiannidis, A., Dafis, S., Kalimeris, A., and Kotroni, V.: Ianos – A Hurricane in the Mediterranean, B. Am. Meteorol. Soc., 103, E1621–E1636, https://doi.org/10.1175/BAMS-D-20-0274.1, 2022. a, b
Lfarh, W., Pantillon, F., and Chaboureau, J.-P.: The Downward Transport of Strong Wind by Convective Rolls in a Mediterranean Windstorm, Mon. Weather Rev., 151, 2801–2817, https://doi.org/10.1175/MWR-D-23-0099.1, 2023. a
Li, L., Žagar, N., Raeder, K., and Anderson, J. L.: Comparison of temperature and wind observations in the Tropics in a perfect-model, global EnKF data assimilation system, Q. J. Roy. Meteor. Soc., 149, 2367–2385, https://doi.org/10.1002/qj.4511, 2023. a
Li, Y., Wang, X., and Xue, M.: Assimilation of Radar Radial Velocity Data with the WRF Hybrid Ensemble–3DVAR System for the Prediction of Hurricane Ike (2008), Mon. Weather Rev., 140, 3507–3524, https://doi.org/10.1175/MWR-D-12-00043.1, 2012. a
Lorenc, A. C., Bowler, N. E., Clayton, A. M., Pring, S. R., and Fairbairn, D.: Comparison of Hybrid-4DEnVar and Hybrid-4DVar Data Assimilation Methods for Global NWP, Mon. Weather Rev., 143, 212–229, https://doi.org/10.1175/MWR-D-14-00195.1, 2015. a
Martin, A., Weissmann, M., and Cress, A.: Investigation of links between dynamical scenarios and particularly high impact of Aeolus on numerical weather prediction (NWP) forecasts, Weather Clim. Dynam., 4, 249–264, https://doi.org/10.5194/wcd-4-249-2023, 2023. a
Matsangouras, I., Avgoustoglou, E., Pytharoulis, I., and Nastos, P.: The Impact of Aeolus Wind Profile Measurements on Severe Weather Events: A COSMO NWP Case Study over Thessaly, Environ. Sci. Proc., 26, 47, https://doi.org/10.3390/environsciproc2023026047, 2023. a
Miglietta, M. M. and Rotunno, R.: Development mechanisms for Mediterranean tropical-like cyclones (medicanes), Q. J. Roy. Meteor. Soc., 145, 1444–1460, https://doi.org/10.1002/qj.3503, 2019. a
Mlawer, E. J., Taubman, S. J., Brown, P. D., Iacono, M. J., and Clough, S. A.: Radiative transfer for inhomogeneous atmospheres: RRTM, a validated correlated-k model for the longwave, J. Geophys. Res.-Atmos., 102, 16663–16682, https://doi.org/10.1029/97JD00237, 1997. a
Pan, Y., Zhu, K., Xue, M.,Wang, X., Hu, M., Benjamin, S. G., Weygandt, S. S., and Whitaker, J. S.: A GSI-Based Coupled EnSRF–En3DVar Hybrid Data Assimilation System for the Operational Rapid Refresh Model: Tests at a Reduced Resolution, Mon. Weather Rev., 142, 3756–3780, https://doi.org/10.1175/MWR-D-13-00242.1, 2014. a
Pandey, S. K. and Yadav, K.: A mathematical model for viscous flow dynamics of tropical cyclones, Eur. J. Mech. B-Fluid., 111, 72–80, https://doi.org/10.1016/j.euromechflu.2024.12.003, 2025. a
Pantillon, F., Davolio, S., Avolio, E., Calvo-Sancho, C., Carrió, D. S., Dafis, S., Gentile, E. S., Gonzalez-Aleman, J. J., Gray, S., Miglietta, M. M., Patlakas, P., Pytharoulis, I., Ricard, D., Ricchi, A., Sanchez, C., and Flaounas, E.: The crucial representation of deep convection for the cyclogenesis of Medicane Ianos, Weather Clim. Dynam., 5, 1187–1205, https://doi.org/10.5194/wcd-5-1187-2024, 2024. a, b, c, d, e, f
Parrish, D. F. and Derber, J. C.: The National Meteorological Center's Spectral Statistical-Interpolation Analysis System, Mon. Weather Rev., 120, 1747–1763, https://doi.org/10.1175/1520-0493(1992)120<1747:TNMCSS>2.0.CO;2, 1992. a
Rani, S. I., Jangid, B. P., Kumar, S., Bushair, M. T., Sharma, P., George, J. P., George, G., and Das Gupta, M.: Assessing the quality of novel Aeolus winds for NWP applications at NCMRWF, Q. J. Roy. Meteor. Soc., 148, 1344–1367, https://doi.org/10.1002/qj.4264, 2022. a
Raveh-Rubin, S. and Wernli, H.: Large-scale wind and precipitation extremes in the Mediterranean: dynamical aspects of five selected cyclone events, Q. J. Roy. Meteor. Soc., 142, 3097–3114, https://doi.org/10.1002/qj.2891, 2016. a
Rennie, M. P., Isaksen, L., Weiler, F., de Kloe, J., Kanitz, T., and Reitebuch, O.: The impact of Aeolus wind retrievals on ECMWF global weather forecasts, Q. J. Roy. Meteor. Soc., 147, 3555–3586, https://doi.org/10.1002/qj.4142, 2021. a, b
Sánchez, C., Gray, S., Volonté, A., Pantillon, F., Berthou, S., and Davolio, S.: The impact of preceding convection on the development of Medicane Ianos and the sensitivity to sea surface temperature, Weather Clim. Dynam., 5, 1429–1455, https://doi.org/10.5194/wcd-5-1429-2024, 2024. a
Saraceni, M., Silvestri, L., Bechtold, P., and Bongioannini Cerlini, P.: Mediterranean tropical-like cyclone forecasts and analysis using the ECMWF ensemble forecasting system with physical parameterization perturbations, Atmos. Chem. Phys., 23, 13883–13909, https://doi.org/10.5194/acp-23-13883-2023, 2023. a
Sasso, N., Borderies, M., Chambon, P., Berre, L., Girardot, N., Moll, P., Payan, C., Pourret, V., Battaglia, A., Illingworth, A., Rennie, M., and Pourshamsi, M.: Impact of WIVERN Wind Observations on ARPEGE Numerical Weather Prediction Model Forecasts Using an Ensemble of Data Assimilation Method, Q. J. Roy. Meteor. Soc., 151, e4991, https://doi.org/10.1002/qj.4991, 2025. a, b
Scarsi, F. E., Battaglia, A., Tridon, F., Martire, P., Dhillon, R., and Illingworth, A.: Mispointing characterization and Doppler velocity correction for the conically scanning WIVERN Doppler radar, Atmos. Meas. Tech., 17, 499–514, https://doi.org/10.5194/amt-17-499-2024, 2024. a
Scarsi, F. E., Battaglia, A., Maahn, M., and Lhermitte, S.: How to reduce sampling errors in spaceborne cloud radar-based snowfall estimates, The Cryosphere, 19, 4875–4892, https://doi.org/10.5194/tc-19-4875-2025, 2025. a
Skamarock, W., Klemp, J., Dudhia, J., Gill, D., Liu, Z., Berner, J., Wang, W., Powers, J., Duda, M., Barker, D., and Huang, X.-Y.: A Description of the Advanced Research WRF, Version 4, NCAR/TN-556+STR, https://doi.org/10.5065/1dfh-6p97, 2019. a, b
Stathopoulos, C., Chaniotis, I., and Patlakas, P.: Assimilating Aeolus SatelliteWind Data on a Regional Level: Application in a Mediterranean Cyclone Using the WRF Model, Atmosphere, 14, 1811, https://doi.org/10.3390/atmos14121811, 2023. a
Thompson, G., Field, P. R., Rasmussen, R. M., and Hall, W. D.: Explicit Forecasts of Winter Precipitation Using an Improved Bulk Microphysics Scheme. Part II: Implementation of a New Snow Parameterization, Mon. Weather Rev., 136, 5095–5115, https://doi.org/10.1175/2008MWR2387.1, 2008. a
Torcasio, R. C., Mascitelli, A., Realini, E., Barindelli, S., Tagliaferro, G., Puca, S., Dietrich, S., and Federico, S.: The impact of global navigation satellite system (GNSS) zenith total delay data assimilation on the short-term precipitable water vapor and precipitation forecast over Italy using the Weather Research and Forecasting (WRF) model, Nat. Hazards Earth Syst. Sci., 23, 3319–3336, https://doi.org/10.5194/nhess-23-3319-2023, 2023. a
Torcasio, R. C., Papa, M., Del Frate, F., Mascitelli, A., Dietrich, S., Panegrossi, G., and Federico, S.: Data Assimilation of Satellite-Derived Rain Rates Estimated by Neural Network in Convective Environments: A Study over Italy, Remote Sens., 16, 1769, https://doi.org/10.3390/rs16101769, 2024. a
Tridon, F., Battaglia, A., Rizik, A., Scarsi, F. E., and Illingworth, A.: Filling the Gap of Wind Observations Inside Tropical Cyclones, Earth and Space Science, 10, e2023EA003099, https://doi.org/10.1029/2023EA003099, 2023. a, b, c
Varlas, G., Pytharoulis, I., Steeneveld, G.-J., Katsafados, P., and Papadopoulos, A.: Investigating the impact of sea surface temperature on the development of the Mediterranean tropical-like cyclone “Ianos” in 2020, Atmos. Res., 291, 106827, https://doi.org/10.1016/j.atmosres.2023.106827, 2023. a
Wang, X., Hamill, T. M., Whitaker, J. S., and Bishop, C. H.: A Comparison of the Hybrid and EnSRF Analysis Schemes in the Presence of Model Errors due to Unresolved Scales, Mon. Weather Rev., 137, 3219–3232, https://doi.org/10.1175/2009MWR2923.1, 2009. a
WMO: The 7th WMO Workshop on the Impact of Various Observing Systems on NWP, Geneva, Switzerland, 30 November–3 December 2020, https://community.wmo.int/events/7th-wmo-workshop-impact-of-various-observing-systems-nwp (last access: 12 January 2026), 2020. a
Zhang, F., Zhang, M., and Poterjoy, J.: E3DVar: Coupling an Ensemble Kalman Filter with Three-Dimensional Variational Data Assimilation in a Limited-Area Weather Prediction Model and Comparison to E4DVar, Mon. Weather Rev., 141, 900–917, https://doi.org/10.1175/MWR-D-12-00075.1, 2013. a