the Creative Commons Attribution 4.0 License.
the Creative Commons Attribution 4.0 License.
 | 06 Jan 2026
Properties and characteristics of atmospheric deserts over Europe: a first statistical analysis
Achim Zeileis
Isabell Stucke
Reto Stauffer
Georg J. Mayr
Atmospheric deserts are air masses that are advected from the deep, hot, dry boundary layer of arid or desert source regions. They frequently occur across Europe, where they can modify the temperature profile throughout the free troposphere. To investigate their occurrence, characteristics, and development, we track air masses travelling from North Africa across Europe continuously during the period from May 2022 to April 2024. Using the Lagrangian analysis tool LAGRANTO together with ERA5, we calculate 120 h-long trajectories at every full hour with a spatial resolution of 5 km in the horizontal and 10 hPa in the vertical. Cluster analysis is used to identify typical synoptic patterns that occur during atmospheric desert events, as well as to cluster the trajectories and find typical air streams.
We find that Atmospheric deserts occur in parts of Europe in up to 60 % of the time. They can cover up to 54 % of the area and 72 % of the land area in the domain 30° W to 60° E and 37 to 73° N. On average, atmospheric deserts persist for about one day, with slightly longer durations near the source region, however the duration and extent vary considerably with the seasons. While the 90th percentile of the duration is between one and two days for most of the domain and most of the seasons, it can exceed nine days in summer in the Mediterranean. Atmospheric desert air frequently resides above the local boundary layer and extends through much of the free troposphere. Intrusions of atmospheric desert air into the local boundary layer are rare and occur mainly over high orography and during the warm season. In some regions, atmospheric deserts frequently reside directly on top of the local boundary layer, forming a so-called lid. The lid, however, only persists for less than two and a half days on average – too short to cause a heat wave.
Four typical, synoptic-scale patterns are identified. They feature either a trough extending into the source region, or a ridge extending from the source to the target region, which lead to an eastward or north-eastward advection of air from the source region. Five typical air streams are present. One reaches the target region after a strong ascent with even higher potential temperature and lower moisture than it had in the source region due to condensation and evaporation. Three air streams experience a decrease in potential temperature, either due to mixing, or evaporative or radiative cooling. The last air stream behaves like an “elevated mixed layer”, as it almost conserves its thermodynamic properties.
- Article
(7613 KB) - Full-text XML
-
Supplement
(63645 KB) - BibTeX
- EndNote


Atmospheric deserts (ADs) are air masses that are transported away from the hot and dry convective boundary layer (CBL) of semi-arid, desert, subtropical, and/or elevated source regions (name and concept first introduced in Fix et al., 2024). Diabatic processes and differential advection in the vertical gradually change the ADs' original characteristics as they are advected over hundreds to thousands of kilometres towards their target region. Similar to elevated mixed layers (EMLs), they can have an influence on the weather in the target region, e.g. due to their effect on the vertical structure of the atmosphere. Therefore, this study aims to investigate typical characteristics of ADs over Europe as well as their evolution during the advection. ADs are a generalisation of EMLs, or their Europe-specific manifestation, the Spanish Plume. This generalisation of the concept is clearly needed, as (1) it is likely that even if the air does not remain well mixed it will still have an influence on the weather in the target region and (2) many studies about the Spanish Plume show air streams that actually originate in northern Africa instead of the Iberian Peninsula (e.g. Table 4 in Schultz et al., 2025b, a; Sibley, 2012; de Villiers, 2020). Schultz et al. (2025a) investigate the convective environment of a storm over the UK in the beginning of July 2015, and introduce a more canonical concept of the Spanish Plume including four different air streams, including one originating in the subtropics.
In the special case of an EML, the thermodynamic properties are mostly conserved. Previous studies e.g. Carlson and Ludlam (1968), Carlson et al. (1983), Lanicci and Warner (1991b), and Cordeira et al. (2017) indicate that the warm, dry air from the CBL of an arid source region glides up on the cooler, moister, local CBL, forms an EML, and produces a capping inversion or so-called lid. This lid can facilitate heat wave formation and prevent thunderstorm outbreaks (Carlson and Ludlam, 1968; Carlson et al., 1983; Farrell and Carlson, 1989; Lanicci and Warner, 1991a, b; Banacos and Ekster, 2010; Dahl and Fischer, 2016; Cordeira et al., 2017; Ribeiro and Bosart, 2018; Andrews et al., 2024). Underrunning and secondary circulations at the air mass' edge can cause violent thunderstorms to erupt along the edges (e.g. Carlson and Ludlam, 1968; Keyser and Carlson, 1984; Lanicci and Warner, 1991b; Andrews et al., 2024; Schultz et al., 2025b).
EMLs are typically identified from vertical profiles in the target region. For ADs this is often not possible, since they are usually modified during their journey from source to target. To analyse the more general case of an AD, a direct detection method is necessary. We therefore developed such a direct detection method in a previous study (Fix et al., 2024), which uses Lagrangian trajectories to trace the air mass directly from its source to its target. The case study presented in Fix et al. (2024) showed that in mid-June 2022 an AD spanned a large part of Europe for a few days. Four air streams were identified based on changes in the trajectories' characteristics between their initialisation and arrival in the target region: One behaved like an EML, almost preserving its thermodynamic properties and rising only slightly with respect to its initialisation. A second one rose high and became drier while increasing its potential temperature. The third airstream experienced a decrease in potential temperature, an increase in moisture, and sank after an initial ascent. The fourth one took a different path and did not necessarily reach the target region of interest. The changes experienced by the air streams were likely dominated by phase changes of the water vapour, and precipitation. Additionally, it was shown that the AD in mid-June 2022 was accompanied by very high temperatures in central and southern Europe, and that lightning mainly occurred close to the AD's edge (and at the cold front). However, the presence of a capping inversion facilitating heat build-up could not be confirmed.
The present study aims at generalising the results from that case study and investigating the properties of ADs over Europe during a longer time period. ADs are tracked continuously between May 2022 and April 2024, resulting in a 2-year dataset of ADs over Europe. With this dataset, we aim to answer how often ADs occur, what area they cover, how long they last, what their vertical structure is, how they are modified during the advection, and how this changes seasonally and regionally.
The focus period of this study is 1 May 2022, 00:00 UTC to 30 April 2024, 23:00 UTC. The direct detection method requires the calculation of trajectories using the Lagrangian trajectory analysis tool (LAGRANTO; Sprenger and Wernli, 2015) and meteorological input data. This study uses the ERA5 reanalysis dataset (Hersbach et al., 2020), which is explained in Sect. 2.1. The calculation of the trajectories is explained in Sect. 2.2, and the identification of the air mass in Sect. 2.3. How synoptic charts and trajectories can be clustered is explained in Sect. 2.4. In Sect. 2.5 we define when an AD is considered to form a lid.
2.1 Reanalysis dataset, ERA5
The latest global reanalysis from the European Centre for Medium-Range Weather Forecasts (ECMWF), ERA5 (Hersbach et al., 2020), is used as a spatio-temporally complete set of atmospheric data. It is based on the Integrated Forecasting System (IFS) Cy41r2, has a horizontal resolution of 0.25°, and data are available hourly on 137 vertical model levels up to 1 Pa (Hersbach et al., 2020; European Centre for Medium-Range Weather Forecasts, 2016). The vertical resolution is therefore about 20 m at the surface and 300 m at 500 hPa. ERA5 single-level, pressure-level and model-level data on the lowest 74 model levels (surface to about 120 hPa) are utilised. In this study, a domain covering northern Africa and Europe is chosen, specifically 30° W to 60° E and 15 to 73° N.
2.2 Trajectory calculation
The Lagrangian analysis tool (LAGRANTO) version 2.0 is used to calculate forward trajectories in this study. It has been developed since the late nineties (Sprenger and Wernli, 2015) and is a mature and widely used tool (e.g. Stohl et al., 2001; van der Does et al., 2018; Keune et al., 2022; Oertel et al., 2023). The 3D wind field of the input dataset is used to calculate trajectories iteratively.
In this work, we are interested in ADs over Europe. Naturally, North Africa is the source region of interest, since it is the biggest desert area in the vicinity. For the case study in Fix et al. (2024) it was shown that the proportion of trajectories originating in Iberia is very small, and literature also suggests that often the air involved in Spanish Plumes is actually of subtropical origin (e.g. Schultz et al., 2025a, b), therefore we neglect Iberia as an additional source region. Trajectories are initiated along a “curtain” marking the northern boundary of the source region (North Africa, Fig. 1b), as all trajectories that start within the source region and reach Europe must pass through this curtain. Trajectories are started at a very high resolution of approximately 5 km in the horizontal, and 10 hPa in the vertical between 1100 and 400 hPa. The approach differs slightly from the one described in Fix et al. (2024) and requires much fewer trajectories. We compared the new curtain based method to the source region based approach in Fix et al. (2024) for the case study presented in said study. We found that the results are qualitatively the same whether trajectories are initialised from the entire source region or only along the curtain. This lends confidence to the adjusted approach, which is considerably more computationally feasible. The results in Fix et al. (2024) are also qualitatively the same whether trajectories are only started from the BL during daytime hours or from a smoothed BL at all times, but for the present study continuos initiation was desired.
Per definition AD-air originates in the source region's boundary layer (BL). The boundary layer height (BLH) in desert regions can extend up to several kilometres from the surface during the day and has a very strong diurnal cycle (e.g. Garcia-Carreras et al., 2015). The daytime CBL often remains aloft as the night time residual layer, which therefore has similar properties as the daytime CBL and can also contribute to ADs. In this study, we require a continuous initiation (hourly) of trajectories. There is no reliable measure for the top of the residual layer in ERA5, so we use an interpolated BLHi, where BLHi is interpolated between the daily maxima of the BLH. We initiate trajectories from below BLHi at the curtain, and calculate the locations of the air parcels forward in time only if they have a northward wind component (and therefore have a chance of arriving in Europe). The locations of air parcels are calculated 120 h into the future, resulting in trajectories that ensure the parcels can reach all areas of the domain within this time while remaining short enough so hat they have not fully lost their former CBL properties. This choice is supported by the results of the following tests: The average age of the air parcels when they reach the northern regions of the domain is less than 120 h and the comparison with experiments using 168 or 240 h long trajectories did not show much difference in the air mass extent.
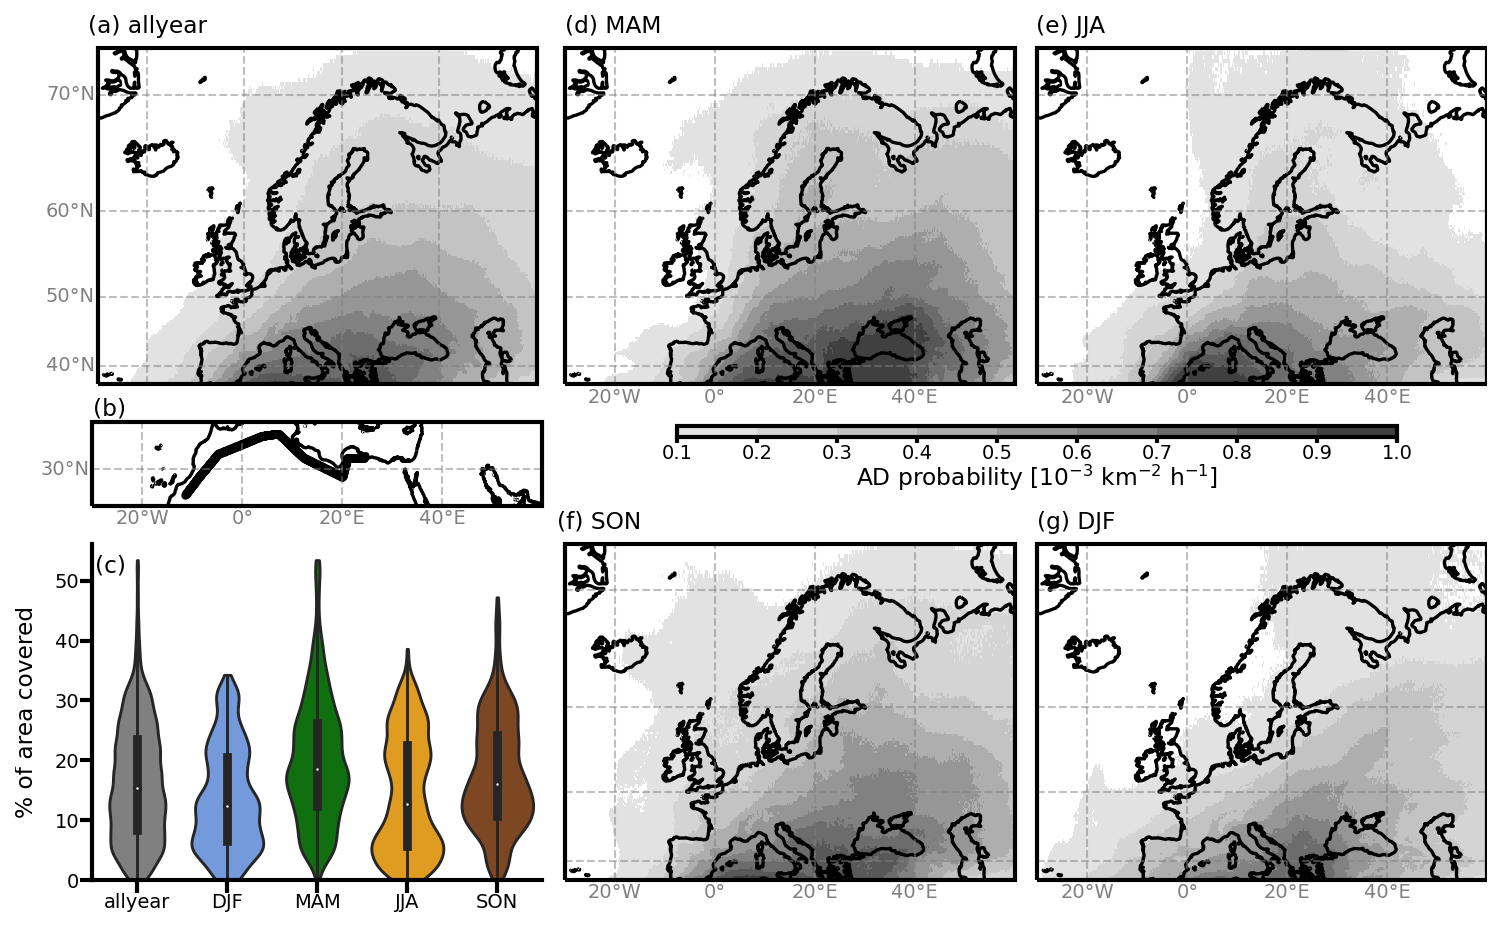
Figure 1(a) Probability of an AD being present in the respective cell, weighted by the cell's area, for the entire 2-year period (allyear) in the shown domain. (b) Locations of the starting points of the trajectories along the “curtain”. (c) Violin plot of the percentage of the area in the domain covered by an AD, per season. The violins are normed to have the same area. (d–g) Same as (a), but for MAM, JJA, DJF, and SON, respectively.
Trajectories are initiated every hour between 1 May 2022, 00:00 UTC and 30 April 2024, 23:00 UTC. This results in approximately 108 million trajectories, 61 million of which pass north of 37° N and therefore contribute to the analysis. Height above mean sea level (h a.m.s.l.), potential temperature (θ), specific humidity (q), and equivalent potential temperature (θE) are traced along the trajectories. For time steps where q is negative in ERA5 due to numerical inaccuracies, θE is set to θ, however, this only affects less than 1 % of all trajectories.
2.3 Detection of the atmospheric desert air mass
In order to identify the AD air mass, the trajectories are aggregated to grid boxes of 0.25° × 0.25° × 500 m, matching ERA5 grid cells in the horizontal. A higher vertical resolution would reduce robustness of the analyses as it would decrease the number of trajectories per AD-cell (which is 6.8 on average for 500 m resolution). At a lower resolution, we could not resolve features smaller than 1 km properly any more. Hence, 500 m is chosen as vertical resolution. An AD-cell is then defined as a grid box that contains at least one trajectory. This results in a dataset that designates each point in space and time as AD- or nonAD-cell. Additionally, the average properties of all trajectories within that cell are known. Using only one trajectory as threshold to identify a cell as AD-cell may seem like a weak definition, but as argued in Fix et al. (2024) it is a useful one and was shown not to substantially misidentify the AD-cells. A column is an AD-column if there is at least one AD-cell in this vertical column. They therefore have a horizontal extent of 0.25° × 0.25°, as the ERA5 grid cells.
The AD streak length is defined for each ERA5-cell as the duration of continuous presence of an AD-column (AD-air anywhere in the column). Since the AD data can be noisy, especially around its edges, short gaps of 1 h were filled, so that the average persistence is not underestimated if long periods are interrupted briefly.
Maxima of AD-events are defined as the time with maximal horizontal extent. They are identified as the local maxima in the smoothed time series of the percentage of AD-columns north of 37 °N. The time series is smoothed using a 4th-order Butterworth low-pass filter with a cut-off frequency of d. This removes noise associated with variations occurring at frequencies higher than every 2 d. Local maxima are identified if they are separated by at least 1 d and have a prominence of at least 0.05, ensuring that only distinct and significant peaks are considered as maxima of AD-events. Similarly, the onset of an AD-event is determined as the local minima in that time series. The situation 24 h after the minimum and 24 h before the maximum are taken as representative for the early and mature phases of an AD-event, respectively. To ascertain that they do not overlap, only those 66 events with at least 48 h between their minimum and maximum are taken into account for further analysis.
2.4 Clustering
In order to analyse typical synoptic patterns associated with ADs, we cluster the AD-events based on their standardised 500 hPa geopotential height (Z500) anomaly 24 h prior to the AD maximum. This allows to identify and categorise large-scale atmospheric circulation patterns linked to ADs. The standardised Z500 anomaly is calculated by subtracting the mean and dividing by the standard deviation within a 30-d running-window. The data is then reshaped from 3-dimensional format (lon × lat × time) to 2-dimensional format (space × time). This reshaping is necessary as principal component analysis (PCA) requires the data to be in (features × samples) format. PCA is applied to the data to reduce its dimensionality and emphasise dominant patterns. We retain the first 7 principal components (PCs), which together explain 62 % of the total variance. This choice represents a balance between simplifying the data and preserving most of its variability. Including additional PCs only marginally increases the explained variance, and the clustering results are not very sensitive to the exact number of PCs used. The clustering is performed on the 7 PCs using k-means clustering (MacQueen, 1967; Cos et al., 2025). The optimal number of clusters is determined to be four, based on the “elbow-plot” of the total sum of squares and an assessment of the interpretability of the resulting cluster's patterns.
Additionally, “typical” trajectory paths and developments are of interest. Analysing the route and the development of the air parcels along the trajectories can give insight into the processes modifying the AD-air during the advection. To reduce the dimensionality of the problem, all trajectories initiated on the same date are clustered using k-means clustering. Trajectories are clustered by the following 5 variables: their differences in longitude, latitude, height above mean sea level, potential temperature, and specific humidity between their initialisation and their end at 120 h (note that trajectories that leave the domain earlier than that are not considered). This is a similar approach as in Fix et al. (2024) but with reduced number of variables. This choice was made, so that the variables used do not over-emphasise phase change driven processes in the clustering. The variables are standardised to ensure equal weight and a number of 4 clusters is chosen for the clustering (as in Fix et al., 2024, where the ideal number of clusters was determined using the “elbow-plot” of the total sum of squares). For each of the 66 AD-events, we perform clustering of the trajectories. Specifically, we consider trajectories initialised 3 and 5 d before the AD maximum (i.e. for a maximum at 20 June 2022 08:00, trajectories initialised on 15 and 17 June 2022 are clustered, respectively). This results in 66 × 2 × 4 = 528 clusters. The respective cluster averages are categorised in “typical” air streams using the following criteria:
-
blue Δh a.m.s.l. > 1000 m & Δθ>0 K & Δq<0 g kg−1
-
red Δθ<0 K & Δqrel>0.1
-
yellow Δθ<0 K &
-
green K &
-
cyan K &
Here, Δ refers to the difference between the end and start of the cluster-averaged trajectory. Δqrel denotes the relative change in q since that time. An absolute relative change in q of less than 10 % over several days is used as a criterion to identify an air stream that retains its moisture. Similarly, a change in potential temperature of less than 1.5 K is considered small. Clusters that do not meet the criteria for any of these air stream types are categorised as black. The criteria were selected based on visual inspection of the clustering results and because the resulting typical air streams can be linked to physical processes that dominate the modification of the air during its advection: The blue air stream implies latent heating due to condensation and a loss of humidity caused by precipitation. The red air stream is likely influenced by evaporation or mixing with cooler, moister air masses. The yellow air stream indicates mixing with cooler, but dryer air masses, the green one is dominated by radiative cooling, and the cyan one behaves like the previously studied EMLs. By focusing on representative, “typical” air streams, we aim to highlight the dominant mechanisms influencing the AD-air during advection, rather than the magnitudes of individual changes.
2.5 Lid
ADs can form a lid on top of the local BL, which can have consequences for the local weather. We consider the AD to have formed a lid if the centre of the lowest AD-cell lies within ± 500 m of the BLH. This may seem like a very loose criterion, but inspection of the vertical temperature profiles and the BLH in ERA5 have shown that the ERA5 BLH variable sometimes differs from where the potential temperature profile would suggest it is by several hundred metres. Note that the lid defined like this does not necessarily indicate the presence of a capping inversion, only the possibility of one caused by an AD sitting directly on top of the local BLH.
The lid-criterion is less meaningful during nighttime, however, as the BLH can be very low, and the residual layer cannot be properly taken into account. We therefore focus the lid analysis on the daytime hours only (6 h, 10:00 through 15:00 UTC). Our selection of 10:00–15:00 UTC does not aim to precisely capture the actual daytime hours at every location and day of the year. Instead, this time window is chosen because it represents a period during which the ERA5 BLH can be reasonably assumed to provide meaningful and useful information for our analysis (Guo et al., 2021, find ERA5 to represent daytime BLH well). To ensure the robustness of our conclusions, we conducted the same analysis using alternative time windows, including a fixed time (12:00 UTC) and seasonally varying windows. The results remain consistent regardless of the exact choice of the daytime hours. The streak length of the lid in a ERA5 grid cell is defined as the number of consecutive days which had a lid during at least 3 (half) of the daytime hours.
In this section the properties of ADs are described. Their occurrence frequency and spatial extent are investigated (Sect. 3.1), as well as the synoptic patterns leading to AD-events (Sect. 3.2). The persistence of AD-events (Sect. 3.3), their vertical structure, their ability to form a capping inversion, and the duration of the latter are of great interest (Sect. 3.4), especially with respect to possible impacts. Furthermore, the development of the AD-air during the advection and the related physical processes are analysed (Sect. 3.5).
3.1 Occurrence frequency and spatial extent of ADs over Europe
The first question to answer is how often ADs occur. The presence of an AD in a respective column is a binary time series, hence its occurrence probability per grid cell can be determined as its temporal mean. Due to Earth's curvature, ERA5 grid cells at high latitudes are smaller than those at lower latitudes. To account for that, the occurrence probability per grid cell is divided by the grid cells' area (Fig. 1). The region with elevated AD probability extends from the Iberian peninsula north-eastward, as far as northern Scandinavia. The area-weighted AD probability reaches more than 0.7 × 10⁻³ km−2 h−1 in the southern Mediterranean, 0.4–0.6 × 10⁻³ km−2 h−1 in central Europe, and still up to 0.3 × 10⁻³ km−2 h−1 in parts of Scandinavia. Over the British Isles, the weighted probability is less than 0.2 × 10⁻³ km−2 h−1. The weighted numbers might not be intuitively interpretable, but highlight the occurrence pattern well. Occurrence probabilities per cell (not weighted by cell area) for an hour to be an AD-hour exceed 60 % in the Mediterranean, and are up to 20 % as far north as southern Scandinavia (not shown). Hence, ADs are frequent and can occur almost everywhere in Europe.
Next, we determine the typical spatial extent of ADs. ADs cover between 0 % and 54 % of the area in the domain, with a median extent of approximately 15 % over the two-year period analysed (see Fig. 1c, allyear). This behaviour varies notably with the seasons. In boreal winter (DJF) and boreal summer (JJA) the maximum and median extent is smaller compared to the annual values. In DJF, the maximum probability is recorded in southeastern Europe (Fig. 1g). The maximum AD probability in JJA is concentrated in the western Mediterranean (Fig. 1e). In eastern Europe during JJA, AD probabilities are very low, and events spanning less than 10 % of the area are most common. Hence, while ADs are very frequent in JJA in the western Mediterranean, they tend to be spatially confined to the southern latitudes of the domain. The highest probabilities and largest events are recorded in boreal spring (MAM), with highest probabilities especially in the eastern Mediterranean, over the Balkans, Turkey and the Black Sea (Fig. 1c, d). Both in the probability map (Fig. 1d) as well as the violin plot (Fig. 1c) it becomes clear, that MAM is also the season with the largest AD-events, spanning up to 54 % of the area, with probabilities of more than km−2 h−1 recorded over all of Scandinavia. The median size of ADs in MAM is about 20 % of the area, which is also the most frequent size in this season, whereas very small events are less likely. In boreal autumn (SON), the median size is slightly lower, but due to one peak in smaller (between 10 % and 15 %) and one in larger (around 30 %) events (Fig. 1c). Also in SON very small events are less likely. Probabilities are elevated across the entire Mediterranean in SON and low but noticeable probabilities are recorded over the British Isles and Scandinavia (Fig. 1f). The analysis yields very similar results if only land-cells are taken into account. Since the ocean accounts for a considerable portion of the domain, but is less frequently affected by ADs, the overall numbers are higher. In MAM, AD extents reach up to 72 % of the land-cells in the domain and even in DJF, where the extents are smallest, they exceed 50 % of land-cells in the maximum.
A more detailed insight in the AD extent can be achieved when looking at the temporal evolution of the extent of the ADs (see Fig. 2), which shows a time series of the AD extent. Long, vertical stripes depict ADs that reach far north, while darker colours depict ADs that cover a wide longitudinal band. While this figure does not allow a detailed analysis of the AD extent, it does show that it is rare that no AD-air is present in the domain north of 37° N. In fact, in only 2.7 % of the hours during the analysed 2-year period, does AD-air cover less than 1 % of the columns in the domain. Many times during these 2 years, ADs do reach as far north as Scandinavia. There are very different flavours of events, i.e. different combinations of extent towards the north, width (intensity of the colour in Fig. 2), and duration. This also becomes apparent, when additionally looking at the number of trajectories in the domain (not shown here) and not only the number of identified AD-columns. A large spatial extent can occur both with a high and low trajectory density. The same is valid for ADs with a smaller spatial extent.
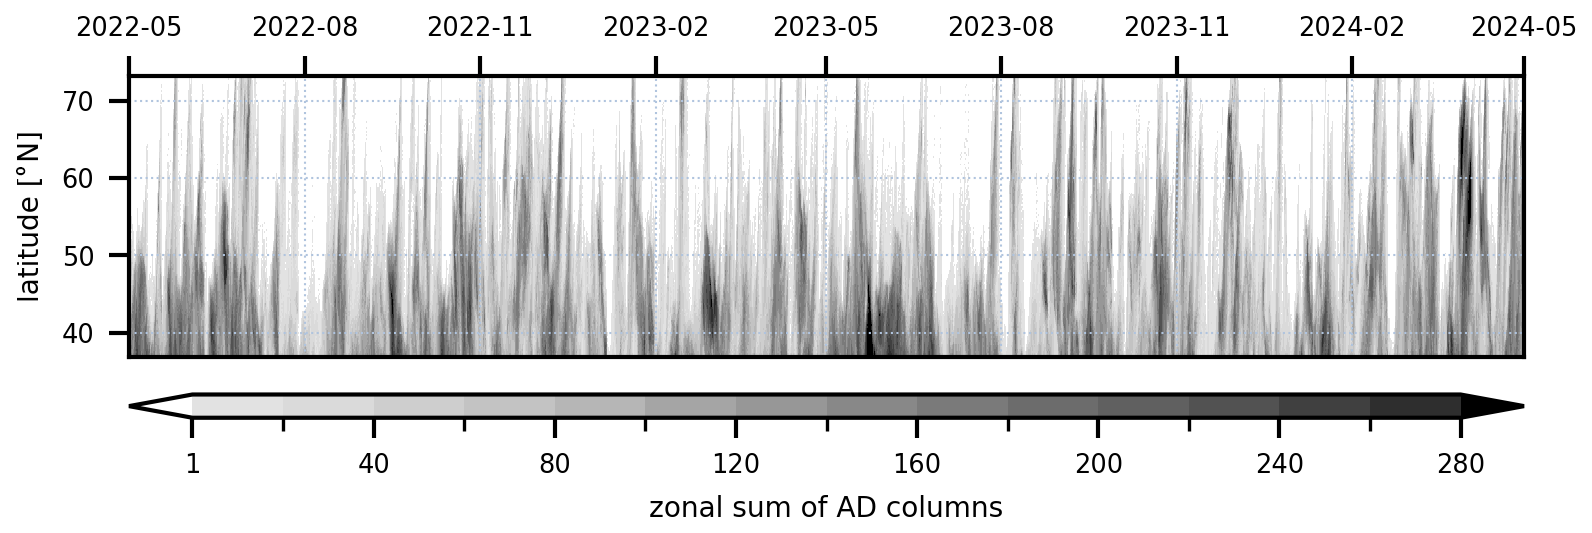
Figure 2Time series of AD-presence. Time is shown on the x axis, the y axis shows latitude, shading shows the number of columns at that latitude, which have an AD present. There are 361 columns at each latitude in the domain.
3.2 Synoptic conditions
In a target region located north of the AD source and within the midlatitude westerlies, the transport of AD-air requires a synoptic pattern featuring either a southward-extending trough into the source region or the northwestern flank of a ridge extending from the source into the target region. Various flow configurations can produce these two overall patterns, varying in Rossby wavelength and in the meridional extent of troughs and ridges. When long-wavelength troughs cut off, they yield the most persistent AD events.
A clustering analysis of the synoptic patterns of the 66 identified events results in four clusters that summarise this diversity (Fig. 3). The clustering is based on 500 hPa geopotential height anomalies 24 h before the maximum aerial AD extent (second and fourth row of Fig. 3). The figure also shows AD extent (frequency) in gray shading and orange contour lines of geopotential height at 850 hPa, which is within the AD-air in the source region but mostly above the local boundary layer in the target region. Overall, the flow pattern at 500 and 850 hPa is similar, except for few baroclinic regions. Additionally, the temporal evolution is visualised by showing the flow 24 h after the minimum aerial AD extent (first and third row of Fig. 3).
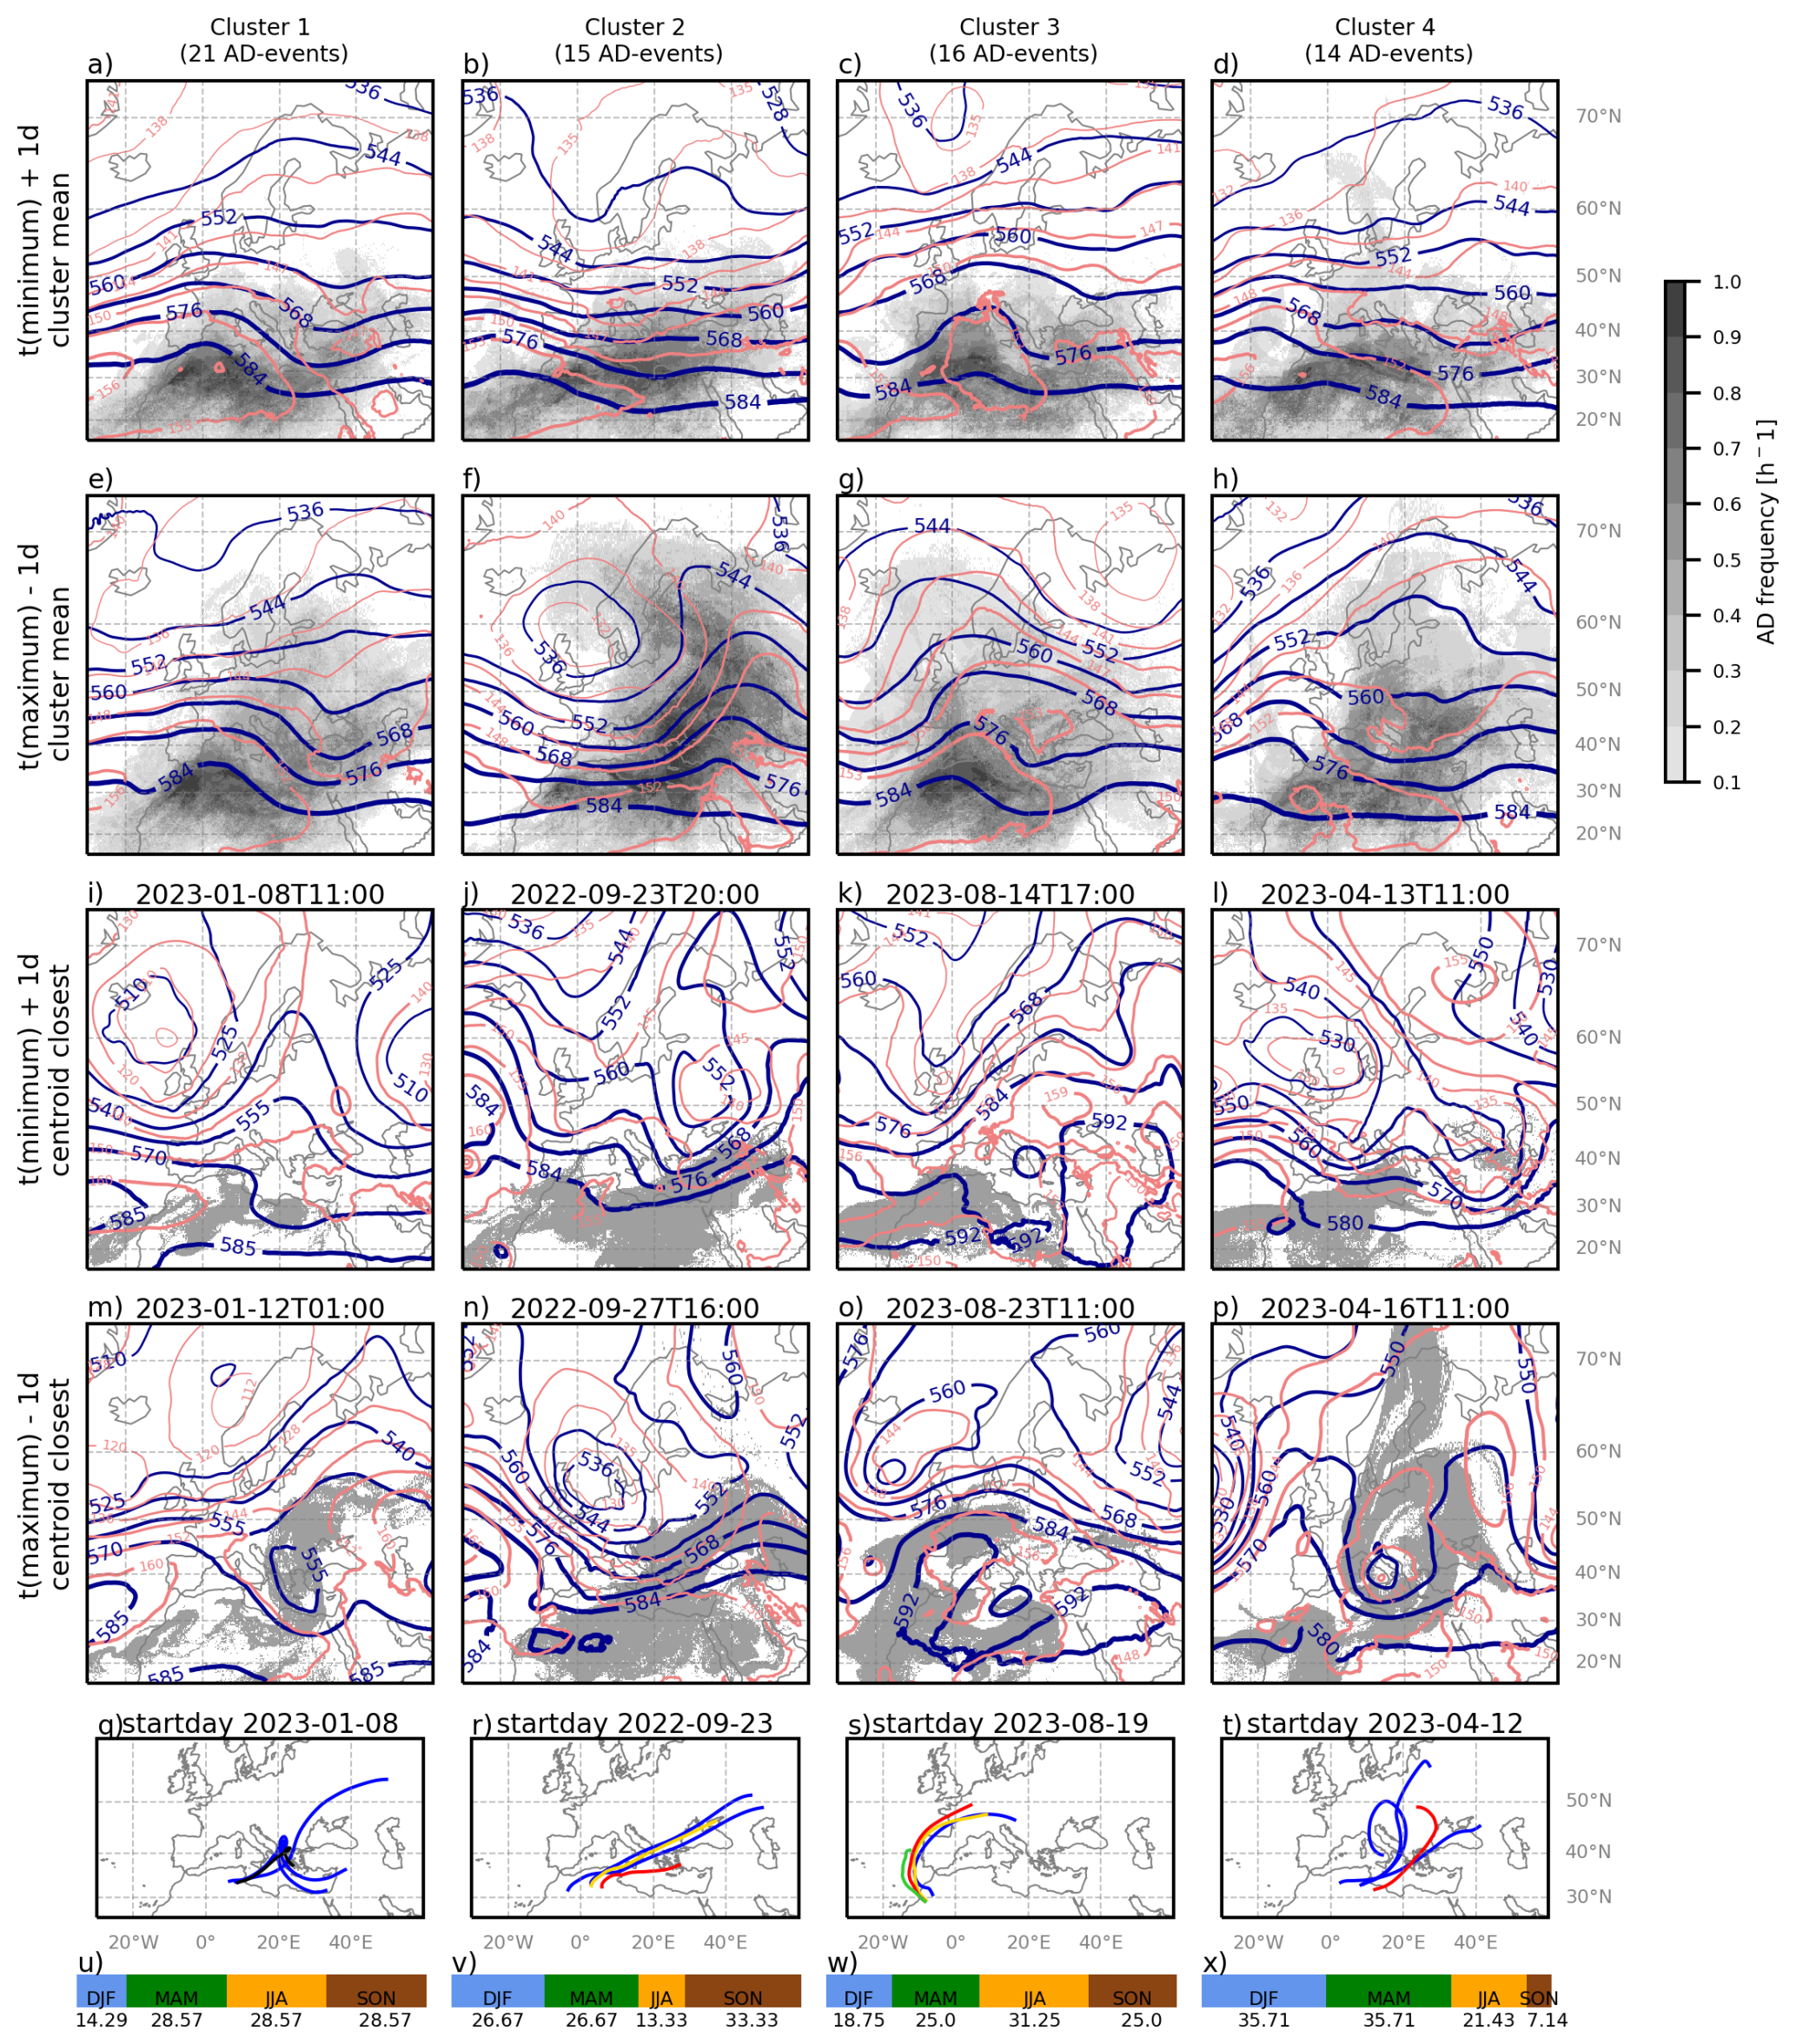
Figure 3For each of the four clusters (columns): Cluster mean Z500 in gpdam (blue contours), mean Z850 in gpdam (orange contours) and AD-frequency (grey shading) for the situation at 24 h after the onset (a–d), 24 h before the AD maximum (e–h). The same is shown for the observation closest to the cluster centroid (i–p, AD-columns shown in grey). Clusters are based on standardised Z500 anomalies at 24 h before the maximum. Panels (q)–(t) show the four trajectory clusters based on the trajectories started on day 5 prior to the AD maximum, colouring of the trajectory clusters is according to the classification algorithm explained in Sect. 2.4. The bottom row (u–x) shows the seasonal breakdown of each cluster in percent (allocated season for the time of the AD maximum). The number of members in each cluster is given in the column title.
Cluster averages (rows 1 and 2, Fig. 3a–h) show a splitting of the flow into a southern and northern branch for clusters 1, 3 and 4. During the onset (Fig. 3, row 1, panels a–d), clusters 1 and 3 both feature a trough intruding into the eastern part of the source region. They differ, however, in the behaviour of the next upstream ridge, which extends farther north in cluster 3 (Fig. 3e, g). Cluster 2 presents with a deep trough during the mature phase of the event (Fig. 3f), in many of its members even a cut-off low emerges over northwestern Europe. The average event-duration in this cluster is highest. AD-air is transported far north ahead of the trough in this cluster. It is Cluster 4, however, where AD-air most frequently reaches furthest north. Even after averaging, the split between a wide ridge in the northern centre of the domain and a wide trough in the southern part is visible (Fig. 3h).
The third and fourth row in Fig. 3 (panels i–p) show the temporal evolution of the members closest to each cluster centroid, exemplifying individual flow configurations and highlighting deviations from the cluster means. The pronounced dipole of a high in the central northern portion of the domain and a cut-off low in the central southern part in the member of cluster 4 (Fig. 3p) illustrates why even after averaging such a pattern remains visible (Fig. 3h). For these individual members we also show trajectory cluster averages as typical trajectory pathways (Sect. 2.4): Clusters 1, 2, and 4 have typical trajectories leading into the eastern Mediterranean and southeastern Europe, whereas for cluster 3 typical trajectories originate from western North Africa and extend northward along the European west coast. The final row of Fig. 3 (panels u–x) depicts the seasonal breakdown of the clusters. Cluster 4 rarely occurs in SON, cluster 2 seldom in JJA, Cluster 3 is most frequent in JJA, and cluster 1 occurs equally often during MAM, JJA, and SON. Overall, MAM emerges as the dominant season for AD events over Europe.
3.3 Persistence of ADs over Europe
The persistence of ADs is another important characteristic, especially with regard to their consequences. ADs over the Mediterranean prevail for about 1 to 2 d on average, while in most of the rest of the domain the average streak length is less than a day. Maximum streak durations of more than 4 weeks were reached in the Mediterranean, while in central Europe the maximum streak length is around a week. However, the maximum streak length may only represent a single event for large parts of the domain, so the 90th percentile is a more robust measure to look at the longest streaks. For the entire study period, the 90th percentile of AD streak lengths is between 2 and 3 d for most of the domain, and more, but still less than a week, in the Mediterranean.
A more detailed view is given in Fig. 4, where the mean (top) and 90th percentile (bottom) streak lengths are shown per season. The mean streak lengths in each season are in a similar range and the pattern resembles the occurrence probability in the respective seasons (Fig. 4, top row, compare Fig. 1d–g). The longest average durations are recorded in the western Mediterranean in SON. The 90th percentile of streak length varies strongly across the seasons (Fig. 4, bottom row). In most seasons, the 90th percentile of the streak length is well below a week, but reaches a week in the south-western Mediterranean in SON. During JJA, however, 90th percentile streak lengths of more than a week for most of the Mediterranean Sea (even exceeding nine days in some cells, not shown) are reached in the Mediterranean, maxima are even up to four weeks. This indicates that ADs are not only frequent in the Mediterranean in JJA, but can also be very persistent. Contrary, MAM showed high probabilities and large extents, but the events are less persistent.
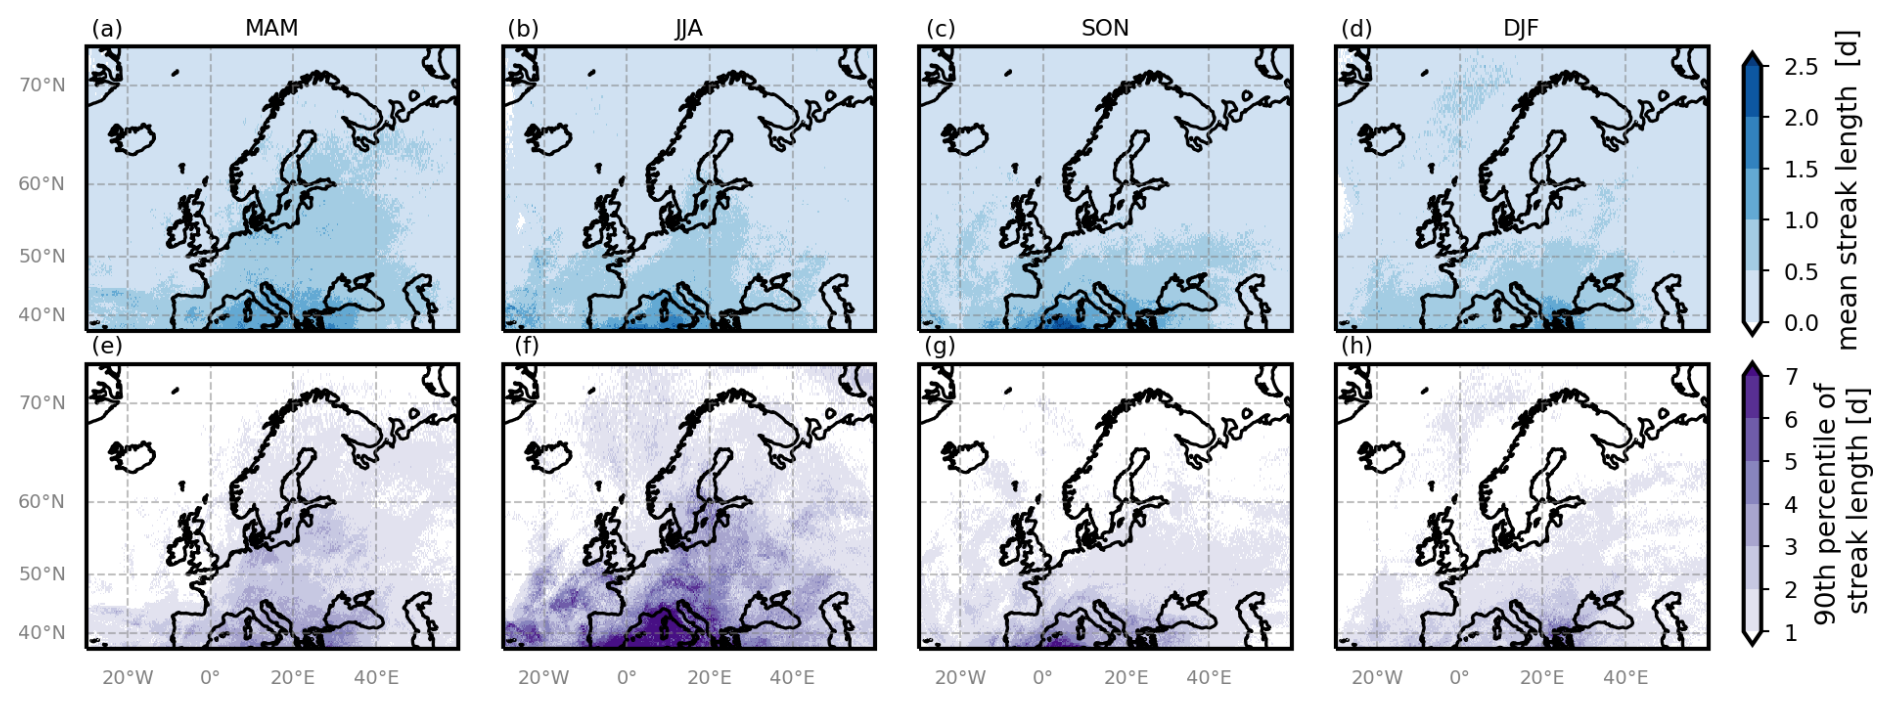
Figure 4Mean (a–d) and 90th percentile (e–h) AD streak length in days, per season (columns).
3.4 Vertical structure of ADs over Europe
The vertical extent and structure of ADs are also of interest, especially with regard to the influence of ADs on local weather. On average, the ADs are about 2–8 cells, i.e. 1–4 km thick (Fig. 5c). Also, the ADs are coherent in the vertical, in the sense, that mostly the entire column between the lowest and highest cells is filled with AD-cells, interruptions in the vertical are few and small (not shown). On average, the lowest AD-cell is between approximately 2 and 6 km, and the highest between approximately 4 and 8 km (Fig. 5a, b). Both in the spatial pattern of the lowest and the highest AD-cells, it becomes apparent that ADs are on average tilted upwards towards the north-east (more yellowish colours towards the north-east in Fig. 5a, b). This is sensible, considering they are advected north or north-eastward, where they ride up on colder, moister, local air masses. The largest average distance between the highest and lowest AD-cells is found over central Europe (Fig. 5c).
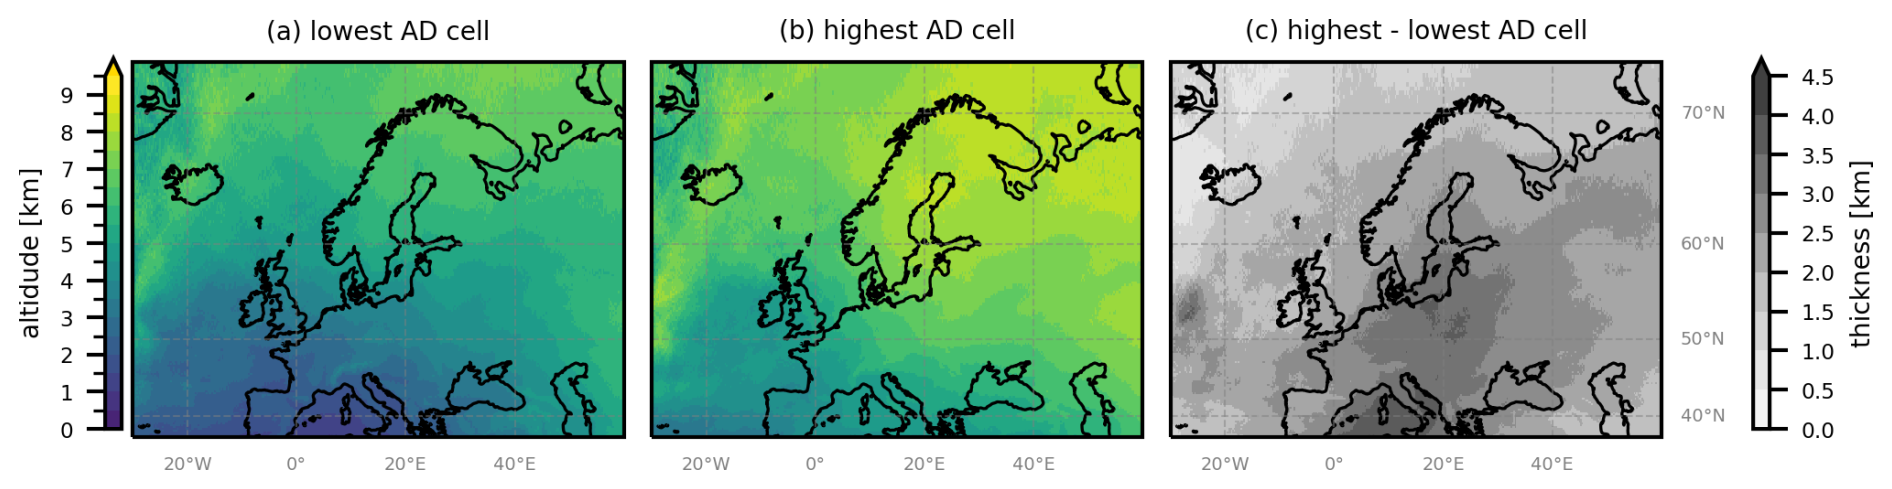
Figure 5Average altitudes of lowest (a) and highest (b) AD-cells, and their distance (c). This distance describes the maximal thickness of the AD, but it does not depict the actual number of layers present.
The overall pattern of the lowest and highest AD-cells looks similar in all seasons (more detail in the Appendix, Fig. A1).
EMLs have been argued to cause heat build-up in the BL below, and prevent thunderstorms in their centres due to a strong capping inversion or lid that separates the BL below from the warmer, dryer EML air above (e.g. Carlson and Ludlam, 1968; Lanicci and Warner, 1991a, b; Cordeira et al., 2017). We therefore investigate how often ADs form a lid, how long it persists, and whether and how often AD-air enters the local BL. This analysis shows that a lid is present in up to 45 % of the daytime hours with AD presence in the western Mediterranean (Fig. 6a). In other parts of the domain south of 55° N and west of 40° E, lid probabilities are still elevated, with about 20 %–40 % of all daytime hours with AD presence having a lid. Beyond this, the probability of an AD causing a lid is much reduced, which is in line with the AD base height increasing towards the north and east (see Fig. 5a and Sect. 3.1). Hence, the pattern is not the same as the pattern of the AD probabilities, and the probability of an AD forming a lid therefore differs between regions (Figs. 6 and 1a).
The impact of an AD on the local weather can strongly depend on the persistence of such a lid. We therefore analyse the average and 90th percentile of the streak length of the lids (Fig. 6b, c). It becomes very clear that in most of the domain the average streak length is between 1 and 2 d. Only in the Mediterranean over the sea the average streak length is between 2 and 3 d, with few cells exceeding 3 d. Another area with long average lid persistence, but similar 90th percentile streak length, is found between Iceland and northern Norway. This is an area with low AD frequency, hence few, long events can dominate the average. Also the 90th percentile of streak lengths is around a few days in most of the domain. Only in the Mediterranean, the 90th percentile exceeds a week. The maximum duration of a lid there is even up to 2 weeks, in some cells even longer (not shown here). It becomes very obvious that the probability as well as mean and 90th percentile of the duration of a lid is elevated over the sea (Mediterranean, Black Sea, and the Atlantic off the Iberian Coast). This likely has to do with the different properties of a marine BL compared to a continental one, as it is often cooler and moister. The greater the difference in thermodynamic properties between the AD-air and the local boundary layer (BL), the less likely the AD is to intrude, making longer-lasting lids more probable. Highest probabilities of a lid are recorded in SON and DJF, with probabilities up to more than 55 % in the Mediterranean and west of Iberia (more detail in the Appendix, Fig. A2).
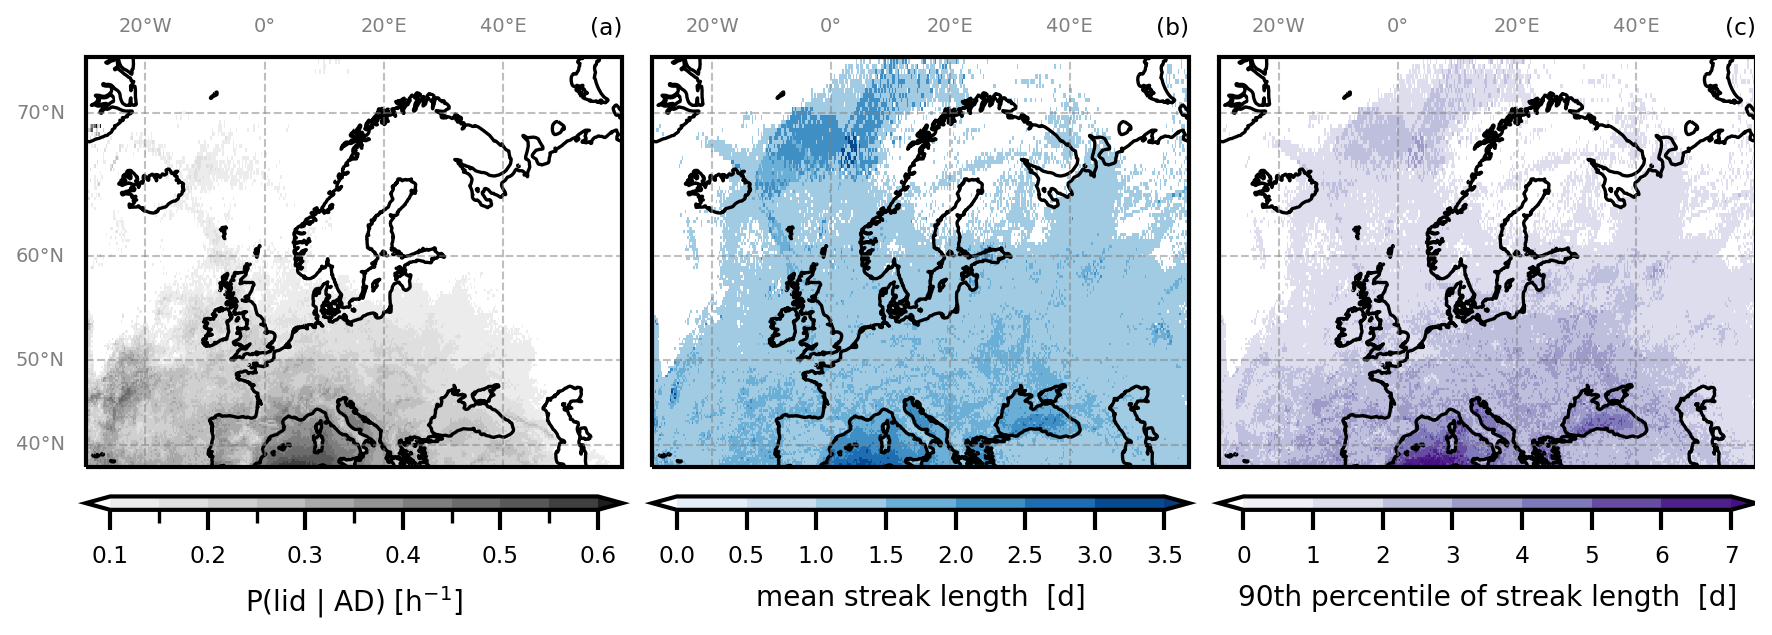
Figure 6Lid properties. (a) Probability of a lid being present, given an AD is present, P(lid|AD). (b) Mean streak length of the lid in days. (c) 90th percentile of streak length of the lid in days.
It is important not only to assess whether the AD forms a lid, but also to determine whether it enters the boundary layer (BL) at all. An AD-cell is identified as within the BL, when its centre is below BLH – 500 m (to match the definition of the lid, also daytime hours only). The probability of an AD-cell within the BL given that an AD is present is shown in Fig. 7. AD-air penetrates the local BL in less than 20 % of the time in most of the domain. This is expected, as AD-air is expected to have higher potential temperature than the local BL, simply due to its origin in a low-latitude and desert region. However, over the Iberian highlands this probability is greatly increased, to more than 60 % of the daytime hours with AD presence. Similar behaviour is seen in the Pyrenees, Alps, Apennines, and Dinaric Alps – hence, in mountainous regions. This is due to the fact that in these regions, simply due to orography, the BLH is already higher above sea level than in other regions. With enough solar heating its properties can become similar to those of the arriving AD-air, which facilitates the intrusion of the latter into the BL. This is supported by the seasonal analysis (Fig. A3, in the Appendix). Another reason for this behaviours could be overestimated BLHs in ERA5. Also, in inhomogeneous, mountainous terrain, mesoscale processes can influence the vertical exchange processes, and therefore the BLH (Rotach et al., 2015), so it can be very difficult to evaluate the BLH in numerical models (Rotach et al., 2017). ERA5 BLH has been found to be well correlated with radiosonde products by Guo et al. (2021), it represents BLHs over Europe well, with an average bias of 50 m. Other studies found ERA5 overestimates BLH especially during daytime in summer over complex terrain (up to 800 or 2000 m Madonna et al., 2021; Wei et al., 2025, respectively).
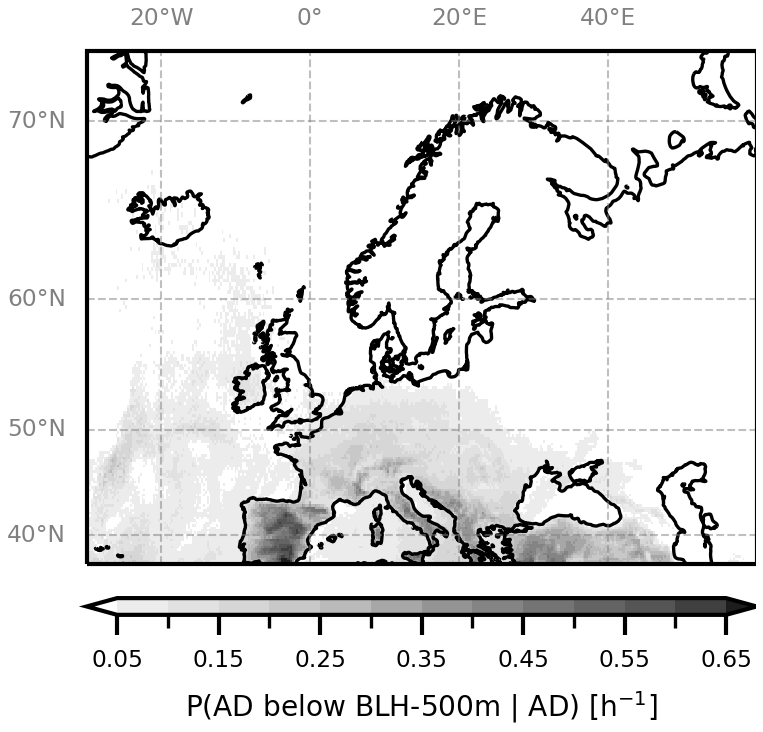
Figure 7Probability of the lowest AD-cell being within the BL, P(AD below BLH|AD).
Air of desert origin can populate the free troposphere between the local BLH and the tropopause in the target region frequently (Figs. 1 and 5). It rarely penetrates the local BLH (Fig. 7). Therefore, the temperature profile in the free troposphere in the target region is often modified by the presence of an AD. Sometimes the AD also forms a lid on top of the local BL, however, the persistence of these lids is typically short, so that they are not likely to cause considerable heat build-up and hence heat waves. Independent of its persistence, the presence of a lid can suppress or delay deep convection in its centre, and boost thunderstorm formation at its edges (as was shown for EMLs by e.g. Carlson and Ludlam, 1968; Keyser and Carlson, 1984; Lanicci and Warner, 1991b; Andrews et al., 2024), which makes ADs important in the context of deep convection.
3.5 Average changes during advection
The changes an AD experiences during its advection from source to target are also of interest in order to understand ADs. Hence, in every AD-cell, the difference in potential temperature, θ, specific humidity, q, and equivalent potential temperature, θE, between the current value and the trajectories' starting point, as well as the air parcels' age are averaged over all trajectories in the respective AD-cell. Note that every AD-cell (0.25° × 0.25° × 500 m) can contain any number of trajectories at a given time. The different air parcels in the cell may have come there along different trajectories, and taken different times to get there, but their combined properties decide the properties of the AD at this location, which is why the cell averaged value is a reasonable choice. The distribution of these average changes is depicted in Fig. 8 for all cells north of 37° N and all time steps. The average changes per AD-cell are interpreted in synergy with the average development of the “typical” trajectory clusters (or air streams; Sect. 2.4, same as in the evaluation of their paths in Sect. 3.2, Fig. 3). The trajectory clusters are shown for two starting days in Fig. 9. The starting days are chosen so that each typical air stream (colour) is present at least once. Time series of the difference in h a.m.s.l. (solid), θ (dotted), and q (dash-dotted) can give insight into what changes the air parcels experienced during the advection.
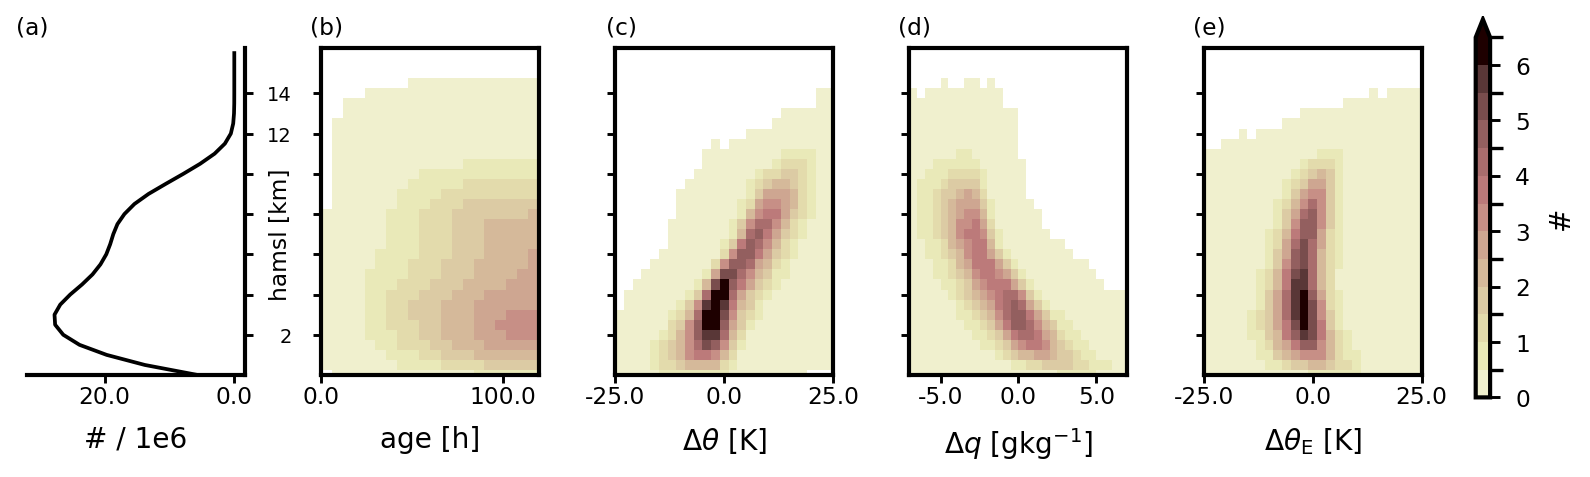
Figure 82D-histograms of cell-averaged changes in trajectories. For each AD-cell (0.25° × 0.25° × 500 m) all trajectories within are averaged. The histograms depict the distribution of cells in total (a), the average age (b), average differences to the starting location of potential temperature (Δθ, c), specific humidity (Δq, d), and equivalent potential temperature (ΔθE, e), respectively, across all cells north of 37° N and all time steps.
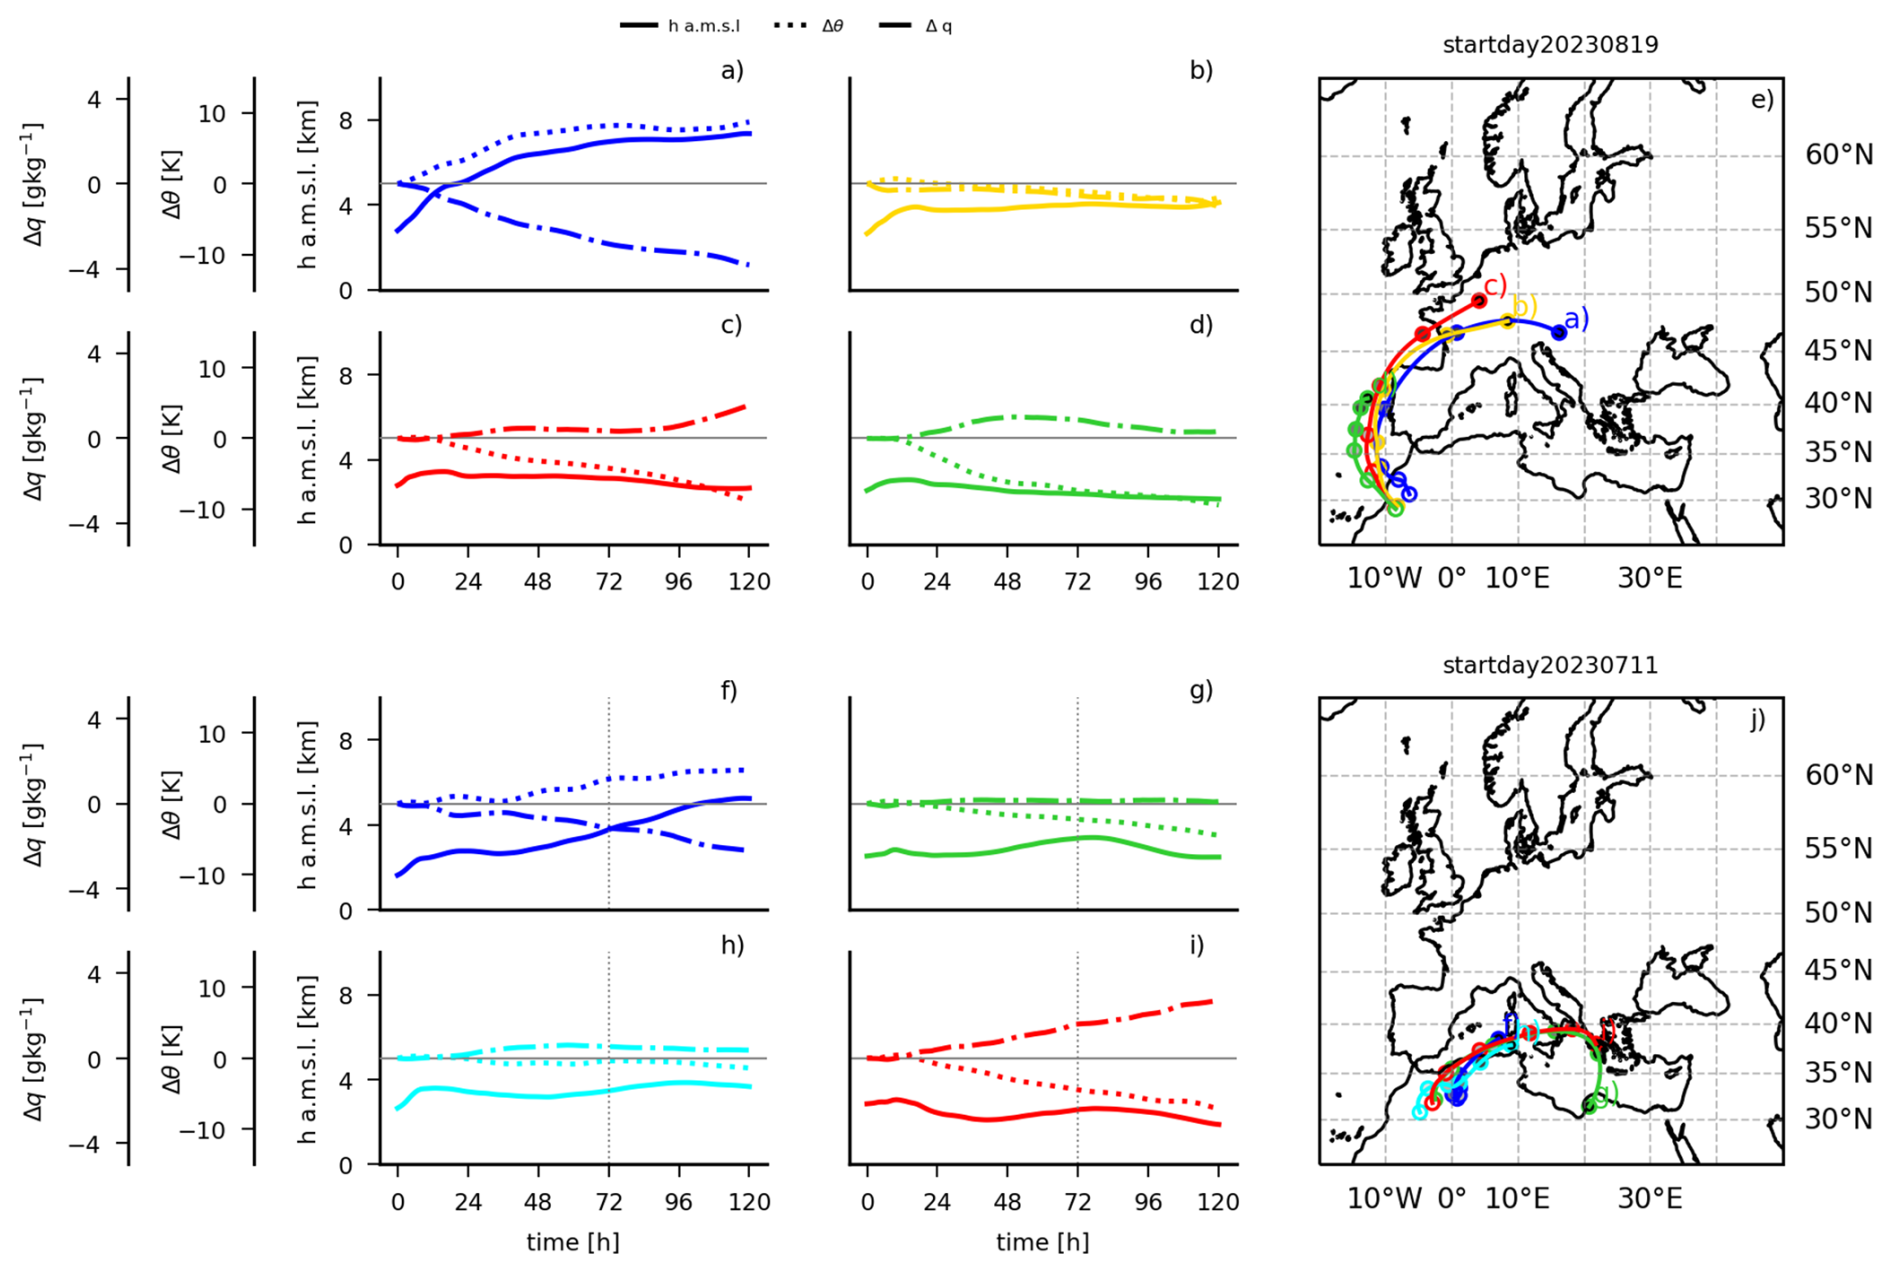
Figure 9Exemplary display of the trajectory clusters for the trajectories initialised on 19 August 2023 (top) and 11 July 2023 (bottom). The AD maximum is at 24 August 2023, 11:00 UTC (5 d after initialisation), and 14 July 2023, 06:00 UTC (3 d after initialisation), respectively. Note that 120 and 72 h (marked with vertical line in panels f–i) indicate the approximate time around which the AD maximum occurs, respectively. Since the trajectories averaged in the cluster means have varying initialisation times, this time point does not correspond to the exact time for all individual trajectories. Panels (a)–(d) and (f)–(i) depict the temporal evolution of the individual cluster means. Lines depict h a.m.s.l. (solid), Δθ (dotted), and Δq (dash-dotted) with respect to initialisation. Panels (e) and (j) show the paths of the cluster means.
It becomes apparent that most AD-cells are found between 2.5 and 3 km. Between 3 and 5 km and above 8 km the cell count decreases strongly with altitude, but in between there is a region where the cell count is almost constant with altitude (see Fig. 8a). Trajectories of all ages can be found at all altitudes (Fig. 8b). It is logical that there are more older trajectories (higher values in the right of Fig. 8b), since they had more time to arrive in the target region and remain there unless they leave the domain again during their 120 h. Figure 8c and d show a strong relation between the change in the potential temperature, θ, as well as the specific humidity, q, and the altitude. Trajectories that reach higher altitudes have experienced an increase in potential temperature of up to 20 K, and lost up to 5 g kg−1 of specific humidity. This behaviour can be explained when looking at the typical trajectory cluster development in Fig. 9: The blue air stream (panels a and f) experiences a strong ascent (sometimes more abrupt, sometimes gradual, see Supplement), together with an increase in θ and a decrease in q, which indicates that the ascent causes condensation which precipitates out. More than half of the 528 trajectory clusters analysed (4 clusters ×2 starting days ×66 events) belong to this air stream. The location of the ascent indicates that it happens at a colder air mass over continental Europe, or sometimes at the Atlas mountain range. This air stream resembles a warm conveyor belt, but unlike a warm conveyor belt does not have its origin in warm and moist regions over subtropical oceans, but in the warm and desert source region. The second most prevalent air stream is the red one (panels c, i), which 23 % of the trajectory clusters fall into. It descends (sometimes after an initial ascent), while experiencing a decrease in θ and increase in q. This indicates evaporative cooling as the reason for the changes. This can be re-evaporation of the precipitation falling through. As this cluster is often (not exclusively) observed over the Mediterranean Sea, it could also be evaporation from the sea or mixing with the cooler, moister BL there. For the yellow air stream (panel b, about 10 % of clusters) the potential temperature also decreases, but so does the specific humidity. This indicates mixing with a cooler, drier air mass. This is supported by the fact that this air stream often travels towards eastern Europe and it occurs more often in the colder season (DJF and SON, see Supplement), where air masses can be expected to be cold and dry. The green air stream (panels d, g) is characterised by a decrease in potential temperature at unchanged humidity. A reduction of potential temperature of more than 4 K during the 5 d without a change in moisture points to radiative cooling as cause. Lastly, the cyan air stream (panel h) almost conserves its thermodynamic properties. This air stream behaves like an EML, rarely reaches northern or eastern Europe, mainly appears in JJA (more than 60 % of occurrences are in JJA), but is generally observed infrequently (2.5 %). The remaining 5.8 % of trajectory clusters could not be categorised in these air streams, which is due to the usage of hard thresholds. The categorisation like this is nonetheless useful, since the air streams are interpretable.
There is a region between 2 and 4 km where many cells have average changes of θ and q around zero (dark colours in Fig. 8c, d). This may be an effect of averaging trajectories with different changes, but it also agrees with the presence of the cyan air stream, which retains its original properties. As a measure for air mass characteristics, the equivalent potential temperature, θE, is also shown (Fig. 8e). Throughout the column, the average changes are almost zero (with a slight tendency towards negative changes), which indicates that overall the air mass properties are preserved well. When looking at the changes for the trajectory clusters, often the yellow and green air streams have large changes in θE (see Supplement), which is logical, since their changes are dominated by diabatic processes.
Looking at the temporal average of the spatial distribution of the changes at several altitudes leads to a similar conclusion (not shown here). At higher altitudes the trajectories in the AD-cells have positive potential temperature differences and dried on average, while at lower altitudes they have moistened and decreased potential temperature. There is no noticeable spatial pattern in the horizontal. Logically, the average age of the trajectories in a cell increases towards the north and east, as the greater distance from the source results in longer advection times to reach these locations on average. On average, trajectories in cells in northern Europe at 9 km are younger than those at 4.5 km, due to higher wind speeds at higher altitudes.
In summary it can be said that there are 5 typical air streams that are dominated by different processes changing their thermodynamic properties: latent heating through condensation, evaporative or radiative cooling, or mixing. Only a small proportion of trajectory clusters falls into an air stream that behaves like an EML, emphasising the necessity of generalising that concept.
We investigated the properties of atmospheric deserts (ADs) over Europe during the period from May 2022 to April 2024. ADs are air masses that originate in the CBL of arid, desert source regions and are advected towards a typically moister, cooler target region. We employ a direct detection method tracing the air masses directly from their source region in northern Africa to their target region in Europe. This is done using LAGRANTO, based on ERA5 input data, to calculate trajectories at very high spatio-temporal resolution. We are aware that this study only covers a 2-year period. However, the computational and storage demand of the direct detection method are high (about 25TB for this study). Nevertheless, ADs have never been studied before (apart from the case study in Fix et al., 2024) and the 2-year dataset is already able to give insights in many of their characteristics, especially because they do occur frequently.
Some regions experience AD presence per ERA5-cell in up to 60 % of the observed hours during the study period. They can affect entire Europe and can span up to 54 % of the domain's area and 72 % of the land area. In the median, they span 15 % of the area, or 19 % of the land area. Their average duration is a few days. They are more likely to occur close to the source region, where they also tend to last longer. AD behaviour varies across seasons. Boreal spring is the season with the ADs with the largest extent and highest probabilities in parts of northern and eastern Europe. In summer, the ADs tend to have smaller extents, often confined to the Mediterranean, but the persistence is largest. During autumn, larger events extending further east are more likely again. Boreal winter is the season with the lowest probabilities of AD in the entire domain, durations are shortest, and small extents are favoured.
A cluster analysis of the geopotential height pattern at 500 hPa 24 h prior to 66 AD maxima yielded four different synoptic situations that foster large AD-events. They are characterised by different configurations of either a trough reaching into the source region, or a ridge extending far north from the source region. They lead to eastward and north-eastward paths of the trajectories on average. This highlights that ADs are a frequent and variable phenomenon occurring under different flow patterns, which can possibly influence local weather often and in a variety of ways. The identified flow patterns also resemble those identified in other studies in the context of Saharan warm air intrusions and dust transport. Cos et al. (2025) also found anomalously low pressure in (north-) western Europe during the onset of warm air intrusions from the Sahara into the Mediterranean. Varga et al. (2013) identified different types of geopotential height patterns connected to Saharan dust events in the Carpathian Basin. Their Type I has similarities with our Cluster 1. Their Type II resembles our Cluster 2, and is also most frequent in spring. Their Type III also has a ridge over central Europe similar to our Cluster 3, which causes dust events especially in western Europe. Also Rostási et al. (2022) investigate dust intrusions into central Europe, and several of their situations resemble our clusters as well. These similarities can be expected, as both warm air intrusions as well as dust intrusions must be caused by ADs by definition.
One mechanism by which ADs can influence local weather is through the modification of the temperature profile in the target region. ADs often reside above the local BL and up to the troposphere, so that they modify the profile of the entire free troposphere in the target region. A particularly strong influence can be expected when the AD forms a lid directly on top of the local BL, and therefore possibly cause a capping inversion. We analysed how often this is the case during daytime. North of 55° N this rarely happens (< 20 %) further south the probability of a lid is 20 %–40 % given an AD is present. However, persistence of such a lid is less than 2.5 d in most of the domain, and only over the Mediterranean Sea the 90th percentile of streak lengths reaches up to a week. AD-air only enters the local BL rarely, and if it does it occurs over high altitude mountainous CBLs. Hence, a considerable proportion of all AD-events can produce a lid, which can have important implications for the local weather, as it can inhibit thunderstorm eruption and foster heat accumulation underneath. We assume the latter to be unlikely, however, since the persistence of the lids are typically so short.
Another consequence of ADs is the transport of Saharan dust. By definition all dust events need to be ADs, but not all ADs have to carry dust. The question of whether and how often they do is beyond the scope of this study. Dusty cirrus clouds can occur when Saharan dust ascends into the upper troposphere (as it can with warm conveyor belts, or the ascending air stream of an AD; Fromm et al., 2016; Seifert et al., 2023; Hermes et al., 2024), forming dust-infused baroclinic storms with characteristic cirrus decks over Europe. These dust events can modify shortwave and longwave radiation fluxes and cloudiness through direct, indirect, and semi-direct dust effects (Helmert et al., 2007) and hence additionally change the vertical temperature profile. Forecasting the cloud and radiative effects of dust events poses a challenge to numerical weather prediction models, which often do not include dust prognostically, and also lack proper parametrisation of dust-cloud-radiation interactions (Hermes et al., 2024; Seifert et al., 2023). Including prognostic dust and a proper parametrisation to describe dusty cirrus effects has been shown to improve forecasts of clouds and radiative fluxes considerably (Hermes et al., 2024; Seifert et al., 2023). This highlights the relevance of AD-linked dust events, especially for cloud and radiation forecasts, which are especially important to the renewable energy sector. All the above mentioned consequences of ADs remain to be investigated in detail.
Atmospheric rivers are another phenomenon related to extreme weather events. While they sound like the moist counterpart of ADs, the direct comparison is not straightforward, as atmospheric rivers are defined by their water vapour footprint, while ADs are solely defined by their source region. Also atmospheric rivers can carry dust, as they have been described to pick up dust in the Saharan boundary layer while travelling from the Atlantic towards the continent (Dezfuli et al., 2021; Francis et al., 2022). Hence, it is possible for an atmospheric river to also be an AD, which is not a contradiction but simply reflects the different definitions of the two terms.
Five typical air streams were identified from trajectory clusters using a classification algorithm. They were used in synergy with the average changes in the thermodynamic variables per AD-cell, to explain changes the AD-air experiences during advection. One of these air streams reaches the target region with an even higher potential temperature and lower moisture than it had at the source. This is likely due to condensation and subsequent precipitation. Three air streams experience a reduction in potential temperature, either through radiation, evaporation, or mixing. The last air stream almost conserves its thermodynamic properties. While this analysis is more detailed and different air streams emerge in different cases, this agrees overall with the findings from Fix et al. (2024). The average changes of equivalent potential temperature are close to zero, which indicates that the air mass characteristics are retained.
ADs include the two well-studied special cases of EMLs and warm conveyor belts. The ascending air stream that experiences an increase in potential temperature and a decrease in moisture, and is found for almost all AD cases, resembles a warm conveyor belt, but it is much dryer since it originates in northern Africa. EMLs, often called “Spanish Plumes”, are probably the most thoroughly studied special cases of ADs in Europe (e.g. Carlson and Ludlam, 1968; Lewis and Gray, 2010; Dahl and Fischer, 2016; Schultz et al., 2025a, b). Ironically, the British Isles – the main target area for Spanish Plumes – are one of the regions least frequently covered by AD-air (see Fig. 1a) and the EML-like air stream is only observed in 2.5 % of cases (Sect. 3.5).
The distribution of the lowest and highest AD-cells is similar across the seasons (Fig. A1 left and centre columns). Both the lowest and highest AD-cells are highest in JJA (upper bounds up to more than 10 km, Fig. A1e) and lowest in DJF (lower bounds as low as around 1 km on average, Fig. A1j). Also the distance between the lowest and highest AD-cells is largest in JJA (more than 5 km) and lowest in DJF (Fig. A1 right column). While in MAM ADs of several kilometres thickness on average cover almost the entire continental portion of the domain, the other seasons show more localised occurrence of the thickest ADs. In JJA there is a clear maximum thickness over the Baltic states an the Mediterranean Sea.
The seasonal analysis of the conditional probability of a lid shows that the highest probabilities of a lid are recorded in SON and DJF, with probabilities up to more than 55 % in the Mediterranean and west of Iberia (Fig. A2d, j). The Mediterranean is the region with the highest probabilities in all seasons (Fig. A2 first column). The highest mean lid streak length is observed over the Mediterranean in JJA with more than 3.5 d on average, followed by SON (Fig. A2e, h). The absolute longest persisting streaks (90th percentile above a week) happen in SON and JJA (Fig. A2f, i).
The highest probabilities for an AD to enter the local BLH are found over mountainous areas, in particular during he warmer seasons, when the local BL is additionally heated. Especially high values are found in JJA and SON over the high regions on the Iberian Peninsula, the Alps, the Apennines, and the Dinaric Alps. In these seasons also the larger Mediterranean islands experience higher probabilities. The south-eastern Mediterranean region has elevated values in MAM already, possibly indicating warm, deep BLH earlier in the year in this region. In autumn, the eastern Mediterranean sea has elevated probabilities, likely because in this season the sea is still warm compared to the surrounding land masses.
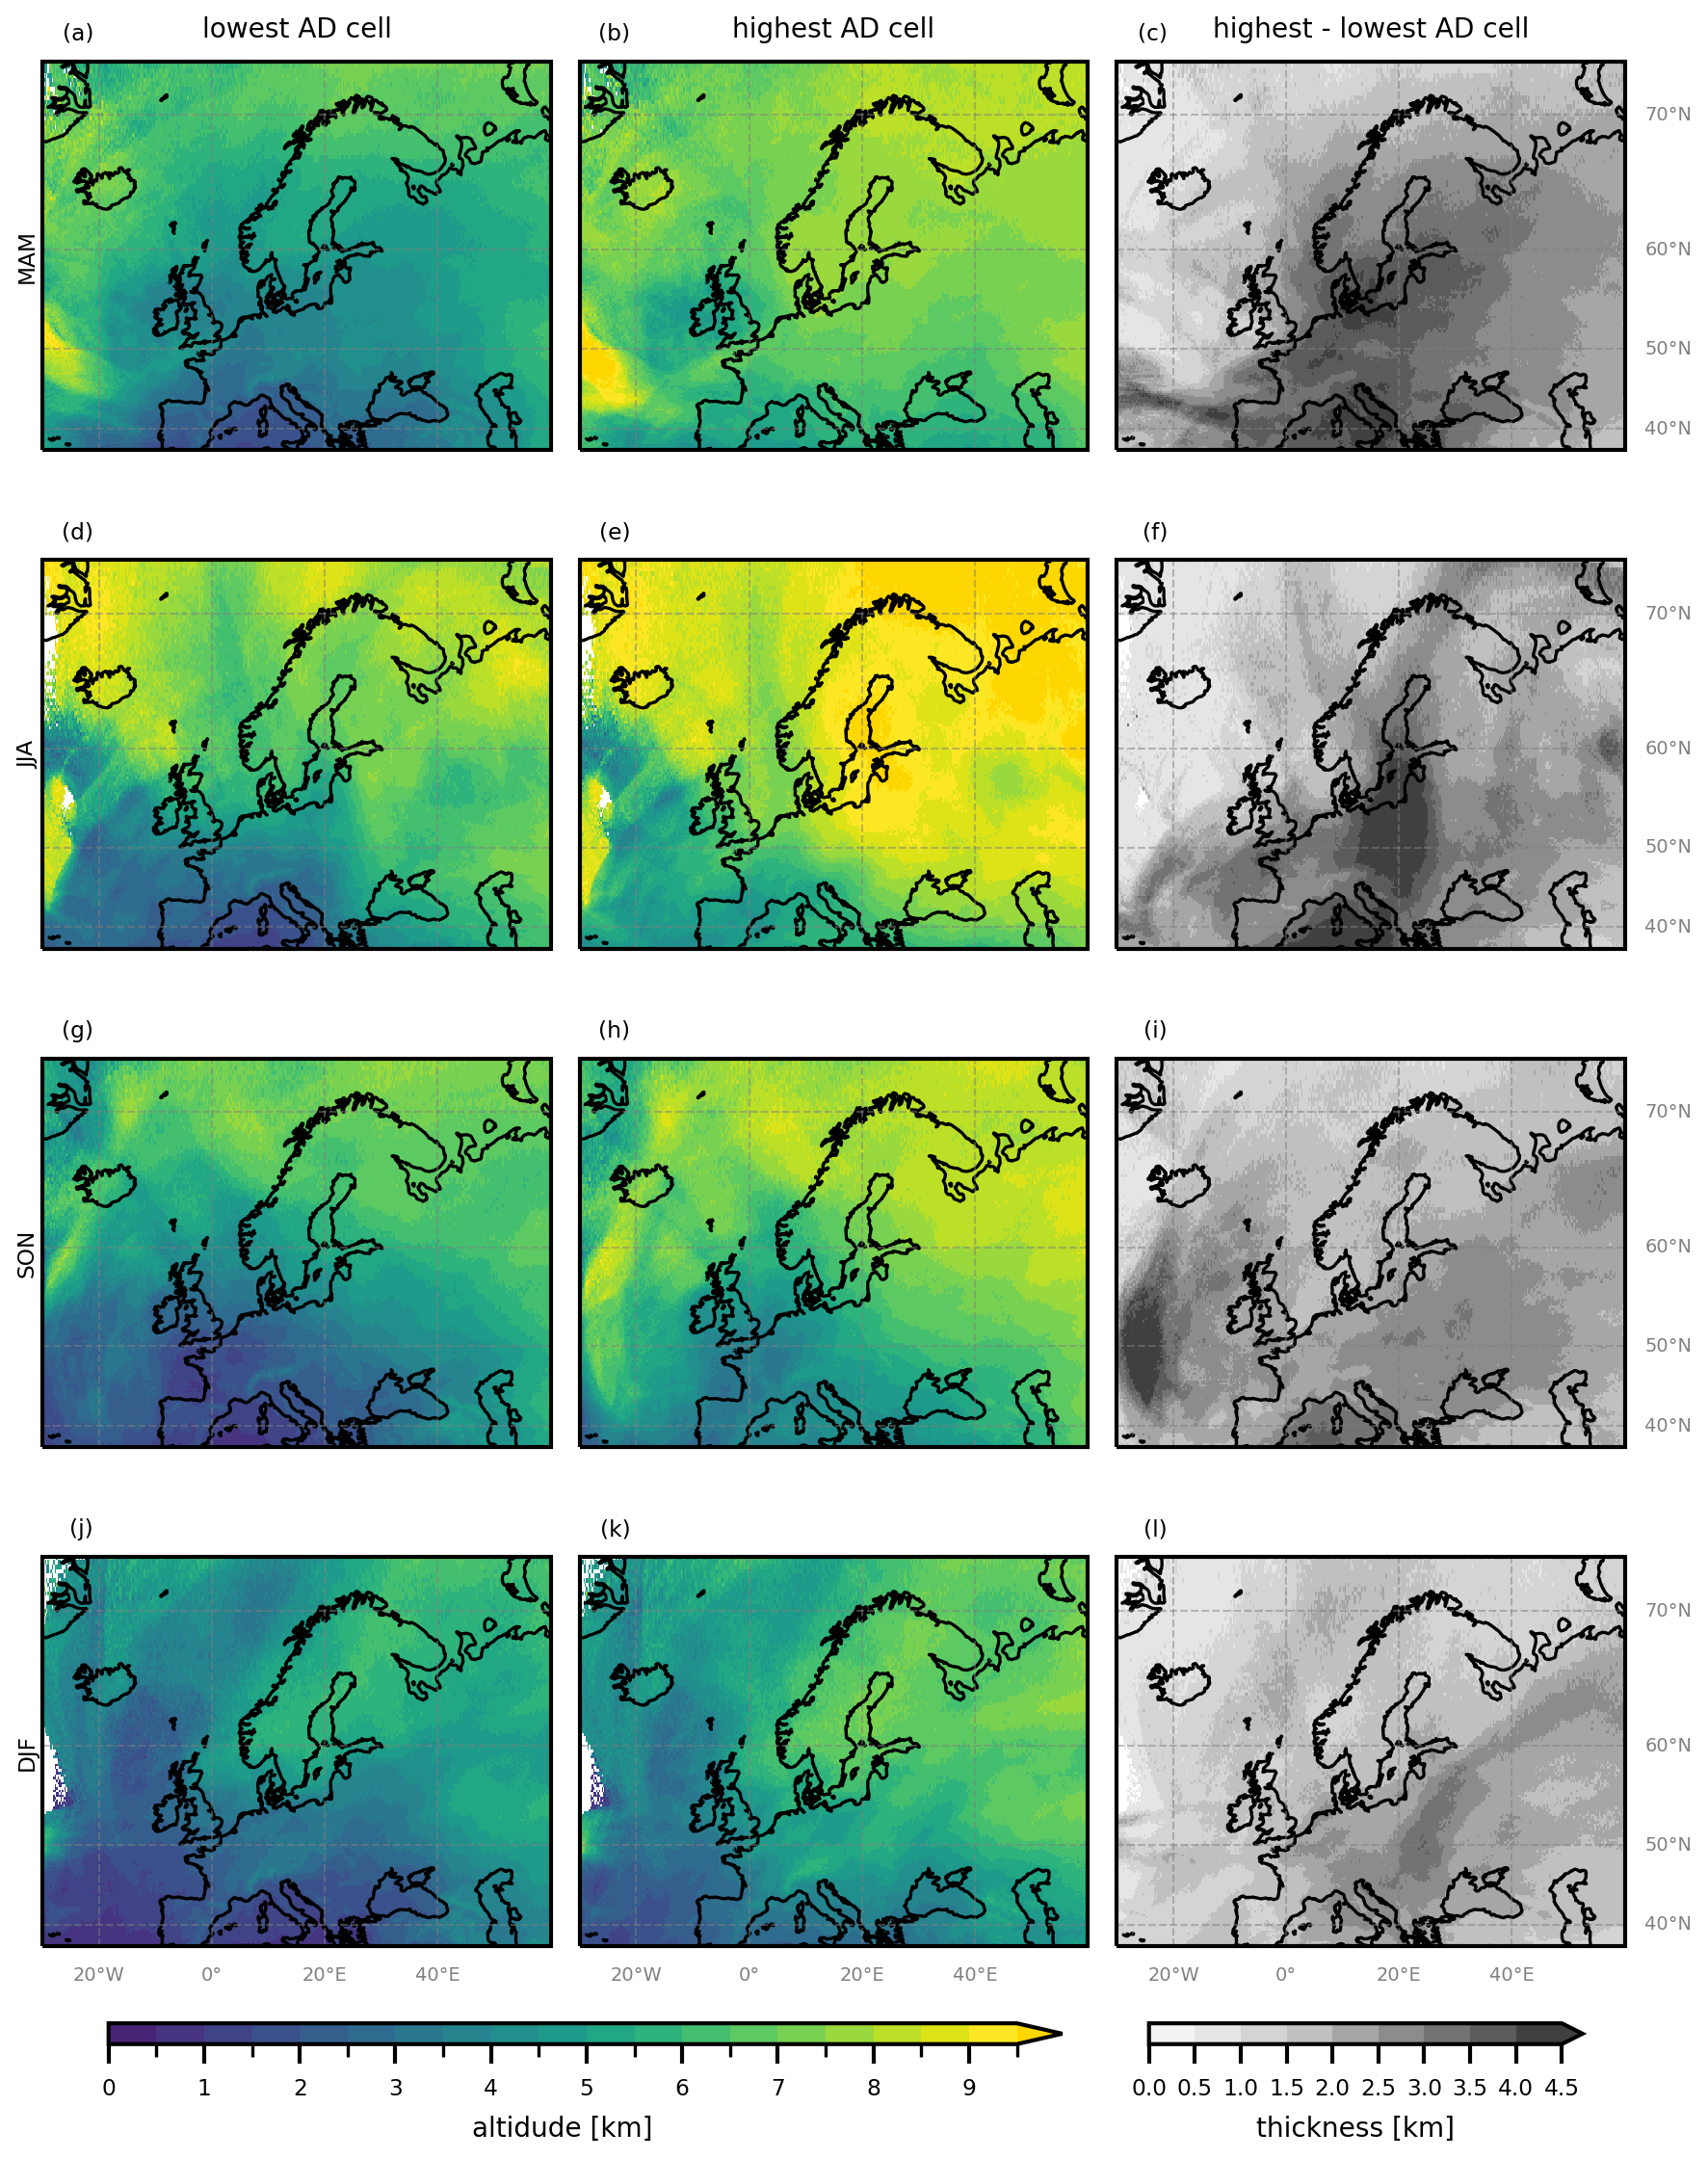
Figure A1Average altitudes of lowest (a, d, g, j), and highest (b, e, h, k) AD-cells, and their distance (c, f, i, l) per season (rows).
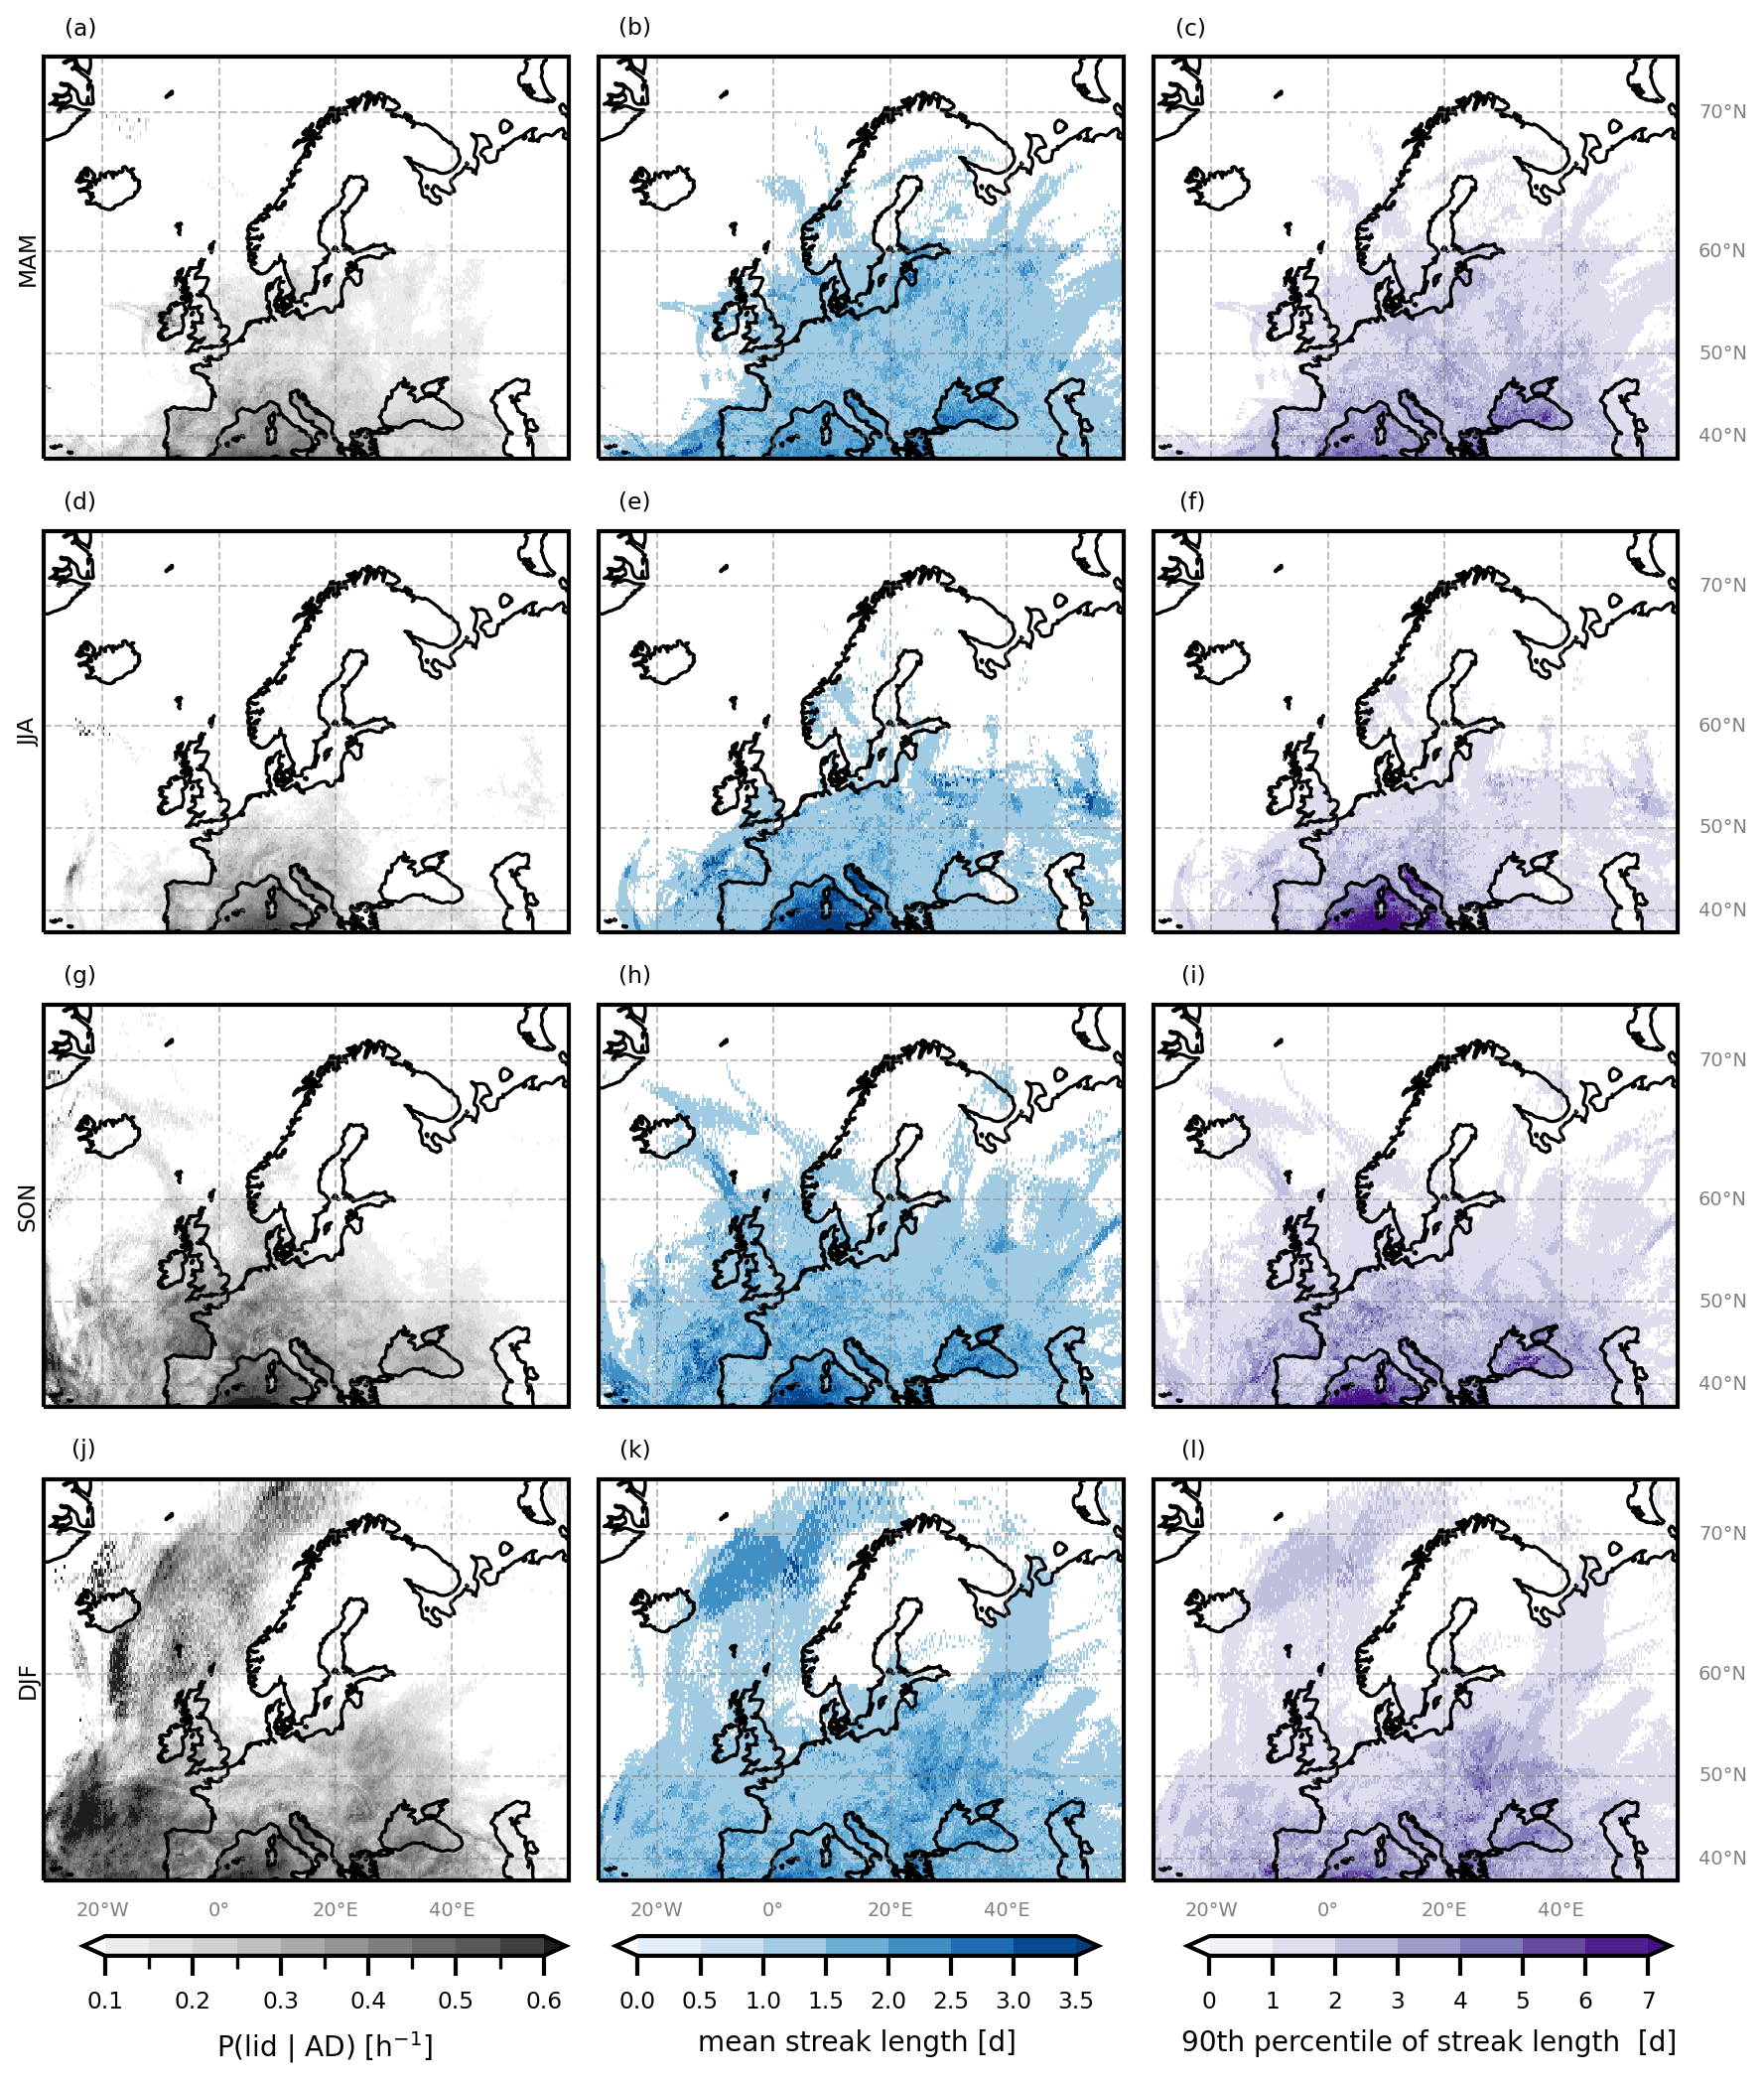
Figure A2P(lid|AD) (a, d, g, j), mean lid streak length in days (b, e, h, k), and maximum lid streak length in days (c, f, i, l), for each season MAM (a–c), JJA (d–f), SON (g–i), DJF (j–l).
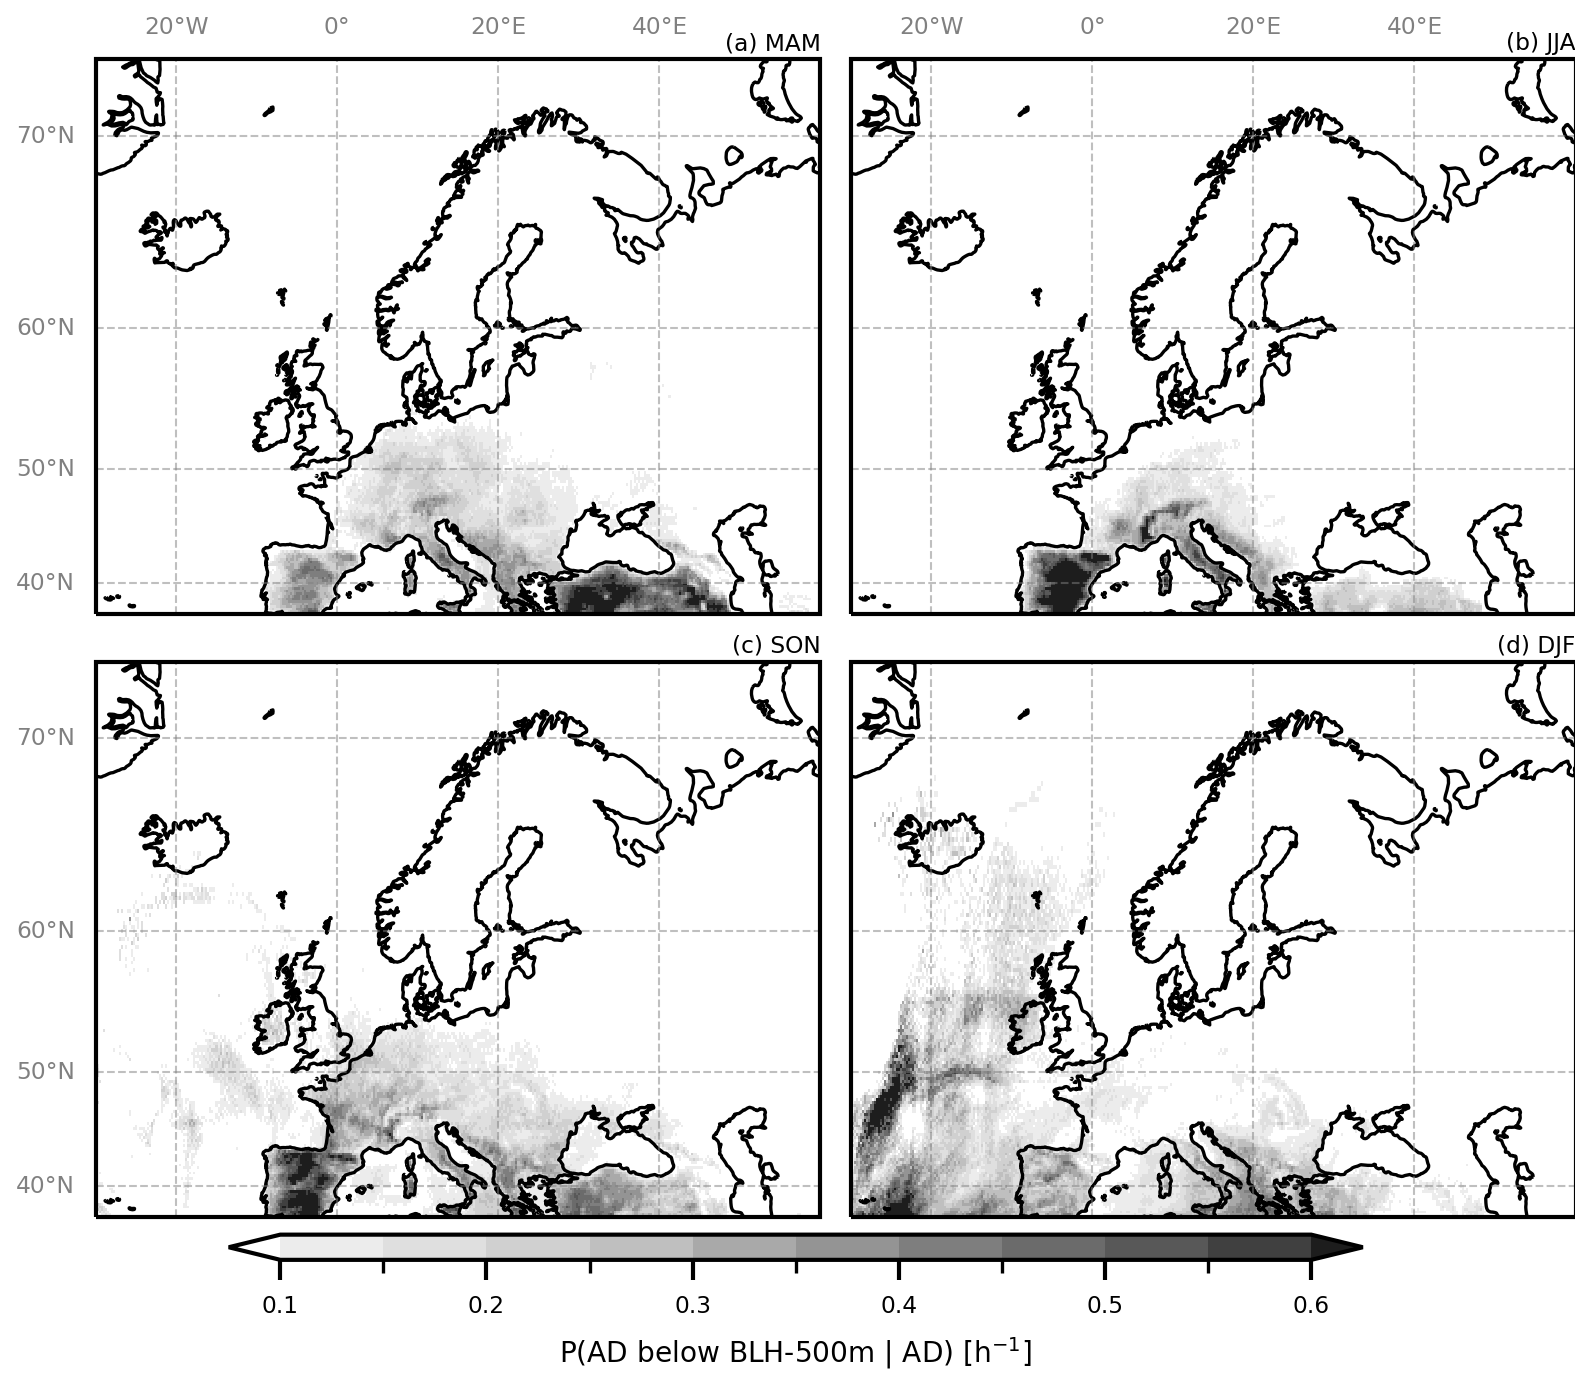
Figure A3Probability of the lowest AD-cell being within the BL, P(AD below BLH|AD), per season.
Much of the data processing is done with the climate data operators (cdo; https://doi.org/10.5281/zenodo.10020800, Schulzweida, 2023) and python. Code is available at Zenodo: https://doi.org/10.5281/zenodo.17485142 (Fix-Hewitt, 2025).
ERA5 data is freely available at the Copernicus Climate Change Service (C3S) Climate Data Store (https://doi.org/10.24381/cds.adbb2d47, Hersbach et al., 2023). The results contain modified Copernicus Climate Change Service information 2020. Neither the European Commission nor ECMWF is responsible for any use that may be made of the Copernicus information or data it contains. The LAGRANTO is available from Sprenger and Wernli (2015).
The supplement related to this article is available online at https://doi.org/10.5194/wcd-7-17-2026-supplement.
GM and AZ acquired the funding for this project. FFH conducted the calculations, the analysis, and wrote the manuscript under supervision by GM and AZ, with the support of IS and RS. IS and FFH acquired the data and RS supported in software development. GM, AZ, IS, and RS reviewed the manuscript prepared by FFH.
The contact author has declared that none of the authors has any competing interests.
Publisher's note: Copernicus Publications remains neutral with regard to jurisdictional claims made in the text, published maps, institutional affiliations, or any other geographical representation in this paper. The authors bear the ultimate responsibility for providing appropriate place names. Views expressed in the text are those of the authors and do not necessarily reflect the views of the publisher.
We thank Deborah Morgenstern for setting up LAGRANTO and running the first explorative trajectory calculations. We thank all colleagues who were involved in discussions. The computational results have been achieved [in part] using the Austrian Scientific Computing (ASC) infrastructure.
This research was funded in part by the Austrian Science Fund (FWF) 10.55776/P35780.
This paper was edited by Christian Grams and reviewed by Kilian Hermes and one anonymous referee.
Andrews, M. S., Gensini, V. A., Haberlie, A. M., Ashley, W. S., Michaelis, A. C., and Taszarek, M.: Climatology of the Elevated Mixed Layer over the Contiguous United States and Northern Mexico Using ERA5: 1979–2021, Journal of Climate, 37, 1833–1851, https://doi.org/10.1175/JCLI-D-23-0517.1, 2024. a, b, c
Banacos, P. C. and Ekster, M. L.: The Association of the Elevated Mixed Layer with Significant Severe Weather Events in the Northeastern United States, Weather and Forecasting, 25, 1082–1102, https://doi.org/10.1175/2010WAF2222363.1, 2010. a
Carlson, T. N. and Ludlam, F. H.: Conditions for the occurrence of severe local storms, Tellus, 20, 203–226, https://doi.org/10.1111/j.2153-3490.1968.tb00364.x, 1968. a, b, c, d, e, f
Carlson, T. N., Benjamin, S. G., and Forbes, G. S.: Elevated Mixed Layers in the Regional Severe Storm Environment: Conceptual Model and Case Studies, Monthly Weather Review, 111, 1453–1473, https://doi.org/10.1175/1520-0493(1983)111<1453:EMLITR>2.0.CO;2, 1983. a, b
Cordeira, J. M., Metz, N. D., Howarth, M. E., and Galarneau, T. J.: Multiscale upstream and in situ precursors to the elevated mixed layer and high-impact weather over the Midwest United States, Weather and Forecasting, 32, 905–923, https://doi.org/10.1175/WAF-D-16-0122.1, 2017. a, b, c
Cos, P., Olmo, M., Campos, D., Marcos-Matamoros, R., Palma, L., Ángel G Muñoz, and Doblas-Reyes, F. J.: Saharan warm-air intrusions in the western Mediterranean: identification, impacts on temperature extremes, and large-scale mechanisms, Weather and Climate Dynamics, 6, 609–626, https://doi.org/10.5194/wcd-6-609-2025, 2025. a, b
Dahl, J. M. and Fischer, J.: The origin of western European warm-season prefrontal convergence lines, Weather and Forecasting, 31, 1417–1431, https://doi.org/10.1175/WAF-D-15-0161.1, 2016. a, b
de Villiers, M. P.: Europe extreme heat 22–26 July 2019: was it caused by subsidence or advection?, Weather, 75, 228–235, https://doi.org/10.1002/wea.3717, 2020. a
Dezfuli, A., Bosilovich, M. G., and Barahona, D.: A Dusty Atmospheric River Brings Floods to the Middle East, Geophysical Research Letters, 48, https://doi.org/10.1029/2021GL095441, 2021. a
European Centre for Medium-Range Weather Forecasts: IFS Documentation CY41R2 – Part IV: Physical Processes, vol. 4, European Centre for Medium-Range Weather Forecasts, https://doi.org/10.21957/tr5rv27xu, 2016. a
Farrell, R. J. and Carlson, T. N.: Evidence for the Role of the Lid and Underrunning in an Outbreak of Tornadic Thunderstorms, Monthly Weather Review, 117, 857–871, https://doi.org/10.1175/1520-0493(1989)117<0857:EFTROT>2.0.CO;2, 1989. a
Fix, F., Mayr, G., Zeileis, A., Stucke, I., and Stauffer, R.: Detection and consequences of atmospheric deserts: insights from a case study, Weather and Climate Dynamics, 5, 1545–1560, https://doi.org/10.5194/wcd-5-1545-2024, 2024. a, b, c, d, e, f, g, h, i, j, k, l
Fix-Hewitt, F.: Code used in preparation of the manuscript “Properties and Characteristics of Atmospheric Deserts over Europe: A First Statistical Analysis” by Fix-Hewitt et. al., Weather and Climate Dynamics, Zenodo [code], https://doi.org/10.5281/zenodo.17485142, 2025. a
Francis, D., Fonseca, R., Nelli, N., Bozkurt, D., Picard, G., and Guan, B.: Atmospheric rivers drive exceptional Saharan dust transport towards Europe, Atmospheric Research, 266, 105959, https://doi.org/10.1016/J.ATMOSRES.2021.105959, 2022. a
Fromm, M., Kablick, G., and Caffrey, P.: Dust-infused baroclinic cyclone storm clouds: The evidence, meteorology, and some implications, Geophysical Research Letters, 43, 12643–12650, https://doi.org/10.1002/2016GL071801, 2016. a
Garcia-Carreras, L., Parker, D. J., Marsham, J. H., Rosenberg, P. D., Brooks, I. M., Lock, A. P., Marenco, F., Mcquaid, J. B., and Hobby, M.: The turbulent structure and diurnal growth of the Saharan atmospheric boundary layer, Journal of the Atmospheric Sciences, 72, 693–713, https://doi.org/10.1175/JAS-D-13-0384.1, 2015. a
Guo, J., Zhang, J., Yang, K., Liao, H., Zhang, S., Huang, K., Lv, Y., Shao, J., Yu, T., Tong, B., Li, J., Su, T., Yim, S. H. L., Stoffelen, A., Zhai, P., and Xu, X.: Investigation of near-global daytime boundary layer height using high-resolution radiosondes: first results and comparison with ERA5, MERRA-2, JRA-55, and NCEP-2 reanalyses, Atmospheric Chemistry and Physics, 21, 17079–17097, https://doi.org/10.5194/acp-21-17079-2021, 2021. a, b
Helmert, J., Heinold, B., Tegen, I., Hellmuth, O., and Wendisch, M.: On the direct and semidirect effects of Saharan dust over Europe: A modeling study, Journal of Geophysical Research: Atmospheres, 112, https://doi.org/10.1029/2006JD007444, 2007. a
Hermes, K., Quinting, J., Grams, C. M., Hoose, C., and Hoshyaripour, G. A.: Impact of Saharan dust outbreaks on short-range weather forecast errors in Europe, Quarterly Journal of the Royal Meteorological Society, 150, 1704–1723, https://doi.org/10.1002/QJ.4666, 2024. a, b, c
Hersbach, H., Bell, B., Berrisford, P., Hirahara, S., Horányi, A., Muñoz-Sabater, J., Nicolas, J., Peubey, C., Radu, R., Schepers, D., Simmons, A., Soci, C., Abdalla, S., Abellan, X., Balsamo, G., Bechtold, P., Biavati, G., Bidlot, J., Bonavita, M., Chiara, G. D., Dahlgren, P., Dee, D., Diamantakis, M., Dragani, R., Flemming, J., Forbes, R., Fuentes, M., Geer, A., Haimberger, L., Healy, S., Hogan, R. J., Hólm, E., Janisková, M., Keeley, S., Laloyaux, P., Lopez, P., Lupu, C., Radnoti, G., de Rosnay, P., Rozum, I., Vamborg, F., Villaume, S., and Thépaut, J. N.: The ERA5 global reanalysis, Quarterly Journal of the Royal Meteorological Society, 146, 1999–2049, https://doi.org/10.1002/qj.3803, 2020. a, b, c
Hersbach, H., Bell, B., Berrisford, P., Biavati, G., Horányi, A., Sabater, J. M., Nicolas, J., Peubey, C., R., R., Rozum, I., Schepers, D., Simmons, A., Soci, C., Dee, D., and Thépaut, J.-N.: ERA5 hourly data on single levels from 1940 to present, Copernicus Climate Change Service (C3S) Climate Data Store (CDS) [data set], https://doi.org/10.24381/cds.adbb2d47, 2023. a
Keune, J., Schumacher, D. L., and Miralles, D. G.: A unified framework to estimate the origins of atmospheric moisture and heat using Lagrangian models, Geoscientific Model Development, 15, 1875–1898, https://doi.org/10.5194/gmd-15-1875-2022, 2022. a
Keyser, D. and Carlson, T. N.: Transverse Ageostrophic Circulations Associated with Elevated Mixed Layers, Monthly Weather Review, 112, 2465–2478, https://doi.org/10.1175/1520-0493(1984)112<2465:TACAWE>2.0.CO;2, 1984. a, b
Lanicci, J. M. and Warner, T. T.: A Synoptic Climatology of the Elevated Mixed-Layer Inversion over the Southern Great Plains in Spring. Part I: Structure, Dynamics, and Seasonal Evolution, Weather and Forecasting, 6, 181–197, https://doi.org/10.1175/1520-0434(1991)006<0181:ASCOTE>2.0.CO;2, 1991a. a, b
Lanicci, J. M. and Warner, T. T.: A Synoptic Climatology of the Elevated Mixed-Layer Inversion over the Southern Great Plains in Spring. Part II: The Life Cycle of the Lid, Weather and Forecasting, 6, 198–213, https://doi.org/10.1175/1520-0434(1991)006<0198:ASCOTE>2.0.CO;2, 1991b. a, b, c, d, e
Lewis, M. W. and Gray, S. L.: Categorisation of synoptic environments associated with mesoscale convective systems over the UK, Atmospheric Research, 97, 194–213, https://doi.org/10.1016/J.ATMOSRES.2010.04.001, 2010. a
MacQueen, J.: Some methods for classification and analysis of multivariate observations, Vol. 1, 281–297, 14 Edn., https://books.google.at/books?hl=de&lr=&id=IC4Ku_7dBFUC&oi=fnd&pg=PA281&dq=MacQueen,+J.:+Some+Methods+for+Classification+and+Analy-+sis+of+MultiVariate+Observations,&ots=nQVfFYNdsO&sig=c-Q0jlu5eVf-0HADehKAHo2Zt4A#v=onepage&q&f=false (last access: 5 January 2026), 1967. a
Madonna, F., Summa, D., Girolamo, P. D., Marra, F., Wang, Y., and Rosoldi, M.: Assessment of Trends and Uncertainties in the Atmospheric Boundary Layer Height Estimated Using Radiosounding Observations over Europe, Atmosphere 2021, Vol. 12, p. 301, https://doi.org/10.3390/ATMOS12030301, 2021. a
Oertel, A., Pickl, M., Quinting, J. F., Hauser, S., Wandel, J., Magnusson, L., Balmaseda, M., Vitart, F., and Grams, C. M.: Everything Hits at Once: How Remote Rainfall Matters for the Prediction of the 2021 North American Heat Wave, Geophysical Research Letters, 50, e2022GL100958, https://doi.org/10.1029/2022GL100958, 2023. a
Ribeiro, B. Z. and Bosart, L. F.: Elevated mixed layers and associated severe thunderstorm environments in South and North America, Monthly Weather Review, 146, 3–28, https://doi.org/10.1175/MWR-D-17-0121.1, 2018. a
Rostási, A., Topa, B. A., Gresina, F., Weiszburg, T. G., Gelencsér, A., and Varga, G.: Saharan Dust Deposition in Central Europe in 2016 – A Representative Year of the Increased North African Dust Removal Over the Last Decade, Frontiers in Earth Science, 10, https://doi.org/10.3389/FEART.2022.869902, 2022. a
Rotach, M. W., Gohm, A., Lang, M. N., Leukauf, D., Stiperski, I., and Wagner, J. S.: On the vertical exchange of heat, mass, and momentum over complex, mountainous terrain, Frontiers in Earth Sciences, 3, 1–14, https://doi.org/10.3389/FEART.2015.00076, 2015. a
Rotach, M. W., Stiperski, I., Fuhrer, O., Goger, B., Gohm, A., Obleitner, F., Rau, G., Sfyri, E., and Vergrgeiner, J.: Investigating Exchange Processes over Complex Topography: The Innsbruck Box (i-Box), Bulletin of the American Meteorological Society, 98, 787–805, https://doi.org/10.1175/BAMS-D-15-00246.1, 2017. a
Schultz, D. M., Herrerías‐Azcué, F., Lowe, D., Kirshbaum, D. J., and Young, M. V.: Rethinking the Spanish plume: An airstream analysis challenges the canonical conceptual model, Quarterly Journal of the Royal Meteorological Society, 151, https://doi.org/10.1002/QJ.5070, 2025a. a, b, c, d
Schultz, D. M., Young, M. V., and Kirshbaum, D. J.: The “Spanish Plume” Elevated Mixed Layer: Review of its Use and Misuse within the Scientific Literature, Monthly Weather Review, 153, https://doi.org/10.1175/MWR-D-24-0139.1, 2025b. a, b, c, d
Schulzweida, U.: CDO User Guide, Zenodo, https://doi.org/10.5281/zenodo.10020800, 2023. a
Seifert, A., Bachmann, V., Filipitsch, F., Förstner, J., Grams, C. M., Hoshyaripour, G. A., Quinting, J., Rohde, A., Vogel, H., Wagner, A., and Vogel, B.: Aerosol–cloud–radiation interaction during Saharan dust episodes: the dusty cirrus puzzle, Atmospheric Chemistry and Physics, 23, 6409–6430, https://doi.org/10.5194/acp-23-6409-2023, 2023. a, b, c
Sibley, A.: Thunderstorms from a Spanish Plume event on 28 June 2011, Weather, 67, 143–146, https://doi.org/10.1002/wea.1928, 2012. a
Sprenger, M. and Wernli, H.: The LAGRANTO Lagrangian analysis tool – version 2.0, Geoscientific Model Development, 8, 2569–2586, https://doi.org/10.5194/gmd-8-2569-2015, 2015. a, b, c
Stohl, A., Haimberger, L., Scheele, M. P., and Wernli, H.: An intercomparison of results from three trajectory models, Meteorological Applications, 8, 127–135, https://doi.org/10.1017/S1350482701002018, 2001. a
van der Does, M., Knippertz, P., Zschenderlein, P., Harrison, R. G., and Stuut, J.-B. W.: The mysterious long-range transport of giant mineral dust particles, Science Advances, 4, eaau2768, https://doi.org/10.1126/sciadv.aau2768, 2018. a
Varga, G., Kovács, J., and Újvári, G.: Analysis of Saharan dust intrusions into the Carpathian Basin (Central Europe) over the period of 1979–2011, Global and Planetary Change, 100, 333–342, https://doi.org/10.1016/J.GLOPLACHA.2012.11.007, 2013. a
Wei, Y., Sun, Y., Ma, Y., Tan, Y., Ren, X., Peng, K., Yang, S., Lin, Z., Zhou, X., Ren, Y., Ahmed, M., Tian, Y., and Xin, J.: Deviations of Boundary Layer Height and Meteorological Parameters Between Ground-Based Remote Sensing and ERA5 over the Complex Terrain of the Mongolian Plateau, Remote Sensing, 17, 393, https://doi.org/10.3390/RS17030393, 2025. a