
the Creative Commons Attribution 4.0 License.
the Creative Commons Attribution 4.0 License.
 | 16 Sep 2026
Meteorological drivers of extreme swells on the Peruvian coast
Gonzalo Agurto Barragán

Ricardo García-Herrera
In this study, we analyse a set of case studies to characterize the meteorological configurations associated with extreme ocean swells along the Peruvian coast, which are frequently produced by remote Pacific storms from both hemispheres. Using extreme-swell warnings from the Peruvian Navy and ERA5 reanalysis, we examine five austral-winter Southern Hemisphere (SH) events (very strong, south-westerly) and six boreal-winter Northern Hemisphere (NH) events (strong, north-westerly). Event-centred composites are computed over lead windows guided by estimated swell travel times (3–4 d in the SH; 8–11 d in the NH). In both hemispheres, these case studies show a deep extratropical cyclone exhibiting a vertically stacked structure throughout the troposphere before the coastal swell peak, while an upper-level jet core strengthens and organizes a persistent corridor of enhanced surface westerlies over the swell-generation region. In the SH, coherent surrounding ridging tightens the meridional pressure gradient and co-occurs with a strengthened, sharper polar-front jet. In the NH, preconditioning is dominated by a deep central–western North Pacific low with comparatively weak, localized ridging and a markedly intensified, more zonally extended subtropical jet, while the polar-front jet weakens. A flow-analogue analysis suggests that SH event-related surface winds have become more intense in recent decades, consistent with increased large-scale pressure contrasts and a shift toward more positive Southern Annular Mode conditions, whereas NH events show no robust signal, probably due to strong interannual-to-decadal variability. These results can support earlier recognition of remote swell hazards affecting Peru and, consequently, can lead to an improvement of early warning systems.
- Article
(8714 KB) - Full-text XML
-
Supplement
(10298 KB) - BibTeX
- EndNote


Coastal communities worldwide are increasingly impacted by extreme wave events. These events, often referred to as coastal wave storms or anomalous swells, can result in flooding, coastal erosion, and disruptions to maritime activities. While some extreme wave conditions are generated by local storms, many destructive coastal events are driven by ocean swells originating from distant extratropical cyclones. Swell can cross ocean basins with modest attenuation (Barber and Ursell, 1948; Ardhuin et al., 2009). In the Pacific, about 22 % of coastal extremes originate from the opposite hemisphere (across the Equator) and ∼ 30 %–35 % of tropical extremes originate at higher latitudes (Boucharel et al., 2021). This underscores a strong interconnection between mid-latitude storminess and low-latitude coastal impacts, highlighting the need to account for remote wave forcing in coastal risk assessments.
The Pacific Ocean has a well-documented history of long-range swell events impacting distant shores. In particular, the Pacific coasts of the Americas have experienced recently severe anomalous swell episodes triggered by remote storms. For example, an anomalous southwest swell event in May 2023 caused coastal flooding and the closure of dozens of ports in Peru (Infobae, 2023). A late-December 2024 swell event generated by a winter storm in the North Pacific impacted Peru's northern tourist beaches and small ports, underscoring the far-reaching effects of remote storm forcing (RPP Noticias, 2024). These events caught coastal communities by surprise, illustrating how storm activity in remote regions can translate into sudden coastal hazards even under fair local weather.
For this region, prior studies have noted that the most potent swell-generating storms often involve quasi-stationary or slow-moving frontal systems, which allow wind energy to accumulate. For instance, Alves (2006) identified mid-latitude cyclones as the chief source of long-period swells in the Pacific. Similarly, an analysis by Campos-Caba (2016) found that the largest swells impacting Chile and Peru were typically caused by distant storms with stalled or multi-day frontal activity over 3000 km offshore. These prolonged fetch conditions favour the production of exceptionally energetic swells.
Recent regional evidence for Peru further supports this remote-forcing framework: using ERA5 wave-power diagnostics off Paita, Callao, and Ilo, Jigena-Antelo et al. (2026) showed that Southern Ocean wind-stress anomalies at 50–60° S account for a substantial fraction of coastal wave-power variability, with lead times of several days.
Most “ordinary” swell events arise from midlatitude extratropical depressions following typical storm-track paths, whose sustained winds generate long-period waves that radiate far from the source (Alves, 2006; Semedo et al., 2011). By contrast, extreme swell episodes tend to coincide with more amplified synoptic states associated with deeper, longer-lived cyclones (Hell et al., 2021; Lodise et al., 2022). In this context, upper-tropospheric forcing is a plausible discriminator: the polar-front jet (and, secondarily, the subtropical jet) organizes and energizes midlatitude weather systems through jet-streak circulations and associated divergence aloft, thereby modulating surface cyclogenesis and intensity (Schultz et al., 1998; Bukenberger et al., 2025). A stronger and more zonally organized jet can enhance upper-level divergence and favour rapid deepening and persistence of extratropical cyclones – conditions that extend fetch and bolster swell generation (Bukenberger et al., 2025). Yet, despite these well-established dynamical links, the explicit connection between jet-stream variability and extreme coastal swell remains only sparsely addressed in the wave-climate literature (Hell et al., 2021).
Motivated by this gap and using ERA5 reanalysis, we investigate the atmospheric circulation associated with extreme swell events originating in both hemispheres that affect the Peruvian coast through a set of case studies, with particular emphasis on the dynamical characteristics of the jet stream. In addition, we use a flow-analogue framework to assess whether the surface winds associated with these circulation patterns have intensified or weakened under recent climate conditions.
2.1 Extreme Swell Events Dataset
We use the term extreme swell events as a generic label for anomalous swell episodes affecting the western coast of South America. These events were identified from Directorate of Hydrography and Navigation (DIHIDRONAV) reports issued between 2008 and 2025, which provide the warning type, operational intensity class, and the corresponding start and end dates (Table 1). In this study, “strong” and “very strong” refer specifically to DIHIDRONAV coastal-impact categories, whereas “extreme” is used more broadly for the selected anomalous events. Accordingly, the SH case studies analysed here were classified as “very strong”, whereas the NH cases were classified as “strong”.
Table 1Extreme-swell events (2008–2025) based on special warnings issued by the DIHIDRONAV.

Note: According to the DIHIDRONAV classification, a “very strong” swell implies wave heights exceeding three times their normal conditions, whereas a “strong” swell indicates wave heights between two and three times the normal wave heights. These labels are operational coastal-impact categories and are reported here as issued in the original warnings.
Five extreme swell episodes, classified as “very strong”, were identified along the Pacific coast of South America during the study period based on Peruvian Navy records (DIHIDRONAV, 2025). All occurred during austral winter months (May–September) and were associated with pronounced south-westerly swell directions originating in the South Pacific. We similarly detected a set of extreme swell events that originated in the North Pacific and propagated to the Peruvian coast over the past ∼ 17 years. In total, we identified six events emanating from the NH (primarily boreal winter occurrences) classified as “strong” swells. Because the DIHIDRONAV archive provides the only homogeneous operational classification available for the Peruvian coast, the selected events are treated here as a benchmark sample for 2008–2025 rather than as an exhaustive climatology of all historical extreme swells in the southeast Pacific. The timing of each event's peak swell at the coast was documented, and we analysed the atmospheric conditions in the days leading up to that peak.
To do this, we first estimated the travel time of swell from its source to the Peruvian coast using deep-water wave theory (Stewart, 2008). The group velocity of a swell packet is given by Eq. (1).
where g is gravitational acceleration (9.81 m s−2) and T the wave period. The propagation time is given by Eq. (2)
where X is the great-circle distance between the storm fetch and the coast. Representative fetch locations were identified event by event from ERA5 sea-level pressure and 10 m wind fields during the preconditioning days, selecting the oceanic sector where the pressure gradient was strongest and the most intense and persistent surface-wind vectors were oriented toward the Peruvian coast. The centroid of each selected fetch region was recorded for each event, and the arithmetic mean of those centroids was used to define a representative source point for SH events and another for NH events. The resulting event-specific fetch coordinates, hemispheric mean source points, coastal reference points, and derived great-circle distances are summarized in Tables S1 and S2 (Supplement). Great-circle distances between these representative source points and the reference coastal sector were then used in Eqs. (1)–(2) to estimate first-order travel times. Using representative swell periods of 16–20 s, consistent with long-period anomalous swells reported for the Peruvian coast (Tamayo Infantes, 2007), we obtained travel times of ∼ 72–90 h (3–3.7 d) for the SH and ∼ 192–260 h (8–11 d) for the NH. These intervals were therefore used to analyse the atmospheric circulation leading up to each swell event.
2.2 Synoptic composite analysis
For each hemisphere's set of events, we performed a composite analysis of the atmospheric fields to identify common patterns. We used daily reanalysis data from 1991 to 2025 from ERA5 (Hersbach et al., 2020) in order to obtain daily maps for a window of 3–4 d (8-11 d for NH) prior to each event's swell arrival at the coast (based on swell travel time estimates). For the main analysis, we retained the original SH and NH lead windows, but their robustness to plausible propagation-time uncertainties was assessed by recalculating the composites after perturbing the assumed swell period and representative source-to-coast distance, without changing the event selection.
These daily fields were averaged across events to compute composite anomalies of sea level pressure (SLP), geopotential height at 500 and 250 hPa, 10 m and 250 hPa winds. We also analysed the significant height of wind waves (SHWW) over the open-ocean source regions to diagnose locally forced wind-sea generation. For each variable, anomalies were defined relative to the 1991–2020 day-of-year climatology and composited across event days. Statistical significance was assessed with a two-sided Mann–Whitney U test (Mann and Whitney, 1947).
2.3 Multiparametric jet diagnostics
To further characterize and understand the jet stream configuration in both hemispheres during these events, a multiparametric analysis of the jet stream was performed. For this, daily zonal wind data at 250 hPa from ERA5 were used, and the methodology developed by Collazo et al. (2024) was applied in order to have a better representation of upper-level jet features. In fact, this approach overcomes the limitations of traditional analysis based solely on jet latitude and intensity by incorporating additional metrics describing its dynamic structure, such as tilt, sharpness, meridional displacement (departure), number of branches, and longitudinal extension. Although originally developed for the SH, the algorithm was adapted to the NH by accounting for hemispheric differences in jet structure and position. In particular, the latitudinal search criteria were inverted, since the polar-front jet (PFJ) lies north of the subtropical jet (STJ) in the NH, whereas the opposite configuration occurs in the SH. Furthermore, due to the stronger influence of land-sea contrasts and orography in the NH, the analysis was divided into western and eastern branches to capture the jet's zonal asymmetry in the North Pacific – a distinction not required for the specific central-western South Pacific region originally studied.
Daily values of all diagnostic parameters were subsequently calculated and grouped according to event type. Boxplots were then produced to analyse the distributions and relationships among the different parameters, differentiating the signal associated with extreme events from the climatological behaviour. A parameter was considered statistically significant only when both the two-sided Mann–Whitney U and Kolmogorov–Smirnov tests yielded p < 0.05, computed using the SciPy library (Virtanen et al., 2020).
Because the extreme-event sample is much smaller than the climatological sample, the boxplots are used here as descriptive summaries of the relative shift of the extreme-event sample. To assess the robustness of these contrasts, we complemented the original Mann–Whitney U and Kolmogorov–Smirnov tests with two additional sensitivity analyses: a balanced resampling of the climatological sample to match the size of the event-related sample, and an analogue-day framework that extends the event sample to dynamically related circulation states.
2.4 Analogue's analysis
To assess long-term changes in 10 m wind speed, we applied the analogue method (e.g., Cattiaux et al., 2010; Yiou et al., 2017). This approach searches for events dynamically similar to the observed one and quantifies changes in intensity by comparing distributions derived from analogues of two periods with different levels of anthropogenic forcing. Because atmospheric circulation is held fixed across analogues, differences in wind speed between periods cannot be attributed to changes in circulation itself. Global warming is a plausible contributor to such differences, alongside other factors such as internal decadal variability. Since the analogue method is applied independently to each of the selected case-study events, these results characterize only the specific events analysed here.
The analogue analysis is based on ERA5 data for 1950–2025. Flow analogues were identified by selecting days with similar SLP, Z500, and Z250 fields, using the mean standardized Euclidean distance to ensure equal weighting among variables (Barriopedro et al., 2025). For each event, the expected wind speed was reconstructed by randomly sampling one of the N best analogues within the [−L, L]-day window surrounding the corresponding calendar date. A sensitivity analysis performed for and , as well as for different analogue-search domains, showed no relevant changes in the results. Based on these reconstructed wind speeds, differences in median values between the past and a present period were then assessed for statistical significance using the Mann–Whitney U test (Mann and Whitney, 1947). Because the most recent event differs between hemispheres, the record was split accordingly: 1950–1986 (past) versus 1987–2024 (present) for SH events, and 1950–1987 (past) versus 1988–2025 (present) for NH events.
After identifying flow analogues, we examined the role of climate variability modes by extracting the monthly Southern Annular Mode (SAM) index for SH events and the Pacific Decadal Oscillation (PDO) index for NH events on the analogue dates following a methodology consistent with the ClimaMeter framework (Faranda et al., 2024). The SAM represents the leading mode of extratropical Southern Hemisphere variability and reflects latitudinal shifts in the westerly wind belt encircling Antarctica, with positive (negative) phases associated with stronger, poleward-shifted (weaker, equatorward-shifted) westerlies and corresponding changes in storm-track position and intensity (Fogt and Marshall, 2020). The SAM index was computed from monthly ERA5 SLP between 40 and 65° S following Marshall (2003). The PDO is a major mode of decadal variability in the North Pacific, marked by basin-wide SST anomalies and associated wind-stress changes. Its positive phase leads to an eastward extension and poleward displacement of the North Pacific jet stream, along with increased mid-latitude cyclonic activity (Wills et al., 2019). The PDO index was obtained from NOAA (https://www.ncei.noaa.gov/access/monitoring/pdo/accessed, last access: November 2025).
The study first examines events originating in the SH and subsequently those in the NH, allowing for a comparative assessment of their large-scale atmospheric drivers. For each hemisphere, the analysis begins with a synoptic characterization to establish the dynamical processes responsible for event development. Building on this, we then deepen the investigation by focusing on the specific configuration and role of the upper-level jet stream, a key driver of extreme weather patterns (e.g., Xu et al., 2024; García-Burgos et al., 2023; Collazo et al., 2024). Finally, to contextualize our findings within a broader climatological framework, we search for analogues of the previously described atmospheric circulation patterns in order to evaluate possible changes in event intensity over time. This progression, from synoptic overview to jet-stream diagnostics and flow-analogue assessment, provides a coherent framework to investigate both the physical mechanisms and temporal changes of the events.
3.1 Southern Hemisphere Extreme Swell Events
3.1.1 Synoptic Patterns
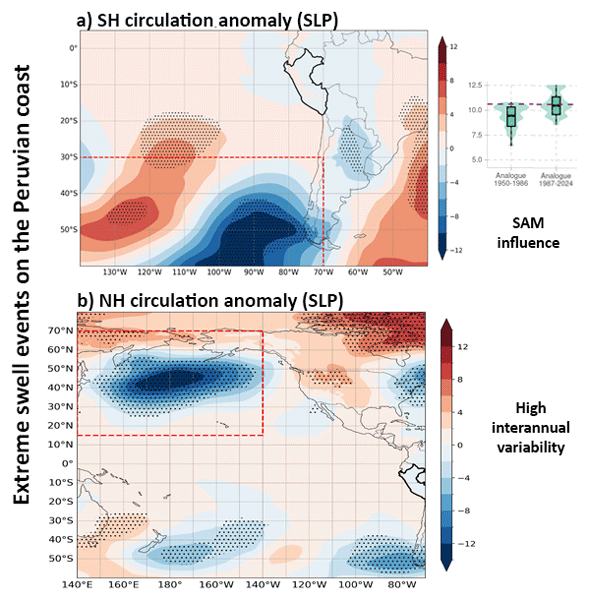
The composite fields for SH events E1–E5, averaged over days D−4 to D−3 relative to D0, reveal a well-organized barotropic disturbance over the southeast Pacific (Figs. 1a and S1). SLP exhibits a pronounced negative anomaly south of 40° S and between about 120–70° W, flanked by positive SLP anomalies to the southwest and southeast of the low (Fig. 1a). This tripolar structure reflects a deep extratropical cyclone embedded between broad anticyclonic anomalies on both sides of the basin. The resulting meridional pressure gradient is strongly enhanced along the northern and north-eastern flank of the low over the mid-latitude Pacific. The vertical coherence of this disturbance is evidenced by the close alignment of the SLP, Z500, and Z250 anomaly centres (Fig. S1, Supplement), which supports the interpretation of a mature, vertically coherent barotropic disturbance.

Figure 1Southern Hemisphere composite anomalies during extreme-swell events (E1–E5; MJJAS). Panels (a)–(b) show large-scale conditions over 140–40° W and 5° N–60° S: (a) sea-level pressure (SLP) anomaly (shading) and (b) 250 hPa wind-speed anomaly (shading) with wind-anomaly vectors. The red boxes in panels (a) and (b) indicate the regional domain analysed in panels (c) and (d) (150–70° W, 30–70° S): (c) 10 m wind-speed anomaly (shading) with wind-anomaly vectors and (d) significant height of wind waves (SHWW) anomaly (shading). Anomalies are computed relative to the 1991–2020 MJJAS climatology and averaged over days D−4 to D−3 relative to day D0. Statistical significance at p < 0.05 (two-sided Mann–Whitney U test) is indicated by stippling in panels (a) and (d), and by dashed contours enclosing the wind vectors in panels (b) and (c). The Peruvian coastline is outlined to indicate the impacted coastal sector.
At upper levels, the 250 hPa wind composite (Fig. 1b) exhibits an elongated band of enhanced winds relative to the climatology, between about 30–60° S and 130–90° W, broadly collocated with the surface pressure tri-pole and the 10 m wind maximum. The jet core follows a relatively straight southwest–northeast trajectory as it approaches South America.
The near-surface wind response at 10 m (Fig. 1c) is consistent with this pressure pattern. A wide corridor of positive wind-speed anomalies spans roughly 35–55° S, with vectors indicating intensified westerly to south-westerly flow over the central southeast Pacific. Within this corridor, the strongest anomalies are found between about 100–90° W, oriented along a southwest–northeast axis that points toward the Peruvian and Chilean coasts. On the equatorward side of the cyclone, the anomalous flow curves from westerly to north-westerly as it approaches South America, effectively lengthening the fetch over which the enhanced winds act on the ocean surface. Weaker or negative wind-speed anomalies to the north and south of this band delineate the core of the storm-track intensification associated with the extreme events.
The impact of this strengthened fetch on local wave generation is captured by the SHWW composites (Fig. 1d). Positive SHWW anomalies exceeding 1 m organize into a broad, zonally elongated swath between about 32–65° S and 150–85° W, broadly collocated with the 10 m wind-speed anomalies. Negative or near-zero anomalies to the north indicate that the subtropical wave field remains relatively unperturbed, highlighting the key role of this high-latitude belt as the primary open-ocean source of the extreme swells that reach the Peruvian coast a few days later.
These SH composite patterns remain stable under plausible perturbations of the assumed swell period and representative source-to-coast distance, indicating that the D−4 to D−3 window is not critically dependent on a single travel-time choice (Figs. S2–S5, Supplement).
3.1.2 Southern Jet Stream Characteristics
Having characterized the synoptic structure of the SH events, we next examine the associated upper-level circulation, focusing in particular on the austral wintertime PFJ over the Southeast Pacific. To quantify changes in the PFJ during extreme-swell events, we construct boxplots for several jet parameters, comparing their climatological distributions with those observed during the events. The PFJ exhibits noticeable differences between extreme-swell cases and the seasonal climatology (Fig. 2). PFJ intensity (Fig. 2a) shows a tendency toward higher values during E1–E5: event-day medians lie several m s−1 above the climatological median, and the interquartile range is substantially narrower. According to the summary statistics (Table S3, Supplement), both the Mann–Whitney and Kolmogorov–Smirnov tests indicate that this enhancement in PFJ strength is statistically significant (p < 0.05).

Figure 2Southern Hemisphere jet diagnostics during extreme-swell events E1–E5 (MJJAS). Boxplots of polar-front jet (PFJ) significant metrics for event days (red) versus austral winter climatology (blue) from ERA5 250 hPa winds: (a) PFJ intensity, (b) PFJ sharpness, (c) PFJ departure and (d) PFJ tilting. P-values from Mann–Whitney and Kolmogorov–Smirnov tests are shown above panels; robustness to unequal sample size is assessed in Table S4 and Fig. S6 (Supplement).
PFJ sharpness, a metric that quantifies how narrowly the jet core is confined latitudinally, also increases during extreme events (Fig. 2b). The distribution for event days is concentrated around larger meridional wind-speed gradients, with very little overlap with the climatological upper quartile. Physically, this indicates that the jet is not merely stronger but also exhibits a steeper gradient between its core and the surrounding flow when extreme swell develops.
Differences in jet orientation are captured by the departure and tilting metrics, which respectively describe the meridional coherence and inclination of the jet. Departure measures the spread of the latitudinal positions of the wind maxima along the jet axis and tilting, in contrast, quantifies the zonal inclination of the jet by evaluating the slope of a linear regression fitted to the tracked latitudes of the jet core (Barriopedro et al., 2023). PFJ departure shows lower values for E1–E5, with event-day boxes clustered near low departures while climatological values span a wide range, including numerous large outliers (Fig. 2c). This indicates that during extreme-swell events, the PFJ maintains a more compact and organized structure, with a single core of maximum winds. PFJ tilting exhibits a modest shift toward more positive values for extremes, implying a slightly more consistent southwest–northeast orientation of the jet as it crosses the South Pacific (Fig. 2d). However, this signal is weaker than for PFJ intensity, sharpness, and departure, and reaches statistical significance only in the Kolmogorov–Smirnov test (Table S3, Supplement).
Overall, these diagnostics indicate that SH extreme-swell events are associated with a PFJ that is stronger and sharper than the austral-winter climatology, with reduced meridional departure and a modest tendency toward positive tilt. The balanced-resampling sensitivity test confirms that the event-day contrasts in PFJ intensity, sharpness, and departure remain significant after accounting for the unequal sample size between event and climatological days (Table S4, Supplement). The analogue-day bootstrap analysis provides a complementary robustness check: PFJ intensity and sharpness remain the most stable signals, tilting is frequently retained, whereas departure becomes less robust under this stricter analogue-based framework (Fig. S6, Supplement). As previously identified in the boxplot analysis, we interpret a strengthened and sharpened PFJ, accompanied by a secondary tendency toward positive tilt, as the most robust SH jet-stream signature of these events.
3.1.3 Analogues Analysis
Records of extreme wave events span only a few years, to examine how the winds associated with these circulation patterns compare between past and present climate conditions, we rely on flow analogues. Figure 3 illustrates the results of applying this method to event E1, with similar patterns found for the other SH events. The wind speed at 10 m and the SLP of the event according to the ERA5 reanalysis are shown in Fig. 3a. As previously analysed, a strong pressure gradient is identified between an anticyclone and a cyclone in the South Pacific, resulting in intense surface winds with a considerable meridional component. By comparing analogue atmospheric circulation patterns between the past (1950–1986) and present (1987–2024) climates, we assess changes in the wind speeds associated with these events, quantified as the median difference between present and past analogue conditions. This difference is then removed from the observed event to construct a counterfactual reconstruction representing how the event may have occurred under past climate conditions. For E1, the counterfactual reconstruction yields weaker surface winds due to a lower pressure gradient (Fig. 3b). A more comprehensive comparison between the reconstruction of wind speed at 10 m in the region indicated in panels a and b is shown in Fig. 3c. Days with random atmospheric circulation show greater variability in wind intensity than days with flow analogues; however, the latter tend to have stronger winds (see the medians in the boxplots). Regarding the comparison between analogue flows in the past and present periods, there has been a significant increase in wind speed in recent decades, meaning that atmospheric circulation similar to that of the observed events is now associated with stronger winds in the South Pacific than in the past. This strengthening is also reflected in the significant wave height (SWH), which combines wind-sea and swell energy and shows significant increases for most SH-origin events, consistent with the enhanced wind forcing observed in the recent period (Fig. S7, Supplement).

Figure 3Analogue analysis for the E1 event. (a) Wind speed at 10 m (shaded) and SLP (contours) observed during E1 in the ERA5 reanalysis. Dashed contours indicate pressures below 1013 hPa. (b) Counterfactual reconstruction of 10 m winds (shading) and SLP (contours), obtained by removing the climate-change signal – defined as the median differences between present and past analogue flows – from the observed event. (c) Mean wind speed at 10 m over the box, indicated in panels (a) and (b), reconstructed from flow analogues (green) and random (orange) days of the past (1950–1986) and present (1987–2024) period. The dotted horizontal line indicates the intensity of the event observed in ERA5. The legend shows the difference in medians between the present and past periods for wind speed at 10 m for days with similar flow and its statistical significance according to the Mann-Whitney U test. (d) Monthly SAM associated with days with flow analogues for the past and present periods. The difference between medians for both periods and statistical significance is indicated in the legend.
Because the SAM is the dominant mode of climate variability in the extratropical SH (Fogt and Marshall, 2020), we also examine its role in shaping this event (Fig. 3d). The monthly SAM index associated with past and present flow analogues indicates a significant difference, with recent analogues predominantly associated with positive values of the index. A positive phase of the SAM strengthens and shifts the belt of SH westerly winds poleward, increasing windiness over the high latitude while weakening westerlies in many midlatitude regions. Consequently, positive SAM conditions are associated with stronger winds across the southern half of the study region (Fig. S8, Supplement), reinforcing the intensification already suggested by the analogue-based wind reconstructions. This relationship helps explain the differences between the observed event and its counterfactual. In the counterfactual reconstruction (Fig. 3b), winds are weaker over the southern portion of the domain compared with the observed event (Fig. 3a). This weakening is consistent with a shift toward less positive SAM conditions in the past analogue period. Positive SAM phases are therefore a likely contributor to the observed wind amplification, alongside other possible drivers of low-frequency variability in the region. Previous studies have shown that this positive SAM trend is largely driven by stratospheric ozone depletion and increasing greenhouse gas concentrations (Abram et al., 2014; Fogt and Marshall, 2020; King et al., 2023; Purich et al., 2026), providing a physical mechanism linking the observed wind intensification to anthropogenic forcing in the high-latitude South Pacific. All SH events examined here exhibit this SAM-related wind intensification, with the sole exception of E3, which shows no significant influence of this climate mode but may instead be more sensitive to the regional forcing of the Amundsen Sea Low (Figs. S9–S11, Supplement). Beyond changes in the SAM, SH extratropical cyclones have also shown a strengthening trend over the satellite period, and are projected to further intensify under continued anthropogenic forcing, with stronger wind speeds throughout the troposphere and an expansion of the area of extreme winds in both winter and summer seasons (Priestley and Catto, 2022).
3.2 Northern Hemisphere Extreme Swell Events
3.2.1 Synoptic Patterns
The composite fields for NH events E6–E11, averaged over days D−11 to D−8 prior to D0, show a large-scale, vertically coherent disturbance over the North Pacific (Fig. 4). SLP exhibits a deep negative anomaly centred near 30–40° N in the central–western basin. Positive SLP anomalies are weaker and more localized, occurring mainly over the north-eastern Pacific–North American/Arctic sector, with no coherent anticyclonic ridge elsewhere. Thus, in this case, the preconditioning atmospheric pattern is characterized by a single basin-scale deep low with comparatively modest surrounding highs (Fig. 4a). This configuration tightens the meridional pressure gradient along the southern flank of the low, favouring an enhanced belt of westerly to north-westerly flow across the midlatitude North Pacific.

Figure 4Northern Hemisphere composite anomalies during extreme-swell events (E6–E11; DJFM). Panels (a)–(b) show basin-scale anomalies over 140° E–70° W and 80° N–60° S, averaged over days D−11 to D−8 relative to day D0: (a) sea-level pressure (SLP) anomaly (shading) and (b) 250 hPa wind-speed anomaly (shading) with wind-anomaly vectors. Panels (c)–(d) show a zoomed view of the North Pacific swell-source region (140° E–140° W, 15–70° N): (c) 10 m wind-speed anomaly (shading) with wind-anomaly vectors and (d) significant height of wind waves (SHWW) anomaly (shading). Anomalies are computed relative to the 1991–2020 DJFM climatology. Statistical significance at p < 0.05 (two-sided Mann–Whitney U test) is indicated by stippling in panels (a) and (d), and by dashed contours enclosing the wind vectors in panels (b) and (c). The Peru outline is highlighted for reference.
The barotropic nature of this storm configuration is evidenced by the consistency among SLP, 500 hPa, and 250 hPa geopotential height anomalies (Fig. S12, Supplement). Negative height anomalies at Z500 and Z250 are nearly vertically aligned with the SLP minimum over the central–western North Pacific, and positive anomalies arch over the subpolar and continental sectors at all three levels. This three-level coherence – from the surface pressure field through the mid-troposphere to the upper-tropospheric flow – confirms that the storm complex associated with events E6–E11 is embedded within a vertically stacked, slowly evolving barotropic structure. In this configuration, the cyclone sustains enhanced W–NW low-level winds over a broad midlatitude sector.
Aloft, the 250 hPa wind-speed anomalies reveal a strongly intensified North Pacific jet, with a well-defined core between about 30 and 40° N that is significantly stronger than the seasonal climatology (Fig. 4b). The anomalous jet is oriented from west-southwest to east-northeast across the central basin, closely collocated with the surface cyclone. This upper-level enhancement indicates that the extreme-swell events occur when the midlatitude jet stream locally accelerates and becomes more zonally extended over the North Pacific, providing sustained upper-tropospheric support for the surface cyclone and reinforcing the low-level pressure gradients along its southern flank. Consistent with this large-scale pressure and upper-level jet configuration, the near-surface wind response strengthens over the North Pacific source region. The 10 m wind-speed anomaly composite displays a wide swath of positive anomalies between about 25 and 40° N, extending from roughly 145° E to 175° W (Fig. 4c). Within this band, wind speeds exceed the climatological mean, with the strongest and most coherent anomalies concentrated on the southern side of the cyclonic system where the pressure gradient is strongest. The vectors reveal a predominantly W–NW orientation, which sets up a long and relatively straight fetch directed toward the subtropical eastern Pacific. To the south and north of this corridor, weak or negative anomalies indicate that the anomalous momentum input is strongly focused within a narrow mid-latitude belt rather than spread across the whole basin.
In the NH, the large-scale SLP configuration remains broadly consistent across the sensitivity experiments, whereas the SHWW source pattern is more sensitive for the longest assumed periods, indicating that the adopted D−11 to D−8 window is appropriate for diagnosing synoptic preconditioning but should not be interpreted as a unique exact arrival time (Figs. S13–S16, Supplement).
The impact of this persistent wind forcing on the sea state is captured by the SHWW composite (Fig. 4d). A broad, statistically significant band of positive SHWW anomalies spans the open-ocean source region between about 27 and 45° N, overlapping and extending downstream of the 10 m wind-speed maximum. In the NH, wind and SHWW anomalies are more tightly co-located, consistent with a narrower, more geographically confined wind-forcing corridor over the North Pacific source region. This pattern indicates an unusually energetic wind-sea that has grown under sustained W–NW winds over several days. Negative or near-zero SHWW anomalies equatorward of ∼ 25° N, including around Hawaii, indicate little enhancement (and locally slight suppression) of wind-sea relative to DJFM climatology in the subtropical central Pacific. Given that the composite window is 8–11 d before coastal impact, these fields capture the stage when the local wind-sea is still being generated in the central basin while the resulting swell has already begun its long-range propagation toward South America.
3.2.2 Northern Jet Stream Characteristics
The multi-parametric description of the jets for the NH events, E6–E11, shows statistically robust differences emerge in both the STJ and the PFJ relative to the boreal winter climatology (Fig. 5).

Figure 5Northern Hemisphere jet diagnostics during extreme-swell events E6–E11 (DJFM). Boxplots of the statistically significant subtropical-jet (STJ) and polar-front-jet (PFJ) metrics derived from ERA5 250 hPa winds. (a) STJ sharpness, (b) STJ west-branch intensity, (c) zonal-mean STJ intensity, (d) STJ west-branch longitudinal extent, (e) STJ east-branch intensity, (f) STJ west-branch tilting, (g) PFJ west-branch intensity, (h) PFJ west-branch longitudinal extent, and (i) PFJ east-branch intensity. Event-day distributions (red) are contrasted with the seasonal climatology (blue); Mann–Whitney and Kolmogorov–Smirnov p-values are shown above each panel; robustness to unequal sample size is assessed in Table S4 and Fig. S17.
STJ diagnostics reveal a systematic strengthening and structural tightening of the upper-level flow during extreme-swell cases (Fig. 5a–f). STJ sharpness (Fig. 5a) is clearly larger for event days, with the red boxes shifted upward and a reduced interquartile range compared with the climatology. The maximum intensity of the western branch (Fig. 5b) and the zonal-mean STJ intensity (Fig. 5c) are likewise enhanced, while the eastern-branch intensity (Fig. 5e) also shifts toward higher values. The western branch extends over a longer longitude range on event days (Fig. 5d), and its tilting (Fig. 5f) exhibits more positive values, indicating a more coherent southwest–northeast tilt of the western branch, consistent with the WSW–ENE jet axis in Fig. 4b. Table S5 in the Supplement confirms that these changes in sharpness, intensity, extent, and tilting are all significant at p < 0.05 in at least one of the non-parametric tests.
PFJ metrics (Fig. 5g–i) show the opposite behaviour. West-branch PFJ intensity (Fig. 5g) is significantly weaker during E6–E11 than in the climatology, with lower medians and a narrower spread. The longitudinal extent of the western branch (Fig. 5h) is also reduced, indicating fewer cases with a long, continuous PFJ across the basin. East-branch PFJ intensity (Fig. 5i) tends to be lower for event days as well. As summarized in Table S6 (Supplement), these PFJ differences are statistically significant for both tests, highlighting that NH extreme swell co-occurs with a markedly intensified and more organized STJ together with a weaker, less extensive PFJ.
As in the Southern Hemisphere, the event-day and climatological distributions are not fully separated, but the NH cases show a coherent shift toward a stronger, sharper, and more zonally extended STJ, together with a weaker and less continuous PFJ. The balanced-resampling sensitivity test shows that these contrasts are not simply an artefact of the unequal sample sizes: STJ sharpness, zonal-mean intensity, west-branch intensity, west-branch longitudinal extent, east-branch intensity, and west-branch tilting all retain significance, while PFJ west-branch intensity, PFJ west-branch longitudinal extent, and PFJ east-branch intensity remain significantly reduced relative to climatology (Table S4, Supplement). The analogue-day bootstrap analysis reinforces the same hierarchy of robustness, with the most stable NH signals being the strengthening and longitudinal extension of the STJ and the weakening of the western PFJ branch (Fig. S17, Supplement). By contrast, east-branch intensity metrics and tilting are less stable and should be interpreted as secondary features. Thus, NH extreme-swell preconditioning is best characterized by a redistribution of upper-level momentum toward an intensified STJ and away from a weaker, less extensive PFJ.
3.2.3 Analogues Analysis
For NH events, the analogue-based analysis highlights notable differences between the three most recent events (E9–E11) and the three preceding ones (E6–E8). To illustrate the latter group, event E7 is shown in Fig. 6. This event is characterized by a very deep cyclone over the north-western Pacific and anticyclonic conditions over Japan, with the strongest winds exhibiting a northwest–southeast orientation within the subtropical belt (Fig. 6a). After removing the estimated difference between present and past analogue conditions, we find that the event would have been more intense under counterfactual conditions – i.e., with reduced anthropogenic influence on the climate (Fig. 6b). This behaviour is also evident in the boxplots of the flow analogues: the analogues for the past period exhibit a significantly higher median wind speed compared with those for the present (Fig. 6c). For both periods, however, analogue days generally show stronger winds than days selected under random circulation. Furthermore, the natural variability associated with the PDO does not contribute to explaining the differences between past and present analogues (Fig. 6d). Moreover, the associated SWH does not exhibit significant differences between periods (Fig. S18, Supplement). The weak SWH response to decreasing wind speeds is consistent with the nonlinear nature of the wind–wave relationship, in which wave heights respond more strongly to wind intensification than to equivalent wind reductions, particularly under already moderate-to-strong background wind conditions (Gao et al., 2023).

Figure 6Analogue analysis for the E7 event. (a) Wind speed at 10 m (shaded) and SLP (contours) observed during E7 in the ERA5 reanalysis. Dashed contours indicate pressures below 1013 hPa. (b) Counterfactual reconstruction of 10 m winds (shading) and SLP (contours), obtained by removing the climate-change signal – defined as the median differences between present and past analogue flows – from the observed event. (c) Mean wind speed at 10 m over the box, indicated in panels (a) and (b), reconstructed from flow analogues (green) and random (orange) days of the past (1950–1987) and present (1988–2025) period. The dotted horizontal line indicates the intensity of the event observed in ERA5. The box shows the difference in medians between the present and past periods for wind speed at 10 m for days with similar flow and its statistical significance according to the Mann-Whitney U test. (d) Monthly PDO associated with days with flow analogues for the past and present periods. The difference between medians for both periods and statistical significance is indicated in the box.
In contrast, the three most recent NH events exhibit an increase in wind speed. To examine this behaviour in greater detail, event E9 is presented in Fig. 7. This event was characterized by an intense surface cyclone situated in mid-latitudes over the North Pacific (Fig. 7a), which, under counterfactual conditions, would have been less intense (Fig. 7b). Boxplots of the analogue flows further highlight this significant increase in wind intensity during the present period (Fig. 7c). It is important to note that this increase is observed only under constrained circulation; wind speeds under random circulation remain essentially unchanged between the two periods. This strengthening under flow analogues days is also reflected in the SWH, which increases significantly for these events (Fig. S18, Supplement).

Figure 7Same as Fig. 6 for the E9 event.
For both E9 and E11, we find a significant contribution from the PDO, since flow analogues from the present period tend to occur more frequently under the negative phase of the PDO (Fig. 7d). However, this phase exerts an influence on surface wind speed that is opposite to that detected with the analogues, as it contributes to a slowdown in wind speed (Fig. S19, Supplement). This discrepancy indicates that PDO variability alone cannot explain the analogue-based period differences for these events; other drivers that may contribute to this signal are examined in the Discussion Section. The western North Pacific, at subtropical and mid-latitudes, is characterized by high interannual and decadal variability, with multiple interacting factors modulating atmospheric and oceanic circulation (Henley, 2017). This intrinsic variability underlies the IPCC's low confidence in attributing the observed changes in extratropical cyclones over the North Pacific to anthropogenic climate change (Seneviratne et al., 2021).
Extreme swell events along the Peruvian coast pose recurrent risks to coastal communities, infrastructure, and maritime activities. These events originate far offshore and exhibit strong seasonal variability in their source regions: during the austral winter they are primarily generated in the South Pacific, whereas in summer they typically develop in the western North Pacific. This study examines the atmospheric circulation patterns associated with extreme wave events reaching the Peruvian coast from both hemispheres, with particular emphasis on the structure and variability of the upper-level jet. In addition, it assesses whether the surface winds associated with these events have changed between past and present climate conditions, using an analogue-based framework, and explores the extent to which this may be linked to anthropogenic climate change. Differences between past and present analogue sets should not, by themselves, be interpreted as direct evidence of anthropogenic influence: they may also reflect internal climate variability or other external forcings, such as aerosols or sea-ice extent (Thompson et al., 2026).
In the SH, preconditioning typically resembles a tripolar pressure-anomaly pattern: a deep subpolar low is flanked by anticyclonic anomalies, yielding a tight meridional pressure gradient along the storm's equatorward flank. This configuration supports a broad, persistent belt of south-westerly surface winds over the south-eastern Pacific, favouring efficient wind–wave growth over a long open-ocean fetch. Consistent with our jet diagnostics, SH events co-occur with a stronger and sharper PFJ that is generally less meandering than the winter climatology, reinforcing the storm–jet coupling required to sustain these wind corridors and allowing some events to reach the “very strong” swell class at the Peruvian coast.
In the NH, the surface pattern is instead dominated by a deep central–western North Pacific low, while surrounding positive SLP anomalies are comparatively weaker, more displaced, and less spatially coherent than in the SH. Thus, unlike the SH composite, the NH pattern does not exhibit a well-defined basin-scale tripolar pressure-anomaly structure. Upper-level support also shifts: NH events are characterized by a marked intensification and zonal extension of the STJ, whereas the PFJ weakens and becomes less continuous. The resulting surface winds are typically westerly to north-westerly along the equatorward flank of the low and can still transmit swell energy toward Peru, but the longer propagation distance and the need to cross the equator favour greater attenuation and dispersion, consistent with NH events reaching at most the “strong” class in our sample.
Complementary ERA5 nearshore diagnostics for representative events support the hemispheric contrast inferred from the composites (Figs. S20–S21, Supplement). SH cases (E1 and E3; Fig. S20) show source-to-coast timing close to the expected 3–4 d window, whereas NH cases (E7 and E8; Fig. S21) exhibit a broader and less coherent coastal response, consistent with stronger dispersion and attenuation along the longer trans-equatorial propagation path. In the NH cases, coastal peak wave period (PWP) provides a sharper timing signal than significant height of total swell (SHTS) alone.
Beyond the synoptic similarities and contrasts described above, it is also crucial to explore how external forcings – particularly anthropogenic climate change – may influence the occurrence and intensity of these swell-generating configurations. We employed the flow-analogue method to identify past and present days with atmospheric circulations similar to those during extreme swell events. In line with established literature (Jézéquel et al., 2018; Thompson et al., 2026), this identification relied exclusively on dynamical fields. As a posteriori analysis, SST anomalies associated with analogue dates were examined by classifying the SST conditions into terciles. The period-based and SST-based analyses yield broadly consistent results across most events, providing mutual reinforcement: since warm SST anomalies have become more prevalent in the present period in line with the global warming trend, the two frameworks largely converge on the same signal (Figs. S22–S25, Supplement).
In this context, the influence of anthropogenic climate change appears to be more consistent among events originating in the SH than in the NH. Across all SH events, atmospheric circulations analogous to those observed are associated with stronger 10 m winds in the recent period, reflecting the increased prevalence of the positive SAM phase. Collectively, these results indicate that the recent intensification of SH wind patterns associated with these “very strong” events is consistent with the observed shift toward positive SAM phases, itself linked in the literature to anthropogenic forcing and stratospheric ozone depletion (Purich et al., 2026) – pointing to climate change as a plausible contributor to this signal, alongside internal climate variability.
To further elucidate the role of other climate modes influencing the South Pacific, we also examined changes in the predominant phases of the El Niño-Southern Oscillation (ENSO) associated with the flow analogue days between the past and present periods. In the austral winter, ENSO modulation over the region is quite weak due to a predominance of the neutral phase (Cai et al., 2021). A significant signal is observed only in events E3 and E4, where past-period analogues are more frequently associated with La Niña conditions, whereas in the present period, neutral and, in some cases, El Niño phases predominate (Fig. S26, Supplement). This shift corresponds to an intensification of winds in subtropical latitudes and a reduction in mid-latitudes (Fig. S27, Supplement), opposing the positive SAM signal. In contrast, the PDO shows no significant association with wind speed in the South Pacific, so the frequency of analogues under the different phases is not analysed.
To expand the sample size of events, “strong” swell events originating in the SH were also explored alongside the most extreme cases. For this subset (Table S7, Supplement), the atmospheric composite displays a circulation pattern similar to that of the “very strong” events, albeit characterized by a weaker pressure gradient (Fig. S28, Supplement). When examining flow analogues individually for each event, higher inter-event variability emerges, reflecting a greater influence of internal climate variability – resembling the behaviour observed in NH events. Nonetheless, a substantial proportion of these strong events still exhibit a present-day wind intensification alongside a shift toward a positive SAM phase, confirming that this dominant forcing persists across a broader set of events (Fig. S29, Supplement).
In contrast to the SH, the attribution of changes in surface circulation during flow-analogue events in the NH remains less straightforward, given that some events have intensified in recent decades whereas others have weakened. The increased occurrence of analogues associated with the negative phase of the PDO in the recent period for events E9 and E11 introduces additional ambiguity, since the influence of the PDO appears to oppose the circulation changes inferred from the analogues. To further elucidate these relationships, the effects of additional modes of internal variability in the North Pacific were examined (Table S8, Supplement).
The influence of ENSO on these events appears limited, with only E8 exhibiting a significant change in index values between periods. In the recent period, analogues for this event tend to occur predominantly during El Niño phases, which are associated with stronger winds over the western North Pacific (Table S8, Supplement). ENSO also serves as the primary driver of the Pacific–North American (PNA) pattern, a leading mode of low-frequency variability in the NH extratropics, particularly during boreal winter (Wang and Yang, 2023). Nevertheless, only the flow analogues of E11 exhibit modulation consistent with the PNA.
The Arctic Oscillation (AO), especially in its positive phase, modifies large-scale pressure gradients and induces changes in wind anomalies over the North Pacific during winter. Positive AO phases correspond to weaker winds mainly in January, over subtropical latitudes and along the Asian coast, which may have contributed to the wind intensity changes observed in the analogous circulations of events E6 and E7 (Table S8, Supplement). Another mode that exerts its influence on various events is the Western Pacific (WP) pattern. The WP is a primary mode of low-frequency variability over the North Pacific (Barnston and Livezey, 1987; Wallace and Gutzler, 1981). During winter and spring, the pattern features a north–south dipole of anomalies, with one centre over the Kamchatka Peninsula and a broad, oppositely signed centre spanning parts of south-eastern Asia and the western subtropical North Pacific (Ma and Zhang, 2018). Consequently, a strong positive phase of this pattern corresponds to intense winds in the mid-latitudes and weak winds in the subtropics. Therefore, the higher frequency of analogues under the positive phase of the WP in the present period is associated with changes in wind intensity that varies within the target region considered for the reconstruction of the analogues (Table S8, Supplement).
Finally, the Interdecadal Pacific Oscillation (IPO), a basin-wide counterpart of the PDO (Dong and Dai, 2015), exerts comparable influences on wind variability in the western North Pacific that closely mirrors the PDO-related signal. Its negative phase is associated with reduced wind speeds across the region, which is consistent with the changes recorded in events E6 and E8.
To better characterize this complexity, NH events were divided into two groups according to signs of the changes between the past and present period (E6–E8 and E9–E11) and analysed separately. Statistical analysis reveals that the two groups are governed by different configurations of large-scale climate variability, with E6–E8 associated with positive phases of PDO, ENSO, PNA, and IPO and a negative AO, while E9–E11 are dominated by the opposing phases of these modes (Fig. S30, Supplement). Regression analysis further indicates that large-scale modes account for a moderate fraction of wind variability in E6–E8 (∼ 22 %) but explain very little in E9–E11 (∼ 10 %), implying that local synoptic processes play an increasingly important role in the latter group. Taken together, these results suggest that the two groups of NH events are not responding to the same dynamical state of the North Pacific, and that the observed wind changes reflect evolving and competing influences rather than a single coherent forcing.
The analysis of internal variability and its contribution to the changes detected by the analogues does not reveal a dominant mode capable of explaining the reported patterns. This suggests the involvement of additional factors. Several reanalyses indicate that the observed weakening of surface winds in this sector of the Pacific Ocean is largely influenced by variations in aerosol concentrations (Deng et al., 2021). In addition, anomalous changes in Arctic Sea ice during the preceding summer and autumn have been shown to strongly modulate the variability of winter extratropical cyclones over the North Pacific (Chen and Sun, 2023). Finally, the pronounced northward displacement and intensification of midlatitude storm-track activity during boreal winters in the North Pacific since the early 1980s have been attributed to subtropical tropospheric warming. This warming enhances the meridional temperature gradient in midlatitudes, counteracting the opposing influence of Arctic warming, which tends to reduce near-surface temperature gradients and suppress storm-track activity (Hsu et al., 2025). These external forcings, however, are not explicitly analysed in this study, and further research would be required to determine their direct influence on the analogues.
While the observed extreme events are concentrated after 2010 due to data availability, the analogue search covers the full 1950–2025 period, effectively sampling both phases of long-term modes. This approach aligns with the ClimaMeter framework (Faranda et al., 2024), which successfully utilizes historical analogues from long reanalysis records to attribute single extreme events. Nevertheless, working with a small set of starting events means these configurations might not capture the full spectrum of natural variability. This warrants caution when interpreting the NH results, where wind and SWH signals are weaker and less consistent. Conversely, the SH signal is physically coherent across all events and is further supported by the statistically significant increases in SWH shown in the boxplot analysis (Fig. S7, Supplement).
Future work should extend the flow-analogue framework beyond the observational record by applying it to large ensembles of climate model simulations under historical and future forcing scenarios. Such an approach would enable a formal attribution of the circulation changes identified here by separating the dynamical and thermodynamical responses to different external forcings, thereby providing a more robust assessment of the role of anthropogenic climate change in modulating the atmospheric conditions that generate extreme swell events along the Peruvian coast.
We examined how extreme swell events affecting the Peruvian coast are preconditioned by large-scale atmospheric circulation in both hemispheres, with particular emphasis on the dynamical configuration of the upper-tropospheric jets and their coupling with barotropic storm systems. Using ERA5 reanalysis, a multiparametric jet diagnostic, and a flow-analogue framework, we contrasted Southern and Northern Hemisphere events to assess both the dynamical pathways leading to extreme swell and the imprint of recent climate change on the associated near-surface winds.
The main conclusions are:
-
In the case studies analysed here, extreme swell events in both hemispheres are preceded by a vertically coherent cyclone–jet configuration (from surface to 250 hPa). In the NH, preconditioning is dominated by a very deep North Pacific low, whereas in the SH it more often reflects a tripolar pattern that tightens the pressure gradient and sustains the wind corridor that projects swell energy toward Peru.
-
In the SH, extreme swell episodes co-occur with a PFJ that is stronger, sharper, generally with a modest positive tilting, and less meandering than the winter climatology. The jet core remains closer to its preferred latitude, and its modest southwest–northeast tilt contributes to focusing persistent south-westerly winds over the southeast Pacific, creating the primary swell-generating fetch for Peru.
-
In the NH, extreme swell events arise under a distinct jet configuration: the STJ intensifies, sharpens, and extends longitudinally, while the PFJ becomes weaker and less continuous. This redistribution of upper-level momentum favours deep barotropic cyclones over the central–western North Pacific and sustains a narrow belt of anomalously strong westerly to north-westerly winds that can still transmit swell energy across the equator to northern Peru.
-
Flow-analogue reconstructions indicate that surface winds during SH extreme-wave events have strengthened in recent decades, associated with enhanced synoptic pressure gradients. This intensification coincides with the recent trend toward more positive SAM phases – itself linked in the literature to ozone depletion and greenhouse-gas forcing – which favours stronger westerlies across the high-latitude South Pacific. This pattern is consistent across all SH events except E3, pointing to anthropogenic forcing as a plausible contributor to the SH signal, alongside internal climate variability.
-
For NH events, analogue-based reconstructions reveal no consistent climate-change signal: while some recent events (E9–E11) exhibit stronger winds, others (E6–E8) weaken under present-day conditions. However, these contrasts cannot be explained by a single mode of internal variability; neither the PDO, ENSO, PNA, AO, WP nor IPO accounts for the observed differences. This highlights that the high interannual and decadal variability characteristic of the North Pacific obscure attribution.
These conclusions should therefore be interpreted in the context of the homogeneous 2008–2025 benchmark sample used in this study, rather than as a complete characterization of all historical extreme swells affecting Peru. Extending the analysis farther back in time will require reconstruction and consistent reclassification of pre-2008 events in order to assess the robustness of these patterns under longer-term interdecadal variability.
Warnings of extreme swell in the Peruvian Coast were provided by the Directorate of Hydrography and Navigation (DIHIDRONAV) upon request. ERA5 reanalysis data are publicly available at https://cds.climate.copernicus.eu (last access: July 2026). The PDO index was obtained from NOAA (https://www.ncei.noaa.gov/access/monitoring/pdo/, last access: November 2025). The other climate indices used in this study are available from NOAA repositories at https://psl.noaa.gov/data/climateindices/ (last access: May 2026). The codes used in this study are available from the corresponding author upon reasonable request.
The supplement related to this article is available online at https://doi.org/10.5194/wcd-7-1779-2026-supplement.
GA contributed to conceptualization, formal analysis, investigation, software development, visualization, data curation, and writing of the original draft. SC contributed to conceptualization, formal analysis, software development, visualization, and writing of the original draft. RGH contributed to conceptualization, supervision, and writing – review and editing.
The contact author has declared that none of the authors has any competing interests.
Publisher's note: Copernicus Publications remains neutral with regard to jurisdictional claims made in the text, published maps, institutional affiliations, or any other geographical representation in this paper. The authors bear the ultimate responsibility for providing appropriate place names. Views expressed in the text are those of the authors and do not necessarily reflect the views of the publisher.
The authors thank the many individuals and institutions that made this work possible. In particular, we acknowledge the Directorate of Hydrography and Navigation (DIHIDRONAV) of the Peruvian Navy for providing detailed records of extreme swell events in the Southern Hemisphere, which guided this analysis. We also thank the European Centre for Medium-Range Weather Forecasts for producing the ERA5 reanalysis and making it freely accessible. We are grateful to the three anonymous reviewers for their constructive comments and suggestions, which helped improve the clarity, robustness, and overall quality of the manuscript.
This research has been supported by the MALONE project (PID2021-122252OB-I00), funded by MICIU/AEI/10.13039/501100011033 and by ERDF, EU. SC was also supported by the European Union's Horizon 2020 research and innovation programme under the Marie Skłodowska-Curie grant agreement no. 847635 (UNA4CAREER) through the SAFETE project (code 4230420), and by the European Commission's NextGenerationEU (Regulation EU 2020/2094) through CSIC's Interdisciplinary Thematic Platform Clima (PTI-Clima; Ref. CSC2304000).
The article processing charges for this open-access publication were covered in part by the CSIC Open Access Publication Support Initiative through its Unit of Information Resources for Research (URICI).
This paper was edited by Stephan Pfahl and reviewed by Vikki Thompson and two anonymous referees.
Abram, N., Mulvaney, R., Vimeux, F., Phipps, S. J., Turner, J., and England, M. H.: Evolution of the Southern Annular Mode during the past millennium, Nat. Clim. Change, 4, 564–569, https://doi.org/10.1038/nclimate2235, 2014
Alves, J. H. G. M.: Numerical modeling of ocean swell contributions to the global wind-wave climate, Ocean Model., 11, 98–122, https://doi.org/10.1016/j.ocemod.2004.11.007, 2006.
Ardhuin, F., Chapron, B., and Collard F.: Observation of swell dissipation across oceans, Geophys. Res. Lett., 36, L06607, https://doi.org/10.1029/2008GL037030, 2009.
Barber, N. F. and Ursell F.: The generation and propagation of ocean waves and swell. I. Wave periods and velocities, Philos. T. R. Soc. S. A, 240, 527–560, https://doi.org/10.1098/rsta.1948.0005, 1948.
Barnston, A. G. and Livezey, R. E.: Classification, seasonality and persistence of low-frequency atmospheric circulation patterns, Mon. Weather Rev., 115, 1083–1126, https://doi.org/10.1175/1520-0493(1987)115<1083:CSAPOL>2.0.CO;2, 1987.
Barriopedro, D., Ayarzagüena, B., García-Burgos, M., and García-Herrera, R.: A multi-parametric perspective of the North Atlantic eddy-driven jet, Clim. Dynam., 61, 375–397, https://doi.org/10.1007/s00382-022-06574-w, 2023.
Barriopedro, D., Jiménez-Esteve B., Collazo S., Garrido-Perez J. M., Johnson J. E., and García-Herrera. R.: A multi-method attribution analysis of the Spain's 2024 extreme precipitation event, Bull. Am. Meteorol. Soc., 106, E2440–E2460, https://doi.org/10.1175/BAMS-D-25-0049.1, 2025.
Boucharel, J., Santiago, L., Almar, R., and Kestenare, E.: Coastal wave extremes around the Pacific and their remote seasonal connection to climate modes, Climate, 9, 168, https://doi.org/10.3390/cli9120168, 2021.
Bukenberger, M., Fasnacht, L., Rüdisühli, S., and Schemm, S.: A climatological characterization of North Atlantic winter jet streaks and their extremes, Weather Clim. Dynam., 6, 279–316, https://doi.org/10.5194/wcd-6-279-2025, 2025.
Cai, W., Santoso, A., Collins, M., Dewitte, B., Karamperidou, C., Kug, J.-S., Lengaigne, M., McPhaden, M. J., Stuecker, M. F., Taschetto, A. S., Timmermann, A., Wu, L., Yeh, S.-W., Wang, G., Ng, B., Jia, F., Yang, Y., Ying, J., Zheng, X.-T., Bayr, T., Brown, J. R., Capotondi, A., Cobb, K. M., Gan, B., Geng, T., Ham, Y.-G., Jin, F.-F., Jo, H.-S., Li, X., Lin, X., McGregor, S., Park, J.-H., Stein, K., Yang, K., Zhang, L., and Zhong, W.: Changing El Niño–Southern Oscillation in a warming climate, Nat. Rev. Earth Environ., 2, 628–644, https://doi.org/10.1038/s43017-021-00199-z, 2021.
Campos-Caba, R. V.: Análisis de marejadas históricas y recientes en las costas de Chile, Memoria de Título para optar al Título de Ingeniero Civil Oceánico, Facultad de Ingeniería, Universidad de Valparaíso, Chile, 210 pp., https://oleaje.uv.cl/descargables/Memorias/Memoria%20UV%20Campos%20-%202016%20-%20An%C3%A1lisis%20de%20marejadas%20hist%C3%B3ricas%20y%20recientes%20en%20las%20costas%20de%20Chile.pdf (last access: 12 November 2025), 2016.
Cattiaux, J., Vautard, R., Cassou, C., You, P., Masson-Delmotte, V., and Codron, F.: Winter 2010 in Europe: A cold extreme in a warming climate, Geophys. Res. Lett., 37, 1–6, https://doi.org/10.1029/2010GL044613, 2010.
Chen, D. and Sun, Q.: Northern Pacific extratropical cyclone variability and its linkage with Arctic sea ice changes, Clim. Dynam., 61, 5875–5885, https://doi.org/10.1007/s00382-023-06889-2, 2023.
Collazo, S., García-Herrera, R., and Barriopedro, D.: Summer upper-level jets modulate the response of South American climate to ENSO, Clim. Dynam., 62, 1031–1054, https://doi.org/10.1007/s00382-023-06955-9, 2024.
Deng, K., Azorin-Molina, C., Minola, L., Zhang, G., and Chen, D.: Global near-surface wind speed changes over the last decades revealed by reanalyses and CMIP6 model simulations, J. Climate, 34, 2219–2234, https://doi.org/10.1175/JCLI-D-20-0310.1, 2021.
Directorate of Hydrography and Navigation (DIHIDRONAV): Avisos especiales, https://www.dhn.mil.pe/portal/avisos-especiales (last access: 12 November 2025), 2025.
Dong, B. and Dai, A.: The influence of the Interdecadal Pacific Oscillation on temperature and precipitation over the globe, Clim. Dynam., 45, 2667–2681, https://doi.org/10.1007/s00382-015-2500-x, 2015.
Faranda, D., Messori, G., Coppola, E., Alberti, T., Vrac, M., Pons, F., Yiou, P., Saint Lu, M., Hisi, A. N. S., Brockmann, P., Dafis, S., Mengaldo, G., and Vautard, R.: ClimaMeter: contextualizing extreme weather in a changing climate, Weather Clim. Dynam., 5, 959–983, https://doi.org/10.5194/wcd-5-959-2024, 2024.
Fogt, R. L. and Marshall, G. J.: The Southern Annular Mode: variability, trends, and climate impacts across the Southern Hemisphere, WIREs Clim. Change, 11, e652, https://doi.org/10.1002/wcc.652, 2020.
Gao, Y., Schmitt F. G., Hu, J., and Huang, Y.: Probability-based wind-wave relation, Front. Mar. Sci., 9, 1085340, https://doi.org/10.3389/fmars.2022.1085340, 2023.
García-Burgos, M., Ayarzagüena, B., Barriopedro, D., and García-Herrera, R.: Jet configurations leading to extreme winter temperatures over Europe, J. Geophys. Res.-Atmos., 128, e2023JD039304, https://doi.org/10.1029/2023JD039304, 2023.
Hell, M. C., Ayet, A., and Chapron, B.: Swell generation under extra-tropical storms, J. Geophys. Res.-Oceans, 126, e2021JC017637, https://doi.org/10.1029/2021JC017637, 2021.
Henley, B. J.: Pacific decadal climate variability: indices, patterns and tropical–extratropical interactions, Global Planet. Change, 155, 42–55, https://doi.org/10.1016/j.gloplacha.2017.06.004, 2017.
Hersbach, H., Bell, B., Berrisford, P., Hirahara, S., Horányi, A., Muñoz-Sabater, J., Nicolas, J., Peubey, C., Radu, R., Schepers, D., Simmons, A., Soci, C., Abdalla, S., Abellan, X., Balsamo, G., Bechtold, P., Biavati, G., Bidlot, J., Bonavita, M., De Chiara, G., Dahlgren, P., Dee, D., Diamantakis, M., Dragani, R., Flemming, J., Forbes, R., Fuentes, M., Geer, A., Haimberger, L., Healy, S., Hogan, R. J., Hólm, E., Janisková, M., Keeley, S., Laloyaux, P., Lopez, P., Lupu, C., Radnoti, G., de Rosnay, P., Rozum, I., Vamborg, F., Villaume, S., and Thépaut, J.-N.: The ERA5 global reanalysis, Q. J. Roy. Meteor. Soc., 146, 1999–2049, https://doi.org/10.1002/qj.3803, 2020.
Hsu, P.-C., Hsu, H.-H., Hong, H.-J., and Chen, Y.-T.: Subtropical warming enhances North Pacific midlatitude winter storm track activity in recent decades, npj Clim. Atmos. Sci., 8, 235, https://doi.org/10.1038/s41612-025-01108-7, 2025.
Infobae: Oleaje anómalo llegará a su punto pico este fin de semana en la costa peruana, advierte la Marina de Guerra, https://www.infobae.com/peru/2023/05/27/oleaje-anomalo-llegara-a-su-punto-pico-este-fin-de-semana/ (last access: 12 November 2025), 2023 (in Spanish).
Jézéquel, A., Yiou, P., and Radanovics, S.: Role of circulation in European heatwaves using flow analogues, Clim. Dynam., 50, 1145–1159, https://doi.org/10.1007/s00382-017-3667-0, 2018.
Jigena-Antelo, B., Alvarado-Espinoza, A., Adrianzén, R., Chauca-Hoyos, R., Estrada-Ludeña, C., Varea-Loayza, E., Molina, R., Contreras-de-Villar, A., Romero-Cózar, J., Contreras-de-Villar, F., and Muñoz-Perez, J. J.: Southern-latitude wind forcing as a predictor of swell energy and coastal wave power in Peru, Front. Mar. Sci., 13, 1779394, https://doi.org/10.3389/fmars.2026.1779394, 2026.
King, J., Anchukaitis, K. J., Allen, K., Vance, T., and Hessl, A.: Trends and variability in the Southern Annular Mode over the Common Era, Nat. Commun., 14, 2324, https://doi.org/10.1038/s41467-023-37643-1, 2023.
Lodise, J., Merrifield, S., Collins, C., Rogowski, P., Behrens, J., and Terrill, E.: Global climatology of extratropical cyclones from a new tracking approach and associated wave heights from satellite radar altimeter, J. Geophys. Res.-Oceans, 127, e2022JC018925, https://doi.org/10.1029/2022JC018925, 2022.
Ma, X. and Zhang, Y.: Interannual variability of the North Pacific winter storm track and its relationship with extratropical atmospheric circulation, Clim. Dynam., 51, 3685–3698, https://doi.org/10.1007/s00382-018-4104-8, 2018.
Mann, H. B. and Whitney, D. R.: On a test of whether one of two random variables is stochastically larger than the other, Ann. Math. Statist., 18, 50–60, https://doi.org/10.1214/aoms/1177730491, 1947.
Marshall, G. J.: Trends in the Southern Annular Mode from Observations and Reanalyses, J. Climate, 16, 4134–4143, https://doi.org/10.1175/1520-0442(2003)016<4134:TITSAM>2.0.CO;2, 2003.
Priestley, M. D. K. and Catto, J. L.: Future changes in the extratropical storm tracks and cyclone intensity, wind speed, and structure, Weather Clim. Dynam., 3, 337–360, https://doi.org/10.5194/wcd-3-337-2022, 2022.
Purich, A., Arblaster, J. M., Boschat, G., Gillett, Z. E., Hobbs, W., Jucker, M., Lim, E.-P., Udy, D., Abram, N., Campitelli, E., Doddridge, E., England, M. H., King, A., Menviel, L., Meyer, A., Ortiz Guzmán, V., Roy, R., Rudeva, I., Spence, P., Strutton, P. G., and Ziehn, T.: Southern Annular Mode dynamics, projections and impacts in a changing climate, Nat. Rev. Earth Environ., 7, 24–42, https://doi.org/10.1038/s43017-025-00746-y, 2026.
RPP Noticias: Fuerte oleaje golpea a caletas y desembarcaderos del litoral norte peruano, Radio Programas del Perú, https://rpp.pe/peru/actualidad/fuerte-oleaje-golpea-a-caletas-y-desembarcaderos-del-litoral-norte-peruano-video-noticia-1606850 (last access: 12 November 2025), 2024 (in Spanish).
Schultz, D. M., Keyser D., and Bosart L. F.: The effect of large-scale flow on low-level frontal structure and evolution in midlatitude cyclones, Mon. Weather Rev., 126, 1767–1791, https://doi.org/10.1175/1520-0493(1998)126<1767:TEOLSF>2.0.CO;2, 1998.
Semedo, A., Sušelj, K., Rutgersson, A., and Sterl, A.: A Global View on the Wind Sea and Swell Climate and Variability from ERA-40, J. Climate, 24, 1461–1479, https://doi.org/10.1175/2010JCLI3718.1, 2011.
Seneviratne, S. I., Zhang, X., Adnan, M., Badi, W., Dereczynski, C., Di Luca, A., Ghosh, S., Iskandar, I., Kossin, J., Lewis, S., Otto, F., Pinto, I., Satoh, M., Vicente-Serrano, S. M., Wehner, M., and Zhou, B.: Weather and climate extreme events in a changing climate, in: Climate Change 2021: The Physical Science Basis, Contribution of Working Group I to the Sixth Assessment Report of the Intergovernmental Panel on Climate Change, Cambridge University Press, Cambridge, United Kingdom and New York, NY, USA, 1513–1766, https://doi.org/10.1017/9781009157896.013, 2021.
Stewart, R. H.: Introduction to Physical Oceanography, Chapter 16: Ocean Waves, Open textbook, Texas A&M Univ., https://www.uv.es/hegigui/Kasper/por%20Robert%20H%20Stewart.pdf (last access: May 2026), 2008.
Tamayo Infantes, M.: Oleaje anómalo de fuerte intensidad en la bahía de Miraflores, Bitácora Hidrográfica, 3, 13–16, Dirección de Hidrografía y Navegación de la Marina de Guerra del Perú, Lima, Peru, https://www.dhn.mil.pe/Archivos/bitacora/edc_03.pdf (last access: 12 November 2025), 2007.
Thompson, V., Philip, S., Kew, S., Pinto, I., and Vautard, R.: Using analogue methods to identify trends in circulation patterns of midlatitude heatwaves, Weather and Climate Extremes, 52, 100898, https://doi.org/10.1016/j.wace.2026.100898, 2026.
Virtanen, P., Gommers R., Oliphant T. E., Haberland M., Reddy T., Cournapeau D., Burovski E., Peterson P., Weckesser W., Bright J., van der Walt, S. J., Brett, M., Wilson, J., Millman, K. J., Mayorov, N., Nelson, A. R. J., Jones, E., Kern, R., Larson, E., Carey, C. J., Polat, İ., Feng, Y., Moore, E. W., VanderPlas, J., Laxalde, D., Perktold, J., Cimrman, R., Henriksen, I., Quintero, E. A., Harris, C. R., Archibald, A. M., Ribeiro, A. H., Pedregosa, F., van Mulbregt, P., and SciPy 1.0 Contributors: SciPy 1.0: Fundamental algorithms for scientific computing in Python, Nat. Methods, 17, 261–272, https://doi.org/10.1038/s41592-019-0686-2, 2020.
Wallace, J. M. and Gutzler, D. S.: Teleconnections in the geopotential height field during the Northern Hemisphere winter, Mon. Weather Rev., 109, 784–812, https://doi.org/10.1175/1520-0493(1981)109<0784:TITGHF>2.0.CO;2, 1981.
Wang, X. and Yang, X.-Q.: Amplified asymmetric impact of ENSO events on the wintertime Pacific–North American teleconnection pattern, Geophys. Res. Lett., 50, e2022GL100996, https://doi.org/10.1029/2022GL100996, 2023.
Wills, R. C. J., Battisti, D. S., Proistosescu, C., Thompson, L., Hartmann, D. L., and Armour, K.: Ocean circulation signatures of North Pacific decadal variability, Geophys. Res. Lett., 46, 1690–1701, https://doi.org/10.1029/2018GL080716, 2019.
Xu, G., Broadman, E., Dorado-Liñán, I., Klippel, L., Meko, M., Büntgen, U., De Mil, T., Esper, J., Gunnarson, B., Hartl, C., Krusic, P. J., Linderholm, H. W., Ljungqvist, F. C., Ludlow, F., Panayotov, M., Seim, A., Wilson, R., Zamora-Reyes, D., and Trouet, V.: Jet stream controls on European climate and agriculture since 1300 CE, Nature, 634, 600–608, https://doi.org/10.1038/s41586-024-07985-x, 2024.
Yiou, P., Jézéquel, A., Naveau, P., Otto, F. E. L., Vautard, R., and Vrac, M.: A statistical framework for conditional extreme event attribution, Adv. Stat. Clim. Meteorol. Oceanogr., 3, 17–31, https://doi.org/10.5194/ascmo-3-17-2017, 2017.