
the Creative Commons Attribution 4.0 License.
the Creative Commons Attribution 4.0 License.
 | 16 Sep 2026
Extratropical teleconnections in a multi-model ensemble nudged towards the observed QBO
Martin B. Andrews

Neal Butchart
James A. Anstey
Ewa Bednarz
Dillon Elsbury
Jorge L. García-Franco
Vinay Kumar
Froila M. Palmeiro
Natasha E. Trencham
Kohei Yoshida
Zhaoyang Chai
Dong-Chan Hong
Kai Huang
Aleena M. Jaison
Yoshio Kawatani
Jeff R. Knight
Pu Lin
François Lott
Yixiong Lu
Hiroaki Naoe
Scott M. Osprey
Jadwiga H. Richter
Federico Serva
Seok-Woo Son
Shingo Watanabe
Jinbo Xie
The Quasi-Biennial Oscillation (QBO), the dominant mode of interannual variability of monthly-mean zonal winds and temperatures in the equatorial stratosphere, has a significant influence on the circulation in other regions of the stratosphere and troposphere in boreal winter. To better understand these teleconnections, results from twelve models are analysed for three complementary experiments in which the QBO is either internally generated by the models (free-running), nudged towards the observed QBO, or nudged towards the observed climatology. For the multi-model ensemble mean we assess how well the free-running experiment captures the observed teleconnections, and whether the simulated teleconnections improve when the models are nudged to have a more realistic QBO.
The observed relationship between the QBO phase and the strength of the boreal winter Polar Night Jet (PNJ) is weakly captured by the free-running experiment. The PNJ response is larger when the models are nudged towards the observed QBO, primarily because nudging reduces the bias in the QBO amplitude, resulting in a larger proportion of the models exhibiting a stronger QBO-PNJ relationship. Both free-running and nudged-QBO experiments capture a small and marginally significant increase in Sudden Stratospheric Warming (SSW) frequency during the QBO-easterly phase relative to the QBO-westerly phase. Neither experiment captures the observed QBO influence on the timings of SSWs during winter nor the QBO teleconnection to the North Atlantic Oscillation. Nudging the QBO does, however, improve its influence on the latitudinal profile of the North Pacific sub-tropical jet and strength of tropical precipitation.
We find that a more realistic representation of the QBO is beneficial for certain teleconnections, but their effective simulation likely depends on how well the underlying model processes respond to the QBO.
- Article
(4028 KB) - Full-text XML
- BibTeX
- EndNote


The works published in this journal are distributed under the Creative Commons Attribution 4.0 License. This license does not affect the Crown copyright work, which is re-usable under the Open Government Licence (OGL). The Creative Commons Attribution 4.0 License and the OGL are interoperable and do not conflict with, reduce or limit each other.
© Crown copyright 2026
The Quasi-Biennial Oscillation (QBO) is the dominant mode of interannual variability of zonal-mean monthly-mean winds and temperatures in the equatorial stratosphere (Baldwin et al., 2001). Mean zonal winds alternate between westerly and easterly phases which descend from around the stratopause to below 70 hPa, at approximately 1 km per month, with periods ranging from 20 to 36 months and averaging ∼ 28 months. The zonal-wind QBO has a latitudinal width extending from approximately 15° S to 15° N. First discovered by Reed et al. (1961) and Veryard and Ebdon (1961) this quasi-biennial phenomenon results from vertically propagating waves depositing momentum in the regions where the zonal mean winds change sign in the vertical thereby driving the observed descent (e.g. Lindzen and Holton, 1968; Holton and Lindzen, 1972; Andrews et al., 1987; Dunkerton, 1997; Kawatani et al., 2010). What is less well understood, and poorly represented in many global climate models, is how the QBO influences the stratosphere and troposphere away from the equatorial regions via extratropical teleconnections (e.g. Ebdon, 1975; Holton and Tan, 1980, 1982; Baldwin et al., 2001; Gray et al., 2018; Rao et al., 2020; Yamazaki et al., 2020; Anstey et al., 2022b; Kumar et al., 2024).
Studies of how the equatorial QBO influences other parts of the atmosphere tend to focus on the strength of the Northern Hemisphere (NH) stratospheric Polar Night Jet (PNJ) during boreal winter, typically represented by the magnitude of the zonal-mean zonal wind around 60° N, 10 hPa. The teleconnection between the phase of the QBO zonal-mean zonal winds when measured at 50 hPa, either westerly (QBOW) or easterly (QBOE), and the strength of the PNJ was first assessed by Holton and Tan (1980, 1982). They found that the PNJ is weaker during winters with QBOE and stronger during QBOW, suggesting a causal link between the equatorial QBO and the strength of the NH polar vortex. The leading proposed mechanism for this teleconnection relates to the QBO's influence on the latitudinal position of the zonal-mean zonal wind zero-wind line in the stratosphere (Holton and Tan, 1980). Under QBOE conditions the zero-wind line at the edge the tropical QBO is located further poleward (Butchart and Anstey, 2026) and the waves are more likely to be constrained within the polar vortex region. This increases the probability that easterly momentum will be deposited into the high-latitude stratosphere decelerating the PNJ. For QBOW the upward wave fluxes are less latitudinally constrained and less concentrated in the region of the PNJ allowing a stronger PNJ to develop. This teleconnection is generally referred to as the stratospheric polar route (Gray et al., 2018) or the Holton–Tan Effect (HTE).
There is gathering evidence that the position of the zero-wind line may not be the only mechanism contributing to the QBO-PNJ teleconnection. The equatorial zonal temperature anomalies and vertical wind shear zones (Baldwin et al., 2001) induced by the alternating phases of the QBO stimulate, through thermal wind balance, a residual tropical meridional circulation (Plumb and Bell, 1982; Garfinkel et al., 2012). This alters the distribution of zonal-mean zonal winds in the subtropics and consequently the wave refractive index (Lu et al., 2014) such that during QBOE the planetary waves are more likely to be confined to polar latitudes causing the PNJ to decelerate through wave momentum deposition (Garfinkel et al., 2012; Lu et al., 2014, 2020; Rao et al., 2021; Karami et al., 2023).
This observed relationship between the QBO and the strength of the boreal winter PNJ has an influence on the likelihood and timing of Sudden Stratospheric Warmings (SSWs; Labitzke, 1982; Anstey et al., 2022b; Elsbury et al., 2024). SSWs represent the rapid reversal of the westerly winter PNJ towards easterly when the polar vortex is either displaced from the pole or split into two vortices (Scherhag, 1952; Charlton and Polvani, 2007). Over recent decades (1958–2019) the frequency of occurrence for SSWs is ∼ 0.9 for QBOE winters compared to ∼ 0.5 for QBOW winters (Baldwin et al., 2021) when measured at 60° N, 10 hPa. SSWs also occur, on average, earlier during QBOE winters than during QBOW winters (Gray et al., 2004). The timing of stratospheric final warmings (SFW) has also been linked to the phase of the QBO (Thiéblemont et al., 2019). Winters without SSWs tend to have earlier SFWs (Hu et al., 2014), hence QBOW winters are more likely to have earlier SFWs (Thiéblemont et al., 2019).
A teleconnection between the QBO and the large-scale lower tropospheric pressure pattern of the North Atlantic Oscillation (NAO; Hurrell et al., 2003) in boreal winter is of interest due to the NAO's influence on winter-time weather patterns across Europe (Thompson and Wallace, 2001). If the teleconnection is robust, improved model representation of the slowly varying QBO and its teleconnections might improve NAO predictability (e.g. Boer and Hamilton, 2008; Scaife et al., 2014; O'Reilly et al., 2019; Wan et al., 2025). The most likely route for the QBO-NAO teleconnection is via the modulation of the strength of the PNJ which exerts a downward influence on the underlying tropospheric circulation (Kidston et al., 2015). For example, following an SSW zonal-mean wind anomalies descend over the course of a few days towards the tropopause and occasionally into the troposphere and influence the tropospheric background flows (Baldwin and Dunkerton, 2001). These changes can increase the likelihood of blocking weather patterns over the North Atlantic and Northern Eurasia typically resulting in anomalously cold surface conditions (Baldwin and Dunkerton, 2001).
The QBO is also believed to influence the latitudinal position and strength of the North Pacific tropospheric Sub-Tropical Jet (STJ; Garfinkel and Hartmann, 2011a) in October–November and February–March via the residual mean meridional circulation on either side of the equator associated with the QBO. In the lower stratosphere the zonal wind component associated with the meridional circulation arcs down to the subtropical troposphere where it can interact with the STJ. However, recent studies suggest that this downward-arching pathway may not be the only route through which the QBO influences the Pacific STJ. QBO-related tropical precipitation anomalies have been diagnosed over the tropical Pacific, often with a west–east gradient (García-Franco et al., 2022), and these anomalies are associated with upper-tropospheric divergent circulation anomalies that may project onto the West Pacific STJ (Andrews et al., 2024; Kumar et al., 2022). In this hypothesis, the precipitation anomalies matter because they reflect QBO-related changes in moist convection and latent heating, whose divergent outflow and associated wave response can provide a tropospheric bridge between tropical QBO impacts and STJ variability. Overall, the observed response of the STJ over the Pacific sector (130–240° E) for QBOE minus QBOW (QBOE-W) conditions from October–March is a weakening around 30° N and a strengthening around 50° N, suggesting a slight northward shift of the STJ (Anstey et al., 2022b; Park et al., 2022).
Of course, the teleconnections between the QBO and the strength of the PNJ, frequency and timing of SSWs, phase of the NAO, and strength of the North Pacific circulation coexist with the influence of El Niño–Southern Oscillation (ENSO; Trenberth, 1997; Domeisen et al., 2019) teleconnections on monthly-to-seasonal timescales, and certain phases of the Madden–Julian Oscillation (MJO; Madden and Julian, 1994; Cassou, 2008; Garfinkel et al., 2012; Lee et al., 2019) on sub-monthly timescales. This superposition of non-QBO influences together with a relatively small sample size of observed QBOs adds complexity to the analysis of teleconnections in observational studies (e.g. Gray et al., 2018; Kumar et al., 2022, 2024).
The Atmospheric Processes And their Role in Climate (APARC, formerly SPARC) QBO initiative (QBOi; Anstey et al., 2022a) has previously investigated the fidelity of the QBO in a set of coordinated experiments (Butchart et al., 2018) using a set of Atmospheric General Circulation Models (AGCMs). This is referred to as QBOi phase 1. Various aspects of the modelled QBO and its influence were investigated, including an evaluation of the fidelity of the QBO (Bushell et al., 2022), the waveforcing of the QBO (Holt et al., 2022), the predictability of the QBO in forecast experiments (Stockdale et al., 2022), the impact of the QBO on the tropical tropopause (Serva et al., 2022), the response of the QBO to a warming climate (Richter et al., 2022), the interaction of the QBO and perpetual ENSO (Kawatani et al., 2025; Naoe et al., 2025), and the influence of perpetual ENSO and the QBO on the MJO (Elsbury et al., 2026).
Of relevance to this study Anstey et al. (2022b) investigated the ability of the models to capture various extratropical teleconnections. Two sets of model experiments which differ only in the prescribed Sea-Surface Temperature (SST) and sea ice (SI) conditions were run to assess the response of the extratropical teleconnections to the free-running internally generated model QBOs. The first experiment included historically-varying SSTs and SI surface boundary conditions, whereas the second used climatological SSTs and SI. Anstey et al. (2022b) found that the correlation between the phase of the QBO at 50 hPa and the sign of the PNJ in the ensemble mean is generally consistent with observations, however, the magnitude of the response is relatively weak. This could be attributable to systematically weak amplitudes of the free-running model QBOs in the lower stratosphere (Bushell et al., 2022). It was suggested that if the strength of the model QBOs could be improved, the strength of teleconnections might also be improved.
Following on from the QBOi phase 1 experiments, a new set of QBOi phase 2 experiments were formulated to address the question of how models respond to a realistic QBO in the lower-to-middle equatorial stratosphere (Anstey et al., 2026b). including an experiment in which the QBO in lower-to-middle stratospheric winds are nudged (relaxed) toward reanalysis data, i.e., the zonal-mean zonal wind of the QBO is bias-corrected. The teleconnections linked to the QBO can, therefore, be assessed equitably across all models. In another experiment the QBO is suppressed by relaxing the zonal-mean zonal winds in the lower-to-middle equatorial stratosphere towards the climatology of the observed stratosphere resulting in the absence of a QBO. By neutralising the QBO the influence of external forcings such as the SST/SI boundary conditions can potentially be separated from that of the QBO.
Section 2 provides an overview of the experimental design and setup for QBOi phase 2 and the relaxation scheme used. Subsequent sections address the question of how each QBO teleconnection is impacted by QBO zonal-mean zonal wind biases when assessed against reanalysis, with the focus on the multi-model ensemble response. Model dependencies are left for follow-up studies. Section 3 assesses the QBO-PNJ relationship, Sect. 4 analyses the QBO-SSW relationship, Sect. 5 looks at the QBO-NAO relationship, and Sect. 6 considers the QBO-North Pacific STJ and precipitation relationship. Concluding remarks are given in Sect. 7.
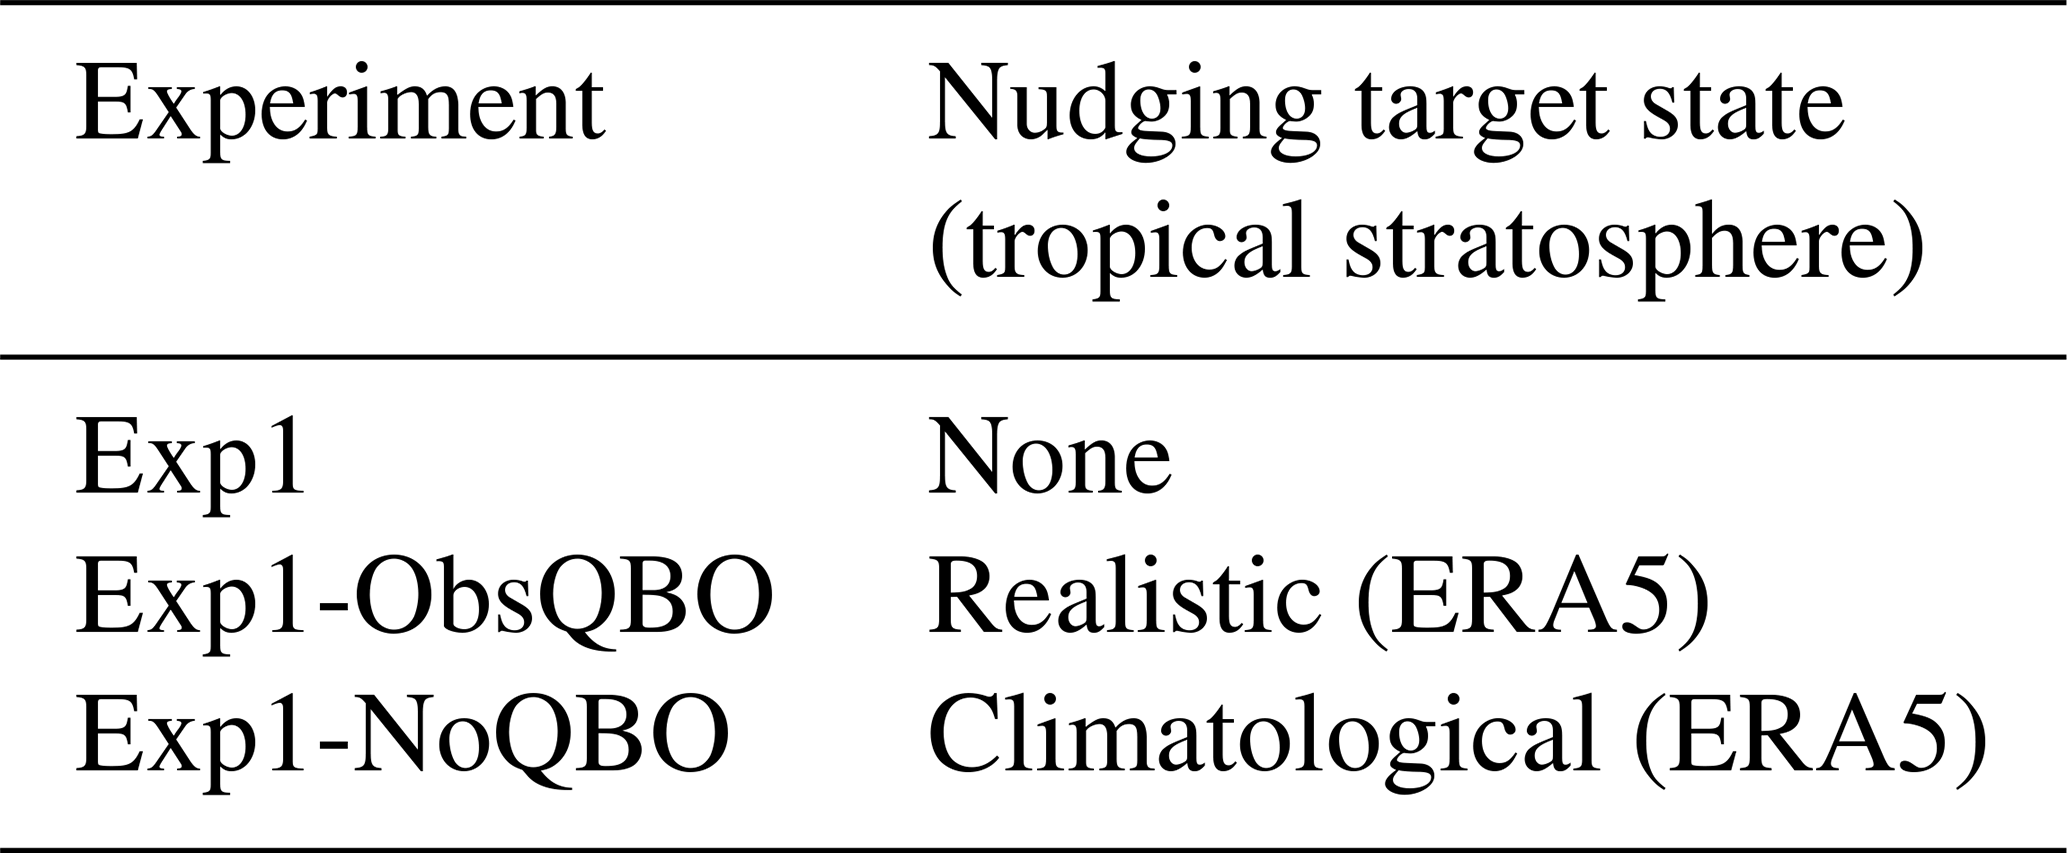
Full details of the three experiments and models used in this study can be found in Anstey et al. (2026b). Briefly the first experiment, Exp1, is based on experiment 3.3 from the fifth phase of the Coupled Model Intercomparison Project (CMIP5), also known as the “Atmospheric Model Intercomparison Project (AMIP)” experiment (Taylor et al., 2012). For QBOi phase-2, however, the prescribed observed monthly varying sea surface temperatures (SSTs) and sea ice (SI) concentrations, and other external forcings were updated and extended to cover the longer period 1 January 1979 to 31 December 2020 (Anstey et al., 2026b). The historically-evolving ozone concentrations defined by CMIP are known to have an imprint of the observed QBO (Butchart et al., 2023; Garfinkel et al., 2025) which can influence the evolution of the QBO in the models hence for the QBOi phase-2 experiments an annually-repeating monthly climatological ozone is adopted (see Anstey et al., 2026b). Two further experiments, Exp1-ObsQBO and Exp1-NoQBO, are based on Exp1 except that the zonal-mean zonal wind in the tropical lower-to-middle stratosphere is nudged (see Fig. 1 for the nudging profile) toward ERA5 reanalysis data produced by the European Centre for Medium-Range Weather Forecasts (Hersbach et al., 2020) and the ERA5 climatological annual cycle, respectively.
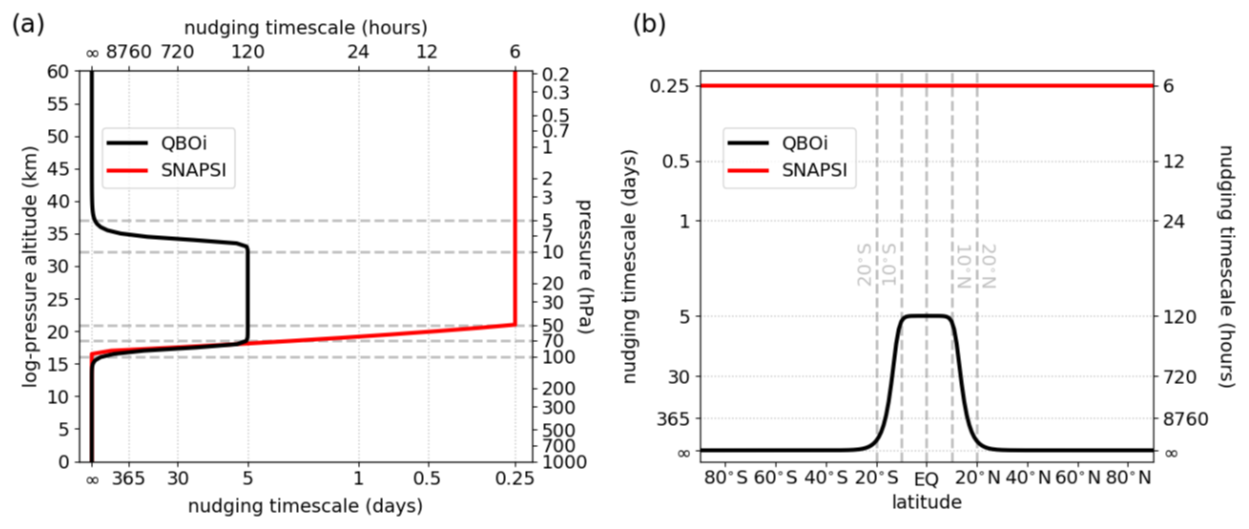
Figure 1Spatial dependence of nudging timescale in (a) the vertical and (b) meridional directions for the QBOi phase-2 nudging experiments Exp1-ObsQBO and Exp1-NoQBO (black curves). The mathematical expressions corresponding to the QBOi profiles shown in panels (a) and (b) are detailed in Anstey et al. (2026b). Vertical and meridional profiles of nudging timescale from the SNAPSI protocol (Hitchcock et al., 2022) are shown in red for comparison with the QBOi profiles (see Anstey et al., 2026b, Appendix A for further details of the QBOi-SNAPSI comparison).
The three experiments, therefore, differ in terms of how the equatorial stratosphere evolves (Table 1). The nudging methodology is the same as used for the SNAPSI (Stratospheric Nudging And Predictable Surface Impacts; Hitchcock et al., 2022) apart from the different profile (cf., black and red curves in Fig. 1). Nudging is generally limited to the zonal-mean component of the zonal wind to allow waves in the tropical stratosphere to evolve freely, but full-field nudging is adopted by some models (see Anstey et al., 2026b, Table 2).
Table 1Summary of QBOi phase-2 nudging experiments (see Anstey et al., 2026b).
The region of the equatorial stratosphere nudged towards ERA5 (Fig. 1a, b) encompasses 80–8 hPa, 12° S–12° N, with a nudging timescale of 5 d. Outside of this core region the nudging timescale tails off to infinity so that no nudging occurs below 100 hPa, above 5 hPa, and polewards of 20° S and 20° N.
The twelve models from eleven different modelling centres that contributed to the multi-model ensemble (MME) analysis in this paper are: BCC-CSM2-MR, CAS-ESM, CESM2, EC-Earth3, E3SMv2, ESM4, GRIMs-4.0, LMDz, MIROC6.1p1, MIROC6.1p2, HadGEM3GA7.1, and MRI-ESM2.0. The models are described in Anstey et al. (2026b) which confirms that most models are able to reproduce QBO-like variability in the equatorial stratosphere, but with a rather large model spread in the rendition of the simulated QBOs in Exp1. Anstey et al. (2026b) also shows that, with nudging, all the models reproduce well the observed QBO in Exp1-ObsQBO, while in Exp1-NoQBO the nudging removes both the inter-annual variability and biases in the climatological mean from the simulated equatorial zonal-mean zonal winds. For the extra-tropical stratosphere, Anstey et al. (2026b) show that, however imposed, the equatorial nudging does not significantly impact the climatology of each model's monthly and zonal-mean zonal winds, nor does it significantly change the interannual standard deviation of these quantities in the models.
The strongest correlation between the PNJ, defined as the zonal-mean zonal wind at 60° N, 10 hPa, and the equatorial zonal-mean zonal winds occurs around 50 hPa for ERA5 during December and January (Fig. 2a). This result is mirrored by the Exp1-ObsQBO MME-mean experiment (Fig. 2b) though the positive correlation with the 50 hPa zonal-mean zonal wind now extends through to March. We therefore define the QBO index as the equatorial zonal-mean zonal wind at 50 hPa, averaged from 5° S to 5° N. This is consistent with previous QBO teleconnection studies, including Holton and Tan (1980, 1982) and the QBOi phase 1 analysis (Anstey et al., 2022b). Thresholds for easterly and westerly QBO phases are defined as ±0.5 standard deviation (σ) of the QBO index, i.e. QBO-easterly occurs when the zonal-mean zonal wind is less than −0.5σ of the climatological monthly zonal-mean zonal wind and for QBO-westerly is greater than +0.5σ. This produces thresholds for observations, and Exp1-ObsQBO, that are broadly similar to the ±5 m s−1 thresholds used in previous studies. For Exp1, the ±0.5σ threshold accounts for the varying strengths of the QBOs in each model, so that the proportion of QBOE and QBOW years is approximately the same for each model and is consistent with observations. The winter period over which the QBO index is calculated varies depending on the teleconnection and is defined within each section.
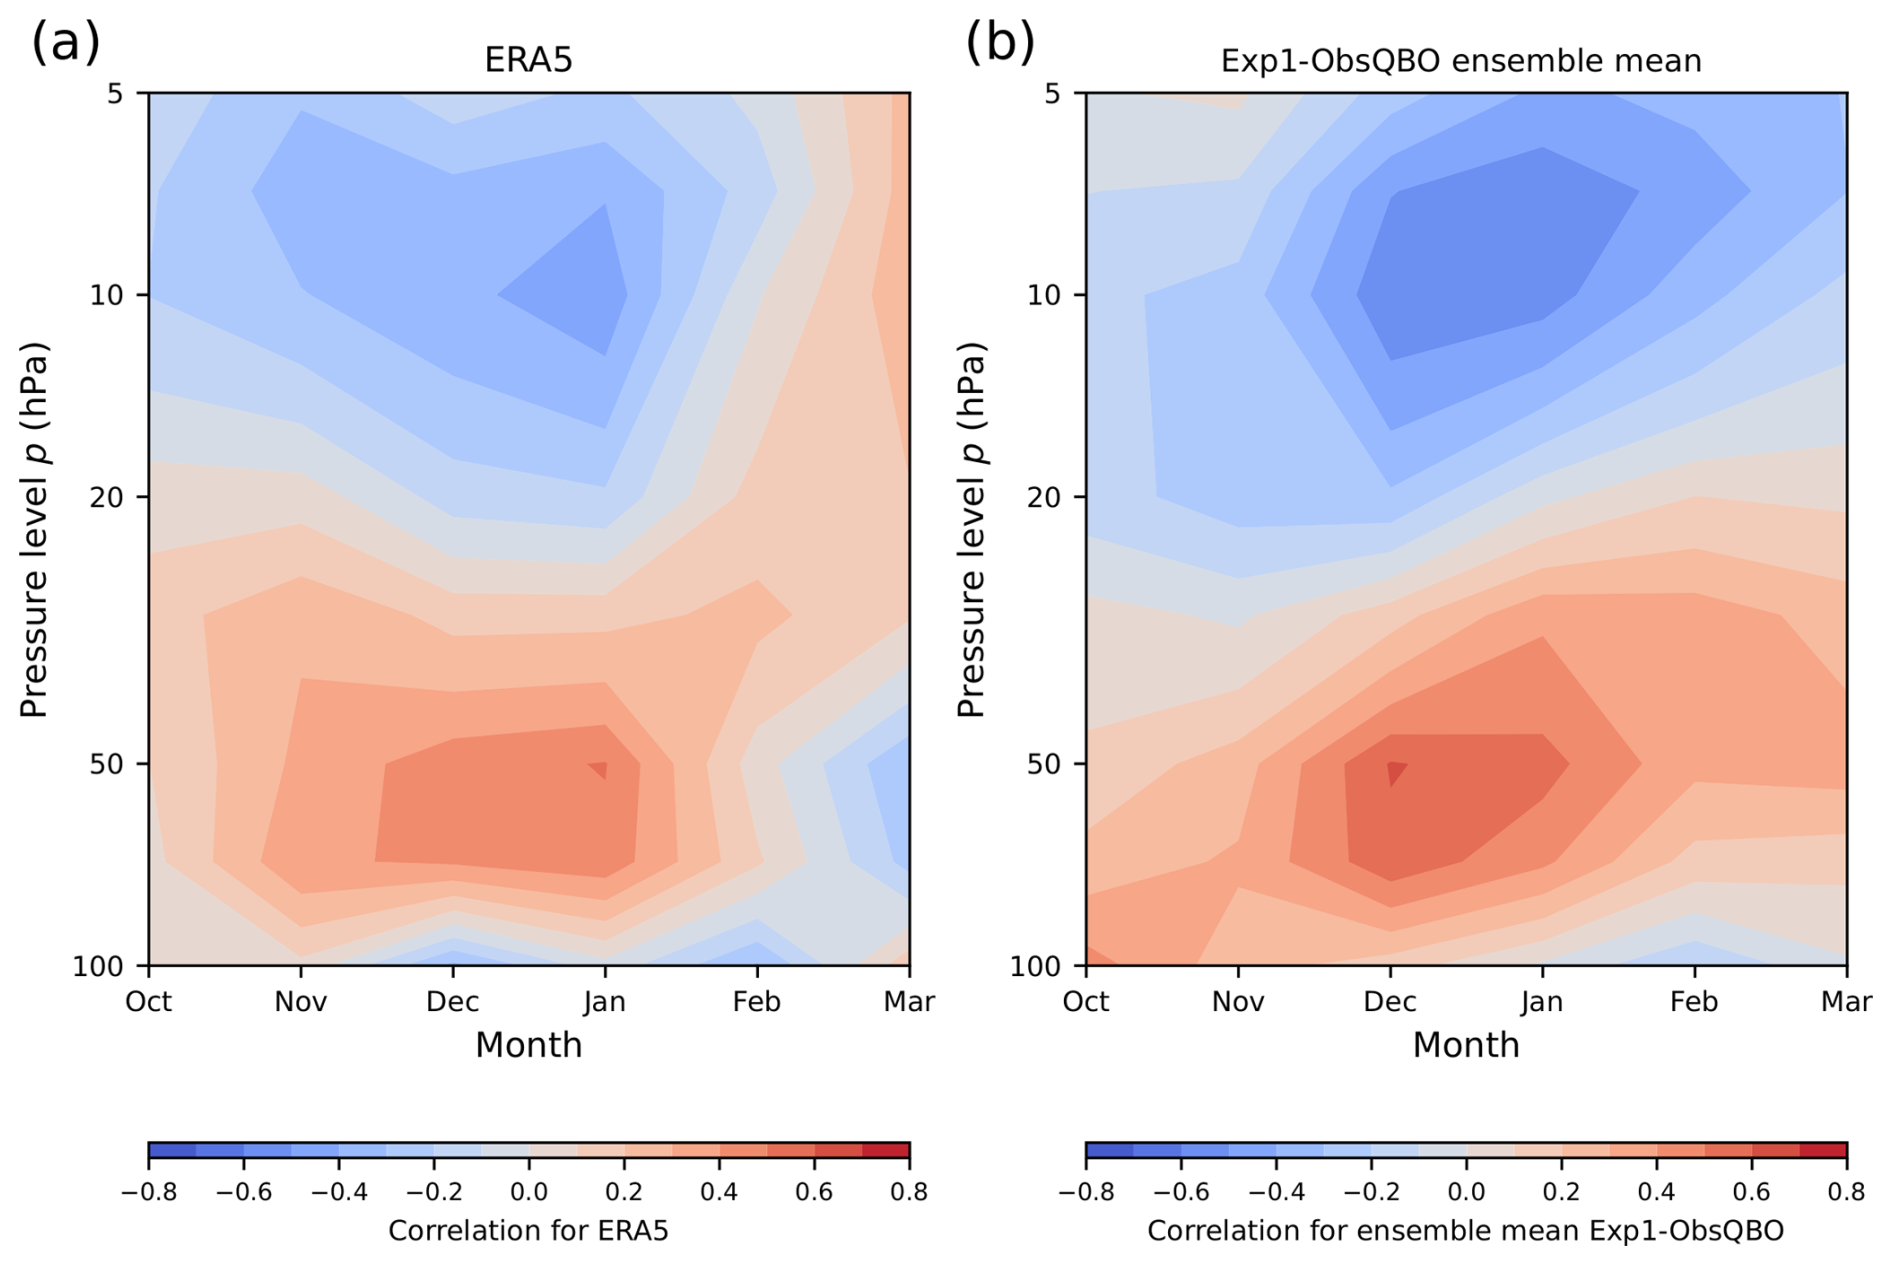
Figure 2Correlation of the zonal-mean zonal wind at 60° N with the equatorial zonal-mean zonal winds from 100 to 5 hPa for October through to March in (a) the ERA5 dataset 1979–2020, and (b) the Exp1-ObsQBO multi-model ensemble mean.
The observation dataset used for the North Pacific precipitation analysis is the Global Precipitation Climatology Project (GPCP; Adler et al., 2018). This dataset provides global estimates of precipitation from 1979 to 2023 at 2.5° resolution. Neutral ENSO winters are defined as when the Oceanic Niño Index (ONI) is below 0.5 °C in magnitude, where ONI is the area-averaged NINO3.4 (5° N–5° S, 120–170° W).
The observed Holton–Tan relationship, measured as the correlation between the QBO index at 50 hPa and the NH stratospheric PNJ, strengthens during early winter, peaks in January, tails off in February and reverses by March (Fig. 2a) over the period 1979–2020. This can be seen more clearly by compositing the ERA5 zonal-mean zonal wind (Uzm) for QBOE and QBOW winters separately and calculating the difference (QBOE-W; Fig. 3). Statistical significance is evaluated using a Monte Carlo method, in which 500 random QBOE-W composites are generated, preserving the QBOE and QBOW samples sizes in the dataset. Significance is measured against the distribution of values for each grid-point. There is a significant negative PNJ response in November of −4 m s−1, increasing to −8 m s−1 in December, before peaking at −20 m s−1 in January. In February the response is weakly negative and is no longer significant, and reverses sign in March to +12 m s−1 becoming significant. This reversal has been linked to a weaker polar vortex due to the cumulative effects of Rossby Wave breaking in late winter during the QBOW phase (Lu et al., 2020).
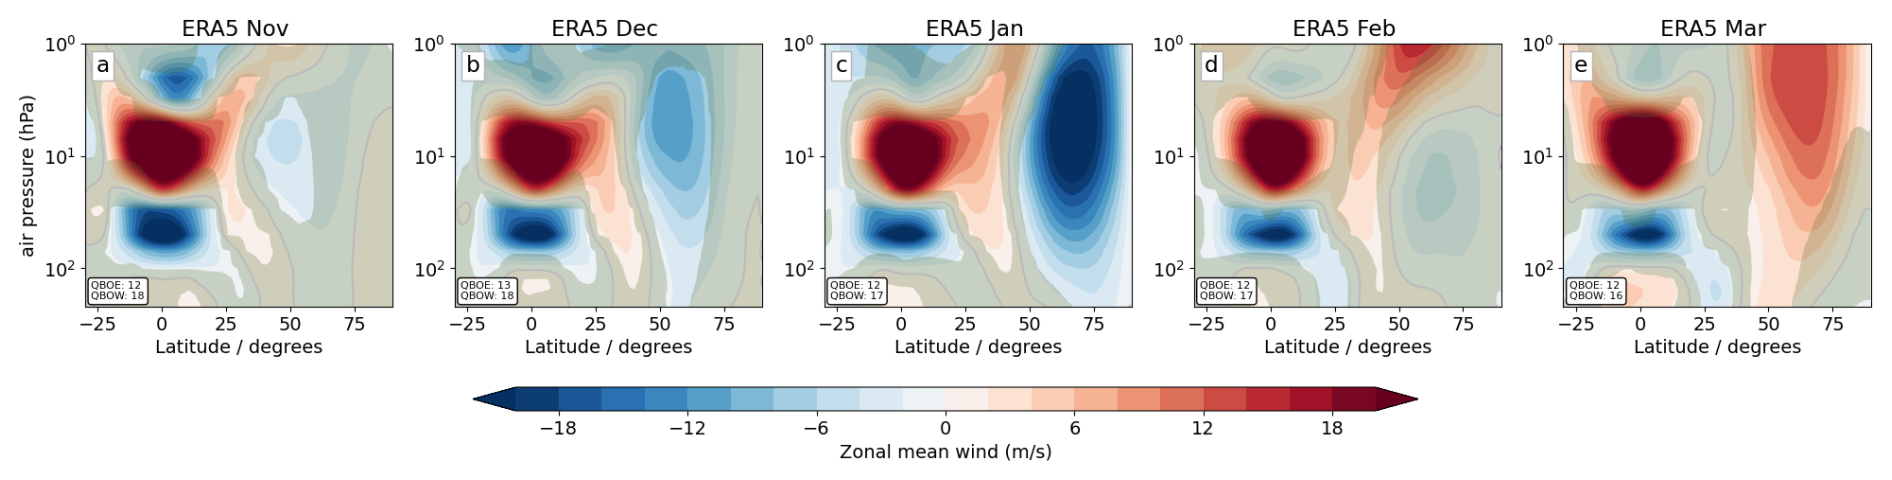
Figure 3Monthly evolution of ERA5 zonal-mean zonal wind, composited by QBOE minus QBOW conditions for November–March over the period 1979-2020. Regions not significant at the 2-sided 90 % level (5 %–95 %) are shaded in olive-green. QBOE and QBOW sample sizes are noted in the bottom left corner of each panel.
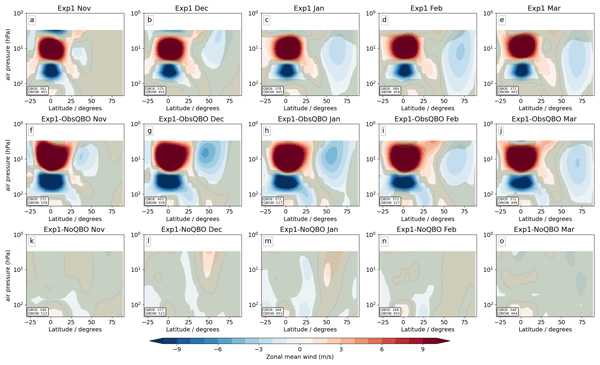
We examined whether this observed Holton–Tan effect is captured in the three QBOi experiments (Exp1, Exp1-ObsQBO, and Exp1-NoQBO) by repeating the QBOE-W composite analysis for the MMEs (Fig. 4). The MME response for each experiment is calculated by compositing the QBOE and QBOW for each month across all models, applying model-specific thresholds, and then calculating the composite QBOE-W response. The Exp1 MME (Fig. 4a–e) exhibits a weak but significant negative Uzm response in the PNJ region with a peak magnitude of −2 m s−1 over the 4 months December-to-March. This demonstrates that the Exp1 MME captures a Holton–Tan-like response to the free-running QBOs spontaneously generated by each model, though notable deficiencies are the absence of the reversal of the response seen in ERA5 for March (Fig. 3) and a much too weak response in December and January. A comparison with the equivalent results of QBOi phase-1 (Anstey et al., 2022b; experiment 2: free-running QBOs and climatological SST/SI boundary conditions) reveals that the Exp1 MME PNJ response is smaller in magnitude (−2 m s−1 vs. −5 m s−1, January). This weaker response might be attributable to differences in boundary conditions, the experiment periods, the atmospheric forcings, and/or the fact that the underlying models have either evolved or differ between QBOi phase 1 and phase 2 experiments.

Figure 4As Fig. 3, but for the three experiments Exp1 (a–e), Exp1-ObsQBO (f–j), and Exp1-NoQBO (k–o). The colour scale is half that of Fig. 3 in order to reveal the detail in the stratospheric polar vortex.
The Exp1-ObsQBO PNJ response (Fig. 4f–j) is also significant but remains weak compared to reanalysis. The absolute November–January values are approximately twice those of Exp1, peaking at −5 and −4 m s−1 in December and January, respectively, suggesting that nudging models towards the observed QBO has most impact in early-mid-winter. In February and March, the values are similar to Exp1 and, again, the models, on average, fail to capture the reversal in the sign of the response in March. Upon examination, this early-mid-winter improvement in the magnitude of the PNJ response arises from an increased number of models capturing a response of the correct sign. For the winter-mean (December–January–February; DJF) PNJ, five of the eleven models capture a negative response for Exp1, which is improved for Exp1-ObsQBO where ten of the twelve models produce a negative response (Table A1). Seven of these (BCC-CSM2-MR, CAS-ESM, CESM2, ESM4, LMDz, MIROC6.1p1, MIROC6.1p2) have a statistically significant PNJ response.
For the Exp1-NoQBO experiment we selected the same QBOE and QBOW winters as for Exp1-ObsQBO to provide a direct comparison, allowing the impacts of the atmospheric forcings and SST/SI boundary conditions to be assessed independently of the QBO. The PNJ responses (Fig. 4k–o) are weak and insignificant across the winter months, suggesting that CMIP6 atmospheric forcings and SST/SI boundary conditions have little impact on the modelled PNJ when the winters are conditioned by the observed QBOE-W.
These results indicate that the free running MME can capture a Holton–Tan-like response, albeit much weaker than in reanalysis, and that this teleconnection is improved in magnitude if the models are nudged towards a more realistic QBO. Despite this improvement the PNJ response remains weak, approximately 20 % of that seen in observations. To quantify the likelihood of capturing a PNJ response of the observed magnitude, we randomly sub-sampled the QBOE and QBOW winters from all winters across the models in each MME with a QBOE-W sample size equivalent to reanalysis to produce a distribution of PNJ values. We focus on January when the peak QBOE-W PNJ response occurs in reanalysis. Figure 5 demonstrates that the distributions that arise from sub-sampling the MME's fail to capture the magnitude of the observed PNJ response (black line towards the left of the plot). The ±2σ range for the Exp1 experiment (blue histogram) is approximately −12 to +7 m s−1, and for the Exp1-ObsQBO (red histogram) from −14 to +6 m s−1. The Exp1 and Exp1-ObsQBO distributions are not significantly different (Student t test p = 0.17) which indicates that the doubling of the PNJ response from Exp1 to Exp1-ObsQBO is unlikely to be significant. As might be expected, both the Exp1 and Exp1-ObsQBO distributions are significantly different to the Exp1-NoQBO distribution (not shown; p < 0.01), which underlines the role of the QBO in modulating the strength of the PNJ.
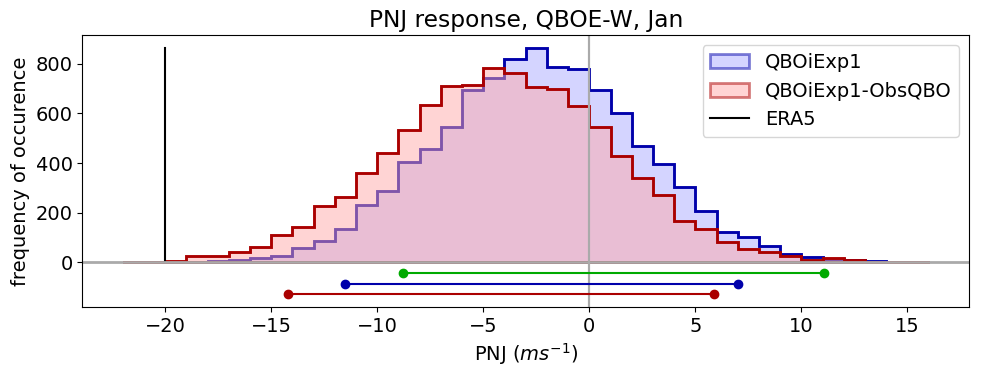
Figure 5Distribution of PNJ values when sub-sampling the multi-model ensembles with a QBOE-W sample size equivalent to observations. The distributions shown use Monte Carlo random sub-sampling-with-replacement with 10 000 iterations for clarity, whereas the statistics given in the main text uses the more statistically robust sub-sampling-without-replacement. The distributions for Exp1-ObsQBO (red) and Exp1 (blue) are accompanied by horizontal lines of similar colours beneath the graph indicating the ±2σ range. The ±2σ range for the Exp1-NoQBO distribution (distribution not shown for clarity) is included as the green line. The vertical black line towards the left represents the observed PNJ response.
It is no surprise that the sub-sampled Exp1-ObsQBO MME distribution does not capture the magnitude of the observed January PNJ response given that no individual model appears capable of consistently producing such a large response. In addition, the timing of the peak PNJ response of individual models varies from December to March. We did, however, find that some models capture the magnitude of the observed December PNJ response. Moreover, if we consider the DJF-mean PNJ response we find that most individual models have a negative response (Table A1) similar in magnitude to ERA5 (−6 m s−1). These results might indicate that the magnitude of the observed January response might reflect aliasing from unrelated variability, or alternatively, that the models only produce a weak mid-winter teleconnection despite the fact that some individual models can capture a reasonable winter-mean HTE. Anstey et al. (2026b) shows that there is very little change in the magnitude of interannual PNJ variability when nudging the equatorial stratosphere which supports the suggestion that the models are failing to fully capture the mechanism by which the QBO modulates the strength of the PNJ. A comparison of the regression coefficients between the peak PNJ value in each distribution and the corresponding peak QBOE-W zonal-mean zonal wind QBO value yields similar results for Exp1 (0.194) and Exp1-ObsQBO (0.183), both of which are substantially smaller than the observed value (0.803). This suggests that the strength of the teleconnection in the ensembles is largely unaffected by nudging, and that the enhanced PNJ response in Exp1-ObsQBO arises primarily from the increased amplitude of the nudged equatorial QBO.
The design of the QBOi phase 2 experiments provides an opportunity to assess the contribution of the QBO to the interannual variability of the PNJ over the simulation period. Unlike the composite analysis presented above, this approach captures the temporal co-variability between the QBO and PNJ, including times when the QBO is in a neutral phase. By comparing the results of Exp1-ObsQBO and Exp1-NoQBO we can assess the predictable component of PNJ variability associated with the observed QBO in the presence of evolving CMIP6-forcings and SST/SI boundary conditions. Figure 6 shows the January PNJ timeseries for ERA5 (black line), and the MME-means for Exp1-ObsQBO (red line) and Exp1-NoQBO (green dashed line). The Pearson correlation between the PNJ of ERA5 and Exp1-ObsQBO is significant (r = 0.61; p < 0.001). This suggests that up to 30 %–40 % of the observed interannual PNJ variance in January may be accounted for by the influence of variability in the equatorial stratosphere including the QBO. This conclusion is supported by the weak and insignificant correlation (r = 0.06; p ∼ 0.68) between ERA5 and the Exp1-NoQBO MME-mean where the QBO in the equatorial stratosphere has been neutralised, and the fact that the experiments have the same time-varying boundary conditions and forcings. This also demonstrates that the combination of historically-varying forcings and SST/SI boundary conditions, at least in the models, do not have a measurable contribution to the predictability of the observed January PNJ over the 1979–2020 period. For Exp1 the QBO is neither synchronised with observations nor synchronised between contributing members so perhaps it is not surprising that there is an insignificant correlation between the observed PNJ and Exp1 MME PNJ (r = 0.17; p ∼ 0.27; not shown in Fig. 6). The magnitude of PNJ variability in Exp1-ObsQBO MME-mean is weaker than in ERA5, which mirrors the results of QBOi phase 1 forecast experiments (Stockdale et al., 2022). On the decadal timescales covered by these experiments, the weaker magnitude of the Exp1-ObsQBO ensemble mean PNJ variability combined with reasonable predictive skill may be indicative of the well-known signal-to-noise paradox which is known to impact the magnitude of predictable signals in seasonal-to-decadal forecast systems (Eade et al., 2014), although on short subseasonal timescales Garfinkel et al. (2024) found no evidence of this issue in the stratospheric polar vortex. Nevertheless, these results indicate that models which are constrained to mirror the observed variability of the January QBO are more likely to capture a significant fraction of the observed variability in the PNJ.
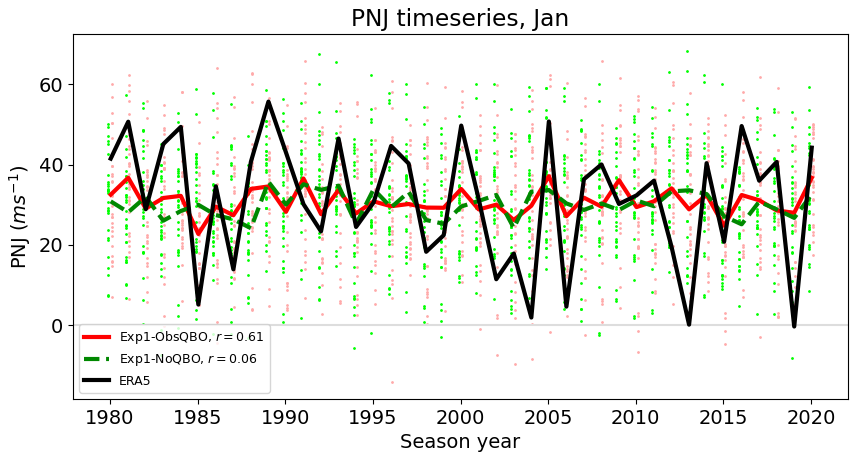
Figure 6Time evolution of the January PNJ in ERA5 (black line), and the MME-means of Exp1-ObsQBO (red line) and Exp1-NoQBO (green line). The PNJ value for each member is plotted with pale red (Exp1-ObsQBO) and pale green (Exp1-NoQBO) dots.
Expanding this analysis across the winter months (Table 2) we find that the Exp1-ObsQBO MME-mean PNJ correlation with observations is significant in early winter ramping up to a peak correlation in January. In late winter the correlations are small and insignificant. This result may be influenced by the fact that the observed QBOE-W teleconnection to the PNJ is only significant in early-winter (Fig. 3b–c) and not in late-winter (Fig. 3d–e). However, given that the MME composite QBOE-W PNJ responses in late winter are significant (Fig. 4d–e, i–j) but do not capture the observed PNJ weakening and reversal (Fig. 3d–e) it may indicate that models are not capturing the HTE correctly and/or that the seasonality, for example, in the timing and frequencies of SSWs (see next section) is incorrect.
Table 2Pearson correlation coefficient values between the timeseries of the observed PNJ and the MME-mean PNJ for each experiment over the period 1979–2020. Correlations with a p value < 0.050 are shown in italics, and < 0.025 in bold.

If it was only the Exp1-ObsQBO MME-mean that exhibited this significant PNJ timeseries correlation in November, December, and January, this would strengthen the attribution of the PNJ interannual variability to the QBO. However, both Exp1 and Exp1-NoQBO also have early-winter months where the correlation is significant (Table 2). For Exp1, the PNJ timeseries correlation peaks in November and becomes less significant in December. For Exp1-NoQBO, the correlation is significant in December. It is possible that time-varying boundary forcings play a role in driving PNJ variability in November and December across all three experiments. In January, however, it can be stated with some confidence that the Exp1-ObsQBO PNJ correlation (r = 0.61) is likely accounted for by the equatorial stratosphere containing the observed QBO given that the Exp1 and Exp1-NoQBO correlations are small and insignificant. These results do not conflict with the results of the composite analysis performed above but do indicate that a significant QBOE-W composite PNJ response does not necessarily lead to significant predictability.
SSWs are defined as reversals of the zonal-mean zonal wind at 10 hPa occurring anywhere between 55 and 70° N, with successive events separated by at least 21 d of westerly winds (Palmeiro et al., 2015). This definition identifies more SSWs than using 60° N 10 hPa (e.g. Baldwin et al., 2021) and helps account for possible model biases in the location of the polar vortex edge. Furthermore, Butler and Gerber (2018) showed that this latitudinal range is optimal for capturing the key characteristics of SSWs.
Before considering the relationship between the phase of the QBO and the frequency and timing of SSWs in observations and models, we examine the influence of the climatological strength of the PNJ on the frequency of SSWs. This relationship for the Exp1-ObsQBO experiment is shown in Fig. 7. We find a clear and strong negative correlation, with models exhibiting a weaker PNJ producing more SSWs per year (e.g. > 1.8 yr−1 for GRIMs 4.0) compared to those with a stronger PNJ (e.g. 0.55 yr−1 for BCC-CSM2-MR). This agrees with Anstey et al. (2022b) (their Fig. 8), with a similar slope of the regression line (−0.0435 vs. ∼ −0.05 s m−1 yr−1 in Anstey et al., 2022b). Similar correlations were found for the Exp1 and Exp1-NoQBO experiments (Table A2, row 1). Further, we performed the same analysis on the results filtered according to ENSO-phase (Table A2, rows 2–4), and whether the SSWs were the first (initial), or occurred after another (subsequent) SSW of that boreal winter (Table A2, rows 5–6). In general, this filtering did not significantly alter our results, yielding r values of about −0.8 to −1.0, and slopes of −0.04 to −0.05 s m−1 yr−1 for ENSO-filtered results, or −0.02 to −0.03 s m−1 yr−1 for initial and subsequent-only SSWs, the smaller frequencies of the latter explained by the fact that such filtering reduces the SSWs counted without altering the number of winters counted.
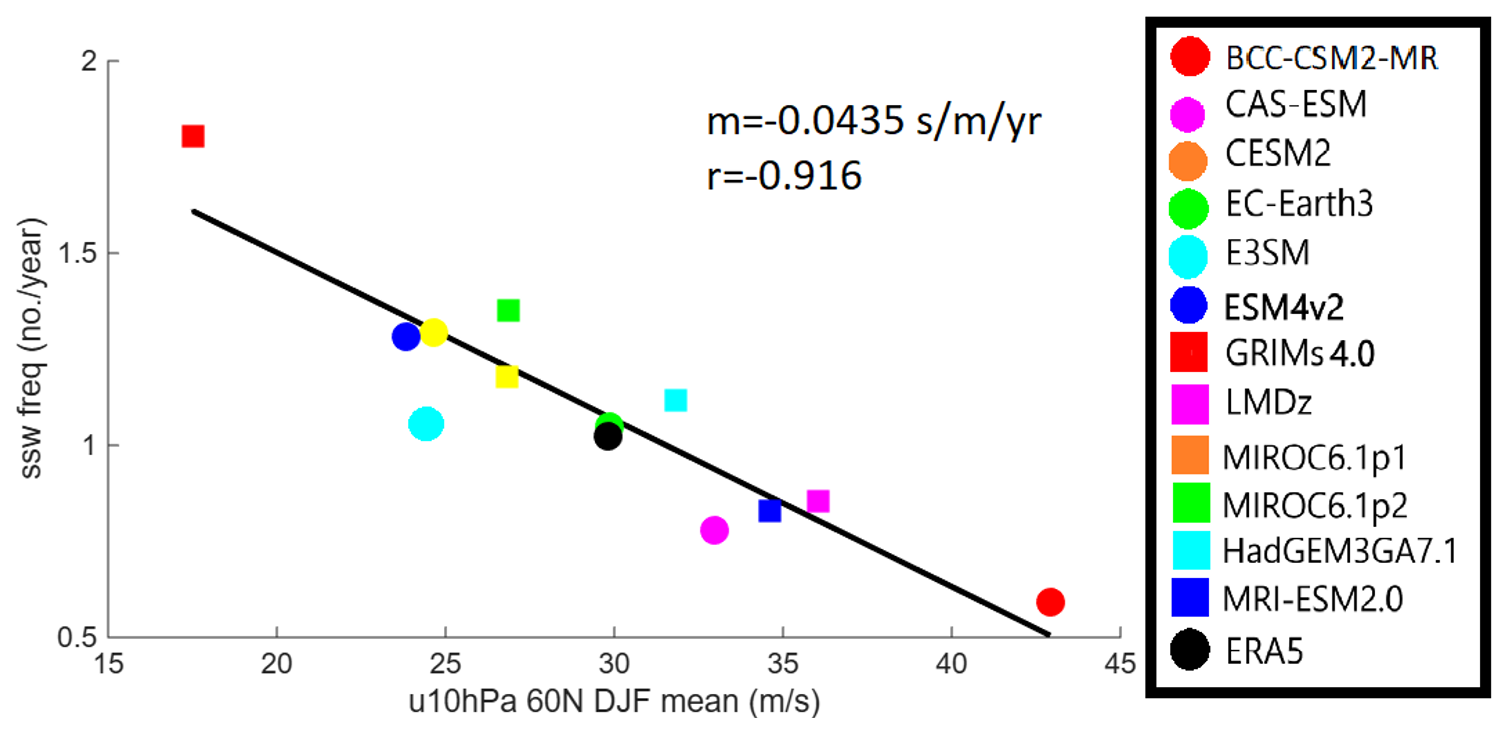
Figure 7Scatter plot showing the regression between DJF PNJ strength (x axis) and Sudden Stratospheric Warming (SSW) frequency (y axis) across the different models in the Exp1-ObsQBO experiment, and also for the ERA5 reanalysis. Slope (m) and correlation coefficient (r) are calculated from the model values only.
We now consider the relationship between the phase of the QBO and the frequency of SSWs. The QBOE-W difference in SSW frequencies for each experiment calculated for all the models (MMM: Multi-Model Mean), for those with a significant HTE, as found in Sect. 3 (MHT: Mean Holton–Tan; see Table A3 for a list), and ERA5 data are shown in Fig. 8. In ERA5 there is an increase in SSW frequency during QBOE vs. QBOW of about +0.4 yr−1, although it is not quite significant. Filtering for neutral-ENSO-only winters was found to make the increase significant (not shown). In the MMM we see a small increase (+0.1 yr−1) in SSW frequency during QBOE vs. QBOW in both Exp1-ObsQBO and Exp1, although it is only significant for the latter. The difference in frequency reverses sign in the Exp1-NoQBO experiment, where the winters are composited according to the QBO phase found in ERA5 and Exp1-ObsQBO. This indicates that the difference in frequency for Exp1-ObsQBO and Exp1, whilst not consistently significant, is likely attributable to the QBO, and not some other extraneous forcing or nudging effect. Furthermore, the majority of models in both experiments (8/12 in Exp1-ObsQBO, 9/11 in Exp1) did show an increase in SSW frequency during QBOE vs. QBOW, in contrast to Exp1-NoQBO in which the majority of models (6/11) showed a decrease, providing additional support for the inferred QBO influence on SSW frequency. It is notable that the Exp1-ObsQBO does not lead to any discernible improvement in QBOE-W SSW frequency when compared to Exp1.
If we restrict the analysis to those models that exhibit a Holton–Tan Effect in each experiment (MHT), as these might be expected to show the strongest QBO modulation of SSWs, we see a similar increase (+0.1 yr−1) in QBOE-W SSW frequency in both Exp1-ObsQBO and Exp1, however it is now significant for both experiments. Furthermore, 6/8 and 3/4 of the models exhibit such an increased SSW frequency under QBOE-W conditions in Exp1-ObsQBO and Exp1, respectively, and the multi-model mean SSW frequency differences increase slightly (+0.05 yr−1), although they remain insignificant. Hence, restricting the analysis to models with a significant Holton–Tan effect leads to only a modest improvement in the significance of the SSW frequency differential in Exp1-ObsQBO. We also repeated this analysis by filtering according to ENSO phase in DJF (not shown). Although the QBOE-W SSW frequency difference approximately doubled when only neutral-ENSO winters were considered, particularly in ERA5 and MHT (Exp1 and Exp1-ObsQBO), the resulting differences were not significant due to the very large uncertainty introduced by sampling such a small subset of the 1979–2020 boreal winters.
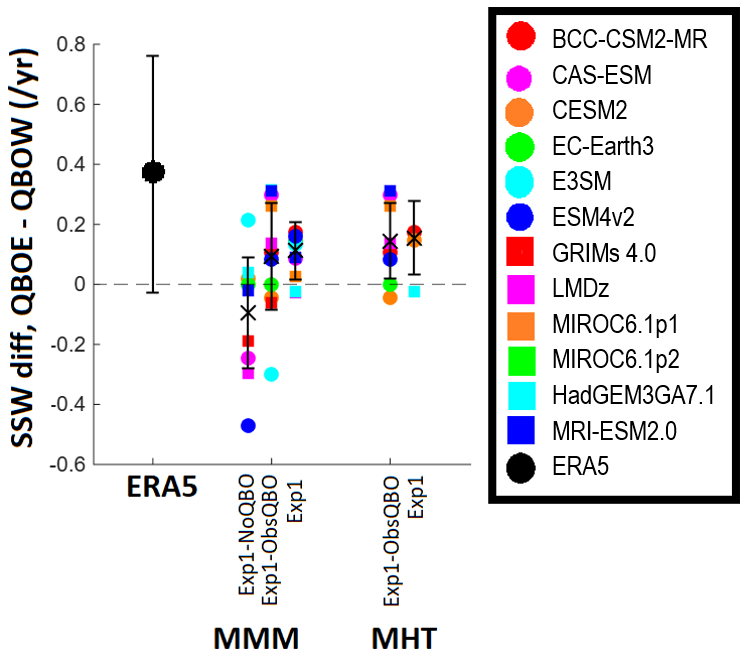
Figure 8The QBOE-W difference in SSW frequencies in each experiment and ERA5 data. Model results are grouped together to show the results from across all models (MMM) and those found to have significant HTE (MHT = Mean Holton–Tan). In MMM, Exp1-NoQBO is also shown, where the QBOE-W years are the same as in Exp1-ObsQBO and ERA5. Individual model means, calculated across ensemble members, are indicated by circles/squares, and the multi-model means and standard deviations are indicated by black crosses and error bars respectively. For ERA5, the Poisson uncertainty, where N is the number of SSW's and T is the number of years, is used.
The timing of mid-winter initial SSWs is also thought to be influenced by the phase of the QBO. Previous observation-based studies showed that the early winter weakening of the stratospheric polar vortex during QBOE can favour an earlier occurrence of SSWs (e.g. Gray et al., 2004). This is evident in ERA5 (Fig. 9a) where the observed distribution of SSW timings occurs approximately one month earlier during QBOE winters (top blue bar) compared to QBOW winters (top red bar) and are significantly different at the 99 % level. During QBO-neutral winters (grey bar) the distribution of SSWs is indistinct from the QBOW winters suggesting that the only phase of the QBO that impacts SSW timings is QBOE. For the Exp1-ObsQBO and Exp1 experiments the MME-mean responses do not capture the observed SSW-timing separation between QBOE and QBOW winters (Fig. 9 MMM-Exp1-ObsQBO and MMM-Exp1). Furthermore, when model results were filtered according to ENSO phase, SSW relative timing (initial vs. subsequent), models with a Holton–Tan effect (see MHT, Fig. 9a), and stronger than average polar vortices, no significant QBO modulation was found due to the persistently large spread in SSW timings (not shown). However, in terms of individual models, some exceptions such as HadGEM3GA7.1 and especially LMDz6 show the expected behaviour when the observed QBO is imposed but not in the free runs (Fig. A1).
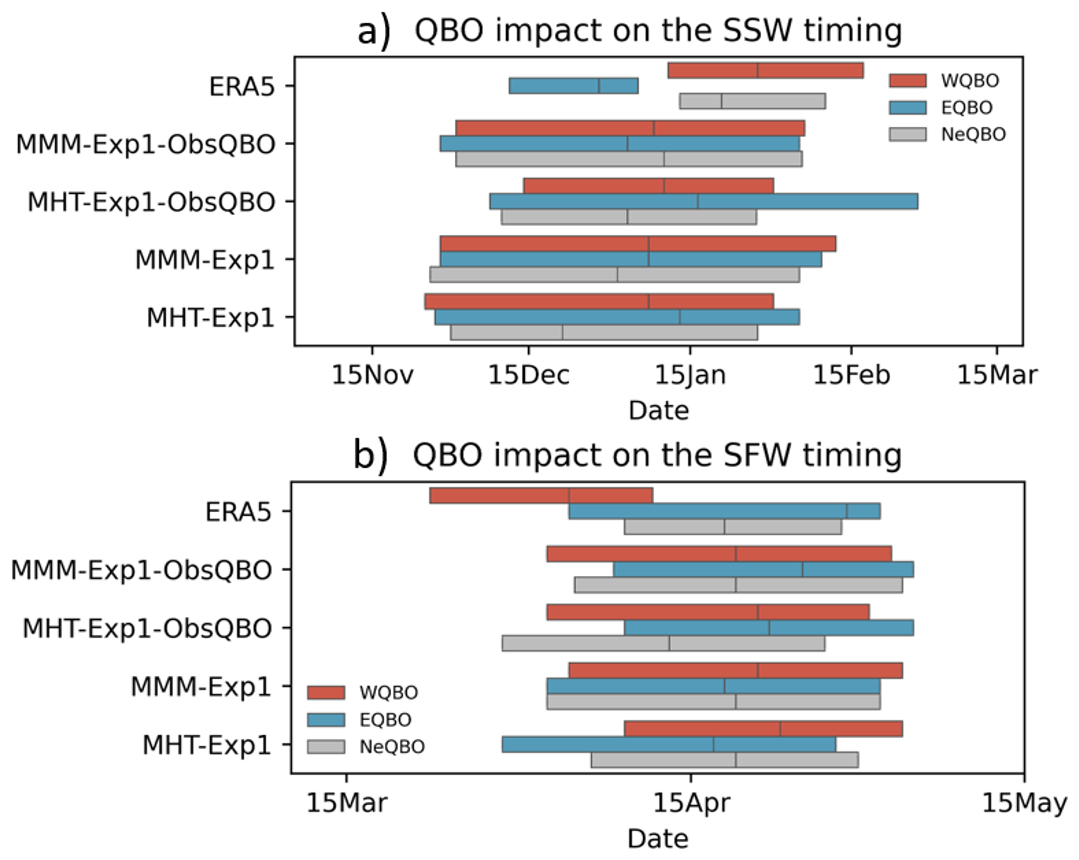
Figure 9Timing distribution of (a) mid-winter SSWs and (b) the stratospheric final warming (SFW) dates for easterly (blue), westerly (red), and neutral (grey) QBO years in ERA5, the multi-model mean (MMM) and the Mean Holton–Tan (MHT) subset in Exp1-ObsQBO and Exp1. Colour bars extend from the 25th to 75th percentile with the mean indicated by a vertical line.
A possible influence of the QBO on the timing of stratospheric final warmings (SFWs), as suggested by Thiéblemont et al. (2019), is also explored. Being more dynamically active than mid–late SFWs, early SFWs are usually followed by downward propagating anomalies and tropospheric impacts similar to SSWs (Palmeiro et al., 2017; Butler et al., 2019). This suggests that these events could represent a stratospheric pathway through which the QBO influences the extratropical troposphere, or at least that the QBO phase could improve the predictability of both the events themselves and their potential impacts.
Figure 9b shows that the mean date of occurrence of SFWs in ERA5 is a month earlier during QBOW than during QBOE. Again, models struggle to capture such an impact, although results are more similar to reanalysis when the observed QBO is imposed in Exp1-ObsQBO. Hu et al. (2014) showed that early SFWs tend to occur in years without SSWs, so considering the strengthening effect of QBOW on the vortex and the decreased frequency of occurrence of mid-winter-SSWs, the earlier occurrence of the SFW during QBOW in ERA5 is expected. Again, individual models struggle to capture such an impact, but, as before, results are more similar to reanalysis when the observed QBO is imposed. This statement is particularly true for EC-Earth3, LMDz, and MIROC6.1p1 which show an improved performance in late winter for Exp1-ObsQBO compared to Exp1 (Fig. A2a).
The influence of the QBO on SSW and SFW timing is, in general, consistent with the weak MME Holton–Tan representation, and is sometimes improved by nudging the observed QBO. Why models do not capture the QBO influence on the timing of these extreme polar stratospheric events could be related to model biases in early winter (i.e. a too weak polar vortex) or a poor representation of the SSW seasonal cycle.
The NAO index is defined here as the sea level pressure difference in the Atlantic sector (290–360° E) between the mid-(30–60° N) and high-(60–90° N) latitudes. One possible route for a teleconnection between the QBO and NAO is via the Holton–Tan modulation of the PNJ. Variability of the PNJ in boreal winter can propagate downwards to the troposphere and affect surface climate variability (Baldwin and Dunkerton, 2001) evidence of which can be seen in ERA5 (Fig. 3b, c) when composited by the phase of the QBO. The DJF correlation between the PNJ and NAO in observations is found to be significant (r ∼ 0.4; Fig. 10 left column). For each of the three experiments the PNJ-NAO correlations in the MME-mean (Fig. 10 right column) are also significant and of similar magnitude to observations. This confirms that the majority of the individual models significantly capture this downward connection. This downward connection is also evident in Exp1 (Fig. 4c–e) and Exp1-ObsQBO (Fig. 4h) MMEs when composited by the phase of the QBO.
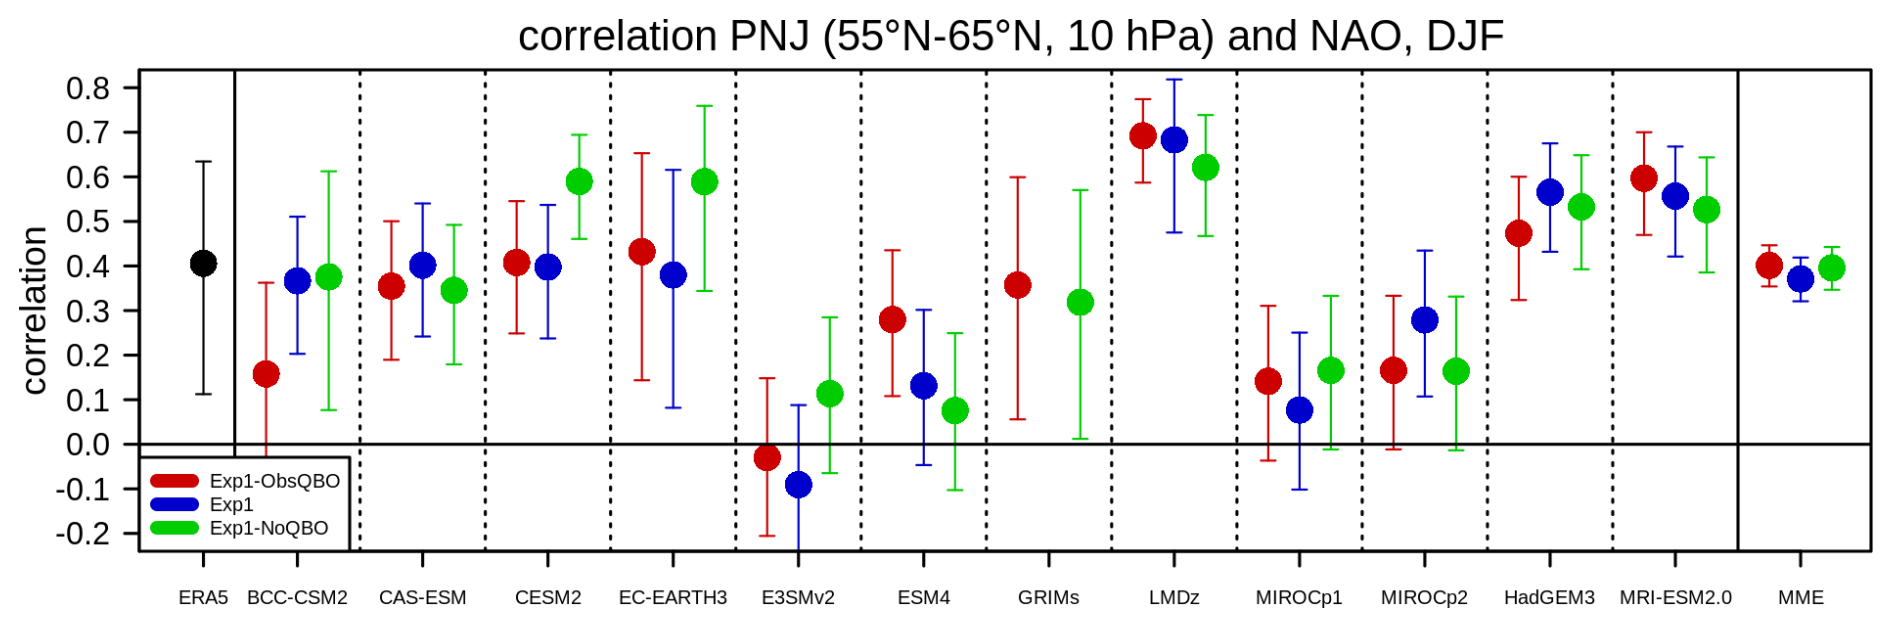
Figure 10Correlation between the strength of the polar night jet (55–65° N, 10 hPa) and the NAO index in DJF for the models and ERA5. The error bars denote the 95 % confidence interval of the correlation.
Previously, we have demonstrated that the phase of the QBO significantly influences the strength of the PNJ anomalies in observations, Exp1 MME, and Exp1-ObsQBO MME, so we considered whether the QBO could influence the strength of the NAO via the PNJ.
The observed correlation between the QBO and NAO is found to be insignificant throughout most of the winter months but is strongest in January (Fig. 11a; r ∼ 0.2–0.3). (In an attempt to improve the significance of the observed teleconnection a longer period (1959–2021) than covered by the experiments was analysed.) The equivalent MME correlations are small (r < 0.1; Fig. 11a) and are generally not statistically significant. We performed the same analysis using a two-station (Azores-Iceland) sea level pressure difference NAO index and found similar results (see Fig. A4). Acknowledging the weakness of the observed QBO-NAO correlation, the lack of significance in the model QBO-NAO relationship may arise due to several factors. These could include the relatively weak magnitude of the MME QBO-PNJ response of the Exp1 and Exp1-ObsQBO experiments (Sect. 3), the insignificant influence of the QBO on the timings of SSWs compared to observations (Sect. 4), and/or the differences in the timing of the individual models' QBO impacts on the PNJ (not shown). These can lead to a large uncertainty with respect to both magnitude and timing of the QBO-NAO relationship as indicated by the wide range of correlation coefficients diagnosed for the individual models from November-onwards (Fig. A3).
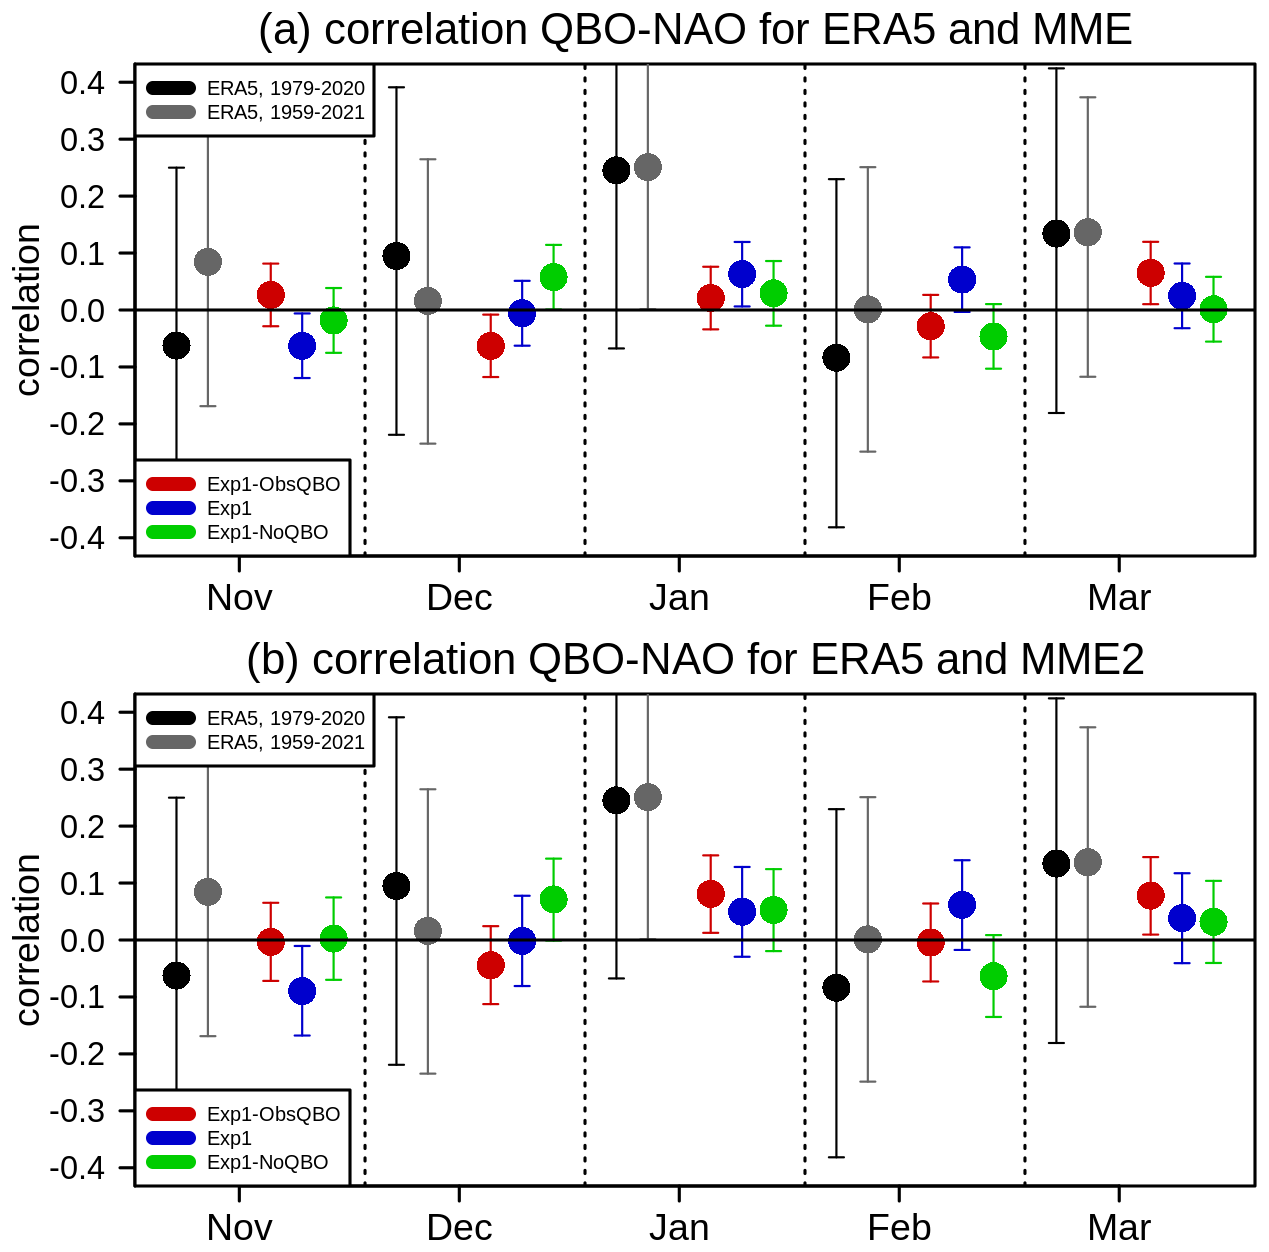
Figure 11Pearson correlation between the QBO phase (5° S–5° N, 50 hPa) and strength of the NAO index from November to March for (a) the multi-model mean MME simulations and (b) the multi-model mean MME2 of only those simulations which exhibit a statistically significant HT effect on the PNJ in DJF, compared to ERA5. Error bars denote the 95 % confidence interval of the correlation calculated across all simulations (i.e. models and ensemble members) contributing to the MME and MME2.
When the MMEs are subsampled to include only those seven models which display statistically significant winter stratospheric QBO-PNJ teleconnection (MME2, Fig. 11b; see Sect. 3 for list of models) the mean of the Exp1-ObsQBO simulations shows a weak (r ∼ 0.1) but statistically significant positive correlation between the QBO and NAO in January (Fig. 11b). This might indicate some limited predictability of the NAO stemming from the QBO teleconnection, although the significance is not apparent using a two-station NAO index (Fig. A4). If we compare this result with the QBO-NAO correlations for the Exp1 and Exp1-NoQBO experiments there is significant overlap, suggesting that the weak correlation response might not be linked to the QBO. It should be noted that the correlations are very small, effectively accounting for less than 1 % of NAO interannual variability in the MMEs. In observations, the QBO-NAO correlation is very weak, so perhaps it is not surprising that the NAO response to the QBO is difficult to isolate in model experiments, highlighting the challenges of inferring details of such a coupling.
The North Pacific Sub-Tropical Jet (STJ) is known to influence the Asian winter precipitation, summer monsoon (Lee et al., 2013; Choi and Kim, 2019; Hunt and Zaz, 2023), and the occurrence of disturbances in tropical regions which typically propagate along the STJ. The influence of the QBO on the strength and position of the STJ may be associated with the downward arch-shaped extension of the QBO zonal wind anomaly (e.g. QBOE-W negative anomaly shown in Fig. 3, equatorial blue region) connecting the equatorial QBO at ∼ 50 hPa and the upper troposphere and lower stratosphere in the subtropical and mid-latitudes (Garfinkel and Hartmann, 2011b; Seo et al., 2013; Garfinkel and Hartmann, 2011a; Park et al., 2022). Following Anstey et al. (2022b) we examined the latitudinal shift of the winter zonal-mean STJ from its climatological position as a function of the QBO phase.
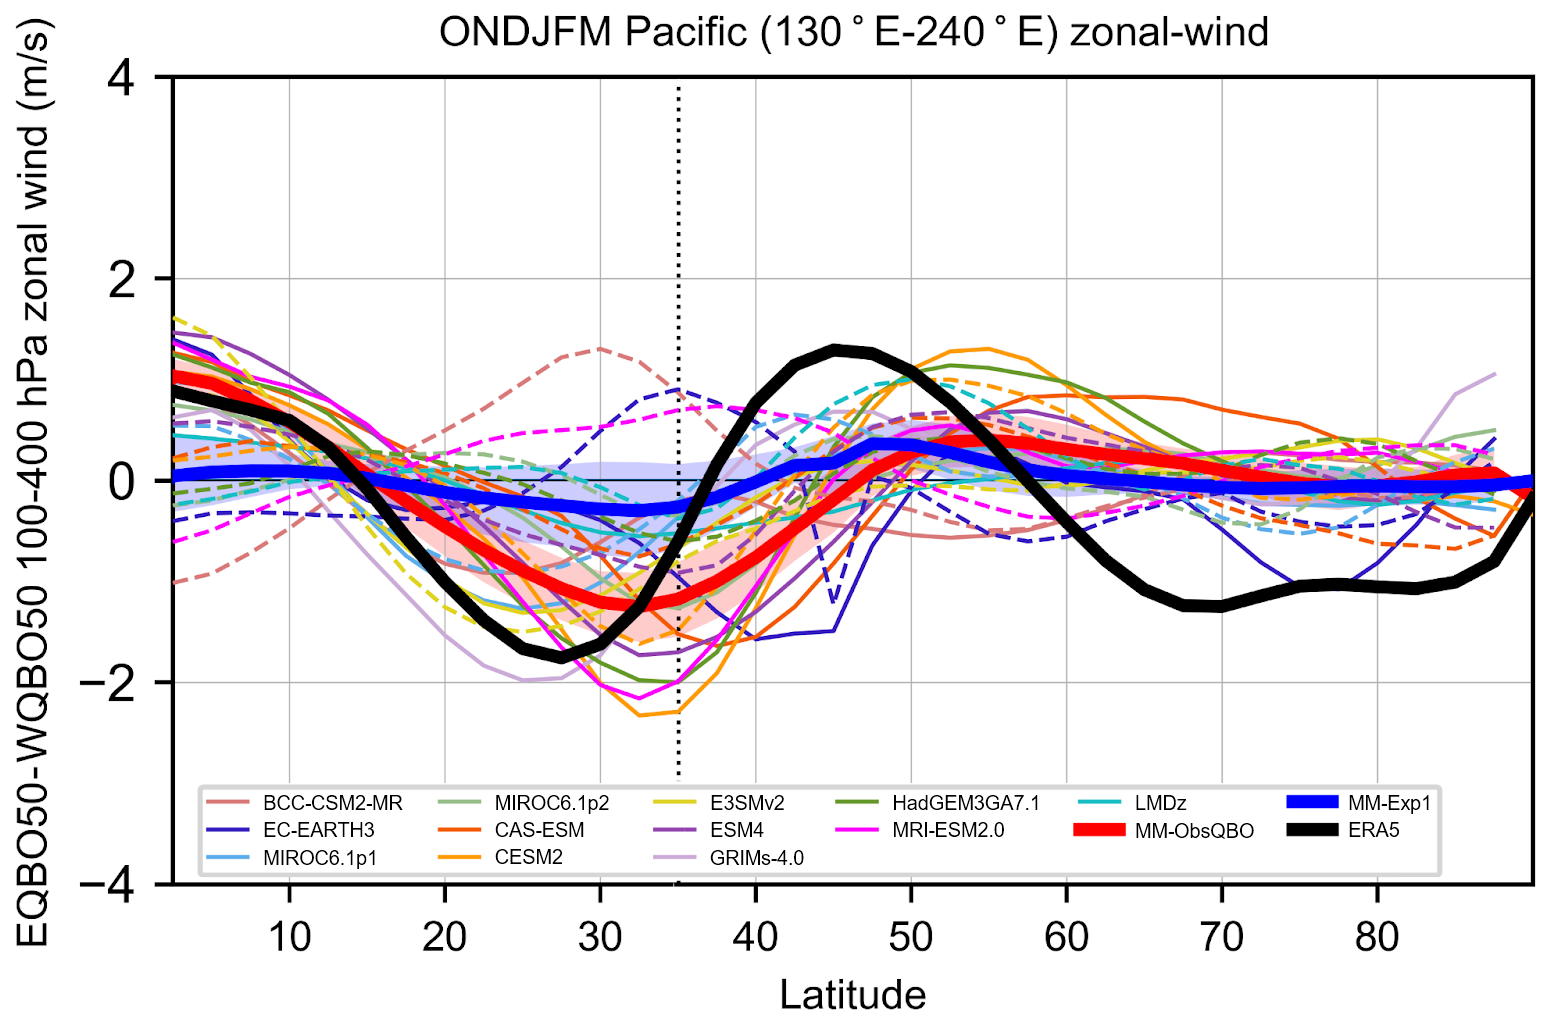
Figure 12October-March QBOE minus QBOW 100–400 hPa pressure-weighted zonal-mean zonal wind anomalies, averaged over the North Pacific (130–240° E) for the period October 1979 to March 2020. The zonal wind for each ensemble member (within a given model and experiment) is deseasonalized to produce anomalies. These anomalies are then composited by QBOE and QBOW phases before subtraction. Each model's zonal-wind anomalies are shown with a characteristic colour, which is used to denote its Exp1 response (dashed line) and its Exp1-ObsQBO response (solid line). The thick black curve shows the ERA5 anomalies over the experiment period and the thick blue and red curves show multi-model averages of the Exp1 and Exp1-ObsQBO ensembles, respectively; we average across a model's respective ensemble members before computing the multi-model averages so that each model is given equal weight in the multi-model average. 2.5 and 97.5 percentile confidence intervals, denoted by shading, are computed about Exp1 and Exp1-ObsQBO by resampling the model ensemble means 10 000 times with replacement. The vertical dashed line denotes the latitude of the climatological STJ from October-to-March across all years over the Pacific in ERA5.
The observed winter (ONDJFM) North Pacific upper tropospheric zonal-mean zonal winds, when composited by QBOE-QBOW at 50 hPa, exhibits a latitudinal profile (Fig. 12, black line) with a minimum around 25–30° N, and a maximum around 42–47° N, on either side of the climatological STJ at 35° N which reflects the reanalysis result of Anstey et al. (2022b; see their Fig. 12). The MME-mean for Exp1 (blue line) shows some variation in the mid-latitudes with a trough around 30–35° N and peak around 45–50° N although neither are significantly different from zero (see blue envelope). Nudging the QBO (Exp1-ObsQBO; red line) and thereby improving the equatorial stratospheric wind profiles improves the representation of the latitudinal wind profile equatorward of 35° N, with a larger and significant trough. However, nudging the QBO degrades the response poleward of 35° N where the jet is expected to be weaker during QBOW. For both Exp1 and Exp1-ObsQBO the trough in the latitudinal wind profile appears to be shifted approximately 5° northwards of the observed trough suggesting a systematic bias in the MME responses. This is despite the latitude of the climatological North-Pacific STJ for Exp1 and Exp1-ObsQBO multi-model means coinciding with that of ERA5. The reason for this bias remains unclear. Repeating this analysis using the QBO phase at 70 hPa does not substantively change the results.
Previous studies (e.g. Gray et al., 2018; Hitchman et al., 2021) have suggested a link between the tropical teleconnection route of the QBO and the STJ. The argument is that the strength and location of tropical convection may modify the horizontal propagation of waves thereby impacting the position and strength of the STJ. In boreal winter, the QBOW phase is associated with an easterly anomaly in the upper troposphere (weaker westerlies) across the Pacific and an equatorward shift in the STJ (Kumar et al., 2022; Park et al., 2022). For this reason, we investigated potential relationships between the simulated QBO-related responses in tropical precipitation and the STJ zonal wind anomalies in Exp1 and Exp1-ObsQBO.
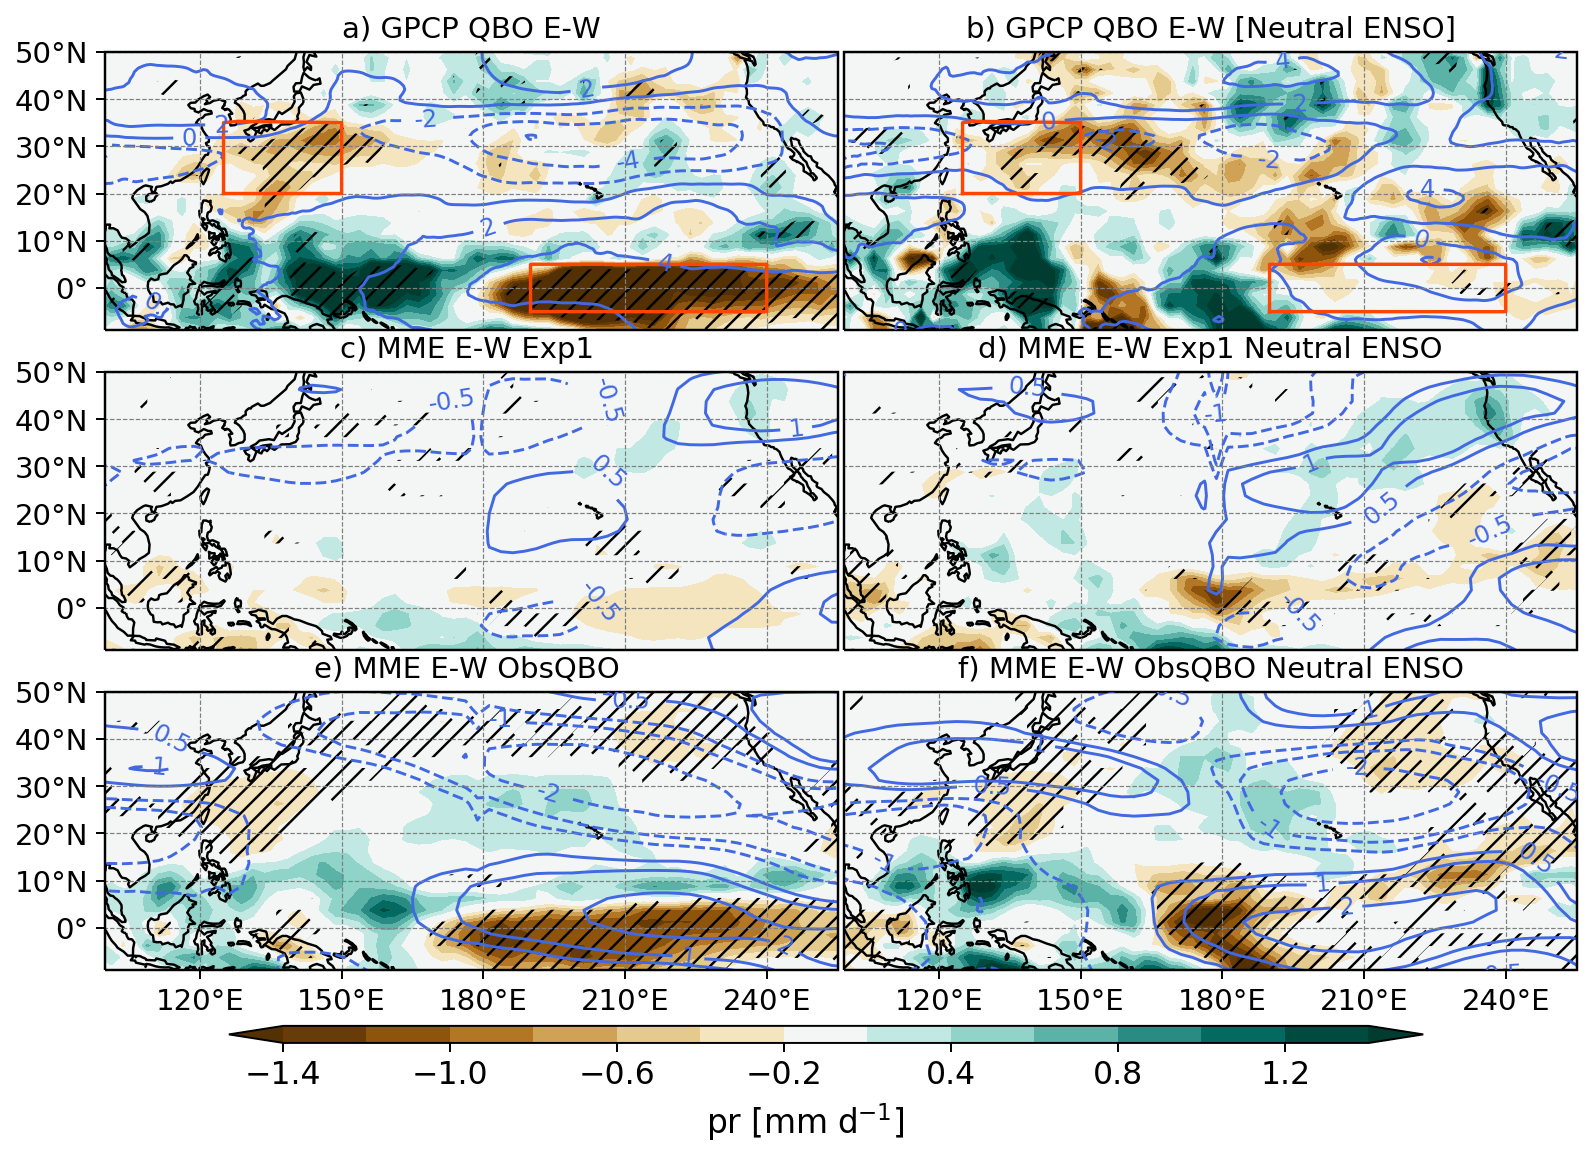
Figure 13DJF mean differences (QBO E-W) in precipitation (shading in mm d−1) and zonal wind at 200 hPa (contours in m s−1). Results are shown for observations considering (a) all cases and (b) only neutral ENSO conditions. QBOi MME of the experiments (c–d) Exp1 and (e–f) Exp1-ObsQBO. Hatching in panels (a)–(b) denotes statistical significance of the precipitation differences to the 95 % confidence level according to a bootstrap test whereas in panels (c)–(f) the hatching shows where at least 70 % of the models agree on the sign of the difference.
Comparing these two experiments shows that nudging the QBO modifies the tropical and subtropical precipitation and zonal wind responses to the QBO phases (Fig. 13). In observations (GPCP; Fig. 13a), the zonal wind response is characterised by a negative QBOE-W response in the North Pacific central region (180–210° E, 30° N), and a positive zonal wind response, aligned with a strong negative precipitation anomaly in the equatorial eastern Pacific. This spatial pattern in either mid-latitude zonal winds or equatorial precipitation is not diagnosed in the MME of Exp1 (Fig. 13c). However, the MME of the nudged experiment, Exp1-ObsQBO, shows a zonal wind response of a similar spatial pattern and sign, both in the equatorial and North Pacific sectors (Fig. 13e).
These spatial patterns of easterly wind anomalies in the eastern tropical Pacific (red box in Fig. 13a, b) in both the observations and nudged experiment may help explain the peak negative zonal mean wind results at 30° N shown in Fig. 12. The positive zonal wind anomalies near the equator are stronger in the nudged experiment coinciding with a stronger negative subtropical response in the zonal wind. In contrast, for the free-running Exp1, there are weaker tropical and subtropical wind responses for individual models leading to no wind response in the ensemble mean. This suggests that the strength of the tropical precipitation and wind are related to the subtropical wind response.
The magnitude and spatial distribution of the zonal wind response, in both the tropics and subtropics, however, appear to be related to the phases of ENSO. When considering only neutral ENSO winters (defined when the absolute value of the ONI is below 0.5 °C in magnitude), both the tropical and subtropical precipitation and zonal wind signals weaken in observations and Exp1-ObsQBO (Fig. 13b, f). Specifically, the North Pacific zonal wind signal in the nudged experiment becomes an east-west dipole at 30° N, with positive anomalies in the western jet (region indicated by red box in Fig. 13a, b) and negative anomalies in the eastern jet.
The tropical Pacific precipitation and North Pacific zonal wind responses appear robust in the nudged experiment (Fig. 13f) even after removing the potential ENSO influence. This QBOE-W response, under neutral ENSO conditions, is characterised by weaker precipitation associated with a westerly wind anomaly in the western North Pacific, and an easterly anomaly in the eastern North Pacific (Yoden et al., 2023), a response not seen in observations. The upper-level westerly wind anomaly in the tropical Pacific suggests a strengthening of the Walker circulation (Bjerknes, 1969), consistent with previous observational and modelling studies (Hitchman et al., 2021; García-Franco et al., 2022, 2023).
Overall, nudging the models towards the observed QBO improves the representation of the subtropical route in the Pacific. However, some aspects of the observed response and the nudged simulations are challenging to interpret given the potential aliasing of the QBO signal with the ENSO signal. Nonetheless, our results show that nudging has a relevant impact on the subtropical jet over the Pacific resulting in a stronger response compared to the free-running experiment Exp1. Finally, while the nudging generates a stronger subtropical response, nudging may not always lead to the correct spatial pattern of the QBO signals as highlighted in Fig. 13 for the extra-tropical response.
This study has examined how QBO extratropical teleconnections are influence by model biases in the zonal-mean zonal winds in the equatorial stratosphere. A comparison of the free-running (Exp1) experiment and the experiment where the equatorial stratosphere is nudged towards the observed QBO (Exp1-ObsQBO) over the period 1979–2020 indicates that the PNJ response to the QBO phase, i.e. the Holton–Tan Effect, is somewhat improved when the QBO matches observations. The response was found to be significant for both experiments. Of the contributing models, five out of the eleven models with internally-generated QBOs exhibited a negative PNJ anomaly for QBOE-QBOW conditions, which increased to ten out of twelve models when the observed QBO was imposed. This provides evidence that the observed winter-mean QBO-PNJ teleconnection is more likely to be captured in models with a realistic QBO compared to an internally-generated QBO. It is plausible that, in free-running models, issues such as model QBO bias in the zonal-mean zonal wind including weaker-than-observed strength of the QBO at 50 hPa (Richter et al., 2022, Anstey et al., 2026b) may act as a barrier to capturing the Holton–Tan effect.
The magnitudes of the QBO-PNJ responses for individual models were similar for Exp1 and Exp1-ObsQBO, but weak compared to observations. The models, on average, also failed to capture the reversal in the sign of the PNJ in March. Sub-sampling the Exp1-ObsQBO models using the same number of QBOE and QBOW winters as for observations demonstrated that the magnitude of the observed PNJ response in January cannot be captured by the models. This suggests that there is still a gap to be bridged between the strength of the teleconnection mechanism in the models and observations. The finding that the composite QBOE–W to PNJ regression coefficients are essentially the same in Exp1 and Exp1-ObsQBO and much smaller than in observations supports this conclusion. It is plausible that the strength of the observed PNJ response, particularly in January, is partly attributable to the observed difference in SSW timing between QBOE and QBOW winters. This relationship between the timing of SSWs and the QBO phase, i.e. earlier SSWs for QBOE compared to QBOW winters, was not captured by either Exp1 or Exp1-ObsQBO experiments. Furthermore, only a small and marginally significant increase in SSW frequency was found during QBOE vs. QBOW in both experiments when the analysis was restricted to models with a significant Holton–Tan Effect. If models were able to fully capture the observed timing and frequency differential it would clarify whether SSWs significantly modulate the strength of the Holton–Tan Effect.
Although the magnitudes of model QBO-PNJ teleconnections were weak, the Exp1-ObsQBO experiment was found to significantly capture part of the interannual variability of the January PNJ over the historical period 1979–2020. A similar analysis using Exp1-NoQBO demonstrated no skill. This suggests that seasonal/multi-annual forecasts which contain a QBO that reflects both the time-evolving phase and strength of the observed QBO is an important consideration when predicting the stratospheric polar vortex, and that any departure from the observed QBO may potentially reduce the prediction skill of the PNJ.
The QBO-NAO teleconnection, which is small and insignificant in observations, was also found to be extremely weak and insignificant in the Exp1 and Exp1-ObsQBO experiments. If the teleconnection acts through the pathway from QBO-to-PNJ and then PNJ-to-NAO, it is plausible that the relatively weak PNJ response to the QBO phase may have contributed to the lack of QBO-NAO response. Nevertheless, the correlation between the PNJ and NAO was found to be significant when not stratified by the phase of the QBO.
The influence of the QBO on the North Pacific STJ has been arguably linked to the QBOE-W zonal-mean zonal wind anomaly arching polewards and downwards from the lower equatorial stratosphere to the upper sub-tropical troposphere, or possibly upper-tropospheric divergent circulation anomalies associated tropical precipitation. The small but significant zonal wind anomaly on the southern flank of the STJ, only captured by the bias-corrected experiment (Exp1-ObsQBO), suggests that the models can produce a weak approximation of the observed response to the QBO. It is probably not a coincidence that the influence of the QBO on the North Pacific upper-level winds was found to be larger in the nudged experiment than in the free running experiment. Hence, it is plausible that the weak response might be attributed to a difference in strength and zonal topology of the arching zonal wind anomalies, or to some aspect of the upper-troposphere-lower-stratosphere coupling outside of the nudged region. Further experiments that bias correct the arching zonal wind anomalies in addition to the QBO may identify where the QBO-STJ connection is breaking down in models.
ENSO is likely to be an influential and potentially confounding factor when interpreting the response of the STJ and precipitation in the North Pacific. Removing ENSO events altered the sign and spatial structure of the tropospheric zonal wind QBO signal and its relationship with tropical precipitation, highlighting the role of the mean tropical state in modulating QBO teleconnections. Only the nudged experiment exhibited a zonal wind STJ response that appeared to be robust with- and without-ENSO but the spatial pattern of the anomalies varies significantly depending on the ENSO state. Further nudged simulations using climatological SSTs would enable the QBO signal to be better isolated from the effects of ENSO.
In summary, this comparison of the three QBOi phase-2 experiments has demonstrated that the QBO teleconnection to the winter stratospheric polar vortex can be improved in models when a more realistic QBO is imposed, i.e. when the QBO is bias-corrected. Perhaps surprisingly, this has failed to translate into a robust SSW frequency and timing response. Similarly, the teleconnection to the tropospheric NAO has failed to produce conclusive and consistent results for both observations and experiments. In the North Pacific, the zonal wind anomaly on the southern flank of the STJ was improved in terms of strength, although not latitudinal position, when imposing a more realistic QBO. While bias-correcting the simulated QBOs increases the strength of those concomitant extra-tropical responses that are diagnosed in this paper, these responses are still, on average, underestimated by the models. Moreover, the morphology of the response in the models is often somewhat different to that observed (e.g. the observed QBO influence on the frequency and timing of SSWs is not captured by the models). Establishing whether these errors can be attributed to model biases in the extra-tropics or are due to the poor representation of the teleconnection mechanisms by the models is beyond the scope of this study and is an important topic for future research.
Table A1Strength of the DJF PNJ response in models when compositing by QBOE-W. Bold indicates significance at the 2-sided 90 % level (5 %–95%).
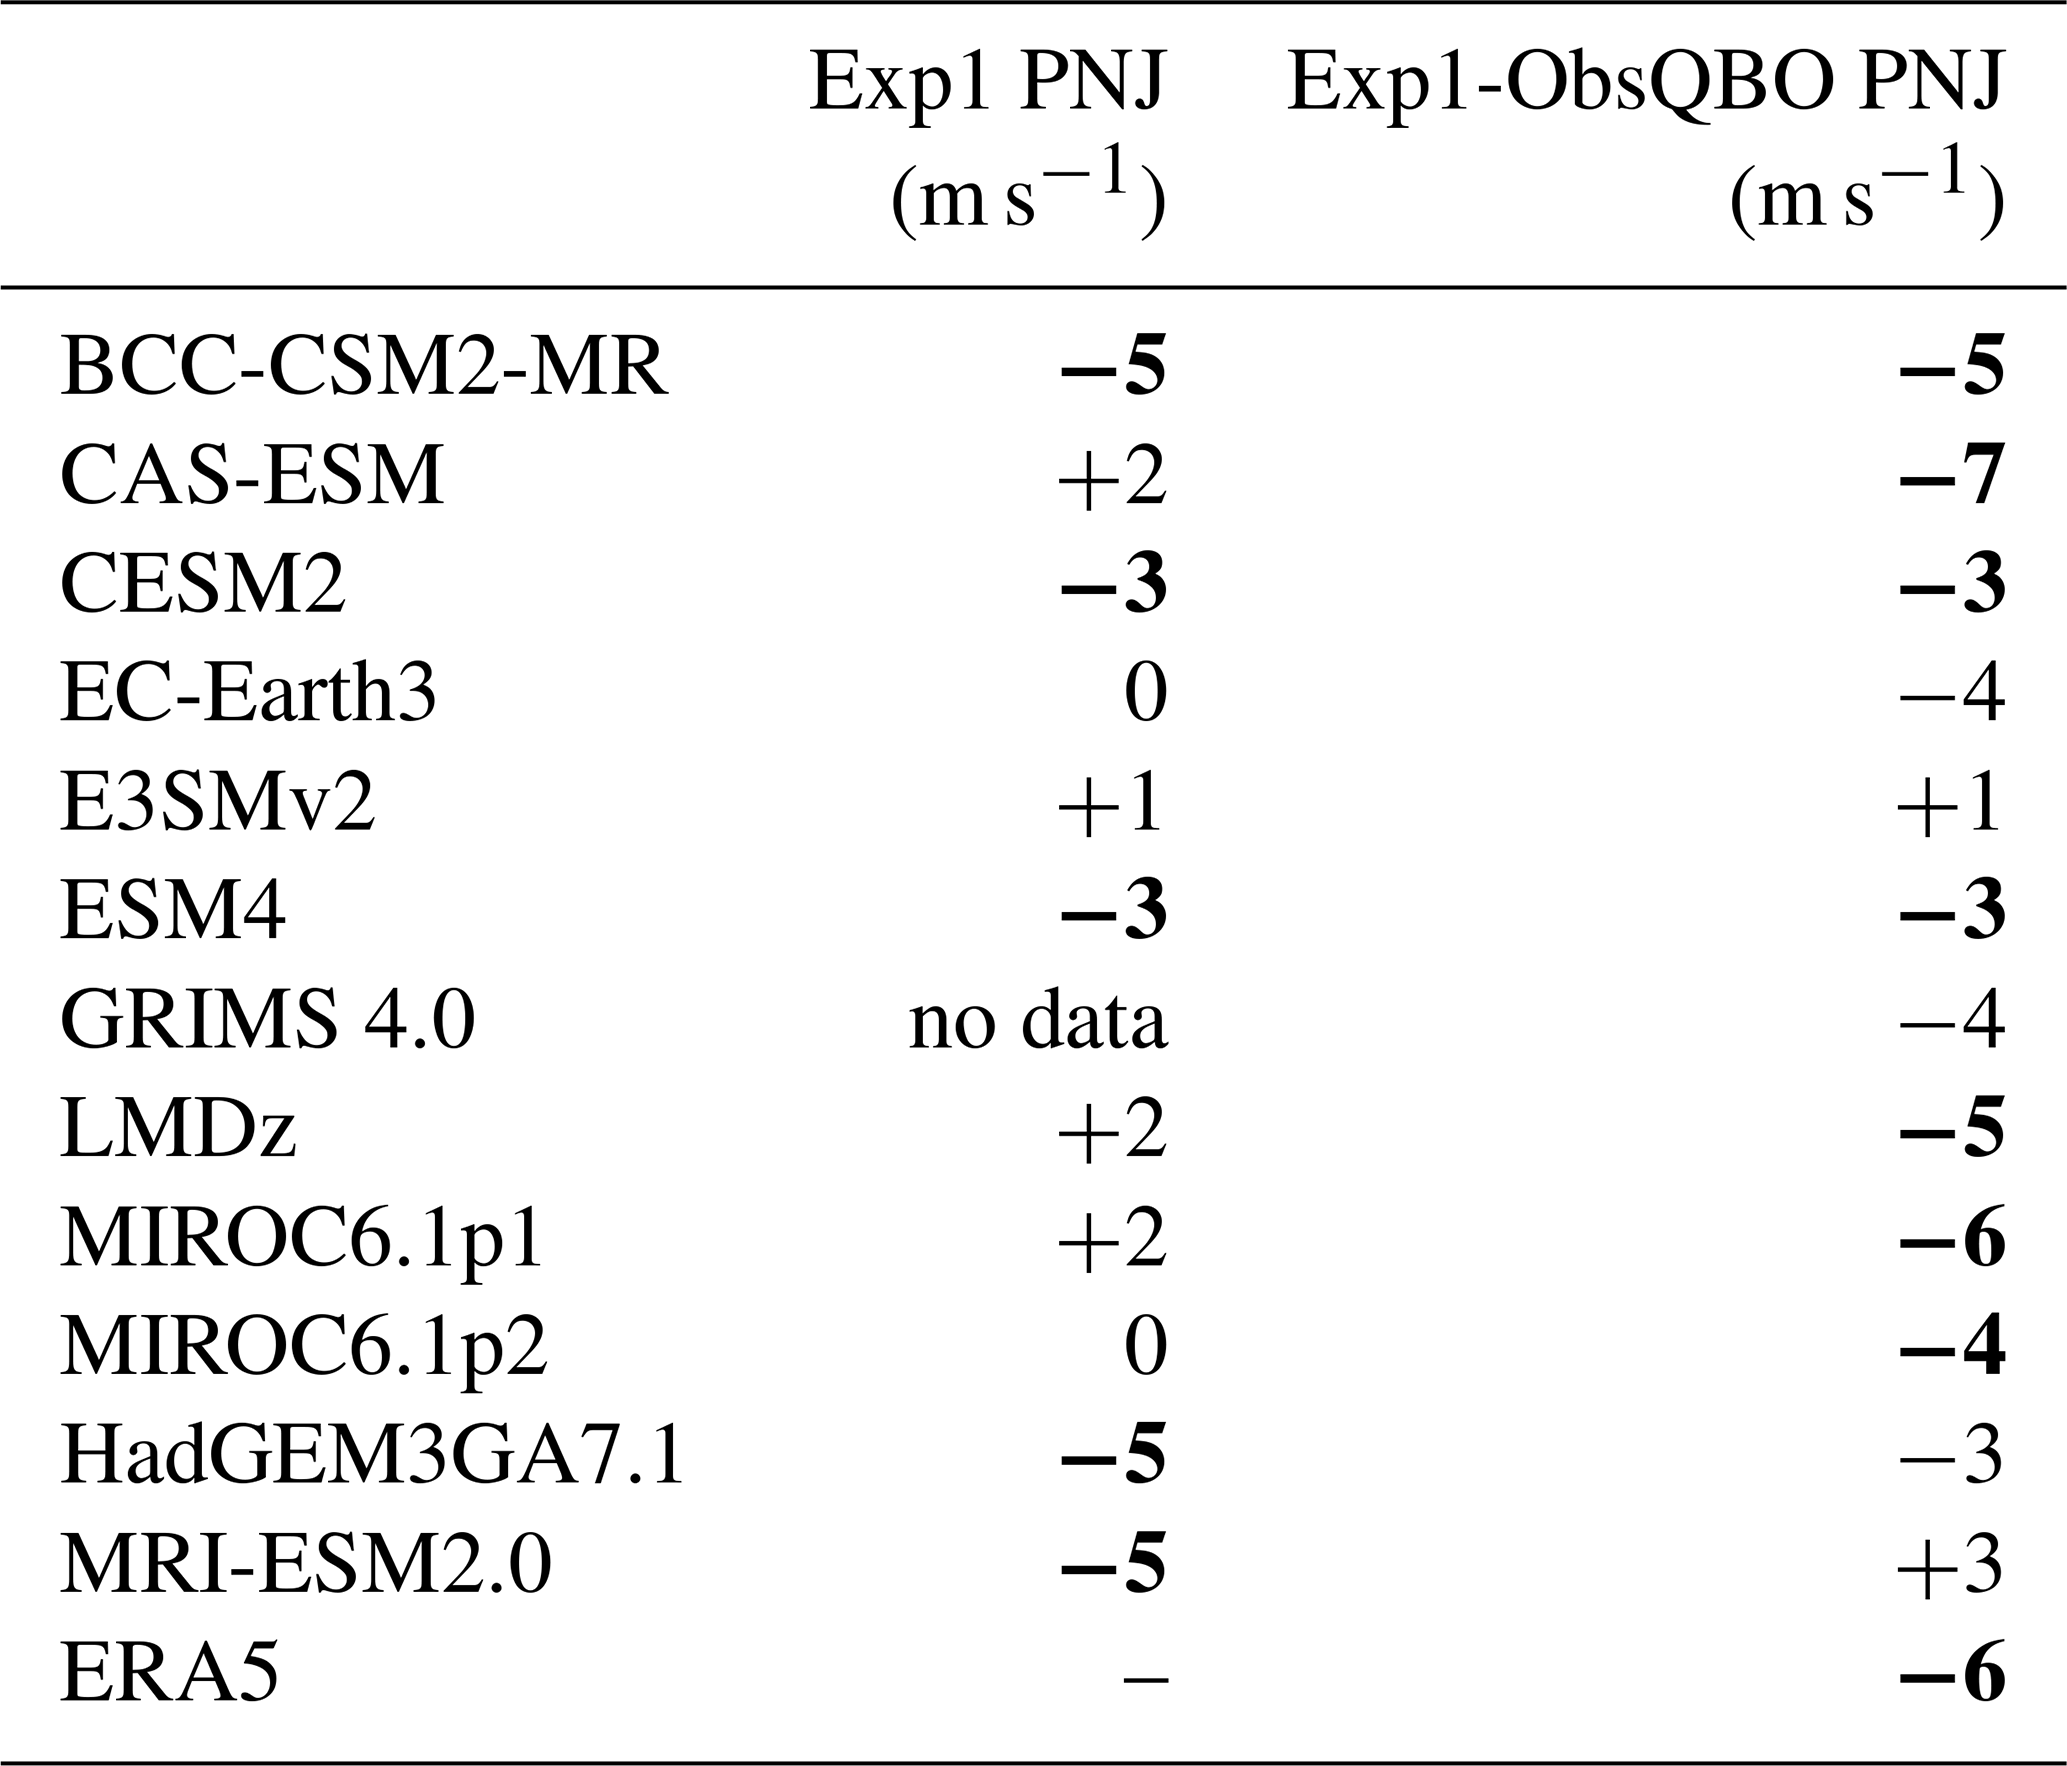
Table A2Slopes (m, unit = s m−1 yr−1) and correlation coefficients (r) when regressing the frequency of SSWs (unit = yr−1) against DJF zonally-averaged zonal winds at 60° N and 10 hPa (m s−1) using the average values from each model, as in Fig. 7. The regression is performed for each experiment, using all boreal winters and SSWs (denoted by “All”), filtering for only El Niño, La Niña, ENSO-neutral winters, and initial and subsequent SSWs.
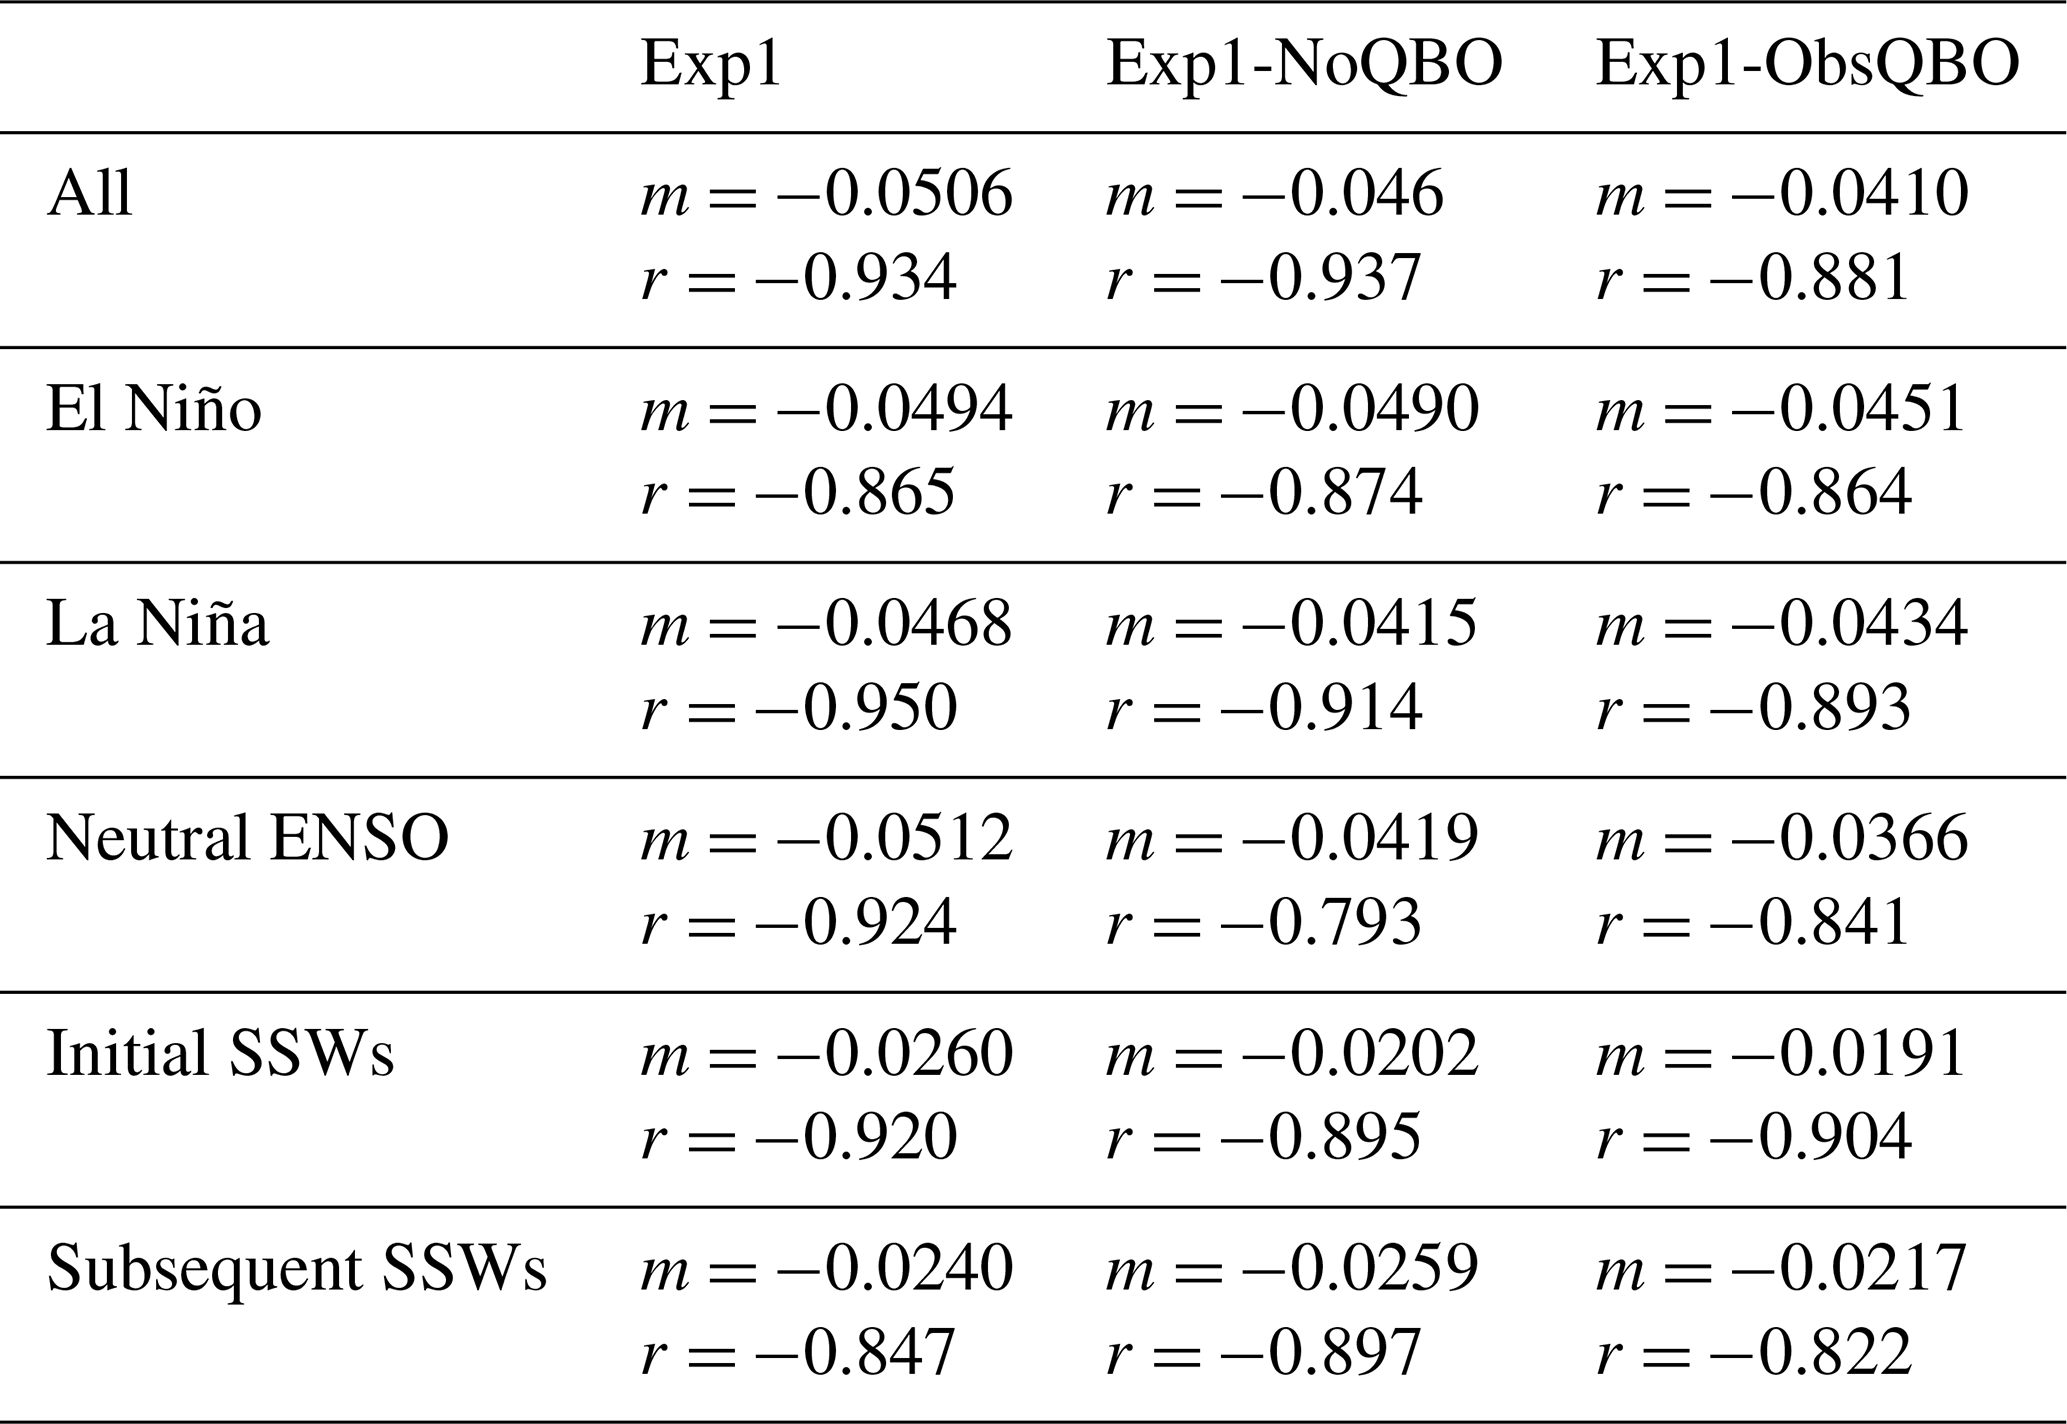
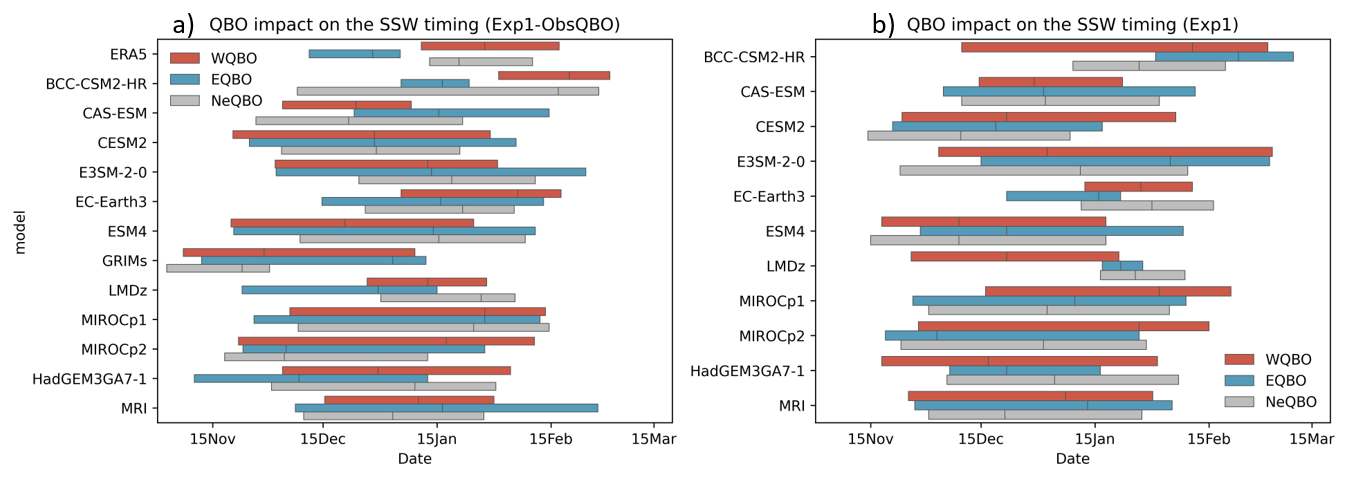
Figure A1Models are unable to capture the observed significant shift to earlier winter SSWs under QBOE conditions. Timing distribution of mid-winter SSWs for (a) Exp1-ObsQBO and (b) Exp1, during QBOE (blue), QBOW (red) and QBO-neutral (grey) winters. Colour bars indicate the spread of SSWs and extend from the 25th to the 75th percentile with the mean indicated by a vertical line.

Figure A2Models are unable to capture the observed shift to earlier SFWs under QBOW conditions. Timing distribution of SFWs for (a) Exp1-ObsQBO and (b) Exp1, during QBOE (blue), QBOW (red) and QBO-neutral (grey) winters.
Table A3The models used in the Holton–Tan ensemble (MHT; X = included) for model experiment: Exp1 and Exp1-ObsQBO.
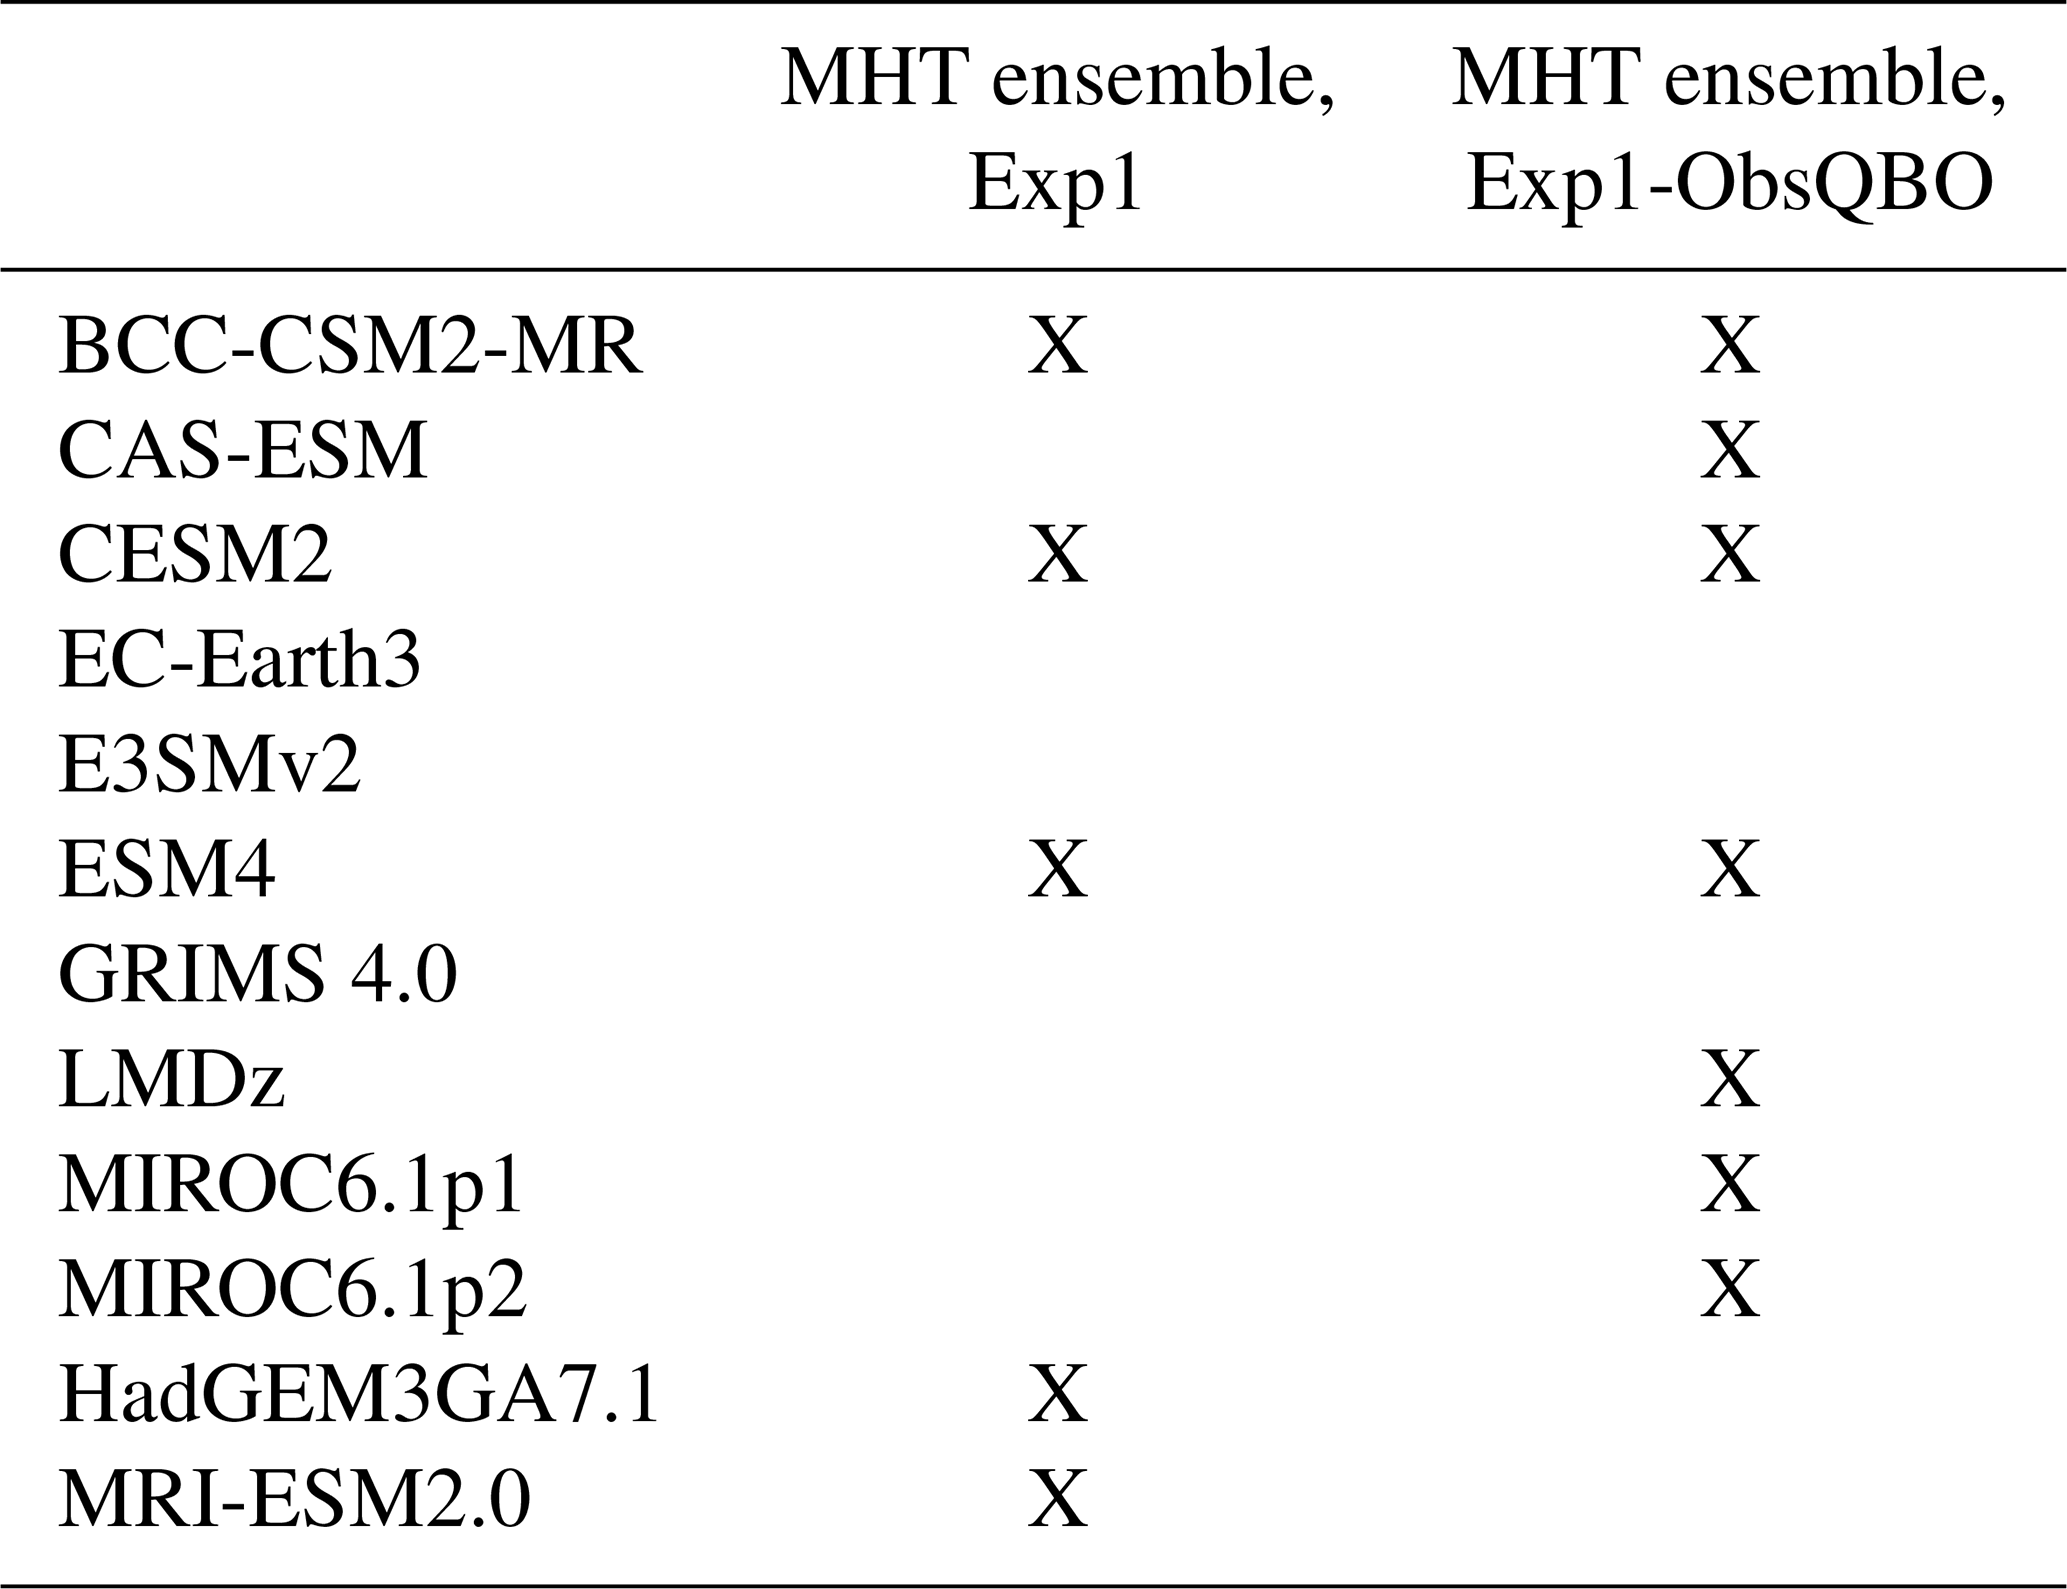

Figure A3Correlation between the QBO (5° S–5° N and 50 hPa) and the NAO index in (top to bottom) November, December, January, February and March for ERA5, all models, and the MME for each experiment.
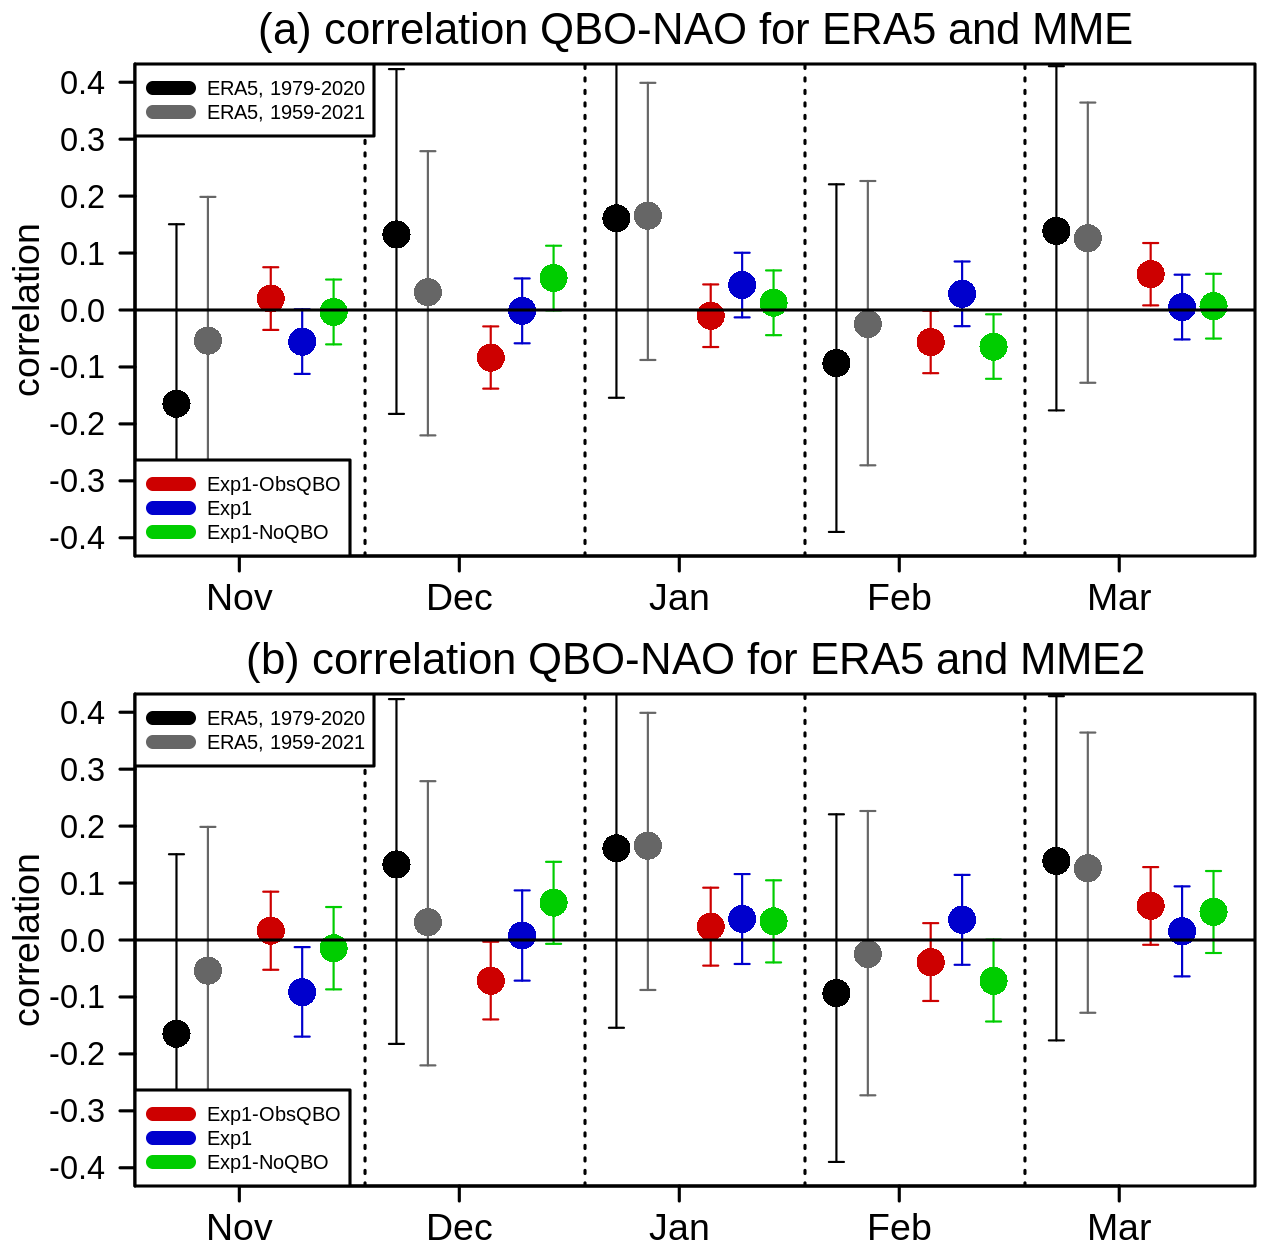
Figure A4Same as Fig. 11 but using a two-station sea level pressure difference NAO index (Ponta Delgado 37.7° N, 25.7° W and Reykjavik 64.1° N, 21.9° W.
The QBOi data archive was kindly hosted by the NERC Centre for Environmental Data Analysis (CEDA), UK. Access can be requested by contacting the QBOi coordinators (https://aparc-climate.org/activities/qboi/, last access: 14 September 2026) and applying via the JASMIN online portal, as described at https://doi.org/10.5281/zenodo.19059510 (Anstey et al., 2026a).
MA, NB, JA, EB, DE, JCF, VK, FP, NT: Conceptualization of the goals and aims of this analysis. Formal analysis of the experiments including investigation and methodology. Visualization of results and writing the manuscript.
MA, KY, ZC, DCH, KH, AJ, YK, JK, PL, FL, YL, HN, JR, FS, SWS, QT, SW, JX: Setting up individual models, running the experiments, and provision of data to the NERC CEDA archive. Reviewing the manuscript.
NB, JA, YK, SO, JR: Project management of QBOi, design of phase 2 experiments and data (diagnostic) request with input from the modellers.
At least one of the (co-)authors is a guest member of the editorial board of Weather and Climate Dynamics for the special issue “Stratospheric impacts on climate variability and predictability in nudging experiments”. The peer-review process was guided by an independent editor, and the authors also have no other competing interests to declare.
Publisher's note: Copernicus Publications remains neutral with regard to jurisdictional claims made in the text, published maps, institutional affiliations, or any other geographical representation in this paper. The authors bear the ultimate responsibility for providing appropriate place names. Views expressed in the text are those of the authors and do not necessarily reflect the views of the publisher.
This article is part of the special issue “Stratospheric impacts on climate variability and predictability in nudging experiments”. It is not associated with a conference.
We acknowledge the scientific guidance of the World Climate Research Programme (WCRP) for helping motivate this work, coordinated under the framework of the Atmospheric Processes and their role in Climate (APARC, formerly Stratosphere-troposphere Processes and their Role in Climate) QBO initiative (QBOi).
We acknowledge the Centre for Environmental Data Analysis (CEDA) for use of the Jasmin analysis platform and group workspace environment.
FS thanks Paolo Davini for support in setting up the simulations of the EC-Earth3 model and acknowledges computing and archive resources provided by an ECMWF Special Project.
MBA, NB, and JK were funded by the Met Office Climate Science for Service Partnership (CSSP) China project under the International Science Partnerships Fund (ISPF).
FMP was supported by the European Union's Horizon Europe research and innovation programme under the Marie Skłodowska-Curie (grant no. 101065820).
HN and KY were supported by JSPS KAKENHI (grant no. JP24K00710).
SO acknowledges funding from the National Environment Research Council CANARI project, and also use of the Monsoon2 system, a collaborative facility supplied under the Joint Weather and Climate Research Programme, a strategic partnership between the Met Office and the Natural Environment Research Council.
ZC was funded by the National Natural Science Foundation of China (grant no. 42405170) and the National Key Research and Development Program of China (grant no. 2024YFF0809003), and was technically supported by the National Large Scientific and Technological Infrastructure–Earth System Numerical Simulation Facility in China (https://cstr.cn/31134.02.EL, last access: 3 September 2026).
YL was supported by the National Natural Science Foundation of China (grant no. 42275056) and the CSSP-China project.
SWS and DH were supported by the National Research Foundation of Korea (NRF) grant funded by the Korea government(MSIT) (grant no. RS-2025-02363044).
QT and JX acknowledge support from the E3SM project, funded by the U.S. Department of Energy (DOE), Office of Science, Office of Biological and Environmental Research (BER) through the Earth System Model Development (ESMD) program area. QT acknowledges grant support from the U.S. DOE BER's Regional and Global Model Analysis (RGMA) program via SCW1813. Lawrence Livermore National Laboratory is operated by Lawrence Livermore National Security, LLC, for the U.S. DOE, National Nuclear Security Administration under Contract DE-AC52-07NA27344.
SW was supported by the MEXT Program for Advanced Studies of Climate Change Projection (SENTAN (grant no. JPMXD0722681344)) and by the Japan Society for the Promotion of Science (JSPS) through a Grant-in-Aid for Scientific Research (grant no. JP22H01303 and JP23K22574). The MIROC6.1 simulations were performed using the Earth Simulator at the Japan Agency for Marine-Earth Science and Technology (JAMSTEC).
This paper was edited by David Battisti and reviewed by Chaim Garfinkel, Thomas Reichler, and Lesley J. Gray.
Adler, R. F., Sapiano, M., Huffman, G. J., Wang, J.-J., Gu, G., Bolvin, D., Chiu, L., Schneider, U., Becker, A., Nelkin, E., Xie, P., Ferraro, R., and Shin, D.-B.: The Global Precipitation Climatology Project (GPCP) Monthly Analysis (Version 2.3) and a Review of 2017 Global Precipitation, Atmosphere, 9, 138, https://doi.org/10.3390/atmos9040138, 2018.
Andrews, D. G., Holton, J. R., and Leovy, C. B.: Middle Atmosphere Dynamics, Academic Press, San Diego, CA, 489 pp., ISBN: 978-0-12-058575-5, 1987.
Andrews, M. B., Knight, J. R., Scaife, A. A., and Wicker, W.: Influence of the Quasi-Biennial Oscillation on tropical convection and its teleconnection to the midlatitudes in boreal winter, Q. J. Roy. Meteor. Soc., 150, 2510–2521, https://doi.org/10.1002/qj.4721, 2024.
Anstey, J. A., Butchart, N., Hamilton, K., and Osprey, S. M.: The SPARC Quasi-Biennial Oscillation initiative, Q. J. Roy. Meteor. Soc., 148, 1455–1458, https://doi.org/10.1002/qj.3820, 2022a.
Anstey, J. A., Simpson, I. R., Richter, J. H., Naoe, H., Taguchi, M., Serva, F., Gray, L. J., Butchart, N., Hamilton, K., Osprey, S., Bellprat, O., Braesicke, P., Bushell, A. C., Cagnazzo, C., Chen, C.-C., Chun, H.-Y., Garcia, R. R., Holt, L., Kawatani, Y., Kerzenmacher, T., Kim, Y.-H., Lott, F., McLandress, C., Scinocca, J., Stockdale, T. N., Versick, S., Watanabe, S., Yoshida, K., and Yukimoto, S.: Teleconnections of the Quasi-Biennial Oscillation in a multi-model ensemble of QBO-resolving models, Q. J. Roy. Meteor. Soc., 148, 1568–1592, https://doi.org/10.1002/qj.4048, 2022b.
Anstey, J., Butchart, N., and Osprey, S.: QBOi Phase-2 Nudging Experiments, Zenodo [data set], https://doi.org/10.5281/zenodo.19059511, 2026a.
Anstey, J. A., Butchart, N., Osprey, S., Kawatani, Y., Hamilton, K., Richter, J. H., Stockdale, T., Andrews, M. B., Chai, Z., Davini, P., Hong, D.-C., Huang, K., Jaison, A. M., Kerzenmacher, T., Knight, J. R., Lin, P., Lott, F., Lu, Y., Naoe, H., Serva, F., Simpson, I., Son, S.-W., Tang, Q., Watanabe, S., Xie, J., and Yoshida, K.: Experiment design, nudging protocol, and models participating in Phase 2 of the APARC Quasi-Biennial Oscillation initiative (QBOi), EGUsphere [preprint], https://doi.org/10.5194/egusphere-2026-1165, 2026b.
Baldwin, M. P. and Dunkerton, T. J.: Stratospheric Harbingers of Anomalous Weather Regimes, Science, 294, 581–584, https://doi.org/10.1126/science.1063315, 2001.
Baldwin, M. P., Gray, L. J., Dunkerton, T. J., Hamilton, K., Haynes, P. H., Randel, W. J., Holton, J. R., Alexander, M. J., Hirota, I., Horinouchi, T., Jones, D. B. A., Kinnersley, J. S., Marquardt, C., Sato, K., and Takahashi, M.: The quasi-biennial oscillation, Rev. Geophys., 39, 179–229, https://doi.org/10.1029/1999RG000073, 2001.
Baldwin, M. P., Ayarzagüena, B., Birner, T., Butchart, N., Butler, A. H., Charlton-Perez, A. J., Domeisen, D. I. V., Garfinkel, C. I., Garny, H., Gerber, E. P., Hegglin, M. I., Langematz, U., and Pedatella, N. M.: Sudden stratospheric warmings, Rev. Geophys., 59, e2020RG000708, https://doi.org/10.1029/2020RG000708, 2021.
Bjerknes, J.: Atmospheric teleconnections from the equatorial Pacific, Mon. Weather Rev., 97, 163–172, https://doi.org/10.1175/1520-0493(1969)097<0163:ATFTEP>2.3.CO;2, 1969.
Boer, G. J. and Hamilton, K.: QBO influence on extratropical predictive skill, Clim. Dynam., 31, 987–1000, https://doi.org/10.1007/s00382-008-0379-5, 2008.
Bushell, A. C., Anstey, J. A., Butchart, N., Kawatani, Y., Osprey, S. M., Richter, J. H., Serva, F., Braesicke, P., Cagnazzo, C., Chen, C.-C., Chun, H.-Y., Garcia, R. R., Gray, L. J., Hamilton, K., Kerzenmacher, T., Kim, Y.-H., Lott, F., McLandress, C., Naoe, H., Scinocca, J., Smith, A. K., Stockdale, T. N., Versick, S., Watanabe, S., Yoshida, K., and Yukimoto, S.: Evaluation of the Quasi-Biennial Oscillation in global climate models for the SPARC QBO initiative, Q. J. Roy. Meteor. Soc., 148, 1459–1489, https://doi.org/10.1002/qj.3765, 2022.
Butchart, N. and Anstey, J. A.: Quasi-Biennial Oscillation, in: Encyclopedia of Atmospheric Sciences, Vol. 4, edited by: Robinson, W. A., Elsevier Academic Press, 536–545, https://doi.org/10.1016/B978-0-323-96026-7.00083-7, 2026.
Butchart, N., Anstey, J. A., Hamilton, K., Osprey, S., McLandress, C., Bushell, A. C., Kawatani, Y., Kim, Y.-H., Lott, F., Scinocca, J., Stockdale, T. N., Andrews, M., Bellprat, O., Braesicke, P., Cagnazzo, C., Chen, C.-C., Chun, H.-Y., Dobrynin, M., Garcia, R. R., Garcia-Serrano, J., Gray, L. J., Holt, L., Kerzenmacher, T., Naoe, H., Pohlmann, H., Richter, J. H., Scaife, A. A., Schenzinger, V., Serva, F., Versick, S., Watanabe, S., Yoshida, K., and Yukimoto, S.: Overview of experiment design and comparison of models participating in phase 1 of the SPARC Quasi-Biennial Oscillation initiative (QBOi), Geosci. Model Dev., 11, 1009–1032, https://doi.org/10.5194/gmd-11-1009-2018, 2018.
Butchart, N., Andrews, M. B., and Jones, C. D.: QBO phase synchronization in CMIP6 historical simulations attributed to ozone forcing, Geophys. Res. Lett., 50, e2023GL104401, https://doi.org/10.1029/2023GL104401, 2023.
Butler, A. H., Charlton-Perez, A., Domeisen, D. I. V., Simpson, I. R., and Sjoberg, J.: Predictability of Northern Hemisphere final stratospheric warmings and their surface impacts, Geophys. Res. Lett., 46, 10578–10588, https://doi.org/10.1029/2019GL083346, 2019.
Butler, A. H. and Gerber, E. P.: Optimizing the definition of a sudden stratospheric warming, J. Climate, 31, 2337–2349, https://doi.org/10.1175/JCLI-D-17-0648.1, 2018.
Cassou, C.: Intraseasonal interaction between the Madden-Julian Oscillation and the North Atlantic Oscillation, Nature, 455, 523–527, https://doi.org/10.1038/nature07286, 2008.
Charlton, A. J. and Polvani, L. M.: A New Look at Stratospheric Sudden Warmings. Part I: Climatology and Modeling Benchmarks, J. Climate, 20, 449–469, https://doi.org/10.1175/JCLI3996.1, 2007.
Choi, W. and Kim, K. Y.: Summertime variability of the western North Pacific subtropical high and its synoptic influences on the East Asian weather, Sci. Rep., 9, 7865, https://doi.org/10.1038/s41598-019-44414-w, 2019.
Domeisen, D. I. V., Garfinkel, C. I., and Butler, A. H.: The teleconnection of El Niño Southern Oscillation to the stratosphere, Rev. Geophys., 57, 5–47, https://doi.org/10.1029/2018RG000596, 2019.
Dunkerton, T. J.: The role of gravity waves in the quasi-biennial oscillation, J. Geophys. Res., 102, 26053–26076, https://doi.org/10.1029/96JD02999, 1997.
Eade, R., Smith, D., Scaife, A., Wallace, E., Dunstone, N., Hermanson, L., and Robinson, N.: Do seasonal-to-decadal climate predictions underestimate the predictability of the real world?, Geophys. Res. Lett., 41, 5620–5628, https://doi.org/10.1002/2014GL061146, 2014.
Ebdon, R. A.: The Quasi-Biennial Oscillation and its association with tropospheric circulation patterns, Meteorol. Mag., 104, 282–297, 1975.
Elsbury, D., Butler, A., Peings, Y., and Magnusdottir, G.: Sensitivity of Easterly QBO's Boreal Winter Teleconnections and Surface Impacts to SSWs, J. Climate, 37, 3675–3688, https://doi.org/10.1175/JCLI-D-23-0395.1, 2024.
Elsbury, D., Serva, F., Caron, J. M., Back, S.-Y., Orbe, C., Richter, J. H., Anstey, J. A., Butchart, N., Chen, C.-C., García-Serrano, J., Glanville, A., Kawatani, Y., Kerzenmacher, T., Lott, F., Naoe, H., Osprey, S., Palmeiro, F. M., Son, S.-W., Taguchi, M., Versick, S., Watanabe, S., and Yoshida, K.: QBOi El Niño Southern Oscillation experiments: assessing relationships between ENSO, MJO, and QBO, Weather Clim. Dynam., 7, 317–339, https://doi.org/10.5194/wcd-7-317-2026, 2026.
García-Franco, J. L., Gray, L. J., Osprey, S., Jaison, A. M., Chadwick, R., and Lin, J.: Understanding the mechanisms for tropical surface impacts of the quasi-biennial oscillation (QBO), J. Geophys. Res.-Atmos., 128, e2023JD038474, https://doi.org/10.1029/2023JD038474, 2023.
García-Franco, J. L., Gray, L. J., Osprey, S., Chadwick, R., and Martin, Z.: The tropical route of quasi-biennial oscillation (QBO) teleconnections in a climate model, Weather Clim. Dynam., 3, 825–844, https://doi.org/10.5194/wcd-3-825-2022, 2022.
Garfinkel, C. I. and Hartmann, D. L.: The Influence of the Quasi-Biennial Oscillation on the Troposphere in Winter in a Hierarchy of Models. Part I: Simplified Dry GCMs, J. Atmos. Sci., 68, 1273–1289, https://doi.org/10.1175/2011JAS3665.1, 2011a.
Garfinkel, C. I. and Hartmann, D. L.: The Influence of the Quasi-Biennial Oscillation on the Troposphere in Winter in a Hierarchy of Models, Part II: Perpetual Winter WACCM Runs, J. Atmos. Sci., 68, 2026–2041, https://doi.org/10.1175/2011JAS3702.1, 2011b.
Garfinkel, C. I., Shaw, T. A., Hartmann, D. L., and Waugh, D. W.: Does the Holton–Tan Mechanism Explain How the Quasi-Biennial Oscillation Modulates the Arctic Polar Vortex?, J. Atmos. Sci., 69, 1713–1733, https://doi.org/10.1175/JAS-D-11-0209.1, 2012.
Garfinkel, C. I., Knight, J., Taguchi, M., Schwartz, C., Cohen, J., Chen, W., Butler, A. H., and Domeisen, D. I. V.: Development of the signal-to-noise paradox in subseasonal forecasting models: When? Where? Why?, Q. J. Roy. Meteor. Soc., 150, 4417–4436, https://doi.org/10.1002/qj.4822, 2024.
Garfinkel, C. I., Avisar, D., Osprey, S., and Smith, D.: The response of the QBO to external forcings: Implications for disruption events, J. Geophys. Res.-Atmos., 130, e2025JD044438, https://doi.org/10.1029/2025JD044438, 2025.
Gray, L. J., Crooks, S., Pascoe, C., Sparrow, S., and Palmer, M.: Solar and QBO influences on the timing of stratospheric sudden warmings, J. Atmos. Sci., 61, 2777–2796, https://doi.org/10.1175/JAS-3297.1, 2004.
Gray, L. J., Anstey, J. A., Kawatani, Y., Lu, H., Osprey, S., and Schenzinger, V.: Surface impacts of the Quasi Biennial Oscillation, Atmos. Chem. Phys., 18, 8227–8247, https://doi.org/10.5194/acp-18-8227-2018, 2018.
Hersbach, H., Bell, B., Berrisford, P., Hirahara, S., Horányi, A., Muñoz-Sabater, J., Nicolas, J., Peubey, C., Radu, R., Schepers, D., Simmons, A., Soci, C., Abdalla, S., Abellan, X., Balsamo, G., Bechtold, P., Biavati, G., Bidlot, J., Bonavita, M., De Chiara, G., Dahlgren, P., Dee, D., Diamantakis, M., Dragani, R., Flemming, J., Forbes, R., Fuentes, M., Geer, A., Haimberger, L., Healy, S., Hogan, R. J., Hólm, E., Janisková, M., Keeley, S., Laloyaux, P., Lopez, P., Lupu, C., Radnoti, G., de Rosnay, P., Rozum, I., Vamborg, F., Villaume, S., and Thépaut, J.-N.: The ERA5 global reanalysis, Q. J. Roy. Meteor. Soc., 146, 1999–2049, https://doi.org/10.1002/qj.3803, 2020.
Hitchcock, P., Butler, A., Charlton-Perez, A., Garfinkel, C. I., Stockdale, T., Anstey, J., Mitchell, D., Domeisen, D. I. V., Wu, T., Lu, Y., Mastrangelo, D., Malguzzi, P., Lin, H., Muncaster, R., Merryfield, B., Sigmond, M., Xiang, B., Jia, L., Hyun, Y.-K., Oh, J., Specq, D., Simpson, I. R., Richter, J. H., Barton, C., Knight, J., Lim, E.-P., and Hendon, H.: Stratospheric Nudging And Predictable Surface Impacts (SNAPSI): a protocol for investigating the role of stratospheric polar vortex disturbances in subseasonal to seasonal forecasts, Geosci. Model Dev., 15, 5073–5092, https://doi.org/10.5194/gmd-15-5073-2022, 2022.
Hitchman, M. H., Yoden, S., Haynes, P. H., Kumar, V., and Tegtmeier, S.: An observational history of the direct influence of the stratospheric quasi-biennial oscillation on the tropical and subtropical upper troposphere and lower stratosphere, J. Meteorol. Soc. Jpn., 99, 239–267, https://doi.org/10.2151/jmsj.2021-012, 2021.
Holt, L. A., Lott, F., Garcia, R. R., Kiladis, G. N., Cheng, Y.-M., Anstey, J. A., Braesicke, P., Bushell, A. C., Butchart, N., Cagnazzo, C., Chen, C.-C., Chun, H.-Y., Kawatani, Y., Kerzenmacher, T., Kim, Y.-H., McLandress, C., Naoe, H., Osprey, S., Richter, J. H., Scaife, A. A., Scinocca, J., Serva, F., Versick, S., Watanabe, S., Yoshida, K., and Yukimoto, S.: An evaluation of tropical waves and wave forcing of the QBO in the QBOi models, Q. J. Roy. Meteor. Soc., 148, 1541–1567, https://doi.org/10.1002/qj.3827, 2022.
Holton, J. R. and Lindzen, R. S.: An Updated Theory for the Quasi-Biennial Cycle of the Tropical Stratosphere, J. Atmos. Sci., 29, 1076–1080, https://doi.org/10.1175/1520-0469(1972)029<1076:AUTFTQ>2.0.CO;2, 1972.
Holton, J. and Tan, H.: The Influence of the Equatorial Quasi-Biennial Oscillation on the Global Circulation at 50 mb, J. Atmos. Sci., 37, 2200–2208, https://doi.org/10.1175/1520-0469(1980)037<2200:TIOTEQ>2.0.CO;2, 1980.
Holton, J. and Tan, H.: The Quasi-Biennial Oscillation in the Northern Hemisphere Lower Stratosphere, J. Meteorol. Soc. Jpn., 60, 140–148, https://doi.org/10.2151/jmsj1965.60.1_140, 1982.
Hu, J., Ren, R., and Xu, H.: Occurrence of winter stratospheric sudden warming events and the seasonal timing of spring stratospheric final warming, J. Atmos. Sci., 71, 2319–2334, https://doi.org/10.1175/JAS-D-13-0349.1, 2014.
Hunt, K. M. R. and Zaz, S. N.: Linking the North Atlantic Oscillation to winter precipitation over the Western Himalaya through disturbances of the subtropical jet, Clim. Dyn., 60, 2389–2403, https://doi.org/10.1007/s00382-022-06450-7, 2023.
Hurrell, J. W., Kushnir, Y., Ottersen, G., and Visbeck, M.: The North Atlantic Oscillation: Climate significance and environmental impact, Geoph. Monog. Series, 134, 1–36, https://doi.org/10.1029/134GM01, 2003.
Karami, K., Garcia, R., Jacobi, C., Richter, J. H., and Tilmes, S.: The Holton–Tan mechanism under stratospheric aerosol intervention, Atmos. Chem. Phys., 23, 3799–3818, https://doi.org/10.5194/acp-23-3799-2023, 2023.
Kawatani, Y., Watanabe, S., Sato, K., Dunkerton, T. J., Miyahara, S., and Takahashi, M.: The Roles of Equatorial Trapped Waves and Internal Inertia-Gravity Waves in Driving the Quasi-Biennial Oscillation. Part I: Zonal Mean Wave Forcing, J. Atmos. Sci., 67, 963–980, https://doi.org/10.1175/2009JAS3222.1, 2010.
Kawatani, Y., Hamilton, K., Watanabe, S., Taguchi, M., Serva, F., Anstey, J. A., Richter, J. H., Butchart, N., Orbe, C., Osprey, S. M., Naoe, H., Elsbury, D., Chen, C.-C., García-Serrano, J., Glanville, A., Kerzenmacher, T., Lott, F., Palmeiro, F. M., Park, M., Versick, S., and Yoshida, K.: QBOi El Niño–Southern Oscillation experiments: overview of the experimental design and ENSO modulation of the QBO, Weather Clim. Dynam., 6, 1045–1073, https://doi.org/10.5194/wcd-6-1045-2025, 2025.
Kidston, J., Scaife, A. A., Hardiman, S. C., Mitchell, D. M., Butchart, N., Baldwin, M. P., and Gray, L. J.: Stratospheric influence on tropospheric jet streams, storm tracks and surface weather, Nat. Geosci., 8, 433–440, https://doi.org/10.1038/NGEO2424, 2015.
Kumar, V., Yoden, S., and Hitchman, M. H.: QBO and ENSO effects on the mean meridional circulation, polar vortex, subtropical westerly jets, and wave patterns during boreal winter, J. Geophys. Res.-Atmos., 127, e2022JD036691, https://doi.org/10.1029/2022JD036691, 2022.
Kumar, V., Hitchman, M. H., Du, W., Dhaka, S. K., and Yoden, S.: Teleconnection of the Quasi-Biennial Oscillation with boreal winter surface climate in Eurasia and North America, Communications Earth & Environment, 5, 251, https://doi.org/10.1038/s43247-024-01422-7, 2024.
Labitzke, K.: On the interannual variability of the middle stratosphere during the northern winters, J. Meteorol. Soc. Jpn., 60, 124–139, https://doi.org/10.2151/jmsj1965.60.1_124, 1982.
Lee, R. W., Woolnough, S. J., Charlton-Perez, A. J., and Vitart, F.: ENSO modulation of MJO teleconnections to the North Atlantic and Europe, Geophys. Res. Lett., 46, 13535–13545, https://doi.org/10.1029/2019GL084683, 2019.
Lee, S. S., Seo, Y. W., Ha, K. J., and Jhun, J. G.: Impact of the western North Pacific subtropical high on the East Asian monsoon precipitation and the Indian Ocean precipitation in the boreal summertime, Asia-Pac. J. Atmos. Sci., 49, 171–182, https://doi.org/10.1007/s13143-013-0018-x, 2013.
Lindzen, R. S. and Holton, J. R.: A Theory of the Quasi-Biennial Oscillation, J. Atmos. Sci., 25, 1095–1107, https://doi.org/10.1175/1520-0469(1968)025<1095:ATOTQB>2.0.CO;2, 1968.
Lu, H., Bracegirdle, T. J., Phillips, T., Bushell, A., and Gray, L. J.: Mechanisms for the Holton–Tan relationship and its decadal variation, J. Geophys. Res.-Atmos., 119, 2811–2830, https://doi.org/10.1002/2013JD021352, 2014.
Lu, H., Hitchman, M. H., Gray, L. J., Anstey, J. A., and Osprey, S. M.: On the role of Rossby wave breaking in the quasi-biennial modulation of the stratospheric polar vortex during boreal winter, Q. J. Roy. Meteor. Soc., 146, 1939–1959, https://doi.org/10.1002/qj.3775, 2020.
Madden, R. A. and Julian, P. R.: Observations of the 40–50-Day Tropical Oscillation: A Review, Mon. Weather Rev., 122, 814–837, https://doi.org/10.1175/1520-0493(1994)122<0814:OOTDTO>2.0.CO;2, 1994.
Naoe, H., García-Franco, J. L., Park, C.-H., Rodrigo, M., Palmeiro, F. M., Serva, F., Taguchi, M., Yoshida, K., Anstey, J. A., García-Serrano, J., Son, S.-W., Kawatani, Y., Butchart, N., Hamilton, K., Chen, C.-C., Glanville, A., Kerzenmacher, T., Lott, F., Orbe, C., Osprey, S., Park, M., Richter, J. H., Versick, S., and Watanabe, S.: QBOi El Niño–Southern Oscillation experiments: teleconnections of the QBO, Weather Clim. Dynam., 6, 1419–1442, https://doi.org/10.5194/wcd-6-1419-2025, 2025.
O'Reilly, C. H., Weisheimer, A., Woollings, T., Gray, L. J., and MacLeod, D.: The importance of stratospheric initial conditions for winter North Atlantic Oscillation predictability and implications for the signal-to-noise paradox, Q. J. Roy. Meteor. Soc., 145, 131–146, https://doi.org/10.1002/qj.3413, 2019.
Palmeiro, F. M., Barriopedro, D., García-Herrera, R., and Calvo, N.: Comparing Sudden Stratospheric Warming Definitions in Reanalysis Data, J. Climate, 28, 6823–6840, https://doi.org/10.1175/JCLI-D-15-0004.1, 2015.
Palmeiro, F. M., Iza, M., Barriopedro, D., Calvo, N., and García-Herrera, R.: The complex behavior of El Niño winter 2015–2016, Geophys. Res. Lett., 44, 2902–2910, https://doi.org/10.1002/2017GL072920, 2017.
Park, C.-H., Son, S.-W., Lim, Y., and Choi, J.: Quasi-biennial oscillation-related surface air temperature change over the western North Pacific in late winter, Int. J. Climatol., 42, 4351–4359, https://doi.org/10.1002/joc.7470, 2022.
Plumb, R. A. and Bell, R. C.: A model of the quasi-biennial oscillation on an equatorial beta-plane, Q. J. Roy. Meteor. Soc., 108, 335–352, https://doi.org/10.1002/qj.49710845604, 1982.
Rao, J., Garfinkel, C. I., and White, I. P.: Impact of the Quasi-Biennial Oscillation on the Northern Winter Stratospheric Polar Vortex in CMIP5/6 Models, J. Climate, 33, 4787–4813, https://doi.org/10.1175/JCLI-D-19-0663.1, 2020.
Rao, J., Garfinkel, C. I., and White, I. P.: Development of the Extratropical Response to the Stratospheric Quasi-Biennial Oscillation, J. Climate, 34, 7239–7255, https://doi.org/10.1175/JCLI-D-20-0960.1, 2021.
Reed, R. J., Campbell, W. J., Rasmussen, L. A., and Rogers, D. G.: Evidence of a downward-propagating annual wind reversal in the equatorial stratosphere, J. Geophys. Res., 66, 813–818, https://doi.org/10.1029/JZ066i003p00813, 1961.
Richter, J. H., Butchart, N., Kawatani, Y., Bushell, A. C., Holt, L., Serva, F., Anstey, J. A., Simpson, I. R., Osprey, S., Hamilton, K., Braesicke, P., Cagnazzo, C., Chen, C.-C., Garcia, R. R., Gray, L. J., Kerzenmacher, T., Lott, F., McLandress, C., Naoe, H., Scinocca, J., Stockdale, T. N., Versick, S., Watanabe, S., Yoshida, K., and Yukimoto, S.: Response of the Quasi-Biennial Oscillation to a warming climate in global climate models, Q. J. Roy. Meteor. Soc., 148, 1490–1518, https://doi.org/10.1002/qj.3749, 2022.
Scaife, A. A., Athanassiadou, M., Andrews, M., Arribas, A., Baldwin, M., Dunstone, N., Knight, J., MacLachlan, C., Manzini, E., Müller, W. A., Pohlmann, H., Smith, D., Stockdale, T., and Williams, A.: Predictability of the quasi-biennial oscillation and its northern winter teleconnection on seasonal to decadal timescales, Geophys. Res. Lett., 41, 1752–1758, https://doi.org/10.1002/2013GL059160, 2014.
Scherhag, R.: Die explosionsartige Stratosphärenerwärmung des Spätwinters 1951/52, Ber. Dtsch. Wetterd., 38, 51–63, 1952.
Seo, J., Choi, W., Youn, D., Park, D.-S. R. and Kim, J. Y.: Relationship between the Stratospheric Quasi-Biennial Oscillation and the Spring Rainfall in the Western North Pacific, Geophys. Res. Lett., 40, 5949–5953, https://doi.org/10.1002/2013GL058266, 2013.
Serva, F., Anstey, J. A., Bushell, A. C., Butchart, N., Cagnazzo, C., Gray, L. J., Kawatani, Y., Osprey, S. M., Richter, J. H., and Simpson, I. R.: The impact of the QBO on the region of the tropical tropopause in QBOi models: Present-day simulations, Q. J. Roy. Meteor. Soc., 148, 1945–1964, https://doi.org/10.1002/qj.4287, 2022.
Stockdale, T. N., Kim, Y.-H., Anstey, J. A., Palmeiro, F. M., Butchart, N., Scaife, A. A., Andrews, M., Bushell, A. C., Dobrynin, M., Garcia-Serrano, J., Hamilton, K., Kawatani, Y., Lott, F., McLandress, C., Naoe, H., Osprey, S., Pohlmann, H., Scinocca, J., Watanabe, S., Yoshida, K., and Yukimoto, S.: Prediction of the quasi-biennial oscillation with a multi-model ensemble of QBO-resolving models, Q. J. Roy. Meteor. Soc., 148, 1519–1540, https://doi.org/10.1002/qj.3919, 2022.
Taylor, K. E., Stouffer, R. J., and Meehl, G. A.: An Overview of CMIP5 and the Experiment Design, B. Am. Meteorol. Soc., 93, 485–498, https://doi.org/10.1175/BAMS-D-11-00094.1, 2012.
Thiéblemont, R., Ayarzagüena, B., Matthes, K., Bekki, S., Abalichin, J., and Langematz, U.: Drivers and surface signal of interannual variability of boreal stratospheric final warmings, J. Geophys. Res.-Atmos., 124, 5400–5417, https://doi.org/10.1029/2018JD029852, 2019.
Thompson, D. W. J. and Wallace, J. M.: Regional climate impacts of the Northern Hemisphere annular mode, Science, 293, 85–89, https://doi.org/10.1126/science.1058958, 2001.
Trenberth, K. E.: The definition of El Niño, B. Am. Meteorol. Soc., 78, 2771–2777, https://doi.org/10.1175/1520-0477(1997)078<2771:TDOENO>2.0.CO;2, 1997.
Veryard, R. G. and Ebdon, R. A.: Fluctuations in Tropical Stratospheric Winds, Meteorol. Mag., 90, 125–143, 1961.
Wan, T., Wang, L., Son, S.-W., Lu, Y., Shen, X., and Park, C.-H.: The Arctic Oscillation response to the QBO in an EOF-based QBO phase space, J. Meteorol. Res., 39, 933–944, https://doi.org/10.1007/s13351-025-5026-0, 2025.
Yamazaki, K., Nakamura, T., Ukita, J., and Hoshi, K.: A tropospheric pathway of the stratospheric quasi-biennial oscillation (QBO) impact on the boreal winter polar vortex, Atmos. Chem. Phys., 20, 5111–5127, https://doi.org/10.5194/acp-20-5111-2020, 2020.
Yoden, S., Kumar, V., Dhaka, S. K., and Hitchman, M. H.: Global monsoon systems and their modulation by the equatorial Quasi-Biennial Oscillation, Mausam, 74, 239–252, https://doi.org/10.54302/mausam.v74i2.5948, 2023.
- Abstract
- Copyright statement
- Introduction
- Experiments, Models and Methods
- QBO influence on the strength of the boreal winter stratospheric polar vortex
- QBO influence on the frequency and timing of SSWs
- QBO influence on the NAO
- QBO influence on the North Pacific STJ and Precipitation
- Conclusions
- Appendix A
- Data availability
- Author contributions
- Competing interests
- Disclaimer
- Special issue statement
- Acknowledgements
- Financial support
- Review statement
- References
- Abstract
- Copyright statement
- Introduction
- Experiments, Models and Methods
- QBO influence on the strength of the boreal winter stratospheric polar vortex
- QBO influence on the frequency and timing of SSWs
- QBO influence on the NAO
- QBO influence on the North Pacific STJ and Precipitation
- Conclusions
- Appendix A
- Data availability
- Author contributions
- Competing interests
- Disclaimer
- Special issue statement
- Acknowledgements
- Financial support
- Review statement
- References