
the Creative Commons Attribution 4.0 License.
the Creative Commons Attribution 4.0 License.
 | 28 Sep 2026
Dynamics of the Asian Summer Monsoon Anticyclone: insights from potential vorticity tendency diagnostics
Ninghui Li
Jonathon S. Wright

Philip Rupp
Alison Ming
Shenglong Zhang
Jie Gao
The Asian Summer Monsoon Anticyclone (ASMA), the dominant circulation in the upper troposphere and lower stratosphere (UTLS) during the boreal summer, undergoes pronounced spatio-temporal variability. While the climatological mean state of the ASMA is well documented, the mechanisms governing its longitudinal propagation, episodic eddy shedding events, and multimodal transient behavior remain incompletely understood. In this study, we investigate the dynamic behavior of the ASMA using the reanalysis products JRA-3Q, ERA5, and MERRA-2 during 2000–2020. The ASMA is primarily trimodal, with core centers situated over the Iranian Plateau, the Tibetan Plateau, and the Western Pacific in all three reanalyses. To identify and analyze the evolution of individual anticyclonic features, we apply a multi-center vortex tracking algorithm to Montgomery stream function on the 370 K isentropic surface. Although potential vorticity (PV) tendencies are dominated by mean zonal and meridional advection, total diabatic heating plays a critical modulating role in the evolution of anticyclonic vortices within the ASMA. For further insight, we develop and apply an ASMA-specific PV tendency diagnostic that decomposes the total PV tendency into dynamical (isentropic horizontal advection) and diabatic (latent heating and background radiation) components. The diagnostic highlights a characteristic tripole pattern of PV tendency within vortices, separating propagation effects from intensification and thereby providing a clearer physical attribution of the evolution of vortices within the ASMA.
- Article
(11840 KB) - Full-text XML
-
Supplement
(1554 KB) - BibTeX
- EndNote


The Asian Summer Monsoon Anticyclone (ASMA) is a defining feature of the upper troposphere and lower stratosphere (UTLS) during the boreal summer. Bounded by the subtropical westerly jet to the north and the tropical easterly jet to the south, the ASMA straddles the boundary between the tropics and subtropics between ∼ 300 and 70 hPa (Hsu et al., 1999; Randel and Park, 2006; Nützel et al., 2016; Manney et al., 2021). The ASMA is driven primarily by diabatic heating associated with the Asian Summer Monsoon (Hoskins and Rodwell, 1995). Strong land–sea thermal contrasts and abundant moisture south of the Himalayas induce low-level convergence over South Asia, promoting ascent and deep convection, particularly along the southern slope of the Tibetan Plateau (Fu et al., 2006; Qie et al., 2014). The strong diabatic heating associated with this convection imposes upper-tropospheric divergence, causing the formation and maintenance of the large-scale anticyclonic circulation at upper levels (Garny and Randel, 2013; Siu and Bowman, 2020). At the peak of the monsoon, warm anomalies in the monsoon upper troposphere are large enough to cause a regional reversal of the meridional temperature gradient between the equator and the core of the anticyclone, yielding a broad region of angular momentum-conserving flow defined by small values of potential vorticity. Water vapor and pollutants accumulate within the boundaries of this flow and interact with the circulation to modulate its structure and variability (Vernier et al., 2015; Santee et al., 2017; Bian et al., 2020; Honomichl and Pan, 2020). Despite this well-established conceptual framework, the mechanisms governing the intraseasonal and interannual variability of the ASMA, which emerge from fluctuations in heating and subtropical jet dynamics among other processes, remain a subject of active scientific inquiry (Garny and Randel, 2013; Ren et al., 2019; Manney et al., 2021; Rupp and Haynes, 2021).
Various diagnostic approaches have been developed to characterize the spatial extent, location, and modality of the ASMA. The breadth of these approaches reflects both the dynamical complexity of the ASMA and its importance, as well as changes in data availability, such as the development of long-term reanalysis products. Observational studies demonstrate that the ASMA exhibits significant temporal variability, including large-amplitude east–west oscillations and systematic vortex propagation on intraseasonal timescales (Zhang et al., 2002; Nützel et al., 2016). Rather than a single, broad, coherent vortex, the circulation frequently reorganizes, with centers of intensity alternating between the Iranian Plateau (IP), the Tibetan Plateau (TP), and the Western Pacific. These zonal shifts are often accompanied by structural instability, resulting in vortex splitting and merging, as well as episodic eddy shedding events wherein subsidiary anticyclonic vortices break off from the primary circulation (Popovic and Plumb, 2001; Yan et al., 2018; Siu and Bowman, 2020). Previous research has employed a wide range of metrics to track these movements and describe the time-mean circulation in which they are embedded. Common metrics include geopotential height and zonal wind fields at the 100 or 200 hPa levels (Zhang et al., 2002; Qian et al., 2002; Wei et al., 2014; Nützel et al., 2016; Wang et al., 2022), potential vorticity (PV) on isentropic surfaces between 360 and 380 K (Garny and Randel, 2013; Ploeger et al., 2015; Amemiya and Sato, 2018; Rupp and Haynes, 2020), and Montgomery stream function (MSF) on isentropic surfaces (Santee et al., 2017; Manney et al., 2021). Numerical simulations and idealized experiments have also provided considerable insight into the roles of both internal variability and anthropogenic forcing in shaping the anticyclonic structure (Popovic and Plumb, 2001; Amemiya, 2018; Amemiya and Sato, 2018; Rupp and Haynes, 2020; Tweedy et al., 2021; Pan et al., 2022). A summary of common diagnostics is provided in Table 1. However, despite these extensive efforts, substantial challenges remain. ASMA characteristics often vary across different reanalysis products, and changes in assimilated observations can exacerbate these discrepancies (Nützel et al., 2016; Manney et al., 2021). Furthermore, the frequent coexistence of two, three, or more concurrent circulation centers suggests that approaches emphasizing a single dominant vortex or a time-mean structure are unable to fully describe the dynamic anticyclone (Zhang et al., 2002; Siu and Bowman, 2020; Rupp and Haynes, 2021). This limitation highlights the need for new diagnostic frameworks that can explicitly account for the multi-center and multimodal nature of the ASMA.
Zhou et al. (2006)Zhang et al. (2002)Qian et al. (2002)Yan et al. (2011)Nützel et al. (2016)Wei et al. (2014)Honomichl and Pan (2020)Zarrin et al. (2010)Garny and Randel (2013)Fairlie et al. (2014)Amemiya and Sato (2018)Ploeger et al. (2015)Popovic and Plumb (2001)Siu and Bowman (2020)Santee et al. (2017)Manney et al. (2021)Kachula et al. (2025)Table 1Overview of methods used to determine the locations of the ASMA based on geopotential (Φ), zonal wind (u), and relative vorticity (ζ) on pressure surfaces and potential vorticity (PV) and Montgomery stream function (MSF) on isentropic surfaces.
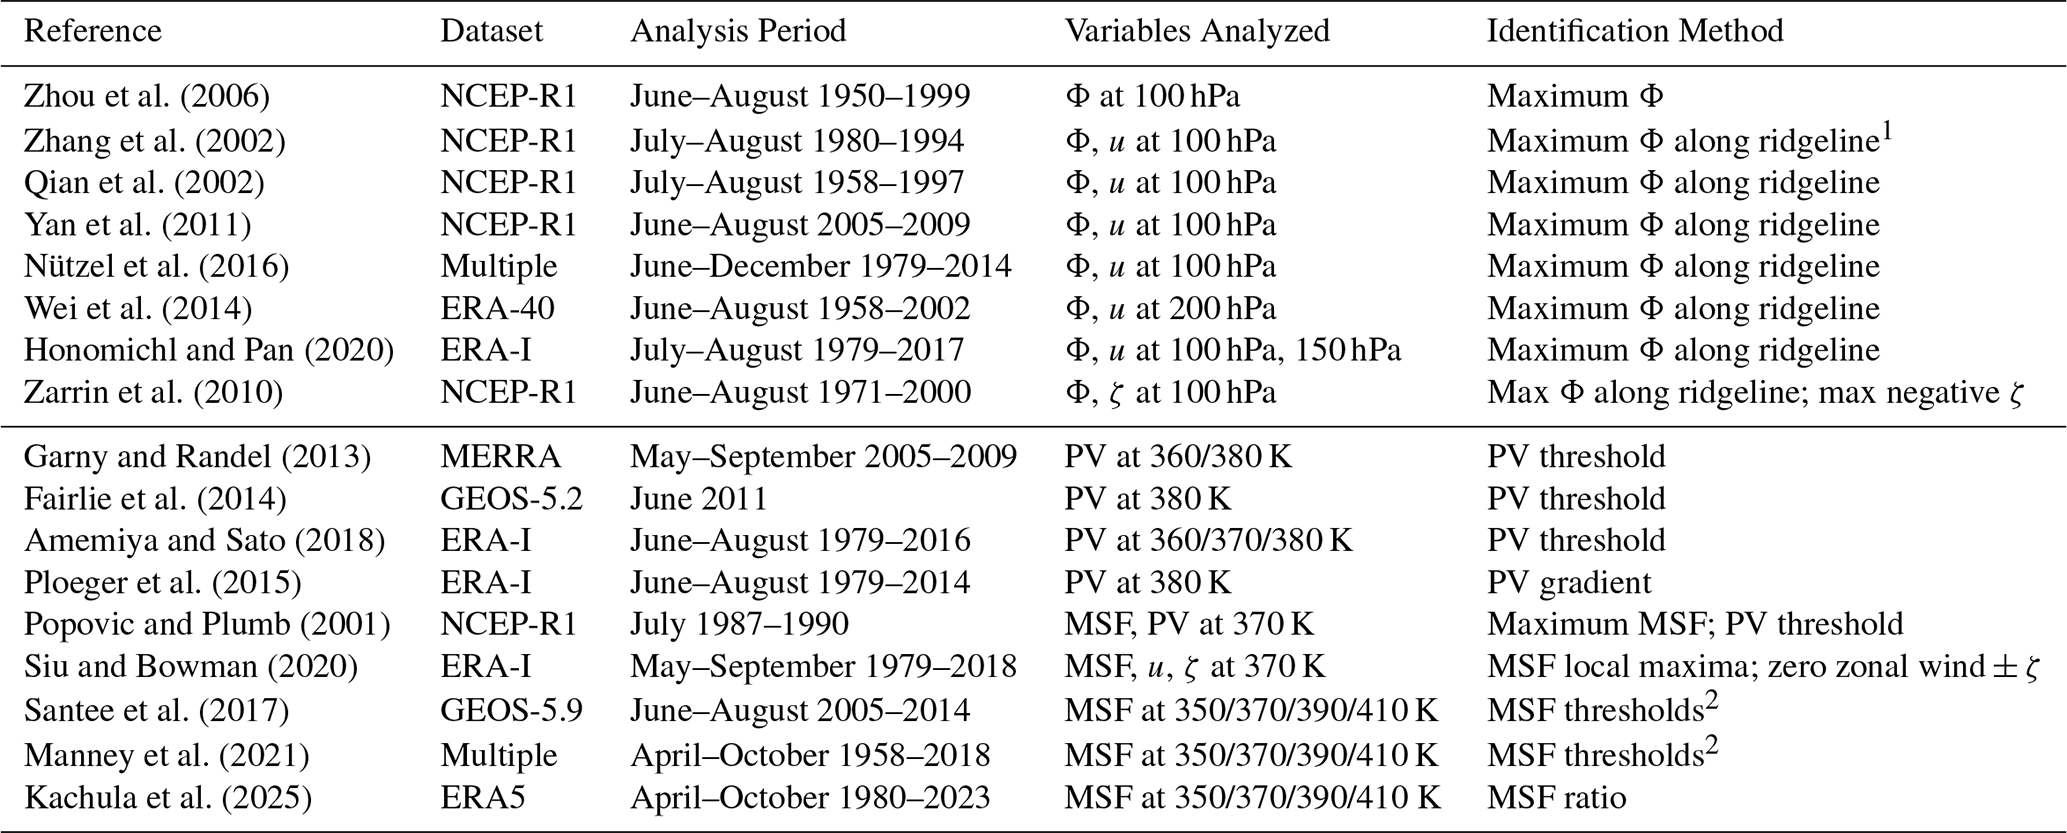
1 Ridgeline is defined as the zero contour in zonal wind.
2 MSF threshold values: 350 K: 344800 m2 s−2; 370 K: 356500 m2 s−2; 390 K: 367100 m2 s−2; 410 K: 377300 m2 s−2.
The development and intensification of the ASMA are frequently evaluated using diagnostics that characterize the evolution of its low-potential vorticity (PV) core (Ploeger et al., 2015). One common metric is the area enclosed by low-PV contours, as the ascending motion, diabatic heating, and upper-level divergence associated with deep convection dilute PV and thus expand the area of low-PV regions within the UTLS (Garny and Randel, 2013). Complementary diagnostics, such as geopotential height anomalies relative to the zonal mean and Montgomery stream function, have also proven effective in capturing key aspects of the ASMA (Xue et al., 2020; Manney et al., 2021; Zhang et al., 2021). However, these diagnostics face significant limitations when applied to the ASMA. PV is already relatively low over the Asian monsoon region at the beginning of boreal summer, and the seasonal evolution of the background state is marked by a gradual increase in mean PV. This evolving background complicates efforts to disentangle ASMA intensification from inherited pre-existing conditions. Furthermore, while PV-area diagnostics are conceptually derived from studies of the stratospheric polar vortex, the underlying physical drivers are considerably different. In the polar vortex, diabatic cooling and transport barriers are the primary determinants of structure, while the ASMA is governed by deep convection, divergent outflow, and complex interactions with the subtropical jet. These differences limit the direct transferability of polar vortex diagnostics to the monsoon system. Consequently, there is a need for a diagnostic framework that can isolate ASMA intensification from zonal propagation and background PV evolution, while providing a robust description of the multi-center dynamic structure of the anticyclone. Addressing this requirement requires diagnostics that quantify not only the magnitude and distribution of low-PV anomalies but also the specific physical processes driving their evolution in time.
In this study, we track the movement and occurrence of vortex centers within the anticyclone following the methodology of Siu and Bowman (2020), with a specific focus on intercomparison across multiple recent reanalysis products and with respect to both persistent and transient vortices. We further introduce a PV tendency diagnostic that quantifies ASMA intensification and provides deeper insight into the physical mechanisms governing its zonal propagation and overall structural development. The remainder of this paper is organized as follows. We describe the datasets in Sect. 2 and the isentropic vortex tracking methodology and the formulation of the PV tendency equation in Sect. 3. We then present the findings in Sect. 4, followed by a discussion in Sect. 5 and a summary of the key conclusions in Sect. 6.
In this study, we analyze variations of the ASMA in three of the most recent “full input” reanalysis products (Fujiwara et al., 2017): the European Centre for Medium-Range Weather Forecasts (ECMWF) Fifth Reanalysis of the Atmosphere (ERA5; Hersbach et al., 2020); the Modern-Era Retrospective Analysis for Research and Applications, Version 2 (MERRA-2; Gelaro et al., 2017), and the Japanese Reanalysis for Three Quarters of a Century (JRA-3Q; Kosaka et al., 2024). Our study covers the warm seasons of the Northern Hemisphere (May to September) during 2000–2020. All reanalysis products are interpolated to a common 1.25° × 1.25° latitude-longitude grid and subsampled in time to produce 6-hourly fields. Analyses are performed on the 100 hPa isobaric level and the 370 K isentropic surface. Key details of the reanalysis products are listed in Table 2. TL639/TL479 denote triangular linear spectral truncation, where the number is the maximum total spherical harmonic wavenumber retained in the global spectral model, corresponding to an approximate horizontal grid spacing.
Hersbach et al. (2020)Gelaro et al. (2017)Kosaka et al. (2024)Table 2Details of the three reanalysis products used in this work. All products are interpolated to a common 1.25° × 1.25° latitude–longitude grid and subsampled to 6-hourly frequency.

In addition to standard products such as temperatures and winds, we use the physical temperature tendencies from each reanalysis. These tendencies include heating due to radiative flux convergence, cloud physics and convection, turbulent mixing, and other parameterized processes affecting temperature, such as gravity wave drag. The decomposition of these terms differs across the reanalyses. For example, ERA5 provides temperature tendencies due to all parameterized physics (mttpm) along with shortwave (mttswr) and longwave (mttlwr) radiative heating. Non-radiative heating, calculated as mttpm − (mttswr + mttlwr), provides a close approximation to deep convective heating in the monsoon UTLS (Tegtmeier et al., 2022), with temperature tendencies due to other non-radiative processes roughly 2 orders of magnitude smaller than those due to convection in the upper troposphere (Wright and Fueglistaler, 2013). MERRA-2 provides a more complete breakdown, including terms due to radiative heating (DTDTRAD), moist physics (DTDTMST), gravity wave drag (DTDTGWD), turbulent mixing (DTDTTRB), and data assimilation (DTDTANA). For the following analysis, we use DTDTRAD to represent radiative heating and DTDTMST to represent latent heating. For JRA-3Q, radiative heating is calculated as the sum of longwave (ttlwr) and shortwave (ttswr) components, while latent is calculated as the sum of convective heating (cnvhr) and large-scale moist physics (lrghr), leaving out turbulent mixing (vdfhr). We adopt this approach both to provide a more complete accounting of how different physical processes contribute to PV tendencies across these three reanalyses, and to more precisely identify the influences of vertical gradients in diabatic heating on PV. Calculations of apparent heating (often termed Q1) as a residual of the thermodynamic equation are especially uncertain in these regions, where numerical errors and the inability to fully represent resolved transport lead to large errors even in climatological budgets (Martineau et al., 2018; Wright et al., 2025).
3.1 Vortex Tracking
The multi-center tracking algorithm employed in this study follows the approach of Siu and Bowman (2020), which builds upon the single-vortex detection method of Zhang et al. (2002). To locate centers of the ASMA, we use three variables taken directly or computed from reanalysis datasets: zonal wind (u), Montgomery stream function (MSF = cpT + Φ, where T is temperature, Φ is geopotential, and cp is the specific heat at constant pressure), and relative vorticity (ζ).
The first step involves identifying the zonal-wind ridgeline (u = 0) within the designated spatial domain (15–45° N, 0–180° E) at each 6-hourly analysis snapshot. This approach is motivated by the observation that the zero-zonal wind contour is nearly zonal within the ASMA (Nützel et al., 2016; Siu and Bowman, 2020). We apply a marching squares algorithm to identify the u = 0 isopleth, which systematically partitions the wind field into grid cells (squares) and employs a divide-and-conquer strategy to determine the exact intersection points where the flow transitions from easterly to westerly (Lorensen, 2020).
A schematic illustration of the method used to identify vortex centers is provided in Fig. 1. Each potential anticyclonic vortex center corresponds to a local maximum in MSF along the u = 0 contour (bold black line). Because the u = 0 isopleths do not align perfectly with the discrete reanalysis grid, the location of the contour and the values of MSF along it are determined using linear interpolation between the two nearest grid points in the meridional direction. For instance, the value of MSF at the blue open circle would be linearly interpolated from the adjacent poleward and equatorward grid points (the closest red dot and the blue dot, respectively). MSF values along the contour are treated as a function of path distance si, computed as the cumulative great-circle arc length from a reference point on the contour. Local maxima of MSF along the ridgeline are required to be unique within a span of length 2Δs around si (si ± Δs), where Δs is a half-angle search window. Following Siu and Bowman (2020), we set the central angle of the great-circle arc to Δa = = 7.5°, where Re is the average radius of the Earth. The distance Δs thus also defines the minimum allowable separation between adjacent peaks (candidate vortex centers) along the ridgeline. To exclude “spurious centers” arising from small-scale noise or localized features, we apply three filtering criteria:
-
Vorticity sign. The relative vorticity ζ at the identified center and its four nearest grid points (blue crosses) must be anticyclonic (i.e. ζ < 0 in the Northern Hemisphere).
-
Zonal wind direction. The three grid points immediately poleward of the center must be characterized by westerly flow (u > 0), while the three points equatorward must be characterized by easterly flow (u < 0).
-
Contour length. The corresponding u = 0 contour must occupy a minimum great-circle arc length greater than 2RΔa (Siu and Bowman, 2020).
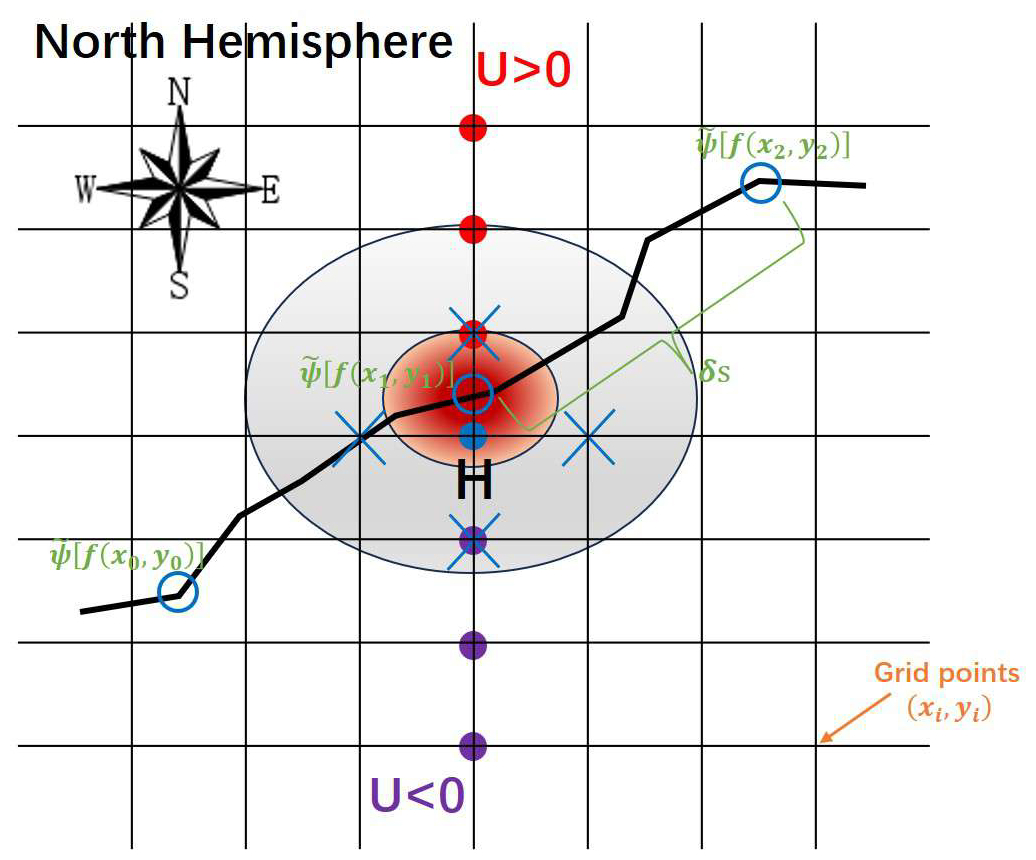
Figure 1Schematic illustration of the method used to identify vortex centers and filter out spurious centers. The candidate vortex center, which marks a local maximum in Montgomery stream function (MSF) along the u = 0 ridgeline, is represented by the open blue circle co-located with the maximum MSF, while the reanalysis grid point closest to the candidate centre is indicated by a filled blue circle. The four reanalysis grid points directly adjacent to this closest point are indicated by blue crosses. The black solid line illustrates the u = 0 contour, the gray ellipse illustrates the area of the anticyclonic vortex, and the shaded coral ellipse illustrates the core of the anticyclonic vortex. In the Northern Hemisphere, we require relative vorticity ζ < 0 at the central five points (blue filled circle and blue crosses), westerly wind anomalies at the three grid points located poleward of the central point (red filled circles), and easterly wind anomalies at the three grid points equatorward of the central point (purple filled circles). Adapted from Fig. 5 of Siu and Bowman (2020).
The final step in the algorithm is to track the movement and duration of each vortex center over time. To do this, we repeat the same vortex-tracking analysis at 6-hourly intervals. A vortex is classified as “persistent” (long-lasting) if two conditions are met. First, the vortex center must move no more than 10° along the Earth's surface (measured as great-circle distance) between one time step and the next. Second, the vortex must remain visible (continuous) for at least four time steps (i.e. > 18 h total). Any identified vortices that do not meet these conditions are designated as “transient” (short-lived) vortices (Siu and Bowman, 2020). All tracking procedures are performed using u, MSF, and ζ on the 370 K isentropic surface.
3.2 PV tendency diagnostic
To quantify the multi-center structure, zonal propagation, and intensification of the ASMA on isentropic surfaces, we develop a combined diagnostic based on MSF, PV, and PV tendency. Each quantity plays a distinct and complementary role in the evolution of the upper-level anticyclone. MSF provides a dynamically consistent field for identifying anticyclonic centers on isentropic surfaces. Analogous to geopotential on pressure surfaces, MSF defines streamlines of geostrophic wind on isentropic surfaces. However, unlike geopotential, MSF incorporates local thermal contributions in addition to column-thickness dynamical contributions. MSF is used to identify and track multiple ASMA centers along the zero zonal-wind contour simultaneously, following the approach of Siu and Bowman (2020) as outlined above. This component enables objective identification of persistent and transient anticyclonic modes.
We use PV to evaluate the strength and coherence of each vortex. PV is especially advantageous in the UTLS because it is conserved for adiabatic and frictionless flow, and thus provides a valuable physical tracer of vortex evolution (Hoskins et al., 1985). First, we define the isentropic mass density σ (the inverse of static stability) as:
where g is the gravitational acceleration and p is pressure. Building on the momentum and continuity equations on isentropic surfaces (Andrew et al., 1986), we use PV to diagnose the boundaries, area, and strength of each anticyclonic vortex. Under a hydrostatic and small-slope approximation, the simplified Ertel's PV is defined as:
where ζθ is the relative vorticity perpendicular to the isentropic surface and f is the planetary vorticity (Ertel, 1942; Charney, 1948).
Although instantaneous PV fields can effectively describe the structure of the ASMA, including sub-vortices, they cannot directly distinguish changes driven by intensification from those driven by propagation. To address this, we analyze the PV tendency, which explicitly quantifies the processes responsible for changes in PV over time. Assuming friction is negligible for the large-scale UTLS flow, the PV tendency is approximated as the sum of dynamic (advective) and thermodynamic (diabatic) terms:
where is the (diabatic) vertical velocity in potential temperature coordinates and Qθ represents the PV tendency from total diabatic heating (including both radiative and non-radiative processes). Keeping only the vertical component of the diabatic source term, we have:
To further clarify the drivers of ASMA variability, we decompose the flow into a time-mean zonal-mean background flow () and a perturbation flow (φ′), such that = + (Tamarin and Kaspi, 2016). The PV tendency equation can then be expanded to highlight variations in intensification:
Here, represents the advection of the PV perturbation by the background zonal flow (referred to as “mean zonal advection”), while corresponds to the meridional advection of background PV (“meridional mean advection”). The terms and are collectively referred to as “nonlinear horizontal advection”, with representing total diabatic vertical advection (Tamarin and Kaspi, 2016; Kang and Son, 2021). Among the variables, only u and PV are split into a time-mean background and a perturbation component (i.e. v′ = v and = ). This is tantamount to defining the background state as the time-mean tropical easterly jet and subtropical westerly jet, averaged zonally across the ASMA and separated by the zonally-oriented u = 0 ridgeline. The zonal advection of mean PV, , vanishes because the background PV field is defined to be zonally uniform along the ridgeline (i.e. = 0).
We adopt potential temperature as the vertical coordinate for analysis due to its advantages for studying upper-tropospheric dynamics, particularly those related to PV (Hoskins et al., 1985). Isentropic surfaces, which are defined as surfaces of constant potential temperature θ, are intrinsically aligned with adiabatic air parcel motion. This alignment simplifies interpretation of PV evolution because PV is conserved under adiabatic, frictionless conditions, making it easier to track air mass movement and isolate the key dynamical and thermodynamic mechanisms driving ASMA variability. In addition, this coordinate system simplifies the vertical term, as the adiabatic component of vertical motion is wrapped into the horizontal advective terms. The local rate of change of PV on the 370 K isentropic surface is thus governed primarily by horizontal advective transport of PV, modified by diabatic transport and diluted by diabatic vertical convergence, as expressed in Eq. (5).
One key uncertainty concerns the assumption of frictionless flow, as convective momentum transport, gravity wave drag, and shear-flow instability could all modify the flow near the monsoon tropopause. Assimilation effects on winds and temperatures can also be locally large in reanalyses, especially in the vicinity of complex topography such as the Tibetan Plateau (e.g. Wright et al., 2025). However, these effects are often tied to topography, and are therefore difficult to interpret and potentially confounding in a vortex-relative framework such as the one adopted here. We center our analysis around the model-generated diabatic heating terms to better attribute these contributions and their consistency across reanalyses, and defer a more complete accounting of assimilation effects and parameterized momentum sources and sinks to future work.
4.1 Movement of vortex centers within the ASMA
Montgomery stream function (MSF), relative vorticity, and zonal wind are used to identify and track multiple vortex centers within the ASMA over the domain 0–180° E and 15–45° N during the period 2000–2020. Figure 2 shows an illustrative example of vortex identification on the 370 K isentropic surface using the method described in Sect. 3. Figure 2 highlights the dynamical consistency among potential vorticity (PV; Fig. 2a), relative vorticity (ζ; Fig. 2b), and MSF and zonal wind (u; Fig. 2c). Vortex centers are identified at locations where MSF reaches a local maximum along the u = 0 ridgeline. These vortices are likewise characterized by negative relative vorticity (ζ < 0) and small values of PV. The typical number and frequency of ASMA vortex centers from May to August are shown in Fig. 3 for JRA-3Q, with results for other reanalyses shown in Fig. S1 of the Supplement. The most frequent centroid locations are consistent across the three reanalysis products, with JRA-3Q and ERA5 agreeing particularly well (Fig. S1; see also Fig. 3). The longitude–frequency distribution (Fig. 4) shows three distinct modes: an “Iranian Plateau” (IP) mode near 50° E, a “Tibetan Plateau” (TP) mode near 90° E, and a “Western Pacific” (WP) mode at 135–150° E, in agreement with previous studies (Honomichl and Pan, 2020; Siu and Bowman, 2020). These modes correspond to the Iranian, Tibetan, and Bonin (Ogasawara) highs (Enomoto et al., 2003; Enomoto, 2004). The Bonin High (BH) is the closed anticyclonic system corresponding to the Western Pacific mode of the ASMA, with its center located near the Bonin Islands in the Northwest Pacific. The TP and WP modes are often collectively associated with the South Asian High, while the IP and TP modes exhibit clear spatial interaction (e.g. Zhang et al., 2002; Nützel et al., 2016; Zhang et al., 2025). Moreover, part of the WP mode, which occurs mainly later in the monsoon season, can be linked to eastward eddy shedding. As shown by Nützel et al. (2016), the occurrence frequencies of the IP and TP modes are concentrated within 25–35° N and 45–100° E. Siu and Bowman (2020) also highlighted a broad region of frequent vortex occurrence associated with the Bonin High (BH) over 120–180° E, where vortices are generally weaker than those defining the IP and TP modes. Overall, the vortex tracking results presented here are consistent with previous studies in both spatial distribution and frequency characteristics.
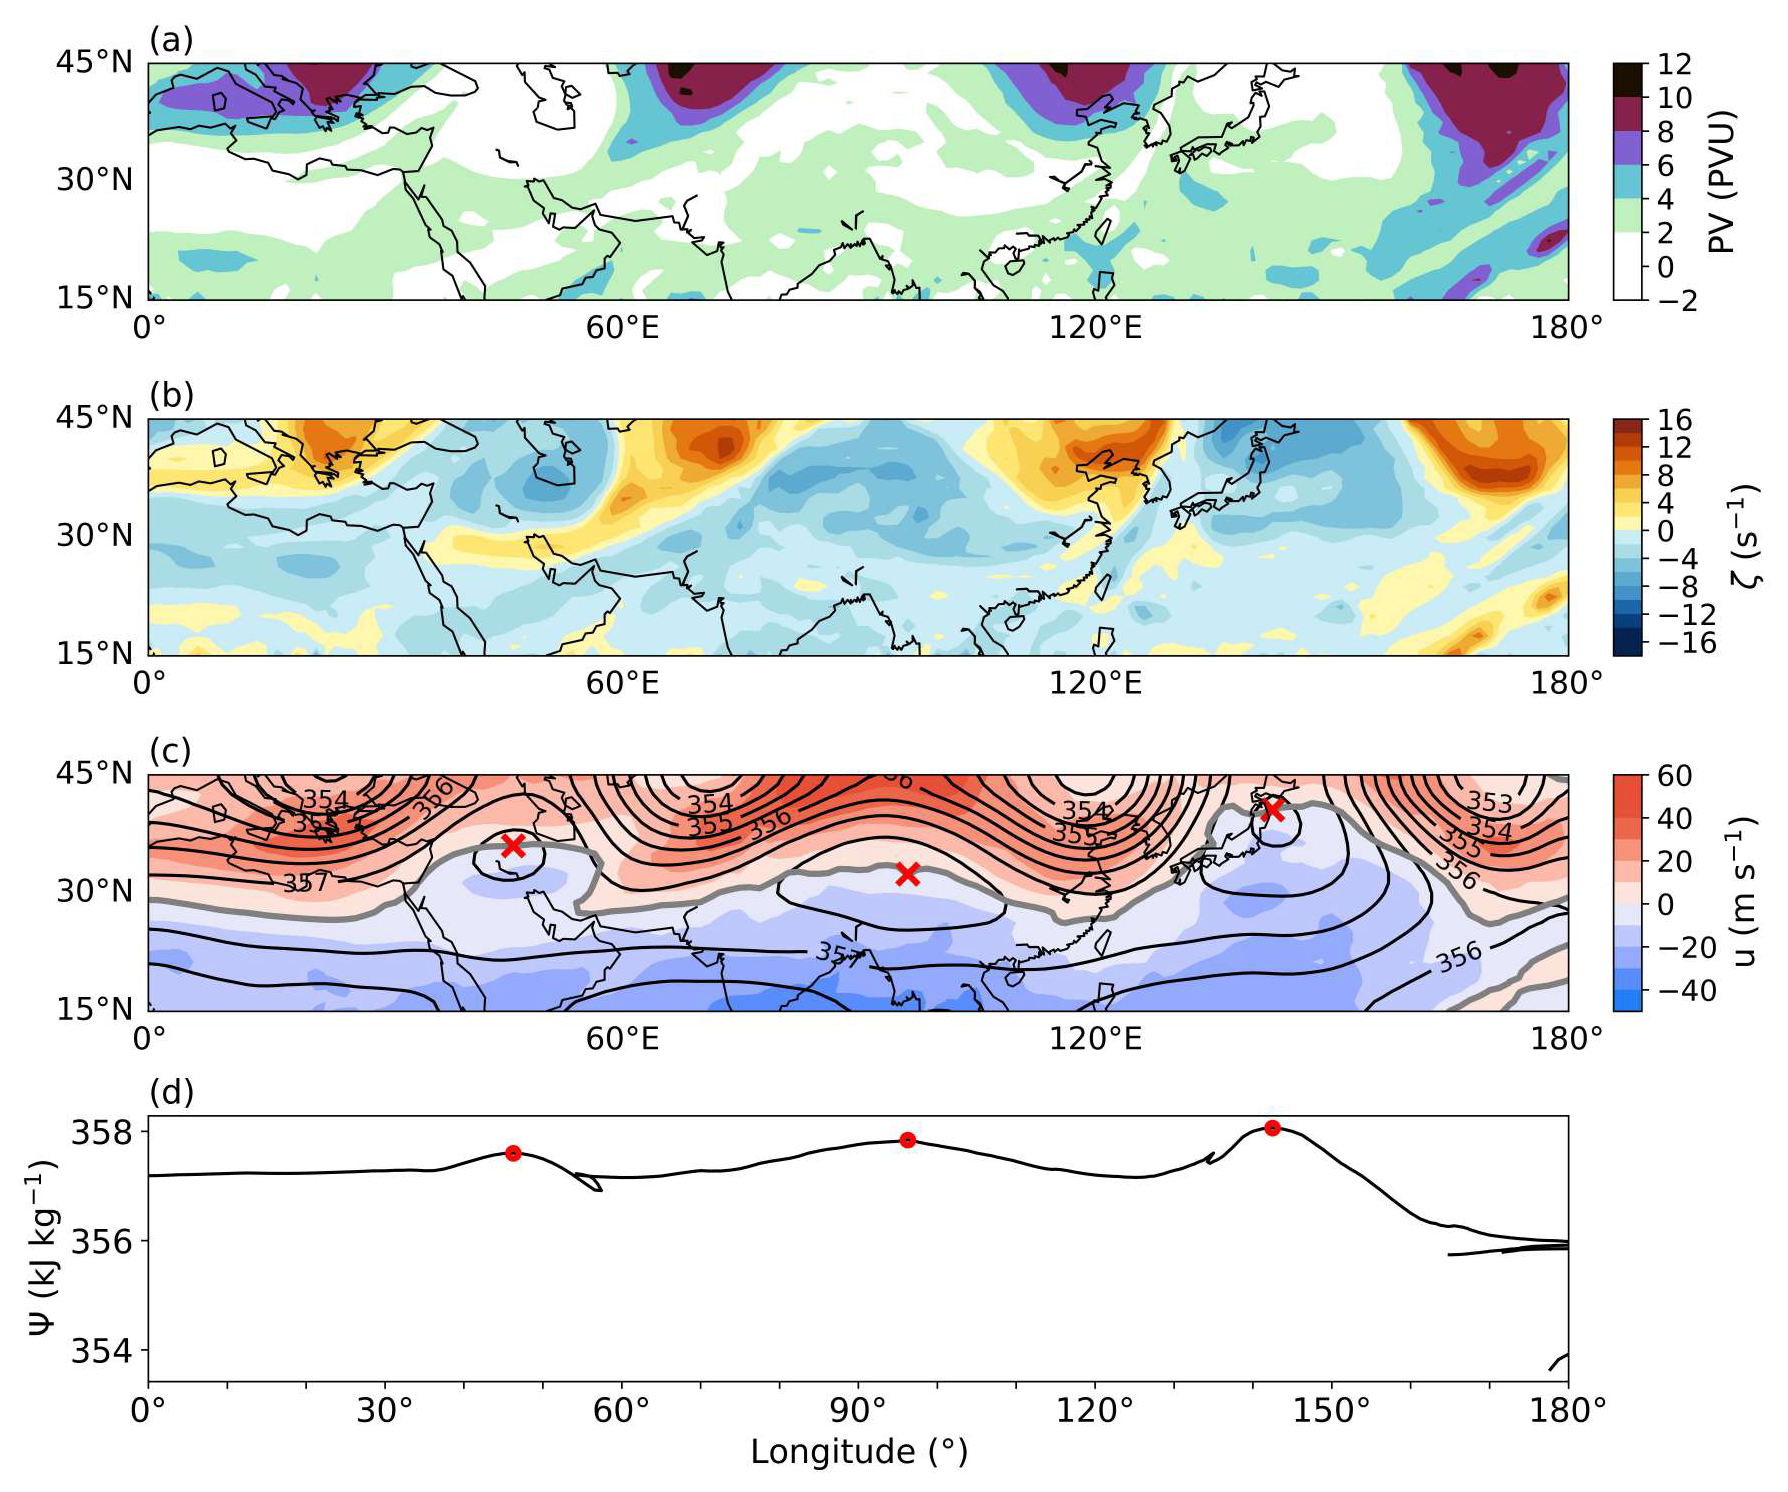
Figure 2An illustrative example of vortex center identification in the ASMA region based on JRA-3Q products at 370 K on 17 August 2019 at 00:00 UTC: (a) potential vorticity, PV; (b) relative vorticity, ζ; (c) zonal wind, u, including the zero-wind u = 0 ridgeline (gray line) as well as identified vortex centres (red crosses), and Montgomery stream function (MSF; black contours); and (d) MSF along the u = 0 ridgeline as a function of longitude, along with the identified vortex centers (red dots).
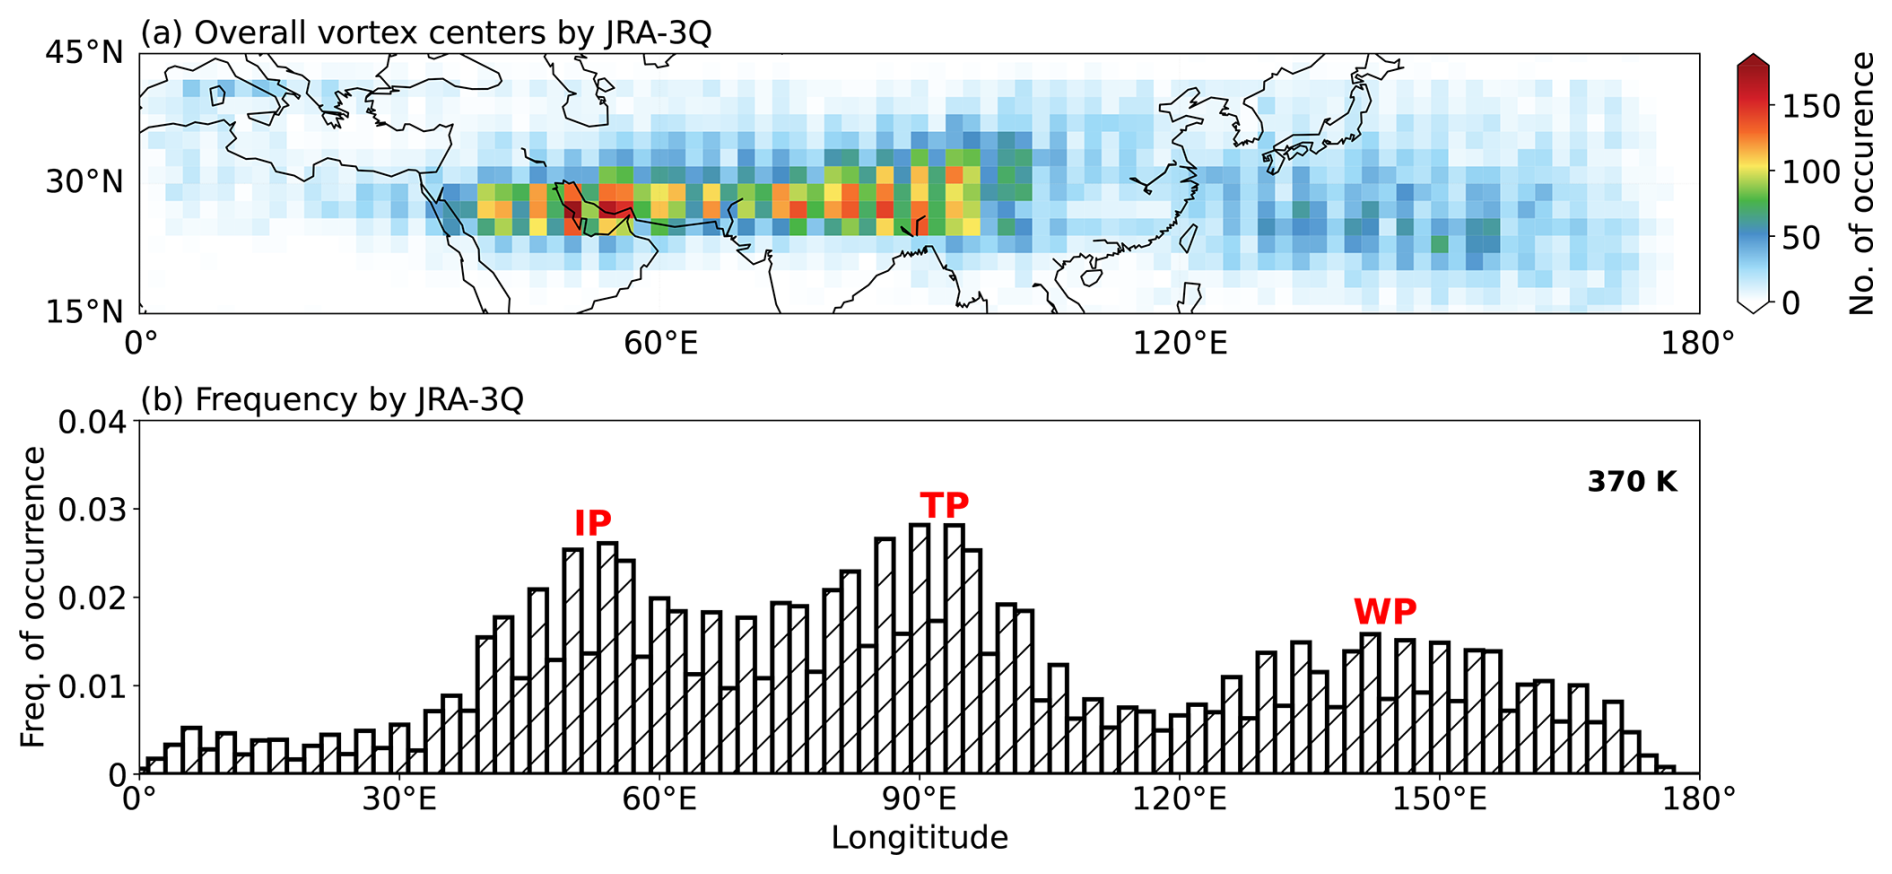
Figure 3The spatial distributions of anticyclonic vortex center occurrence on the 370 K isentropic surface based on JRA-3Q during May–September 2000–2020. (a) Cumulative total count of vortex center detections across all 6-hourly time steps. Note that multiple vortex centers may coexist at individual time steps, consistent with the trimodal structure of the ASMA. (b) Occurrence frequency, defined as the fraction of all 6-hourly time steps at which a vortex center is detected in the vicinity of each grid point. The red labels “IP”, “TP”, and “WP” in panel (b) mark the peaks associated with the Iranian Plateau mode, the Tibetan Plateau mode, and the Western Pacific, respectively.

Figure 4Evolution of vortex occurrence counts based on applying the vortex tracking algorithm at 370 K level from 2000 to 2020 in the (a–c) time–longitude and (d–f) time–latitude phase spaces. Results are shown for the (a, d) JRA-3Q, (b, e) ERA5, and (c, f) MERRA-2 reanalysis products.
To gain a better understanding of ASMA variability, particularly the pronounced trimodal structure from May to September, Hovmöller diagrams are constructed to illustrate the spatiotemporal evolution of vortex centers. These diagrams depict the densities of longitudinal and latitudinal positions of anticyclonic vortices within the ASMA as a function of time of year. The trimodal structure comprising the IP, TP, and BH modes is clearly evident in Fig. 4a–c. The longitudinal ranges of the vortex centers are well defined, with climatological centers for the IP, TP, and BH modes located at approximately 45–65, 85–100, and 135–145° E longitude, respectively. The relative prevalence of these three centers likewise shows a clear seasonal evolution, with the TP center dominant during May, IP from mid-June to mid-July, and a shift back to predominantly TP centers as the BH emerges in August and September. The ASMA exhibits a clear latitudinal evolution of vortex centers as well, with a northward migration of vortex density in early boreal summer followed by a southward migration later in the season. The northernmost position of approximately 40° N is reached between 15 July and 14 August. This behavior is likewise consistent with previous findings (Nützel et al., 2016, 2022). Persistent vortices account for more than 65 % of identified vortex centers in ERA5 and JRA-3Q, while transient vortices occur much less frequently (Table S1 in the Supplement).
Figure 5 shows four examples of anticyclone evolution during May–September of the years 2000, 2005, 2010, 2015, and 2020. The panels show PV fields on the 370 K isentropic surface, with color shading ranging from 0 to 2 PVU. Low-PV structures in JRA-3Q are highly consistent with the locations of the identified anticyclone centers. Many anticyclonic features show evidence of westward propagation, although some features propagate eastward, especially in the early and late monsoon, and periods of long-lasting quasi-stationary centers are also evident (e.g. August 2020). Tails extending toward both the eastern and western boundaries indicate eddy shedding events (Popovic and Plumb, 2001). There remains no universally accepted quantitative threshold for defining eddy shedding in the ASMA, as it involves gradual vortex splitting, detachment, and westward/eastward propagation that is inherently continuous and difficult to discretize objectively. We therefore mark only a handful of typical, visually clear cases to illustrate eddy shedding behavior in Fig. 5, rather than attempting to label every event. The Western Pacific sector lies within the southward-flowing, eastward flank of the anticyclone, where high-PV air from the extratropical lowermost stratosphere is often advected toward lower latitudes. This southward mean advection contributes to the enhanced PV there (Wang et al., 2022). Although vortex motion is predominantly zonal (east–west), many vortices also experience meridional (north–south) displacements during their life cycles (not shown).
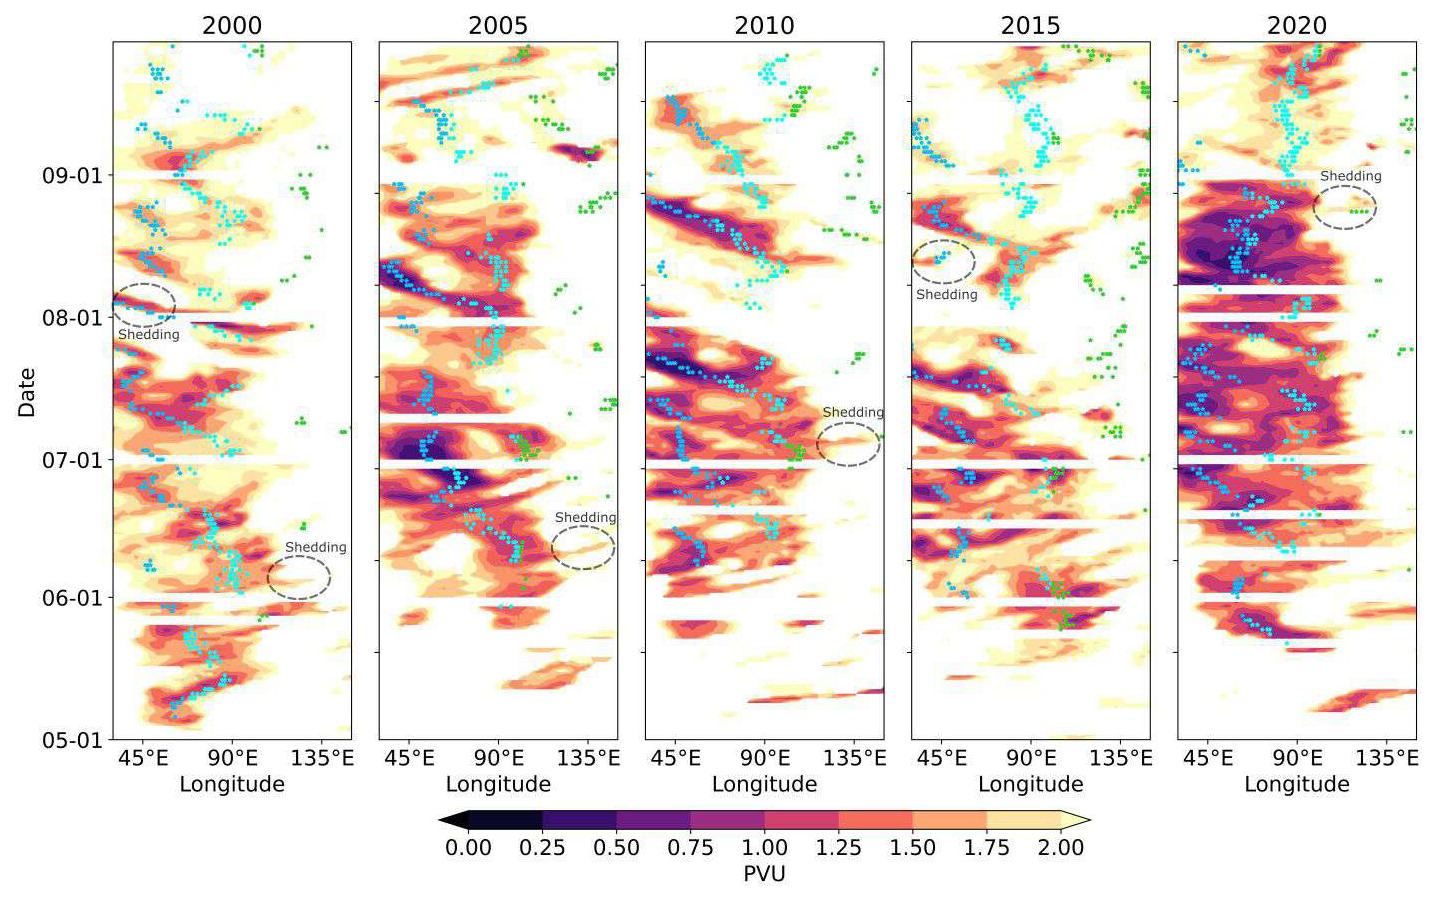
Figure 5Time–longitude plots of 6-hourly PV at 370 K over the latitudinal band between 20 and 40° N in 2000, 2005, 2010, 2015, and 2020 based on JRA-3Q. Light blue, cyan, and green dots represent the locations of persistent anticyclonic vortex centers in the IP, TP, and BH regions, respectively. Grey dashed circles mark exemplary eddy shedding events.
4.2 Development of vortex centers within the ASMA
Figure 6 shows vertical cross-sections for each term in Eq. (3). The extents are defined as ±30° in longitude and ±15° in latitude relative to the center of the vortex. A dipolar structure of positive and negative PV tendencies is evident in both the horizontal advection terms (Fig. 6a–b). In the composite mean, zonal PV advection exhibits a positive tendency to the west and a negative tendency to the east of the vortex center above 300 hPa, while meridional advection is positive to the east and negative to the west as opposed to dipolar pattern thus largely cancel when the horizontal advection terms are summed together (Fig. 6c) and they yield a tripolar structure. The net time tendency of PV (Fig. 6d) shows a similar pattern but with smaller amplitude. The dipole patten features positive tendencies peaking immediately west of the vortex center, flanked by negative tendencies on both east and west, although the negative tendencies to the west are considerably farther from the vortex center. Focusing on the tendencies close to the vortex center, the sum of horizontal advection terms exhibits a dipolar structure (Fig. 6c) with positive values to the west and negative values to the east of the vortex center. Physically, this pattern corresponds to eastward propagation of the anticyclonic vortex in which positive PV tendencies erode the low-PV anomaly on the western flank, while negative PV tendencies reinforce it on the eastern flank, causing the entire vortex core to move eastward over time.
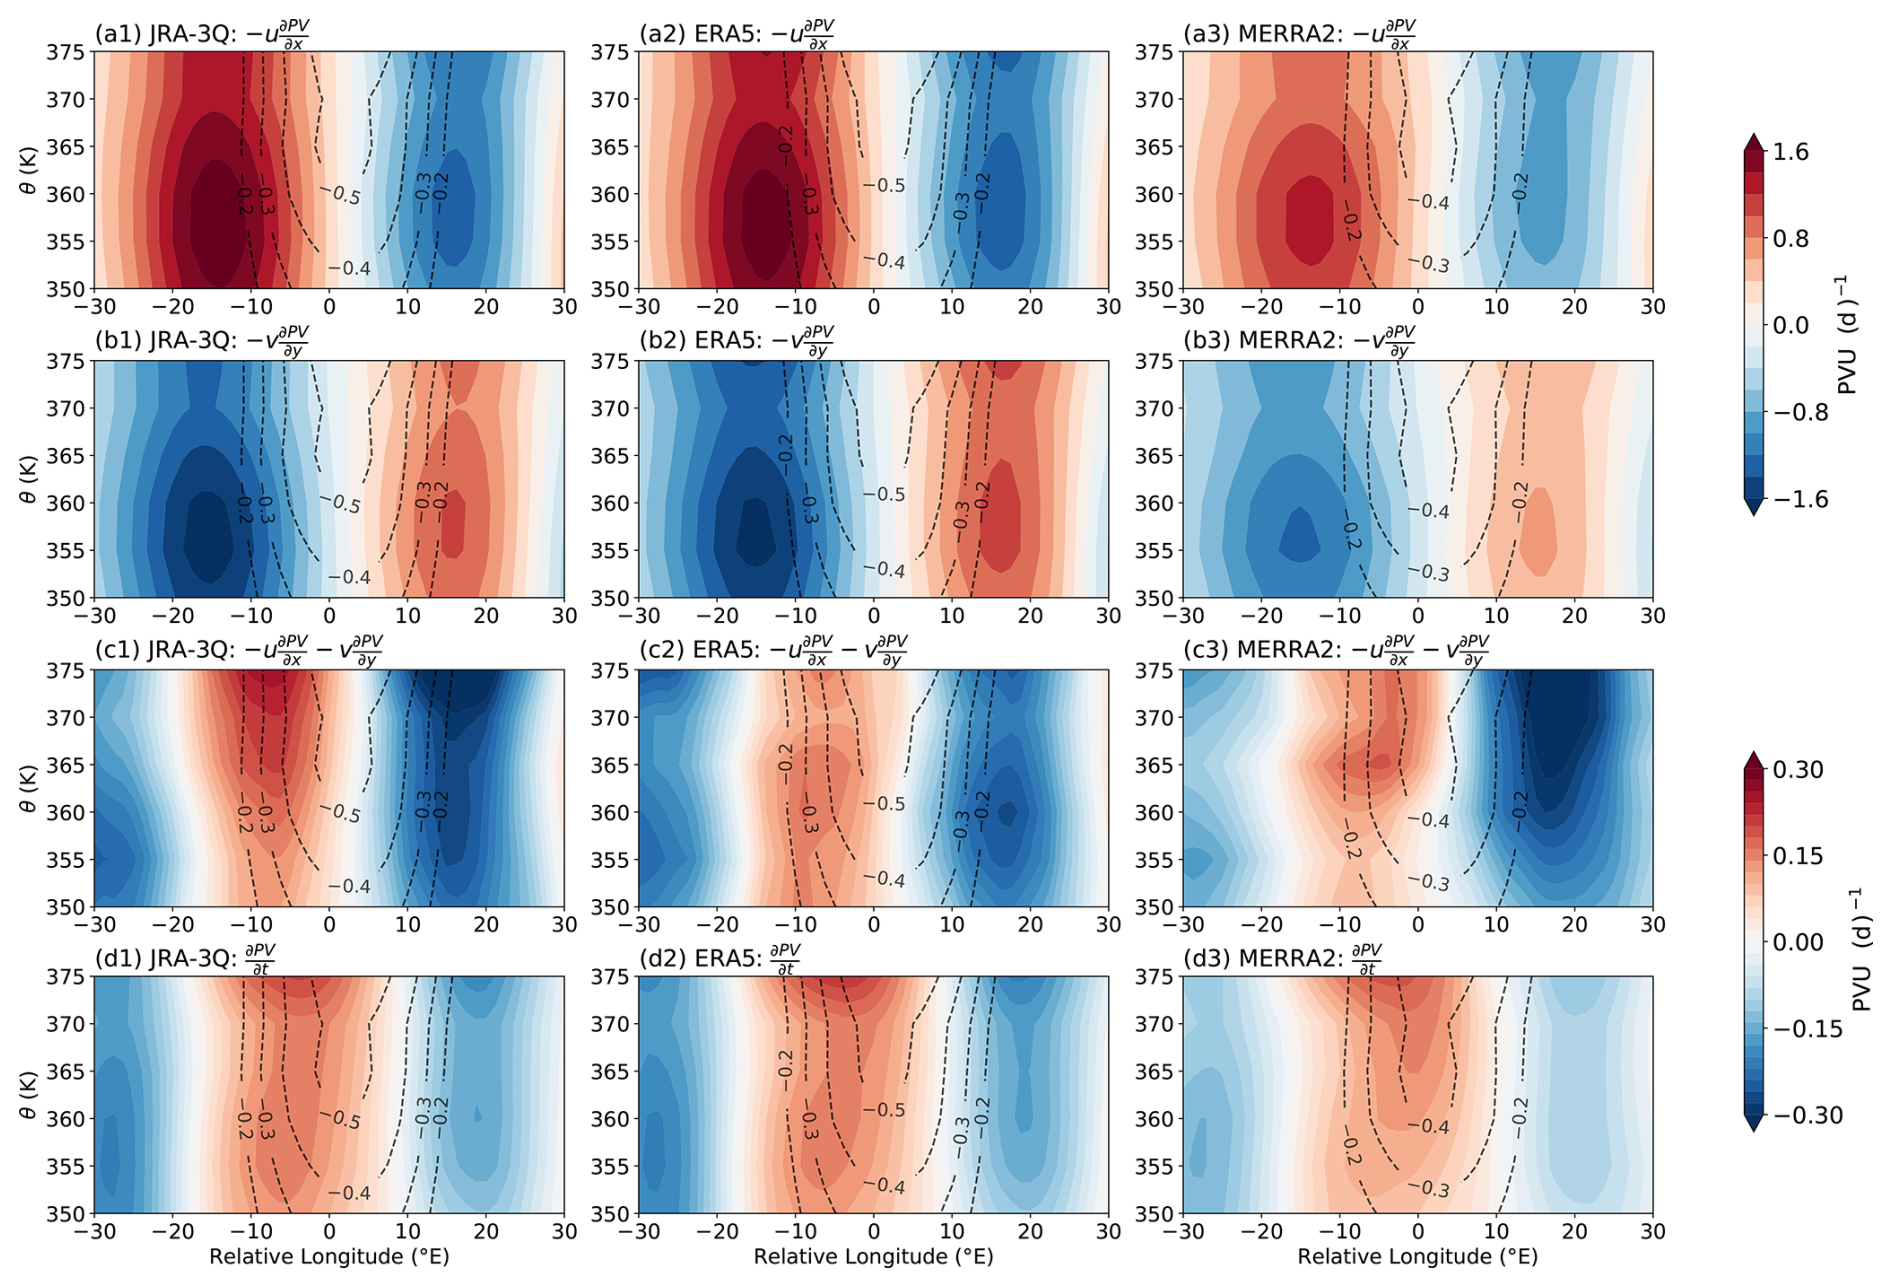
Figure 6Composite-mean PV tendencies from (a) zonal advection (), (b) meridional advection (), (c) the sum of zonal and meridional advection, and (d) the net time tendency (). PV anomalies are shown as black dashed contours at 0.1 PVU intervals from −0.2 to −0.5 PVU. The horizontal axis indicates the longitude relative to the vortex center. Results are shown for the (a1–d1) JRA-3Q, (a2–d2) ERA5, and (a3–d3) MERRA-2 reanalysis products.
The dipolar signature is driven primarily by horizontal advection and accounts for the zonal translation of the vortex. When diabatic source terms are incorporated, the total PV tendency develops a characteristic tripolar structure (Fig. 6d). This dipolar structure arises from the superposition of two physically distinct processes, an advective east–west dipole that governs zonal propagation, and a central monopole that modulates vortex intensification. The flanking dipolar components, dominated by net horizontal advection, set the speed and direction of vortex movement. The central component, driven mainly by diabatic heating and its vertical gradient, modulates the overall strength of the low-PV core without displacing its horizontal position. A negative central tendency strengthens the anticyclone, while a positive central tendency weakens it.
Diabatic heating plays an influential role in setting the PV tendency and is essential for anticyclonic vortex development. The vertical structure of diabatic heating is defined by a balance between latent heating and radiative cooling below about 360 K and dominated by radiative heating above this level. Figure 7 illustrates the distribution of diabatic heating around the identified anticyclonic vortices. On average, the identified vortices show strong deep convective heating collocated with the vortex center and below the eastern flank of the vortex, with much weaker heating below the western part of the vortex. Radiative heating in the upper levels also peaks near the center of the vortex, especially in ERA5 (Fig. 7a2). Strong radiative cooling in the lower levels compensates much of the positive anomaly in convective heating below 360 K, creating a band of negative net heating around 355–360 K that extends downward to 350 K in the western part of the vortex (Fig. 7c).
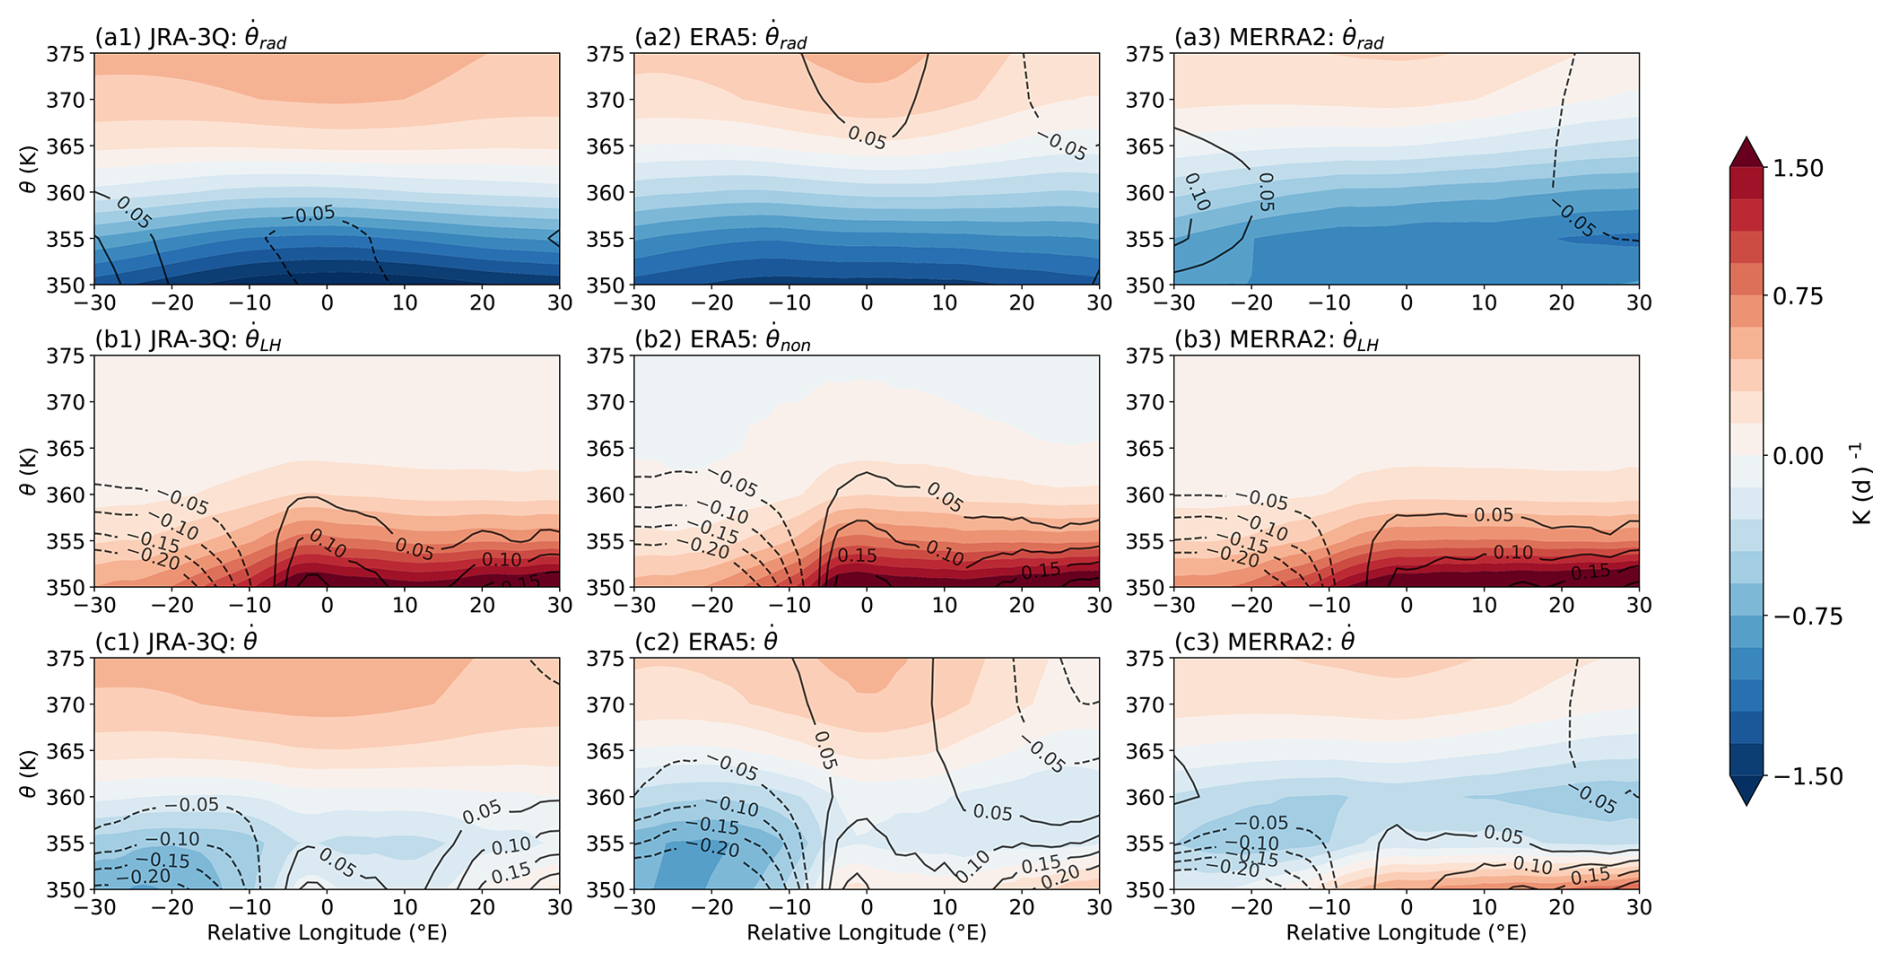
Figure 7Composite-mean diabatic vertical velocities () due to (a) radiation, (b) latent (JRA-3Q, MERRA-2) or non-radiative (ERA5) heating, and (c) all parameterized physics based on the (a1–c1) JRA-3Q, (a2–c2) ERA5, and (a3–c3) MERRA-2 reanalyses. The horizontal axis indicates the longitude relative to the vortex center. Contour lines show differences relative to the zonal mean across the eastern hemisphere (0–180° E).
The contributions of diabatic heating to vortex evolution can be separated into two terms. The first of these corresponds to diabatic vertical advection, as shown in Fig. 8 (the horizontal distribution on the 370 K isentropic surface is provided in Fig. S3). In this term, the diabatic heating distributions shown in Fig. 7 operate on the partial derivative of PV with respect to potential temperature. PV increases with height, with a local minimum at the vortex center that is strongest in ERA5 and weakest in MERRA-2 (Fig. S2). As a result, upward vertical velocities tend to reduce PV and downward vertical velocities tend to increase PV. The net effect is a vertical dipole centered just below 360 K, with positive tendencies below and negative tendencies above this level. Whereas the qualitative structure is set primarily by the distribution of radiative heating, latent heating acts to shift the zero line downward. Further investigation shows that the positive tendency associated with latent heating near the vortex center results from collocation of the largest positive latent heating with a local reversal of the vertical gradient of PV.
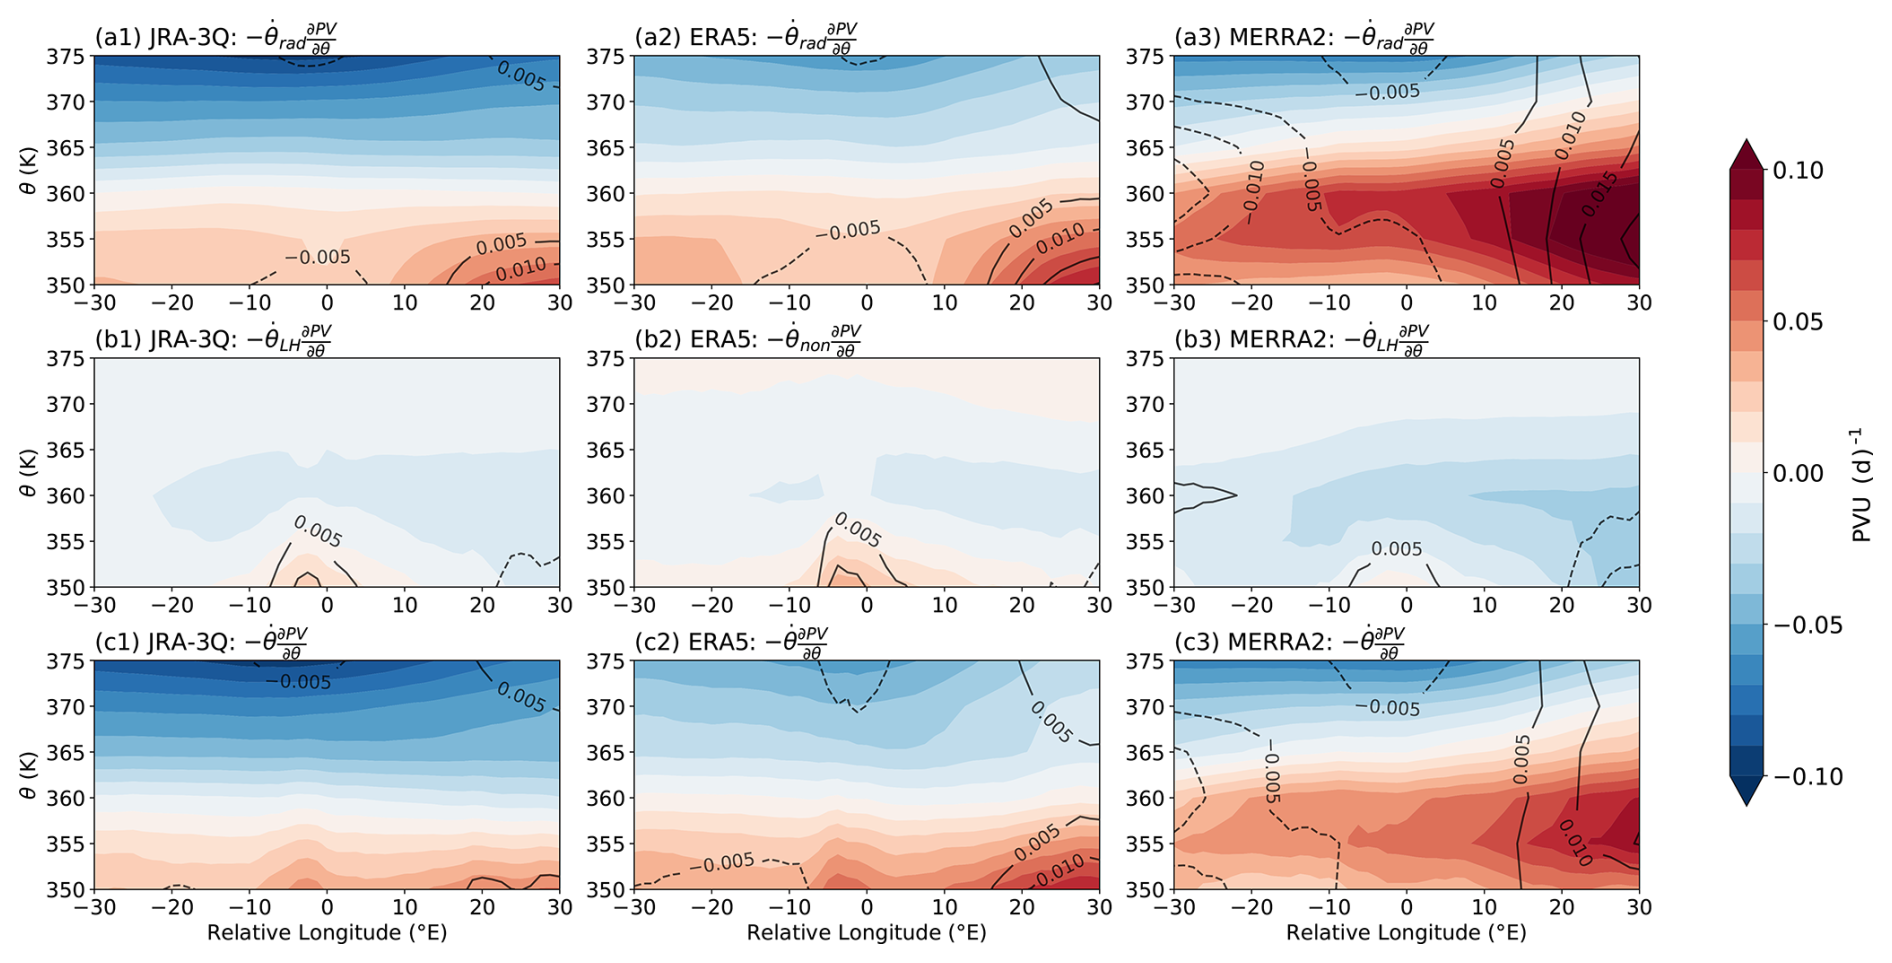
Figure 8Composite-mean PV tendencies (shading; PVU d−1) due to diabatic vertical advection of PV from (a) radiative heating, (b) latent or non-radiative heating, and (c) total diabatic heating based on the (a1–c1) JRA-3Q, (a2–c2) ERA5, and (a3–c3) MERRA-2 reanalysis products. Black contours show deviations from the background zonal-mean for the corresponding term. The horizontal axis indicates the longitude relative to the vortex center.
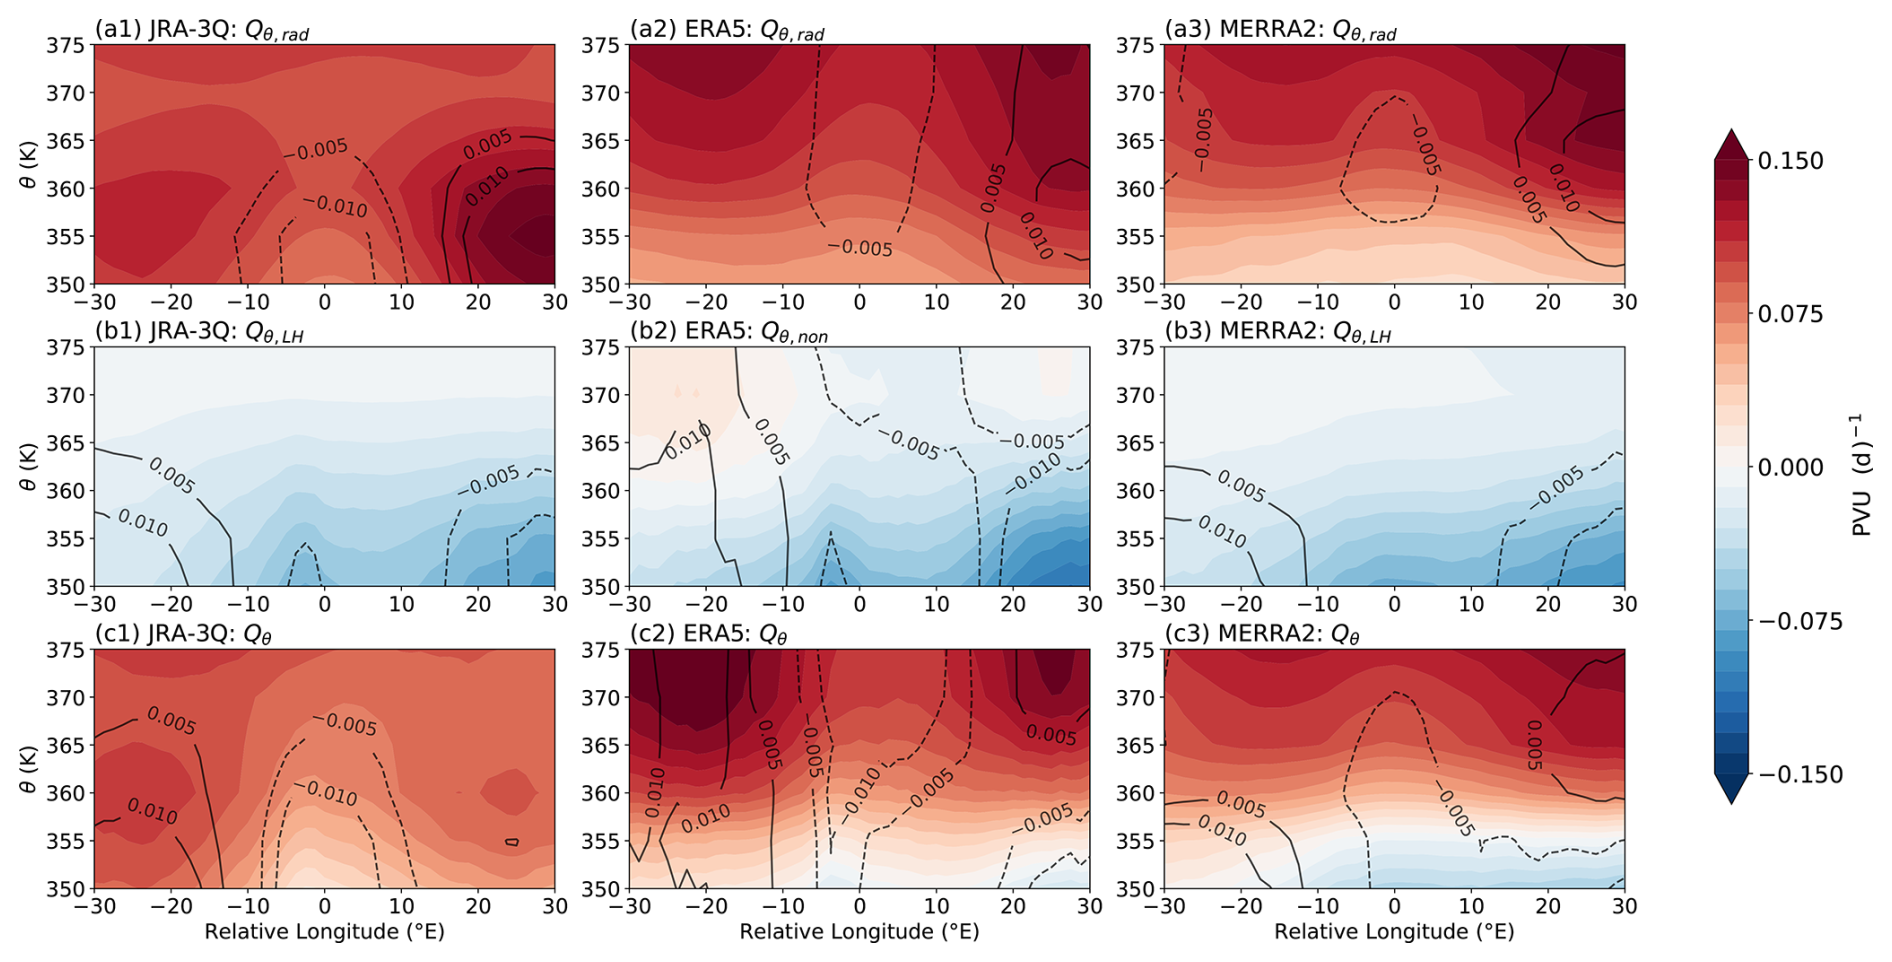
Figure 9Composite-mean PV tendencies (shading; PVU d−1) from the vertical divergence of (a) radiative heating Qrad, (b) non-radiative heating Qnon, and (c) total diabatic heating Q based on the (a1–c1) JRA-3Q, (a2–c2) ERA5, and (a3–c3) MERRA-2 reanalysis products. Black contours show deviations from the background zonal mean for the corresponding term. The horizontal axis indicates the longitude relative to the vortex center.
Figure 9 shows PV tendencies induced by the vertical divergence of different diabatic heating components: radiative heating (Qrad), latent (QLH; JRA-3Q and MERRA-2) or non-radiative heating (Qnon; ERA5), and total diabatic heating (Q). The vertical divergence of radiative heating produces a strong positive tendency at these altitudes (Fig. 9a), primarily contributed by the increase in background radiative heating with increasing height (Fig. 7a). These tendencies indicate that the vertical structure of radiative heating in the UTLS, where tropospheric radiative cooling transitions to stratospheric radiative heating, generally acts to spin down the monsoon anticyclone through the diabatic source term. Beyond this general tendency, the spatial structure of radiative heating effects around the vortex center shows a stronger positive tendency in the eastern part of the vortex and a weaker positive tendency near the center of the vortex: the spin-down effect is less pronounced near the center of active anticyclonic vortices. Examination of Fig. 7, which shows that the composite mean vertical gradient of is largest near the vortex center, indicates that this local minimum primarily reflects the local minimum in PV. By contrast to radiative heating, the decrease in latent heating with increasing height near the tops of deep convective clouds produces negative PV tendencies (Fig. 9b). These negative tendencies show two peaks. The first is located near the center of the vortex, where it supplements the weaker positive radiative tendencies noted above. The second is located in the eastern sector of the vortex, where it offsets at least part of the stronger positive radiative tendencies. The net effect of the vertical divergence of diabatic heating (Fig. 9c) is to spin down the negative PV anomaly at higher altitudes, with stronger effects near the edges of the vortex and weaker effects near the center. The three reanalyses show large differences in the vertical locations of these effects and their relative magnitudes. Whereas positive tendencies in JRA-3Q peak near 360 K, positive tendencies in ERA5 and MERRA-2 increase with increasing height. Moreover, both ERA5 and MERRA-2 show negative tendencies in the lower part of this vertical range extending eastward from the vortex center. These differences may be explained by stronger anvil cloud radiative effects in ERA5 and MERRA-2 (Wright et al., 2020), which weakens the vertical gradient of radiative heating by producing positive longwave heating effects below the anvil and negative effects above the anvil (Fig. 7a). Like the earlier JRA-55 reanalysis, JRA-3Q produces very little prognostic cloud ice at these altitudes (Zhang et al., 2025). Meanwhile, the gradient in diabatic source tendencies in MERRA-2 is larger than those based on the other two reanalyses, owing to larger values of PV throughout this altitude range (Fig. S2).
Figures 10 and 11 show latitude–longitude distributions of the diabatic source term on the 350 and 370 K levels based on JRA-3Q (equivalent distributions based on ERA5 and MERRA2 are shown in Figs. S5 and S6). Results are shown separately for vortices associated with the IP, TP, and BH modes of the ASMA. Radiative heating (Fig. 10a–c) produces strong positive PV tendencies to the north of the vortex core at 350 K, indicating an increase in radiative heating with increasing potential temperature acting to increase PV and weaken the vortex. By contrast, latent or non-radiative heating (Fig. 10d–f) generates strong negative PV tendencies south of the vortex center. The associated reduction in PV enhances the anticyclonic vorticity and contributes to vortex intensification or propagation. The total diabatic heating (bottom row), which combines both radiative and latent effects, shows a net negative PV tendency along the southern flank the vortex and opposing effects along the northern flank. The orientation of this dipole between positive and negative tendencies differs between vortices associated with the IP, TP, and BH modes, primarily owing to differences in the latent heating component. Whereas the latent heating intensification is located in the southeast for the IP mode, it is located in the south for the TP mode, and mainly to the southwest of the vortex center for the BH mode. Meanwhile, positive tendencies wrap around the western flank of IP-mode vortices and the eastern flank of BH-mode vortices. These distributions of the diabatic source term will tend to pull vortices in all modes back toward the southern flank of the central ASMA, where the convective core of the monsoon is located, and inhibit their propagation away from this center. We note that these distributions are composite means over many vortex centers; the tendencies associated with individual vortices may differ.
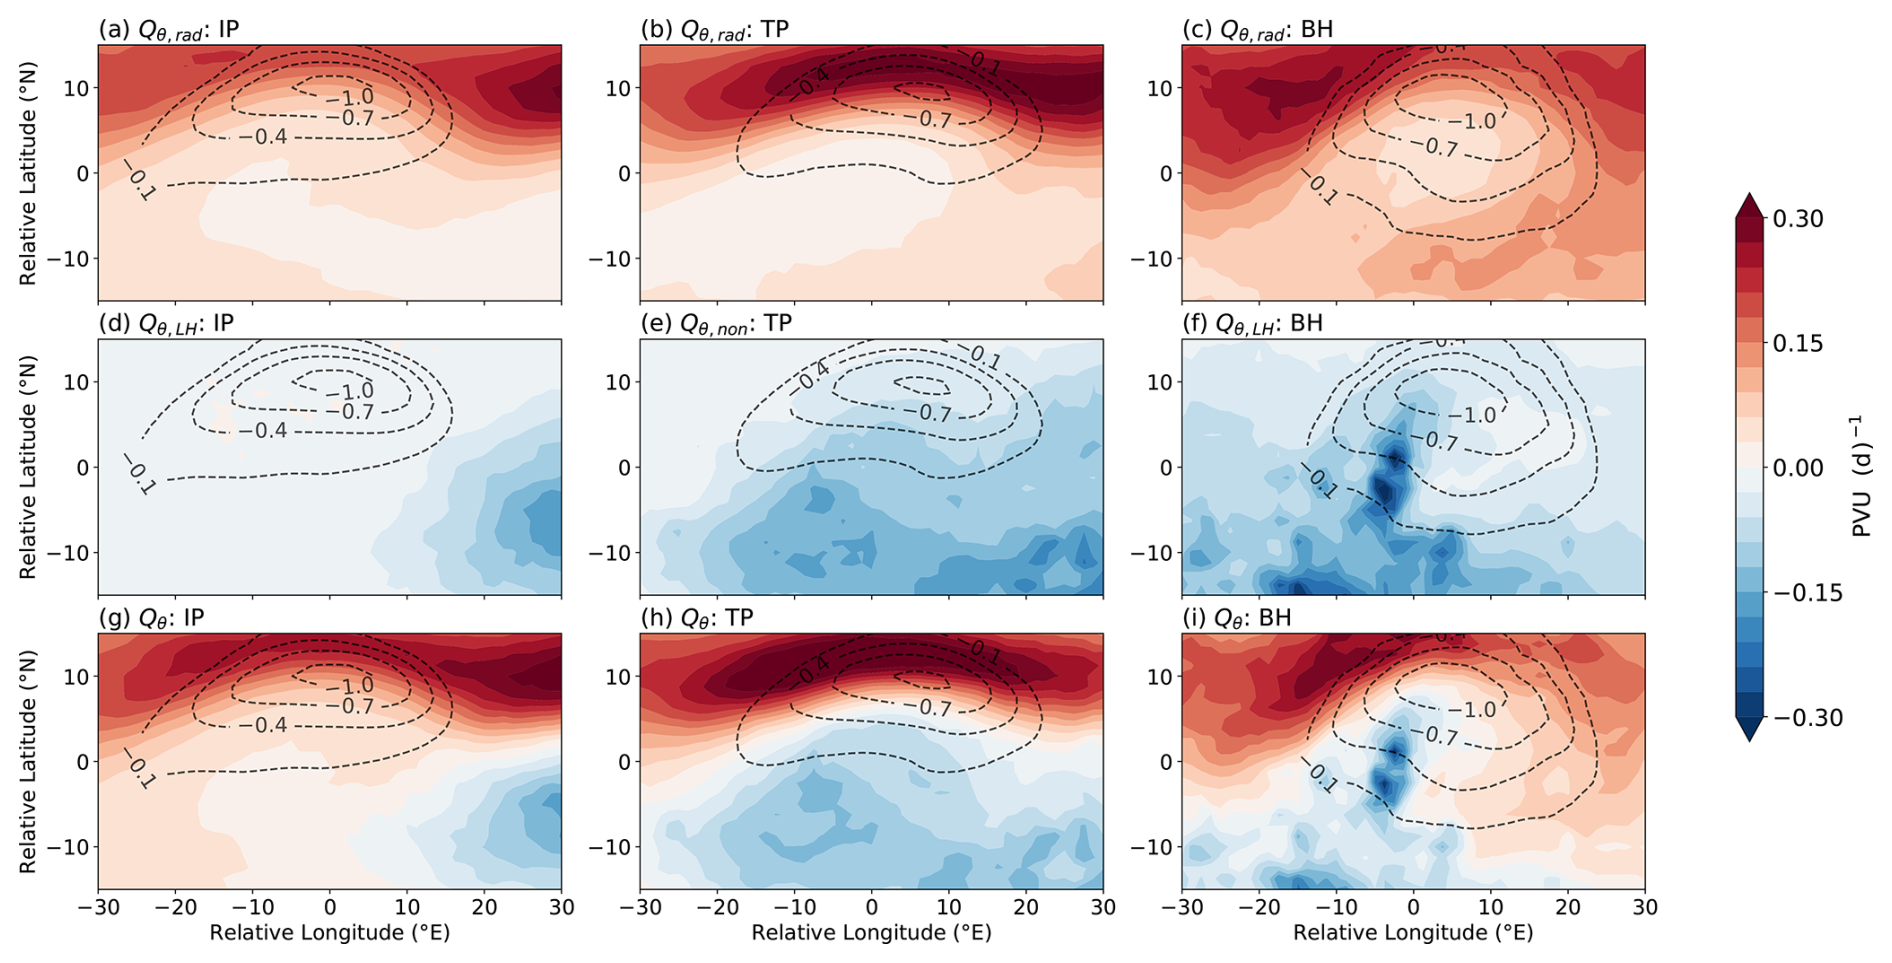
Figure 10PV tendencies from the vertical divergence of (a–c) radiative heating, (d–f) latent or non-radiative heating, and (g–i) their sum on the 350 K isentropic surface based on JRA-3Q. Results are shown for the (a, d, g) Iranian Plateau (IP), (b, e, h) Tibetan Plateau (TP), and (c, f, i) Bonin High (BH) vortices. Black dashed contours show the PV anomaly at 350 K from −1 to 0 PVU at an interval of 0.3 PVU. The horizontal and vertical axes indicate longitude and latitude relative to the vortex center, respectively.
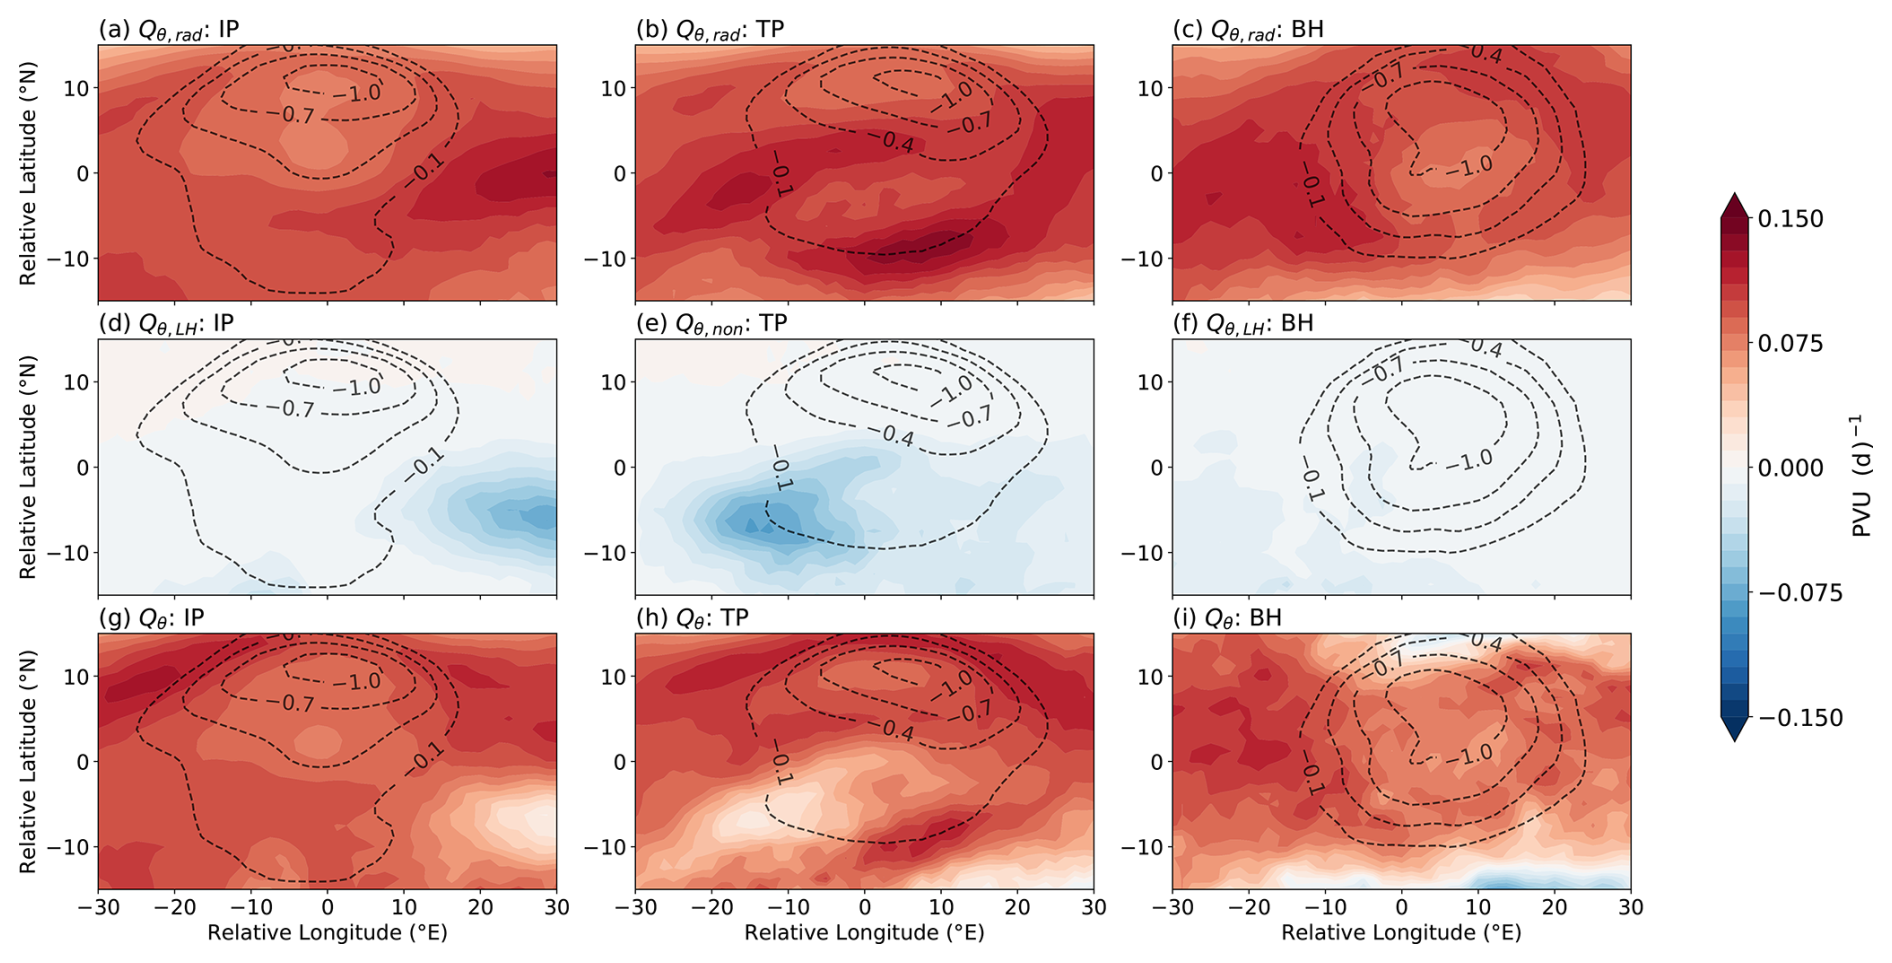
The dipole patterns shown in Fig. 10 are weaker on the 370 K level, as shown in Fig. 11. This difference largely results from a redistribution of the positive tendencies due to radiative heating and a weakening of the negative tendencies due to latent heating. In particular, positive tendencies due to radiative heating at 370 K are weakest within the anticyclonic vortices and strongest toward the convective core of the monsoon. Although the net effect of both terms is to weaken the vortices, the total positive tendencies are weakest from the center toward the southeast for IP-mode vortices and from the center toward the southwest for TP-mode vortices (with a second local minimum in the far southeast). The distribution associated with BH-mode vortices has a more complex structure, with minima to the north and southeast, relatively strong positive tendencies near the vortex center, and stronger positive tendencies to the east and west.
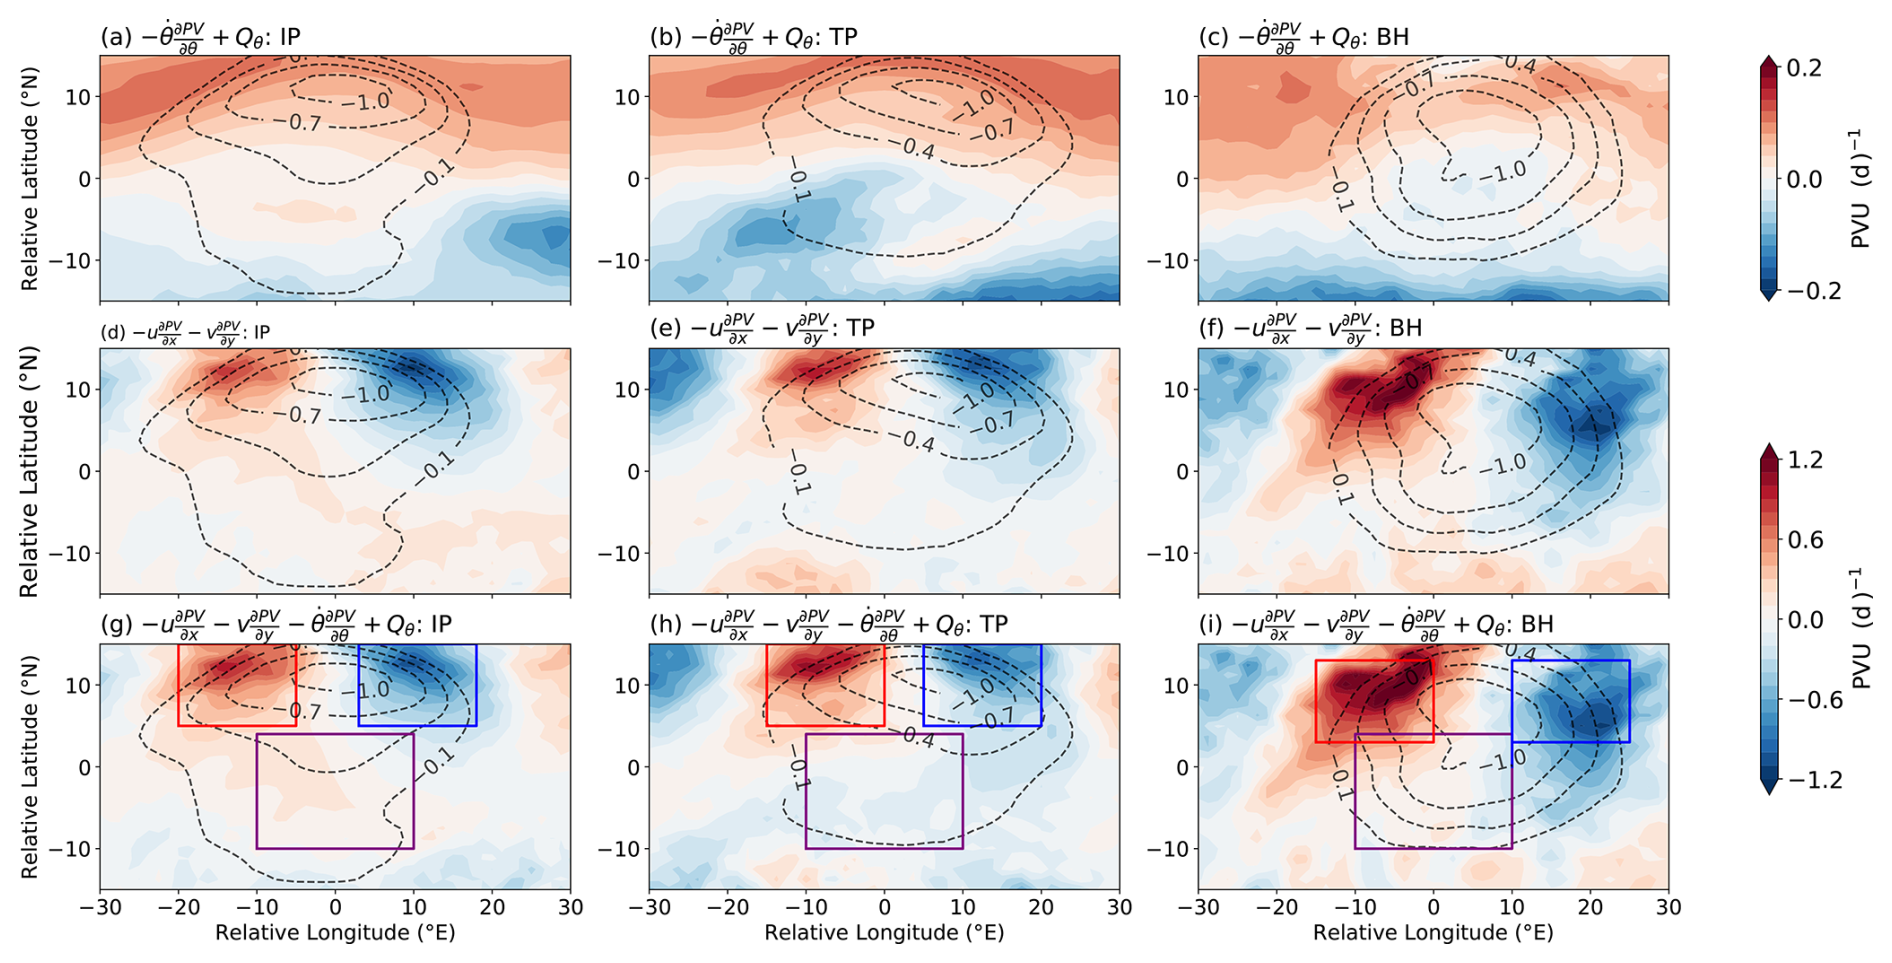
Figure 12PV tendencies from (a–c) the vertical divergence of diabatic heating, (d–f) horizontal advection, and (g–i) their sum along with vertical advection on the 370 K isentropic surface. Black dashed contours show the PV anomaly at 370 K from −1 to 0 PVU at an interval of 0.3 PVU. The horizontal and vertical axes indicate longitude and latitude relative to the vortex center, respectively. The red boxe in the lower row indicates the main areas of net positive PV tendencies, while the blue box indicates regions of net negative PV tendencies.
On average, diabatic heating exerts a southward pull on anticyclonic vortices at 370 K, with both latent heating and radiative processes contributing to this tendency. However, the magnitude of the diabatic heating term is small relative to that of horizontal advection, particularly north of the vortex center (Fig. 12; equivalent results based on ERA5 and MERRA2 are shown in Figs. S7 and S8). Vertical advection produces a net negative tendency at 370 K, which is located above the level of zero net radiative heating (Fig. 7a). This advection thus represents a supply of low-PV air from lower altitudes. The combined effects of vertical advection, horizontal advection, and total diabatic heating produce a tripolar structure associated with the anticyclone (Fig. 12g–i). The three poles of this structure include a predominantly advective dipole along the northern flank of the vortex, characterized by strong negative tendencies to the northeast of the vortex center and positive tendencies to the northwest, and a more monopolar distribution that straddles the vortex center in the south. Warm, moist air with low values of PV is transported upward to the southeast of the vortex and then westward along the southern flank. These two effects combine to produce the predominantly negative net tendencies at latitudes south of the vortex center, which we refer to as the monopole (Fig. 12g–i). Meanwhile, the background zonal flow (i.e. the subtropical westerly jet) imports relatively high values of PV from upstream of the vortex and exports relatively low values downstream, explaining the dipole along the northern flank (see also Fig. 6a).
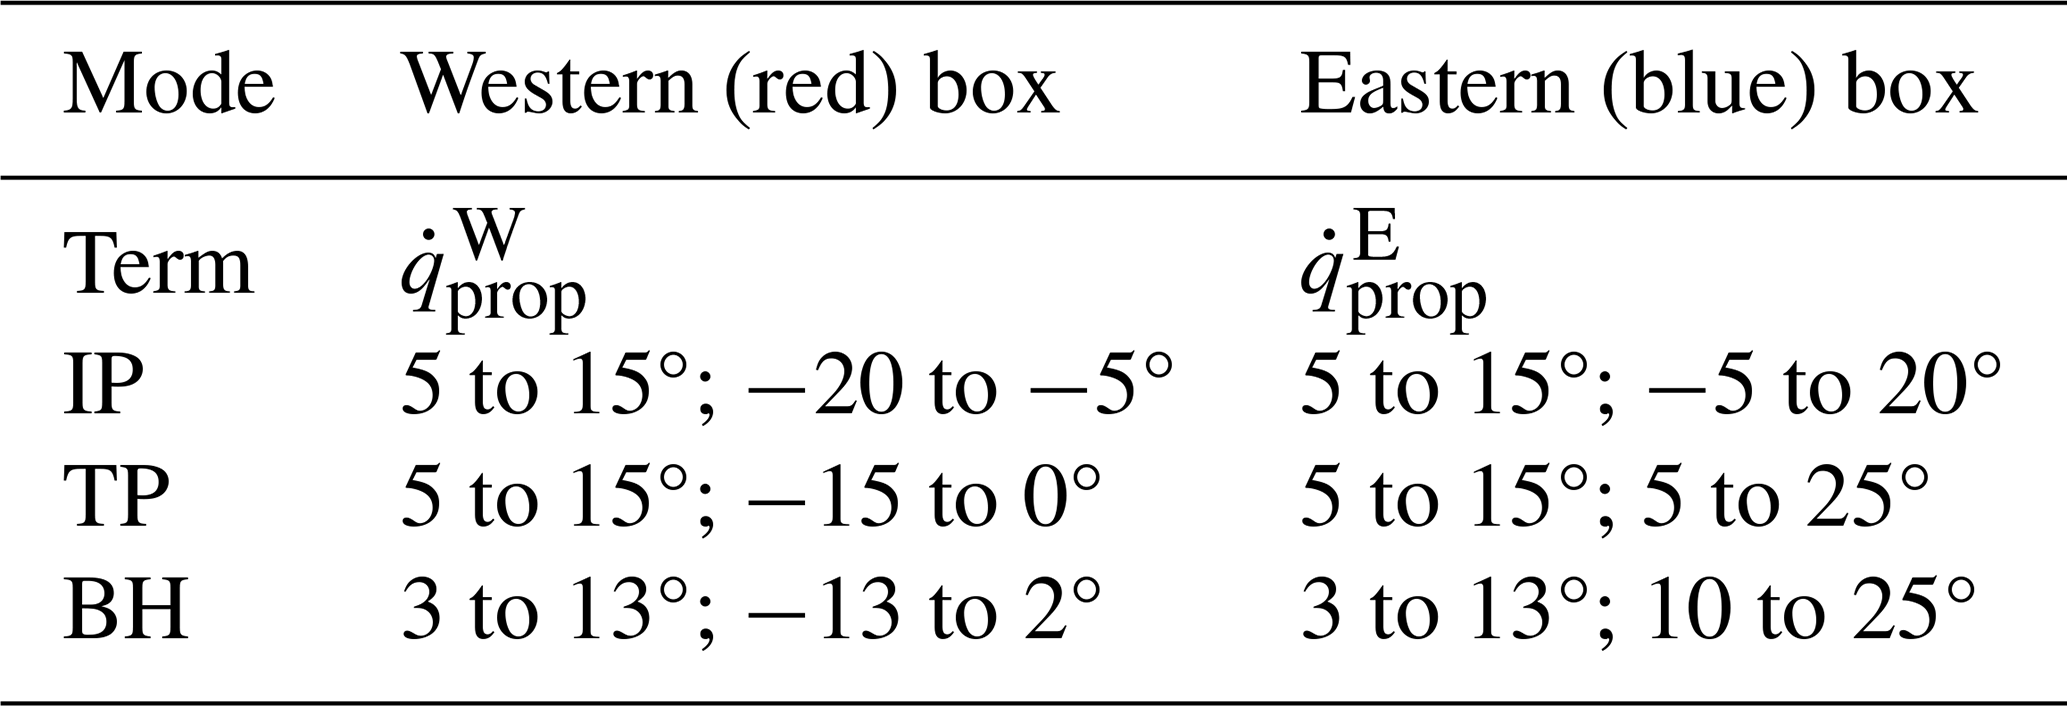
The PV tendency equation provides a useful framework for examining how vortices within the ASMA evolve over time. To better quantify the contributions of each term to intensification and propagation, we take the PV tendencies inside the boxes marked in Fig. 12 to represent vortex development. Propagation is taken to be defined by the dipole situated along the northern flank of the composite vortex, as represented by the red and blue boxes:
where is the average tendency in the red (western) box and is the average tendency in the blue (eastern) box. By this definition, a positive value of indicates an eastward propagation tendency. The locations of the western and eastern boxes for each mode are listed in Table 3. Intensification () is taken to be defined by the monopole straddling the vortex center, defined as the average tendency within the purple boxes outlined in Fig. 12 (−10 to +10° relative longitude and −10 to +5° relative latitude). The same ranges in relative longitude and latitude are used to define for all three vortex modes.
Table 3Geographical ranges in relative latitude and longitude (given as latitude; longitude) for the areas used to calculate the propagation term . Positive values of relative longitude indicate locations east of the vortex center and positive values of relative latitude indication locations north of the vortex center. Colors refer to boundaries outlined in Fig. 12g–i.
The diabatic term Qθ (Eq. 4) is often important for understanding vortex intensification. By analyzing the PV tendency on 370 K, we can directly isolate and quantify the impacts of latent heat release (i.e. convective heating) and radiative heating on the time evolution of PV in each of the three modes relative to those of other processes. The rapid decrease in convective heating with height below the 370 K surface creates a negative PV tendency on that surface (Fig. 11), directly linking convective processes to large-scale dynamics. This negative tendency is supplemented by upward advection of low PV, especially above 360 K (Fig. 8c), but opposed by the increase in radiative heating with increasing height (Fig. 9a). The total diabatic heating term ( + Qθ) features local minima consistent with deep convection near the vortex core (Fig. 11d–f), especially for vortices in the TP and BH modes (Fig. 12a–c). This negative PV tendency reduces radiative spin-down of the anticyclonic circulation, while horizontal PV advection (Fig. 12d–f) introduces the northern dipole pattern.
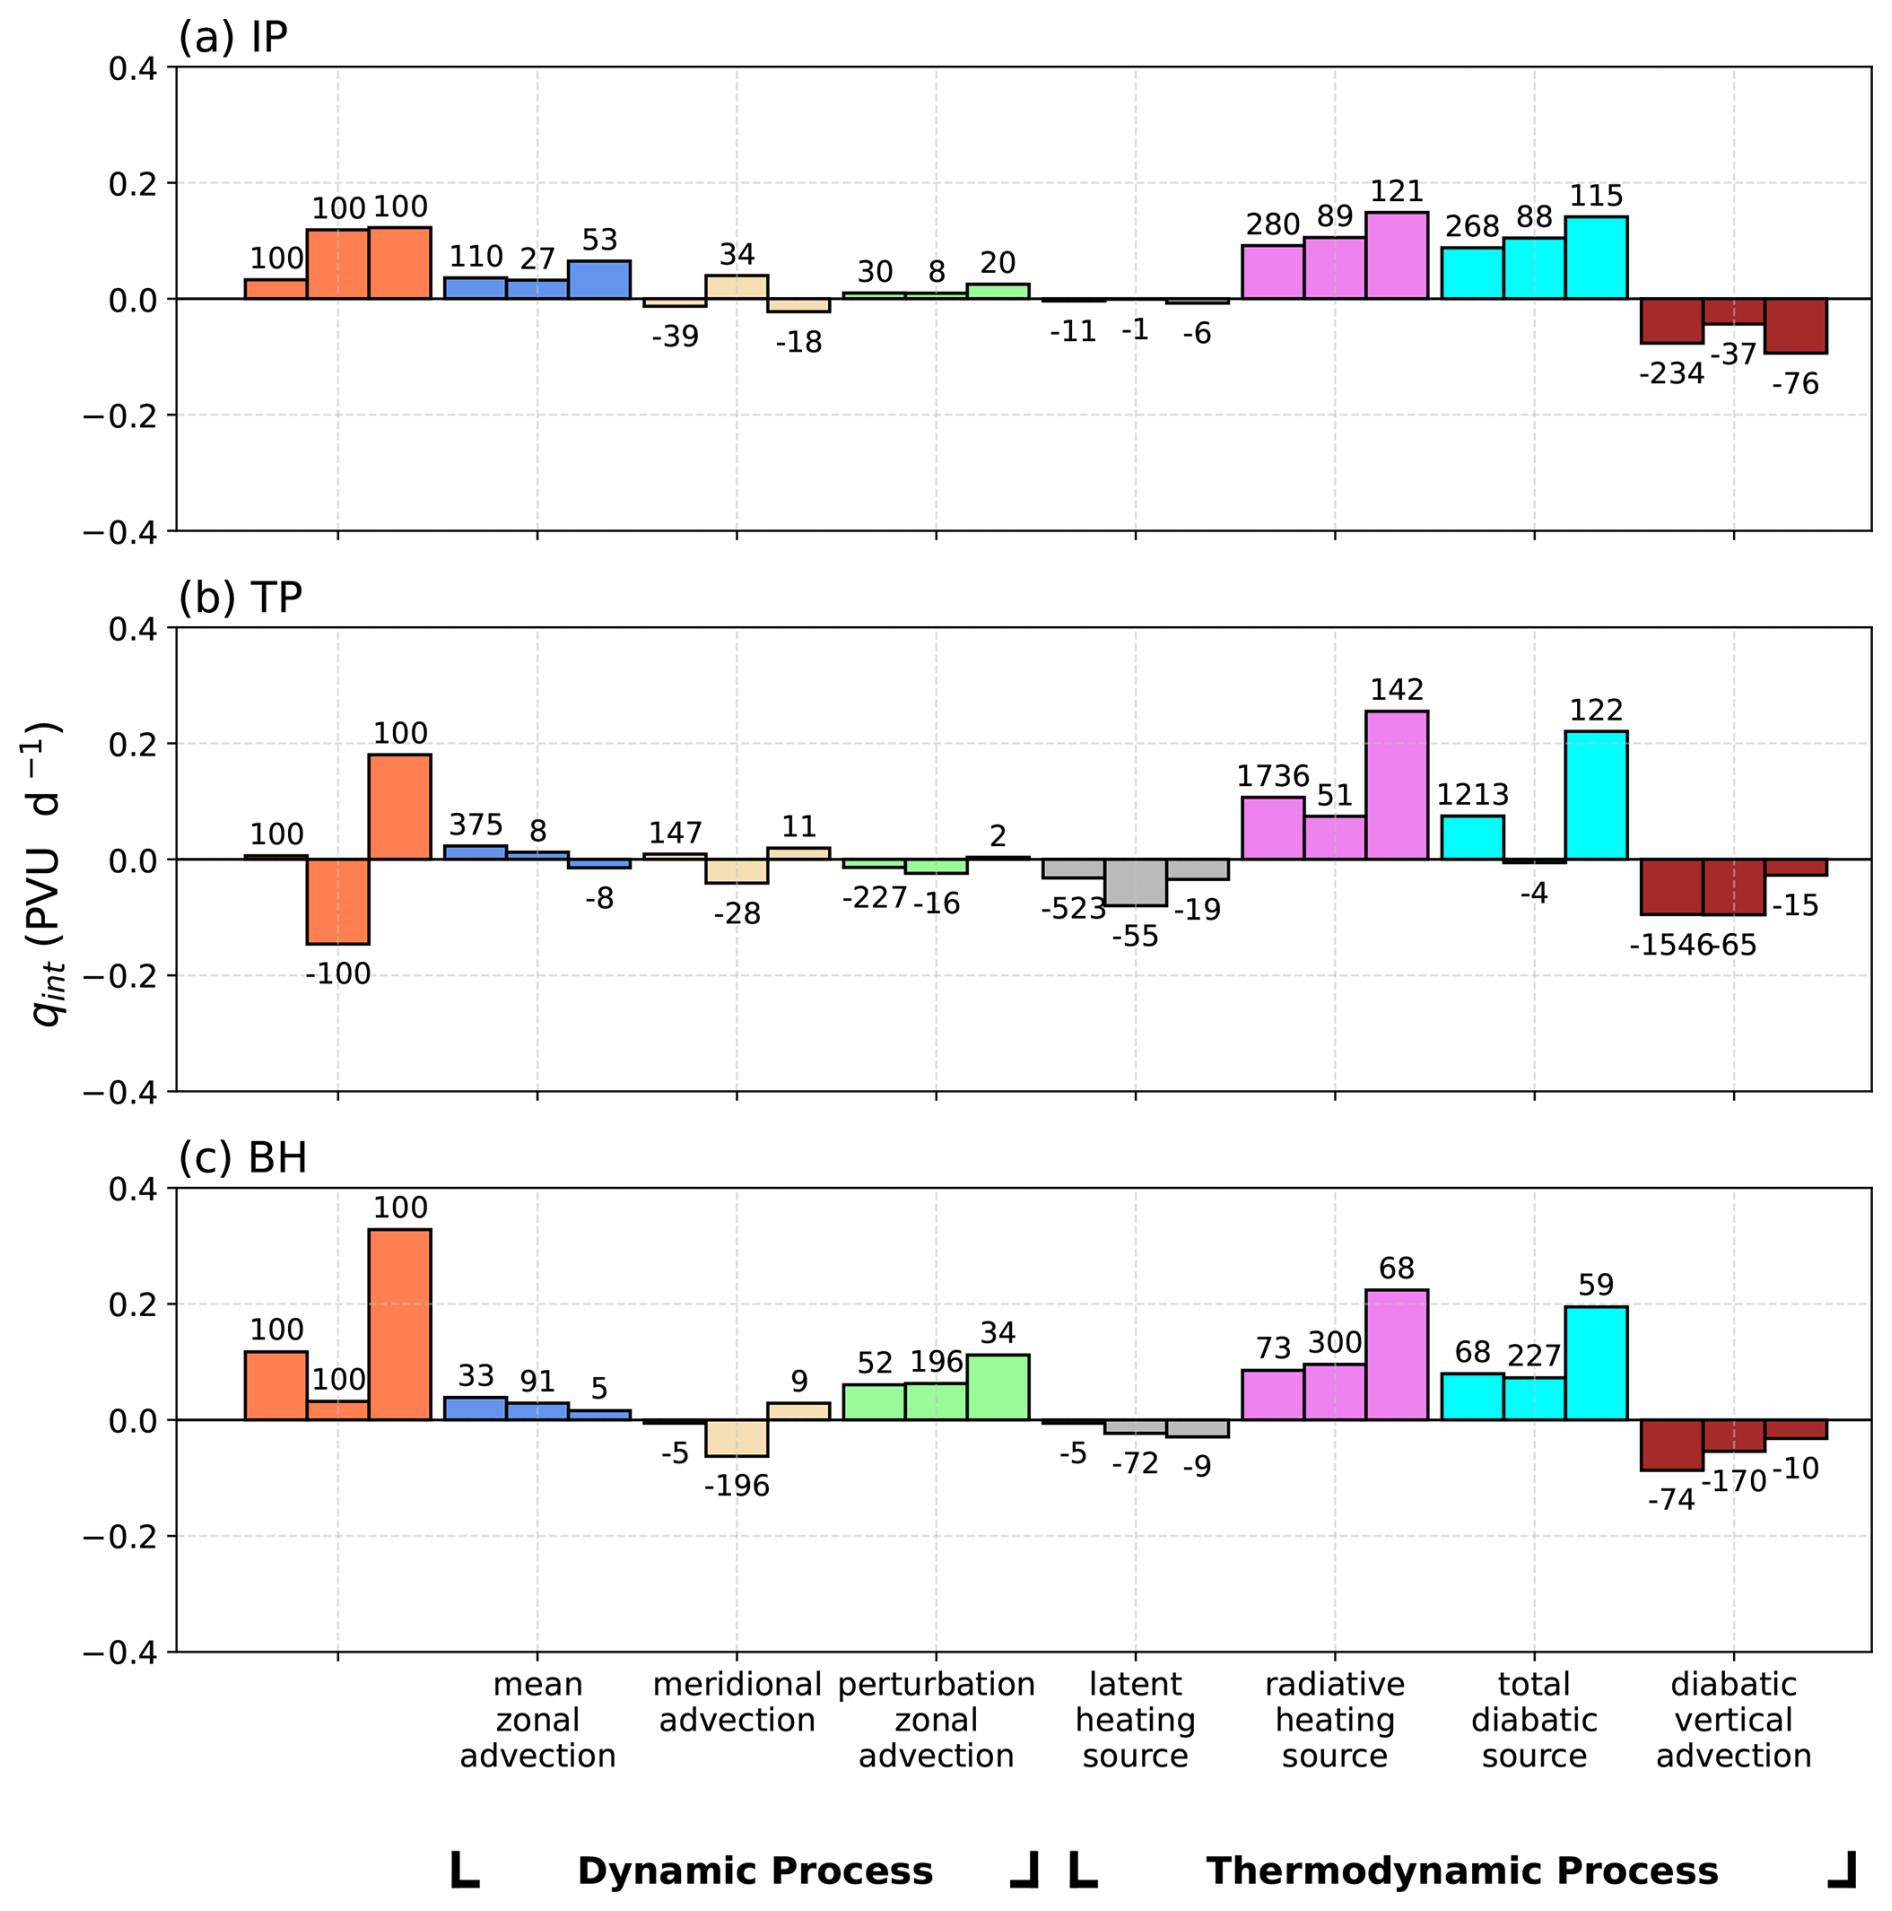
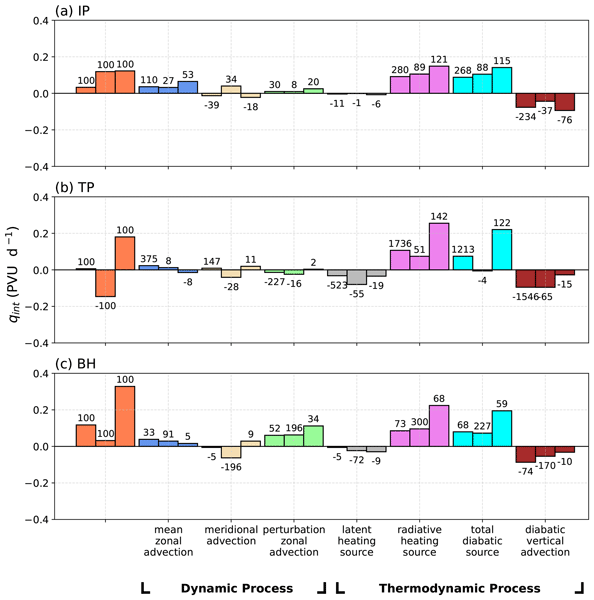
Figure 13Contributions of dynamical and thermodynamic processes in Eq. (5) to mean intensification-oriented PV tendencies in the central monopole (; averaged over the purple boxes in Fig. 12g–i) for vortices in the (a) IP, (b) TP, and (c) BH modes. Each group of three bars corresponds to JRA-3Q on the left, ERA5 in the center, and MERRA-2 on the right. Numbers on the bars denote percentage contributions to the total tendency as shown by the set of orange bars toward the left edge of each panel. Terms include mean zonal advection, meridional advection, perturbation (nonlinear) zonal advection, diabatic vertical advection, and the source terms due to vertical divergence of latent, radiative, and total heating, respectively. See Sect. 3.2 for definitions.
Contributions from each term in Eq. (5) to anticyclone intensification are shown in Fig. 13. A larger positive PV tendency corresponds to a weakening of the anticyclone, whereas negative PV tendencies indicate strengthening. The PV tendency decomposition highlights the common dynamics underlying the maintenance of different ASMA modes, as well as key differences across modes and among reanalysis products. Across all modes, the net advective contributions are small, with substantial compensation among the terms, although the extent of cross-term compensation varies among the different modes. For the IP mode, background zonal advection contributes to weakening anticyclonic vortices, consistent with the location of this mode in the western part of the anticyclone. For the BH mode, nonlinear advective contributions act to weaken vortices, consistent with the location of this mode near the eastern flank of the anticyclone, where the subtropical westerly jet exit region and the tropical easterly jet entrance region create a critical zone that hosts frequent wave breaking. For the TP mode, advective contributions to the intensification monopole are weak, consistent with its location near the center of the climatological ASMA (Nützel et al., 2016). By contrast, diabatic contributions to vortex intensification are larger for the TP mode than for the other two modes. Latent heating and diabatic vertical advection act to strengthen vortices in this mode, whereas radiative heating typically acts to weaken it. The composite-mean balance of these terms varies substantially across the three reanalyses: strengthening in ERA5, weakening in MERRA-2, and near-zero net tendencies in JRA-3Q. Both radiative and non-radiative heating contribute to these differences. The results show greater consistency across the reanalyses for the IP mode, where the latent heating source is weak and the net tendency is dominated by radiative damping offset by diabatic ascent. BH mode vortices are weakly damped in ERA5, moderately damped in JRA-3Q, and strongly damped in MERRA-2. The weaker damping in ERA5 derives from meridional advection-induced strengthening supplementing latent heating and diabatic ascent, while the stronger damping in MERRA-2 is due to greater radiative heating-induced spin-down. Indeed, radiative damping is considerably stronger in MERRA-2 than in the other reanalyses for all three modes, leading to stronger overall vortex damping via net and its total diabatic component in this reanalysis.
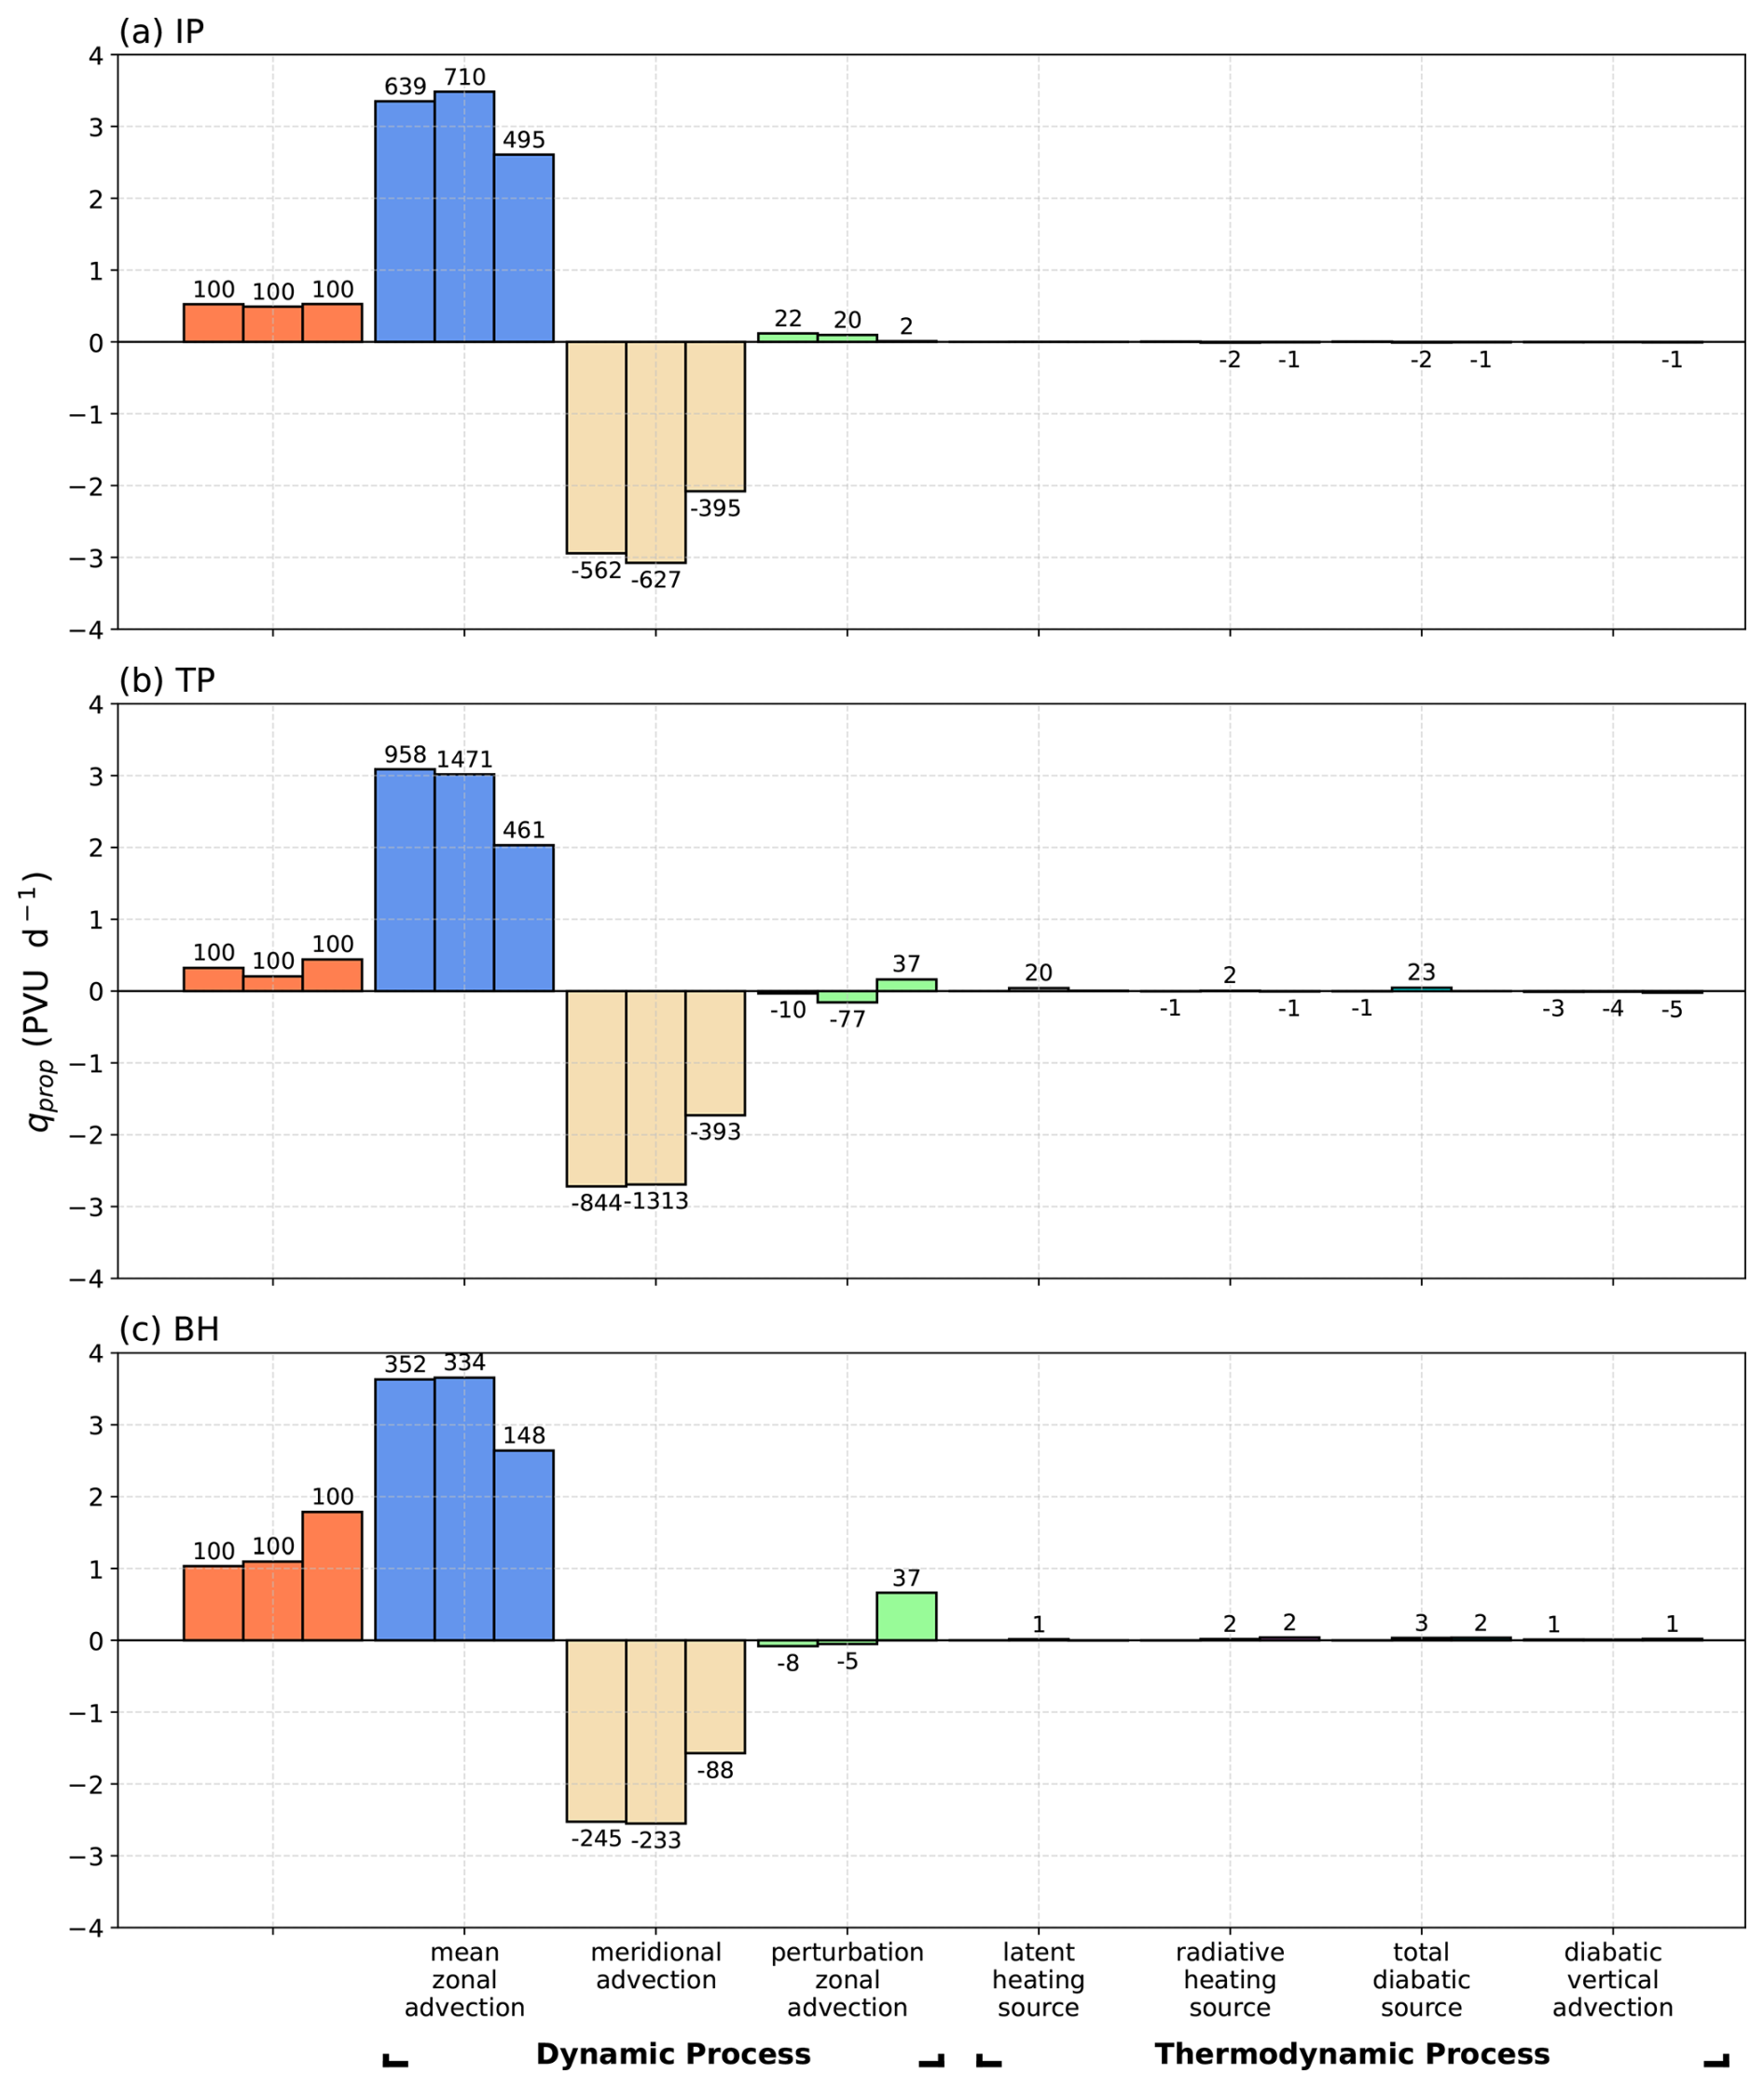
Figure 14 shows contributions from each term in Eq. (5) to anticyclone propagation (), as defined in Eq. (6). Total tendencies are eastward (positive) due to the dominant contributions of zonal advection, indicating the critical influence of the subtropical westerly jet in advecting individual vortices eastward relative to the surface. The balance of all other terms is dominated by meridional advection, which offsets the eastward contribution of the zonal background flow. This contribution indicates that, despite moving eastward on average relative to the surface, the vortices in all three modes typically move westward relative to the background flow due primarily to the meridional advection of potential vorticity, the dominant term governing Rossby wave propagation. Other contributions are negligible by comparison. Both the eastward contribution from mean zonal advection and the westward contribution from meridional advection are considerably weaker in MERRA-2 than in the other two reanalyses, whereas ERA5 and JRA-3Q show close agreement in these primary terms. Inter-reanalysis differences in the overall magnitude of are explained to close approximation by differences in perturbation zonal advection, particularly the stronger eastward propagation tendency of BH-mode vortices in MERRA-2 and the weaker eastward propagation tendency of TP-mode vortices in ERA5.
Our findings on the trimodal structure, PV tendency dynamics, and eddy shedding behavior of the ASMA build upon the work of Nützel et al. (2016) and Siu and Bowman (2020), while helping to resolve key discrepancies, quantify the contributions of previously unaddressed mechanisms, and clarify the sources and scales of uncertainties across different reanalysis products.
A central debate in ASMA research concerns its modal structure. Early studies centered around the concept of bimodality in the ASMA, due in large part to the strong preference toward the IP and TP modes in the NCEP-NCAR reanalysis with support from climate model simulations (Zhang et al., 2002; Zhou et al., 2006; Yan et al., 2011). Nützel et al. (2016) challenged this bimodality based on analysis of 100 hPa geopotential height from the previous generation of reanalysis products used in this work (i.e. ERA-Interim, JRA-55, and MERRA), finding clear evidence of bimodality only in the NCEP-NCAR and NCEP-DOE reanalyses. They proposed that, rather than being bimodal, the center of the ASMA fluctuates across the longitudinal span between the IP and TP centers, neglecting the Western Pacific/BH mode. Our analysis, which employs three modern high-resolution reanalysis datasets (ERA5, JRA-3Q, and MERRA-2) and tracks vortices on the 370 K isentropic surface, supports the modality of the ASMA and highlights the BH within 135–150° E as a robust third mode. The consistency across the three reanalysis products supports the findings of Siu and Bowman (2020), who documented the frequent occurrence of BH vortices using MSF based on the ERA-Interim reanalysis. The discrepancy with Nützel et al. (2016) may arise from two factors. First, Nützel et al. (2016) used pressure-level data (100 hPa) on a slightly higher level and coarser spatial grid, where BH signals may be obscured by strong zonal flow. The isentropic framework adopted here better resolves the UTLS region, where weaker anticyclonic centers are more clearly resolved. Second, Nützel et al. (2016) focused on the June–August period of the peak South Asian monsoon. Our results indicate that the BH mode emerges mainly during August–September, as the Western North Pacific maritime component of the monsoon matures (Wu and Wang, 2001; LinHo and Wang, 2002).
The PV tendency diagnostics presented here extend the work of Garny and Randel (2013), who associated low-PV regions with convective heating but did not explicitly quantify the processes governing PV temporal evolution. Garny and Randel (2013) also noted that pre-existing low-PV conditions over the Asian monsoon region complicate the separation of intrinsic ASMA intensification from background variability. This issue is addressed in the present study by decomposing PV tendency into dynamical (isentropic horizontal advection) and thermodynamic (diabatic) components. Our results indicate that mean zonal and meridional advection are the largest individual contributors to vortex propagation, governing propagation relative to the These tendencies largely offset each other, yielding similar net contributions to vortex propagation despite differences in the amplitudes of individual terms between MERRA-2 and the other two reanalysis products. Contributions to intensification are more variable across the reanalyses, reflecting the pre-eminent contribution of diabatic heating to PV tendencies near the center of the vortex. Manney et al. (2021) documented the ASMA core on 350–410 K isentropic surfaces, but did not investigate PV dynamics. Here, we demonstrate that a dipole in advective PV tendencies (positive to the west of the vortex center and negative to the east) governs the zonal propagation of the anticyclone across its three modes, while a central diabatic monopole governs changes in vortex intensity.
We note a conceptual difference in the diabatic heating decomposition among the three reanalysis products, which introduces uncertainty in the interpretation of the moist physics-related PV tendency terms shown in Figs. 7b, 8b, and 9b. Whereas MERRA-2 and JRA-3Q provide explicit, separate output for radiative and moist physics-related (i.e. LH) temperature tendencies, no direct moist-physics output is available for ERA5. We use non-radiative heating instead, computed as a residual: total physics temperature tendency minus net radiative tendencies (mttpm − mttswr − mttlwr; see Sect. 2). This residual includes contributions from additional parameterised processes (turbulent mixing, gravity-wave drag, etc.), which are explicitly separated from the moist physics terms based on MERRA-2 and JRA-3Q. This methodological mismatch may impact comparisons of the quantitative amplitude of the moist physics-related PV tendencies between ERA5 and the other two reanalyses. However, direct comparison of the spatial patterns of non-radiative versus moist physics PV-tendency anomalies for MERRA-2 and JRA-3Q (Figs. S9–S10) indicates that differences related to this conceptual difference are small. Our core large-scale dynamical conclusions regarding the competition between advection and diabatic forcing, the tripolar PV-tendency signature, and mode-specific differences are not sensitive to this choice, and do not depend on the exact magnitude of the ERA5 residual-estimated non-radiative heating.
Regional characteristics, particularly those related to the underlying surface, further modulate ASMA dynamics. These effects are reflected in the distinct drivers of each mode. The IP mode is shaped by continental-scale advection and moderate diabatic forcing (Fig. 12a, g; see also Figs. S7g and S8g), in which radiative damping outweighs convective intensification on average and acts to dissipate the mode. The TP mode is distinguished by strong latent heating along the southern slope of the Himalayas and the elevated heating of the Tibetan Plateau (Figd. 10 and 11). This localized heating yields a net tendency toward intensification in JRA-3Q (Fig. 12h) and ERA5 (Fig. S7h), but not in MERRA-2 (Fig. S8b, h). The BH mode is governed by strong diabatic heating that emerges over the Western Pacific during the later part of the monsoon heating; however, advection produces a strong propagation tendency in this mode that outweighs a weak diabatic tendency toward intensification near the center of the vortex (Fig. 12c, f, i). Again, the composite balance of terms for this mode based on MERRA-2 (Fig. S8) differs from that based on ERA5 (Fig. S7) or JRA-3Q (Fig. 12), primarily due to a stronger positive radiative tendency (Figs. 8, S4) that may reflect the particularly strong cloud radiative effects characteristic of MERRA-2 (Wright et al., 2020).
Overall, our identification of the three primary vortex modes is consistent with the interpretation of Randel and Park (2006), who argued that distinct modes of the ASMA are aligned with the warmest tropospheric columns. In this context, future work should explore how teleconnections (e.g. ENSO; Yan et al., 2018) modulate ASMA modality and eddy shedding frequency, as well as the impact of anthropogenic forcing (Tweedy et al., 2021; Qie et al., 2025) on the stability and variability of the ASMA.
This study systematically examines the key dynamical mechanisms of the ASMA through comprehensive analyses of three state-of-the-art reanalysis datasets via a PV tendency diagnostic. One robust finding across the three reanalysis products is the trimodal structure of the ASMA during boreal summer, which is characterized by persistent anticyclonic centers over the IP, TP, and BH with a distinct seasonality. This finding clarifies the challenge to bimodality reported by Nützel et al. (2016), suggesting that the broader distributions of ASMA center in more recent reanalysis products results from seasonal migration of the primary longitudinal modes. Our multi-center vortex tracking algorithm further affirms the BH as a distinct third mode that emerges late in the monsoon season as the Western North Pacific monsoon matures (LinHo and Wang, 2002; Siu and Bowman, 2020). The trimodality and its dominant seasonality are highly consistent across the three recent reanalysis products, despite some quantitative discrepancies in MERRA-2. The drivers of vortex evolution highlighted by the composite PV tendency analysis are less robust across the reanalyses, emphasizing continued uncertainties in mechanistic attribution using reanalysis products. Key contributors to inter-reanalysis differences include nonlinear advection and diabatic heating, with substantial contributions from both convective and radiative components of diabatic heating. New budget diagnostics that explicitly include tendencies due to data assimilation (Wright et al., 2025; Zhang et al., 2025) may help to further disentangle these uncertainties.
The ASMA-specific PV tendency diagnostic developed herein extends the PV-based analytical method pioneered by Garny and Randel (2013) by quantifying the dynamical and diabatic contributions to ASMA vortex evolution. Results demonstrate that mean zonal and meridional advection are the predominant drivers of vortex propagation, while total diabatic heating (encompassing latent heating and background radiation) exerts a critical modulating effect on vortex intensity. This diagnostic framework effectively captures a characteristic tripole PV tendency pattern consisting of an advective dipole north of the vortex center and a predominantly diabatic monopole centered slightly south of the vortex center. Our approach takes steps to decouple ASMA intensification from zonal propagation, addressing a noted limitation of conventional PV analysis approaches. Specifically, latent heating enhances the BH mode via negative PV tendencies, whereas background radiation imposes weakening effects on the ASMA as a whole, highlighting the mode-specific regulatory role of thermodynamic processes. The balance of these processes differs substantially across both the three identified vortex modes and the three evaluated reanalysis products.
Eddy shedding is an important driver of ASMA intraseasonal variability with intrinsic links to the trimodal structure of the ASMA. Popovic and Plumb (2001) first identified westward eddy shedding of ASMA, attributing it to baroclinic instability, while Siu and Bowman (2020) linked eastward shedding to BH formation without quantifying underlying mechanisms. Recent observational and modeling studies have reaffirmed the importance of eddy shedding dynamics for the evolution of UTLS composition (e.g. Pan et al., 2022; Bak et al., 2025). Our PV tendency analysis could help to clarify these processes, including key differences between the dynamics of westward-shedding eddies and eastward-shedding eddies. Such an analysis will require a robust, objective approach to identifying eddy shedding events, which will be a central goal of follow-up work, as well as consideration of additional contributions to PV evolution, such as parameterized momentum tendencies and data assimilation.
Collectively, our findings establish a unified theoretical framework for understanding ASMA variability, underscoring the intricate interplay between dynamical advection, thermodynamic forcing, and modal structure. This work advances the scientific understanding of UTLS circulation dynamics while also providing a robust physical basis for improving the predictability of monsoon-related regional climate variability and UTLS tracer transport.
ERA5 products (Hersbach et al., 2017, https://doi.org/10.24381/cds.143582cf; Hersbach et al., 2023, https://doi.org/10.24381/cds.bd0915c6) were acquired from the Copernicus Climate Data Store (CDS; https://cds.climate.copernicus.eu, last access: 19 September 2026). JRA-3Q reanalysis products (JMA, 2022, https://doi.org/10.20783/DIAS.645; JMA, 2023, https://doi.org/10.5065/AVTZ-1H78) were acquired from the Data Integration and Analysis System (DIAS; https://search.diasjp.net/en/dataset/JRA3Q, last access: 19 September 2026) archive maintained by the Japan Agency for Marine-Earth Science and Technology (JAMSTEC) and the University of Tokyo and from the National Center for Atmospheric Research (NCAR) Geoscience Data Exchange (https://gdex.ucar.edu/datasets/d640000, last access: 19 September 2026). MERRA-2 (GMAO, 2015a, https://doi.org/10.5067/WWQSXQ8IVFW8; GMAO, 2015b, https://doi.org/10.5067/9NCR9DDDOPFI) products were acquired from the NASA Goddard Earth Sciences Data and Information Services Center (GES DISC; https://disc.gsfc.nasa.gov, last access: 19 September 2026). Python scripts used to produce the analyses and figures in this study are available on request from the authors.
The supplement related to this article is available online at https://doi.org/10.5194/wcd-7-1853-2026-supplement.
Ninghui Li contributed to conceptualization, data analysis, and drafting the original manuscript; Jonathon Wright provided supervision, draft editing, participated in data analysis, and curated the data; Philip Rupp Alison Ming and Shenglong Zhang were involved in data analysis and manuscript review/editing; Jie Gao contributed to result analysis, provided supervision on the research, and participated in manuscript review/editing.
The contact author has declared that none of the authors has any competing interests.
Publisher's note: Copernicus Publications remains neutral with regard to jurisdictional claims made in the text, published maps, institutional affiliations, or any other geographical representation in this paper. The authors bear the ultimate responsibility for providing appropriate place names. Views expressed in the text are those of the authors and do not necessarily reflect the views of the publisher.
We would like to thank Dr. Leong Wai Siu and Xiangliang Zhang for the advice in vortex tracking. And the paper is benifited a lot from the discussion with Dr. Shenglong Zhang and YuanRui Chen. The authors gratefully acknowledge the financial support of the Department of Science and Technology of Shandong Province and the National Science Foundation of China.
This research has been supported by the Department of Science and Technology of Shandong Province (grant no. ZR2024QD136), and the National Science Foundation of China (grant no. 42275053).
This paper was edited by Juliane Schwendike and reviewed by two anonymous referees.
Amemiya, A.: Dynamics of the quasi-biweekly variability of the Asian monsoon anticyclone, PhD thesis, The University of Tokyo, https://doi.org/10.15083/0002001522, 2018. a
Amemiya, A. and Sato, K.: A Two-Dimensional Dynamical Model for the Subseasonal Variability of the Asian Monsoon Anticyclone, J. Atmos. Sci., 75, 3597–3612, https://doi.org/10.1175/JAS-D-17-0208.1, 2018. a, b, c
Andrew, D. G., Holton, J. R., and Leovy, C. B.: Middle atmosphere dynamics, Academic Press Inc., Orlando, FL, https://www.osti.gov/biblio/5936274 (last access: 19 September 2026), 1986. a
Bak, J., Kim, J., Koo, J.-H., Pan, L. L., Ryoo, J.-M., Newman, P. A., Franchin, A., Liu, X., Abad, G. G., Lee, H.-J., Jeon, W., and Kim, C.-H.: An Integrated Analysis of Ozone and Carbon Monoxide Over the Western Pacific Using Satellite and Aircraft Measurements During the ACCLIP Summer Campaign 2022, J. Geophys. Res.-Atmos., 130, https://doi.org/10.1029/2024jd042771, 2025. a
Bian, J., Li, D., Bai, Z., Li, Q., Lyu, D., and Zhou, X.: Transport of Asian surface pollutants to the global stratosphere from the Tibetan Plateau region during the Asian summer monsoon, Natl. Sci. Rev., 7, 516–533, https://doi.org/10.1093/nsr/nwaa005, 2020. a
Charney, J. G.: On the scale of atmospheric motions, Geofysiske Publikasjoner, 17, 1–17, 1948. a
Enomoto, T.: Interannual Variability of the Bonin High Associated with the Propagation of Rossby Waves along the Asian Jet, J. Meteorol. Soc. Jpn., Ser. II, 82, 1019–1034, https://doi.org/10.2151/jmsj.2004.1019, 2004. a
Enomoto, T., Hoskins, B. J., and Matsuda, Y.: The formation mechanism of the Bonin high in August, Q. J. Roy. Meteor. Soc., 129, 157–178, https://doi.org/10.1256/qj.01.211, 2003. a
Ertel, H.: Ein neuer hydrodynamischer Wirbelsatz, Meteorol. Z., 59, 271–281, 1942. a
Fairlie, T. D., Vernier, J.-P., Natarajan, M., and Bedka, K. M.: Dispersion of the Nabro volcanic plume and its relation to the Asian summer monsoon, Atmos. Chem. Phys., 14, 7045–7057, https://doi.org/10.5194/acp-14-7045-2014, 2014. a
Fu, R., Hu, Y., Wright, J. S., Jiang, J. H., Dickinson, R. E., Chen, M., Filipiak, M., Read, W. G., Waters, J. W., and Wu, D. L.: Short circuit of water vapor and polluted air to the global stratosphere by convective transport over the Tibetan Plateau, P. Natl. Acad. Sci. USA, 103, 5664–5669, https://doi.org/10.1073/pnas.0601584103, 2006. a
Fujiwara, M., Wright, J. S., Manney, G. L., Gray, L. J., Anstey, J., Birner, T., Davis, S., Gerber, E. P., Harvey, V. L., Hegglin, M. I., Homeyer, C. R., Knox, J. A., Krüger, K., Lambert, A., Long, C. S., Martineau, P., Molod, A., Monge-Sanz, B. M., Santee, M. L., Tegtmeier, S., Chabrillat, S., Tan, D. G. H., Jackson, D. R., Polavarapu, S., Compo, G. P., Dragani, R., Ebisuzaki, W., Harada, Y., Kobayashi, C., McCarty, W., Onogi, K., Pawson, S., Simmons, A., Wargan, K., Whitaker, J. S., and Zou, C.-Z.: Introduction to the SPARC Reanalysis Intercomparison Project (S-RIP) and overview of the reanalysis systems, Atmos. Chem. Phys., 17, 1417–1452, https://doi.org/10.5194/acp-17-1417-2017, 2017. a
Garny, H. and Randel, W. J.: Dynamic variability of the Asian monsoon anticyclone observed in potential vorticity and correlations with tracer distributions, J. Geophys. Res.-Atmos., 118, 13421–13433, https://doi.org/10.1002/2013JD020908, 2013. a, b, c, d, e, f, g, h
Gelaro, R., McCarty, W., Suárez, M. J., Todling, R., Molod, A., Takacs, L., Randles, C. A., Darmenov, A., Bosilovich, M. G., Reichle, R., Wargan, K., Coy, L., Cullather, R., Draper, C., Akella, S., Buchard, V., Conaty, A., Silva, A. M. D., Gu, W., Kim, G.-K., Koster, R., Lucchesi, R., Merkova, D., Nielsen, J. E., Partyka, G., Pawson, S., Putman, W., Rienecker, M., Schubert, S. D., Sienkiewicz, M., and Zhao, B.: The Modern-Era Retrospective Analysis for Research and Applications, Version 2 (MERRA-2), J. Climate, 30, 5419–5454, https://doi.org/10.1175/JCLI-D-16-0758.1, 2017. a, b
GMAO: MERRA-2 inst3_3d_asm_Nv: 3d,3-Hourly,Instantaneous,Model-Level,Assimilation,Assimilated Meteorological Fields V5.12.4, Goddard Earth Sciences Data and Information Services Center (GES DISC) [data set], https://doi.org/10.5067/WWQSXQ8IVFW8, 2015a. a
GMAO: MERRA-2 tavg3_3d_tdt_Np: 3d,3-Hourly,Time-Averaged,Pressure-Level,Assimilation,Temperature Tendencies V5.12.4, Goddard Earth Sciences Data and Information Services Center (GES DISC) [data set], https://doi.org/10.5067/9NCR9DDDOPFI, 2015b. a
Hersbach, H., Bell, B., Berrisford, P., Hirahara, S., Horányi, A., Muñoz‐Sabater, J., Nicolas, J., Peubey, C., Radu, R., Schepers, D., Simmons, A., Soci, C., Abdalla, S., Abellan, X., Balsamo, G., Bechtold, P., Biavati, G., Bidlot, J., Bonavita, M., De Chiara, G., Dahlgren, P., Dee, D., Diamantakis, M., Dragani, R., Flemming, J., Forbes, R., Fuentes, M., Geer, A., Haimberger, L., Healy, S., Hogan, R., Hólm, E., Janisková, M., Keeley, S., Laloyaux, P., Lopez, P., Lupu, C., Radnoti, G., de Rosnay, P., Rozum, I., Vamborg, F., Villaume, S., and Thépaut, J.-N.: Complete ERA5 from 1940: Fifth generation of ECMWF atmospheric reanalyses of the global climate, Copernicus Climate Change Service (C3S) Climate Data Store (CDS) [data set], https://doi.org/10.24381/cds.143582cf, 2017. a
Hersbach, H., Bell, B., Berrisford, P., Hirahara, S., Horányi, A., Muñoz-Sabater, J., Nicolas, J., Peubey, C., Radu, R., Schepers, D., Simmons, A., Soci, C., Abdalla, S., Abellan, X., Balsamo, G., Bechtold, P., Biavati, G., Bidlot, J., Bonavita, M., De Chiara, G., Dahlgren, P., Dee, D., Diamantakis, M., Dragani, R., Flemming, J., Forbes, R., Fuentes, M., Geer, A., Haimberger, L., Healy, S., Hogan, R. J., Hólm, E., Janisková, M., Keeley, S., Laloyaux, P., Lopez, P., Lupu, C., Radnoti, G., de Rosnay, P., Rozum, I., Vamborg, F., Villaume, S., and Thépaut, J.-N.: The ERA5 global reanalysis, Q. J. Roy. Meteor. Soc., Society, 146, 1999–2049, https://doi.org/10.1002/qj.3803, 2020. a, b
Hersbach, H., Bell, B., Berrisford, P., Biavati, G., Horányi, A., Muñoz Sabater, J., Nicolas, J., Peubey, C., Radu, R., Rozum, I., Schepers, D., Simmons, A., Soci, C., Dee, D., and Thépaut, J.-N.: ERA5 hourly data on pressure levels from 1940 to present, Copernicus Climate Change Service (C3S) Climate Data Store (CDS) [data set], https://doi.org/10.24381/cds.bd0915c6, 2023. a
Honomichl, S. B. and Pan, L. L.: Transport From the Asian Summer Monsoon Anticyclone Over the Western Pacific, J. Geophys. Res.-Atmos., 125, e2019JD032094, https://doi.org/10.1029/2019JD032094, 2020. a, b, c
Hoskins, B. J. and Rodwell, M. J.: A Model of the Asian Summer Monsoon. Part I: The Global Scale, J. Atmos. Sci., 52, 1329–1340, https://doi.org/10.1175/1520-0469(1995)052<1329:AMOTAS>2.0.CO;2, 1995. a
Hoskins, B. J., McIntyre, M. E., and Robertson, A. W.: On the use and significance of isentropic potential vorticity maps, Q. J. Roy. Meteor. Soc., 111, 877–946, https://doi.org/10.1002/qj.49711147002, 1985. a, b
Hsu, H.-H., Terng, C.-T., and Chen, C.-T.: Evolution of Large-Scale Circulation and Heating during the First Transition of Asian Summer Monsoon, J. Climate, 12, 793–810, https://doi.org/10.1175/1520-0442(1999)012<0793:EOLSCA>2.0.CO;2, 1999. a
JMA: The Japanese Reanalysis for Three Quarters of a Century, Data Integration and Analysis System (DIAS) [data set], https://doi.org/10.20783/DIAS.645, 2022. a
JMA: The Japanese Reanalysis for Three Quarters of a Century (JRA-3Q), NSF National Center for Atmospheric Research [data set], https://doi.org/10.5065/AVTZ-1H78, 2023. a
Kachula, O., Vogel, B., Günther, G., and Müller, R.: An optimization-based approach to track the Asian summer monsoon anticyclone across daily and interannual variability, Atmos. Chem. Phys., 25, 15171–15195, https://doi.org/10.5194/acp-25-15171-2025, 2025. a
Kang, J. M. and Son, S.-W.: Development Processes of the Explosive Cyclones over the Northwest Pacific: Potential Vorticity Tendency Inversion, J. Atmos. Sci., 78, 1913–1930, https://doi.org/10.1175/JAS-D-20-0151.1, 2021. a
Kosaka, Y., Kobayashi, S., Harada, Y., Kobayashi, C., Naoe, H., Yoshimoto, K., Harada, M., Goto, N., Chiba, J., Miyaoka, K., Sekiguchi, R., Deushi, M., Kamahori, H., Nakaegawa, T., Tanaka, T. Y., Tokuhiro, T., Sato, Y., Matsushita, Y., and Onogi, K.: The JRA-3Q Reanalysis, J. Meteorol. Soc. Jpn., Ser. II, 102, 49–109, https://doi.org/10.2151/jmsj.2024-004, 2024. a, b
LinHo and Wang, B.: The Time–Space Structure of the Asian–Pacific Summer Monsoon: A Fast Annual Cycle View, J. Climate, 15, 2001–2019, https://doi.org/10.1175/1520-0442(2002)015<2001:TTSSOT>2.0.CO;2, 2002. a, b
Lorensen, W. E.: History of the Marching Cubes Algorithm, IEEE Comput. Graph., 40, 8–15, https://doi.org/10.1109/MCG.2020.2971284, 2020. a
Manney, G. L., Santee, M. L., Lawrence, Z. D., Wargan, K., and Schwartz, M. J.: A Moments View of Climatology and Variability of the Asian Summer Monsoon Anticyclone, J. Climate, 34, 7821–7841, https://doi.org/10.1175/JCLI-D-20-0729.1, 2021. a, b, c, d, e, f, g
Martineau, P., Wright, J. S., Zhu, N., and Fujiwara, M.: Zonal-mean data set of global atmospheric reanalyses on pressure levels, Earth Syst. Sci. Data, 10, 1925–1941, https://doi.org/10.5194/essd-10-1925-2018, 2018. a
Nützel, M., Dameris, M., and Garny, H.: Movement, drivers and bimodality of the South Asian High, Atmos. Chem. Phys., 16, 14755–14774, https://doi.org/10.5194/acp-16-14755-2016, 2016. a, b, c, d, e, f, g, h, i, j, k, l, m, n, o, p
Nützel, M., Brinkop, S., Dameris, M., Garny, H., Jöckel, P., Pan, L. L., and Park, M.: Climatology and variability of air mass transport from the boundary layer to the Asian monsoon anticyclone, Atmos. Chem. Phys., 22, 15659–15683, https://doi.org/10.5194/acp-22-15659-2022, 2022. a
Pan, L. L., Kinnison, D., Liang, Q., Chin, M., Santee, M. L., Flemming, J., Smith, W. P., Honomichl, S. B., Bresch, J. F., Lait, L. R., Zhu, Y., Tilmes, S., Colarco, P. R., Warner, J., Vuvan, A., Clerbaux, C., Atlas, E. L., Newman, P. A., Thornberry, T., Randel, W. J., and Toon, O. B.: A Multimodel Investigation of Asian Summer Monsoon UTLS Transport Over the Western Pacific, J. Geophys. Res.-Atmos., 127, e2022JD037511, https://doi.org/10.1029/2022JD037511, 2022. a, b
Ploeger, F., Gottschling, C., Griessbach, S., Grooß, J.-U., Guenther, G., Konopka, P., Müller, R., Riese, M., Stroh, F., Tao, M., Ungermann, J., Vogel, B., and von Hobe, M.: A potential vorticity-based determination of the transport barrier in the Asian summer monsoon anticyclone, Atmos. Chem. Phys., 15, 13145–13159, https://doi.org/10.5194/acp-15-13145-2015, 2015. a, b, c
Popovic, J. M. and Plumb, R. A.: Eddy Shedding from the Upper-Tropospheric Asian Monsoon Anticyclone, J. Atmos. Sci., 58, 93–104, https://doi.org/10.1175/1520-0469(2001)058<0093:ESFTUT>2.0.CO;2, 2001. a, b, c, d, e
Qian, Y., Zhang, Q., Yao, Y., and Zhang, X.: Seasonal variation and heat preference of the south asia high, Adv. Atmos. Sci., 19, 821–836, https://doi.org/10.1007/s00376-002-0047-3, 2002. a, b
Qie, K., Tian, W., Bian, J., Xie, F., and Li, D.: Weakened Asian summer monsoon anticyclone related to increased anthropogenic aerosol emissions in recent decades, npj Climate and Atmospheric Science, 8, 140, https://doi.org/10.1038/s41612-025-01026-8, 2025. a
Qie, X., Wu, X., Yuan, T., Bian, J., and Lu, D.: Comprehensive pattern of deep convective systems over the Tibetan Plateau–South Asian monsoon region based on TRMM data, J. Climate, 27, 6612–6626, https://doi.org/10.1175/JCLI-D-14-00076.1, 2014. a
Randel, W. J. and Park, M.: Deep convective influence on the Asian summer monsoon anticyclone and associated tracer variability observed with Atmospheric Infrared Sounder (AIRS), J. Geophys. Res.-Atmos., 111, https://doi.org/10.1029/2005JD006490, 2006. a, b
Ren, R., Zhu, C., and Cai, M.: Linking quasi-biweekly variability of the South Asian high to atmospheric heating over Tibetan Plateau in summer, Clim. Dynam., 53, 3419–3429, https://doi.org/10.1007/s00382-019-04713-4, 2019. a
Rupp, P. M. and Haynes, P. H.: Spatio-temporal stability analysis applied to monsoon anticyclone flow, Q. J. Roy. Meteor. Soc., 146, 1861–1879, https://doi.org/10.1002/qj.3771, 2020. a, b
Rupp, P. and Haynes, P.: Zonal scale and temporal variability of the Asian monsoon anticyclone in an idealised numerical model, Weather Clim. Dynam., 2, 413–431, https://doi.org/10.5194/wcd-2-413-2021, 2021. a, b
Santee, M. L., Manney, G. L., Livesey, N. J., Schwartz, M. J., Neu, J. L., and Read, W. G.: A comprehensive overview of the climatological composition of the Asian summer monsoon anticyclone based on 10 years of Aura Microwave Limb Sounder measurements, J. Geophys. Res.-Atmos., 122, 5491–5514, https://doi.org/10.1002/2016JD026408, 2017. a, b, c
Siu, L. W. and Bowman, K. P.: Unsteady Vortex Behavior in the Asian Monsoon Anticyclone, J. Atmos. Sci., 77, 4067–4088, https://doi.org/10.1175/JAS-D-19-0349.1, 2020. a, b, c, d, e, f, g, h, i, j, k, l, m, n, o, p, q, r
Tamarin, T. and Kaspi, Y.: The Poleward Motion of Extratropical Cyclones from a Potential Vorticity Tendency Analysis, J. Atmos. Sci., 73, 1687–1707, https://doi.org/10.1175/JAS-D-15-0168.1, 2016. a, b
Tegtmeier, S., Krüger, K., Birner, T., Davis, N. A., Davis, S., Fujiwara, M., Homeyer, C. R., Ivanciu, I., Kim, Y.-H., Legras, B., Manney, G. L., Nishimoto, E., Nützel, M., Kedzierski, R. P., Wang, J. S., Wang, T., and Wright, J. S.: Chapter 8: Tropical Tropopause Layer, in: SPARC Report No. 10, WCRP Report 6/2021, edited by: Fujiwara, M., Manney, G., Gray, L., and Wright, J. S., SPARC, Munich, 309–389, https://doi.org/10.17874/800DEE57D13, 2022. a
Tweedy, O., Oman, L. D., Waugh, D. W., Schoeberl, M. R., Douglass, A. R., and Li, F.: Response of the upper-level monsoon anticyclones and ozone to abrupt CO2 changes, J. Geophys. Res.-Atmos., 126, e2021JD034903, https://doi.org/10.1029/2021jd034903, 2021. a, b
Vernier, J. P., Fairlie, T. D., Natarajan, M., Wienhold, F. G., Bian, J., Martinsson, B. G., Crumeyrolle, S., Thomason, L. W., and Bedka, K. M.: Increase in upper tropospheric and lower stratospheric aerosol levels and its potential connection with Asian pollution, J. Geophys. Res.-Atmos., 120, 1608–1619, https://doi.org/10.1002/2014JD022372, 2015. a
Wang, X., Randel, W., Pan, L., Wu, Y., and Zhang, P.: Transient Behavior of the Asian Summer Monsoon Anticyclone Associated With Eastward Eddy Shedding, J. Geophys. Res.-Atmos., 127, e2021JD036090, https://doi.org/10.1029/2021JD036090, 2022. a, b
Wei, W., Zhang, R., Wen, M., Rong, X., and Li, T.: Impact of Indian summer monsoon on the South Asian High and its influence on summer rainfall over China, Clim. Dynam., 43, 1257–1269, https://doi.org/10.1007/s00382-013-1938-y, 2014. a, b
Wright, J. S. and Fueglistaler, S.: Large differences in reanalyses of diabatic heating in the tropical upper troposphere and lower stratosphere, Atmos. Chem. Phys., 13, 9565–9576, https://doi.org/10.5194/acp-13-9565-2013, 2013. a
Wright, J. S., Sun, X., Konopka, P., Krüger, K., Legras, B., Molod, A. M., Tegtmeier, S., Zhang, G. J., and Zhao, X.: Differences in tropical high clouds among reanalyses: origins and radiative impacts, Atmos. Chem. Phys., 20, 8989–9030, https://doi.org/10.5194/acp-20-8989-2020, 2020. a, b
Wright, J. S., Zhang, S., Chen, J., Davis, S. M., Konopka, P., Lu, M., Yan, X., and Zhang, G. J.: Evaluating reanalysis representations of climatological trace gas distributions in the Asian monsoon tropopause layer, Atmos. Chem. Phys., 25, 9617–9643, https://doi.org/10.5194/acp-25-9617-2025, 2025. a, b, c
Wu, R. and Wang, B.: Multi-stage onset of the summer monsoon over the western North Pacific, Clim. Dynam., 17, 277–289, https://doi.org/10.1007/s003820000118, 2001. a
Xue, X., Chen, W., and Hou, S.: The long-term variation in the South Asia High intensity measured by 150-hPa eddy geopotential height, Meteorol. Atmos. Phys., 132, 833–844, https://doi.org/10.1007/s00703-020-00723-8, 2020. a
Yan, R.-C., Bian, J.-C., and Fan, Q.-J.: The Impact of the South Asia High Bimodality on the Chemical Composition of the Upper Troposphere and Lower Stratosphere, Atmospheric and Oceanic Science Letters, 4, 229–234, https://doi.org/10.1080/16742834.2011.11446934, 2011. a, b
Yan, X., Konopka, P., Ploeger, F., Tao, M., Müller, R., Santee, M. L., Bian, J., and Riese, M.: El Niño Southern Oscillation influence on the Asian summer monsoon anticyclone, Atmos. Chem. Phys., 18, 8079–8096, https://doi.org/10.5194/acp-18-8079-2018, 2018. a, b
Zarrin, A., Ghaemi, H., Azadi, M., and Farajzadeh, M.: The spatial pattern of summertime subtropical anticyclones over Asia and Africa: A climatological review, Int. J. Climatol., 30, 159–173, https://doi.org/10.1002/joc.1879, 2010. a
Zhang, D., Huang, Y., Zhou, B., and Wang, H.: Is There Interdecadal Variation in the South Asian High?, J. Climate, 34, 8089–8103, https://doi.org/10.1175/JCLI-D-21-0059.1, 2021. a
Zhang, Q., Wu, G., and Qian, Y.: The Bimodality of the 100 hPa South Asia High and its Relationship to the Climate Anomaly over East Asia in Summer, J. Meteorol. Soc. Jpn, Ser. II, 80, 733–744, https://doi.org/10.2151/jmsj.80.733, 2002. a, b, c, d, e, f, g
Zhang, S., Chen, J., Wright, J. S., Davis, S. M., Gao, J., Konopka, P., Li, N., Lu, M., Tegtmeier, S., Yan, X., Zhang, G. J., and Zhu, N.: Covariability of dynamics and composition in the Asian monsoon tropopause layer from satellite observations and reanalysis products, Atmos. Chem. Phys., 25, 10109–10139, https://doi.org/10.5194/acp-25-10109-2025, 2025. a, b, c
Zhou, N., Yu, Y., and Qian, Y.: Simulations of the 100-hPa South Asian High and precipitation over East Asia with IPCC coupled GCMs, Adv. Atmos. Sci., 23, 375–390, https://doi.org/10.1007/s00376-006-0375-9, 2006. a, b