
the Creative Commons Attribution 4.0 License.
the Creative Commons Attribution 4.0 License.
 | 13 Oct 2026
The development and persistence of doldrums over the Great Barrier Reef
Lara S. Richards

Michael A. Barnes
Chenhui Jin
Fadhlil R. Muhammad
Daniel P. Harrison
Steven T. Siems
Marine heatwaves and coral bleaching pose significant threats to the Great Barrier Reef (GBR), particularly during austral summer when atmospheric conditions can significantly enhance ocean surface warming. One such condition is the development of doldrums, characterised by weak winds and reduced cloud cover, which promote increased solar heating of the ocean surface. When these conditions persist, this buildup of heat can develop into marine heatwaves contributing to widespread coral bleaching. Despite these impacts, the formation and persistence of the doldrums remain poorly understood. Here, we identify doldrums events over the GBR through a K-means cluster analysis and investigate the tropical and extratropical interactions associated with their onset and maintenance. Expanding upon previous links between doldrums formation and Rossby waves, the cyclonic anomaly within the Rossby wave packet is found to disrupt the typical trade wind easterlies over the GBR through anomalous westerlies over eastern Australia. If the cyclonic anomaly propagates east quickly, the doldrums tend to cease; if the anomaly stalls, the doldrums tend to persist. These stalled Rossby wave packets are associated with repeated cyclonic Rossby wave breaking over Australia, which weakens the zonal flow and enhances blocking near New Zealand. Concurrently, favourable conditions are needed in the tropics to establish and maintain the doldrums. During longer doldrums, the slower-moving Madden–Julian Oscillation and Equatorial Rossby wave more frequently align their suppressed phases over the GBR, reinforcing anomalous westerlies to further counter the trade easterlies. Finally, Lagrangian trajectory analysis reveals that dry descending air within the doldrums typically originates in the mid-latitudes. Here, the positioning of the cyclonic anomaly or cut-off low forces the parcels to sweep across southern Australia over the dry interior before reaching the GBR. Together, these results highlight the tropical-extratropical interactions that promote the doldrums persistence over the GBR and favours the development of both marine and terrestrial heatwaves.
- Article
(16277 KB) - Full-text XML
- BibTeX
- EndNote


The doldrums refers to regions of calm winds (usually ≤ 3 m s−1) found close to the equator, migrating seasonally following the inter-tropical convergence zone (ITCZ), monsoon trough, and other areas of tropical convergence (Klocke et al., 2017; Windmiller, 2024). The doldrums reside between the northern and southern hemisphere trade wind regions, where persistent easterly winds converge towards the equator (Crowe, 1950; Riehl et al., 1951; Wyrtki and Meyers, 1976). In the summer hemisphere, poleward excursions of the ITCZ or monsoon trough can cause these trade winds to weaken and collapse, allowing doldrums to form in higher latitudes, often within the subtropics (Wyrtki and Meyers, 1976; Klocke et al., 2017; Richards et al., 2026).
Although early meteorological studies examined the structure of the trade winds and doldrum regions (Crowe, 1950, 1951; Riehl et al., 1951), scientific interest declined as reliance on wind-powered sailing diminished. More recently, studies of the doldrums have made a resurgence through the lens of renewable energy, as wind droughts have a severe impact on the energy grid (Richardson et al., 2023). Most existing literature, however, focuses on high-latitude wind droughts, with low wind areas likely forming differently from those associated with the tropics and ITCZ, where renewable energy is studied less. Despite this, reports of “calm and clear” conditions or doldrums have been a feature of thermal coral bleaching studies since at least the 1960's (Glynn, 1968).
Coral reefs, such as the Great Barrier Reef (GBR), are located in the subtropical trade wind regions. The temperatures of the relatively shallow waters in which the corals are located are heavily influenced by the overlying weather patterns (Skirving et al., 2006), with shifts from trades to the calm doldrums resulting in rapid heating events. During austral summer, the breakdown of the trades reduces the latent heat flux and therefore evaporative cooling (Karnauskas, 2020; Richards et al., 2024), while also reducing ocean mixing (Skirving et al., 2006). Convection is also suppressed with cloud cover dominated by shallow cumulus (Richards et al., 2026), allowing more solar radiation into the upper ocean, further exacerbating the ocean heat stress (Zhao et al., 2021, 2022). When these conditions persist, heat stress can quickly accumulate and develop into marine heatwaves and mass coral bleaching events (CBEs). For example, the recent 2024, 2022, 2020, 2016, and 1998 GBR bleaching events all showed evidence of repeated doldrums formation and resultant heating spikes during the summer period (Skirving and Guinotte, 2000; Bainbridge, 2017; Karnauskas, 2020; McGowan and Theobald, 2023; Richards et al., 2024, 2026).
While the impacts of doldrums on coral reefs are well studied, the processes leading to their formation and persistence are less clear. Recent work by Windmiller (2024) noted that Atlantic doldrums are actually regions of net descent, not ascent. Similar profiles of descent for GBR doldrums were found by Richards et al. (2026). This work details an anomalously warm and moist surface layer capped by a region of dry descending air. While the doldrums are not completely cloud-free, heavy rainfall is rare during these periods, allowing heat and humidity to persist (Windmiller, 2024; Richards et al., 2024, 2026). Synoptic analysis of the 2022 CBE, indicated that the breakdown of the trade winds is often preceded by repeated Rossby wave breaking (RWB) (the overturning of the upper-level jet stream) and cut-off low formation over eastern Australia (Richards et al., 2024). Richards et al. (2026) later identified these cut-off lows as the start of a large Rossby wave packet that extends across the Pacific during the doldrums. However, no analysis was performed on how these Rossby waves connect to the doldrums formation and what other weather systems may be involved in their formation and maintenance.
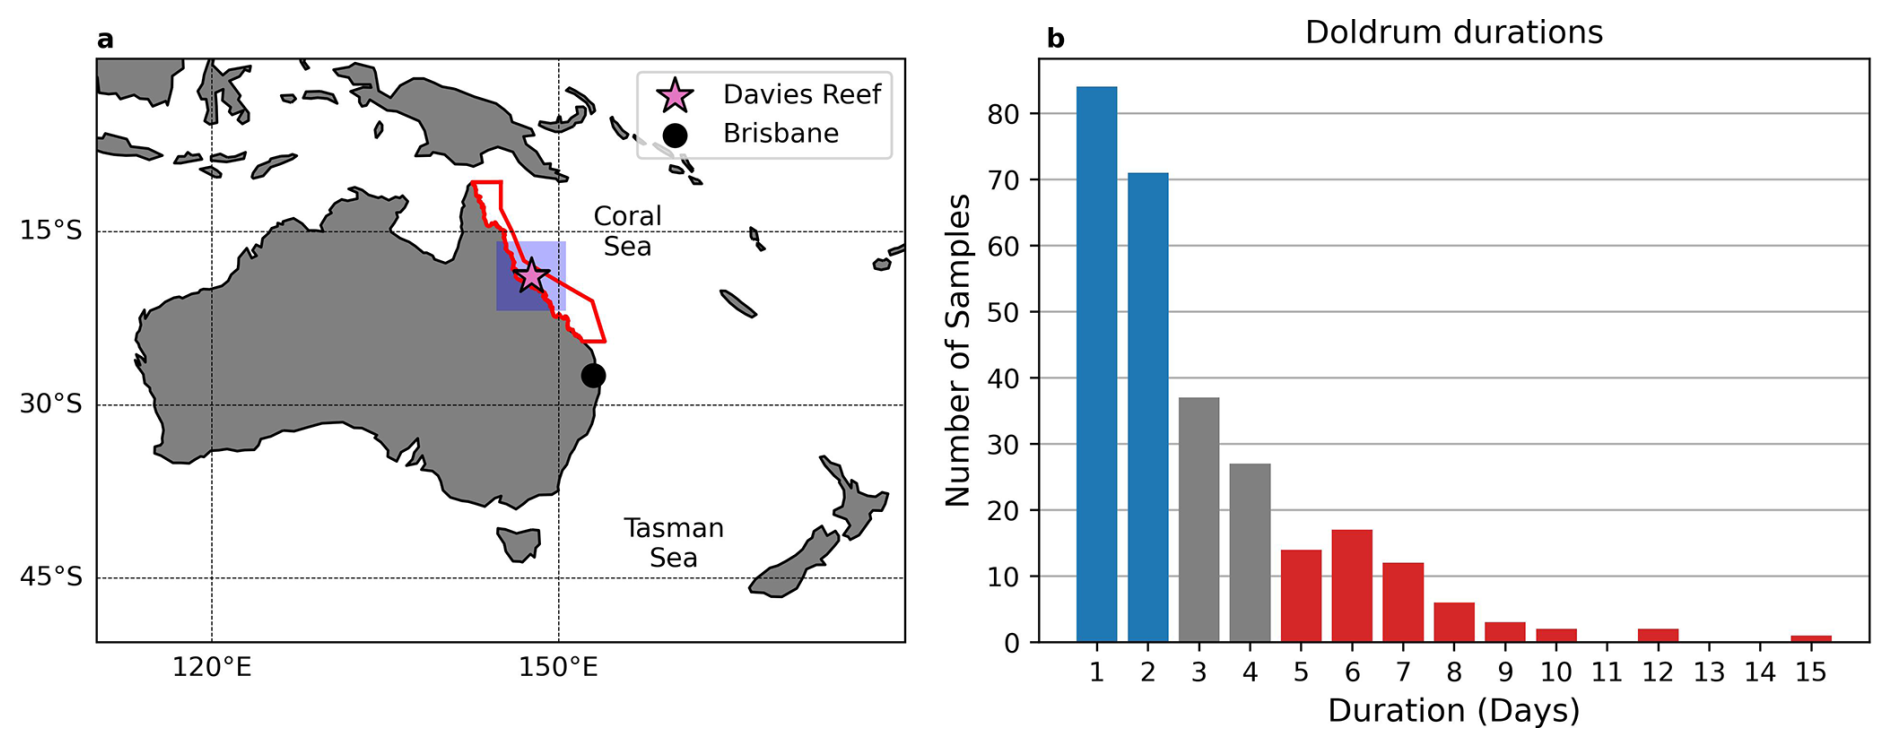
Figure 1Panel (a) shows a map of the study area marking the location of the study site Davies Reef (pink star) within the GBR (red outline). The blue box marks the locations where the back trajectories are launched from. Panel (b) shows the number of consecutive doldrums events cases within the 835 cluster days. Blue (red) bars denote the short (long) duration cases used in this study.
Several weather extremes in Australia are linked to the passage of Rossby waves and RWB (O'Brien and Reeder, 2017). In the extratropics, the development of blocking anticyclones and heatwaves (Parker et al., 2014; Boschat et al., 2014; Quinting and Reeder, 2017; Ali et al., 2022; Henderson et al., 2024) as well as extreme fire weather (Reeder et al., 2015) over southern Australia are commonly influenced by RWB. Rossby waves often interact with tropical processes such as the Australian monsoon, typically referred to as tropical-extratropical interactions. Here, RWB can trigger monsoon bursts (Berry and Reeder, 2016; O'Brien and Reeder, 2017) or cause devastating floods when the Rossby waves break into stalling cut-off lows (de Vries, 2021; Barnes et al., 2023; Robinson et al., 2024). While in the subtropics, RWB is also linked to heatwaves over the Brisbane region (see Fig. 1a), creating areas of weak winds and subsidence (Quinting et al., 2018). These shared dynamical features suggest that the formation of GBR doldrums may similarly arise from coupled tropical-extratropical Rossby wave processes.
Within the tropics, modes of variability may further modulate the development of doldrums over the GBR. Previous studies have linked GBR doldrums and coral bleaching to the Madden–Julian Oscillation (MJO), although this relationship is not always consistent. The MJO can influence convection and wind patterns over northern Australia (Madden and Julian, 1972; Wheeler et al., 2009). Thus, the passage of the active MJO can cool the GBR as cloud cover and wind speeds increase (Benthuysen et al., 2018, 2021; Gregory et al., 2024). However, MJO phases 6–7 also more often occur during GBR doldrums, potentially due to anomalous westerlies opposing the climatological trade easterlies (Richards et al., 2026). Other studies have also noted the MJO can be weak/inactive during doldrum-related CBEs (Zhao et al., 2024; Richards et al., 2024), indicating the MJO alone is unlikely to drive the doldrums formation. Other modes of tropical variability, such as the Equatorial Rossby (ER) wave may then contribute to the doldrums formation, through both their interactions with the MJO and influence on tropical moisture and circulation patterns (Muhammad et al., 2024; Robinson et al., 2025). Exploring the relationship between doldrums and tropical wave activity may therefore provide further insight into the mechanisms governing their formation and persistence.
In this study, we build on the work of Richards et al. (2026) to investigate both the development and persistence of doldrum conditions over the summertime Great Barrier Reef. By separating the doldrums dataset into short and long periods, we perform a lead-lag analysis to investigate the roles of tropical and extratropical wave dynamics before, during, and after the doldrums' lifetime.
2.1 Data
Following Richards et al. (2026), synoptic typing was undertaken using a K-means cluster analysis undertaken for Davies Reef (18.83° S, 147.63° E, central GBR, see Fig. 1a) covering the 1996–2024 December–April period. The clustering data incorporates air and dew point temperatures as well as the horizontal wind components from the surface, 925, 850, 700, 600, and 500 hPa. Five clusters were identified, one of which is the doldrums cluster (835 d), notable for weak winds within the boundary layer. Consecutive doldrums cluster days are grouped into events which are further separated into short (≤ 2 d, 155 samples, 226 d) and long duration (≥ 5 d, 57 samples, 390 d) events, noting the distribution of events is naturally heavily skewed towards shorter events (Fig. 1b). Five days was chosen as it represents the upper 20 % of doldrums samples. We analyse the identified short and long duration events by conducting a lead-lag analysis centred on the first day of each event (denoted as day 0).
This study largely relies on the European Centre for Medium-Range Weather Forecasts (ECMWF) 5th generation reanalysis (ERA5), with a 0.25° horizontal grid spacing on 37 pressure levels (Hersbach et al., 2020). Anomalies are calculated relative to a 15 d rolling mean day-of-year based climatology re-gridded to 1° resolution covering the same period as the cluster analysis. We then produce similar anomalies for the closest grid point to Davies Reef (18.75° S, 147.75° E) for the full atmospheric profile of specific humidity and vertical velocity in pressure coordinates.
2.2 Extratropical dynamics
We first analyse the phasing of mid-latitude Rossby waves and their influence on moisture transport and vertical motion. To assess this, we derive anomalies of 500 hPa geopotential heights, mean sea-level pressure (MSLP), 500 hPa and 10 m horizontal winds, 850 hPa air temperatures, 400–600 hPa averaged omega, and total column water vapour (TCWV). Statistical testing using a simple one-sided t-test to show that the mean anomalies are significantly different from zero was conducted on the 850 hPa air temperature, 400–600 hPa omega and TCWV anomalies at the 95 % confidence level. To support the mid-latitude Rossby wave analysis, we calculate the frequency of both cyclonic and anticyclonic breaking zones across the southern hemisphere, as RWB is more frequent during austral summer (Reeder et al., 2015). From a potential vorticity (PV) perspective, RWB is seen as the rapid, irreversible deformation of PV contours on isentropic surfaces where cyclonic and anticyclonic denote the direction of breaking (McIntyre and Palmer, 1983, 1984). Using the dataset described in Barnes et al. (2025), RWB zones are calculated on the 315, 330, and 350 K isentropic surfaces and are calculated on 6-hourly intervals. Each breaking zone creates a binary mask outlining the region where at least three crossings of the -2 potential vorticity unit (PVU) contour (1 PVU K kg−1 m2 s−2) occur at a single longitude. We consider the 00:00 UTC and the preceding 18 h as the same day for the three potential temperature levels and create a union of the four time steps into a single binary mask. This mask is then flattened into a 1-D binary array marking which longitudes have experienced RWB in the 24 h period.
Finally, the frequency of atmospheric blocking is evaluated using a blocking index based on the Tibaldi et al. (1994) method that assesses meridional reversals in mid-tropospheric geopotential heights. The Tibaldi et al. (1994) method was found to best capture southern hemisphere blocking compared to other methods (Pook et al., 2013), which only occurs on around 10 % of days in austral summer over the Tasman region (Tibaldi et al., 1994; Sinclair, 1996; Berrisford et al., 2007). To adjust for the higher resolution ERA5 data in comparison to the original dataset with which the method was developed, the ERA5 data is first coarsened to 7.5° longitude blocks with a 3 d persistence criterion applied as in Henderson et al. (2025) to create a simple binary index that quantifies if a longitude is blocked.
2.3 Tropical dynamics
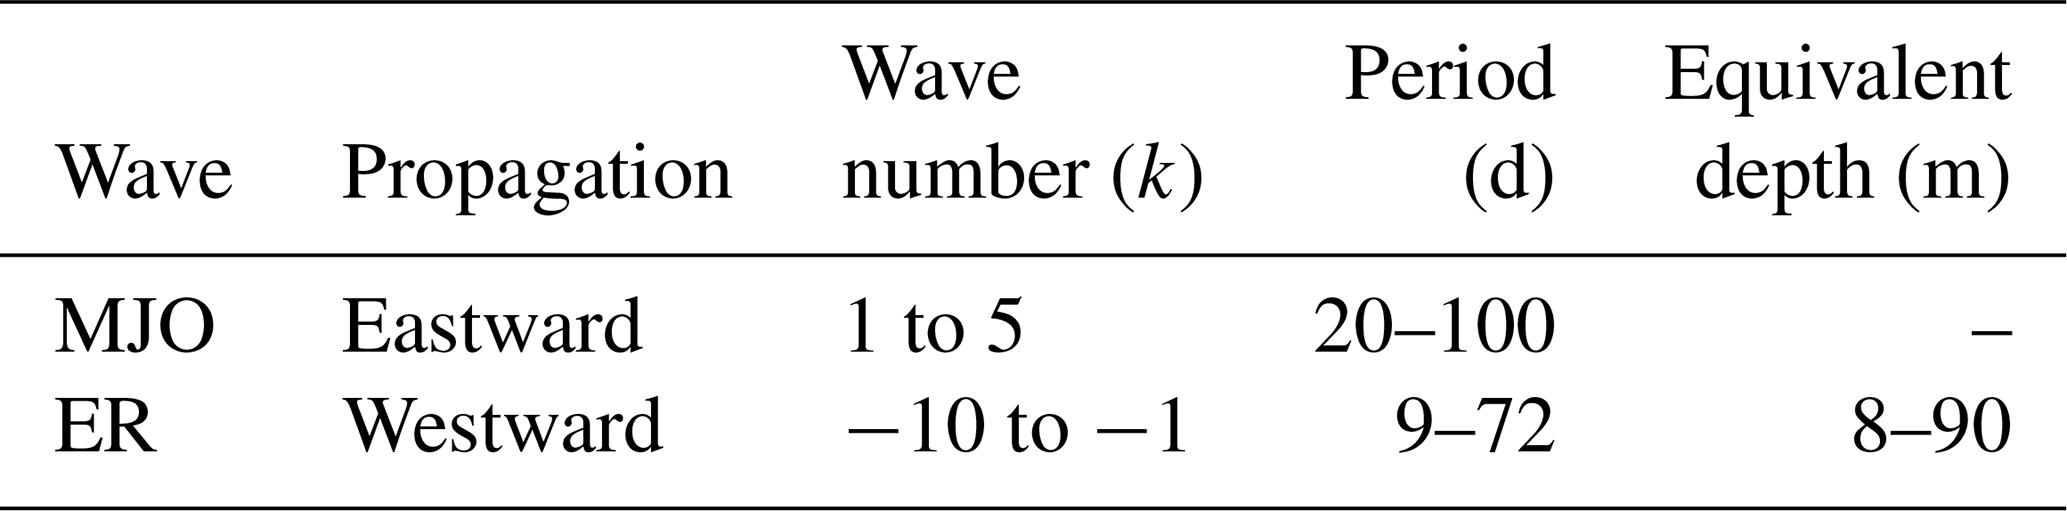
Along with mid-latitude Rossby waves, we assess the timing, frequency and strength of two tropical waves: Equatorial Rossby (ER) waves and the Madden–Julian Oscillation (MJO). ER waves and the MJO are identified using the filtering techniques as described in Muhammad et al. (2024) following the details in Table 1, where a local wave activity can be produced relative to any longitude. Here, the 148° E longitude reference is used to mark when the active wave is closest to the central GBR. An additional three tropical waves were also initially assessed (Kelvin Waves, Tropical Depression type waves and Mixed Rossby-Gravity waves), although their faster propagation speeds had little impact on the results and are therefore not analysed in detail.
Table 1Wave filtering details as described in Muhammad et al. (2024).
2.4 Parcel trajectories
To trace the origin of the dry descending air over the GBR in the long doldrums, we utilise the Langrangian trajectory analysis tool LAGRANTO v2.0 (Wernli and Davies, 1997; Sprenger and Wernli, 2015) which runs on ERA5 data taken at 6-hourly intervals. Five-day back trajectories are launched every 0.5° within a 6° ×6° box centred over Davies Reef (Fig. 1a) at the 23 pressure levels between 1000 and 200 hPa, creating 3887 launch points for each day. The trajectories are launched at 00:00 UTC for each of the 390 total long doldrums days and are separated into those launched from the boundary layer ≥ 800 hPa and those launched from the middle atmosphere (< 800 hPa).
Parcels of dry, descending air, termed “dry intrusions” are often studied over the mid-latitudes in relation to extratropical cyclones. Dry intrusions are defined using a descent over a fixed time threshold, the most common being ≥ 400 hPa in 48 h (Raveh-Rubin, 2017), typically used for mid-latitude dry intrusions. In the tropics, studies of dry intrusions note weaker descent rates within tropical dry intrusions, particularly as the parcels reach their point of interest (Aemisegger et al., 2021; Aslam et al., 2023). Thus, to trace the dry, descending air mass in this study, we employ a modified version of Raveh-Rubin (2017)'s dry intrusion method and consider parcels that descend > 250 hPa in the 48 h before they arrive at Davies Reef.
LAGRANTO is further used to identify warm conveyor belts (WCB) associated with extratropical cyclones on the Australian east coast. WCBs provided a dynamical link between the tropics and extratropics through the polewards transport of warm, moist air that can intensify extratopical weather systems like blocking anticyclones (Eckhardt et al., 2004; Pfahl et al., 2015). Following Madonna et al. (2014), WCBs are identified during short and long doldrums by launching 48 h forwards trajectories from 14 equidistant levels between 1050 to 790 hPa within the box 100–180° E and 0–60° S. First, we consider only the trajectories that ascend ≥ 600 hPa. To exclude tropical convection, trajectories must leave the tropical band (25° N–25° S) by hour 24. A clustering criteria that considers all trajectories within 250 km of each other as one WCB bundle is then applied. Finally, to isolated the WCBs interacting with the east coast, we consider only the WCB bundles that have at least one trajectory forming within the box 140–170° E and north of 45° S.
3.1 Extratropical dynamics
The extratropical influence on the development and persistence of the doldrums is shown by a Hovmöller diagram of the 500 hPa geopotential height anomalies with the blocking frequency and cyclonic/anticyclonic RWB frequency (Fig. 2). Both the short and long duration cases indicate the passage of a Rossby wave packet with the cyclonic anomaly passing over eastern Australia close to day 0 (Fig. 2). Comparing the short and long cases, the Rossby wave packet propagates faster in the short cases (∼ 9.6 and ∼ 6.8 m s−1 respectively) and is more present upstream of the initial doldrums formation, while the long cases have very little wave propagation and resides downstream of the doldrums (Fig. 2a, d). In the short cases, the cyclonic anomaly moves over the east coast at roughly day-3 and moves towards New Zealand as the Rossby wave packet eventually dissipates in the Central Pacific. Conversely, for long-duration cases the cyclonic anomaly forms and moves over the Australian east coast by day-1 where it is also difficult to see a clear wave propagation pattern upstream of the doldrums formation (Fig. 2d). From here, the signal of the Rossby wave packet amplifies as it moves across the Pacific, notably stalling over New Zealand and the central Pacific. Unsurprisingly, the blocking frequency is larger in the long-duration cases, marking the stalled anticyclone over New Zealand.
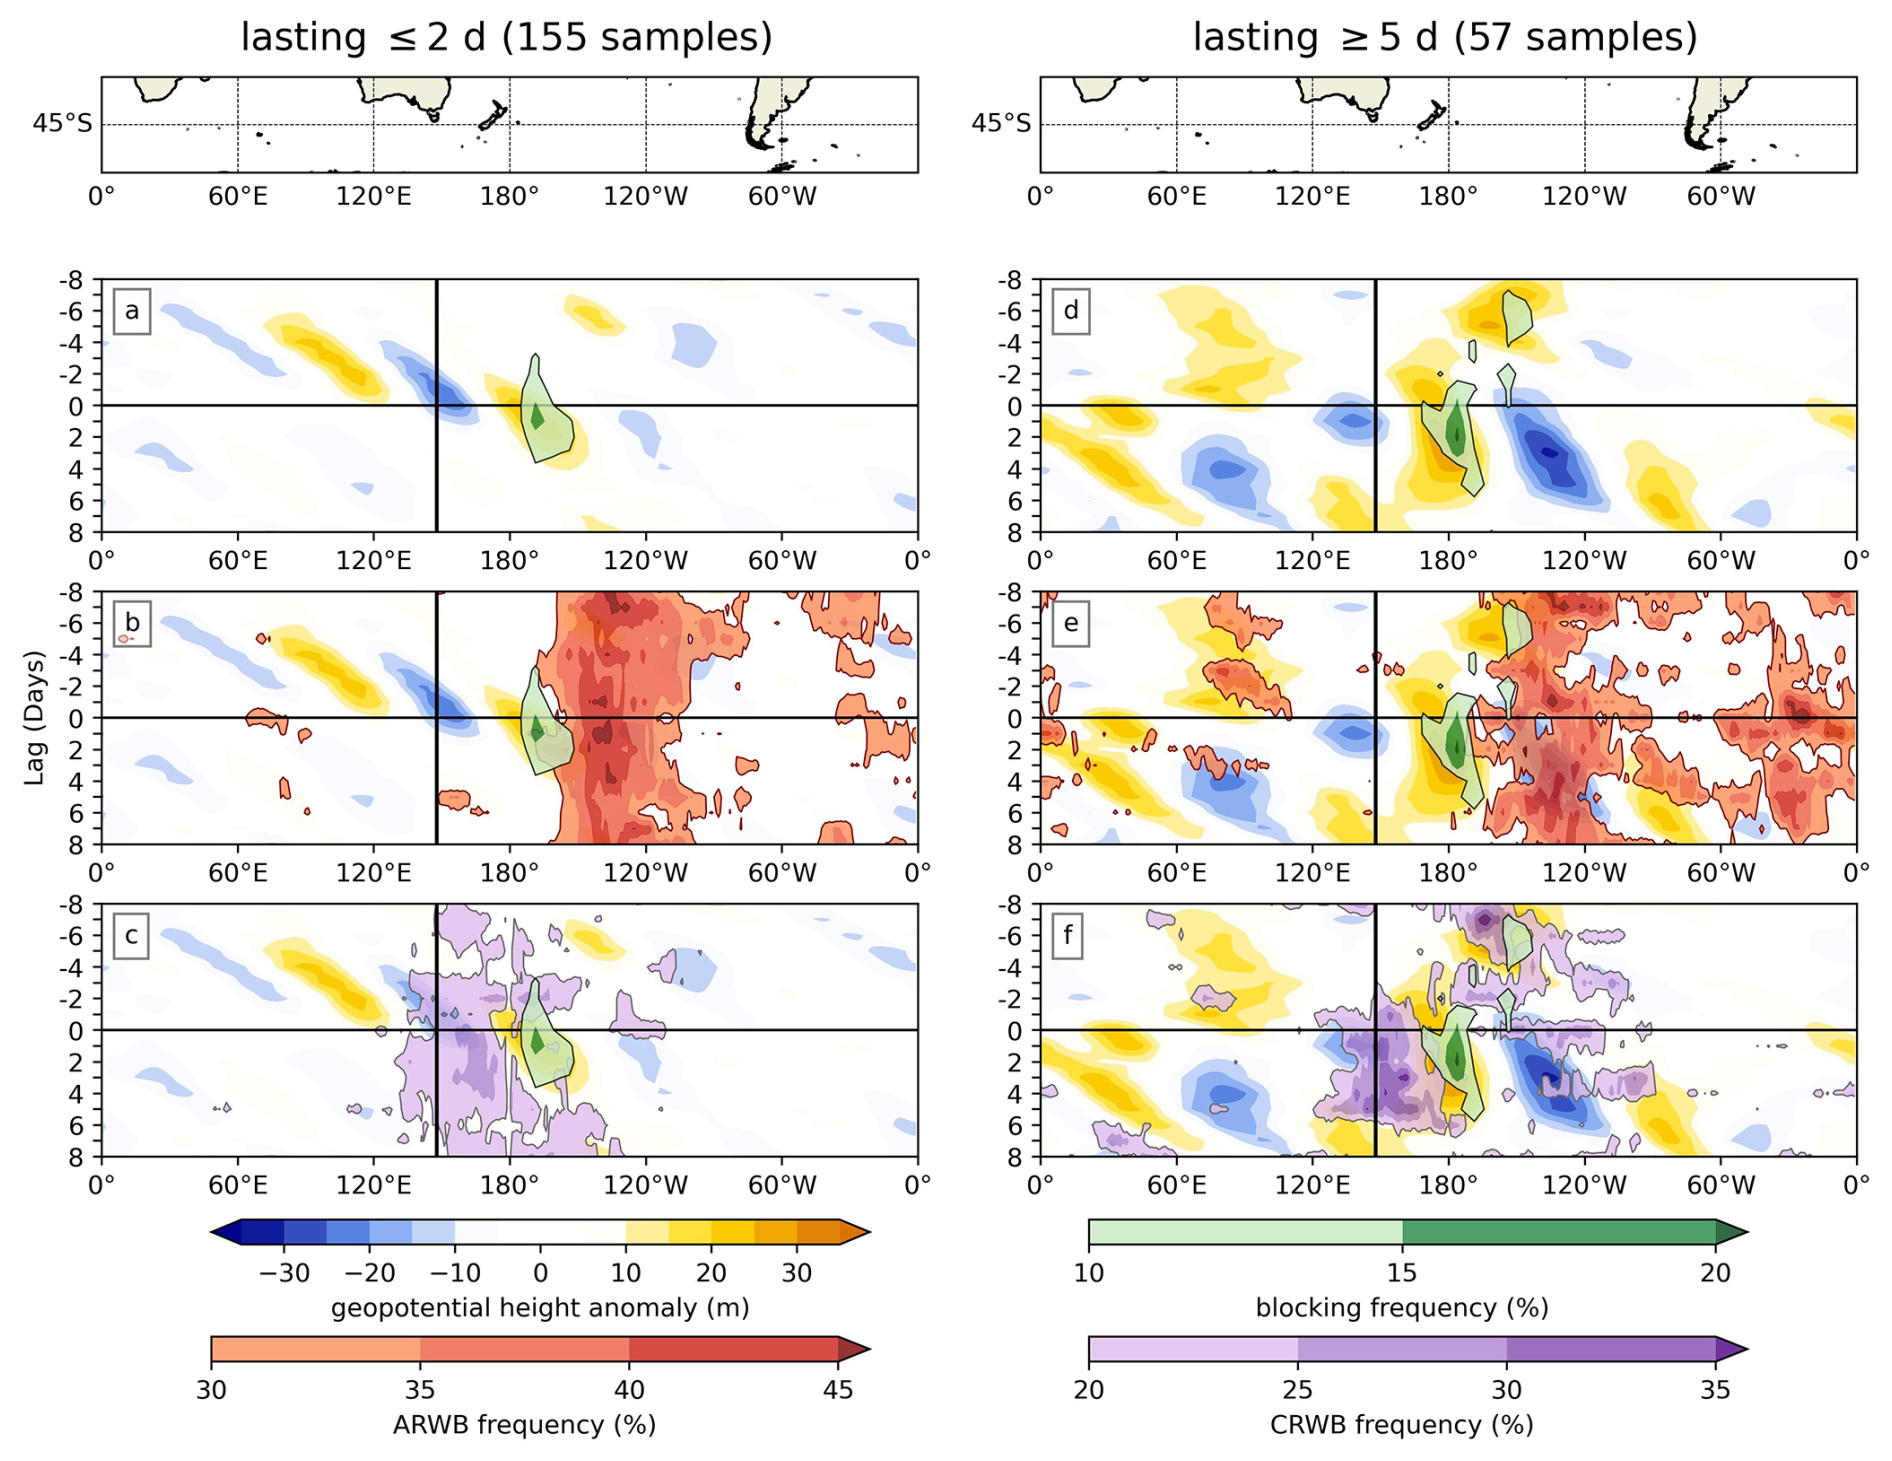
Figure 2Hovmöller diagrams averaged over 24–66° S for lead-lag composites of 500 hPa geopotential height anomalies (blue/yellow), blocking frequency (green, a, d), anticyclonic Rossby wave breaking (ARWB) frequency (red, b, e) and cyclonic Rossby wave breaking (CRWB) frequency (purple, c, f). All lead-lag composites are centred on the first day of the doldrums formation (day 0, horizontal line). The vertical line marks the longitude of Davies Reef and the GBR (148° E).
Both cases have enhanced frequencies of cyclonic RWB over Australia (Fig. 2c, f) and strong anticyclonic RWB to the east of the blocking anticyclone in the Central Pacific (Fig. 2b, e). The enhanced cyclonic RWB frequency over Australia in the longer doldrums cases likely indicates repeated RWB after the initial doldrums formation, as the high frequency is maintained for up to 5 d after their formation. This repeated cyclonic RWB could help maintain the New Zealand block and amplify the Rossby wave packet downstream (Pelly and Hoskins, 2003; Berrisford et al., 2007; Nakamura and Huang, 2018; Barnes et al., 2025). In the long-duration cases, 40 %–44 % of days also have anticyclonic RWB upstream of the cyclonic anomaly (Fig. 2e), which may create the cyclonic anomaly and stalled pattern seen at day 0.
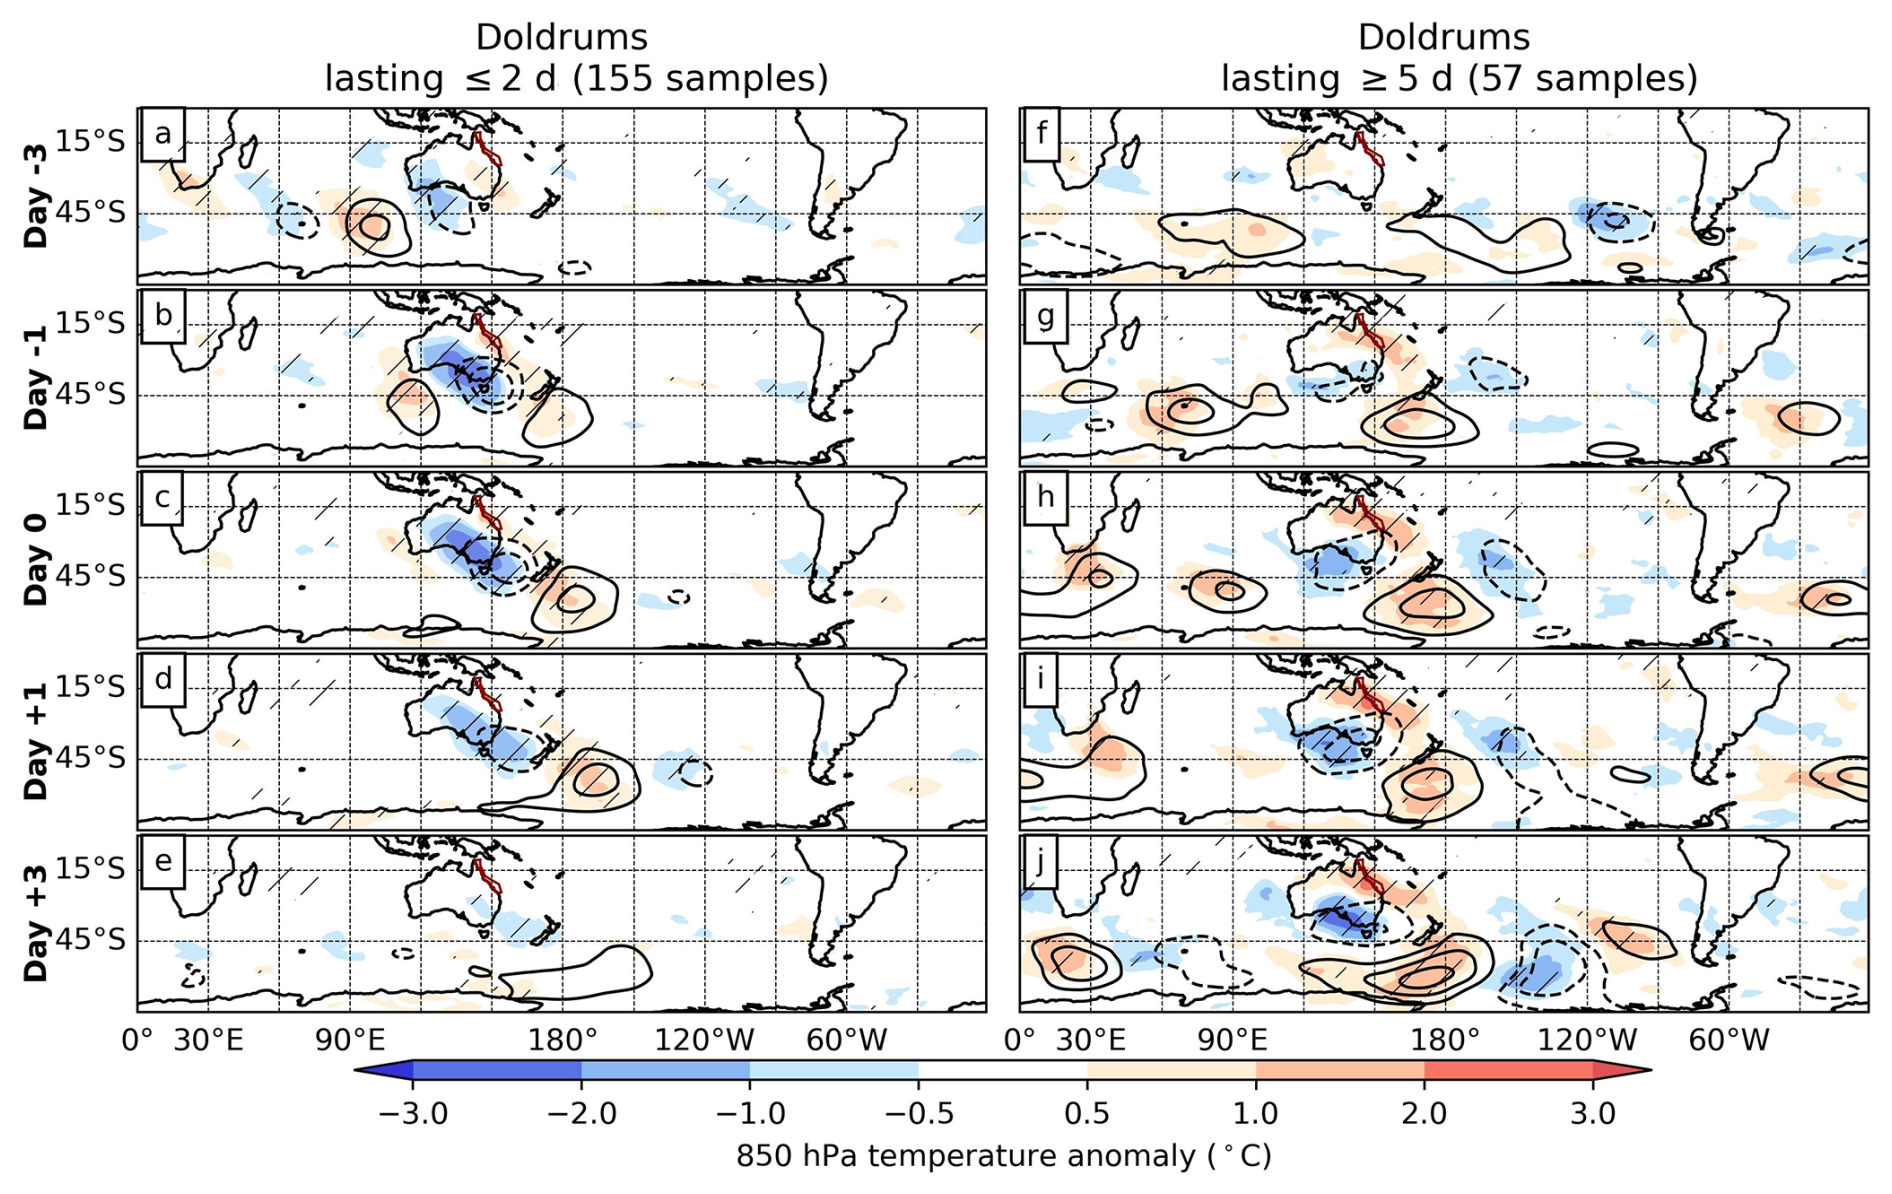
Figure 3Lead-lag composites centred on the first day of the doldrums formation (day 0). Contours denote 500 hPa geopotential height anomalies (20 m intervals, 0 contour removed, dashed is negative, solid is positive) and shading the 850 hPa air temperature anomalies (°C). The Great Barrier Reef is outlined in red. Significance hatching shows where temperature anomalies are statistically significant from zero at the 95th % confidence interval.
Looking spatially at the same Rossby wave packets, the differences between the short and long events become clearer. Here, the 500 hPa geopotential height anomalies are shown together with 850 hPa temperature anomalies (Fig. 3). In the short-duration cases, the Rossby wave packet rapidly propagates over Australia, bringing a frontal-like temperature shift as the cyclonic anomaly passes over south-eastern Australia (Fig. 3a–e). Prior to the doldrums onset, the Rossby wave packet appears to refract towards the tropics before generating the blocking anticyclone and warmer temperatures over New Zealand (Fig. 3a–b). As in Fig. 2a–c, the Rossby wave packet quickly moves into the Pacific and dissipates as the temperature anomalies weaken.
One day prior to the doldrums formation, in the longer duration cases, the cyclonic anomaly or what is likely a cut-off low appears over Australia with warmer temperatures over northern Australia and cooler temperatures inside the cut-off low (Fig. 3g). Here, the New Zealand block develops in an omega pattern with cyclones flanking the anticyclone. By day 0, the cut-off low and associated temperature anomalies strengthen while heat builds over the New Zealand block. As the event progresses, the Rossby wave packet establishes across the Pacific while the temperature anomalies continue to build over Australia with the warmest anomalies over the GBR and coolest over southeastern Australia (Fig. 3i–j). Interestingly, as the blocking anticyclone is squeezed further south, warmer temperatures also penetrate into the Southern Ocean down to the Antarctic coastline. Here, the movement of the temperature anomalies with the blocking pattern follows those described in van Mourik et al. (2025) for northern hemisphere summer blocking.
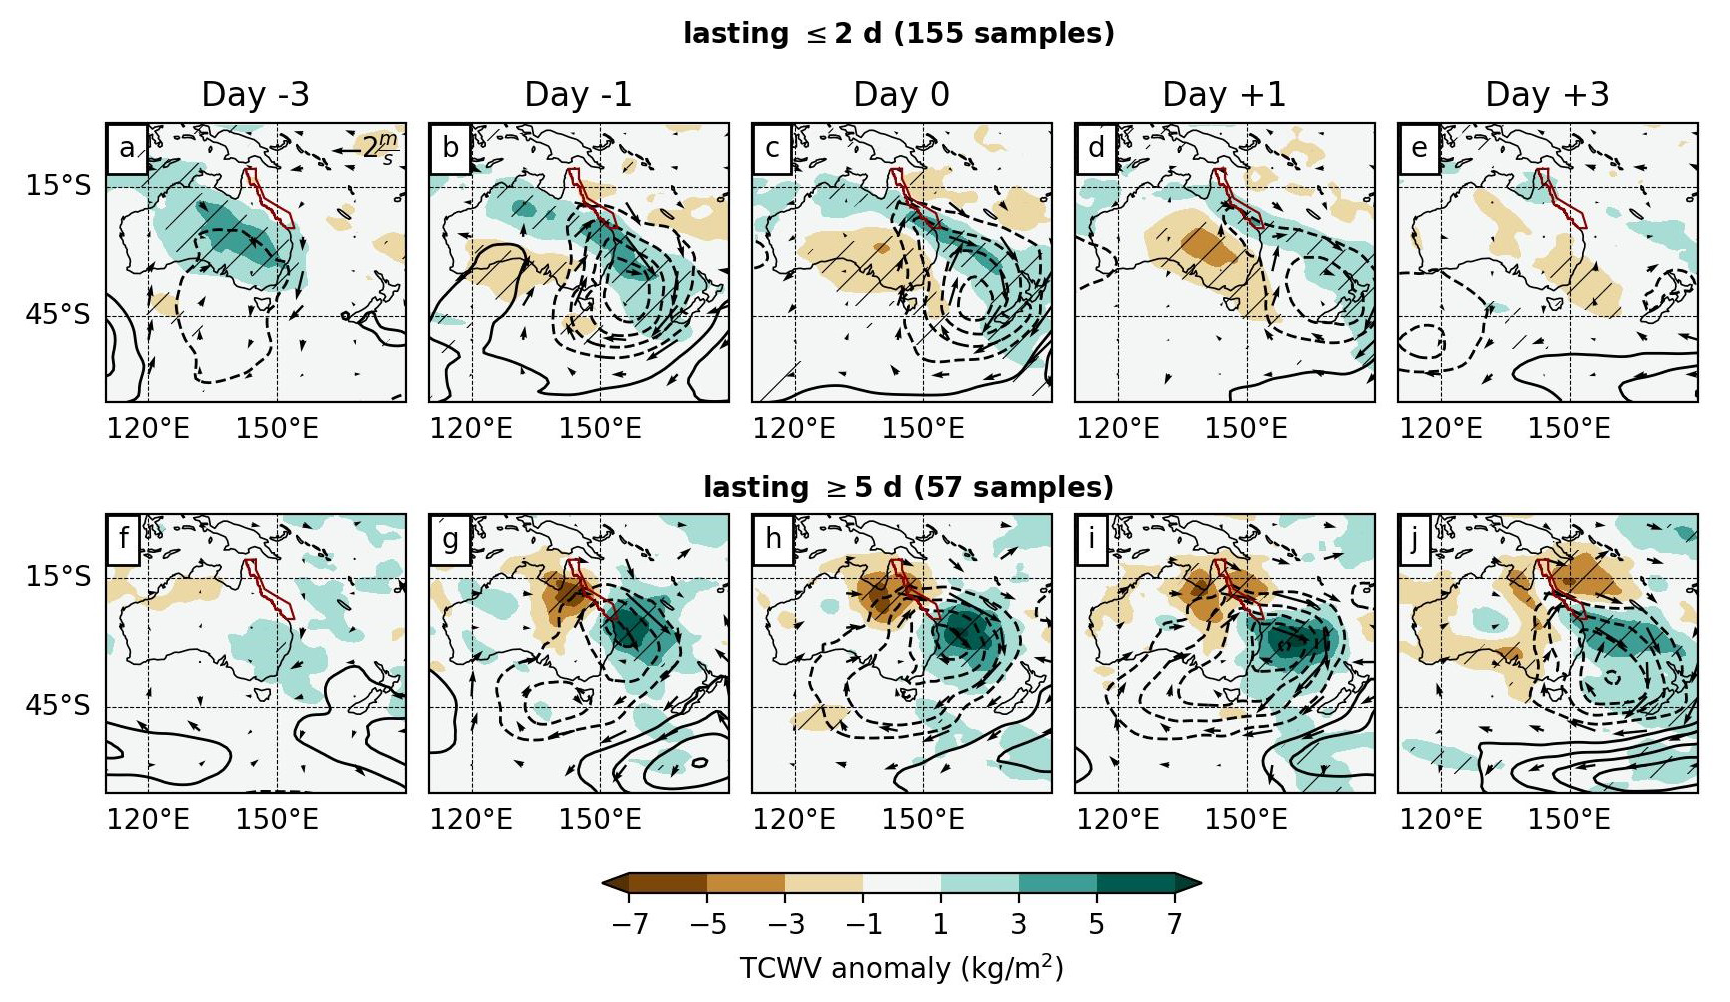
Figure 4Lead-lag composites of total column water vapour (TCWV) anomalies (shading) with MSLP anomalies (contours, 1 hPa intervals, 0 contour removed, dashed is negative, solid is positive) and 10 m horizontal wind vectors (m s−1, quiver key located in panel a). The Great Barrier Reef is outlined in red. Significance hatching shows where TCWV anomalies are statistically significant from zero at the 95th % confidence interval.
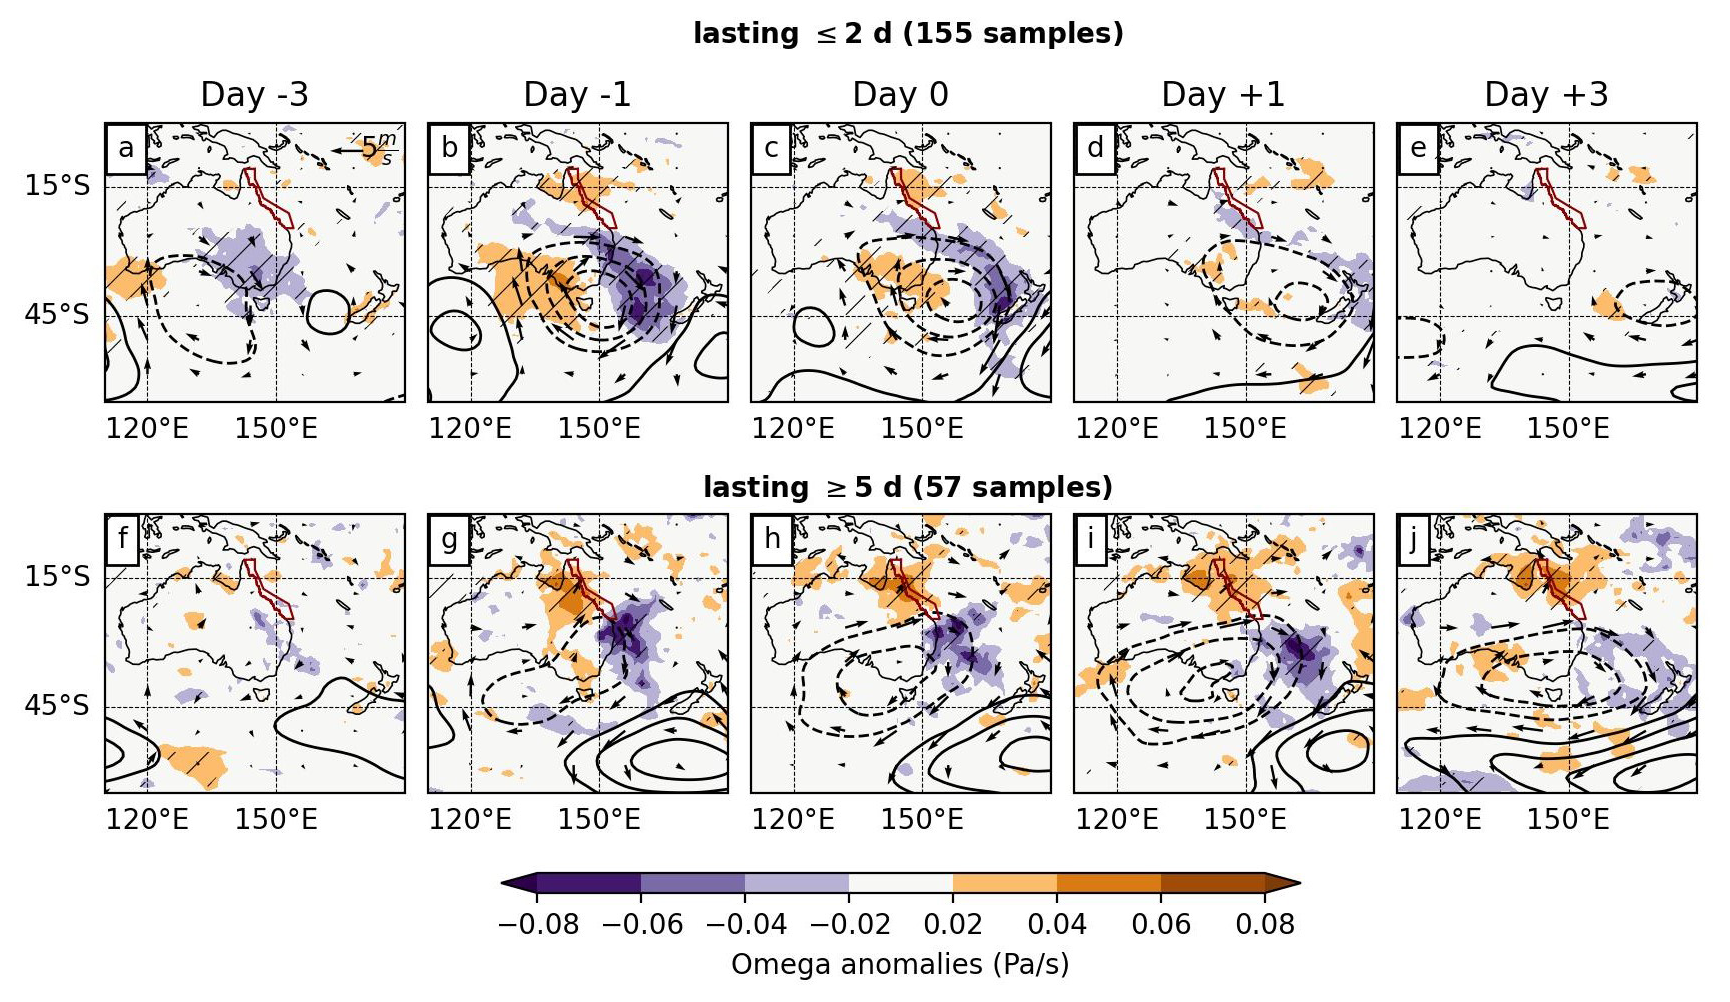
Figure 5Lead-lag composites of 400–600 hPa averaged omega anomalies (shading) with 500 hPa geopotential height anomalies (contours, 15 m intervals, 0 contour removed, dashed is negative, solid is positive) and 500 hPa horizontal wind vectors (m s−1, quiver key located in panel a). Significance hatching shows where omega anomalies are statistically significant from zero at the 95th % confidence interval.
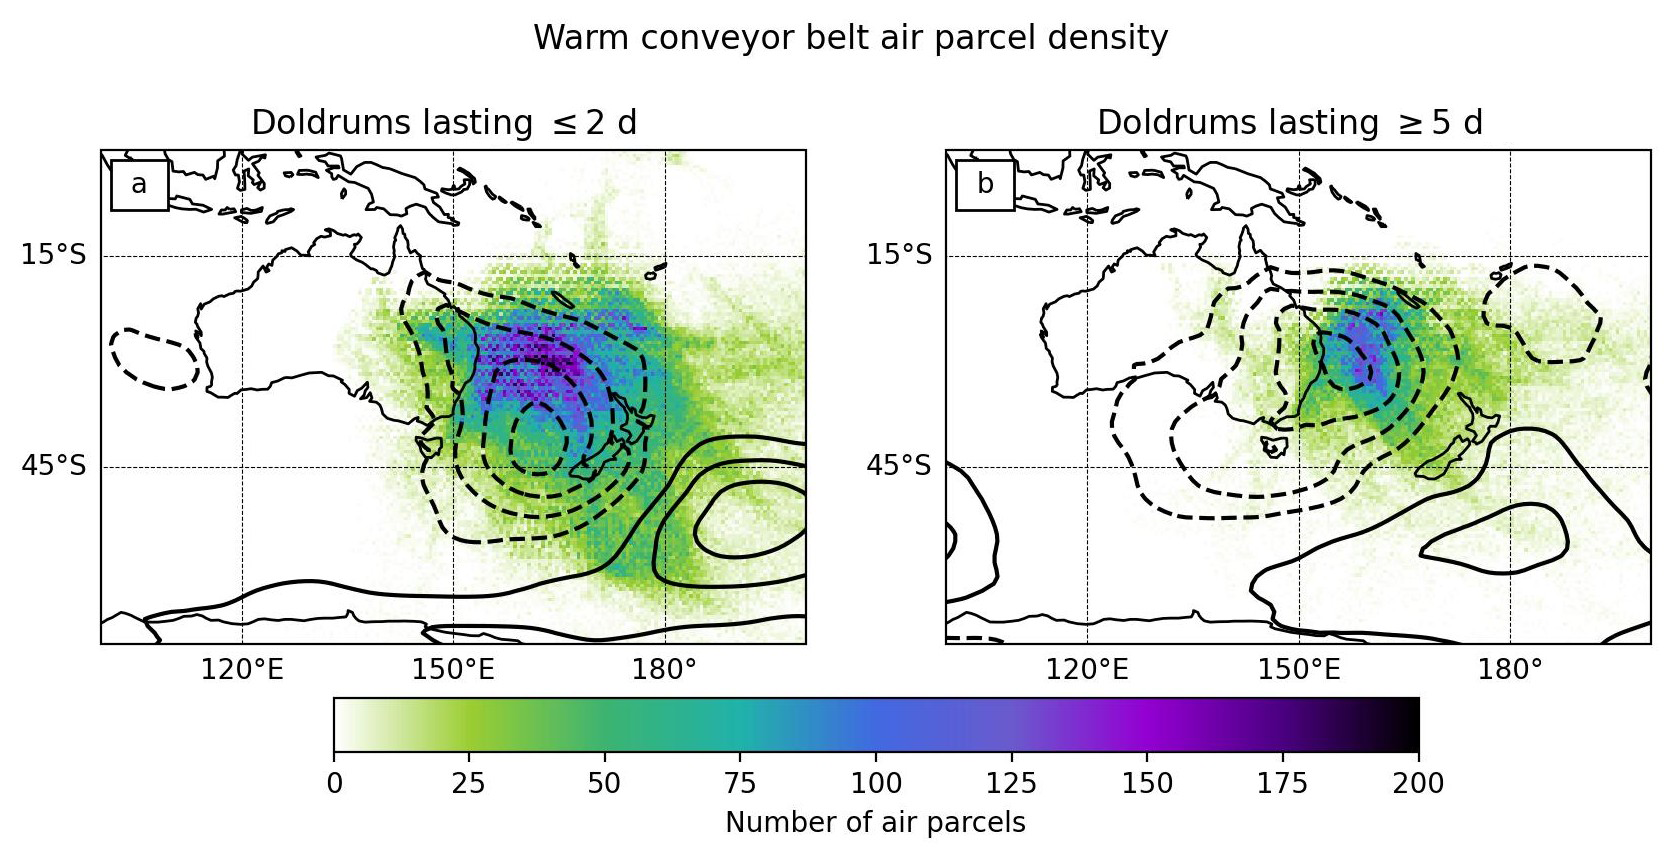
Figure 6Warm conveyor belt air parcel density (shaded) for short (155 samples) and long (57 samples) doldrums cases showing only the first day of each event. The contours represent the MSLP anomalies (1 hPa intervals, 0 contour removed, dashed is negative, solid is positive).
Short-duration cases (Fig. 4a–e) are notably wetter over Australia prior to the events' formation. As the cut-off low deepens, dry air intrudes over south-east Australia, while moisture is advected towards New Zealand with the north-westerly flow indicating a WCB structure ahead of the approaching front (Fig. 5b–c). Indeed, many WCBs can be identified along this frontal region, often extending into the Tasman Sea and across New Zealand and into the Southern Ocean (Fig. 6a). To the cyclonic anomalies east on the warm side of the front (Fig. 3c), a mid-level ascending region develops following the moisture contours, while a dry descending region forms to the cyclones west on the cold side of the front. This pattern agrees with where ascending/descending motion is expected following quasi-geostrophic omega theory (Hoskins et al., 1985). Likewise, a small descending region forms over the GBR within the dry anomalies (Fig. 5a–e). As the Rossby wave packet propagates eastward into the Pacific, the moisture and omega anomalies disappear.
Compared to the short cases, the moisture and omega anomalies of the long doldrums cases are more intense and form closer to the GBR (Figs. 4f–j, 5f–j). While still forming to the east of the cyclonic anomaly, the north-east south-west tilt allows the warm, moist ascending region to form over the Australian east coast. This area can again be characterised as a WCB, with the majority of WCB trajectories on day 0 forming and progressing just east of the cyclonic anomalies centre. However only progressing to 45° S with fewer passing over New Zealand (Fig. 6b). The longer doldrums also see a larger dry, descending region forming over the GBR and north-eastern Australia, with the large dry descending region over southern Australia now missing, potentially due to cancellations in the composites. As the doldrums persist, the stalled cut-off low allows these anomalies to remain largely in the same area.
3.2 Dry intrusions
As Figs. 4 and 5 show a large dry and descending air mass over the GBR, we now take a closer look at the full profile of specific humidity and omega anomalies over Davies Reef (Fig. 7). Again, short and long-duration cases show similar patterns with differences in magnitude and duration. Both cases present two separate dry-descending areas, one in the boundary layer centred at 875 hPa and another in the mid-troposphere centred at 550 hPa. This anomalously dry column also sits on top of a moist surface layer that extends to 950 hPa on average, growing in height as the days progress. On average, this dry column forms 2 d prior to the doldrums start, with the upper-level dry slot peaking on day 0 and the lower dry spot at day+1. Both cases terminate with a moistening of the column, while the long cases are also terminated by a strong updraft at day+6. The long cases are also notably wetter throughout the column between 4 to 8 d prior to the doldrums formation, a feature absent in the short cases composite.
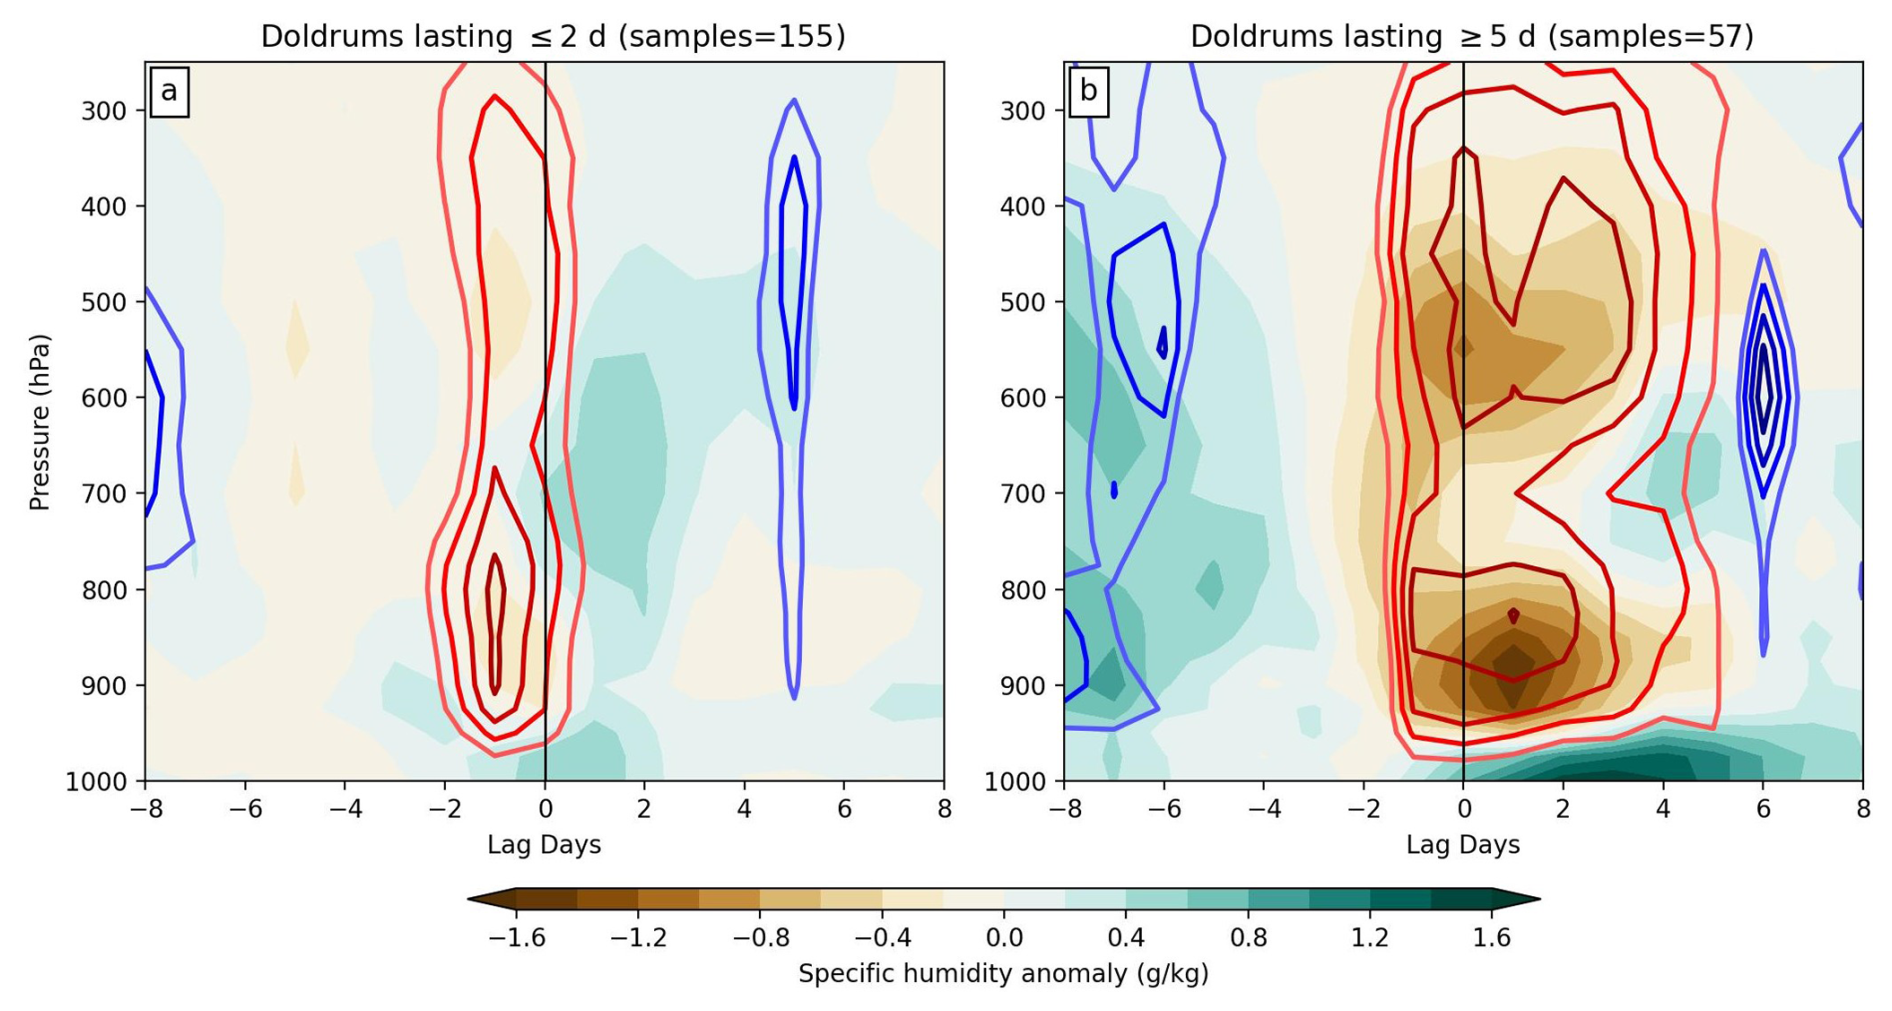
Figure 7Hovmöller centred on the first day of doldrums formation for Davies Reef (18.75° S, 147.75° E) from 1000 to 250 hPa. Specific humidity anomalies (shading) and omega anomalies (contours, every 0.01 Pa s−1 starting from 0.02) for short and long duration doldrums are shown. Red contours denote positive (descending) anomalies while blue denotes negative (ascending) anomalies.
Based on Fig. 7 alone, the anomalous moist surface layer and dry boundary layer are likely a result of the weakened lower-level winds found in the doldrums. Under the typical trade wind flow, the strong surface fluxes help mix the boundary layer below the trade inversion through convection (Malkus, 1958; Nuijens and Stevens, 2012). In their absence, the moist surface layer over the ocean is unable to mix with the drier air above, allowing the surface to become anomalously moist. This lack of mixing, combined with local subsidence and suppressed shallow convection, would then dry out the layer above. Here, stratification and weak vertical mixing decouple the dry descending layers from the surface, so the near-surface air can stay moist even as the overlying layers remain dry and descending (Malkus, 1958; Augstein et al., 1973; Albright et al., 2022). The upper-level dry slot appears to form separately from its lower counterpart and is more likely driven by large-scale dynamics, possibly including Rossby wave associated descent (Fig. 5f–j), tropical wave suppression (Fig. 10e–f), and the advection of dry subtropical air. Based on the timing of the cyclonic anomaly and dry slot formation in Fig. 4, we hypothesise that the dry air is advected from the continent by the south-westerly flow around the extratropical low.
3.2.1 Parcel trajectories
Until this point, this study has explored the doldrums formation from a Eulerian perspective. For this section we adopt a Lagrangian perspective to identify and investigate dry intrusions over the Davies Reef region. After separating out the back trajectories that descend at least 250 hPa within the 48 h before arriving at Davies Reef, we can analyse the origins and air mass characteristics of the dry intrusions in both the boundary layer and mid-troposphere. Starting with the trajectories launched from above 800 hPa, as shown in Fig. 8a, 104 of the 390 long doldrums days have dry intrusions in the middle atmosphere with 3029 tracks identified across the 104 d. Dry intrusions are more frequent on the first day of the doldrums formation (25/57 d) and almost exclusively originate from the extratropics. The parcels originate either over the South Atlantic or southern Indian Ocean (Fig. 8a) at around 200–400 hPa (Fig. 9a) before moving east towards Australia, likely along the jet stream, typically staying equatorwards of 55° S. The parcels approach southeastern Australia around 48 h prior to reaching Davies Reef, where they turn equatorwards and begin their descent, staying almost exclusively over the continent (Fig. 8a–b). As the parcels descend to around 600 hPa, they begin to warm near adiabatically (40 K in 48 h), remaining very dry throughout the process (Fig. 9d).
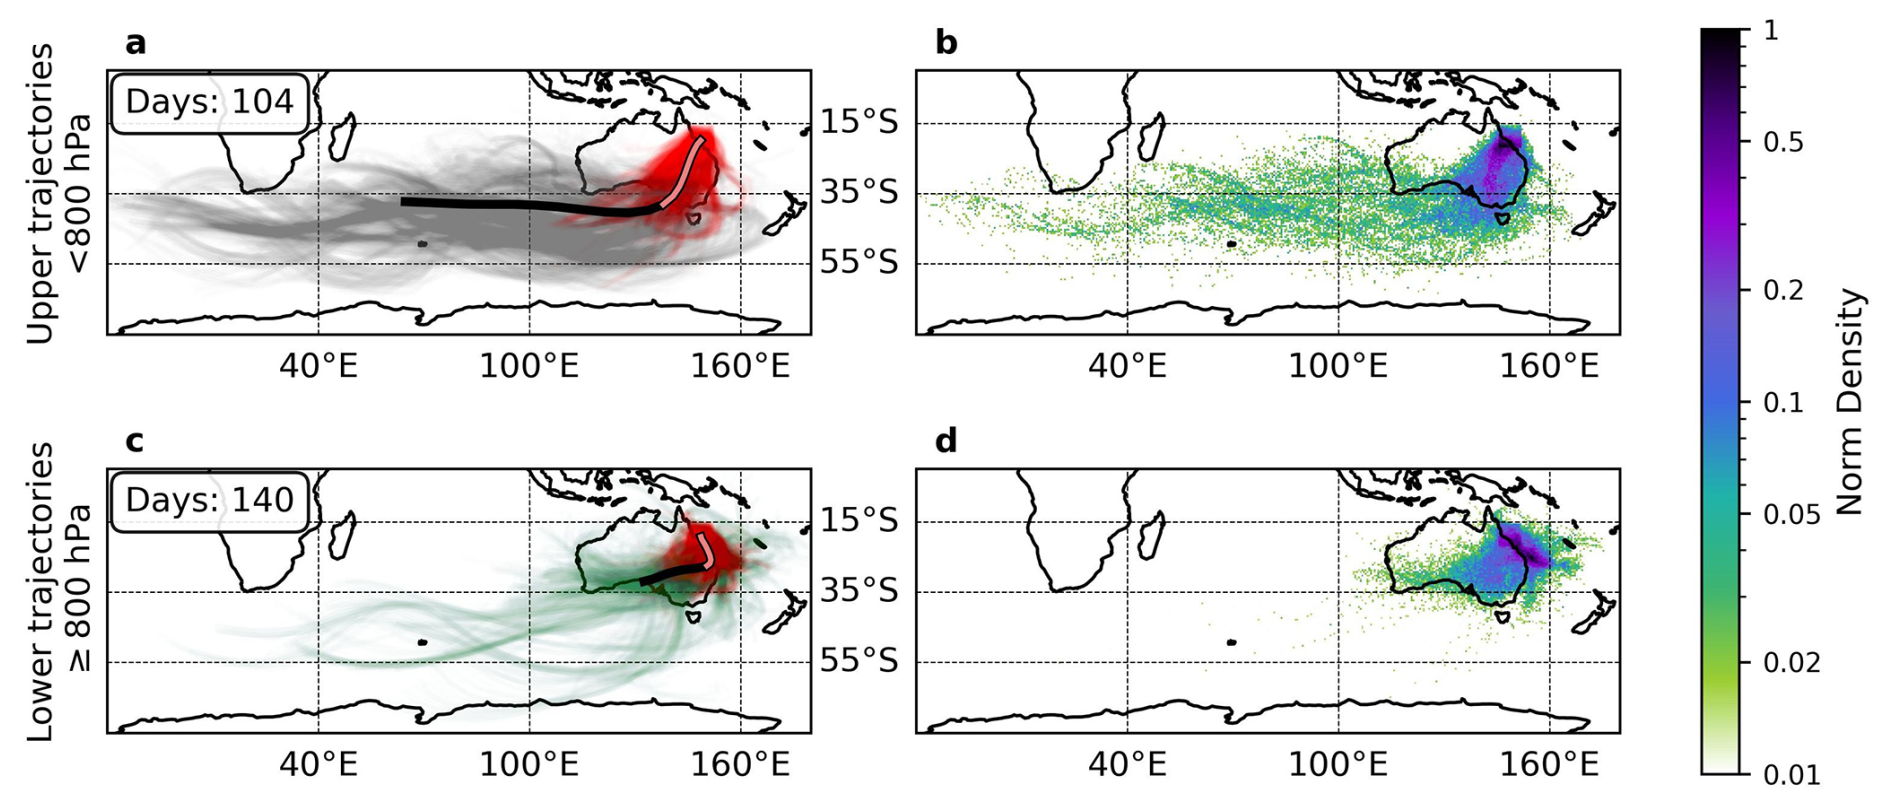
Figure 8Density plot of the back trajectories launched from Davies Reef that descend > 250 hPa in 48 h from their launch time. Trajectories run for 5 d with 6 hourly time steps. The top row those that launched from < 800 hPa and the bottom row shows trajectories launched from ≥ 800 hPa. In panels (a) and (c) the red trajectories mark when the parcel is within 48 h of their launch time with the mean trajectory path marked by the solid line (black prior to 48 h, pale red after 48 h). Panels (b) and (d) show the normalised density plots of the upper and lower trajectories.
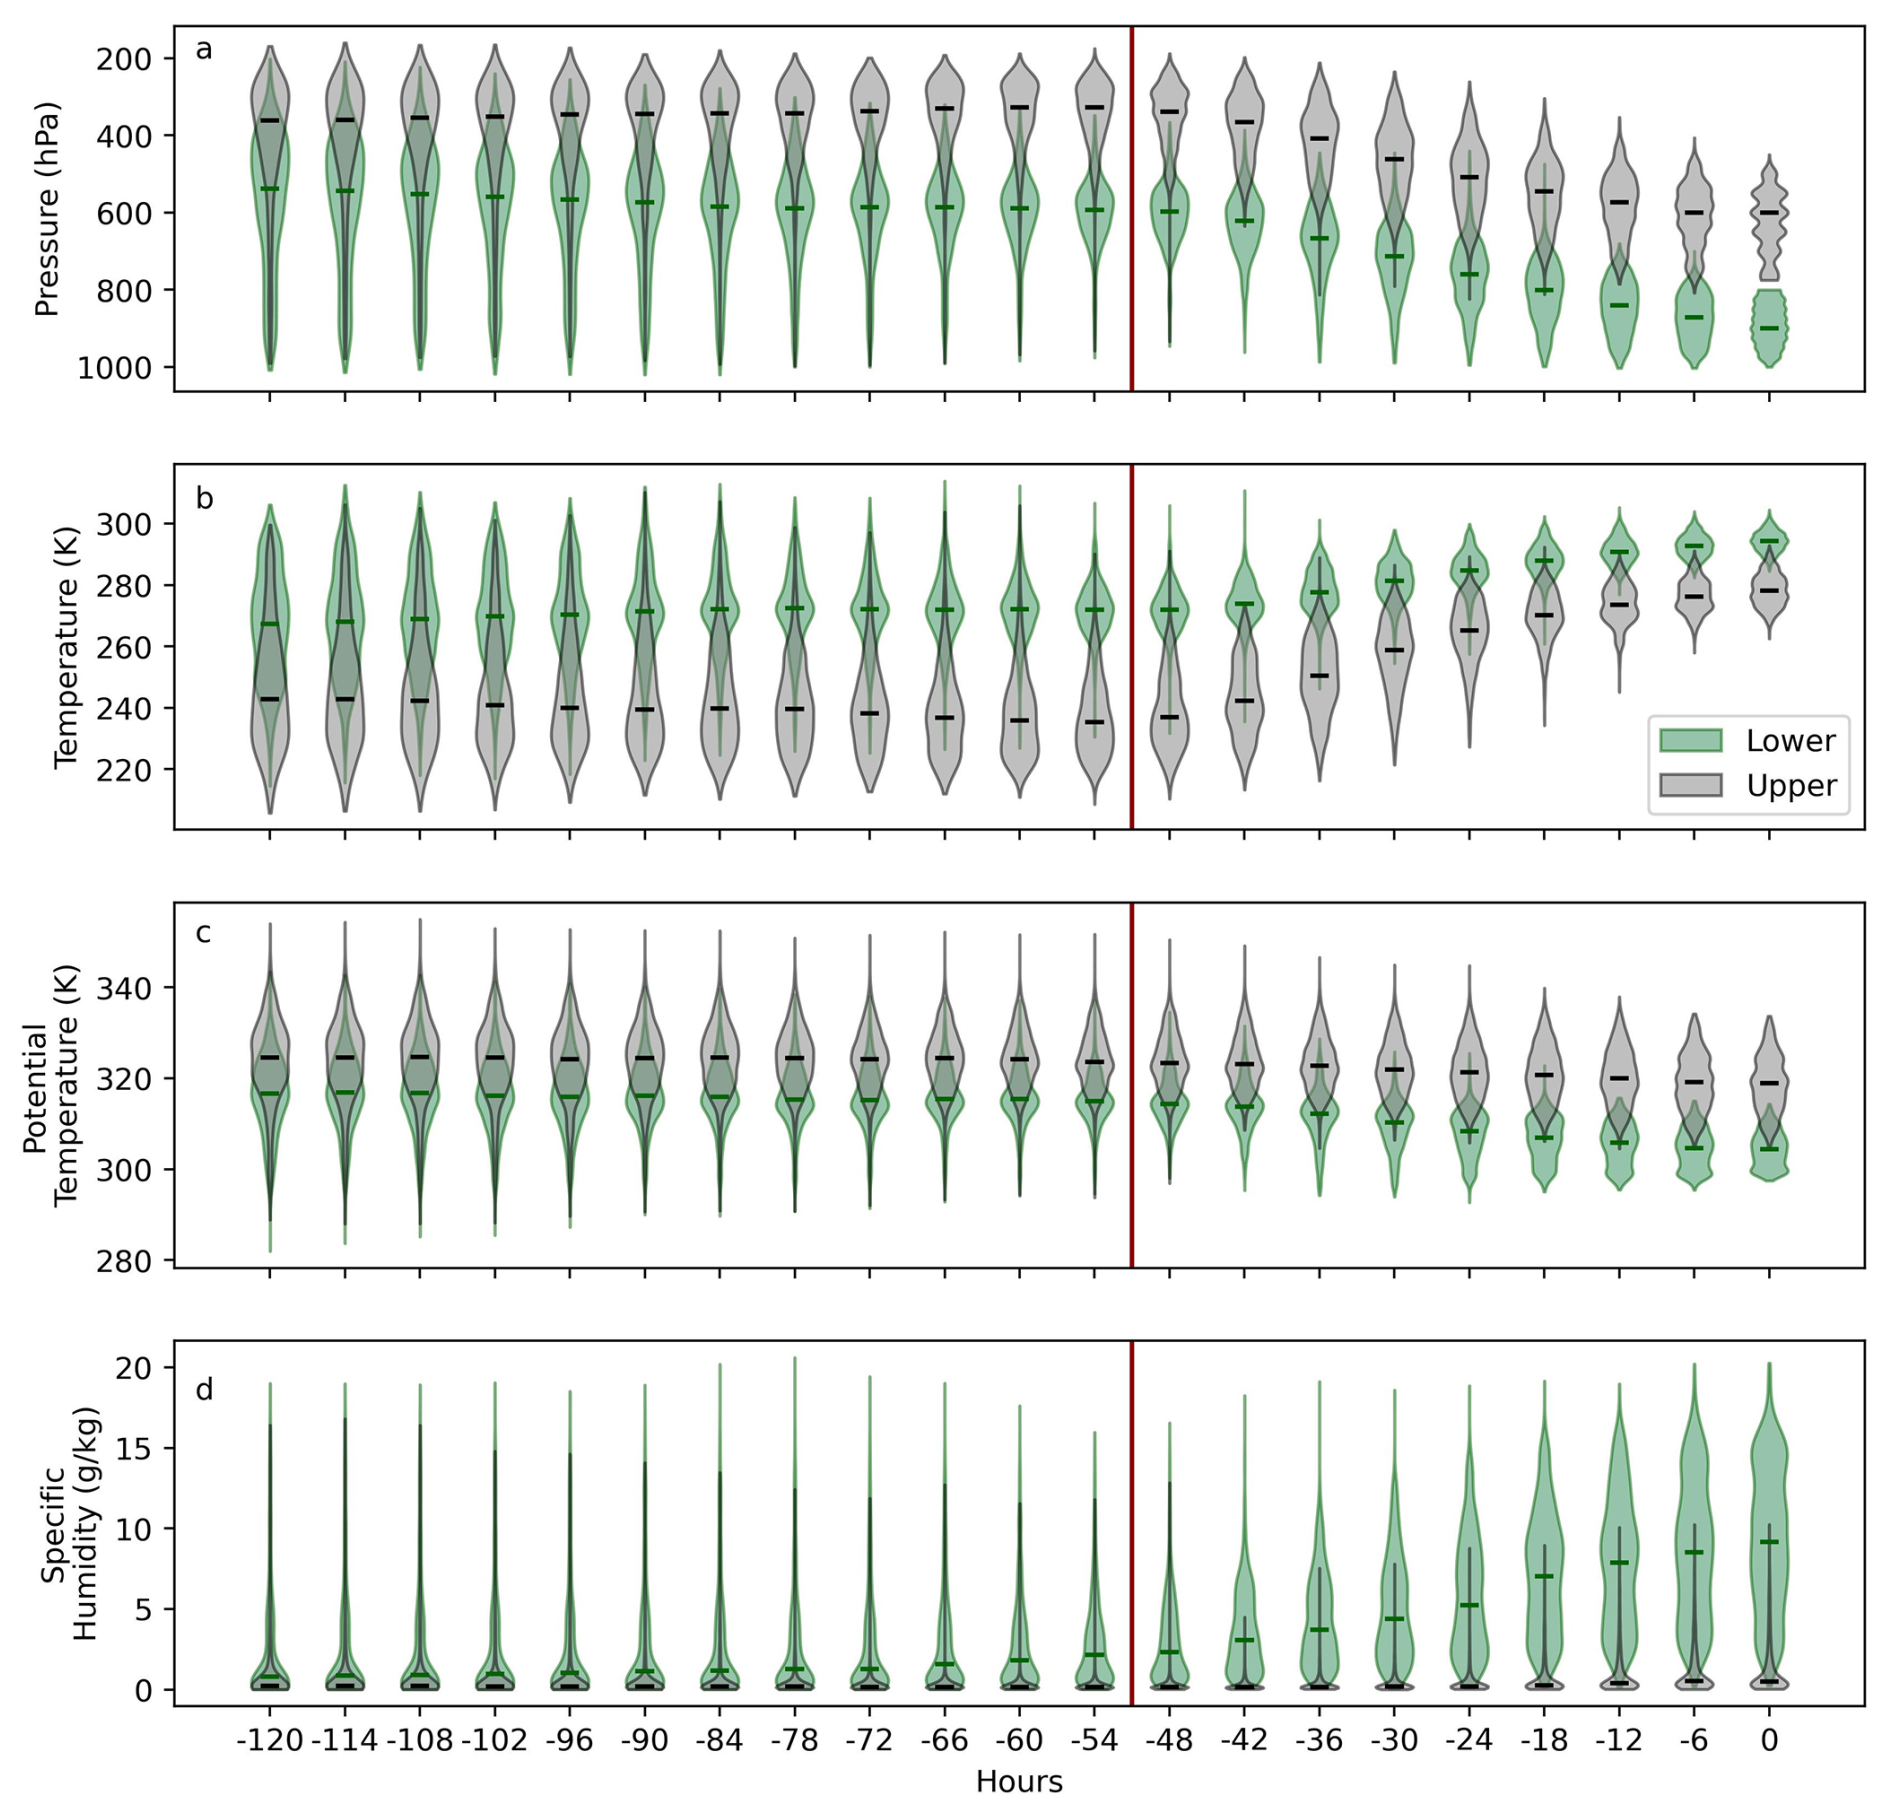
Figure 9Parcel trajectory properties of the lower (≥ 800 hPa) and upper (< 800 hPa) dry intrusions. In each violin plot the median is marked with a horizontal line. The red line marks the separation between the 48 h after the parcel launch where the descent occurs and the remaining trajectory.
Comparatively, in the trajectories launched from below 800 hPa, 140 of the 390 long doldrums days have dry intrusions in the lower atmosphere, giving 3064 tracks identified across the 140 d. These dry intrusions are again more frequent on the first day of the doldrums formation (30/57 d). Compared to the dry intrusions forming above 800 hPa, these lower trajectories originate much closer to Australia (Fig. 8c) and slightly lower in the atmosphere (600–400 hPa) (Fig. 9a). The parcels tend to sweep across southeastern Australia, often reaching the Coral Sea before turning north-west towards the GBR (Fig. 8c–d). Some trajectories can be seen originating in the tropics, though the vast majority originate south of Davies Reef. When the parcels begin their descent at −48 h, the lower dry intrusions are found much closer to Davies Reef (equatorwards of 35° S) and descend to around 900 hPa by the time they reach Davies Reef (Fig. 9a). As the parcels descend, they warm slightly (22 K in 48 h) but experience diabatic cooling (−10 K in 48 h). This is potentially due to radiative cooling or more likely through evaporative cooling as the dry parcels interact with moisture within the boundary layer (increasing 6 g kg−1 in 48 h) (Fig. 9d) as the trajectories move over the Coral Sea. Trajectories with the strongest descent (≥ 350 hPa) over the 48 h period follow the mean route across the Coral Sea before entering the boundary layer over Davies Reef.
3.3 Tropical dynamics
The extratropical circulation, blocking and WCB activity described above provide an important dynamical context for the development of persistent doldrums and drying over the GBR. Given its location at the interface between tropical and extratropical influences, the evolution of conditions over the GBR is closely linked to variability in tropical circulation, convection, and moisture distribution. Here, tropical wave activity could provide a critical thermodynamic and dynamical link to extratropical dynamics by modulating the circulation and moisture transport, including the supply of moisture that fuels poleward-ascending WCB air streams. We therefore next examine tropical wave activity, focusing on the slower-moving MJO (eastward propagating) and ER waves (westward propagating), exploring how tropical moisture availability and wave-induced circulation anomalies dynamically sustain the coupling between tropical and extratropical dynamics that produce the doldrums. As a measure of the strength of tropical convection, Hovmöllers averaged over 0–25° S of both the total outgoing longwave radiation (OLR) and filtered OLR anomalies and spatial composites on the first day of doldrums formation are shown in Figs. 10 and 11 respectively.
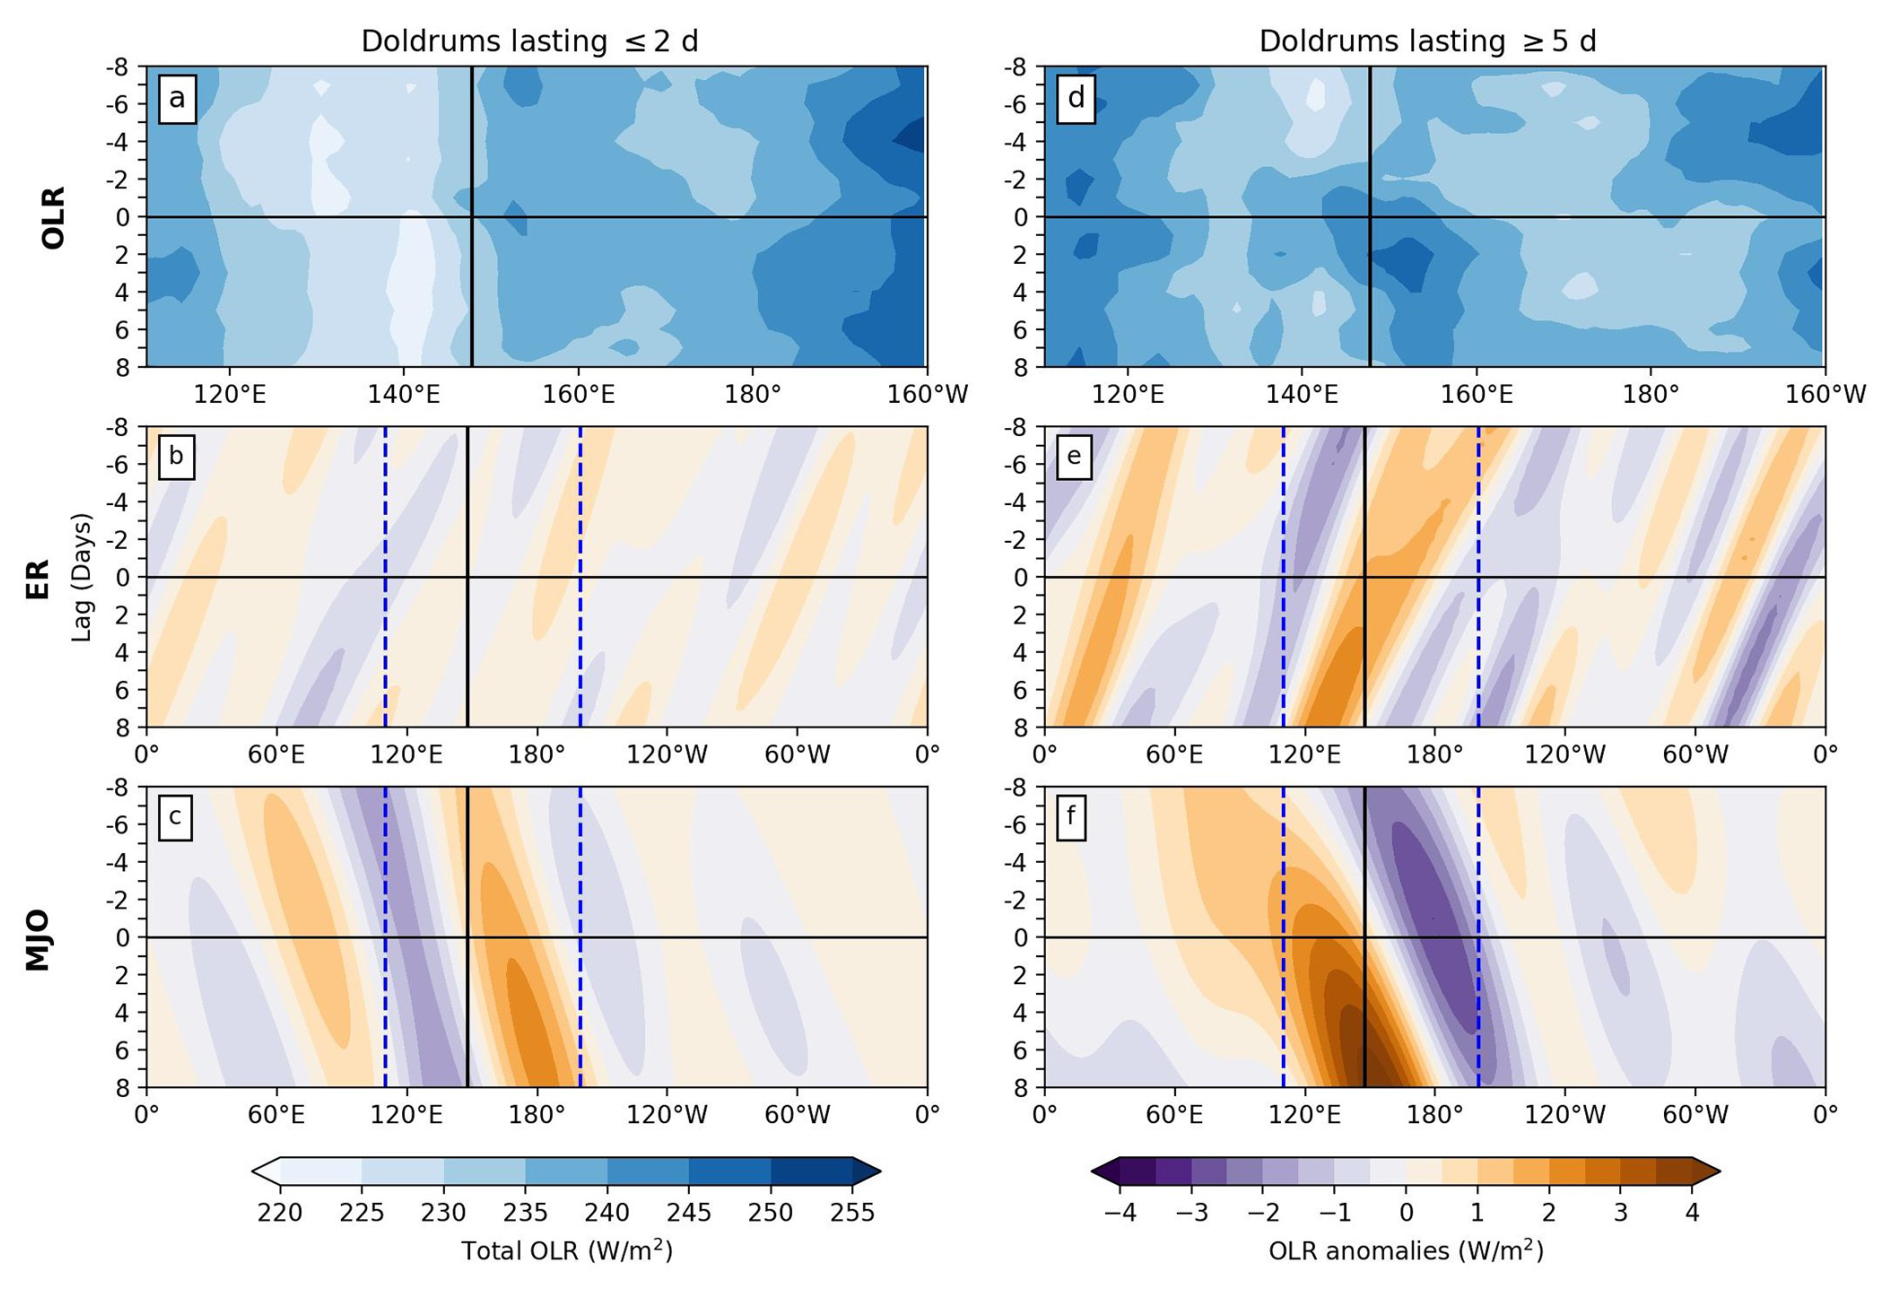
Figure 100–25° S averaged Hovmöller diagrams centred on the first day of the doldrums formation. Top row shows the total OLR between 110° E and 160° W (region marked with blue lines in middle and bottom rows), middle row the ER wave filtered OLR anomalies and bottom row the MJO OLR anomalies. Here positive (negative) anomalies represent suppressed (enhanced) convection. On each panel the vertical line marks the longitude of Davies Reef within the GBR (148° E).
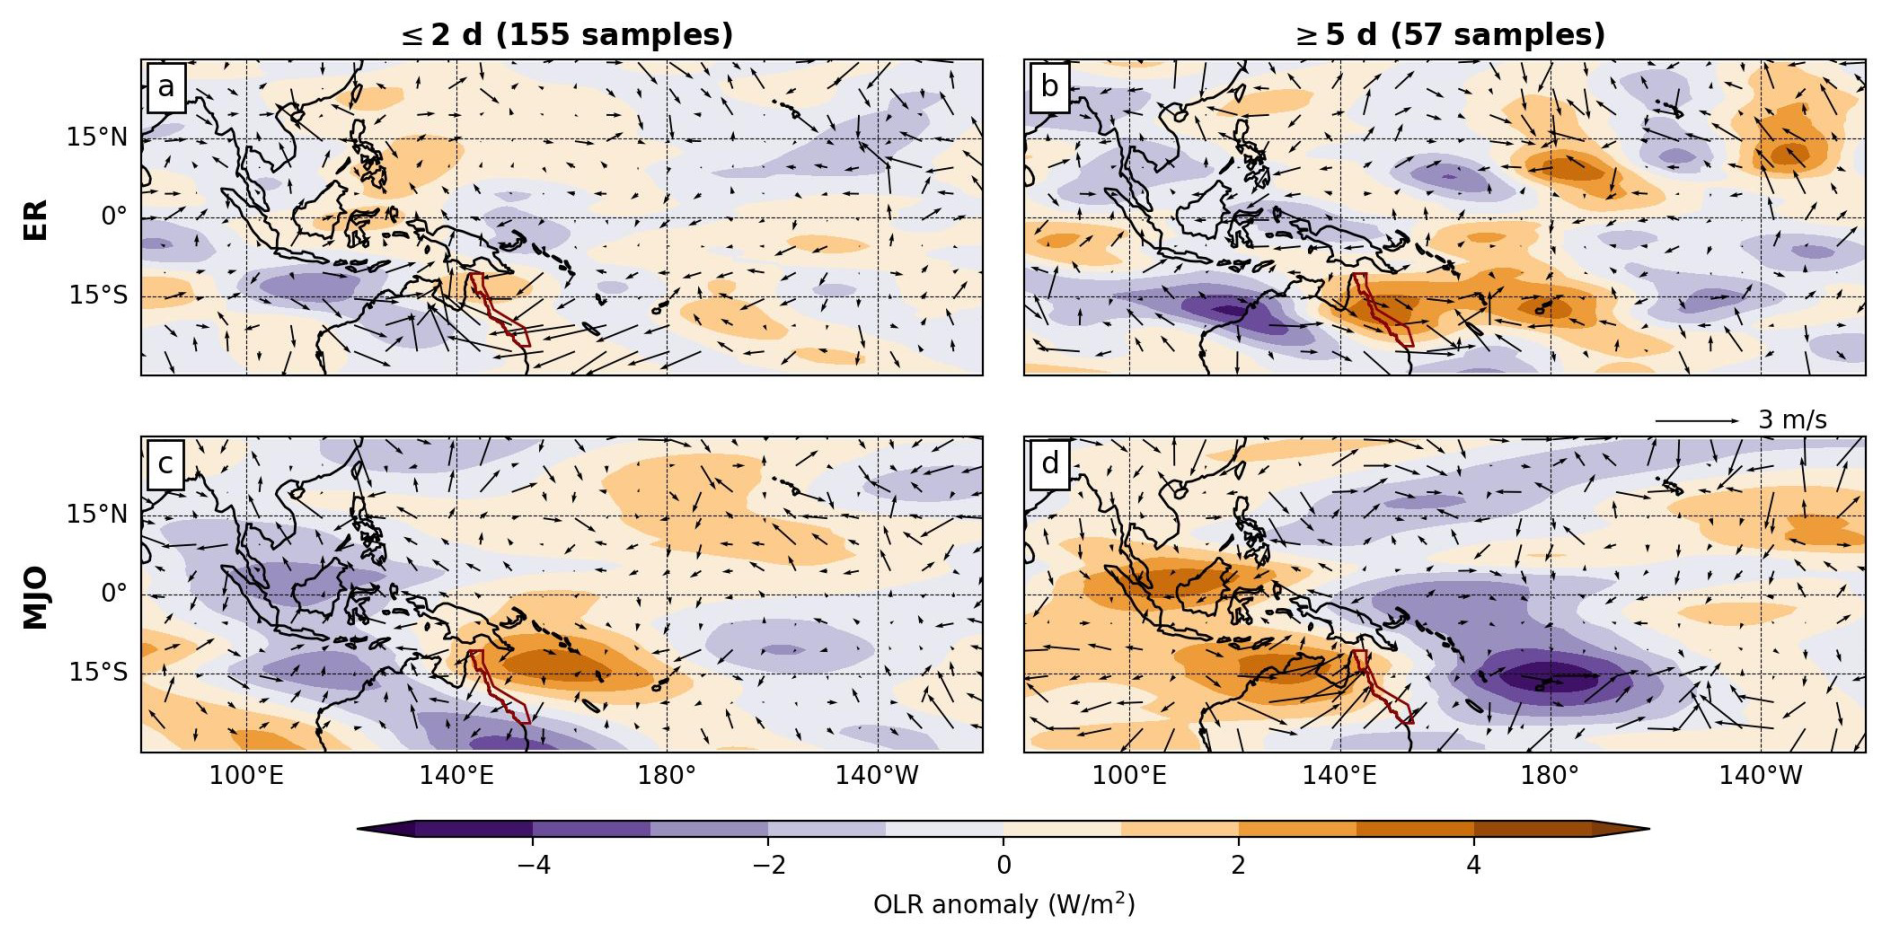
Figure 11OLR anomalies for the Equatorial Rossby wave (top row) and MJO (bottom row) for short and long duration doldrums. The GBR outline is marked in red. ERA5 850 hPa wind anomalies are composited using only the days where there was a suppressed wave over the GBR giving 43 samples (a), 26 samples (b), 46 samples (c) and 26 samples (d). A quiver key is found above (d).
Short-duration doldrums show little total OLR change over the GBR region with more enhanced convection further west over Australia (Fig. 10a). This convection likely follows the path of the active MJO and ER waves (Fig. 10c) seen over the Maritime Continent and north-western Australia at the doldrums onset (Fig. 11a–b). Prior to the doldrums onset, the MJO is suppressed over the GBR while the ER wave is weakly suppressed (Fig. 10b–c). After the doldrums form, the active MJO slowly progresses east towards the GBR, enhancing convection over the region.
The long-duration cases have stronger tropical wave activity (Fig. 10d–f). Up to 3 d prior to the doldrums onset, the total OLR indicates suppressed convection across Australia and the GBR. Over the Western Pacific, the ER wave activity is suppressed and the MJO is active, while over Australia, the opposite is true. After the doldrums start, the total OLR rises over the GBR and Coral Sea, indicating reduced convection (Fig. 10d), with suppressed MJO and ER wave phases persisting over the GBR for ∼ 8 d (Fig. 11c–d). The actual co-occurrence of the suppressed MJO and ER wave is modest at day 0 (short: 10 %, long: 7 %) but rises in long doldrums to 18 % by day+4, while remaining low in short cases. Considering suppression of either wave, the frequency jumps to 57 % in short doldrums and 65 % in long doldrums at day 0. Again, this frequency increases in long doldrums to 72 % of events by day+4, while dropping to 50 % in short doldrums. Here, the difference lies in the long doldrums having more events with a suppressed ER wave.
Differences in MJO propagation and phasing are also evident. During short-duration doldrums, the MJO propagates more slowly (∼ 2.7 m s−1), and the doldrums form to the east of the MJO convection, resulting in anomalous easterly flow. In contrast, during long-duration doldrums, the MJO propagates faster (∼ 4.5 m s−1), and the doldrums form to the west of the MJO convection, producing anomalous westerly flow (Fig. 11c–d). This sustained westerly flow in long events may help counter the trade easterlies over the GBR, contributing to the persistence of prolonged doldrums.
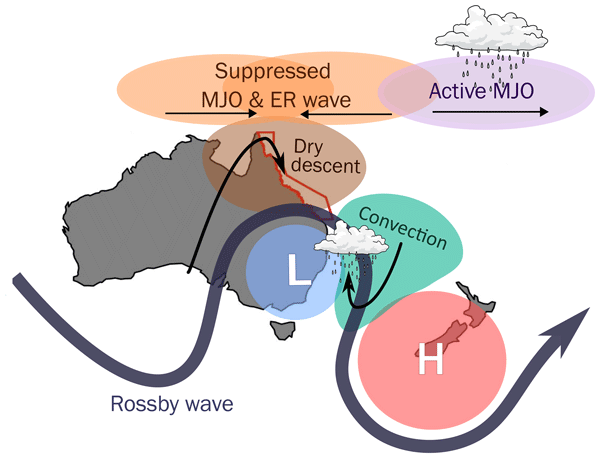
Given the low winds and clearer skies of the doldrums promote both oceanic and near-surface heating, understanding why these conditions develop and persist is an important question to address. Our results show that both tropical and extratropical processes are involved in the development and maintenance of the doldrums on the GBR. These processes have been synthesised into a schematic (see Fig. 12). From an extratropical perspective, trade wind easterlies are initially disrupted by the cyclonic component of a Rossby wave packet passing over southeastern Australia by creating anomalous westerlies (Richards et al., 2024, 2026; McGowan and Theobald, 2023; Pathmeswaran et al., 2022; Quinting et al., 2018). Anomalous westerlies introduced by circulations around tropical wave packets can additionally align to help oppose the trade easterlies. In shorter doldrums cases, a more transient cyclonic anomaly in the extratropics quickly passes over south-east Australia while the active MJO is located over north-west Australia, promoting easterlies over the GBR (Fig. 11a, c). Once the extratropical cyclonic anomaly dissipates in the Pacific, the trade easterlies can quickly return. Conversely, in longer doldrums, the extratropical cyclonic anomaly stalls allowing anomalous westerlies to persist over the GBR (Fig. 4f–j). This typically occurs together with the active MJO east of the GBR in the West Pacific, amplifying anomalous westerlies over the GBR region (Fig. 11d). Thus, it appears important that both tropical and extratropical circulations align for the doldrums to persist.
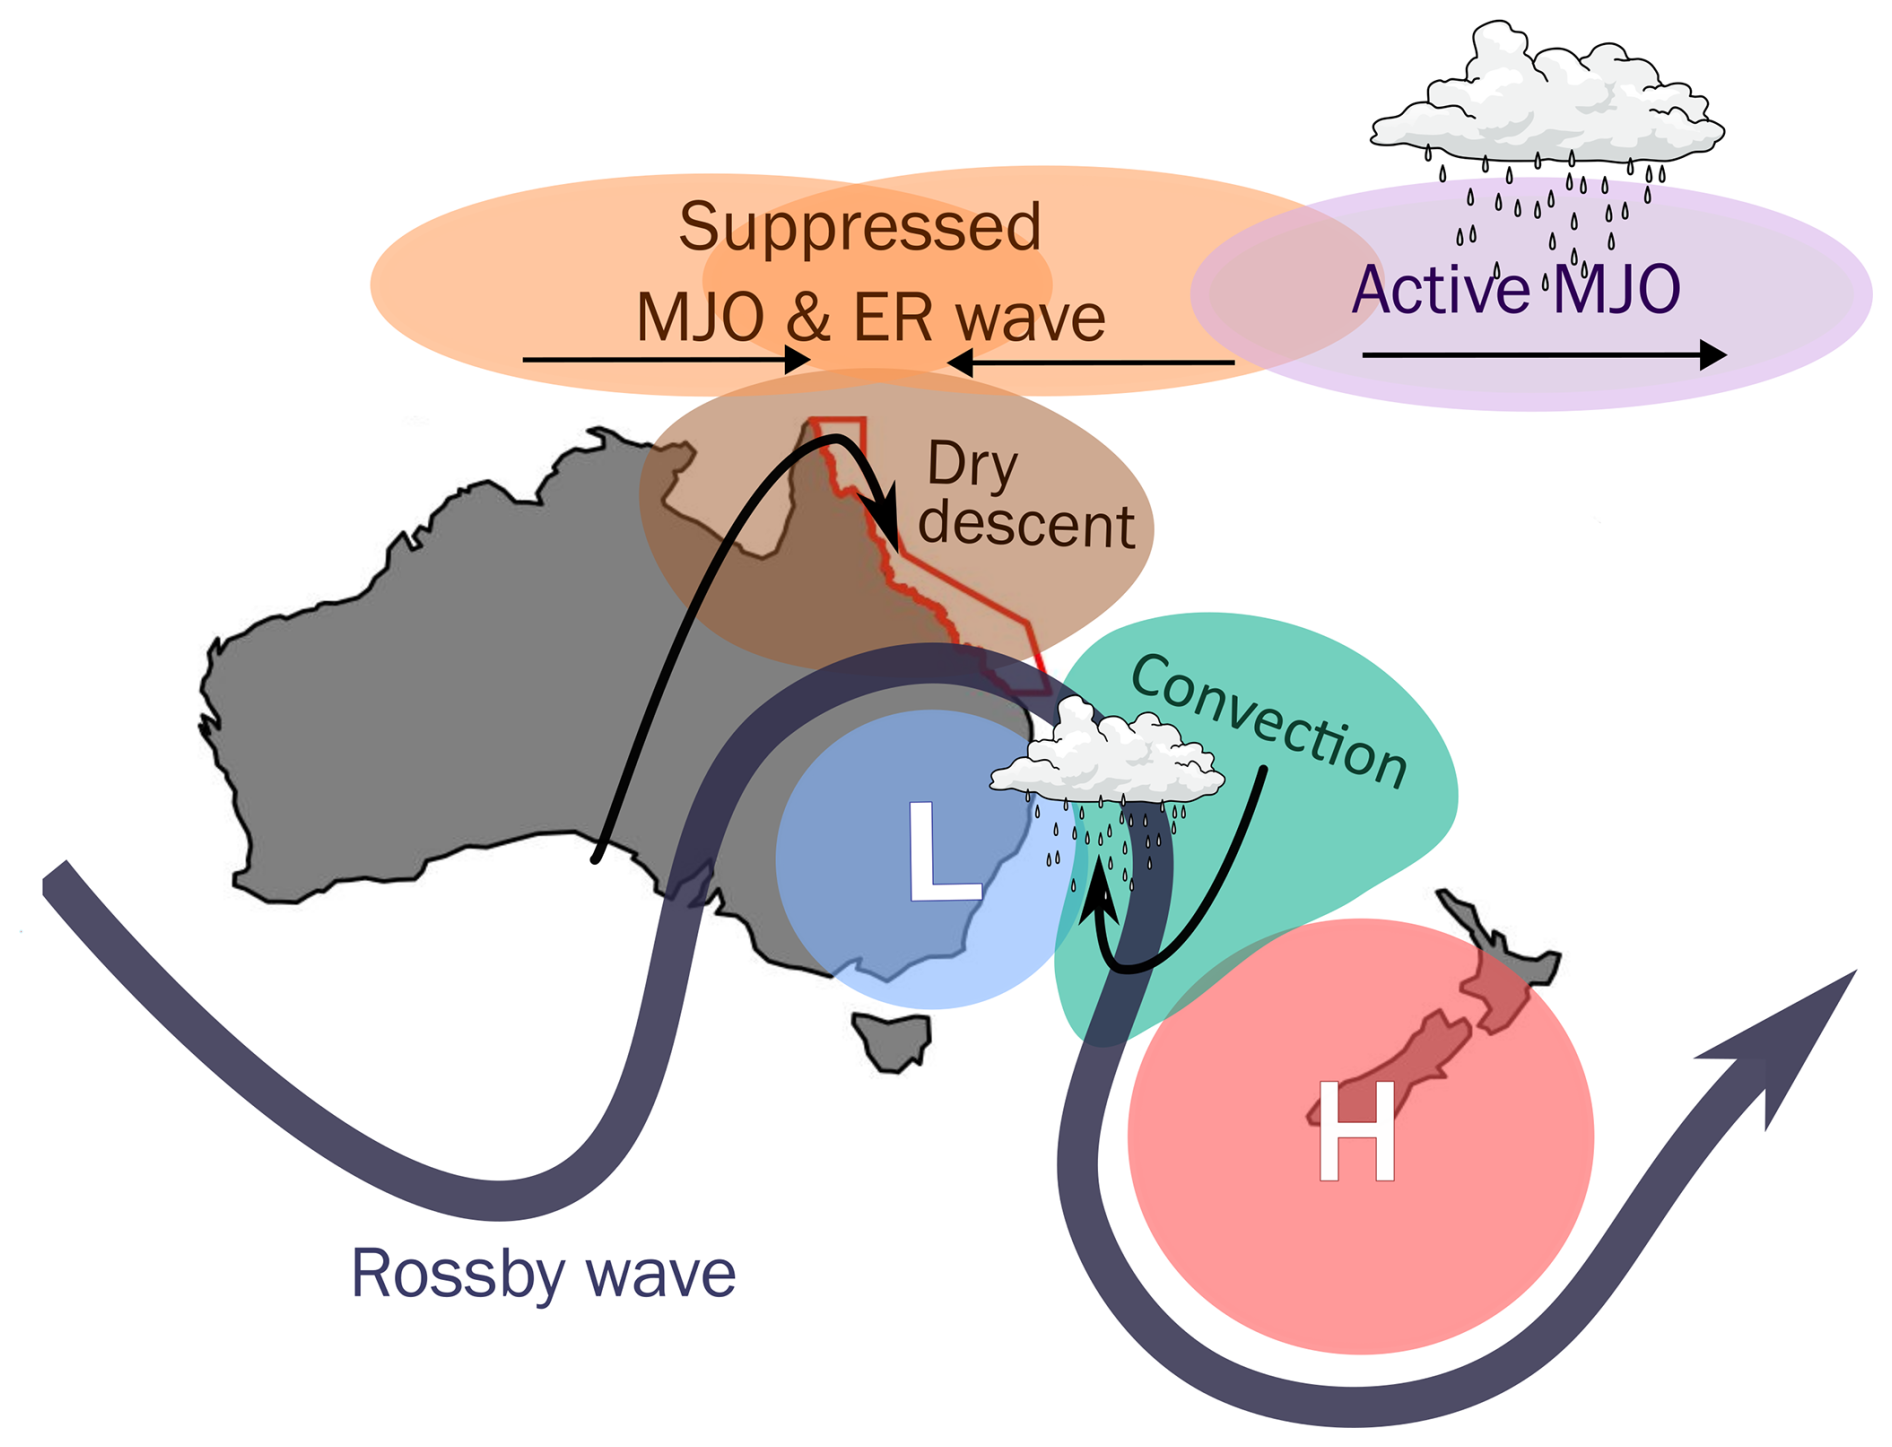
Figure 12Schematic of persistent doldrums processes over the Australian region.
While the mid-latitude Rossby wave packets in both long and short doldrums cases appear similar at first glance, their downstream evolution differs markedly (Fig. 2). For short cases, the cyclonic anomaly lies at the downstream edge of the Rossby wave packet which refracts towards the tropics (Fig. 3a–c) and resembles the Rossby wave packets associated with Australian monsoon bursts (O'Brien and Reeder, 2017). Overall, short doldrums are associated with a propagating Rossby wave packet that dissipates in the Pacific potentially as anticyclonic RWB (Fig. 2b). Conversely in the long cases, the cyclonic anomaly is located on the upstream edge of a Rossby wave packet. The Rossby wave packet appears to be generated closer to Australia which stalls over the South Pacific (Fig. 3h–j) similar to the Rossby wave packets observed during eastern Tasmanian rainfall extremes (Tozer et al., 2018). Between short and long doldrums, there is also a notable difference in RWB activity (Fig. 2). Prior to the doldrums formation, the longer doldrums are marked by a chain of anticyclonic RWB just west of Australia, likely producing the cyclonic anomaly or cut-off low that passes over eastern Australia (Fig. 2e). The formation of this cut-off low potentially induces the repeated cyclonic RWB over Australia (Fig. 2f), where the cut-off low is re-captured by the breaking Rossby wave (Barnes et al., 2025). This repeated RWB could amplify blocking near New Zealand (Masato et al., 2012) and force the Rossby wave generation into the Pacific (Barnes et al., 2025), thus stalling the Rossby wave packet and enhancing the doldrums duration.
Along with the alignment of tropical-extratropical wind patterns, the availability of tropical moisture may be important in increasing the length of the doldrums. In longer duration cases, large moist anomalies form over Davies Reef 6 to 8 d prior to the doldrums (Fig. 7b), aligning with the passage of the active MJO and ER waves over the GBR (Fig 10) which enhances rainfall in the region (Muhammad et al., 2024). As the MJO propagates into the Pacific and the ER wave towards the Indian Ocean, their suppressed phases align over the GBR, helping to suppress rainfall in the region (Muhammad et al., 2024). In addition, when a Rossby wave packet moves over eastern Australia, amplifies, and subsequently breaks, it can advect moisture over the Coral Sea from the active MJO towards the blocking anticyclone, along the WCBs identified in Fig. 6 (Pfahl et al., 2015). The upper anticyclone can then strengthen as the moist ascending air of the WCB releases latent heat as it condenses, warming the surrounding air and modifying the upper-tropospheric potential vorticity (Pfahl et al., 2015; Quinting and Reeder, 2017). As the strengthened block enhances easterlies on the equatorward side of the anticyclone together with the cyclonic circulation over eastern Australia would create a dipole forcing for the wave packet to stall (Masato et al., 2012; Barnes et al., 2023).
GBR doldrums are associated with dry, descending air as found in other regions, such as the tropical Atlantic (Windmiller, 2024). The origin and formation of these dry descending regions appear indicative of another atmospheric feature known as dry intrusions (Raveh-Rubin, 2017), which are extratropically forced regions of dry descending air, often associated with RWB. From our trajectory analysis (Fig. 8), the column of dry descending air above the doldrums generally originates in the extratropics, descending over the arid regions of south-east Australia towards the GBR, likely forced by RWB and the formation of mid-level cut-off lows. Studies of tropical dry intrusions with extratropical origins have noted similar interactions where RWB precedes the dry intrusion formation. In Barbados, RWB also weakened the trade winds prior to the dry intrusion forming (Aemisegger et al., 2021), while Villiger et al. (2022) noted the dry intrusions were steered towards the region by upper-level RWB before descending into the cold sector of an extratropical cyclone from ∼ 500 hPa. In the Australian region, dry intrusions following RWB have been reported in the tropics just west of Australia (Aslam et al., 2023). The properties traced along the dry intrusions during doldrums events act similarly to previous studies where diabatic cooling and moistening is observed as the parcel descends (Raveh-Rubin, 2017; Aemisegger et al., 2021; Villiger et al., 2022). However, in this study, some parcels that descend into the boundary layer cool up to 10 K over 48 hours, which is far more than has previously noted 6 K by Aemisegger et al. (2021). Notably, the parcels experiencing the strongest diabatic cooling are found closest to the surface, where increased moistening occurs as they pass over the Coral Sea (Fig. 8a–b) likely in a similar process described in Villiger et al. (2022). Lastly, despite the suppressed tropical wave phases over the GBR. These waves do not notably influence the origin of the dry intrusions, with only a small portion of trajectories >800 hPa moving from the tropics towards Davies Reef.
Dry intrusion trajectories, mainly from the boundary layer, also have similar pathways to Quinting et al. (2018)'s study of Brisbane heatwaves, with one pathway from the south-west crossing Australia and one coming from the east interacting with the Coral Sea. Henderson et al. (2024)'s study of south-east Queensland heatwaves noted similar Rossby wave patterns over Australia with a region of anomalous descent and negative rainfall anomalies over the GBR. While the doldrums have not been explicitly connected to terrestrial heatwaves in the region, the doldrums persistence and intense surface heating are known to cause coral bleaching and marine heatwaves over the shallow waters of the GBR. Heating associated with GBR doldrums is evidently not limited to the ocean. Figure 3g–j shows positive 850 hPa temperature anomalies sweeping across north-east Australia. Within the doldrums, weak winds result in the surface layer becoming hot and humid (Windmiller, 2024; Richards et al., 2024, 2026). Dry intrusions within the doldrums may additionally promote the development of terrestrial heatwaves over the region by capping the humid surface layer and preventing deep convection allowing boundary layer heat to persist for multiple days. Interestingly, this same synoptic setup seen within the doldrums, with a cyclonic anomaly over eastern Australia or the Tasman Sea, has been attributed to terrestrial heatwaves over north-east Australia (Pathmeswaran et al., 2022; Henderson et al., 2024) and the Brisbane region (Quinting et al., 2018). Pathmeswaran et al. (2022) investigated both marine and terrestrial heatwaves and their co-occurrence, noting that the synoptic conditions driving terrestrial heatwaves also drove ocean heating in the region, and that given the background ocean temperatures were warm enough, this heating can promote marine heatwaves. The cut-off low in south-east Australian and the associated south-westerly flow over the GBR (opposing the regular trade wind flow) appears essential for the build up of atmospheric and ocean heat over north-east Australia and the GBR. While the doldrums have been known to cause marine heatwaves in the region, this work further supports the ideas of Pathmeswaran et al. (2022) that the doldrums and their synoptic meteorology are the same as terrestrial heatwaves.
4.1 Potential limitations and future work
Lastly, while the results of this study highlight the many processes involved in the doldrums formation, it is important to address the potential limitations behind our definition of the doldrums. In this study, as in Richards et al. (2026), a single day is assigned a cluster based on the 00:00 UTC profile at Davies Reef alone. Thus, many days would sit on the fringe of what is defined a doldrums day. This limitation is more prominent when determining the duration of the doldrums, as doldrums events can be broken up by a single non-doldrums day, meaning the duration of the events are potentially longer than shown in Fig. 1b. This clustering method also does not account for any diurnal changes and may not be representative of the doldrums in a nocturnal environment. While a basic wind speed definition can also be used, similar issues will likely arise as winds remain low but not below the typical 3 m s−1 threshold.
This study has also focused exclusively on weather-scale features in opposition to the more typical climate variability approach to coral bleaching meteorology. Given the GBR's location in the tropical Pacific, the modes of interannual variability that affect the Pacific trade winds like the El Niño Southern Oscillation and the Interdecadal Pacific Oscillation could also influence some of the dynamical processes identified in this study. This approach may be more useful when addressing how the doldrums persistence differs on a year-to-year basis, connecting with the established research on modulations in Pacific trade wind strength (L'Heureux et al., 2013; England et al., 2014), which may provide further insights into what determines a coral bleaching or marine heatwave year on the GBR. Furthermore, given the study period of December–April, further research would benefit from investigating the timing of monsoon bursts and breaks within the Australian monsoon given their links to RWB (Berry and Reeder, 2016; O'Brien and Reeder, 2017). Further investigation of the Australian monsoon and the movement of tropical moisture may reveal more details on the tropical-extratropical coupling identified in the present study.
In this study, we illustrate the synoptic dynamics underlying the formation and persistence of GBR doldrums over the December to April period, highlighting the interactions between tropical and extratropical waves. In the extratropics, the doldrums' duration is related to a stalled cyclonic anomaly over south-east Australia. The longer this cyclonic anomaly (or cut-off low) stalls, the longer that anomalous westerly winds can persist over the GBR region, disrupting the trade easterlies. This disruption is enhanced by the alignment of tropical waves over the GBR region, where during longer doldrums, the MJO being in the West Pacific adds to the anomalous westerlies over the GBR.
Concurrently, the tropics need to be primed to interact with the extratropical Rossby wave packet. During longer doldrums, the suppressed phases of the MJO and ER wave are more often located over the GBR region, with the active MJO in the Coral Sea. Moisture from the Coral Sea can then readily interact with the breaking Rossby wave as the cut-off low forms, promoting ascent and convection to the east of the low along the WCB. Here, both the impediment of the mid-latitude flow via the cyclonic RWB and diabatic latent heat release within the ascending WCB air streams may further reinforce downstream blocking over New Zealand and the stalling of the Rossby wave packet in line with previous findings (Pfahl et al., 2015). Overall, allowing the doldrums to persist for longer.
The dry descending air of the doldrums is further studied through the lens of dry intrusions. Air parcels descend from the mid-latitudes over south-eastern Australia, moving cyclonically around the cut-off low toward the GBR. This local subsidence, combined with weak surface mixing, suppresses deep convection while also maintaining the abnormally warm and moist surface layer below. The parcels that descend closest to the surface first interact with the Coral Sea, where they moisten and experience diabatic cooling before reaching Davies Reef. The trajectory routes and synoptic patterns of the GBR doldrums closely mirror those documented for south-east Queensland heatwaves (Quinting et al., 2018; Henderson et al., 2024), demonstrating that the synoptic meteorology responsible for enhancing coral bleaching over the GBR is the same as the well-known patterns that produce both marine and terrestrial heatwaves in the region.
This work highlights the importance of understanding the formation of doldrums conditions on the GBR and the atmospheric dynamical processes that drive them. This is important for improving the forecasts of marine and terrestrial heatwaves in the region. Further work is required to understand how other aspects of the tropics, such as the Australian monsoon and tropical cyclones, interact with the doldrums development. In addition, how the development, duration, and intensity of GBR doldrums may change in future climate scenarios remain unknown and warrant further investigation.
The ERA5 reanalysis data is available from the Copernicus Climate Change Service (C3S) Climate Data Store (CDS), with single level data found at https://doi.org/10.24381/cds.adbb2d47 (Hersbach et al., 2023a) and pressure level data at https://doi.org/10.24381/cds.bd0915c6 (Hersbach et al., 2023b). The Rossby wave breaking detection code is based on that of Kaderli (2023) and is available at https://doi.org/10.5281/zenodo.8063526. The equatorial wave dataset uses NOAA's outgoing longwave radiation available at https://doi.org/10.25921/9pt5-by77 (Lee, 2025) and the equatorial wave dataset is available at https://doi.org/10.5281/zenodo.23253209 (Muhammad et al., 2026). The equatorial wave detection code is available on request on the GitHub page (https://github.com/fadhlilmuhammad/CCEWS_analysis, last access: 16 April 2026).
LSR performed the data analysis and prepared the manuscript. STS, YH, DPH and MAB supervised and edited the draft manuscript. MAB provided the Rossby wave breaking detection code, while FRM provided the equatorial wave data and edited the draft manuscript. Lastly CJ assisted with running LAGRANTO, producing the trajectories and editing the draft manuscript.
The contact author has declared that none of the authors has any competing interests.
Publisher's note: Copernicus Publications remains neutral with regard to jurisdictional claims made in the text, published maps, institutional affiliations, or any other geographical representation in this paper. The authors bear the ultimate responsibility for providing appropriate place names. Views expressed in the text are those of the authors and do not necessarily reflect the views of the publisher.
This work was supported by the Reef Restoration and Adaptation Program. The Reef Restoration and Adaptation Program is funded by the partnership between the Australian Governments Reef Trust and the Great Barrier Reef Foundation. This research was undertaken with the assistance of resources from the National Computational Infrastructure (NCI Australia), an NCRIS enabled capability supported by the Australian Government
This research has been supported by the ARC Centre of Excellence for the Weather of the 21st Century (grant no. CE230100012). Yi Huang and Steve Siems are further supported by an Australian Research Council Discovery Grant (grant no. DP230100639).
This paper was edited by Shira Raveh-Rubin and reviewed by two anonymous referees.
Aemisegger, F., Vogel, R., Graf, P., Dahinden, F., Villiger, L., Jansen, F., Bony, S., Stevens, B., and Wernli, H.: How Rossby wave breaking modulates the water cycle in the North Atlantic trade wind region, Weather Clim. Dynam., 2, 281–309, https://doi.org/10.5194/wcd-2-281-2021, 2021. a, b, c, d
Albright, A. L., Bony, S., Stevens, B., and Vogel, R.: Observed Subcloud-Layer Moisture and Heat Budgets in the Trades, J. Atmos. Sci., 79, 2363–2385, https://doi.org/10.1175/JAS-D-21-0337.1, 2022. a
Ali, S. M., Röthlisberger, M., Parker, T., Kornhuber, K., and Martius, O.: Recurrent Rossby waves and south-eastern Australian heatwaves, Weather Clim. Dynam., 3, 1139–1156, https://doi.org/10.5194/wcd-3-1139-2022, 2022. a
Aslam, A. A., Schwendike, J., Peatman, S. C., Birch, C. E., Bollasina, M. A., and Barrett, P.: Mid‐level dry air intrusions over the southern Maritime Continent, Q. J. Roy. Meteorol. Soc., 150, 727–745, https://doi.org/10.1002/qj.4618, 2023. a, b
Augstein, E., Riehl, H., Ostapoff, F., and Wagner, V.: Mass and Energy Transports in an Undisturbed Atlantic Trade-Wind Flow, Mon. Weather Rev., 101, 101–111, https://doi.org/10.1175/1520-0493(1973)101<0101:MAETIA>2.3.CO;2, 1973. a
Bainbridge, S. J.: Temperature and light patterns at four reefs along the Great Barrier Reef during the 2015–2016 austral summer: understanding patterns of observed coral bleaching, J. Oper. Oceanogr., 10, 16–29, https://doi.org/10.1080/1755876X.2017.1290863, 2017. a
Barnes, M. A., King, M., Reeder, M., and Jakob, C.: The dynamics of slow‐moving coherent cyclonic potential vorticity anomalies and their links to heavy rainfall over the eastern seaboard of Australia, Q. J. Roy. Meteorol. Soc., https://doi.org/10.1002/qj.4503, 2023. a, b
Barnes, M. A., Reeder, M. J., and Ndarana, T.: Rossby wave breaking morphologies on the Southern Hemisphere dynamical tropopause, J. Climate, https://doi.org/10.1175/JCLI-D-24-0461.1, 2025. a, b, c, d
Benthuysen, J. A., Oliver, E. C. J., Feng, M., and Marshall, A. G.: Extreme Marine Warming Across Tropical Australia During Austral Summer 2015–2016, J. Geophys. Res.-Oceans, 123, 1301–1326, https://doi.org/10.1002/2017JC013326, 2018. a
Benthuysen, J. A., Smith, G. A., Spillman, C. M., and Steinberg, C. R.: Subseasonal prediction of the 2020 Great Barrier Reef and Coral Sea marine heatwave, Environ. Res. Lett, 16, 124050, https://doi.org/10.1088/1748-9326/ac3aa1, 2021. a
Berrisford, P., Hoskins, B. J., and Tyrlis, E.: Blocking and Rossby Wave Breaking on the Dynamical Tropopause in the Southern Hemisphere, J. Atmos. Sci., 64, 2881–2898, https://doi.org/10.1175/jas3984.1, 2007. a, b
Berry, G. J. and Reeder, M. J.: The Dynamics of Australian Monsoon Bursts, J. Atmos. Sci., 73, 55–69, https://doi.org/10.1175/jas-d-15-0071.1, 2016. a, b
Boschat, G., Pezza, A., Simmonds, I., Perkins, S., Cowan, T., and Purich, A.: Large scale and sub-regional connections in the lead up to summer heat wave and extreme rainfall events in eastern Australia, Clim. Dynam., 44, 1823–1840, https://doi.org/10.1007/s00382-014-2214-5, 2014. a
Crowe, P. R.: The Seasonal Variation in the Strength of the Trades, Transactions and Papers, Institute of British Geographers, 25–47, https://doi.org/10.2307/621211, 1950. a, b
Crowe, P. R.: Wind and Weather in the Equatorial Zone, Transactions and Papers, Institute of British Geographers, 23–76, https://doi.org/10.2307/621291, 1951. a
de Vries, A. J.: A global climatological perspective on the importance of Rossby wave breaking and intense moisture transport for extreme precipitation events, Weather Clim. Dynam., 2, 129–161, https://doi.org/10.5194/wcd-2-129-2021, 2021. a
Eckhardt, S., Stohl, A., Wernli, H., James, P., Forster, C., and Spichtinger, N.: A 15-Year Climatology of Warm Conveyor Belts, J. Climate, 17, 218–237, https://doi.org/10.1175/1520-0442(2004)017<0218:AYCOWC>2.0.CO;2, 2004. a
England, M. H., McGregor, S., Spence, P., Meehl, G. A., Timmermann, A., Cai, W., Gupta, A. S., McPhaden, M. J., Purich, A., and Santoso, A.: Recent intensification of wind-driven circulation in the Pacific and the ongoing warming hiatus, Nat. Clim. Change, 4, 222–227, https://doi.org/10.1038/nclimate2106, 2014. a
Glynn, P. W.: Mass mortalities of echinoids and other reef flat organisms coincident with midday, low water exposures in Puerto Rico, Mar. Biol., 1, 226–243, https://doi.org/10.1007/BF00347116, 1968. a
Gregory, C. H., Holbrook, N. J., Spillman, C. M., and Marshall, A. G.: Combined Role of the MJO and ENSO in Shaping Extreme Warming Patterns and Coral Bleaching Risk in the Great Barrier Reef, Geophys. Res. Lett., 51, https://doi.org/10.1029/2024gl108810, 2024. a
Henderson, C. R., Reeder, M. J., Parker, T. J., Quinting, J. F., and Jakob, C.: Summer Heatwaves in Southeastern Australia, Q. J. Roy. Meteorol. Soc., 150, 4285–4305, https://doi.org/10.1002/qj.4816, 2024. a, b, c, d
Henderson, C. R., Barnes, M. A., Reeder, M. J., Quinting, J. F., and Jakob, C.: Heavy summer rainfall in southeastern Australia, Q. J. Roy. Meteorol. Soc., 151, https://doi.org/10.1002/qj.4936, 2025. a
Hersbach, H., Bell, B., Berrisford, P., Hirahara, S., Horányi, A., Muñoz‐Sabater, J., Nicolas, J., Peubey, C., Radu, R., Schepers, D., Simmons, A., Soci, C., Abdalla, S., Abellan, X., Balsamo, G., Bechtold, P., Biavati, G., Bidlot, J., Bonavita, M., De Chiara, G., Dahlgren, P., Dee, D., Diamantakis, M., Dragani, R., Flemming, J., Forbes, R., Fuentes, M., Geer, A., Haimberger, L., Healy, S., Hogan, R. J., Hólm, E., Janisková, M., Keeley, S., Laloyaux, P., Lopez, P., Lupu, C., Radnoti, G., de Rosnay, P., Rozum, I., Vamborg, F., Villaume, S., and Thépaut, J.: The ERA5 global reanalysis, Q. J. Roy. Meteorol. Soc., 146, 1999–2049, https://doi.org/10.1002/qj.3803, 2020. a
Hersbach, H., Bell, B., Berrisford, P., Biavati, G., Horányi, A., Muñoz‐Sabater, J., Nicolas, J., Peubey, C., Radu, R., Rozum, I., Schepers, D., Simmons, A., Soci, C., Dee, D., and Thépaut, J.: ERA5 hourly data on single levels from 1940 to present, Copernicus Climate Change Service (C3S) Climate Data Store (CDS) [data set], https://doi.org/10.24381/cds.adbb2d47, 2023a. a
Hersbach, H., Bell, B., Berrisford, P., Biavati, G., Horányi, A., Muñoz‐Sabater, J., Nicolas, J., Peubey, C., Radu, R., Rozum, I., Schepers, D., Simmons, A., Soci, C., Dee, D., and Thépaut, J.: ERA5 hourly data on pressure levels from 1940 to present, Copernicus Climate Change Service (C3S) Climate Data Store (CDS) [data set], https://doi.org/10.24381/cds.bd0915c6, 2023b. a
Hoskins, B. J., McIntyre, M. E., and Robertson, A. W.: On the use and significance of isentropic potential vorticity maps, Q. J. Roy. Meteorol. Soc., 111, 877–946, https://doi.org/10.1002/qj.49711147002, 1985. a
Kaderli, S.: skaderli/WaveBreaking: WaveBreaking v0.3.6, Zenodo [code], https://doi.org/10.5281/zenodo.8063526, 2023. a
Karnauskas, K. B.: Physical Diagnosis of the 2016 Great Barrier Reef Bleaching Event, Geophys. Res. Lett., 47, https://doi.org/10.1029/2019GL086177, 2020. a, b
Klocke, D., Brueck, M., Hohenegger, C., and Stevens, B.: Rediscovery of the doldrums in storm-resolving simulations over the tropical Atlantic, Nat. Geosci., 10, 891–896, https://doi.org/10.1038/s41561-017-0005-4, 2017. a, b
Lee, H.-T.: NOAA Climate Data Record (CDR) of Daily Outgoing Longwave Radiation (OLR), Version 2.0, NOAA National Centers for Environmental Information [data set], https://doi.org/10.25921/9pt5-by77, 2025. a
L'Heureux, M., Lee, S., and Lyon, B.: Recent multidecadal strengthening of the Walker circulation across the tropical Pacific, Nat. Clim. change, 3, 571–576, https://doi.org/10.1038/nclimate1840, 2013. a
Madden, R. A. and Julian, P. R.: Description of Global-Scale Circulation Cells in the Tropics with a 40–50 Day Period, J. Atmos. Sci., 29, 1109–1123, https://doi.org/10.1175/1520-0469(1972)029<1109:DOGSCC>2.0.CO;2, 1972. a
Madonna, E., Wernli, H., Joos, H., and Martius, O.: Warm Conveyor Belts in the ERA-Interim Dataset (1979–2010). Part I: Climatology and Potential Vorticity Evolution, J. Climate, 27, 3–26, https://doi.org/10.1175/JCLI-D-12-00720.1, 2014. a
Malkus, J. S.: On the structure of the trade wind moist layer, Phys. Oceanogr. Meteorol., https://doi.org/10.1575/1912/5443, 1958. a, b
Masato, G., Hoskins, B. J., and Woollings, T. J.: Wave-breaking characteristics of midlatitude blocking, Q. J. Roy. Meteorol. Soc., 138, 1285–1296, https://doi.org/10.1002/qj.990, 2012. a, b
McGowan, H. and Theobald, A.: Atypical weather patterns cause coral bleaching on the Great Barrier Reef, Australia during the 2021-2022 La Niña, Sci. Rep., 13, 6397–6397, https://doi.org/10.1038/s41598-023-33613-1, 2023. a, b
McIntyre, M. E. and Palmer, T. N.: Breaking planetary waves in the stratosphere, Nature, 305, 593–600, https://doi.org/10.1038/305593a0, 1983. a
McIntyre, M. E. and Palmer, T. N.: The “surf zone” in the stratosphere, J. Atmos. Terr. Phys., 46, 825–849, https://doi.org/10.1016/0021-9169(84)90063-1, 1984. a
Muhammad, F. R., Vincent, C., King, A., and Lubis, S. W.: The Impacts of Convectively Coupled Equatorial Waves on Extreme Rainfall in Northern Australia, J. Climate, 37, 5973–5993, https://doi.org/10.1175/jcli-d-24-0042.1, 2024. a, b, c, d, e
Muhammad, F. R., Richards, L., and Huang, Y.: Processed data for “The development and duration of doldrums over the Great Barrier Reef”, in: The development and duration of doldrums over the Great Barrier Reef, Zenodo [data set], https://doi.org/10.5281/zenodo.23253209, 2026. a
Nakamura, N. and Huang, C. S. Y.: Atmospheric blocking as a traffic jam in the jet stream, Science, 361, 42–47, https://doi.org/10.1126/science.aat0721, 2018. a
Nuijens, L. and Stevens, B.: The Influence of Wind Speed on Shallow Marine Cumulus Convection, J. Atmos. Sci., 69, 168–184, https://doi.org/10.1175/jas-d-11-02.1, 2012. a
O'Brien, L. and Reeder, M. J.: Southern Hemisphere summertime Rossby waves and weather in the Australian region, Q. J. Roy. Meteorol. Soc., 143, 2374–2388, https://doi.org/10.1002/qj.3090, 2017. a, b, c, d
Parker, T. J., Berry, G. J., and Reeder, M. J.: The Structure and Evolution of Heat Waves in Southeastern Australia, J. Climate, 27, 5768–5785, https://doi.org/10.1175/JCLI-D-13-00740.1, 2014. a
Pathmeswaran, C., Sen Gupta, A., Perkins-Kirkpatrick, S. E., and Hart, M. A.: Exploring Potential Links Between Co-occurring Coastal Terrestrial and Marine Heatwaves in Australia, Front. Climate, 4, https://doi.org/10.3389/fclim.2022.792730, 2022. a, b, c, d
Pelly, J. L. and Hoskins, B. J.: A New Perspective on Blocking, J. Atmos. Sci., 60, 743–755, https://doi.org/10.1175/1520-0469(2003)060<0743:ANPOB>2.0.CO;2, 2003. a
Pfahl, S., Schwierz, C., Croci-Maspoli, M., Grams, C. M., and Wernli, H.: Importance of latent heat release in ascending air streams for atmospheric blocking, Nat. Geosci., 8, 610–614, https://doi.org/10.1038/ngeo2487, 2015. a, b, c, d
Pook, M. J., Risbey, J. S., McIntosh, P. C., Ummenhofer, C. C., Marshall, A. G., and Meyers, G. A.: The Seasonal Cycle of Blocking and Associated Physical Mechanisms in the Australian Region and Relationship with Rainfall, Mon. Weather Rev., 141, 4534–4553, https://doi.org/10.1175/mwr-d-13-00040.1, 2013. a
Quinting, J. F. and Reeder, M. J.: Southeastern Australian Heat Waves from a Trajectory Viewpoint, Mon. Weather Rev., 145, 4109–4125, https://doi.org/10.1175/mwr-d-17-0165.1, 2017. a, b
Quinting, J. F., Parker, T. J., and Reeder, M. J.: Two Synoptic Routes to Subtropical Heat Waves as Illustrated in the Brisbane Region of Australia, Geophys. Res. Lett., 45, https://doi.org/10.1029/2018gl079261, 2018. a, b, c, d, e
Raveh-Rubin, S.: Dry Intrusions: Lagrangian Climatology and Dynamical Impact on the Planetary Boundary Layer, J. Climate, 30, 6661–6682, https://doi.org/10.1175/jcli-d-16-0782.1, 2017. a, b, c, d
Reeder, M. J., Spengler, T., and Musgrave, R.: Rossby waves, extreme fronts, and wildfires in southeastern Australia, Geophys. Res. Lett., 42, 2015–2023, https://doi.org/10.1002/2015gl063125, 2015. a, b
Richards, L. S., Siems, S. T., Huang, Y., Zhao, W., Harrison, D. P., Manton, M. J., and Reeder, M. J.: The meteorological drivers of mass coral bleaching on the central Great Barrier Reef during the 2022 La Nina, Sci. Rep., 14, 23867, https://doi.org/10.1038/s41598-024-74181-2, 2024. a, b, c, d, e, f, g
Richards, L. S., Siems, S. T., Huang, Y., Harrison, D. P., and Zhao, W.: Trade wind regimes during the Great Barrier Reef coral bleaching season, Weather Clim. Dynam., 7, 109–127, https://doi.org/10.5194/wcd-7-109-2026, 2026. a, b, c, d, e, f, g, h, i, j, k, l
Richardson, D., Pitman, A. J., and Ridder, N. N.: Climate influence on compound solar and wind droughts in Australia, npj Clim. Atmos. Sci., 6, https://doi.org/10.1038/s41612-023-00507-y, 2023. a
Riehl, H., Yeh, T. C., Malkus, J. S., and la Seur, N. E.: The north‐east trade of the Pacific Ocean, Q. J. Roy. Meteorol. Soc., 77, 598–626, https://doi.org/10.1002/qj.49707733405, 1951. a, b
Robinson, C., Narsey, S., Jakob, C., and Nguyen, H.: Weather systems associated with synoptic variability in the moist margin, Weather Clim. Dynam., 6, 369–385, https://doi.org/10.5194/wcd-6-369-2025, 2025. a
Robinson, C. M., Barnes, M. A., Narsey, S., and Reeder, M. J.: The meteorology of the 2019 North Queensland floods, Q. J. Roy. Meteorol. Soc., https://doi.org/10.1002/qj.4685, 2024. a
Sinclair, M. R.: A Climatology of Anticyclones and Blocking for the Southern Hemisphere, Mon. Weather Rev., 124, 245–264, https://doi.org/10.1175/1520-0493(1996)124<0245:ACOAAB>2.0.CO;2, 1996. a
Skirving, W. and Guinotte, J.: The sea surface temperature story on the Great Barrier Reef during the coral bleaching event of 1998, CRC Press, 321–334, https://doi.org/10.1201/9781420041675, 2000. a
Skirving, W., Heron, M., and Heron, S.: The Hydrodynamics of a Bleaching Event: Implications for Management and Monitoring, pp. 145–161, Washington, D. C: American Geophysical Union, Washington, D. C, https://doi.org/10.1029/61CE09, 2006. a, b
Sprenger, M. and Wernli, H.: The LAGRANTO Lagrangian analysis tool – version 2.0, Geosci. Model Dev., 8, 2569–2586, https://doi.org/10.5194/gmd-8-2569-2015, 2015. a
Tibaldi, S., Tosi, E., Navarra, A., and Pedulli, L.: Northern and Southern Hemisphere Seasonal Variability of Blocking Frequency and Predictability, Mon. Weather Rev., 122, 1971–2003, https://doi.org/10.1175/1520-0493(1994)122<1971:NASHSV>2.0.CO;2, 1994. a, b, c
Tozer, C. R., Risbey, J. S., O'Kane, T. J., Monselesan, D. P., and Pook, M. J.: The Relationship between Wave Trains in the Southern Hemisphere Storm Track and Rainfall Extremes over Tasmania, Mon. Weather Rev., 146, 4201–4230, https://doi.org/10.1175/mwr-d-18-0135.1, 2018. a
van Mourik, J., de Vries, H., and Baatsen, M.: On the movement of atmospheric blocking systems and the associated temperature responses, Weather Clim. Dynam., 6, 413–429, https://doi.org/10.5194/wcd-6-413-2025, 2025. a
Villiger, L., Wernli, H., Boettcher, M., Hagen, M., and Aemisegger, F.: Lagrangian formation pathways of moist anomalies in the trade-wind region during the dry season: two case studies from EUREC4A, Weather Clim. Dynam., 3, 59–88, https://doi.org/10.5194/wcd-3-59-2022, 2022. a, b, c
Wernli, H. and Davies, H. C.: A Lagrangian-based analysis of extratropical cyclones. I: The method and some applications, Q. J. Roy. Meteorol. Soc., 123, 467–489, https://doi.org/10.1002/qj.49712353811, 1997. a
Wheeler, M. C., Hendon, H. H., Cleland, S., Meinke, H., and Donald, A.: Impacts of the Madden–Julian Oscillation on Australian Rainfall and Circulation, J. Climate, 22, 1482–1498, https://doi.org/10.1175/2008JCLI2595.1, 2009. a
Windmiller, J. M.: The Calm and Variable Inner Life of the Atlantic Intertropical Convergence Zone: The Relationship Between the Doldrums and Surface Convergence, Geophys. Res. Lett., 51, https://doi.org/10.1029/2024gl109460, 2024. a, b, c, d, e
Wyrtki, K. and Meyers, G.: The Trade Wind Field Over the Pacific Ocean, J. Appl. Meteorol. Climatol., 15, 698–704, https://doi.org/10.1175/1520-0450(1976)015<0698:TTWFOT>2.0.CO;2, 1976. a, b
Zhao, W., Huang, Y., Siems, S., and Manton, M.: The Role of Clouds in Coral Bleaching Events Over the Great Barrier Reef, Geophys. Res. Lett., 48, https://doi.org/10.1029/2021GL093936, 2021. a
Zhao, W., Huang, Y., Siems, S., and Manton, M.: A characterization of clouds over the Great Barrier Reef and the role of local forcing, Int. J. Climatol., 42, 6647–6664, https://doi.org/10.1002/joc.7660, 2022. a
Zhao, W., Huang, Y., Siems, S., Manton, M., and Harrison, D.: Interactions between trade wind clouds and local forcings over the Great Barrier Reef: a case study using convection-permitting simulations, Atmos. Chem. Phys., 24, 5713–5736, https://doi.org/10.5194/acp-24-5713-2024, 2024. a