
the Creative Commons Attribution 4.0 License.
the Creative Commons Attribution 4.0 License.
 | 13 Oct 2026
Stratosphere–troposphere exchange and surface ozone pollution over tropical regions: a case study of Rossby wave breaking and tropopause folding
Clemente Lopez-Bravo

Ernesto Caetano
Armenia Franco-Díaz
Stratosphere–troposphere exchange (STE) is a fundamental process in which ozone-rich stratospheric air enters the troposphere, modulating tropospheric ozone distributions and, under favorable conditions, influencing surface air quality. This study investigates an atypical STE event over North America from 6 to 14 March 2016, which coincided with a severe surface ozone pollution episode in Mexico City. Analyses using ERA5 reanalysis, potential vorticity (PV) diagnostics, ozone tracers, Lagrangian trajectories, and isentropic methods attribute the event to anticyclonic Rossby wave breaking, a PV cut-off low, and a persistent tropopause fold. Deep intrusions of high-PV air penetrated the troposphere, with maximum downward transport occurring approximately 1 d before the peak in surface ozone (O3) mixing ratios. Equatorward wave amplification facilitated coherent isentropic transport, enabling efficient descent of ozone-rich stratospheric air over the elevated basins of central Mexico. Backward trajectory analysis confirmed stratospheric origins, while isentropic advection quantified quasi-horizontal transport along 320–340 K surfaces. Tropopause folding, intensified by the subtropical jet and the elevated terrain of central Mexico, resulted in enhanced O3 mixing ratios of 8 × 10⁻⁸ kg kg−1 at 750–700 hPa, preconditioning background ozone levels prior to surface exceedance rather than serving as a direct surface source. The analysis identifies recurrent tropopause folds preceding high-ozone episodes, highlighting the persistent role of STE as a dynamical preconditioning mechanism for regional air-quality extremes. These results indicate that the location of cities in elevated tropical basins, in combination with Rossby wave dynamics and quasi-horizontal isentropic transport pathways, determines the depth, persistence, and significance of STE.
- Article
(12587 KB) - Full-text XML
-
Supplement
(12426 KB) - BibTeX
- EndNote


Stratosphere–troposphere exchange (STE) is a fundamental atmospheric process responsible for transporting air masses, including trace gases like ozone (Bates and Jacob, 2020; Holton et al., 1995; Martin, 1998; Wang and Fu, 2021), across the dynamic boundary that separates the stratosphere and troposphere, known as the tropopause. Tropopause folds are identified as a primary mechanism of STE and are frequently associated with upper-tropospheric jet streams and mid-latitude baroclinic systems. These tropopause folds facilitate the downward transport of stratospheric ozone into the upper and middle troposphere (Škerlak et al., 2014, 2015; Sprenger et al., 2003). While tropopause folds are most commonly investigated at mid-latitudes, these can also occur in subtropical and tropical regions, particularly during the boreal winter (Barrett et al., 2019; Ogino et al., 2013; Toihir et al., 2018).
Tropopause folds are frequently linked to Rossby wave breaking (RWB) events, where large-amplitude wave disturbances on the tropopause surface evolve into overturning structures, inducing potential vorticity (PV) anomalies and enhancing cross-tropopause mixing (Gabriel and Peters, 2008; Luo et al., 2019; Postel and Hitchman, 1999). However, the presence of RWB or tropopause folding alone does not necessarily indicate STE. Dynamical deformation of the tropopause must be accompanied by transport processes, such as PV cut-off low formation, turbulent mixing, or sustained isentropic descent, to enable stratospheric air to persist within the troposphere and alter its chemical composition (Holton et al., 1995; Sprenger et al., 2003). Consequently, only a subset of observed tropopause folds result in meaningful STE, and the depth, duration, and thermodynamic characteristics of these events largely determine their impact on tropospheric ozone and surface air quality, exacerbating the already low air quality in cities and megacities around the globe (Chen et al., 2024; Li et al., 2025; Ni et al., 2024; Vazquez Santiago et al., 2024).
The STE events can substantially modify tropospheric ozone distributions and, under favorable meteorological conditions, intensify surface air-quality episodes. Stratospheric ozone constitutes a primary natural source of background tropospheric ozone (Grewe, 2006), and its downward transport can significantly increase ozone (O3) mixing ratios in the lower troposphere. Previous research has shown that STE events may elevate surface O3 mixing ratios and, in certain instances, result in exceedances of air-quality standards (Knowland et al., 2017; Lin et al., 2015; Nguyen et al., 2022; Wang and Fu, 2021). Assessing this contribution presents significant challenges in polluted tropical and subtropical cities, where stratospheric transport interacts with local precursor emissions, photochemical processes, atmospheric dynamics, and regional transport. Most existing studies have focused on mid-latitude regions and have primarily utilized Eulerian diagnostics. In contrast, relatively few investigations have explored the detailed Lagrangian pathways and isentropic evolution of stratospheric intrusions, especially within tropical and subtropical environments.
Mexico City serves as an appropriate case study for investigating the potential descent of stratospheric air into the lower troposphere and its impact on surface ozone levels in a tropical megacity. Situated at approximately 19° N and 2300 m above sea level within a mountain basin, the location and altitude of the city make it particularly susceptible to mid-latitude dynamical processes during the boreal winter (Binder and Wernli, 2025; Boothe and Homeyer, 2017; Škerlak et al., 2014). The southerly extension of the mid-latitude waveguide in this season allows baroclinic systems and upper-level troughs to reach subtropical and sometimes tropical latitudes (Hoskins and Karoly, 1981; Karoly and Hoskins, 1983; Nakamura, 1992; Trenberth, 1991), including central Mexico. The location of Mexico City also favors stable, dry atmospheric conditions during the boreal winter, resulting in reduced vertical mixing and pollutant dispersion; under these conditions, local emissions accumulate and can lead to episodes of high near-surface O3 mixing ratios. Additionally, complex terrain, basin circulations, boundary-layer dynamics, and significant local emissions strongly influence near-surface ozone levels. These factors complicate the differentiation between large-scale stratospheric ozone transport and local or regional ozone production. As a result, comprehensive case studies that directly link stratospheric intrusions to documented high-ozone episodes in Mexico City are insufficient.
Despite these favorable conditions for STE impacts, detailed case studies explicitly linking stratospheric intrusions, their dynamical evolution, and documented surface ozone exceedances in Mexico City remain scarce. Barrett et al. (2019) presented surface observations and large-scale analyses on a tropopause fold over Mexico City and highlighted the potential importance of STE in contributing to extreme surface O3 mixing ratios. While previous research has emphasized the potential significance of STE in contributing to extreme surface O3 mixing ratios, the specific Lagrangian pathways, isentropic evolution, vertical structure, and synoptic development enabling stratospheric air to reach the lower troposphere over central Mexico are not fully understood. This study seeks to address these knowledge gaps by integrating reanalysis data with Lagrangian trajectory and isentropic analyses to characterize the dynamical evolution and transport pathways associated with the event, and to evaluate their potential impact on surface ozone.
A significant high-ozone episode occurred in Mexico City from 6 to 14 March 2016, coinciding with a pronounced large-scale dynamical disturbance over Mexico that included a mid-latitude cyclone, RWB, and deep tropopause folding. Historical environmental reports identify this event as one of the most severe high-O3 episodes documented in Mexico City, with surface O3 mixing ratios reaching approximately 210 parts per billion by volume (ppb) at several monitoring stations on 14 March (DMA, 2025). The concurrence of this severe episode with dynamical conditions favorable for STE presents an opportunity to investigate whether stratospheric air descended into the lower troposphere and contributed to surface-ozone enhancements in Mexico City and other Mexican urban centers.
This study presents a dynamical analysis of the March 2016 event, focusing on the evolution of Rossby wave breaking, the associated tropopause fold, and the relationship between stratospheric transport and surface ozone over Mexico City and other Mexican urban regions. The analysis integrates European Centre for Medium-Range Weather Forecasts Reanalysis version 5 data (ERA5; Hersbach et al., 2020), PV and isentropic diagnostics, Lagrangian trajectories, satellite products, and surface observations to address the following research questions: (1) How did the RWB event and associated tropopause fold evolve? (2) Do the Lagrangian and isentropic diagnostics provide evidence that stratospheric air crossed the tropopause, descended into the troposphere, and persisted there? (3) What was the spatial and temporal relationship between the diagnosed stratospheric intrusion and surface ozone enhancements over Mexico City and other Mexican urban regions? (4) Did similar dynamical signatures consistent with STE precede other major high-ozone episodes in Mexico City? Addressing these questions enables an assessment of the potential contribution of large-scale stratospheric transport, while acknowledging that observed surface ozone enhancements and exceedances cannot be attributed exclusively to STE.
These findings also highlight the need to incorporate large-scale stratospheric processes into the interpretation and forecasting of air-quality variability in tropical and subtropical urban regions. Given ongoing urbanization and the persistent frequency of ozone exceedance days in Mexican cities, enhanced monitoring of Rossby wave breaking and related tropopause dynamics could improve early warning systems for severe pollution episodes during the boreal winter.
The remainder of this paper is organized as follows. Section 2 describes the study period, datasets, and methods, including the reanalysis, observational, Lagrangian, and isentropic diagnostics. Section 3 presents a dynamical analysis of the event, which covers the structure of the Rossby wave breaking, the evolution of the tropopause fold, and the spatiotemporal distribution of stratospheric ozone tracers over Mexico City and other urban regions. Sections 4 and 5 provide the discussion and conclusions, respectively.
2.1 Data Sources and Event Selection
2.1.1 ERA5 Reanalysis
The ERA5 global reanalysis was used at a horizontal resolution of 0.25° × 0.25° with hourly output and vertical resolution of 37 levels. ERA5 provides fields of PV, wind, temperature, and specific humidity, which are essential for the analysis of the dynamical evolution of the upper troposphere and lower stratosphere during the STE event over Mexico in March 2016. The primary variables derived from ERA5 include: (1) PV on isentropic levels, used to identify stratospheric air masses and tropopause folds; (2) wind speed and geopotential height at constant pressure levels to characterize the synoptic-scale evolution of the Rossby wave breaking and the associated PV cut-off low event over Mexico, and (3) ozone mass mixing ratio from ERA5 at constant pressure for the analysis of the downward transport of stratospheric ozone into the troposphere during the STE event. Beyond the detailed analysis of the 6–14 March 2016 event, a small set of additional high-ozone episodes over Mexico City was examined to provide a broader context for the STE mechanisms identified in this study. These events occurred on 25 December 2015, 14 April 2007, 10 April 2019, and 22 February 2024. Selection criteria included (i) documented surface ozone exceedances reported by local air-quality authorities and (ii) the presence of synoptic-scale features consistent with STE in ERA5 reanalysis fields, such as tropopause folding, enhanced upper-level PV, and ozone mixing ratios.
2.1.2 Surface Ozone Observations
Ground-based ozone observations used in this study are provided by regional air quality monitoring networks across central and western Mexico, including Mexico City, Toluca, and the Metropolitan Area of Guadalajara (locations shown in Fig. S1 in the Supplement). Surface O3 mixing ratios in Mexico City were obtained from the air quality monitoring system operated by the Secretaría del Medio Ambiente de la Ciudad de México (SEDEMA), while data for Jalisco and the Toluca Valley were retrieved from the Secretaría de Medio Ambiente y Desarrollo Territorial (SMCA) and the Red Automática de Monitoreo Atmosférico de la Zona Metropolitana del Valle de Toluca (RAMA), respectively, through the Sistema Nacional de Información de la Calidad del Aire (SINAICA). Together, these datasets provide continuous near-surface ozone measurements representative of urban and regional air quality conditions during the study period.
2.1.3 Satellite Ozone Products
Satellite-based ozone observations provided a large-scale context for the STE event examined in this study. Total and tropospheric ozone column data were sourced from the Earth Polychromatic Imaging Camera (EPIC) on the Deep Space Climate Observatory (DSCOVR) (Kramarova et al., 2021; Marshak et al., 2018). Tropospheric column ozone was obtained from the DSCOVR EPIC Level-4 tropospheric ozone product using a residual-based approach, in which the Modern-Era Retrospective analysis for Research and Applications, Version 2 (MERRA-2) stratospheric ozone column was subtracted from the EPIC total ozone column. The MERRA-2 stratospheric ozone column was calculated by integrating three-hourly ozone profiles from the top of the atmosphere to the tropopause, defined using a potential-vorticity threshold of 2.5 potential vorticity units (PVU, 1 PVU = 10−6 K m2 kg−1 s−1) and 380 K criteria. The MERRA-2 fields were spatially and temporally collocated with the EPIC observations, and the resulting tropospheric ozone columns were provided on a (1° × 1°) grid in Dobson Units. The limited vertical resolution, especially in the upper troposphere–lower stratosphere, means these products represent vertically integrated values and cannot resolve fine-scale structures. Uncertainty is further increased over regions with high-elevation terrain. EPIC total column ozone fields were qualitatively compared with independent measurements from the Ozone Mapping and Profiler Suite (OMPS) data from the Suomi National Polar-Orbiting Partnership (Suomi NPP) L2 NM Ozone (O3) Total Column swath orbital V2 (Flynn et al., 2014; Jaross, 2017).
2.2 Dynamical Tropopause, Tropopause Folds, and RWB Diagnosis
2.2.1 Tropopause Definition and Stratospheric Intrusion Diagnosis
Rossby waves originate from the latitudinal variation of the Coriolis parameter. In a stratified atmosphere, their dynamics are described using Ertel PV, which is materially conserved under adiabatic and frictionless conditions (Hoskins et al., 1985). RWB occurs when a baroclinic Rossby wave amplifies sufficiently for PV contours on isentropic surfaces to experience meridional overturning and deformation. Consequently, RWB was identified based on these changes in PV-contour geometry. This phenomenon is marked by intense meridional mixing of PV and is typically identified by a reversal of the meridional PV gradient (Postel and Hitchman, 1999). The RWB also implies the disruption of the westerly flow in the neighboring areas (Tyrlis and Hoskins, 2008) and it promotes blocking.
The dynamical tropopause is typically identified on isentropic surfaces as the PV contour that aligns with the strongest meridional gradient, which acts as a barrier to cross-tropopause transport (Holton, 1997; Holton et al., 1995). Commonly used PV thresholds range from 1.5 to 5 PVU (Jing and Banerjee, 2018; Schoeberl, 2004), and the value corresponding to the maximum gradient generally increases with potential temperature (Homeyer and Bowman, 2013; Turhal et al., 2024). In extratropical and subtropical analyses, the 2 PVU surface is widely adopted to distinguish stratospheric from tropospheric air masses and to identify tropopause folds (Holton et al., 1995; Sprenger et al., 2003; Tyrlis and Hoskins, 2008). Tropopause folds are defined in the literature where the 2 PVU surface descends below 400 hPa and coincides with regions of strong PV gradients and relative vorticity anomalies, indicating zones of potential cross-tropopause exchange (Sprenger et al., 2003; Spreitzer et al., 2019).
The PV value associated with the dynamical tropopause varies according to latitude and potential temperature, with higher PV values generally observed at higher latitudes and isentropic levels (Homeyer and Bowman, 2013). In subtropical and tropical regions, the tropopause is typically characterized by lower PV values, around 1.5 PVU. Consequently, this study employed thresholds between 1.5 and 2 PVU to provide consistency with previous research on subtropical and low-latitude STE and to identify stratospheric air masses (Škerlak et al., 2019; Gouget et al., 1996; Clain et al., 2010). Enhanced ozone, defined as an ERA5 ozone mass mixing ratio exceeding 2 × 10⁻⁷ kg kg−1, was used as a complementary chemical tracer of stratospheric influence. The combined PV and ozone criteria facilitated the interpretation of the spatial and temporal evolution of tropopause folding and stratospheric transport.
2.2.2 Rossby wave breaking identification
An RWB event over Mexico in March 2016 was analyzed using the Python package WaveBreaking (Kaderli, 2023). RWB structures were identified based on the geometry of the 2 PVU contour on isentropic surfaces, employing the Streamer, Overturning, and cut-off Indices. The Streamer Index detects filamentary PV structures whose contour points are geographically proximate but widely separated along the contour (Sprenger et al., 2017; Wernli and Sprenger, 2007). The Overturning Index identifies regions where the PV contour intersects the same meridian at least three times (Barnes and Hartmann, 2012). The Cut-off Index detects closed PV features that are detached from the parent stratospheric or tropospheric PV reservoir (Wernli and Sprenger, 2007). Stratospheric events were retained if the absolute mean PV within the detected polygon exceeded 2 PVU. Eddy momentum flux on the 310–360 K isentropic surfaces was used as the intensity field and calculated as
where and represent the zonal means at each latitude, isentropic level, and time step. WaveBreaking quantified the intensity of each detected PV streamer and PV cut-off as the unweighted sum of over all grid cells within the corresponding event polygon.
2.3 Transport Diagnostics
2.3.1 Lagrangian Trajectories
Lagrangian trajectories were computed using the Lagrangian Analysis Tool LAGRANTO (Sprenger and Wernli, 2015; Wernli and Davies, 1997) to investigate STE over Mexico. LAGRANTO allows flexible and precise definition of trajectory starting positions based on geometrical or meteorological criteria. For this study, the trajectories were initialized equidistantly (50 km spacing) over a box covering Mexico City and its Metropolitan area (Longitude: 100 to 98° W, Latitude: 18.5 to 20° N) and on multiple vertical levels between 700 and 100 hPa, with the 700 hPa level chosen to account for the altitude of Mexico City (∼ 2300 m above sea level). Backward trajectories were calculated for 72 h using ERA5 reanalysis meteorological fields as input. The trajectories were then selected based on dynamical criteria, specifically potential vorticity (PV > 2 PVU), to identify stratospheric air masses linked to the Rossby wave breaking and the PV cut-off low event over Mexico. The use of LAGRANTO enabled a detailed investigation of the downward intrusion of high-PV air along tropopause folds and its connection to the PV cut-off system over Mexico.
2.3.2 Isentropic Analysis of Tropopause Fold Transport
To quantify the downward transport of stratospheric air over Mexico City, we calculated transport across the dynamical tropopause using ERA5 winds, PV, and ozone interpolated onto isentropic surfaces following Dethof et al. (2000). Air parcels with PV > 2 PVU were tracked to identify regions of tropopause erosion, and negative advection values were interpreted as indicative of the export of high-PV stratospheric air into the troposphere. O3 mixing ratios were also used to further distinguish stratospheric signatures. This approach allows the detection of quasi-horizontal transport along isentropic surfaces (Dethof et al., 2000), providing an identification method to relate stratospheric intrusions to enhancements of near-surface ozone during the 8–15 March 2016 tropopause fold event.
3.1 Surface Ozone Episode
A regional high-ozone episode occurred over central and western Mexico between 12 and 14 March 2016 (Fig. 1). Ground-level O3 concentrations reached approximately 210 ppb, while concentrations of 100 ppb persisted for nearly 5 d in Mexico City. Monitoring networks in Toluca and Jalisco also recorded elevated O3 concentrations, indicating that the episode affected a broad area beyond Mexico City.
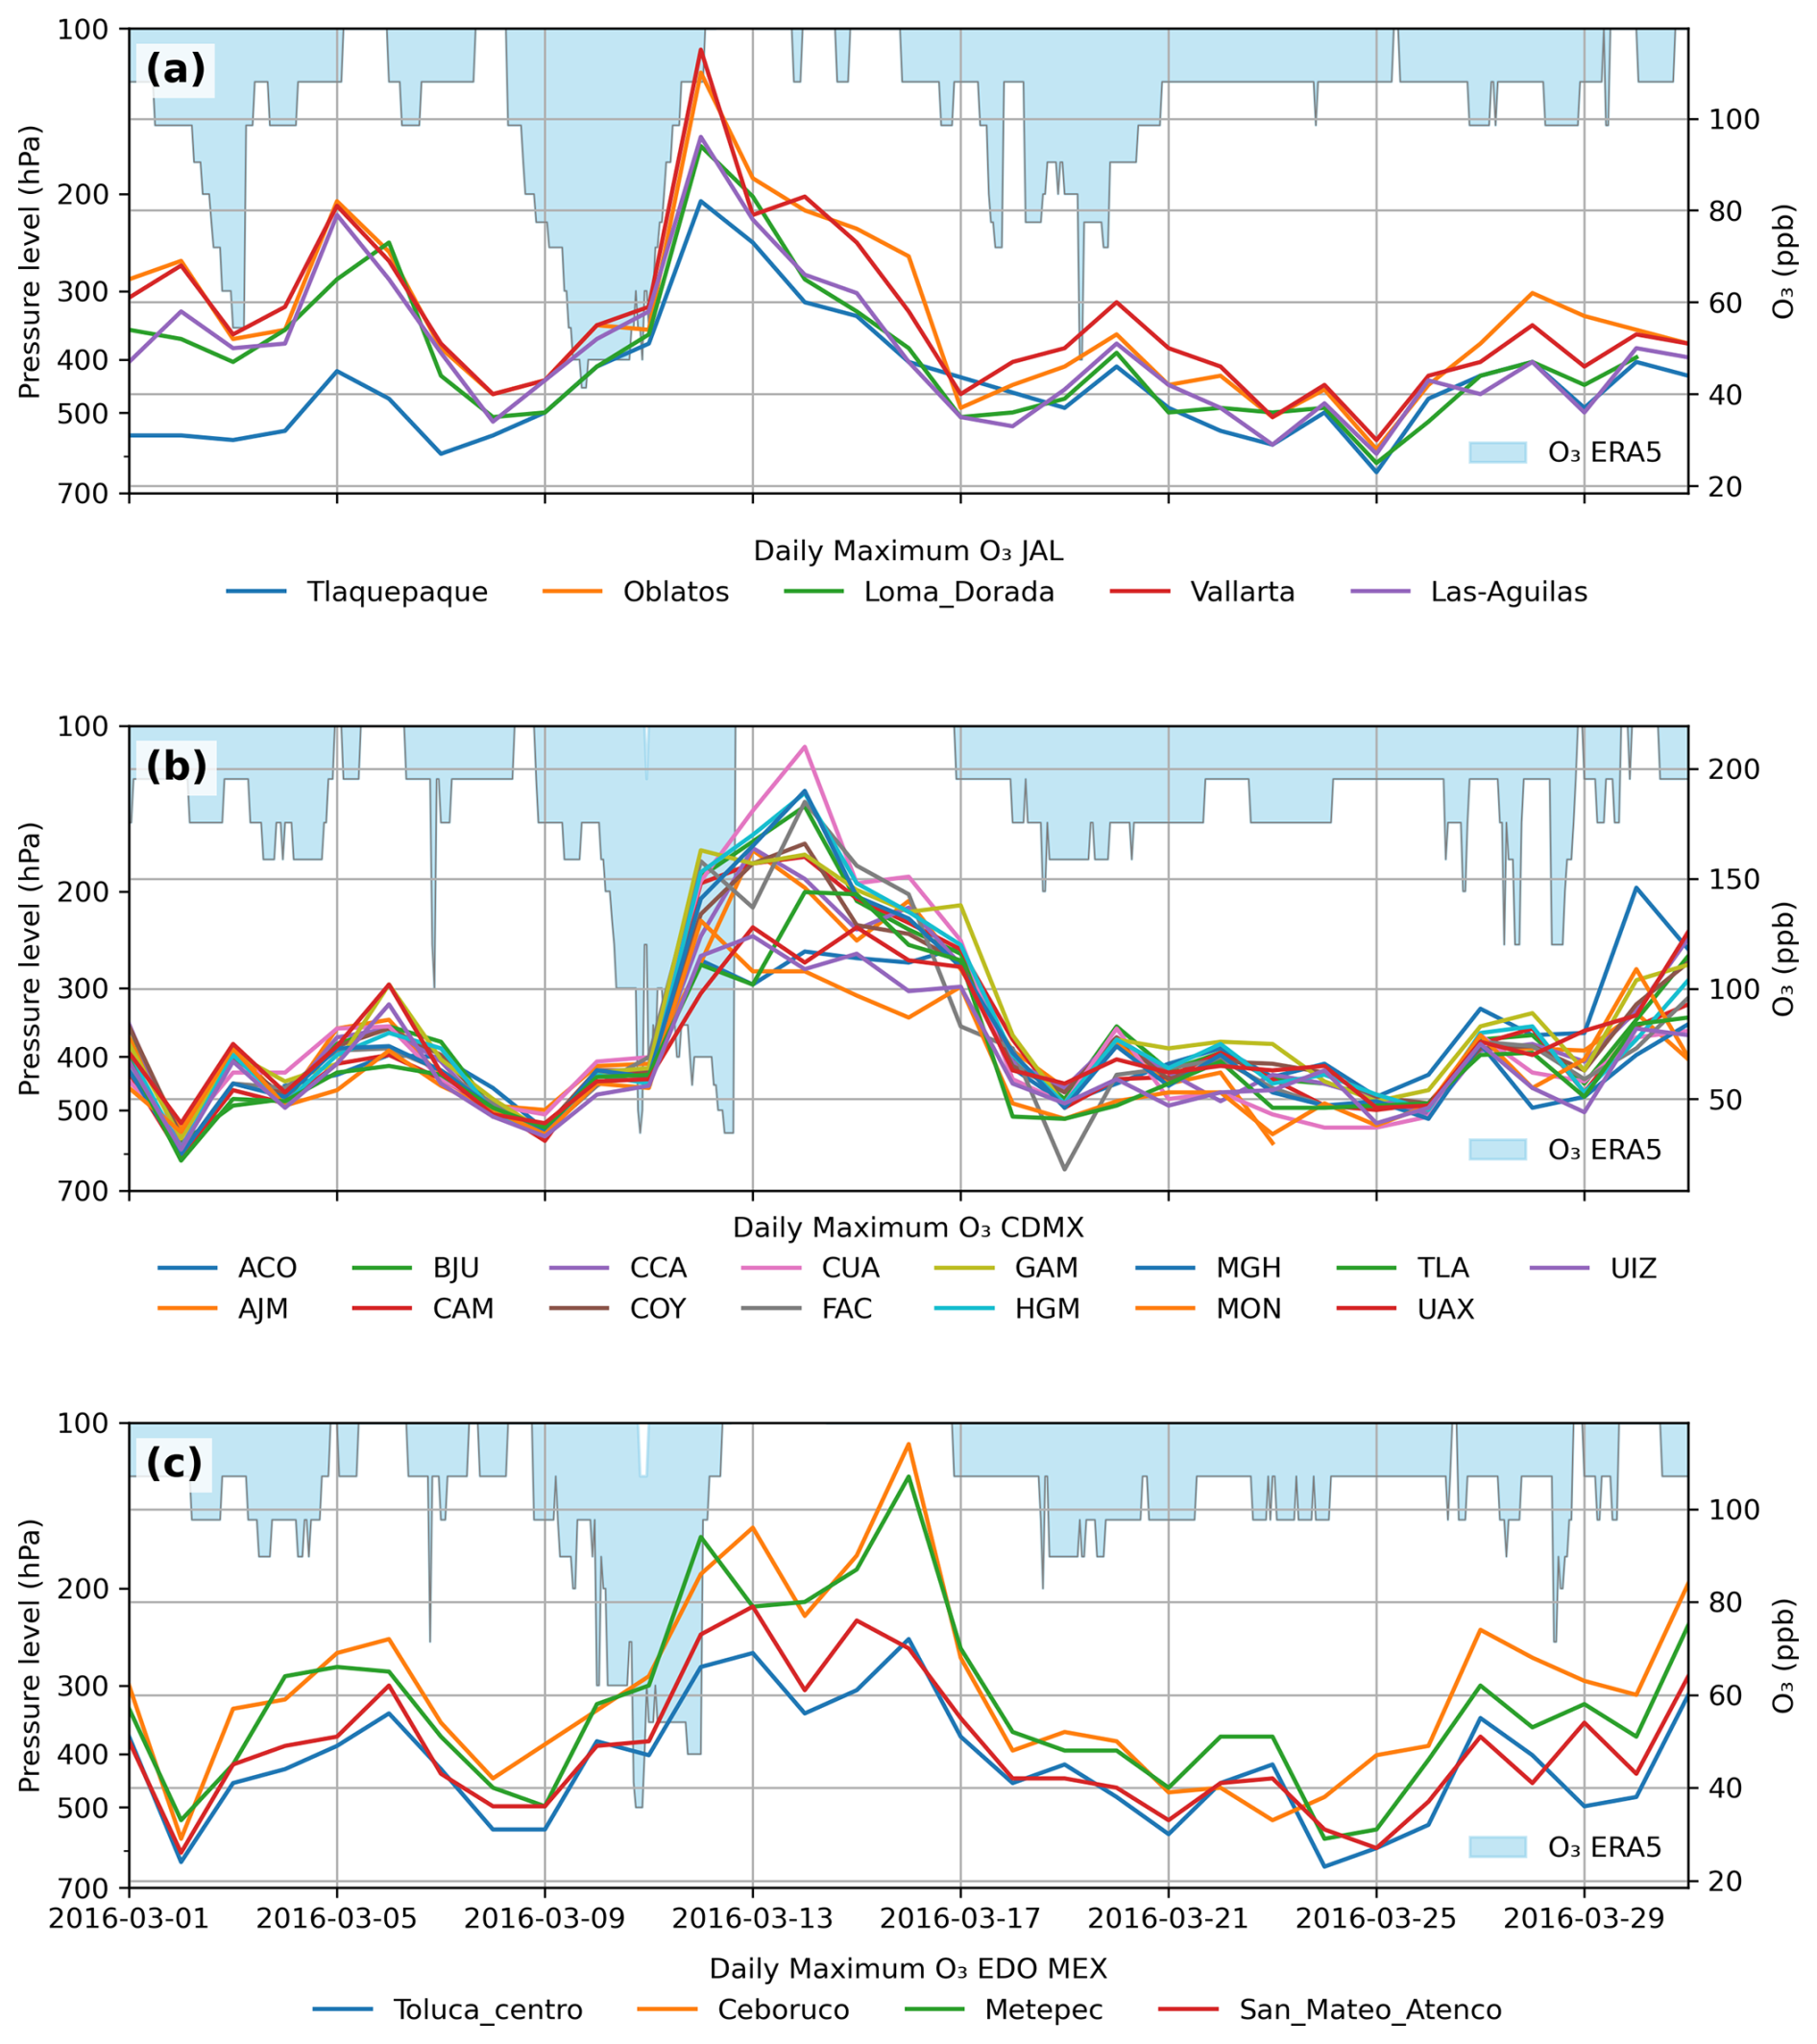
Figure 1Observed and reanalysis evidence of the high-ozone event in Mexico during 12–14 March 2016. (a) Ground-based O3 mixing ratios from the air quality monitoring network in western Mexico, Guadalajara, Jalisco, (b) Mexico City, and (c) Toluca (locations are shown in Fig. S1). Sustained ground-level ozone concentrations at three locations are reported in parts per billion (ppb). Light-blue shading identifies periods when ERA5 PV exceeded 1 PVU and ERA5 ozone mass mixing ratio exceeded 2 × 10⁻⁷ kg kg−1, indicating conditions favorable for STE. Ground-level ozone concentrations were retrieved from Calidad del Aire, Secretaría del Medio Ambiente de la Ciudad de México (SEDEMA), Mexico City (DMA, 2025). Data from Secretaría de Medio Ambiente y Desarrollo Territorial (SMCA), Jalisco, Red Automática de Monitoreo Atmosférico de la Zona Metropolitana del Valle de Toluca (RAMA) were retrieved through the Sistema Nacional de Información de la Calidad del Aire (SINAICA, 2025).
The increase in surface O3 concentrations followed a pronounced tropopause disturbance in the previous days, as shown in Fig. 1. Although this temporal pattern does not confirm a stratospheric origin for the surface ozone, the relationship motivates an investigation of whether changes in the upper-level circulation enabled ozone-rich stratospheric air to enter the troposphere. The following section examines the synoptic evolution, Rossby wave breaking, and tropopause folding.
3.2 Synoptic Evolution, Rossby Wave Breaking, and Tropopause Folding
Between 6 and 14 March 2016, a pronounced upper-tropospheric trough associated with a mid-latitude cyclone amplified over the eastern North Pacific and propagated equatorward toward central Mexico. Figure 2 presents the pressure-level synoptic diagnosis of the upper-level disturbance at a representative stage of its evolution. The 300 hPa relative-vorticity field delineated a well-defined trough extending into the subtropics at 03:00 Coordinated Universal Time (UTC) on 9 March, embedded within the circulation of the developing cyclone. This pressure-level depiction establishes the large-scale synoptic context for the subsequent PV filamentation (Animation 1; Lopez-Bravo, 2026).
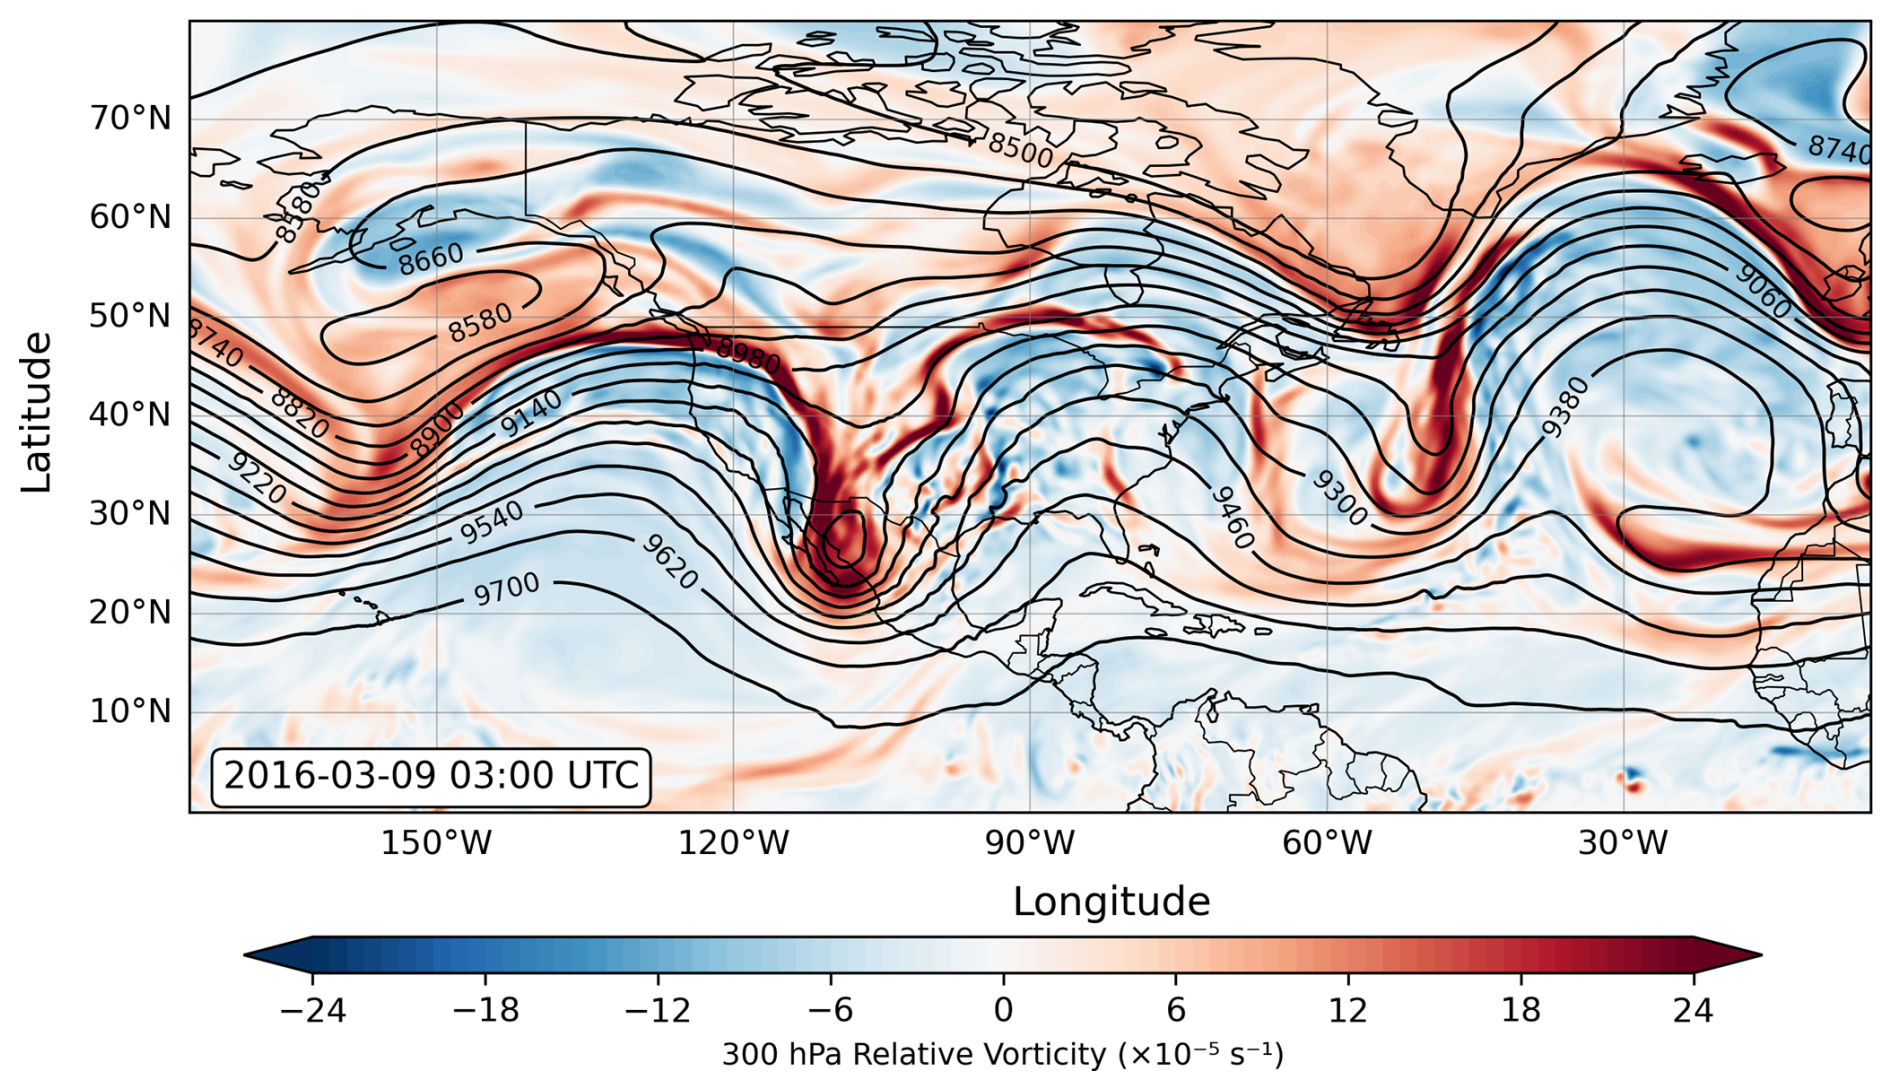
Figure 2Relative vorticity (shading, × 10−5 s−1) at 300 hPa at the time when the cyclone reached its minimum sea level pressure over Mexico (03:00 UTC, 9 March 2016). Solid black lines indicate geopotential height (m).
The spatial relationship between the surface cyclone and the 300 hPa relative-vorticity maximum quantitatively demonstrates the baroclinic structure of the system. On 8 March, the surface low was positioned near 29.75° N, 102.25° W, with a geopotential-height minimum of 682.3 m. The upper-level trough was centered near 24.75° N, 106.75° W, where relative vorticity attained 2.87 × 10⁻⁴ s−1. These features were separated by approximately 711 km. During 9–10 March, both features migrated poleward and eastward, maintaining horizontal separations of approximately 1170 and 1028 km, respectively. The persistent westward displacement of the upper-level trough relative to the surface cyclone indicates a pronounced vertical tilt with height, which is characteristic of a dynamically coherent baroclinic disturbance. The surface geopotential-height tendency showed weak deepening on 8 March (−1 × 10⁻⁴ m s−1), followed by only minor changes during the subsequent evolution.
Figure 3 presents the vertical structure of the associated tropopause disturbance. Compared to the March 2016 mean PV–θ structure (Fig. 3a), the event-specific cross-section at 21:00 UTC on 10 March displays a pronounced equatorward and downward extension of elevated PV reaching approximately 20° N (Fig. 3b). PV values between 1 and 4 PVU extend below 300 hPa, and the 2 PVU dynamical-tropopause contour was strongly displaced towards higher pressures. The presence of sharp PV gradients and the downward deformation of the dynamical tropopause provide the vertical signature of a deep tropopause disturbance over central Mexico. This cross-sectional analysis complements the pressure-level diagnosis in Fig. 2 by clarifying the vertical extent of the high-PV anomaly.
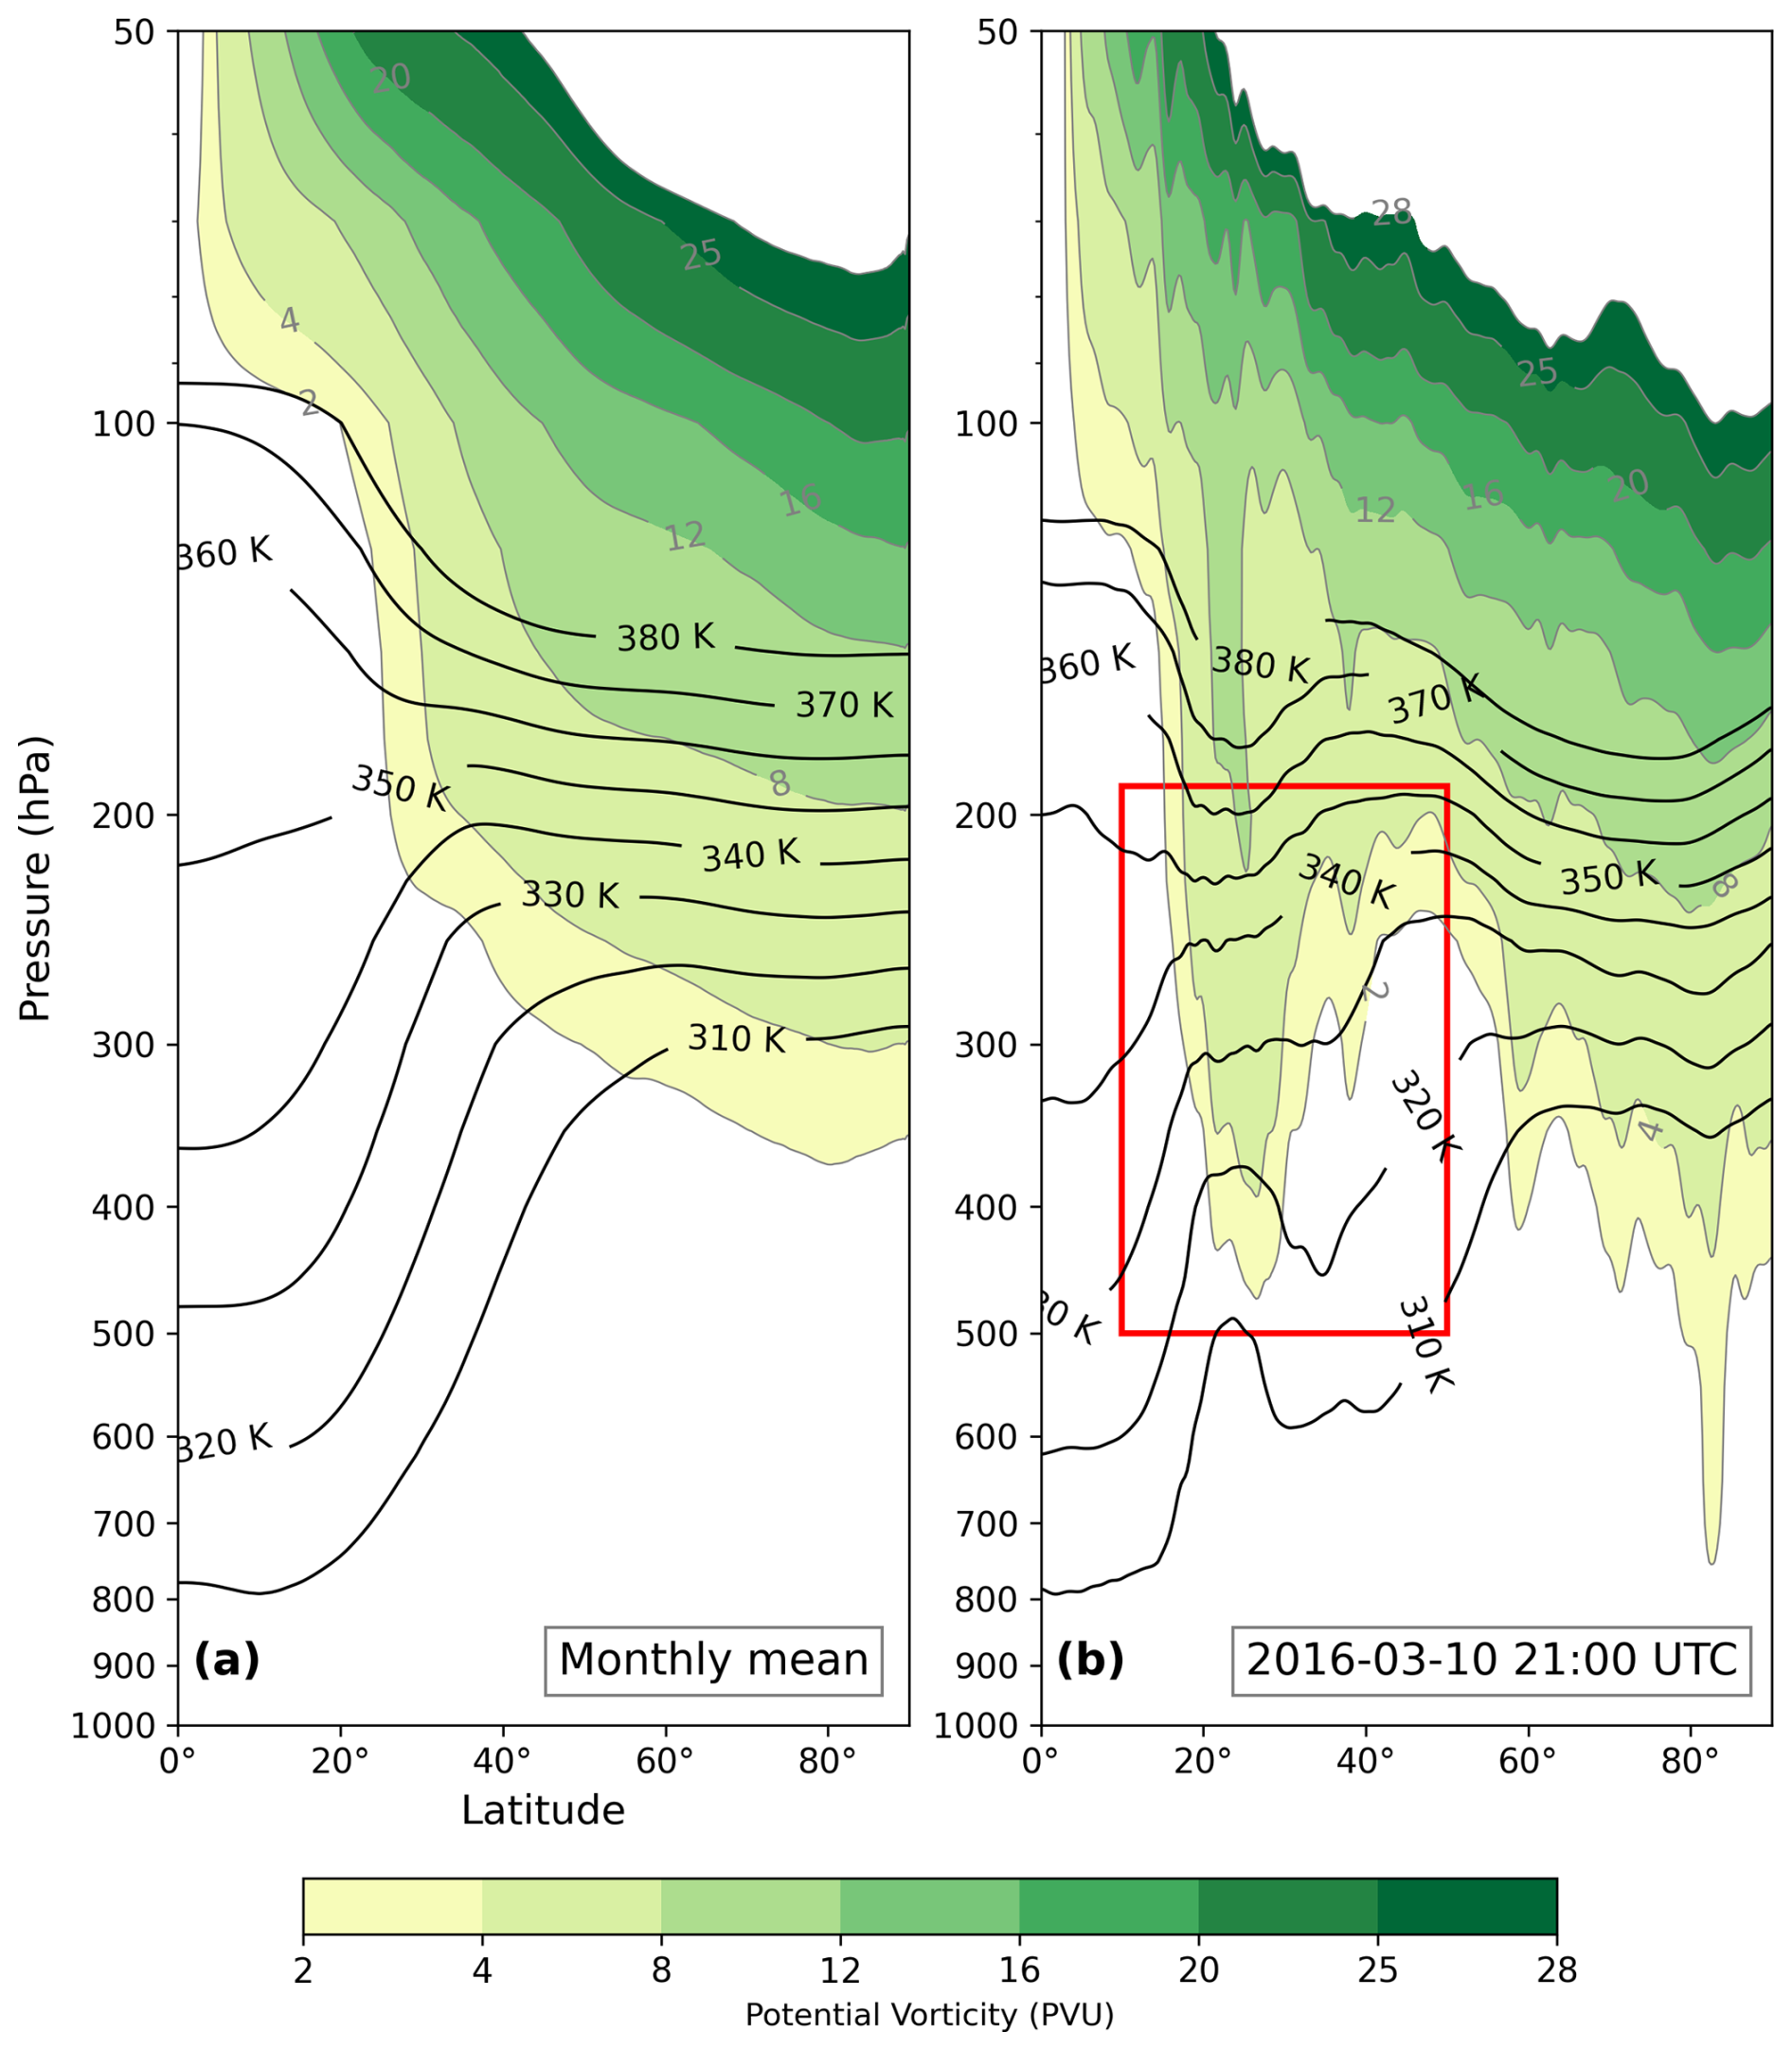
Figure 3Latitude–pressure cross-sections of potential temperature (black contours, K) and potential vorticity (color shading, PVU, 1 PVU = 1.0 × 10⁻⁶ K m2 kg−1 s−1) longitudinally averaged over 125 and 84° W from ERA5. (a) March 2016 monthly mean over Mexico. (b) 21:00 UTC 10 March 2016 over Mexico, showing a PV maximum over the extratropical region (∼ 20° N) and downward extension of PV values between 1 and 4 PVU below 300 hPa, indicative of tropopause folding and potential cross-tropopause exchange (red box highlights region of interest).
Amplification of the trough coincided with an equatorward displacement of the subtropical jet, where 300 hPa wind speeds exceeded 50 m s−1 (Fig. 4). This deformation of the upper-level flow facilitated meridional amplification and overturning of the isentropic PV contours. Figure 4 presents the horizontal structure and temporal evolution of this process on the 330 K surface from 9 to 11 March. The 2-6 PVU contours became increasingly distorted, forming a pronounced equatorward extension from the mid-latitude PV reservoir into central Mexico. This reversal of the meridional PV gradient and the overturning of contours indicate anticyclonic RWB (McIntyre and Palmer, 1983; Gabriel and Peters, 2008; Tyrlis and Hoskins, 2008).
During the subsequent evolution, the elongated PV formed a coherent PV streamer that extended equatorward to latitudes below 20° N. Objective diagnostics identified repeated overturning and multiple crossings of the dynamical-tropopause PV contour across several longitudes. This configuration persisted for nearly 3 d, from 9 to 11 March, indicating sustained deformation of the subtropical tropopause rather than a transient filamentary disturbance. Similar structures were observed between 320 and 350 K, demonstrating that the RWB event was identified across several adjacent isentropic surfaces. As the PV streamer evolved, a portion of the high-PV filament became isolated from the main stratospheric PV reservoir and developed into a PV cut-off over Mexico.
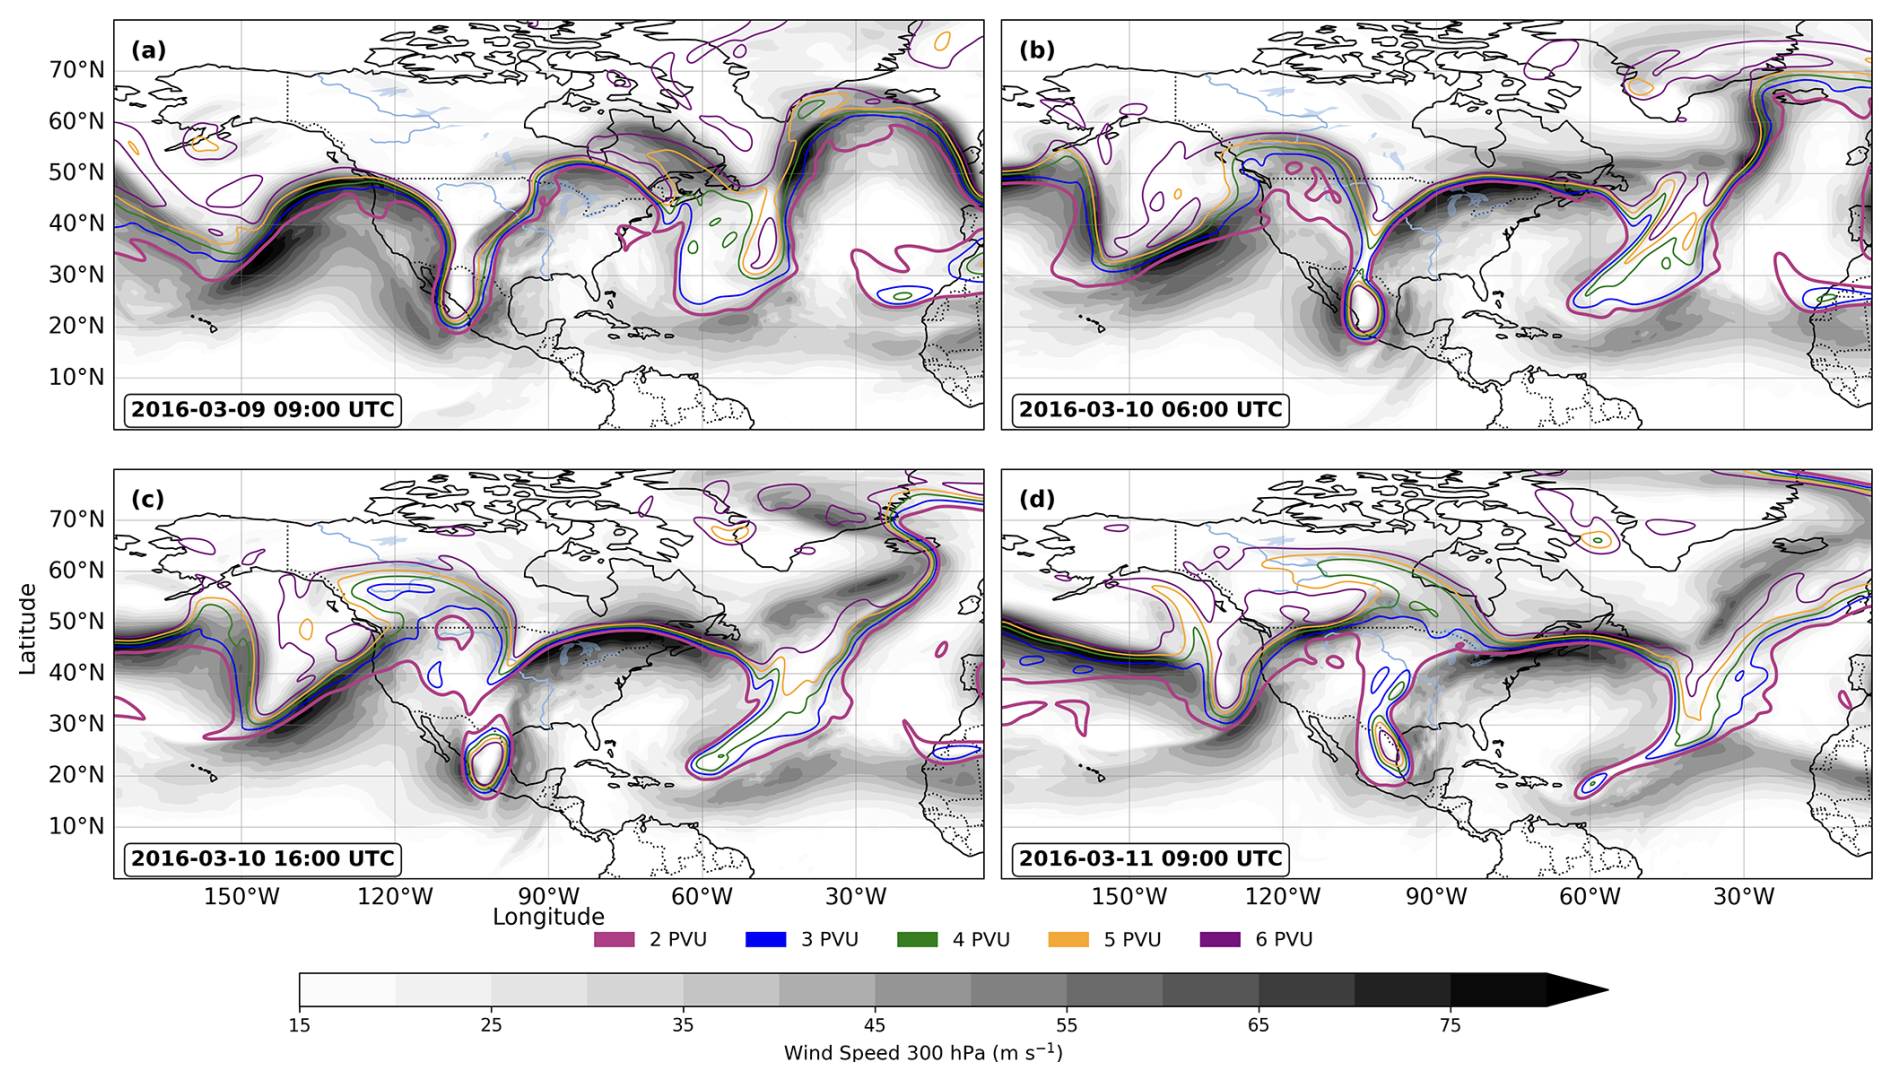
Figure 4PV contours (2–6 PVU) on the 330 K isentropic surface and shaded 300 hPa wind speed (m s−1) from ERA5 during 9–11 March 2016. Contours undergoing Rossby wave breaking overturn across North America, the Pacific Ocean, and the Atlantic Ocean. Overturning is defined where a PV contour intersects a meridian and spans at least 1000 km. Panels (a)–(d) show the temporal evolution of the event, including the formation of a cut-off low over Mexico associated with tropopause folding.
Figure 5 presents a distinct aspect of the disturbance by showing PV on the lower 320 K isentropic surface together with the 500 hPa circulation. The high-PV at 320 K was collocated with a closed cyclonic circulation at 500 hPa. This correspondence is dynamically consistent with the balanced cyclonic response anticipated from a positive upper-level PV anomaly according to the PV invertibility in Hoskins et al. (1985). The detection of the anomaly on 320 K, below the 330 K surface used to diagnose RWB morphology, indicates that the PV cut-off was not limited to a single upper-isentropic layer but constituted a deeper, vertically coherent disturbance with a pronounced mid-tropospheric signature.
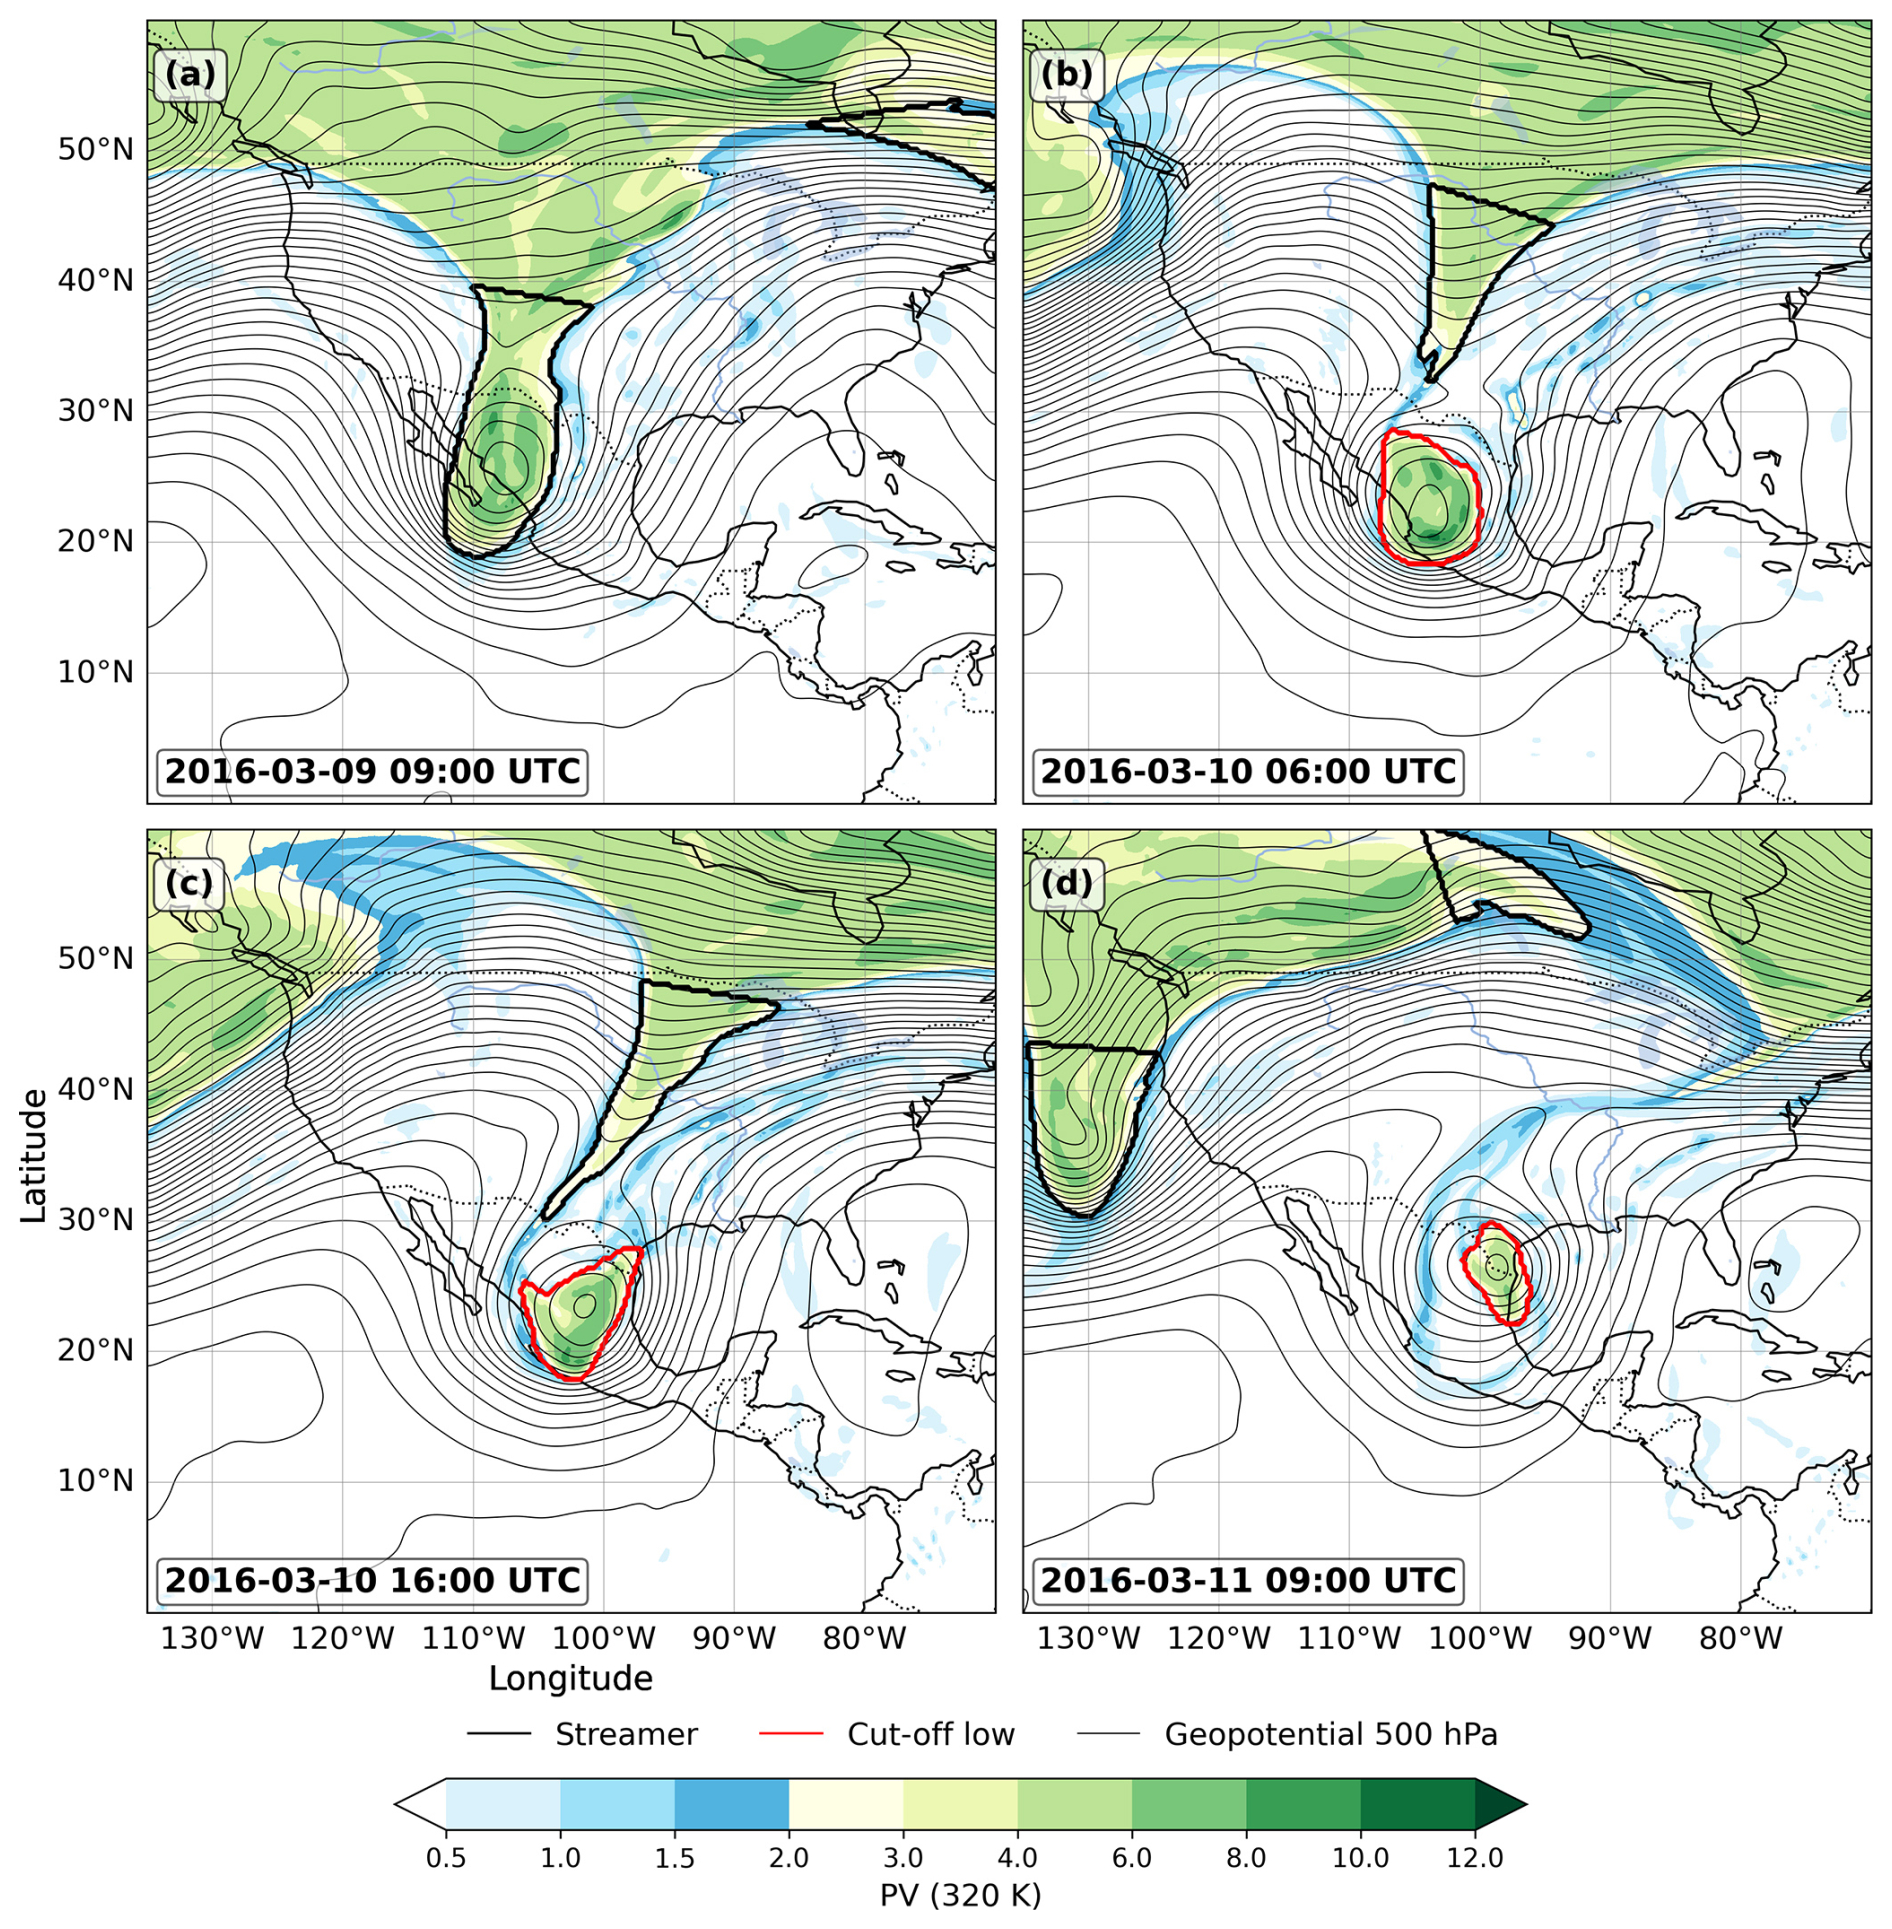
Figure 5Isentropic potential vorticity in (shading, PVU) on the 320 K surface overlaid with 500 hPa geopotential (thin contours at 50 intervals, m2 s−2) for (a) 09:00 UTC 9 March 2016, (b) 06:00 UTC 10 March 2016, (c) 16:00 UTC 10 March 2016 and (d) 09:00 UTC 11 March 2016. A PV streamer of high-PV air extends equatorwards over Mexico (thick black contour), indicating strong tropopause distortion. Portions of this PV streamer roll up into an isolated structure, forming a PV cut-off low collocated with a closed 500 hPa circulation (red contours). This configuration highlights the dynamical coupling between upper-level PV and mid-tropospheric cyclonic development, a key mechanism of STE for this case study.
3.3 Tropopause Fold Depth and Structure
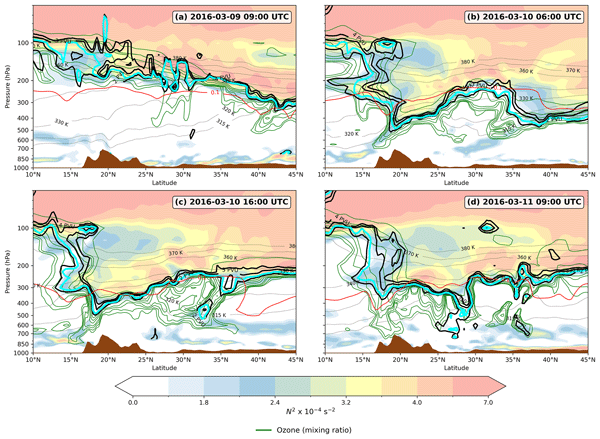
The dynamical tropopause is a line of constant PV that separates the highly stratified stratosphere from the weakly stratified troposphere (Morgan and Nielsen-Gammon, 1998). It is identified using PV thresholds ranging from 1 to 5 PVU. Between 9 and 11 March, analyses reveal the development of a well-defined tropopause fold associated with the upper-level trough. The 2 PVU surface descended to altitudes below 400 hPa, a clear indicator of downward penetration of stratospheric air (Fig. 3b). A vertical cross-section at 00:00 UTC 12 March 2016 shows sharp PV gradients and a folded structure of the tropopause extending over central Mexico and Mexico City (Fig. 6), persisting for ∼ 24 h prior to the onset of high O3 surface mixing ratios on 13 March 2016.
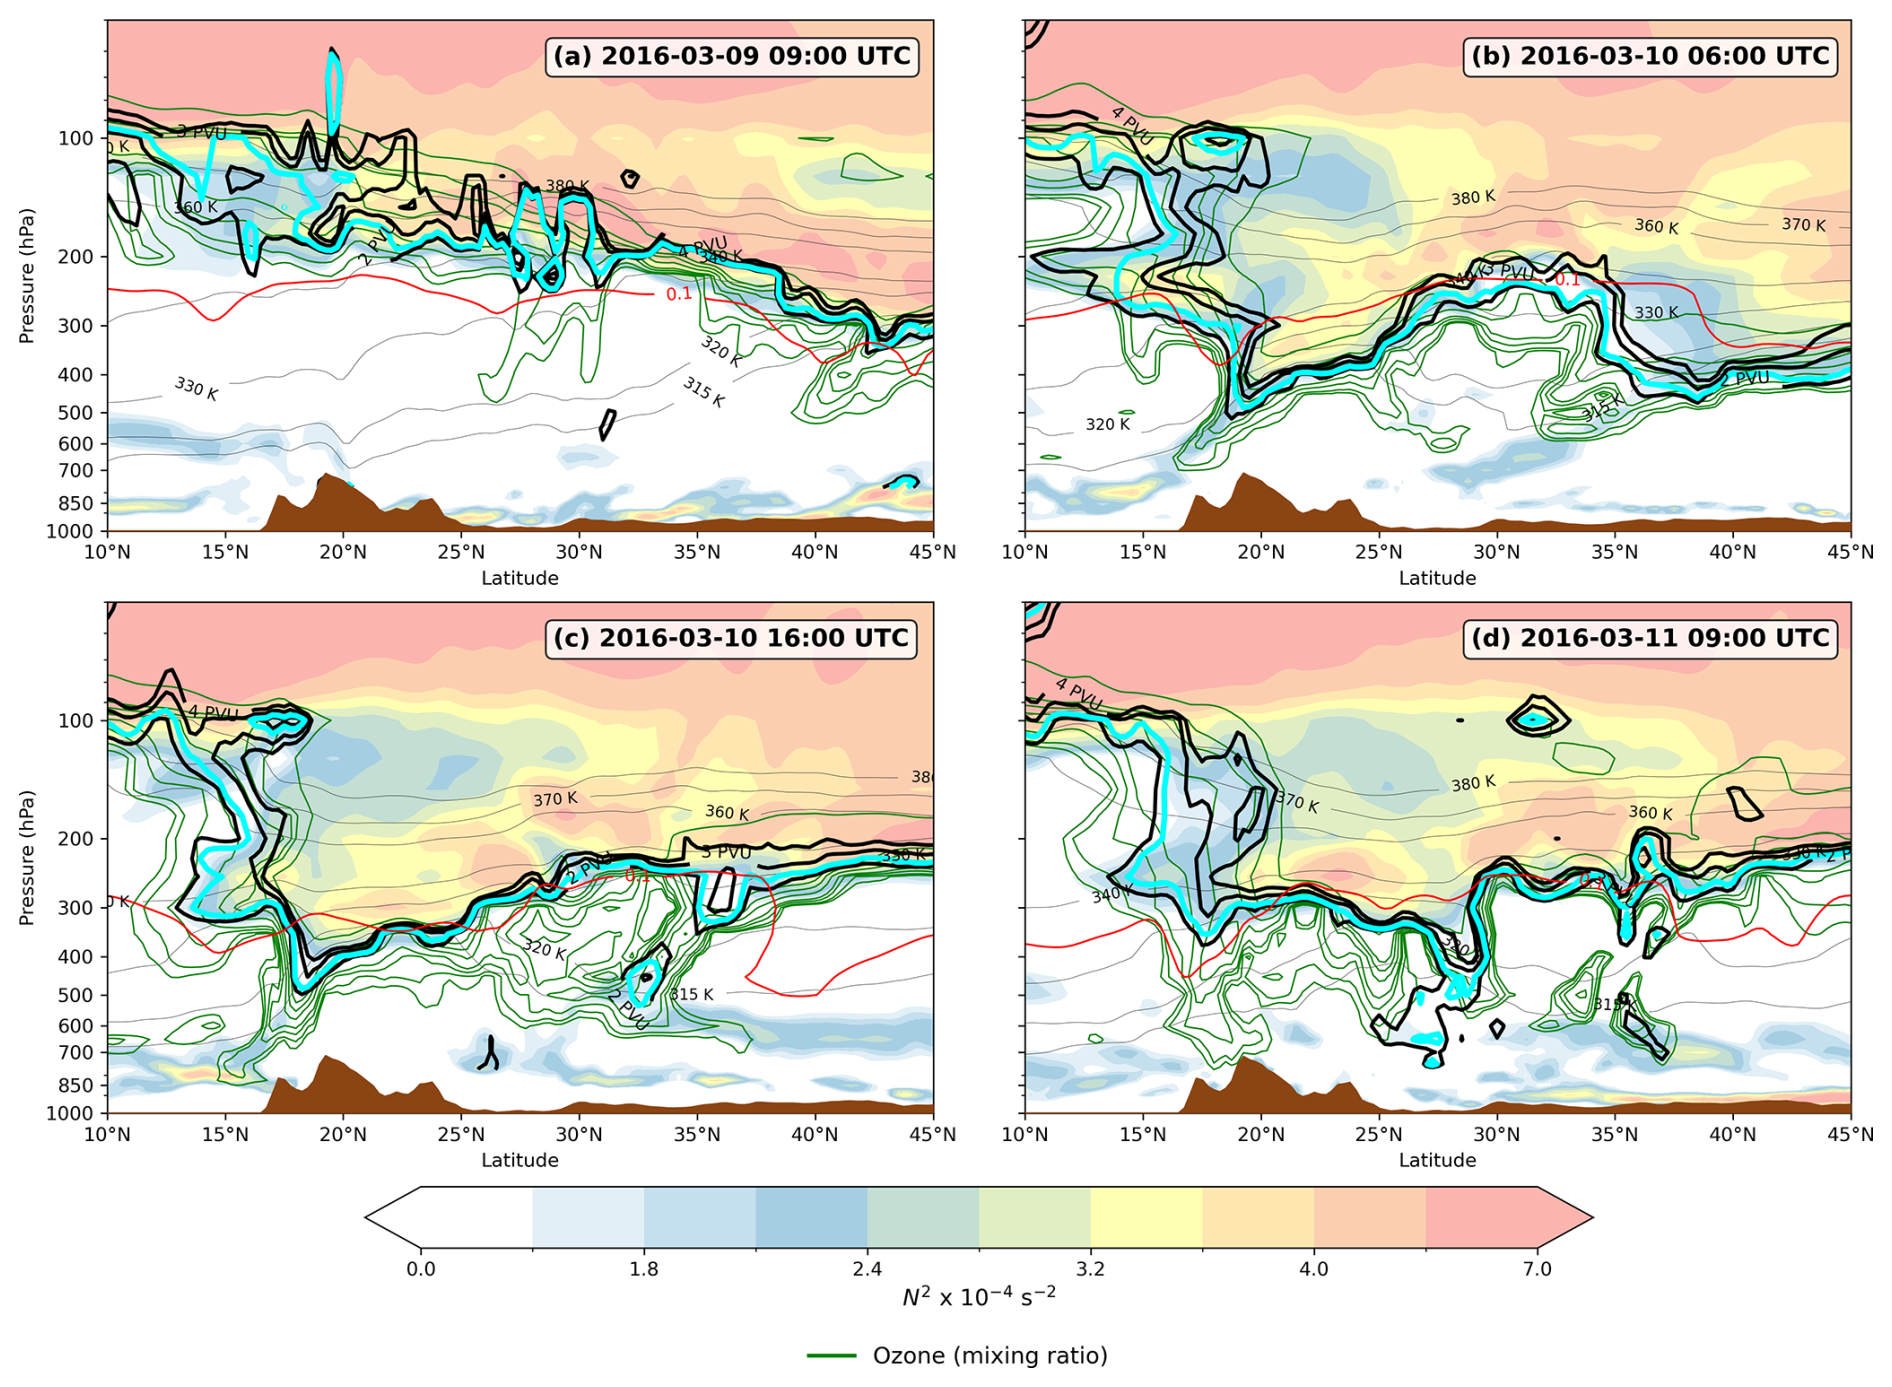
Figure 6Tropopause fold over Mexico from (a) 09:00 UTC 9 March, (b) 06:00 UTC 10 March, (c) 16:00 UTC 10 March, to (d) 09:00 UTC 11 March 2016. The dynamical tropopause is defined using PV (solid thick black contours, PVU), with the cyan solid line indicating 2 PVU, and the squared Brunt–Väisälä frequency (color shading, N2, × 10−4 s−2). The section was average over longitudes between 99.1 and 98.4° W and displays latitudes from 10 to 45° N. Tropopause folds extend from the upper to mid–lower troposphere, with high-PV stratospheric air descending into low-PV tropospheric air and locally reduced N2 within the intrusion. The solid red line indicates the specific humidity threshold (q = 0.1 g kg−1). Thin solid lines indicate the potential temperature (K).
Figure 6 presents the temporal evolution of the tropopause fold through four successive cross sections (9–11 March 2016), enabling direct comparison with the PV evolution shown in Fig. 4. The figure illustrates the dynamical structure of the fold, where a sharp PV gradient is collocated with a pronounced increase in the squared Brunt–Väisälä frequency (N2), which marks the tropopause. During the early stage (9 March; Fig. 6a), the fold remains shallow and is confined to the upper troposphere. Subsequent panels demonstrate progressive deepening and equatorward extension of high-PV air. The tropopause folding is characterized by high-PV air descending into low-PV air, locally reduced N2 within the intrusion (indicating weakened stability), and strong N2 above, consistent with a stratospheric intrusion extending into the mid- to lower troposphere below 400 hPa and near latitude ∼ 20° N. As the fold intensifies between 10 and 11 March (Fig. 6b–d), elevated O3 mixing ratios were subsequently observed beneath the locally depressed dynamical tropopause, which is consistent with the downward extension of ozone-rich stratospheric air. However, these Eulerian diagnostics indicate a stratospheric intrusion but do not, in isolation, demonstrate parcel-scale tropopause crossing. A specific humidity threshold of q = 0.1 g kg−1 is also applied to distinguish stratospheric air from diabatically generated high-PV values in the troposphere (solid red line in Fig. 6). The combined PV, N2, ozone, and humidity diagnostics identify the tropopause fold and the downward intrusion of air exhibiting stratospheric characteristics. Evidence for individual air parcels crossing the tropopause is assessed separately through trajectory analysis.
The tropopause fold developed on the central to southern flank of a low-pressure system along the westerly jet stream. The multi-panel evolution in Fig. 6 demonstrates that fold formation and deepening occurred concurrently with the development and maturation of the PV cut-off low, which provided a dynamical environment favorable for sustained tropopause deformation and potential stratospheric intrusion. Three regions of folding were identified: over the United States (∼ 40 and ∼ 30° N) and over Mexico (∼ 20° N), all associated with the PV cut-off low centered between 15 and 25° N (Fig. 6). The latitude–pressure structure clearly depicts a closed PV circulation in the mid- to upper troposphere by 10–11 March, confirming the presence of a fully developed PV cut-off low. These regions exhibit a horizontally extensive, statically stable layer in the mid-troposphere, marked by a vorticity maximum induced by the PV cut-off low, which favors displacement of the system toward lower latitudes. Amplification of the isentropic PV contours illustrates the Rossby wave amplification process and the associated tropopause folding. In these regions, an upper-level trough develops (Fig. 2), supported by the intrusion of highly stable, high-PV stratospheric air that strengthens cyclonic circulation aloft and extends downward to induce surface cyclonic motion. As the intrusion deepens, this process intensifies, consistent with the amplification patterns shown in Fig. 4. The concurrent downward displacement of the 1 PVU contour underscores the deepening of the tropopause fold and the extension of high-PV air towards the middle troposphere. While this deformation suggests conditions favorable for STE, it does not, by itself, demonstrate parcel transport across the tropopause. Between 10 and 12 March 2016, the intrusion intensified, resulting in a closed circulation throughout the troposphere (Fig. 4). A low-pressure system developed and subsequently strengthened at the surface, coinciding with the amplification of the trough in the middle and upper troposphere. The temporal alignment of the deepening PV, cut-off closure, and subsequent ozone enhancement supports the interpretation of a descending stratospheric intrusion, which became most pronounced after the PV cut-off low was fully established. Confirmation of parcel-scale STE, however, requires the additional trajectory evidence presented in the following section.
3.4 Transport Pathways
Isentropic analyses on the 320–340 K surfaces reveal pronounced equatorward advection of high-PV air from the mid-latitude into central Mexico, consistent with the tropopause fold and PV streamer described in Sect. 2.2.1. Backward trajectories computed with LAGRANTO using ERA5 input fields confirm this intrusion. Parcels arriving near 700 hPa over Mexico City between 11 and 13 March 2016 originated from stratospheric levels above 250 hPa within the fold region. The three-dimensional trajectories capture the filamentation of a streamer, the subsequent development of a PV cut-off low, and the persistence of the fold, which together provided an efficient dynamical pathway for the downward transport of stratospheric air. This mechanism enabled ozone-rich, high-PV air to penetrate the lower troposphere above Mexico City (Fig. 7). Although ERA5 ozone tracer fields indicate enhanced O3 mixing ratios (∼ 8 × 10⁻⁸ kg kg−1 at 700 hPa), the dominant signal was dynamical: a sustained Rossby wave breaking episode that facilitated STE at unusually low latitudes.
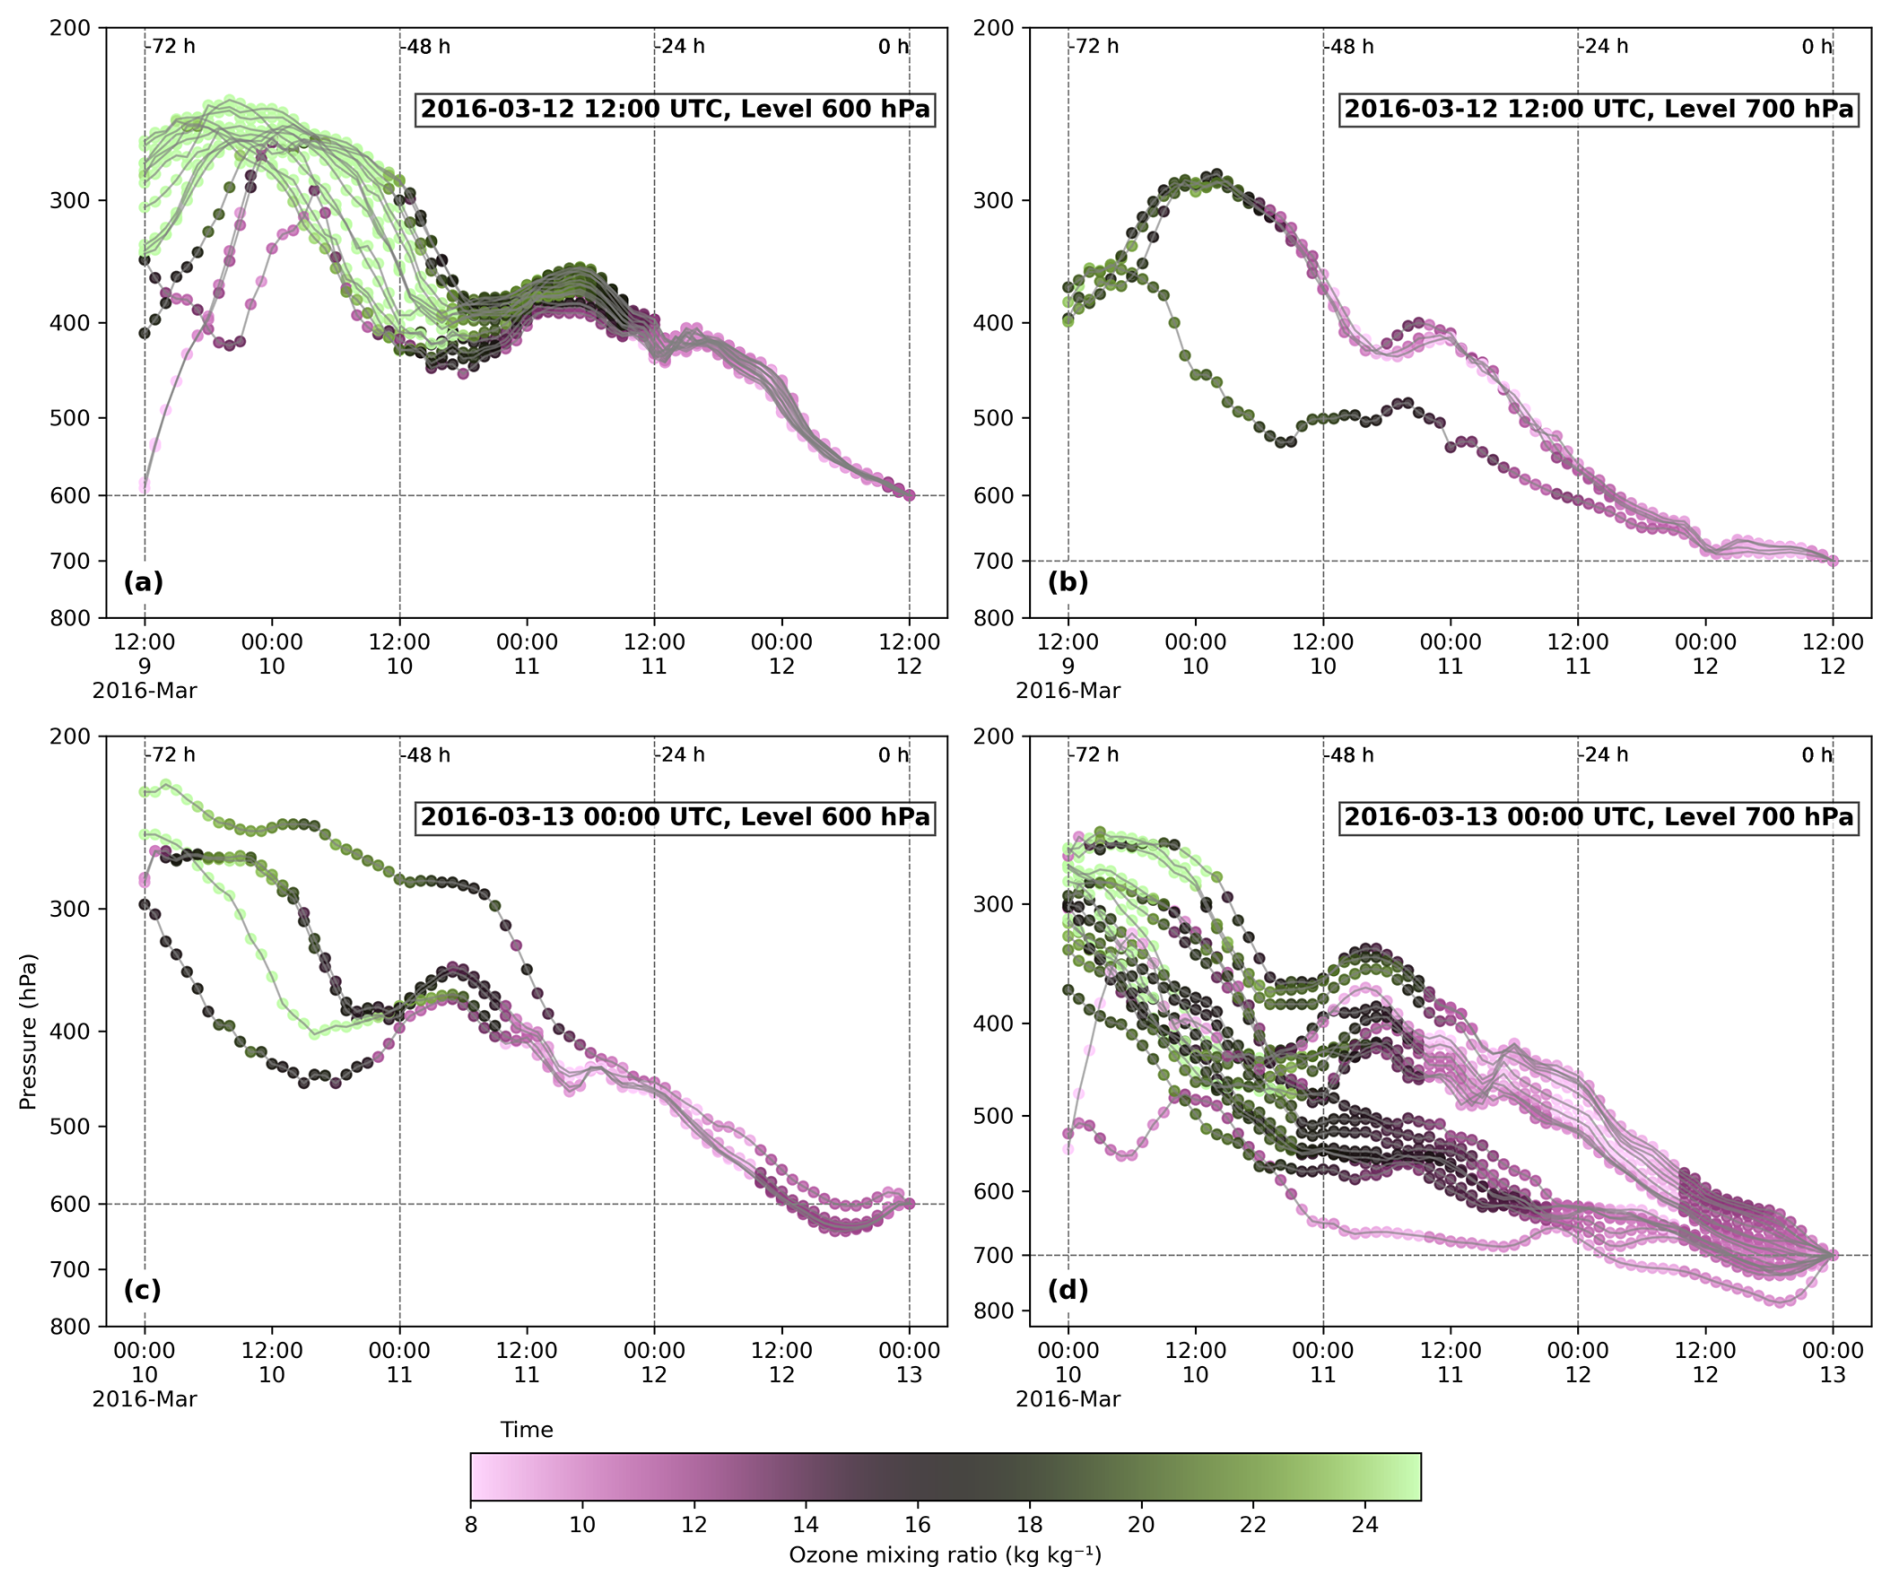
Figure 7Backward trajectories initialized over Mexico City and its Metropolitan Area during 12–13 March 2016, computed with LAGRANTO using ERA5 fields. Panels (a)–(b) show trajectories arriving at 600 and 700 hPa at 12:00 UTC 12 March, while panels (c)–(d) illustrate the evolution at 00:00 UTC 13 March at the same levels. O3 mixing ratios (× 10−8 kg kg−1) are shown as shading along the trajectories. Only trajectories with ΔP > 200 hPa and PV > 2 PVU at upper levels were retained. Most parcels originated in the stratosphere above 250 hPa within the tropopause fold region, confirming stratosphere-to-troposphere transport.
O3 mixing ratios were interpolated along each trajectory, and only those with pressure differences (ΔP) exceeding 200 hPa between the initial and final positions were retained to diagnose descent trajectories. Most trajectories were located near 600 hPa at 12:00 UTC 12 March (Fig. 7a), with only a few extending down to 700 hPa above Mexico City (Fig. 7b) (surface pressure reference for Mexico City: 760 hPa). These parcels carried elevated ozone tracer values from the upper stratosphere that decreased gradually towards the surface, in agreement with the PV distribution showing 1–2 PVU air below 550 hPa (Fig. S2). By 00:00 UTC 13 March, the maximum density of descending trajectories shifted downward from 600 to 700 hPa (Fig. 7c, d), coinciding with the observed peak in surface O3 mixing ratios in Mexico City (Fig. 1b).
Two distinct groups of trajectories can be distinguished at 700 hPa (Fig. 7d). The first group experienced a rapid vertical descent with a clear ΔP from 350 to 700 hPa within 48 h, but with relatively low PV values (∼ 1 PVU) near the surface (Fig. S2d), suggesting substantial dilution during transport, e.g., mixing with tropospheric air that reduces the original stratospheric PV. In contrast, the trajectories of the second group decreased more gradually during the first 48 h, with PV decreasing smoothly from approximately 2 PVU aloft to about 1 PVU at 700 hPa. This gradual pathway provided a more efficient channel for transporting ozone-rich air into the lower troposphere, consistent with the enhanced surface ozone levels observed during the event.
The spatial distribution of the trajectories links the descent over central Mexico directly to the large-scale Rossby wave breaking and PV cut-off low embedded in the extratropical circulation (Sect. 2.2.1). Parcels initially located in the stratosphere, with PV values exceeding 2 PVU, were traced back to the eastern Pacific and North America (Fig. S3), linking the fold to the Rossby wave breaking and the PV cut-off low embedded in the extratropical circulation. Their subsequent descent into the 300–700 hPa layer over central Mexico reflects the sloping geometry of the tropopause fold and the adiabatic descent forced by the cyclonic circulation on the anticyclonic flank of the breaking wave. Trajectories released between 500 and 600 hPa reveal the evolution of the PV cut-off low over Mexico (Fig. S3), highlighting the dynamic coupling between stratospheric PV anomalies aloft and the development of cyclonic features near the surface.
The corresponding vertical evolution of PV and ozone is shown in Fig. 8. Between 10 and 13 March, before the environmental contingency in Mexico City, the downward displacement of isentropes within the tropopause fold and associated subsidence facilitated the transport of ozone-rich air from the lowermost stratosphere into the troposphere over central Mexico. ERA5 O3 mixing ratios reached approximately 8 × 10⁻⁷ kg kg−1 between 150 and 400 hPa, spatially coinciding with elevated PV. The subsequent downward movement of ozone and PV anomalies provides consistent dynamical and ozone concentration evidence for the descent of stratospheric air into the middle and lower troposphere. Figure S4 also demonstrates that the regional ozone enhancement extended across densely populated and industrialized areas of central Mexico. This sequence of events establishes a plausible pathway through which STE could have contributed to the regional ozone enhancement. However, the magnitude of its contribution to observed surface exceedances cannot be determined from these diagnostics alone.
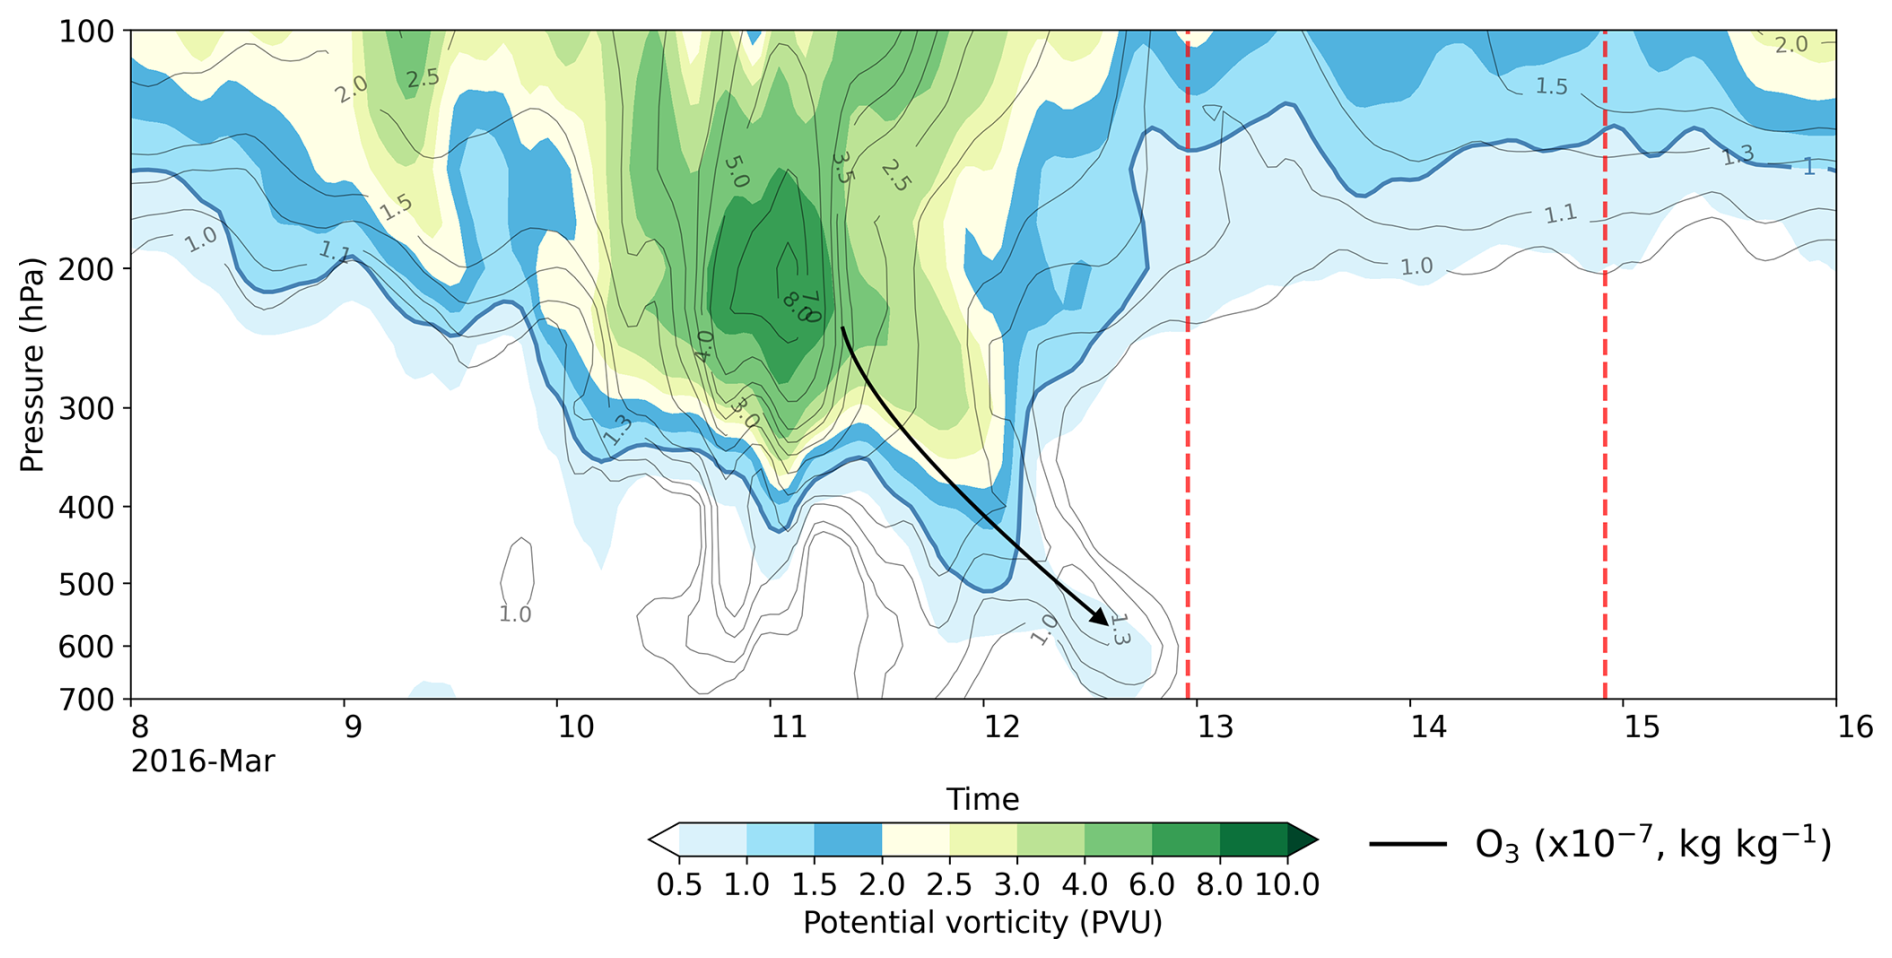
Figure 8STE over Mexico City, 8–16 March 2016. ERA5 ozone mixing ratio (× 10−7 kg kg−1) is shown in black contours and potential vorticity (PV) shown by shading. Ozone mixing ratio and potential vorticity were averaged over latitudes from 18.5 to 20° N and longitudes from 99.5 to 98.5° W. Tropopause folding linked to an upper-level baroclinic wave and jet stream drives the intrusion of stratospheric air into the troposphere between 10 and 12 March, prior to the environmental emergency (start and end days indicated by vertical red dotted lines). This event represents an unusually strong STE episode for the tropical latitude of Mexico City.
Satellite-derived products were utilized to supplement ozone tracer analysis and to investigate the evolution of total and tropospheric ozone columns during the tropopause fold and the associated STE event over Mexico (Fig. S5). EPIC total column ozone data indicate an enhancement across Mexico, whereas tropospheric ozone columns reveal an increase over eastern Mexico on 10–11 March 2016, coinciding with the development of the tropopause fold. In contrast, the tropospheric ozone signal over central Mexico is weaker, which aligns with the influence of high-elevation terrain and reduced satellite sensitivity in the upper troposphere–lower stratosphere. Although the daily averages reflect specific satellite scan times, the observed spatial patterns remain robust and are supported by independent OMPS-NPP L2 NM Ozone (O3) Total Column swath orbital V2 (Flynn et al., 2014; Jaross, 2017), which exhibit similar large-scale features.
3.5 Downward Transport Over Mexico City
Quasi-horizontal isentropic advection was quantified by interpolating ERA5 winds, PV, and ozone to isentropic surfaces. This approach provides a direct measure of the horizontal transport of PV anomalies along isentropic layers. In the context of the tropopause fold event described above, the analysis highlights regions where stratospheric air masses are irreversibly mixed into the troposphere. For simplicity, the analysis assumes one-way flux, although exchange can occur in both directions. Emphasis is placed on negative advection values, which correspond to the export of high-PV stratospheric air, indicating erosion of the tropopause and the downward transport of stratospheric signatures into the troposphere. The 2 PVU threshold was used to delineate the dynamical tropopause, and areas with PV > 2 PVU experiencing negative advection reveal the quasi-horizontal, transport of stratospheric parcels into the troposphere, consistent with the mechanism described by Dethof et al. (2000).
Figure 9 presents the temporal and isentropic distribution of ozone-rich air over Mexico City and its Metropolitan Area during 8–15 March 2016. The marker shape denotes the position of ozone-rich air relative to the dynamical tropopause: triangles indicate air on the stratospheric side, while stars indicate air on the tropospheric side. Marker color represents the O3 mixing ratio, and colored circles correspond to the associated PV values.
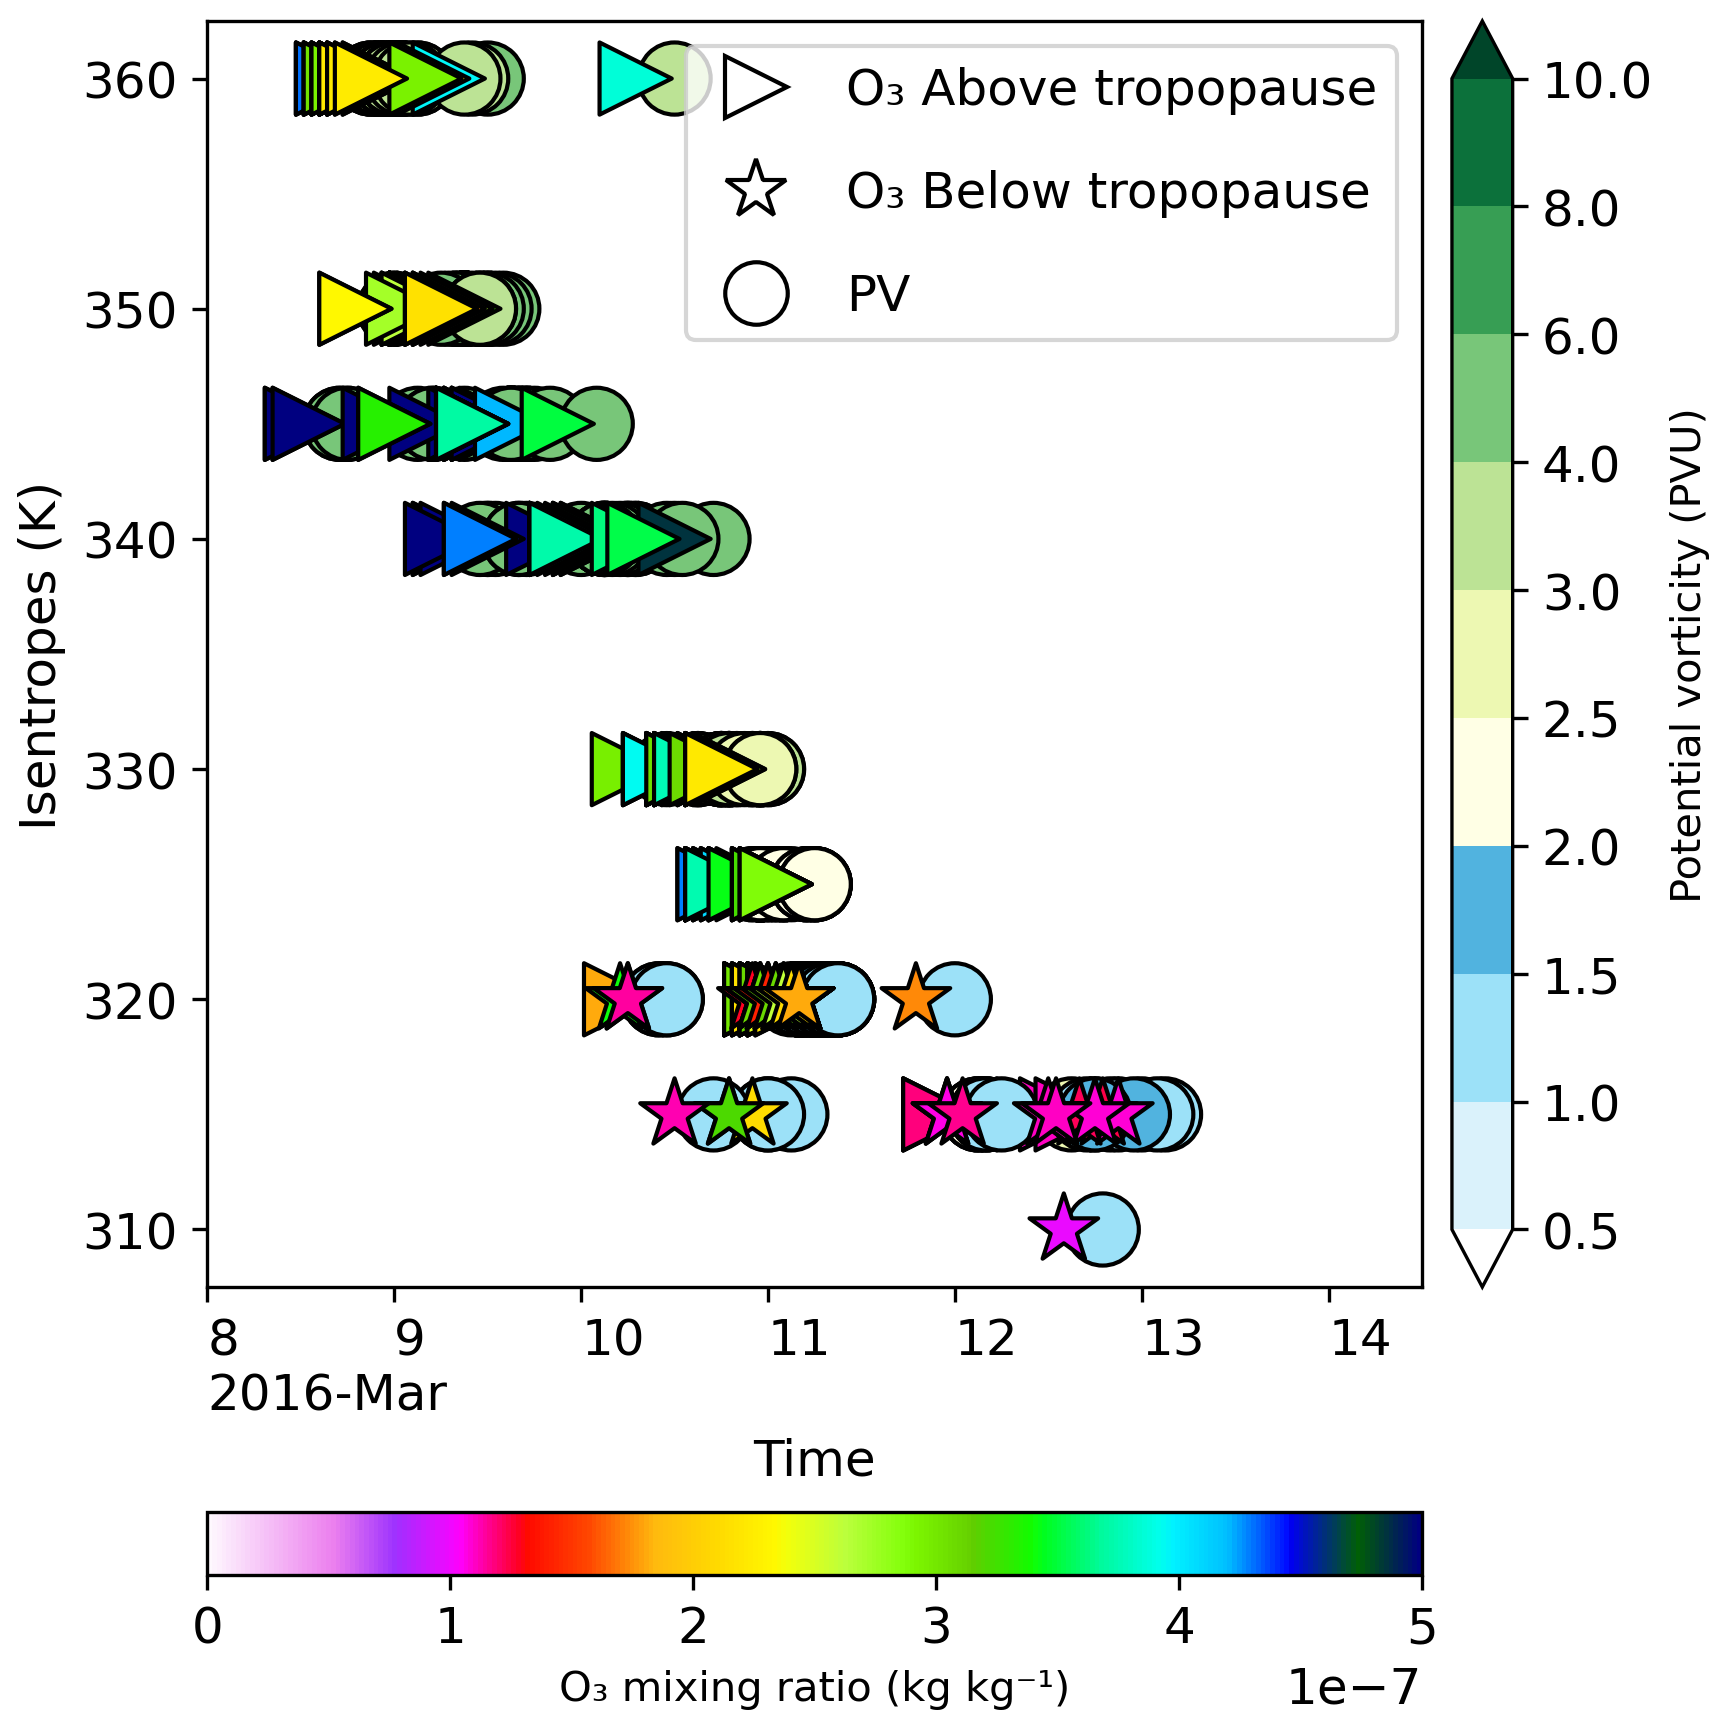
Figure 9Time–isentropic-level distribution of ozone-rich air detected over Mexico City and its Metropolitan Area during 8–15 March 2016. Triangles represent ozone-rich air on the stratospheric side of the 2 PVU dynamical tropopause, whereas stars represent ozone-rich air on its tropospheric side. Triangle and star colors indicate ERA5 O3 mixing ratio, and circles show the corresponding PV values. Values represent daily averages of the samples detected at each isentropic level between 310 and 360 K.
Between 8 and 10 March, ozone-rich air with elevated PV was primarily confined to the 340–360 K isentropic levels and remained predominantly above the dynamical tropopause. After 10 March, the signal progressively extended to lower isentropic levels, reaching approximately 325–330 K. Ozone-rich air was subsequently observed on the tropospheric side of the dynamical tropopause at approximately 315–320 K, particularly between 10 and 13 March. The lowest detected signal occurred near 10 K on 12–13 March. This temporal progression is consistent with the deepening stratospheric intrusion identified in the vertical-section and trajectory analyses, indicating that air with stratospheric characteristics reached progressively lower isentropic levels over central Mexico. Figure 9 thus provides supporting evidence for the timing and vertical extent of the intrusion, although it does not independently quantify its contribution to surface ozone exceedance.
3.6 Observed Tropopause Folds Preceding High-Ozone Events in Mexico City
To contextualize the 6–14 March 2016 event and explore the recurrence of the documented mechanisms, four additional cases were analyzed in which major high-ozone episodes in Mexico City were preceded by tropopause folding. These events (25 December 2015, 14 April 2007, 10 April 2019, and 22 February 2024) were identified using the same PV–ozone diagnostics as in the March 2016 case, combined with surface air-quality records indicating exceedance of Mexico City's ozone contingency thresholds.
Figure 10 summarizes the dynamical structure of these events. The 25 December 2015 event (Fig. 10a) featured a shallow intrusion, associated with enhanced PV and O3 mixing ratios in the upper troposphere, and coincided with a pronounced surface pollution episode. In contrast, the 14 April 2007 (Fig. 10b) and 10 April 2019 (Fig. 10c) events involved deeper, consecutive tropopause folds, with PV values exceeding 1–2 PVU extending downward toward the mid–lower troposphere. These structures closely resemble the March 2016 event in both fold depth and the co-location of high-PV air with elevated O3 mixing ratios above central Mexico.
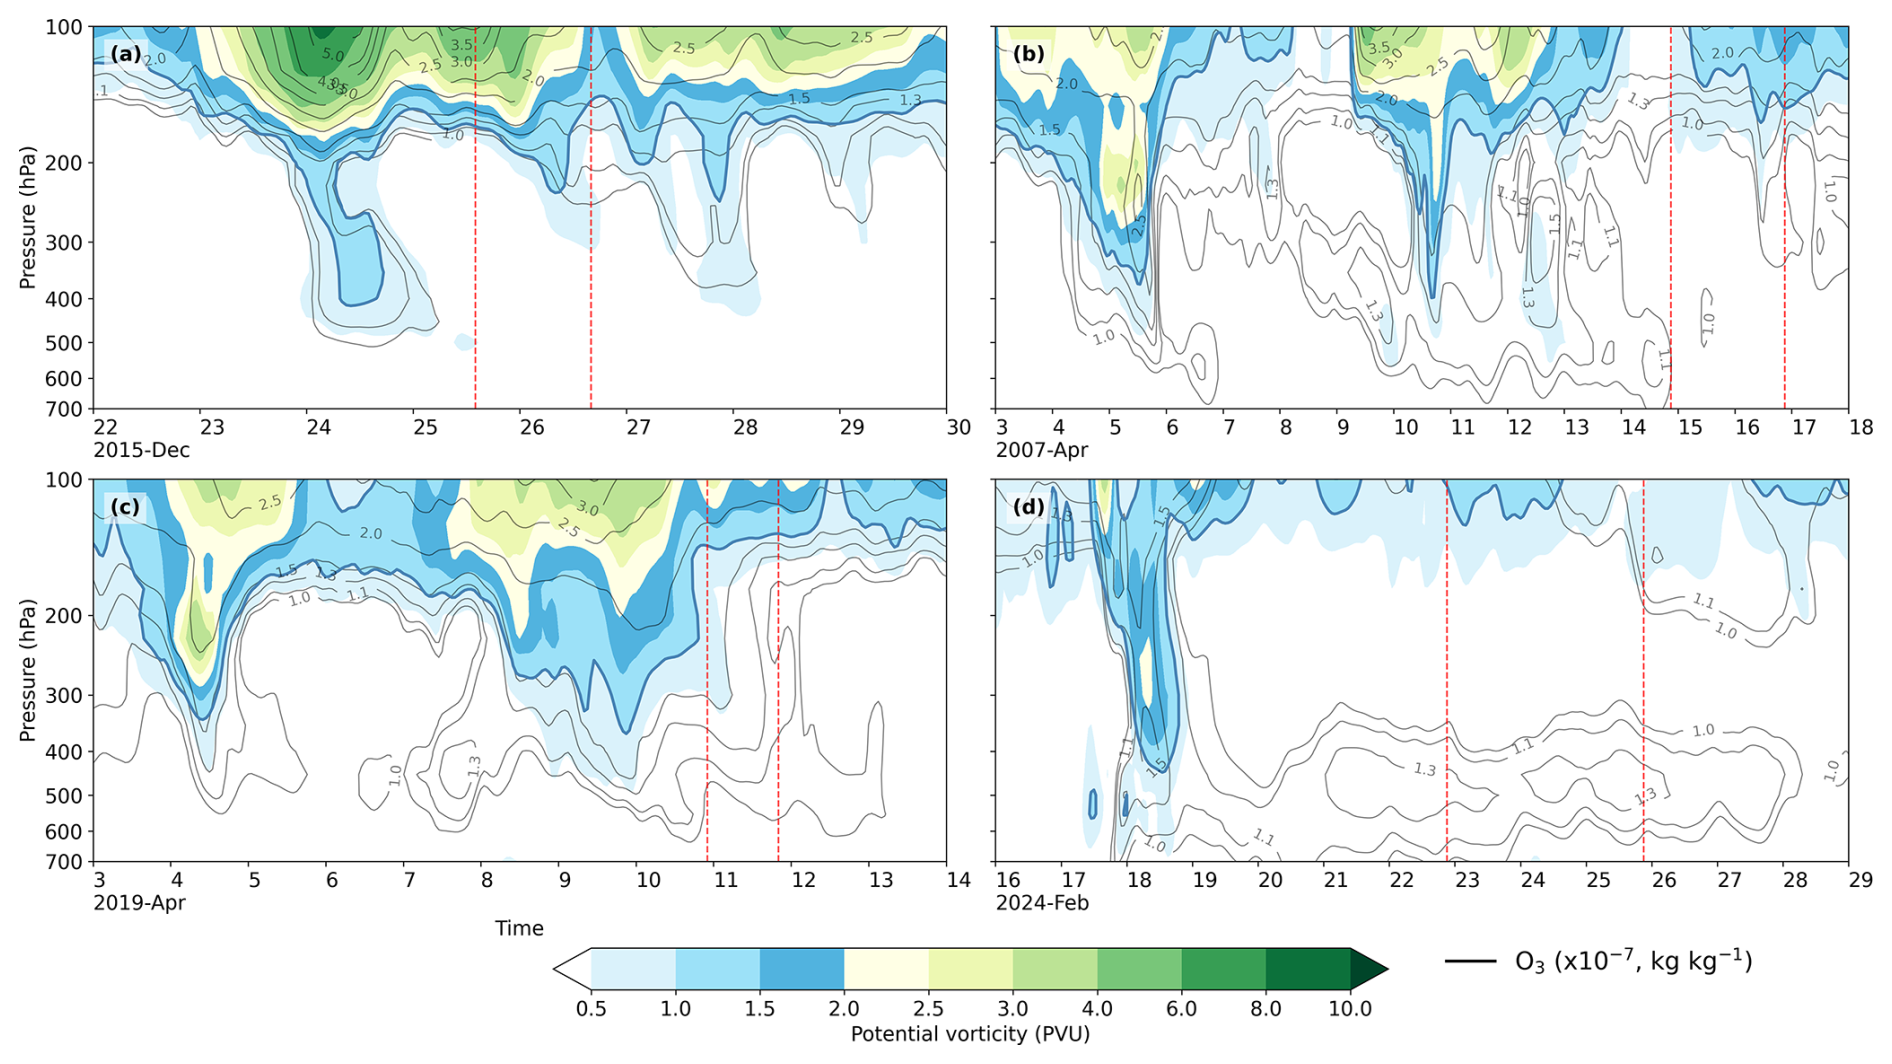
Figure 10Examples of tropopause fold events over central Mexico associated with major air quality episodes. (a) shallow intrusion on 25 December 2015, ERA5 potential vorticity (PV) and ozone mixing ratio (× 10−7 kg kg−1), (b) consecutive deep intrusions on 14 April 2007 and (c) 10 April 2019, and (d) 22 February 2024 event. These cases illustrate how both shallow and deep folds can act as effective pathways for stratospheric ozone, enhancing surface O3 mixing ratios and contributing to extreme pollution episodes. Start and end days indicated by vertical red dotted lines).
The 22 February 2024 event (Fig. 10d) also exhibited a deep tropopause fold, with elevated O3 mixing ratios between 700 and 600 hPa. This pattern indicates that stratospheric air reached altitudes near the planetary boundary layer over Mexico City. In all four cases, the folds occurred within a few days prior to major surface ozone enhancements over the Mexico Megacity. This timing is consistent with the dynamical pathway documented for March 2016: Rossby wave amplification and PV cut-off development, tropopause folding, and subsequent downward transport of ozone-rich, high-PV air.
Although these additional events are not examined in the same detail as the March 2016 case, they provide supporting evidence that both shallow and deep tropopause folds serve as effective pathways for stratospheric ozone to influence near-surface O3 mixing ratios over central Mexico. This finding suggests that STE associated with wintertime and early-spring baroclinic activity may systematically modulate extreme ozone episodes in the region. A more comprehensive climatological assessment of the frequency, intensity, and mechanisms of such events is beyond the scope of this study, but is clearly warranted for future research.
The March 2016 event over central Mexico was characterized by an unusually deep episode of STE, in which stratospheric air descended into the mid- and lower troposphere and reached near-surface levels over Mexico City by 13–14 March, resulting in surface O3 mixing ratios reaching up to 210 ppb. Dynamical analyses in Sect. 2.2.1 demonstrate that Rossby wave breaking, a persistent tropopause fold, and associated isentropic transport pathways facilitated this descent. The following section examines the implications of this atmospheric configuration for surface ozone exceedances and regional air quality.
While a precise quantification of the stratospheric contribution is not possible given the use of reanalysis data, an ERA5 ozone mixing ratio enhancement of approximately 8 × 10⁻⁸ kg kg−1 was observed near the surface of Mexico City (750–700 hPa). This enhancement resulted in elevated background ozone levels, providing conditions favorable for the subsequent ozone exceedance event. The stratospheric input should therefore be viewed as an additional source that enhanced pre-existing anthropogenic background O3 mixing ratios, the STE increased pre-existing background ozone, rather than as the dominant mechanism of the episode. The timing of the event is also notable. The intrusion reached the lower troposphere roughly one day before the environmental contingency began, suggesting a lag between the dynamical descent of ozone-rich air and the peak surface O3 mixing ratios. This suggests that the stratospheric signature likely preconditioned the lower troposphere, which was then exacerbated by local photochemical ozone creation, resulting in the observed exceedances.
The dynamical evolution of the event involved PV streamer development, PV cut-off low formation, and slow-evolving baroclinic disturbances, consistent with known midlatitude-tropical interactions that facilitate stratospheric intrusions (Appenzeller and Davies, 1992; Wernli and Sprenger, 2007). Unlike more transient STE events, the persistence of the fold and its structured isentropic pathways not only favored unusually deep descent into the lower troposphere over Mexico City, enhanced by its high altitude (∼ 2300 m above mean sea level) and the southward position of the boreal winter subtropical jet, but also enabled long-range meridional and zonal transport of ozone-rich air. These quasi-horizontal pathways connected mid-latitude source regions with multiple destinations in central and northern Mexico, demonstrating how RWB can act as an effective pathway for trace gases and synchronize pollution events across distant Metropolitan Areas.
Local emissions and meteorological conditions contribute to tropospheric O3 mixing ratios, while long-range stratospheric transport adds to the already high anthropogenic background. This finding is consistent with previous studies documenting STE-related tropospheric ozone enhancements in North America and Europe (Lin et al., 2015; Trickl et al., 2020, 2023) although relatively few cases have been examined over Mexico (Barrett et al., 2019). Importantly, the STE influence extended beyond Mexico City, with elevated O3 mixing ratios also detected in Guadalajara, Monterrey, San Luis Potosí, and Torreón (Fig. S4). Such regional-scale transport compounded the effects of local emissions, as regional ozone enhancements and exceedances coincided with the large-scale intrusion, turning the dynamical event into a broader national-scale air-quality hazard.
Comparable stratospheric intrusions over complex terrain in subtropical South America have been shown to increase both surface and tropospheric-column ozone concentrations (Rondanelli et al., 2002; Seguel et al., 2018). The March 2016 event demonstrates that STE contributed to elevated regional ozone background and increased the probability of exceedances in Mexico City. However, the influence of local emissions complicates exclusive attribution to STE, and further research is necessary to distinguish between stratospheric and local sources.
While the present study does not directly quantify the influence of topography, the geographical context of the affected sites indicates that terrain and elevation likely modulate the surface manifestation of stratospheric intrusions. Mexico City and Monterrey, both situated in elevated basins, may be more prone to stratospheric air reaching the surface during deep tropopause fold events. In contrast, regions at lower elevations are likely to experience less pronounced near-surface impacts from comparable intrusions. Interactions between complex terrain and stratospheric intrusion dynamics have been documented in regions such as the Tibetan Plateau and other mid-latitude mountainous areas (Chen et al., 2016; Lüthi et al., 2015; Škerlak et al., 2019). Comparable STE-related ozone enhancements have been reported in North America and Europe (Škerlak et al., 2019), relatively few studies have examined these processes in tropical regions, where meteorological conditions are episodically influenced by extratropical cyclones. Comparisons with the Mediterranean basin and East Asia indicate that the combination of complex orography and subtropical jet dynamics can facilitate deep intrusions reaching lower tropospheric levels. In Mexico, the elevated basins of central and northern cities appear particularly susceptible, highlighting the broader subtropical relevance of this case and underscoring the need for targeted analyses that explicitly address the influence of orography and altitude on STE, especially during boreal winter and spring when upper-level dynamics interact with complex terrain.
From a forecasting perspective, synoptic-scale precursors offer a potential basis for an early warning. Rossby wave amplification, PV streamer formation, PV cut-off low development, and depression of the dynamical tropopause are large-scale phenomena that may be identified in numerical weather prediction output several days before the associated stratospheric intrusion arrives in central Mexico. Operational monitoring should therefore track the evolution of PV on isentropic surfaces, the pressure or altitude of the 1.5–2 PVU dynamical tropopause, upper-level humidity and ozone distributions, and forecast trajectories directed toward elevated urban basins.
An early warning system could be considered. An initial regional-risk outlook could be considered when successive medium-range forecasts consistently indicate RWB, PV cut-off low formation, and an equatorward intrusion of high-PV air. This outlook can be refined within approximately 24 to 48 h using forecasts of intrusion depth, air-parcel trajectories, boundary-layer evolution, surface meteorology, and atmospheric composition. In the March 2016 event, ozone-rich air reached the lower troposphere about one day before the environmental contingency was declared. Early recognition of the descending intrusion could have provided short-term warning of an increased risk of surface ozone exceedance.
However, predictability of the synoptic-scale STE configuration does not imply equivalent predictability of the timing or magnitude of surface ozone exceedance. The surface response is also influenced by cross-tropopause mixing, the depth and persistence of the intrusion, terrain-flow interactions, boundary-layer dynamics, precursor emissions, and local photochemical production. Consequently, STE diagnostics should be considered as probabilistic indicators that adjust the background risk of exceedance, rather than as deterministic predictors of surface ozone concentrations.
The operational relevance of this monitoring system cannot be determined from a single event. Additional case studies spanning different years, intrusion pathways, synoptic configurations, and pollution environments are necessary to assess whether the March 2016 evolution is representative of STE events affecting central Mexico. More importantly, a systematic multi-event climatology is required to quantify the frequency, intensity, duration, seasonality, vertical penetration, and regional extent of these intrusions, as well as their relationships to surface ozone enhancements and exceedance. Since the present study relies on reanalysis rather than retrospective operational forecasts, the proposed warning times should be considered indicative. Hindcast experiments conducted across such an event catalogue are needed to evaluate achievable lead times, detection and false-alarm rates, and the sensitivity of forecast performance to intrusion strength, boundary-layer conditions, and local photochemical activity.
This study provides a detailed dynamical analysis of a stratosphere–troposphere exchange (STE) event over central Mexico during 6–14 March 2016, coinciding with a severe ozone pollution episode in Mexico City. Using ERA5 reanalysis, PV and ozone tracer diagnostics, Lagrangian trajectories, and isentropic analysis, we show that this event was driven by anticyclonic Rossby wave breaking and a persistent tropopause fold, facilitating the transport of stratospheric air into near-surface layers over central Mexico. The key findings are listed below:
-
The amplification of Rossby waves toward the equator and the subsequent formation of a PV streamer contributed to the development of a PV cut-off low over Mexico. This process created coherent isentropic transport pathways that allowed ozone-rich air from the stratosphere to efficiently descend into the lower troposphere. The intrusion of this stratospheric air reached the lower troposphere about one day before the environmental contingency began, highlighting a temporal lag between the dynamical descent of stratospheric air into the lower troposphere and the peak of surface O3 mixing ratios, consistent with STE acting as a dynamical preconditioning mechanism rather than the direct sole driver of surface ozone exceedances.
-
Persistence and depth of the tropopause fold were unusual compared to previous STE events, allowing stratospheric air to reach the lower troposphere over Mexico City, unlike shallower or more transient intrusions reported in earlier studies (e.g., Barrett et al., 2019).
-
Dynamical coupling between PV anomalies and mid-tropospheric cyclonic circulation amplified the intrusion and sustained downward transport over multiple days, demonstrating a strong link between large-scale Rossby wave dynamics and regional air quality impacts.
Elevated ozone mixing ratios were observed not only over Mexico City but also in urban centers, such as Guadalajara, Monterrey, San Luis Potosí, and Torreón, showing that STE events can modulate regional air quality by elevating background ozone levels, thereby increasing the sensitivity of surface ozone to local photochemical production. Intrusion depth was strongly influenced by topography and altitude, with elevated basins like Mexico City and Monterrey more prone to near-surface stratospheric air, while lower-altitude regions were less affected. While this study does not explicitly quantify topography effects, comparisons with other subtropical regions, including the Mediterranean and East Asia, indicate that subtropical jet dynamics combined with complex orography facilitate deep intrusions, highlighting the vulnerability of central Mexican urban centers.
Limitations of this study include reliance on ERA5 reanalysis, which may underestimate the sharpness of small-scale folds and mixing layers, and the lack of direct in situ ozone measurements aloft during the event. In particular, we do not quantify the relative contributions of stratospheric ozone versus in situ photochemical ozone production at the surface; therefore, the observed exceedance cannot be attributed to STE alone. Future work should combine high-resolution chemistry-atmospheric simulations with targeted observational campaigns to quantify stratospheric contributions and better understand the dynamical–chemical mechanisms driving regional ozone exceedance.
The large-scale dynamical precursors examined here may provide useful advance indicators of winter and early-spring periods when background ozone is likely to be elevated over central Mexico. These indicators could support the identification of increased regional ozone-exceedance risk several days in advance, with the initial outlook subsequently refined using short-range meteorological and chemical forecasts. However, because the present study examines a single event using reanalysis, dedicated multi-event hindcast experiments are required to quantify the achievable lead time and forecast skill for surface ozone exceedance.
Overall, the March 2016 case exemplifies how synoptic-scale Rossby wave dynamics and tropopause folding can influence background ozone conditions relevant to surface air quality in tropical and subtropical urban centers. Recognizing these links is essential for attributing past pollution episodes, improving operational forecasts, and informing mitigation strategies. Beyond documenting a single event, this study advances the understanding of STE by demonstrating that the persistence, depth, and geometry of isentropic transport pathways, rather than tropopause folding alone, determine whether stratospheric intrusions become environmentally significant in tropical and subtropical regions. High-resolution chemistry–climate simulations, combined with real-time monitoring of STE precursors, would improve the quantification of stratospheric contributions to surface ozone, providing actionable insights for environmental management and public health preparedness by treating STE as a large-scale dynamical modifier of background chemical conditions rather than as a primary surface ozone source.
Lagrangian trajectories were computed using the LAGRANTO tool (Sprenger and Wernli, 2015), which is available upon request from the developers. The WaveBreaking detection package (Kaderli, 2023) is accessible at https://doi.org/10.5281/zenodo.14214463.
ERA5 reanalysis data (Hersbach et al., 2020) are publicly available from the Copernicus Climate Data Store https://cds.climate.copernicus.eu (last access: 10 November 2025). Tropospheric ozone data from the Earth Polychromatic Imaging Camera (EPIC) aboard the Deep Space Climate Observatory (DSCOVR) (Kramarova et al., 2021; Marshak et al., 2018) and Ozone Mapping and Profiler Suite (OMPS) data from the Suomi National Polar-Orbiting Partnership (Suomi NPP) L2 NM Ozone (O3) Total Column swath orbital V2 (Flynn et al., 2014; Jaross, 2017) are both available through NASA's Earthdata portal https://earthdata.nasa.gov (last access: 20 September 2025).
Animation 1 presents wind streamlines on the 315, 330, and 340 K potential-temperature surfaces, demonstrating quasi-conservative transport along isentropic surfaces. The red solid line indicates the 2-PVU dynamical tropopause. The animation covers the period from 00:00 UTC on 6 March to 00:00 UTC on 14 March 2016 at hourly intervals, covering the domain 0–65° N and 135–70° W (https://doi.org/10.5446/74035, Lopez-Bravo, 2026).
The supplement related to this article is available online at https://doi.org/10.5194/wcd-7-1995-2026-supplement.
CLB and EC conceived the study; CLB analyzed data and wrote the manuscript draft; CLB, EC, and AFD reviewed and edited the manuscript.
The contact author has declared that none of the authors has any competing interests.
Publisher's note: Copernicus Publications remains neutral with regard to jurisdictional claims made in the text, published maps, institutional affiliations, or any other geographical representation in this paper. The authors bear the ultimate responsibility for providing appropriate place names. Views expressed in the text are those of the authors and do not necessarily reflect the views of the publisher.
Clemente Lopez-Bravo's position is supported by the ARC Centre of Excellence for Climate Extremes CE170100023. We also want to thank Michael Sprenger for his valuable feedback. The authors thank the three anonymous reviewers for their constructive comments, which helped improve the manuscript.
This research has been supported by the Climate Extremes (grant no. CE170100023).
This paper was edited by Roberto Rondanelli and reviewed by three anonymous referees.
Appenzeller, C. and Davies, H. C.: Structure of Stratospheric Intrusions into the Troposphere, Nature, 358, 570–572, https://doi.org/10.1038/358570a0, 1992. a
Barnes, E. A. and Hartmann, D. L.: Detection of Rossby Wave Breaking and Its Response to Shifts of the Midlatitude Jet with Climate Change, J. Geophys. Res.-Atmos., 117, D09117, https://doi.org/10.1029/2012JD017469, 2012. a
Barrett, B. S., Raga, G. B., Retama, A., and Leonard, C.: A Multiscale Analysis of the Tropospheric and Stratospheric Mechanisms Leading to the March 2016 Extreme Surface Ozone Event in Mexico City, J. Geophys. Res.-Atmos., 124, 4782–4799, https://doi.org/10.1029/2018JD029918, 2019. a, b, c, d
Bates, K. H. and Jacob, D. J.: An Expanded Definition of the Odd Oxygen Family for Tropospheric Ozone Budgets: Implications for Ozone Lifetime and Stratospheric Influence, Geophys. Res. Lett., 47, e2019GL084486, https://doi.org/10.1029/2019GL084486, 2020. a
Binder, H. and Wernli, H.: Frequency anomalies and characteristics of extratropical cyclones during extremely wet, dry, windy, and calm seasons in the extratropics, Weather Clim. Dynam., 6, 151–170, https://doi.org/10.5194/wcd-6-151-2025, 2025. a
Boothe, A. C. and Homeyer, C. R.: Global large-scale stratosphere–troposphere exchange in modern reanalyses, Atmos. Chem. Phys., 17, 5537–5559, https://doi.org/10.5194/acp-17-5537-2017, 2017. a
Chen, X., Škerlak, B., Rotach, M. W., Añel, J. A., Su, Z., Ma, Y., and Li, M.: Reasons for the Extremely High-Ranging Planetary Boundary Layer over the Western Tibetan Plateau in Winter, J. Atmos. Sci., 73, 2021–2038, https://doi.org/10.1175/JAS-D-15-0148.1, 2016. a
Chen, Z., Liu, J., Qie, X., Cheng, X., Yang, M., Shu, L., and Zang, Z.: Stratospheric Influence on Surface Ozone Pollution in China, Nat. Commun., 15, 4064, https://doi.org/10.1038/s41467-024-48406-x, 2024. a
Clain, G., Baray, J.-L., Delmas, R., Keckhut, P., and Cammas, J.-P.: A lagrangian approach to analyse the tropospheric ozone climatology in the tropics: Climatology of stratosphere–troposphere exchange at Reunion Island, Atmos. Environ., 44, 968–975, https://doi.org/10.1016/j.atmosenv.2009.08.048, 2010. a
Dethof, A., O'Neill, A., and Slingo, J.: Quantification of the Isentropic Mass Transport across the Dynamical Tropopause, J. Geophys. Res.-Atmos., 105, 12279–12293, https://doi.org/10.1029/2000JD900127, 2000. a, b, c
DMA: [Air Quality Dataset], Aire CDMX [data set], http://www.aire.cdmx.gob.mx/default.php (last access: 1 July 2025), 2025. a, b
Flynn, L., Long, C., Wu, X., Evans, R., Beck, C. T., Petropavlovskikh, I., McConville, G., Yu, W., Zhang, Z., Niu, J., Beach, E., Hao, Y., Pan, C., Sen, B., Novicki, M., Zhou, S., and Seftor, C.: Performance of the Ozone Mapping and Profiler Suite (OMPS) products, J. Geophys. Res.-Atmos., 119, 6181–6195, https://doi.org/10.1002/2013JD020467, 2014. a, b, c
Gabriel, A. and Peters, D.: A Diagnostic Study of Different Types of Rossby Wave Breaking Events in the Northern Extratropics, J. Meteorol. Soc. Jpn., Ser. II, 86, 613–631, https://doi.org/10.2151/jmsj.86.613, 2008. a, b
Gouget, H., Cammas, J.-P., Marenco, A., Rosset, R., and Jonquières, I.: Ozone peaks associated with a subtropical tropopause fold and with the trade wind inversion: A case study from the airborne campaign TROPOZ II over the Caribbean in winter, J. Geophys. Res.-Atmos., 101, 25979–25993, https://doi.org/10.1029/96JD01545, 1996. a
Grewe, V.: The origin of ozone, Atmos. Chem. Phys., 6, 1495–1511, https://doi.org/10.5194/acp-6-1495-2006, 2006. a
Hersbach, H., Bell, B., Berrisford, P., Hirahara, S., Horányi, A., Muñoz-Sabater, J., Nicolas, J., Peubey, C., Radu, R., Schepers, D., Simmons, A., Soci, C., Abdalla, S., Abellan, X., Balsamo, G., Bechtold, P., Biavati, G., Bidlot, J., Bonavita, M., De Chiara, G., Dahlgren, P., Dee, D., Diamantakis, M., Dragani, R., Flemming, J., Forbes, R., Fuentes, M., Geer, A., Haimberger, L., Healy, S., Hogan, R. J., Hólm, E., Janisková, M., Keeley, S., Laloyaux, P., Lopez, P., Lupu, C., Radnoti, G., De Rosnay, P., Rozum, I., Vamborg, F., Villaume, S., and Thépaut, J.-N.: The ERA5 Global Reanalysis, Q. J. Roy. Meteor. Soc., 146, 1999–2049, https://doi.org/10.1002/qj.3803, 2020. a, b
Holton, J.: Atmospheric Dynamics: Fundamentals, in: The Stratosphere and Its Role in the Climate System, edited by: Brasseur, G. P., Springer Berlin Heidelberg, Berlin, Heidelberg, 7–14, https://doi.org/10.1007/978-3-662-03327-2_2, ISBN 978-3-642-08334-1 978-3-662-03327-2, 1997. a
Holton, J. R., Haynes, P. H., McIntyre, M. E., Douglass, A. R., Rood, R. B., and Pfister, L.: Stratosphere-troposphere Exchange, Rev. Geophys., 33, 403–439, https://doi.org/10.1029/95RG02097, 1995. a, b, c, d
Homeyer, C. R. and Bowman, K. P.: Rossby Wave Breaking and Transport between the Tropics and Extratropics above the Subtropical Jet, J. Atmos. Sci., 70, 607–626, https://doi.org/10.1175/JAS-D-12-0198.1, 2013. a, b
Hoskins, B. J. and Karoly, D. J.: The Steady Linear Response of a Spherical Atmosphere to Thermal and Orographic Forcing, J. Atmos. Sci., 38, 1179–1196, https://doi.org/10.1175/1520-0469(1981)038<1179:TSLROA>2.0.CO;2, 1981. a
Hoskins, B. J., McIntyre, M. E., and Robertson, A. W.: On the Use and Significance of Isentropic Potential Vorticity Maps, Q. J. Roy. Meteor. Soc., 111, 877–946, https://doi.org/10.1002/qj.49711147002, 1985. a, b
Jaross, G.: OMPS-NPP L2 NM Ozone (O3) Total Column swath orbital V2, Goddard Earth Sciences Data and Information Services Center (GES DISC) [data set], Greenbelt, MD, USA, https://doi.org/10.5067/0WF4HAAZ0VHK, 2017. a, b, c
Jing, P. and Banerjee, S.: Rossby Wave Breaking and Isentropic Stratosphere-Troposphere Exchange During 1981–2015 in the Northern Hemisphere, J. Geophys. Res.-Atmos., 123, 9011–9025, https://doi.org/10.1029/2018JD028997, 2018. a
Kaderli, S.: Skaderli/WaveBreaking: WaveBreaking v0.3.8, Version 0.3.8, Zenodo [code], https://doi.org/10.5281/zenodo.14214463, 2023. a, b
Karoly, D. J. and Hoskins, B. J.: The Steady, Linear Response of the Stratosphere to Tropospheric Forcing, Q. J. Roy. Meteor. Soc., 109, 455–478, https://doi.org/10.1002/qj.49710946103, 1983. a
Knowland, K. E., Ott, L. E., Duncan, B. N., and Wargan, K.: Stratospheric Intrusion-Influenced Ozone Air Quality Exceedances Investigated in the NASA MERRA-2 Reanalysis, Geophys. Res. Lett., 44, https://doi.org/10.1002/2017GL074532, 2017. a
Kramarova, N. A., Ziemke, J. R., Huang, L.-K., Herman, J. R., Wargan, K., Seftor, C. J., Labow, G. J., and Oman, L. D.: Evaluation of Version 3 Total and Tropospheric Ozone Columns From Earth Polychromatic Imaging Camera on Deep Space Climate Observatory for Studying Regional Scale Ozone Variations, Frontiers in Remote Sensing, 2, 734071, https://doi.org/10.3389/frsen.2021.734071, 2021. a, b
Li, M., Kong, Y., Fan, M., Yu, C., Zhang, Y., Gu, J., Tao, J., and Chen, L.: The Impact of Stratospheric Intrusion on Surface Ozone in Urban Areas of the Northeastern Tibetan Plateau, Atmosphere, 16, 708, https://doi.org/10.3390/atmos16060708, 2025. a
Lin, M., Fiore, A. M., Horowitz, L. W., Langford, A. O., Oltmans, S. J., Tarasick, D., and Rieder, H. E.: Climate Variability Modulates Western US Ozone Air Quality in Spring via Deep Stratospheric Intrusions, Nat. Commun., 6, 7105, https://doi.org/10.1038/ncomms8105, 2015. a, b
Lopez-Bravo, C.: Stratosphere-Troposphere Exchange and Surface Ozone Pollution over Tropical Regions: A Case Study of Rossby Wave Breaking and Tropopause Folding, TIB AV-Portal [video], https://doi.org/10.5446/74035, 2026. a, b
Luo, J., Liang, W., Xu, P., Xue, H., Zhang, M., Shang, L., and Tian, H.: Seasonal Features and a Case Study of Tropopause Folds over the Tibetan Plateau, Adv. Meteorol., 2019, 1–12, https://doi.org/10.1155/2019/4375123, 2019. a
Lüthi, Z. L., Škerlak, B., Kim, S.-W., Lauer, A., Mues, A., Rupakheti, M., and Kang, S.: Atmospheric brown clouds reach the Tibetan Plateau by crossing the Himalayas, Atmos. Chem. Phys., 15, 6007–6021, https://doi.org/10.5194/acp-15-6007-2015, 2015. a
Marshak, A., Herman, J., Adam, S., Karin, B., Carn, S., Cede, A., Geogdzhayev, I., Huang, D., Huang, L.-K., Knyazikhin, Y., Kowalewski, M., Krotkov, N., Lyapustin, A., McPeters, R., Meyer, K. G., Torres, O., and Yang, Y.: Earth Observations from DSCOVR EPIC Instrument, B. Am. Meteorol. Soc., 99, 1829–1850, https://doi.org/10.1175/BAMS-D-17-0223.1, 2018. a, b
Martin, J. E.: The Structure and Evolution of a Continental Winter Cyclone. Part I: Frontal Structure and the Occlusion Process, Mon. Weather Rev., 126, 303–328, https://doi.org/10.1175/1520-0493(1998)126<0303:TSAEOA>2.0.CO;2, 1998. a
McIntyre, M. E. and Palmer, T. N.: Breaking Planetary Waves in the Stratosphere, Nature, 305, 593–600, https://doi.org/10.1038/305593a0, 1983. a
Morgan, M. C. and Nielsen-Gammon, J. W.: Using Tropopause Maps to Diagnose Midlatitude Weather Systems, Mon. Weather Rev., 126, 2555–2579, https://doi.org/10.1175/1520-0493(1998)126<2555:UTMTDM>2.0.CO;2, 1998. a
Nakamura, H.: Midwinter Suppression of Baroclinic Wave Activity in the Pacific, J. Atmos. Sci., 49, 1629–1642, https://doi.org/10.1175/1520-0469(1992)049<1629:MSOBWA>2.0.CO;2, 1992. a
Nguyen, D.-H., Lin, C., Vu, C.-T., Cheruiyot, N. K., Nguyen, M. K., Le, T. H., Lukkhasorn, W., Vo, T.-D.-H., and Bui, X.-T.: Tropospheric Ozone and NOx: A Review of Worldwide Variation and Meteorological Influences, Environmental Technology & Innovation, 28, 102809, https://doi.org/10.1016/j.eti.2022.102809, 2022. a
Ni, J., Jin, J., Wang, Y., Li, B., Wu, Q., Chen, Y., Du, S., Li, Y., and He, C.: Surface Ozone in Global Cities: A Synthesis of Basic Features, Exposure Risk, and Leading Meteorological Driving Factors, Geography and Sustainability, 5, 64–76, https://doi.org/10.1016/j.geosus.2023.09.008, 2024. a
Ogino, S.-Y., Fujiwara, M., Shiotani, M., Hasebe, F., Matsumoto, J., T. Hoang, T. H., and T. Nguyen, T. T.: Ozone Variations over the Northern Subtropical Region Revealed by Ozonesonde Observations in Hanoi, J. Geophys. Res.-Atmos., 118, 3245–3257, https://doi.org/10.1002/jgrd.50348, 2013. a
Postel, G. A. and Hitchman, M. H.: A Climatology of Rossby Wave Breaking along the Subtropical Tropopause, J. Atmos. Sci., 56, 359–373, https://doi.org/10.1175/1520-0469(1999)056<0359:ACORWB>2.0.CO;2, 1999. a, b
Rondanelli, R., Gallardo, L., and Garreaud, R. D.: Rapid changes in ozone mixing ratios at Cerro Tololo (30°10′ S, 70°48′ W, 2200 m) in connection with cutoff lows and deep troughs, J. Geophys. Res.-Atmos., 107, ACL 6-1–ACL 6-15, https://doi.org/10.1029/2001JD001334, 2002. a
Schoeberl, M. R.: Extratropical Stratosphere-troposphere Mass Exchange, J. Geophys. Res.-Atmos., 109, D13303, https://doi.org/10.1029/2004JD004525, 2004. a
Seguel, R. J., Mancilla, C. A., and Leiva G., M. A.: Stratospheric Ozone Intrusions during the Passage of Cold Fronts over Central Chile, Air Qual. Atmos. Hlth., 11, 535–548, https://doi.org/10.1007/s11869-018-0558-4, 2018. a
SINAICA: [Air Quality Dataset], SINAICA [data set], https://sinaica.inecc.gob.mx/data.php?tipo=C (last access: 1 July 2025), 2025. a
Škerlak, B., Sprenger, M., and Wernli, H.: A global climatology of stratosphere–troposphere exchange using the ERA-Interim data set from 1979 to 2011, Atmos. Chem. Phys., 14, 913–937, https://doi.org/10.5194/acp-14-913-2014, 2014. a, b
Škerlak, B., Sprenger, M., Pfahl, S., Tyrlis, E., and Wernli, H.: Tropopause Folds in ERA-Interim: Global Climatology and Relation to Extreme Weather Events, J. Geophys. Res.-Atmos., 120, 4860–4877, https://doi.org/10.1002/2014JD022787, 2015. a
Škerlak, B., Pfahl, S., Sprenger, M., and Wernli, H.: A numerical process study on the rapid transport of stratospheric air down to the surface over western North America and the Tibetan Plateau, Atmos. Chem. Phys., 19, 6535–6549, https://doi.org/10.5194/acp-19-6535-2019, 2019. a, b, c
Spreitzer, E., Attinger, R., Boettcher, M., Forbes, R., Wernli, H., and Joos, H.: Modification of Potential Vorticity near the Tropopause by Nonconservative Processes in the ECMWF Model, J. Atmos. Sci., 76, 1709–1726, https://doi.org/10.1175/JAS-D-18-0295.1, 2019. a
Sprenger, M. and Wernli, H.: The LAGRANTO Lagrangian analysis tool – version 2.0, Geosci. Model Dev., 8, 2569–2586, https://doi.org/10.5194/gmd-8-2569-2015, 2015. a, b
Sprenger, M., Croci Maspoli, M., and Wernli, H.: Tropopause Folds and Cross-tropopause Exchange: A Global Investigation Based upon ECMWF Analyses for the Time Period March 2000 to February 2001, J. Geophys. Res.-Atmos., 108, 8518, https://doi.org/10.1029/2002JD002587, 2003. a, b, c, d
Sprenger, M., Fragkoulidis, G., Binder, H., Croci-Maspoli, M., Graf, P., Grams, C. M., Knippertz, P., Madonna, E., Schemm, S., Škerlak, B., and Wernli, H.: Global Climatologies of Eulerian and Lagrangian Flow Features based on ERA-Interim, B. Am. Meteorol. Soc., 98, 1739–1748, https://doi.org/10.1175/BAMS-D-15-00299.1, 2017. a
Toihir, A. M., Portafaix, T., Sivakumar, V., Bencherif, H., Pazmiño, A., and Bègue, N.: Variability and trend in ozone over the southern tropics and subtropics, Ann. Geophys., 36, 381–404, https://doi.org/10.5194/angeo-36-381-2018, 2018. a
Trenberth, K. E.: Storm Tracks in the Southern Hemisphere, J. Atmos. Sci., 48, 2159–2178, https://doi.org/10.1175/1520-0469(1991)048<2159:STITSH>2.0.CO;2, 1991. a
Trickl, T., Vogelmann, H., Ries, L., and Sprenger, M.: Very high stratospheric influence observed in the free troposphere over the northern Alps – just a local phenomenon?, Atmos. Chem. Phys., 20, 243–266, https://doi.org/10.5194/acp-20-243-2020, 2020. a
Trickl, T., Couret, C., Ries, L., and Vogelmann, H.: Zugspitze ozone 1970–2020: the role of stratosphere–troposphere transport, Atmos. Chem. Phys., 23, 8403–8427, https://doi.org/10.5194/acp-23-8403-2023, 2023. a
Turhal, K., Plöger, F., Clemens, J., Birner, T., Weyland, F., Konopka, P., and Hoor, P.: Variability and trends in the potential vorticity (PV)-gradient dynamical tropopause, Atmos. Chem. Phys., 24, 13653–13679, https://doi.org/10.5194/acp-24-13653-2024, 2024. a
Tyrlis, E. and Hoskins, B. J.: Aspects of a Northern Hemisphere Atmospheric Blocking Climatology, J. Atmos. Sci., 65, 1638–1652, https://doi.org/10.1175/2007JAS2337.1, 2008. a, b, c
Vazquez Santiago, J., Hata, H., Martinez-Noriega, E. J., and Inoue, K.: Ozone Trends and Their Sensitivity in Global Megacities under the Warming Climate, Nat. Commun., 15, 10236, https://doi.org/10.1038/s41467-024-54490-w, 2024. a
Wang, M. and Fu, Q.: Stratosphere-Troposphere Exchange of Air Masses and Ozone Concentrations Based on Reanalyses and Observations, J. Geophys. Res.-Atmos., 126, e2021JD035159, https://doi.org/10.1029/2021JD035159, 2021. a, b
Wernli, H. and Davies, H. C.: A Lagrangian-based Analysis of Extratropical Cyclones. I: The Method and Some Applications, Q. J. Roy. Meteor. Soc., 123, 467–489, https://doi.org/10.1002/qj.49712353811, 1997. a
Wernli, H. and Sprenger, M.: Identification and ERA-15 Climatology of Potential Vorticity Streamers and Cutoffs near the Extratropical Tropopause, J. Atmos. Sci., 64, 1569–1586, https://doi.org/10.1175/JAS3912.1, 2007. a, b, c