
the Creative Commons Attribution 4.0 License.
the Creative Commons Attribution 4.0 License.
 | 30 Oct 2026
Large-scale drivers of compounding hot and dry events in three breadbasket regions
Natalia Castillo Bautista

Leonard F. Borchert
Benjamin Poschlod
Lukas Brunner
Jana Sillmann
Mario L. V. Martina
Compound hot and dry events cause damage to ecosystems and society. While these events have been widely studied individually, their co-ocurrence and the associated large-scale atmospheric drivers remain less understood. Here, we use reanalysis products and observational data to identify compound hot and dry events in the historical period from 1960–2020. We analyze the large-scale circulation patterns associated with compound occurrence of hot and dry events when they affect large portions of three breadbasket regions in the Northern Hemisphere, namely North America, Europe and the Mediterranean and eastern Asia. We find that compound hot and dry events recur throughout the historical period and are consistently linked to Rossby wave patterns and mid-tropospheric anticyclonic ridging, which trigger land–atmosphere feedbacks resulting in the reinforcement of the events. Our study highlights that the spatial coverage of compound hot and dry events across the selected regions provides a useful metric for assessing regional impacts.
- Article
(20070 KB) - Full-text XML
- BibTeX
- EndNote


Weather and climate extremes, such as hot and dry events, cause damage to human activities and infrastructures, and affect the economies worldwide (Field et al., 2011). When these phenomena occur in combination (compound events) the impacts can be exacerbated (Hao et al., 2022; Leonard et al., 2014; Poschlod et al., 2020; Raymond et al., 2020; Seneviratne et al., 2021; Ward et al., 2022; Zscheischler et al., 2020; Zscheischler and Seneviratne, 2017). Specifically, compound hot and dry events (COHDEs) can reduce river streamflow and lead to water shortages which affect crop production and may threaten food security at the regional and global scale (Bevacqua et al., 2022). Understanding the characteristics of these events and their possible drivers to better project their occurrence in the future is therefore necessary.
The concept of compound extreme events was first introduced in 2012 by the Intergovernmental Panel on Climate Change (IPCC) in the Special Report for Managing the Risks of Extreme Events and Disasters to Advance Climate Change Adaptation (SREX) (Field et al., 2012). Since then, it has been a topic of rising interest (Brett et al., 2025), due to evidence of changes in individual extremes starting in the mid-20th century and concerns about their possible variations in the future (Field et al., 2012; Seneviratne et al., 2021). Compound events were defined by Zscheischler et al. (2018) as a combination of multiple drivers and/or hazards that contributes to societal or environmental risk. Four event categories are defined by Zscheischler et al. (2020): “preconditioned, where a weather-driven or climate-driven precondition aggravates the impacts of a hazard; multivariate, where multiple drivers and/or hazards lead to an impact; temporally compounding, where a succession of hazards leads to an impact; and spatially compounding, where hazards in multiple connected locations cause an aggregated impact”.
Among the different types of compound extreme events, the multivariate co-occurrence of hot and dry events has received increasing attention in the last years (Sarhadi et al., 2018; Zhou et al., 2023), as such events are becoming more frequent under anthropogenic climate change and are projected to further increase with warming (Bevacqua et al., 2022; Sarhadi et al., 2018; Seneviratne et al., 2021; Zscheischler et al., 2020). This is in line with the expected consequences of the Clausius–Clapeyron relationship in the warming troposphere, which can hold about 7 % more moisture per °C of warming (Skliris et al., 2016), resulting in increased vapor pressure deficit and evaporative demand, in turn promoting surface drying during heat extremes. An example of these new temperature records is the 2010 boreal summer, in which a persistent heat wave developed across western Russia and Eastern Europe, and the associated extreme temperatures and low humidity conditions led to wildfires (Witte et al., 2011). Another case is the 2022 boreal summer, which was characterized by hot temperatures in Europe (Schumacher et al., 2022), China, Japan (NOAA National Centers for Environmental Information, 2023a) and North America (NOAA National Centers for Environmental Information, 2023b) concomitant with drought in the same locations (Faranda et al., 2023; Toreti, et al., 2022) as well as parts of Africa (Ma et al., 2022).
COHDEs at different spatial scales can be attributed to regional and local scale processes, such as atmospheric blocking, subtropical highs, soil moisture-atmosphere interactions (Mukherjee et al., 2020; Röthlisberger and Martius, 2019; Zscheischler et al., 2020) or land–atmosphere feedbacks (Berg et al., 2015; Röthlisberger and Martius, 2019; Zscheischler and Seneviratne, 2017). However, large scale dynamics like El Niño-Southern Oscillation (ENSO) can act as common forcing of compound weather and climate events mainly through the excitation of Rossby-wave patterns (Kopp et al., 2017; Zscheischler et al., 2020). For example, using the Niño 3.4 SST index (NINO34), defined as the area averaged sea surface temperature from 5° S–5° N and 170–120° W, Hao et al. (2018) found a relationship between NINO34 and the occurrence of compound dry and hot events in different regions, including southeastern Asia. On the other side, drought and heat events in Texas are associated with La Niña conditions consisting of a cold tropical east Pacific Ocean (Hoerling et al., 2013).
Dynamical mechanisms like planetary waves and blocking highs cover a spatial scale of thousands of kilometres, and they can persist for days to weeks favouring conditions for both heat and suppressed precipitation. Such dynamical drivers are characterized by recurrence – how, why and if this recurrence is changing has recently been a matter of debate (Faranda et al., 2023). Previous studies have described large circulation patterns, such as amplified Rossby wave numbers, to the persistence of hot extremes associated with crop yield failures in different regions of the world (Dietz et al., 2025; Kornhuber et al., 2020; Raymond et al., 2022). However, these studies only focused on spatially simultaneous hot extremes (Kornhuber et al., 2020; Nasong et al., 2025) or considered COHDEs without examining the possible atmospheric drivers of such compounds (Dietz et al., 2025; Raymond et al., 2022). More recent studies have investigated the links between specific Rossby wave configurations, associated surface conditions, and their impacts on ecosystem productivity and crop yields (Kornhuber et al., 2023; Lian et al., 2025). However, the circulation anomalies and the role of different Rossby wave patterns in raising persistent COHDEs across Northern Hemisphere regions is still not clear. In this study, we address the following questions: What are the characteristics of COHDEs, in terms of their frequency, spatial extent, and temporal evolution, in specific regions that are important for crop yield, i.e. regions including the so-called breadbaskets (Gaupp et al., 2019, 2020; Kornhuber et al., 2020), in the Northern Hemisphere? Which large-scale atmospheric circulation anomalies are associated with the occurrence of COHDEs affecting large areas? Are these anomalies related to Rossby-wave patterns? To answer to the above questions, the features of COHDEs during the historical period from 1960–2020 and the atmospheric patterns of the highest hazard events are examined. The understanding of the dynamical drivers of highest hazard COHDEs would be crucial to improve early warning capabilities and provide valuable insights for climate impact assessment.
2.1 Data
The atmospheric variables in this study are extracted from the fifth version of the European Centre for Medium-Range Weather Forecasts (ECMWF) reanalysis dataset (ERA5) (Hersbach et al., 2020). ERA5 is an atmospheric reanalysis based on the Integrated Forecasting System. The variables are provided from 1940 to present day, at hourly time steps, on a 0.25° regular grid and on single and vertical pressure levels. The 2 m temperature (t2m) is used to define hot days, while the atmospheric thermodynamics is characterized by analysing the geopotential height at 500 hPa (z500), the zonal and meridional components of wind at 250 hPa (u250, v250) and the surface latent and sensible heat fluxes (SLHF and SSHF, respectively).
Precipitation data are extracted from the observational dataset provided by the Climatic Research Unit (CRU) of the University of East Anglia. In this study, we use the CRU TS 4.07 monthly precipitation data since it integrates a large number of gauge observations on a regular grid at 0.5° spatial resolution, covering global land except Antarctica from 1901–2022 (Harris et al., 2020).
The analysis is carried out on 61 boreal summers (June, July, and August, JJA), from 1960–2020, since at the start of this analysis these were the years available to download and completely assimilated by ERA5. To define hot and dry events on a common grid, ERA5 t2m and all atmospheric thermodynamic variables are interpolated to the CRU spatial grid using a bilinear method provided by the climate data operators (CDO, Schulzweida, 2023).
2.2 Detection of COHDEs
2.2.1 Dry events
We focus on meteorological drought, which is a period with a lack of precipitation over a region (Mishra and Singh, 2010). Meteorological drought differs from hydrological, agricultural, and socioeconomic drought, which, respectively, use river streamflow data, soil moisture decline, or focus on the failure of water resources systems to meet water demands (Mishra and Singh, 2010; Wilhite and Glantz, 1985). In this study, drought conditions at each grid point are identified by using the Standardized Precipitation Index (SPI), which is a commonly used index for meteorological drought recommended by the World Meteorological Organization (Svoboda et al., 2012) and widely used in compound hot-dry event studies (e.g., Guo et al., 2025; Ionita et al., 2021; Wu et al., 2021). This selection is motivated by the fact that our compound-event framework identifies heat extremes explicitly from temperature, and we aim to keep the dry component independent from temperature to facilitate a cleaner dynamical interpretation of compound hot-dry co-occurrence. We calculate the 3 month SPI (SPI3) using a non-parametric standardized index using empirical precipitation probabilities estimated with the help of Gringorten plotting position as shown in Gringorten (1963), in Hao and AghaKouchak (2014) and Farahmand and AghaKouchak (2015). At each grid point, precipitation data for each target month is accumulated over that month and the two preceding months. For each calendar month, the resulting 3 month precipitation totals are ranked across the years of the reference period. The ranks are converted into empirical non exceedance probabilities using the Gringorten plotting position. The resulting empirical probabilities are then converted into SPI, defined by Farahmand and AghaKouchak (2015) as:
where Pp is the empirical probability of precipitation and φ is the standard normal distribution function. We use the 3 month SPI (SPI3) based on CRU precipitation, using as reference a 30 year shifted baseline, starting in the 1960–1989 and ending in the 1991-2020 period. A shifting baseline is used to remove the influence of slow changes in climatological conditions, since we want to investigate the physical drivers of COHDEs rather than long-term trends. For this analysis we use SPI3 for June, July and August. Each index reflects precipitation accumulated over the respective and its two preceding months (e.g., the June SPI3 is based on April–June). The 3 month timescale is chosen because SPI3 captures the transition from meteorological to agricultural drought (Huang et al., 2015; Zhang et al., 2025) and is closely linked to agricultural impacts such as in North America (Teleubay et al., 2025), Europe (Fioravanti et al., 2025; Jiménez-Donaire et al., 2020) and Asia (Huang et al., 2015; Zhang et al., 2025). A dry event is then defined as the precipitation deficit corresponding to (Fig. 1), which is equivalent to a cumulative probability of 0.159, or the lower 15.8 % of a standard normal distribution.
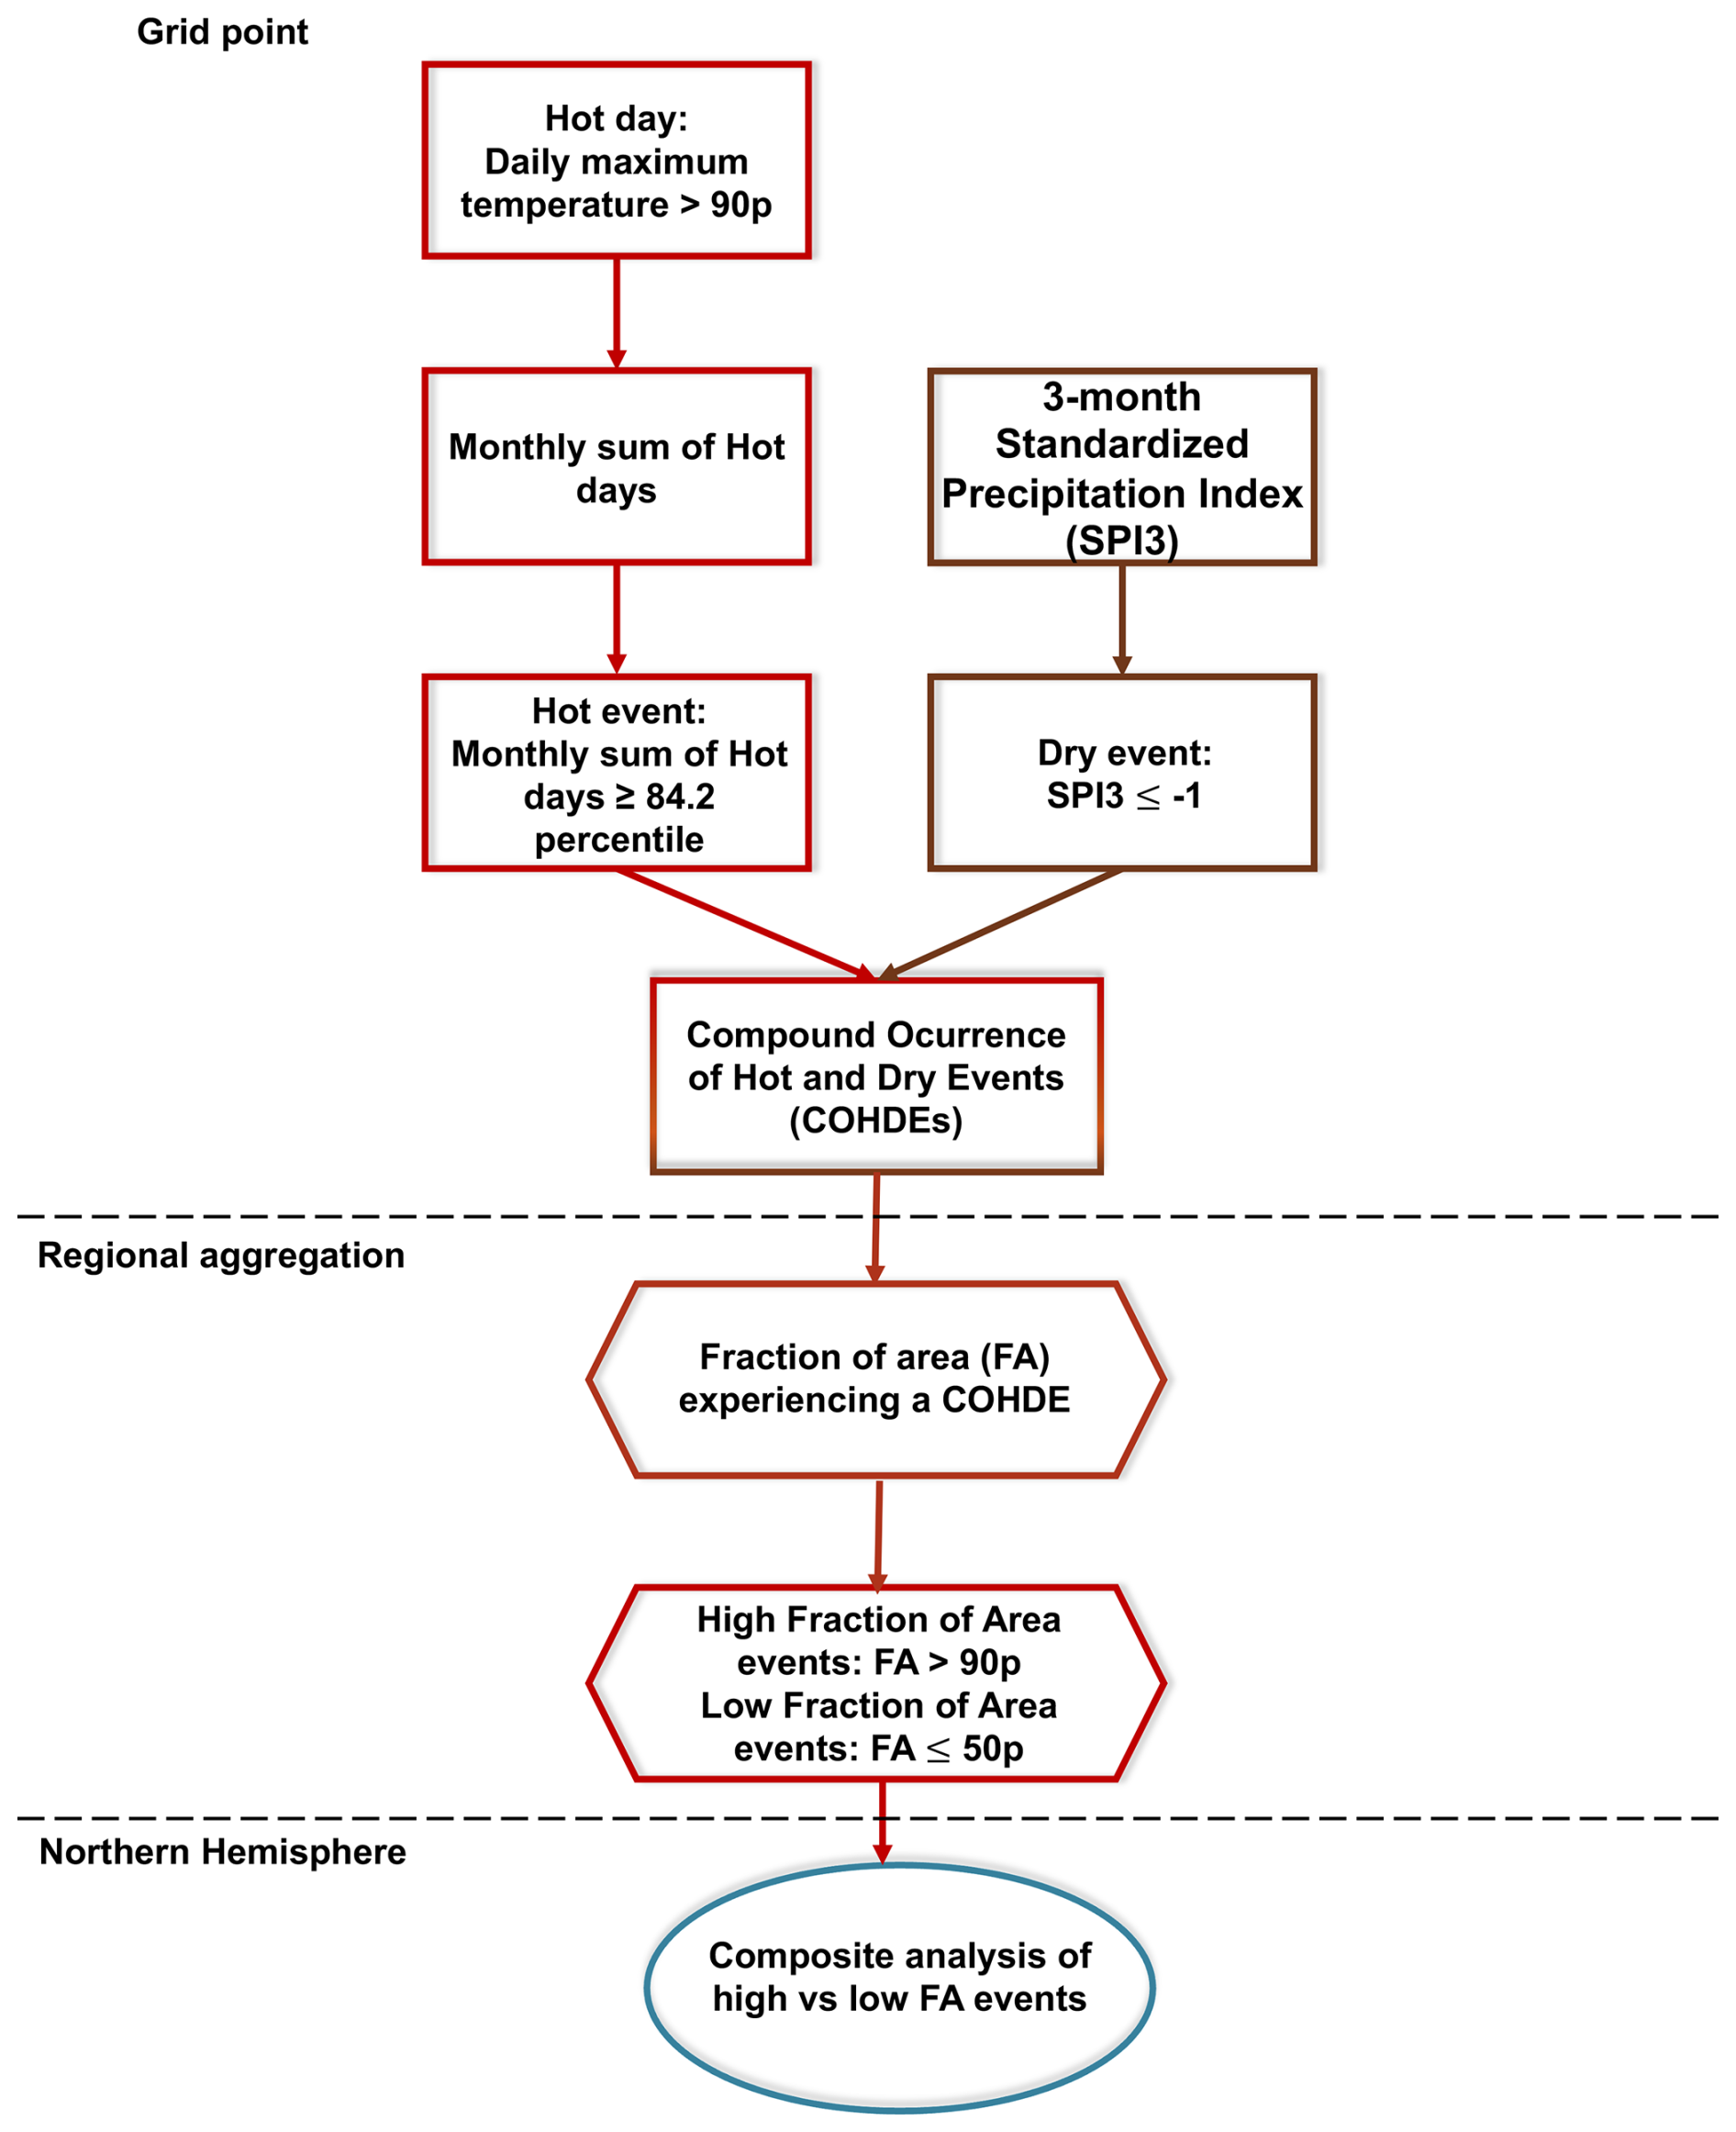
Figure 1Flow chart with the steps that are followed to identify hot and dry events and their compound occurrence at each grid point; to define high and low fraction of area events in each breadbasket; to isolate the associated large-scale atmospheric patterns.
2.2.2 Hot events
For each grid point we define hot days as days characterised by daily maximum temperatures above the 90th climatological percentile. Daily maximum temperatures are identified using the daily maximum of hourly t2m. For the calculation of the 90th percentile for each day of summer (JJA), the daily climatology is defined using a centred 15 d moving window (Fischer and Schär, 2010; Smith et al., 2025), on a 30 year reference period shifting from 1960–2020. This method allows us to remove the influence of slow changes in climatological conditions such as the mean and variability, reducing the influence of long-term warming trends on the percentile estimation (Smith et al., 2025). During the first and last 15 years of the time series, the hot days are identified by using the 90th climatological percentile of the first and last 30 year period, respectively. The rest of the years the daily maximum temperatures are compared against a yearly updated 90th climatological percentile, computed from the surrounding 30 year period.
Then, a monthly index for the hot days is defined as the sum of hot days per month, and hot events are detected when the index exceed the 84.2th percentile of the distribution, corresponding to one standard deviation above the mean of a standard normal distribution. This definition provides a counterpart to the dry event definition (, i.e., one standard deviation below the mean). The 84.2th percentile is calculated separately for June, July, and August (Fig. 1).
2.2.3 COHDEs definition
Monthly compound occurrence of hot and dry events is defined at each grid cell over land when a dry and hot event occur in the same month. This follows the “AND hazard scenario” (Salvadori et al., 2016), where both dry and hot thresholds most be exceeded simultaneously (Fig. 1). Thresholds are computed separately for each month and grid cell, with an example shown in Fig. 2. Since, by definition, the probability of occurrence is 15.8 % for both events, compound events would occur on average with a probability of without any dependence between the two processes. This would amount to 1.5 events per 61 years on average. Conversely, a physical dependence between the two events would result in a probability of co-occurrence higher than the probability expected in case of no dependence – a feature known as positive dependence (Böhnisch et al., 2025; Zscheischler and Seneviratne, 2017). We apply a permutation test to assess this positive dependence: at each grid cell, SPI3 and the monthly hot day index were independently shuffled 1000 times to break their dependence, and compound occurrences were recalculated. Positive dependence is identified when the observed compound frequency exceeds the 95th percentile of the shuffled distribution (α=0.05). The spatial distribution of grid cells with significant positive dependence is shown in Fig. 3.
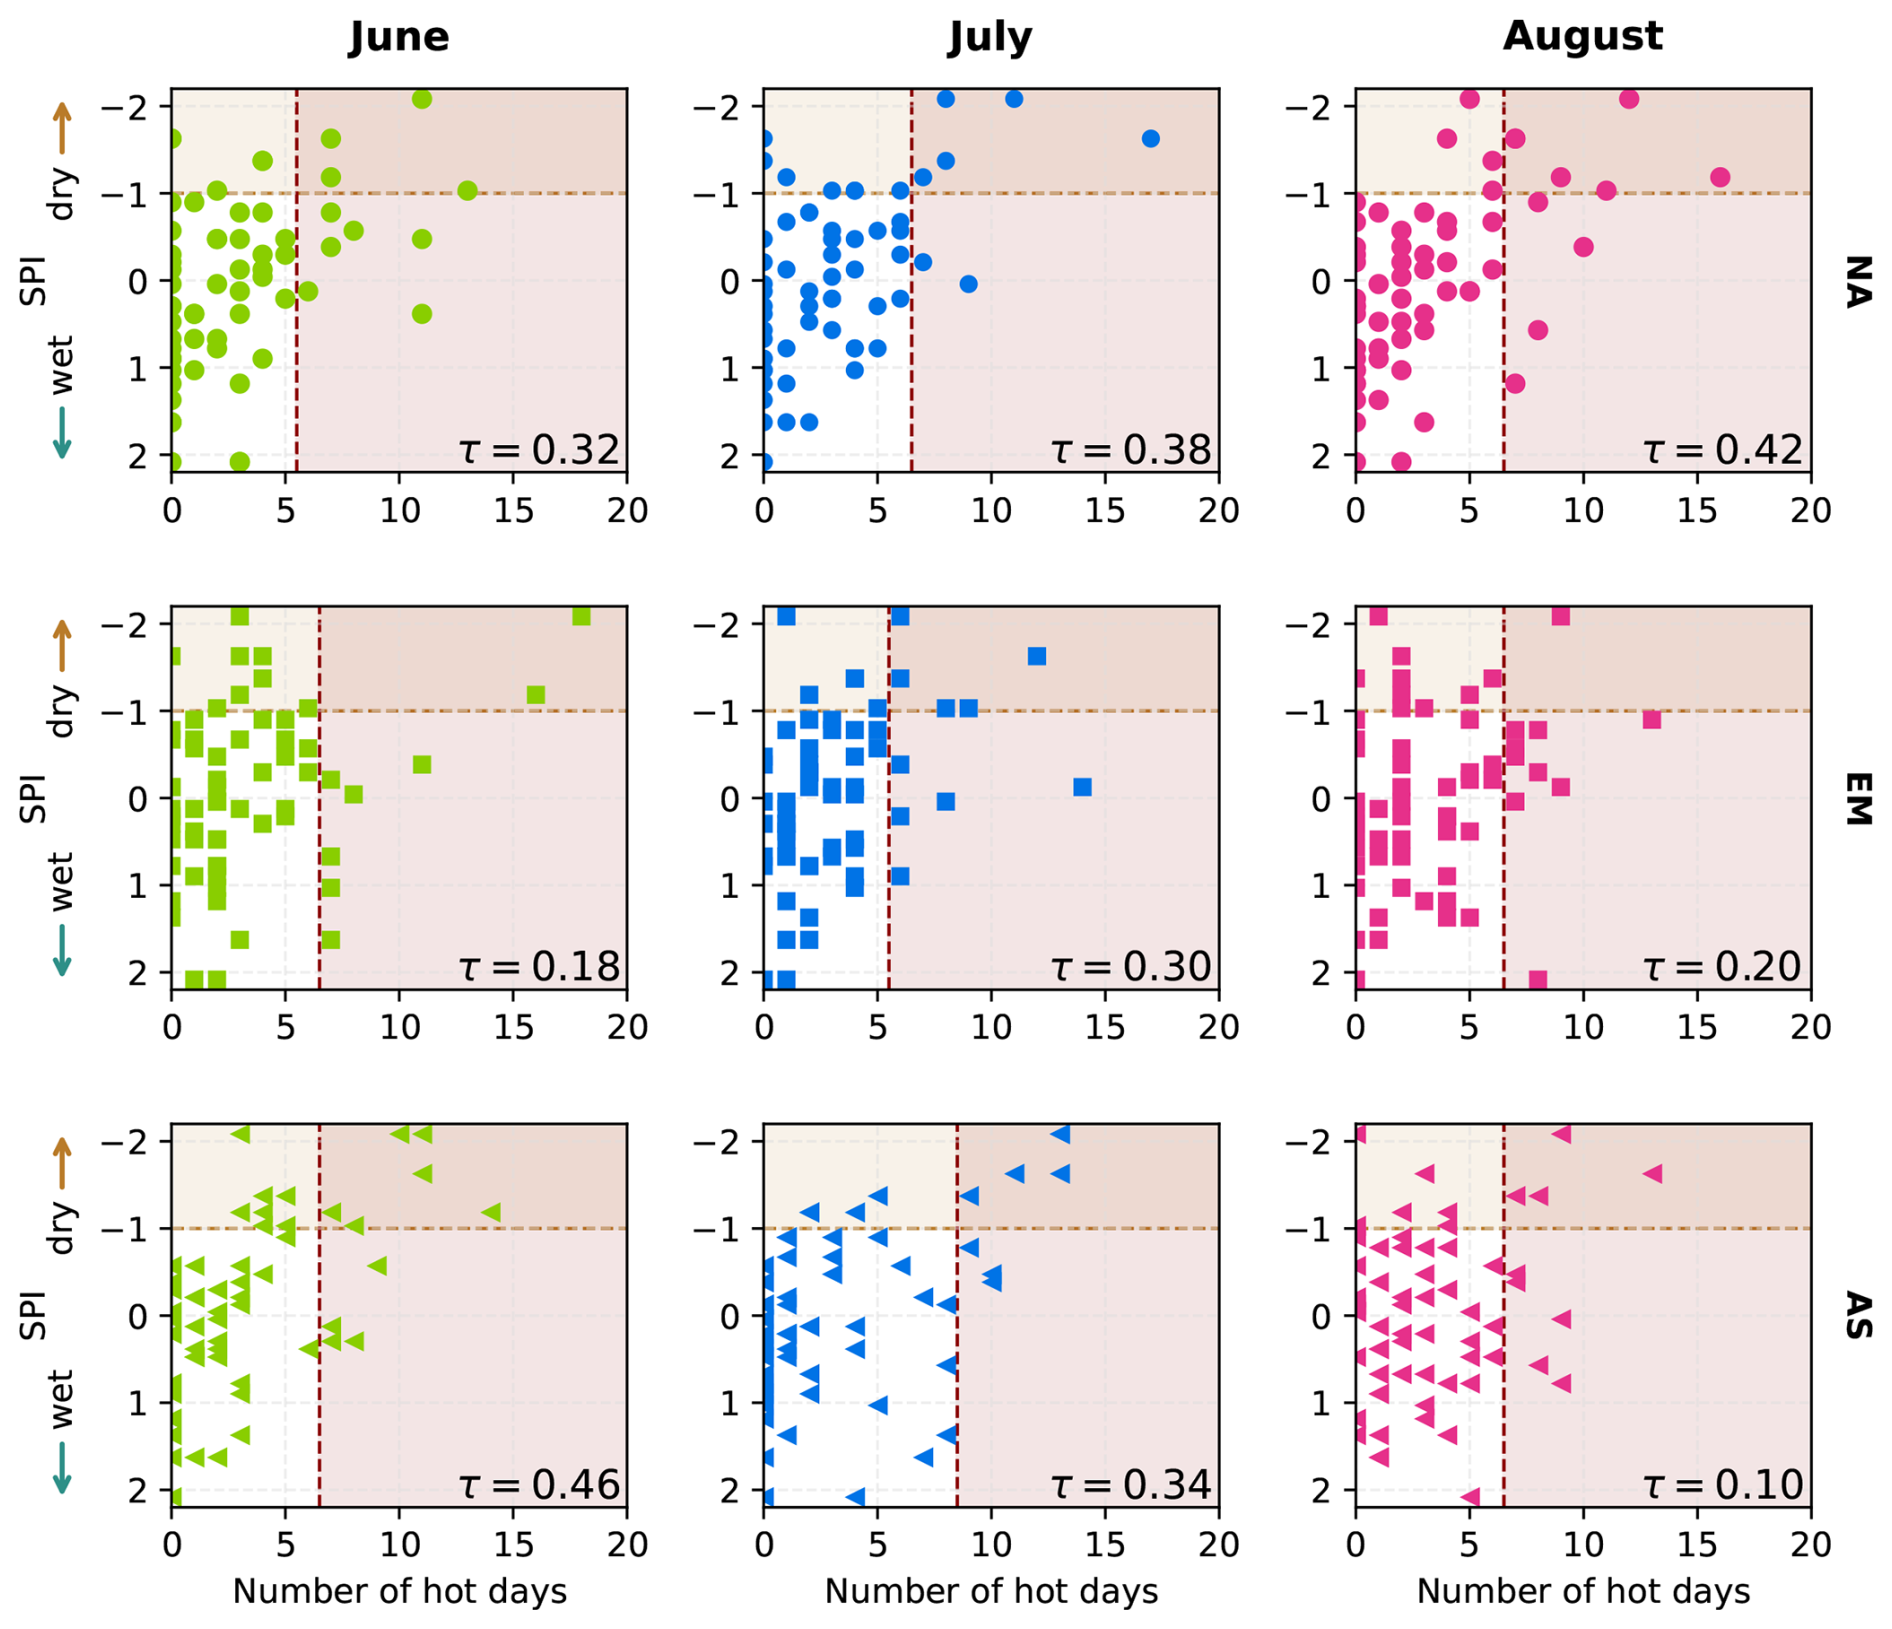
Figure 2Distribution of the monthly hot day index and SPI for three different grid cells located within the three selected regions (North America, NA (41.48° N, 100.62° W), in the first row; Euro-Mediterranean, EM (45.7° N, 3.3° E), in the second row; Eastern Asia, AS (43.37° N, 123.53° E), in the third row). June, July and August are displayed in columns, shown in green, blue and pink, respectively. Different markers are associated with the three regions: circles for NA, squares for EM, and triangles for AS. The dashed lines show the thresholds that are used to identify hot events, i.e., 84.2th percentile of the monthly hot day index, and dry events, i.e., . The upper right area shows the compound events in these grid cells. Kendall's τ as rank correlation coefficient provides a measure of the strength of the dependence between hot and dry events.
2.3 Definition of breadbasket regions
We use the regions identified by the IPCC for the climate impact and risk assessment (Iturbide et al., 2020) to encompass some breadbasket regions in the Northern Hemisphere. We select and combine subregions to create three regions where maize, soybean, wheat and rice can be grown (Gaupp et al., 2020): North America (NA) (maize and soybean), Euro-Mediterranean (EM) (maize and wheat) and Eastern Asia (AS) (rice and wheat). For each region, we compute the fraction of area (FA) affected by COHDEs, which is the area-weighted number of grid points out of the total (Fig. 1). Area-weighting is performed by multiplying by the cosine of the latitude to account for the varying sizes of the grid cells with latitude.
2.4 Atmospheric large circulation patterns
We identify the large circulation patterns associated with COHDEs in each region by using the FA. First, we define high fraction (low fraction) of area events as those with FA>90th percentile (≤50th percentile), resulting in 19 (92) events, respectively. The selected atmospheric variables that are used to identify the large-scale atmospheric drivers of COHDEs are de-seasonalized and the composite differences between high and low FA events are analysed, as shown in the last step of Fig. 1. The statistical significance of the composite differences is assessed through a Student's t-test with 95 % confidence level.
For each high FA event, the wavenumber of the anomalous mean westerly flow at mid latitudes is determined by applying a fast Fourier transform to the monthly v250 anomalies spatially averaged from 37.5–57.5° N (Kornhuber et al., 2019; Petoukhov et al., 2013).
3.1 Climatology of COHDEs in the Northern Hemisphere and in the three bread-basket regions
The spatial pattern of the frequency of occurrence of COHDEs during the summer season is shown in Fig. 3a. Hotspots of COHDEs (up to 10.4 % monthly occurrence probability) are evident in different mid-latitude and tropical areas, including US, eastern Europe, and North India. Regions with non-positive dependence between heat and drought are expected to have less than 2.5 % monthly occurrence probability of COHDEs, yet several regions exceed this by more than a factor of three. This suggests that land–atmosphere feedback and/or large-scale circulation patterns amplify the co-occurrence of heat and dryness. A maximum of 15 COHDEs is reached in the most affected regions, i.e., conditions that can significantly stress water resources and agriculture. On average, more than 20 % of land in the Northern Hemisphere is affected by a 4 % monthly occurrence probability of COHDEs (Fig. 3b), i.e., there are about seven summer months with compound hot and dry conditions over the 61 year period. While this highlights that such events are relatively rare, the observed frequency indicates that there is a significant positive dependence between the two drivers in large parts of the study area (Fig. 3a).
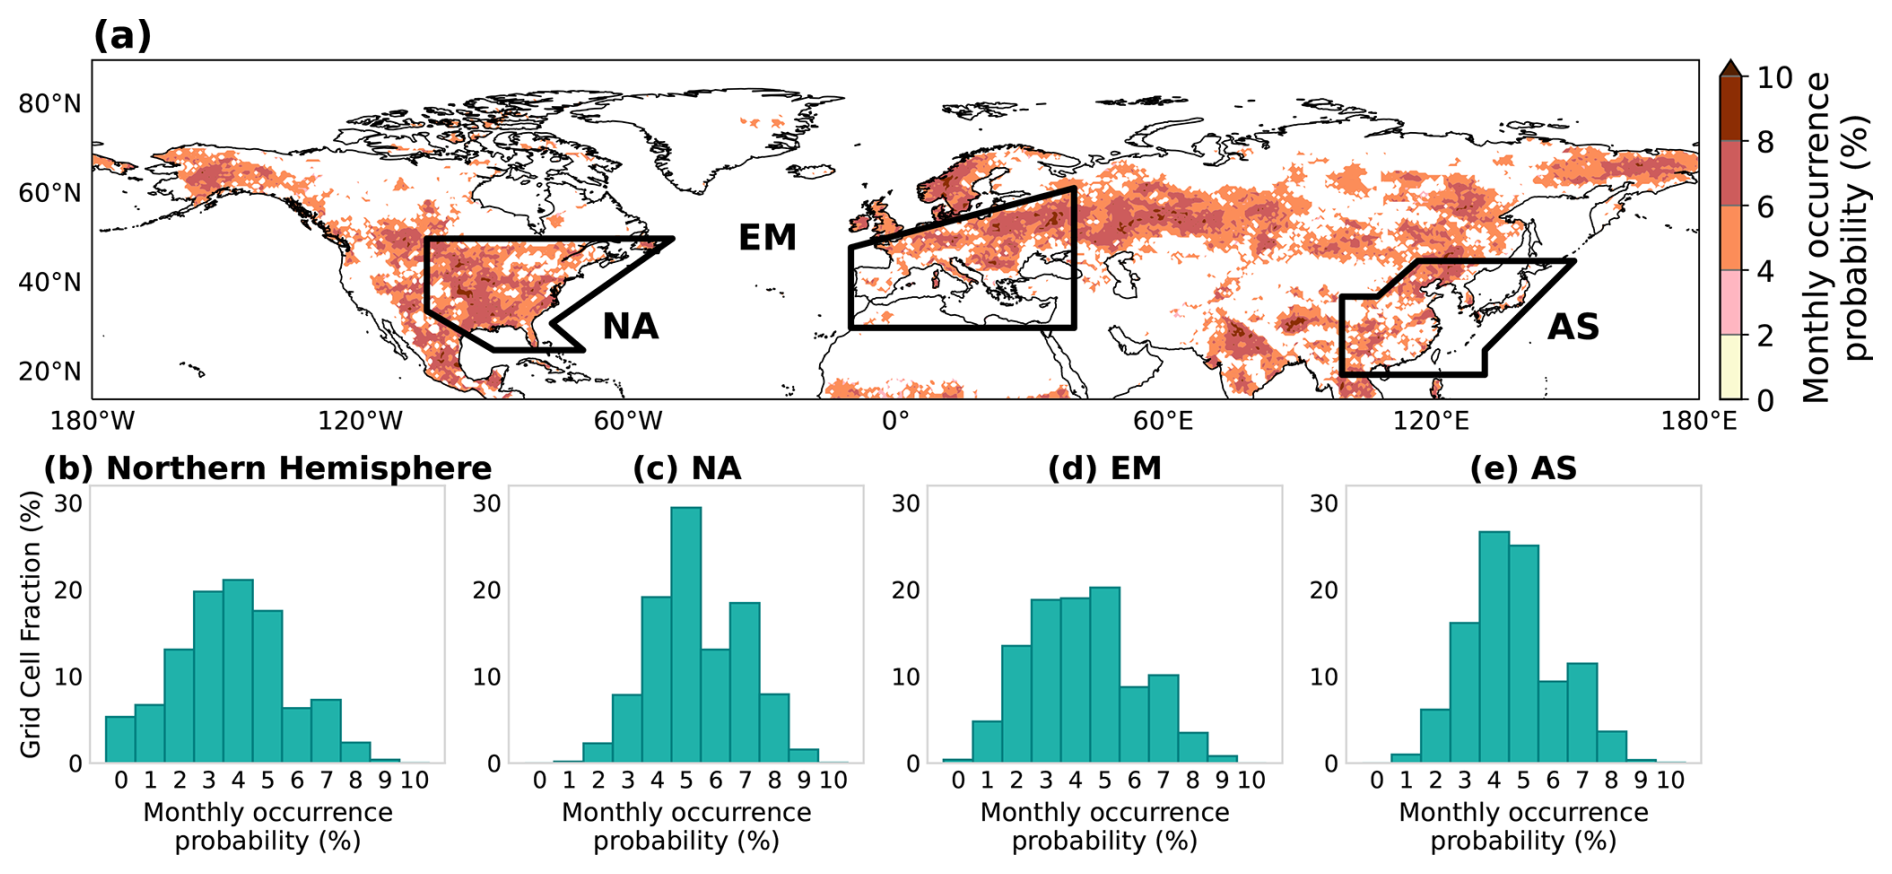
Figure 3(a) Monthly occurrence probability of Compound Hot and Dry Events (COHDEs) in June–July–August (JJA) from 1960–2020. Black contours indicate the selected bread-basket regions (NA: North America; EM: Euro-Mediterranean and AS: eastern Asia). Shadings indicate the frequency of COHDEs in the grid cells showing significant positive dependence between hot and dry events; white grid cells indicate no significant positive dependence. In (b–e), distribution of grid cell fraction as a function of monthly occurrence probability of COHDEs in the Northern Hemisphere, NA, EM and AS regions, respectively.
The FA in the Northern Hemisphere affected by COHDEs (Fig. 4a) varies across the years, with different notable peaks. For June and August, a Mann–Kendall test indicates no significant trend, which is consistent with the use of a moving-window baseline that removes long-term climate change effects. July is the only exception, with a weak, but statistically significant positive trend (slope=0.02, p=0.01). For the three selected regions (NA, EM and AS), the Mann–Kendall test does not show statistically significant trends in the FA for any summer month. Some examples of the peaks in Fig. 4a are 1988, which stands out with nearly 8 % of land grid cells simultaneously experiencing COHDEs, coinciding with large FA events in North America (Fig. 4b). Similarly, 1994 shows more than 5 % of land area affected, consistent with high values across EM and AS regions (Fig. 4c and d). Between the late 1980s and early 2000s (1988–2004), the FA affected exceeded 2 % during June and July. More recently, years such as 2012, 2015 and 2018, reached above 4 % area in July consistent with events in the NA and EM regions (Fig. 4b and c).
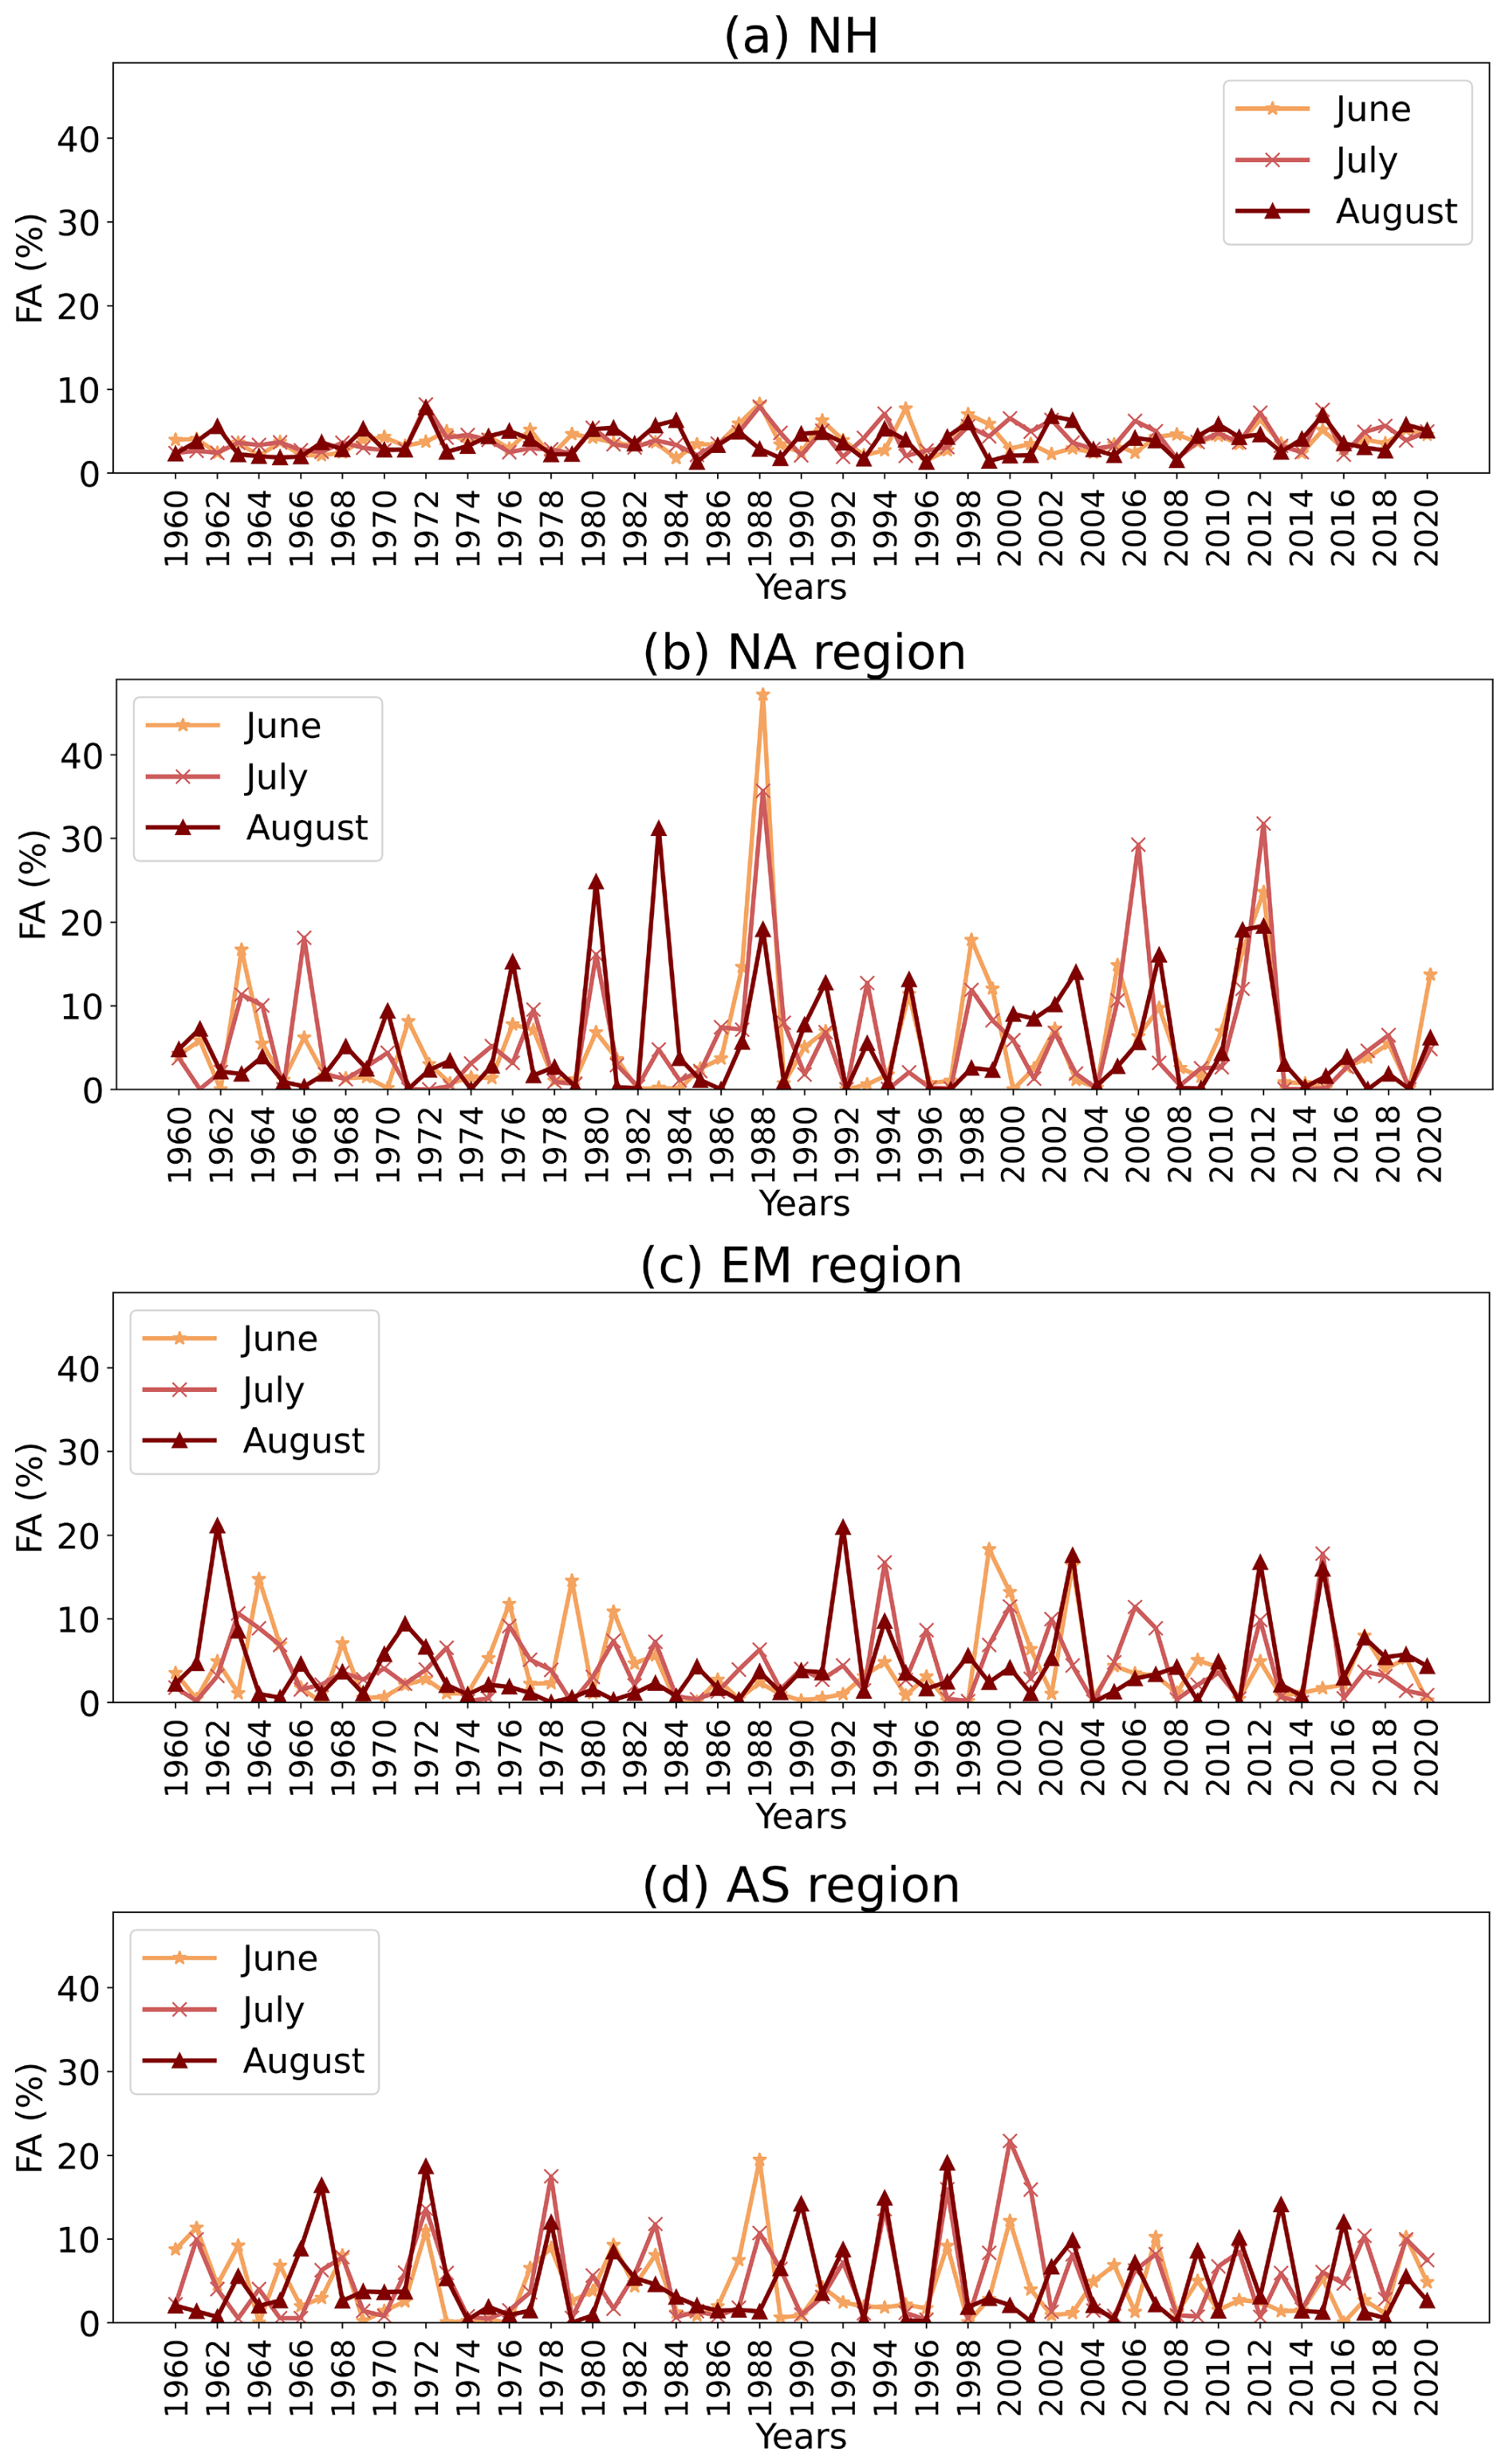
Figure 4Fraction of Area (FA) affected by COHDEs during June, July and August, from 1960–2020, in (a) the Northern Hemisphere, (b) North America (NA), (c) Euro-Mediterranean (EM) and (d) eastern Asia (AS).
The frequency of COHDEs shows some regional hot spots (up to 9 % monthly occurrence probability) in the Midwest of NA with almost the whole domain being positive dependent (Fig. 3a). Over this region at least 30 % grid cells experienced nine months with hot and dry conditions during the whole period (Fig. 3c). The mean FA affected by COHDEs during the whole period in the NA region is 5.4 %. There is a maximum of 47.2 % in June 1988, followed by 35.7 % during July 1988 (Fig. 4b). The summer of 1988 was characterized by having one of the most extensive droughts in the United States since the 1950s and recorded one of the hottest and driest periods in 90 years over the Plains, Midwest, and the Mississippi valley (Mo et al., 1991; Trenberth et al., 1988). Our approach also captures a 31.2 % FA affected by COHDEs during August 1983, which was also hit by a drought period and a heat wave (Malcolm, 1983; The New York Times, 1983). In NA, from 1990s onwards, the upper percentile range of the sliding FA enlarge, indicating larger fluctuations and high FA periods compared to earlier decades (see Fig. A1a in Appendix A).
The EM region shows some COHDEs spots mainly in the eastern side, with positive dependence across most of the domain except in some regions of the Iberian Peninsula (Fig. 3a). This is in line with findings by Schmutz et al. (2026) who show that in the Iberian region the temperature dominates the compound signal while dependence is close to zero and with Böhnisch et al. (2025) who indicates that precipitation fluctuates very low in this region. In the Alps, the complex topography and frequent precipitation might decouple hot and dry extremes. Unlike NA and AS, the distribution of affected months in EM is flatter (Fig. 3d), indicating more heterogeneity of monthly occurrence probability of COHDEs within the region. The mean FA affected by COHDEs in this region is 4.1 %, while a maximum of 21.1 % is displayed in August 2003 (Fig. 4c). The European summer of 2003 was characterized by a series of heatwaves and drought conditions which led to thousands of excess deaths, fires and impacts on water ecosystems, causing economic losses of ∼13 billion euros (Fink et al., 2004; García-Herrera et al., 2010; UNEP, 2004). This region also shows a slight increase of the upper percentiles of the distribution of FA with COHDEs starting in the late 1980s (Fig. A1b).
The spatial pattern of the monthly occurrence probability of COHDEs in AS region has broad occurrences over the region, especially in eastern China (Fig. 3a). The distribution of grid cell fraction is centred around 4 %–5 % monthly occurrence probability, which means that COHDEs occur at least in 7 months across the period of analysis (Fig. 3e). The distribution resembles that of NA, suggesting a clustering around moderate occurrence probabilities with COHDEs. Furthermore, the mean FA in the AS region is 4.7 % and its maximum is 21.7 % in July 2000 (Fig. 4d). This is consistent with studies that reported losses of ∼40 million hectares in agricultural areas due to droughts in China during the summer of 2000 (Zou et al., 2005).
We also find that the FA affected by COHDEs is larger in the three breadbasket regions than in the Northern Hemisphere (mean NH=3.8 %, NA=5.4 %, EM=4.1 % and AS=4.7 %).
3.2 COHDEs and associated large circulation patterns in NA region
In this section, we analyze the large circulation patterns associated with high FA events in the NA region. There is a maximum of up to 9 COHDEs during these high FA events (Fig. 5a), with associated temperature anomalies of up to 3 °C and precipitation anomalies of (Fig. 5b and c).
Near-surface thermal anomalies are associated with positive anomalies of z500 in the mid troposphere (Fig. 5b), which lead to increased radiative heating at the surface, reflected by an upward SSHF (negative SSHF anomalies, Fig. 5d) (following ERA5 convention, which defines downward fluxes as positive, an increase/reduction in the upward flux from land to the atmosphere manifests in a negative/positive anomaly). At the same time, precipitation deficits associated with positive z500 anomalies (Fig. 5c) and a northward deflection of the westerly flow (Fig. 5h) reduce the amount of water available for evaporation, leading to suppressed evaporative cooling. This is reflected by positive anomalies in SLHF (Fig. 5e), and results in more heat being retained at the surface. Together, these processes reinforce surface warming and dryness, creating a feedback promoting the occurrence of COHDEs in this region.
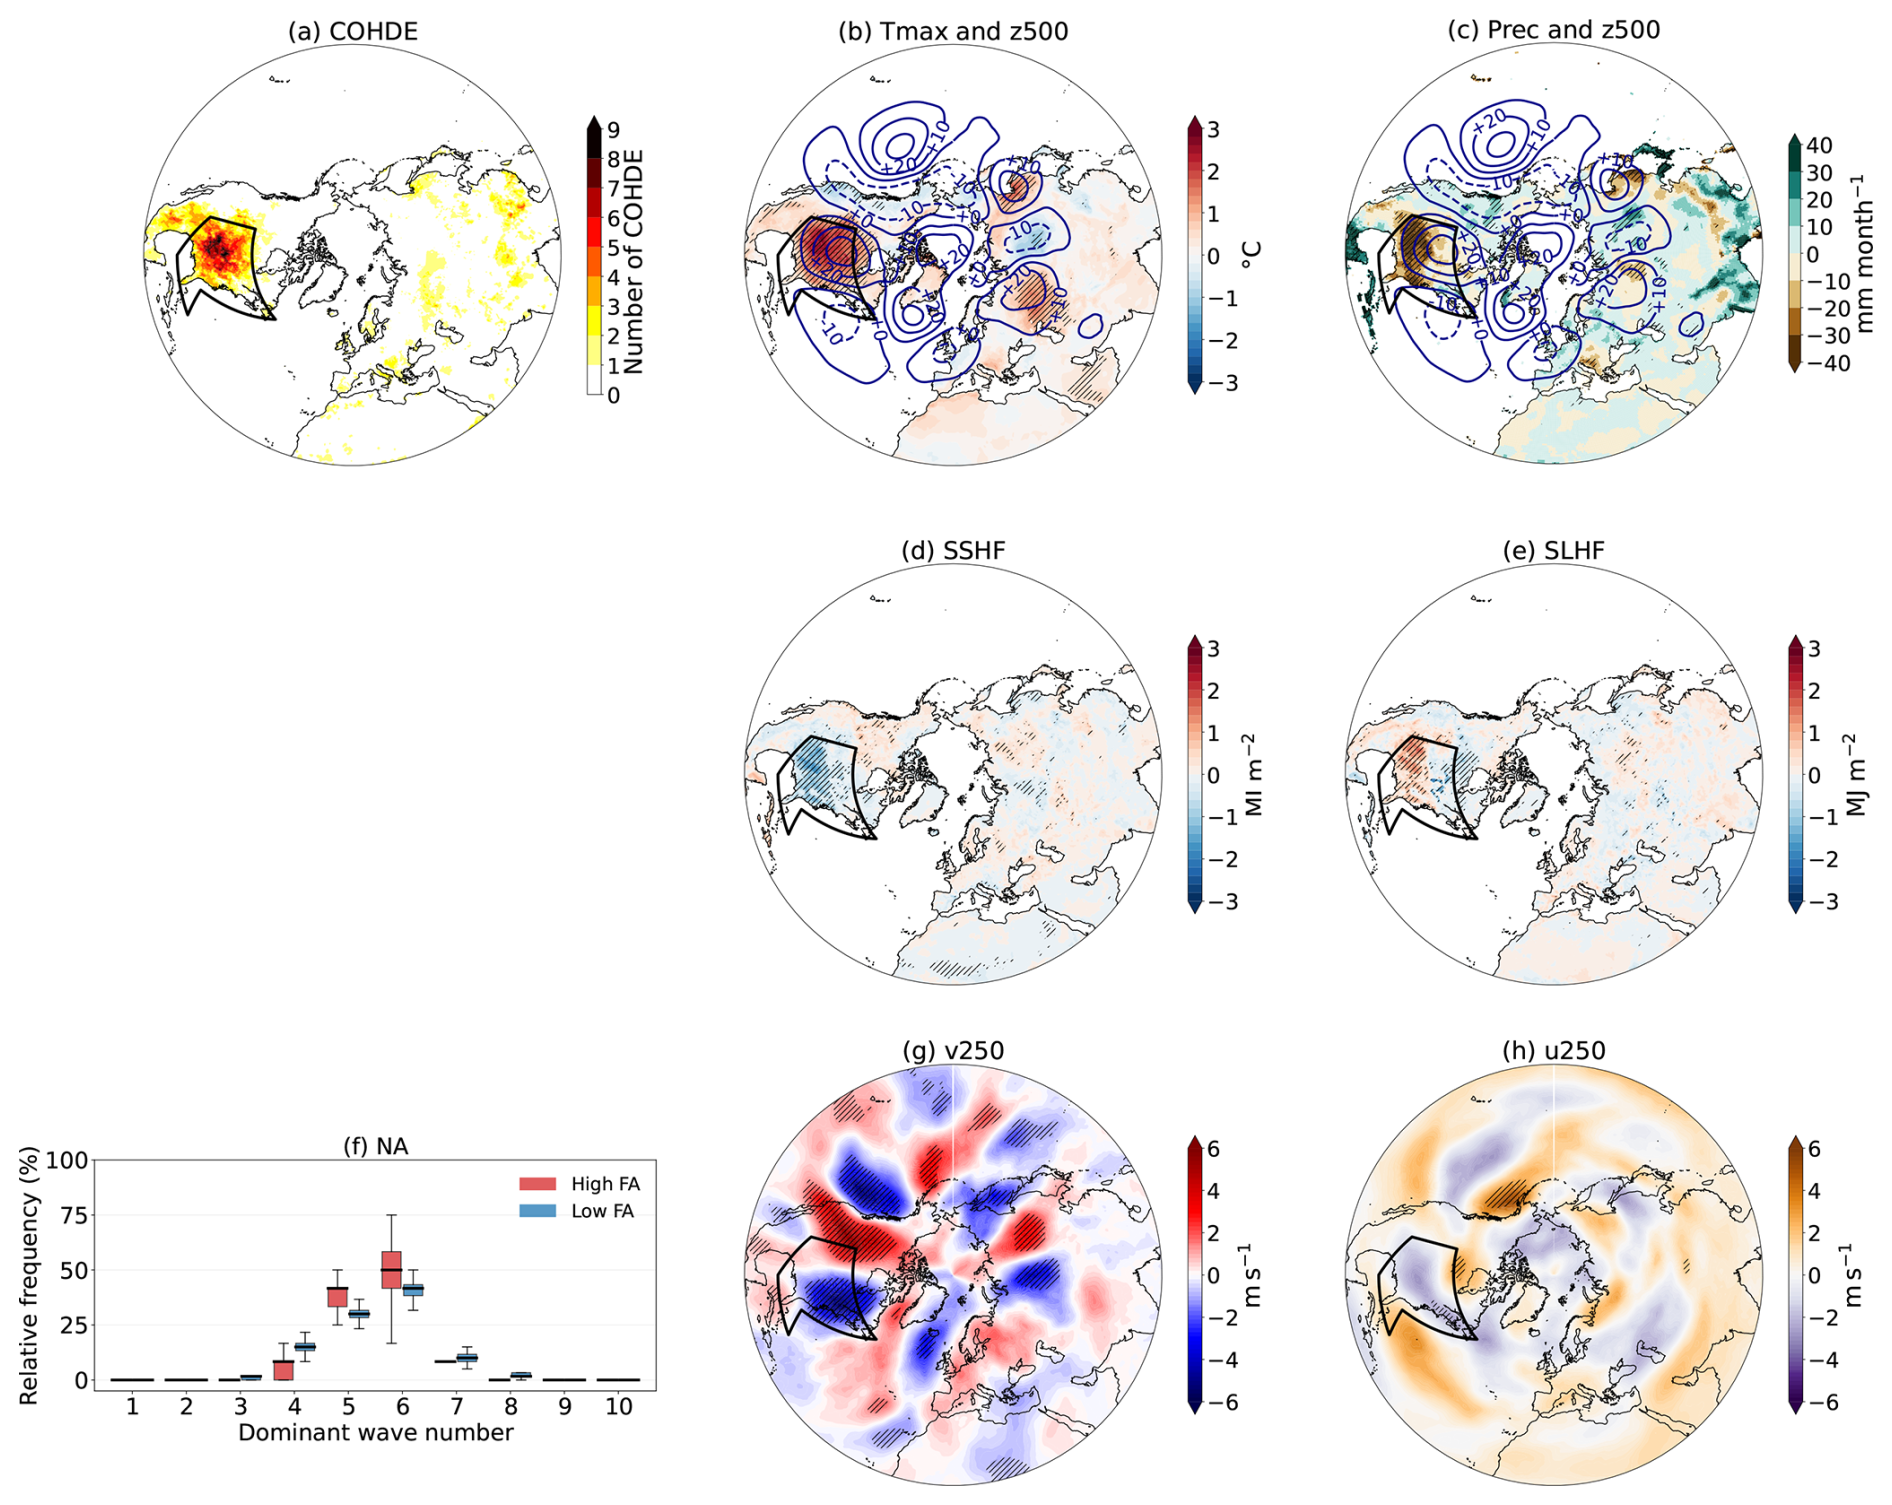
Figure 5Composite analysis of high Fraction of Area (FA) events (19 events) minus low FA events in North America (NA, highlighted by the black contours): (a) Total number of COHDEs during high FA events (19 events), composite differences of (b) maximum daily temperature at 2 m (shadings) and isohypses at 500 hPa (z500), (c) precipitation (shadings) and isohypses at 500 hPa, (d) surface sensible and (e) surface latent heat fluxes, (f) relative frequency distributions of the dominant zonal wavenumbers in the v250 anomalies during high FA (red) and low FA events (blue) with COHDEs (f, g) meridional component of the wind at 250 hPa (v250) and (h) zonal component of the wind at 250 hPa (u250). Hatched areas in the composites indicate regions where differences are statistically significant at the 95 % confidence level, based on a Student's t-test.
The large circulation patterns in the middle and upper troposphere associated with these events display a circumglobal Rossby wave pattern in the v250 (Fig. 5g) and in the z500 (Figs. 5b and A2g) fields, with positive anomalies of z500 in the north of this region. The meridional winds in the upper troposphere show a meandering pattern with a dipole-like structure placed southwards with respect to the climatology (Fig. A2a), with northward winds in the western side of NA and southward winds in the east of this region (Fig. 5g), which is consistent with the geopotential pattern found in the mid troposphere. The v250 longitudinal profiles associated with the high FA events show that this pattern is a robust feature (Fig. A3a), with strong winds above and below normal for each of these selected months. The low FA events show an opposite sign with respect to high FA events, consistent with a circulation less favourable for regional ridging (Fig. A3d). Furthermore, the dominant zonal wave number distributions were evaluated using 1000 repeated random subsampling realizations. In each realization, 120 of the 183 JJA months were selected and the high and low FA classes were recalculated. Wavenumbers 5 and 6 show higher frequencies during high FA events (Fig. 5f). Their median frequencies are 40 % and 50 % respectively, during high FA events, compared with 30 % and 40 % during low FA events. This indicates an association of high FA events with circumglobal wave 5 and wave 6 configurations.
We also demonstrate how the installation of the circulation featuring high FA events leads to the triggering and maintenance of the compound hot-dry events in NA. Hovmöller diagrams and line plots of daily data show the composites of anomalous z500, SSHF, SLHF and u250 (Fig. 6) for the 19 high-FA events, from 60 d before the compound hot-dry events, to 30 d after. Positive z500 anomalies are already present over western NA 60 d before the composite event (Fig. 6a). This initial ridge-like signal becomes unorganized as negative anomalies interrupt the regional pattern 50 d before the events. Positive anomalies re-emerge around 35 d before and form a persistent precursor through the final antecedent weeks and the beginning of the event. During the first part of the event, the anomaly remains within a similar longitude range while progressively changing in amplitude and spatial extent, indicating there is a persistent and slowly evolving atmospheric ridge. Towards the end of the event, the positive anomaly weakens due to a wave train that starts before the event upstream the region. The ridge structure becomes less pronounced, while the whole structure start smoving to the east after the termination of the event. The u250 latitude-time composite shows the evolution of the upper-level zonal flow over the NA region (Fig. 6b). Before the event, positive u250 anomalies occur at higher midlatitudes and southwards the region, while negative anomalies are present to the north of the NA region, indicating a northward displacement of the westerly jet stream, and enhanced subtropical flow. During the event, the zonal wind anomalies become less organized, indicating a disruption of the jet stream, which together with the positive anomalies of z500 suggest a redistribution of the upper-level flow around the ridge, compatible with a displaced jet configuration.
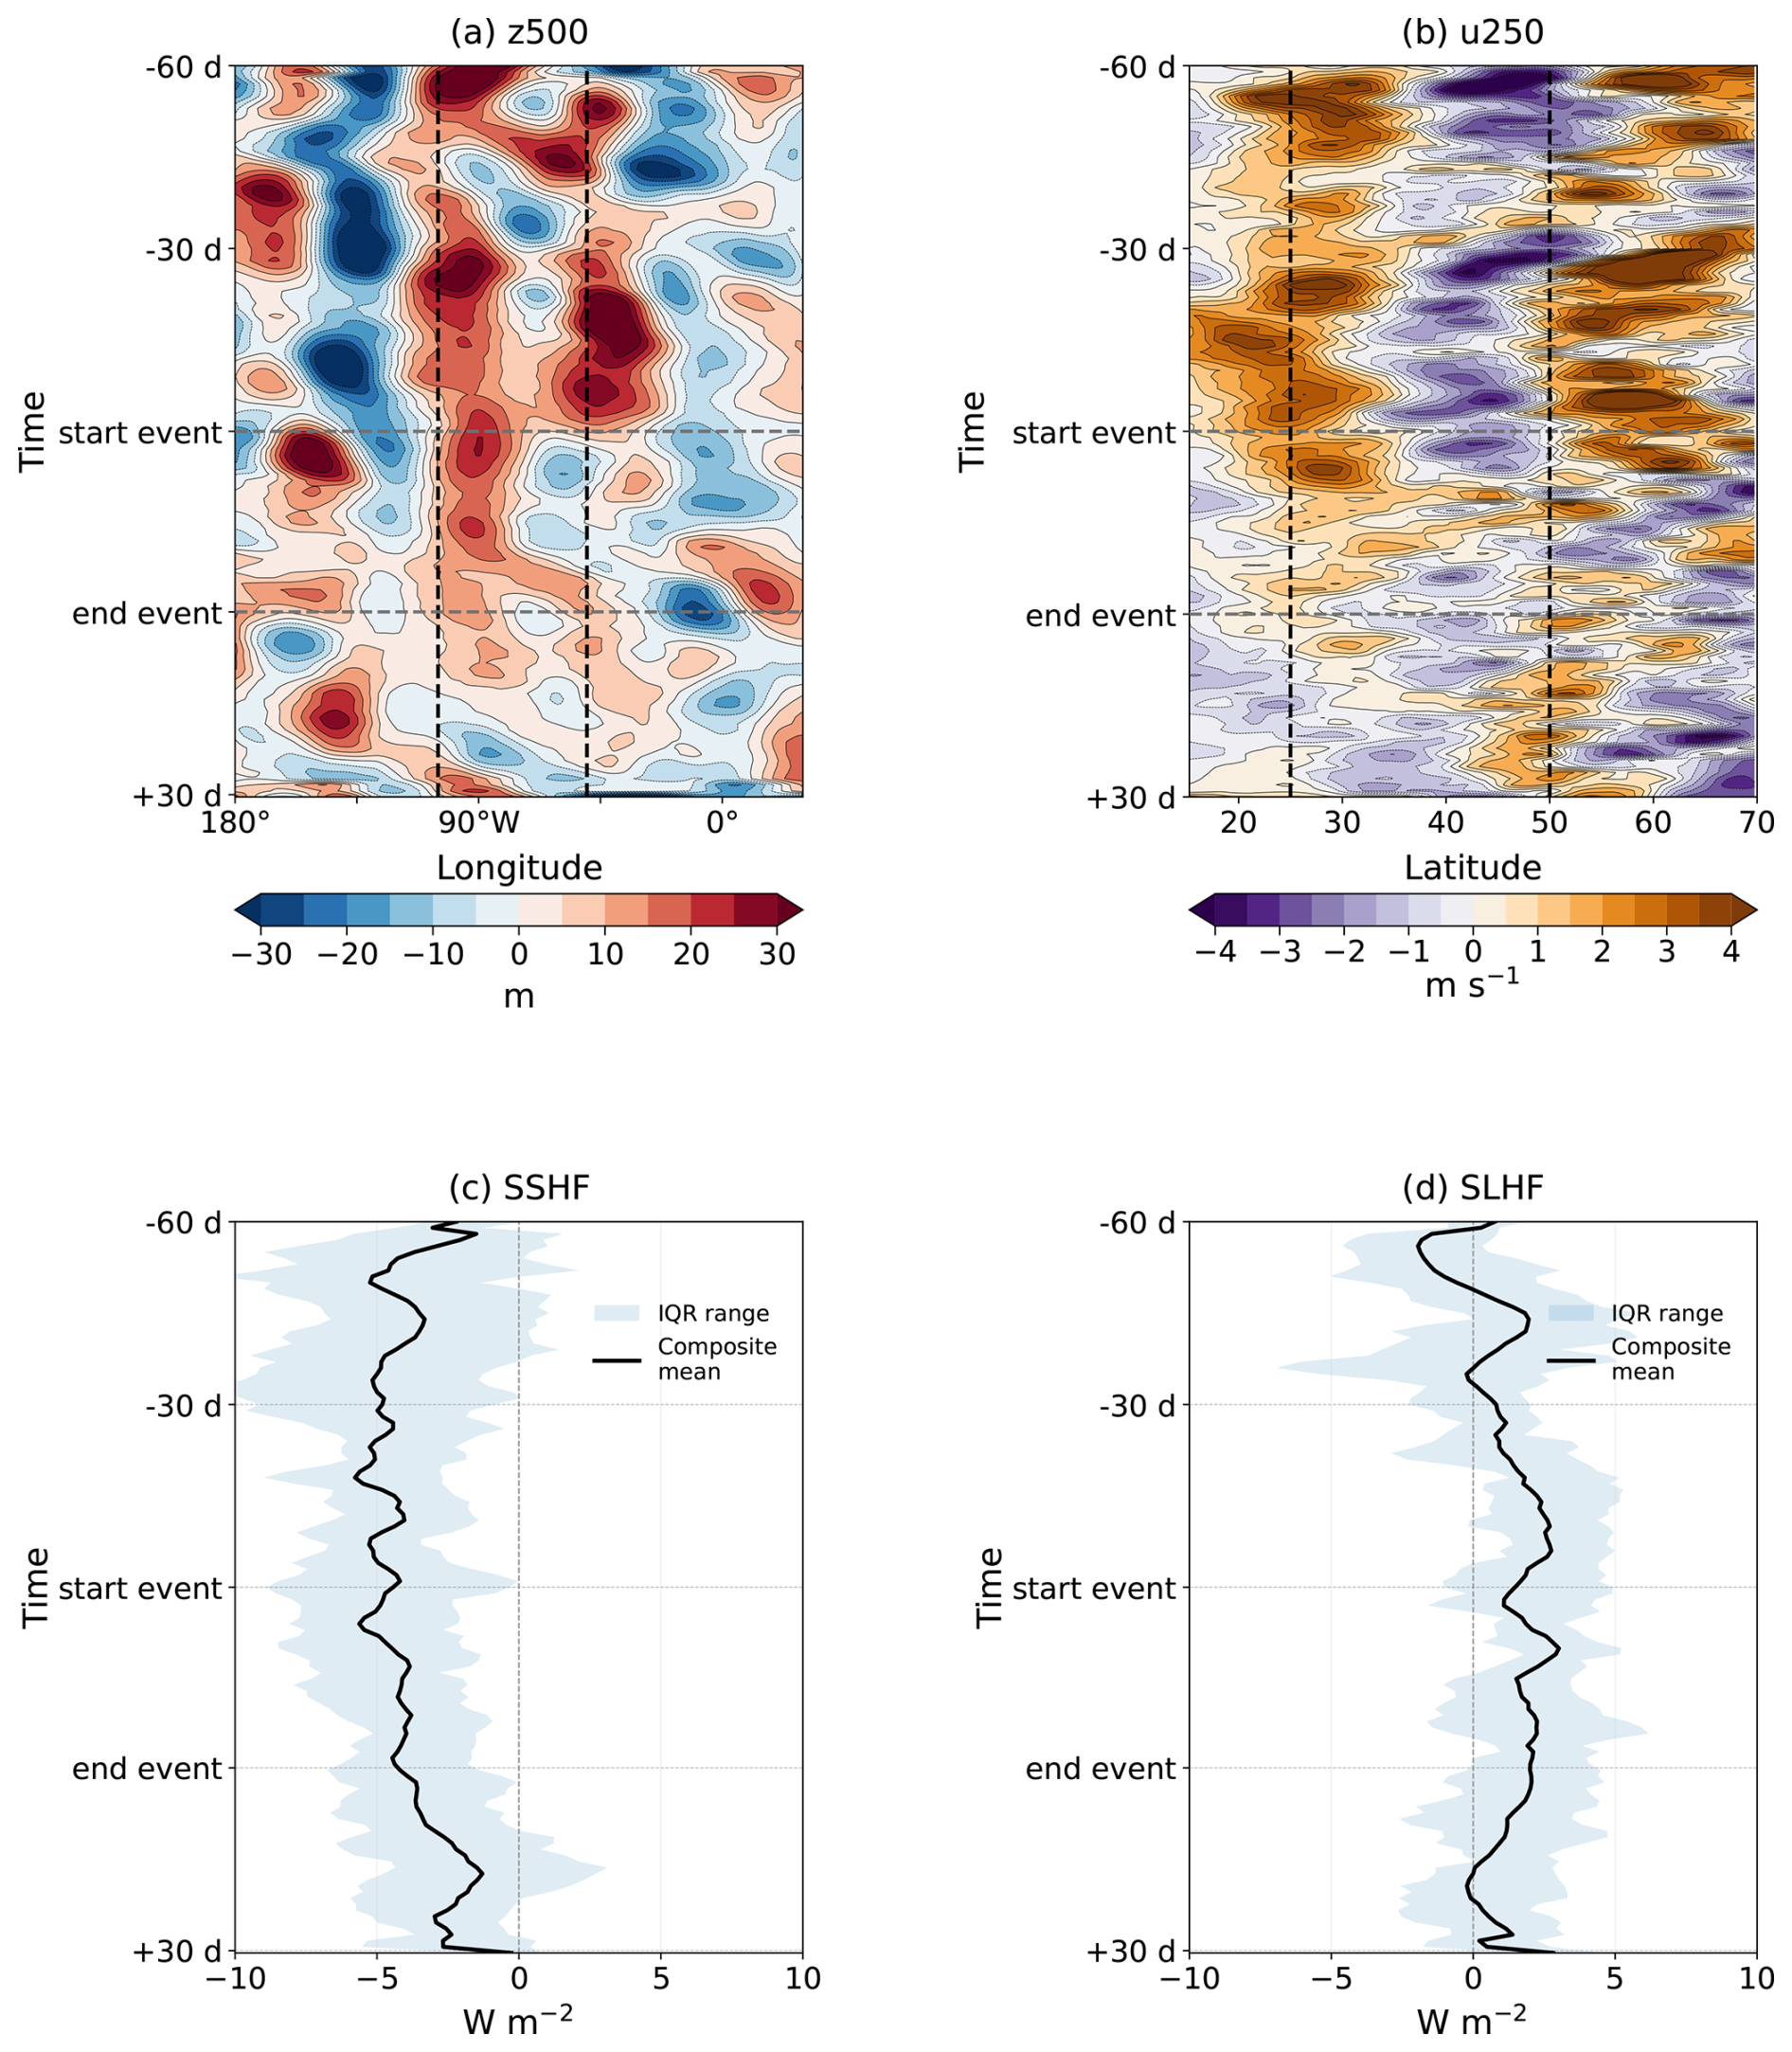
Figure 6Composites of the daily evolution of the atmospheric circulation variables and surface heat fluxes associated with the 19 high FA events in North America. For each event and variable, daily anomalies are calculated by removing the corresponding daily climatology and filtered using a 7 d centered running mean. The event windows were aligned on a common event-centered time axis and subsequently composited across the 19 events. (a) Time-longitude Hövmoller diagram of daily 500 hPa geopotential height (z500) anomalies averaged over 37.5–57.5° N. (b) Time-latitude Hövmoller diagram of daily 250 hPa zonal wind (u250) anomalies averaged over 110–45° W. (c) Surface sensible heat flux (SSHF) and in (d) surface latent heat flux (SLHF) anomalies regionally averaged over North America, with the shaded area indicating the interquartile range across the 19 events. Horizontal dashed grey lines indicate the beginning and end of the event in all panels. In panels (a, b), the vertical black dashed lines indicate, respectively, the longitudinal and latitudinal boundaries of the NA region.
Negative SSHF anomalies are already present before the event and persist throughout the event, indicating enhanced upward sensible heat transfer from the surface to the atmosphere (Fig. 6c). At the start of the event there is a pick which then decreases through the event. The SLHF composite shows there is a pick around 40 d before the event which then decreases due to the disorganization of the first ridge (Fig. 6d and a). Afterwards the surface response develops again at the start of the event and becomes more pronounced after the formation of the circulation anomaly (Fig. 6d). The positive SLHF anomalies indicate a reduction in upward latent heat flux (according to ERA5 convention positive-downward) and are associated with suppressed evaporation and reduced evaporative cooling. The time span of SLHF anomalies is consistent with the anomalously low SPI3 observed (by construction) during the event. Together, these anomalies indicate a redistribution of surface energy from latent toward sensible heating. Their timing suggest that enhanced sensible heating may contribute to the event preconditioning and maintenance, while reduced evaporative cooling reinforces the hot and dry conditions after their onset.
3.3 COHDEs and associated large circulation patterns in EM region
The large circulation patterns associated with the high FA events in the EM region are displayed in Fig. 7. In the eastern of this region there are some hot spots, showing up to 5 COHDEs during these high FA events (Fig. 7a). It is worth noting that COHDEs frequencies are also observed in central North America, indicating that the two regions are affected by synchronous high FA events, as shown in Fig. A4. There are 3 events out of 19 that were spatially compounding: July 2006, July 2012, and August 2012 (Fig. A4). The high FA events are associated with positive anomalies of temperature of >3 °C (Fig. 7b) and negative anomalies of precipitation of up to in the eastern side of this region (Fig. 7c).
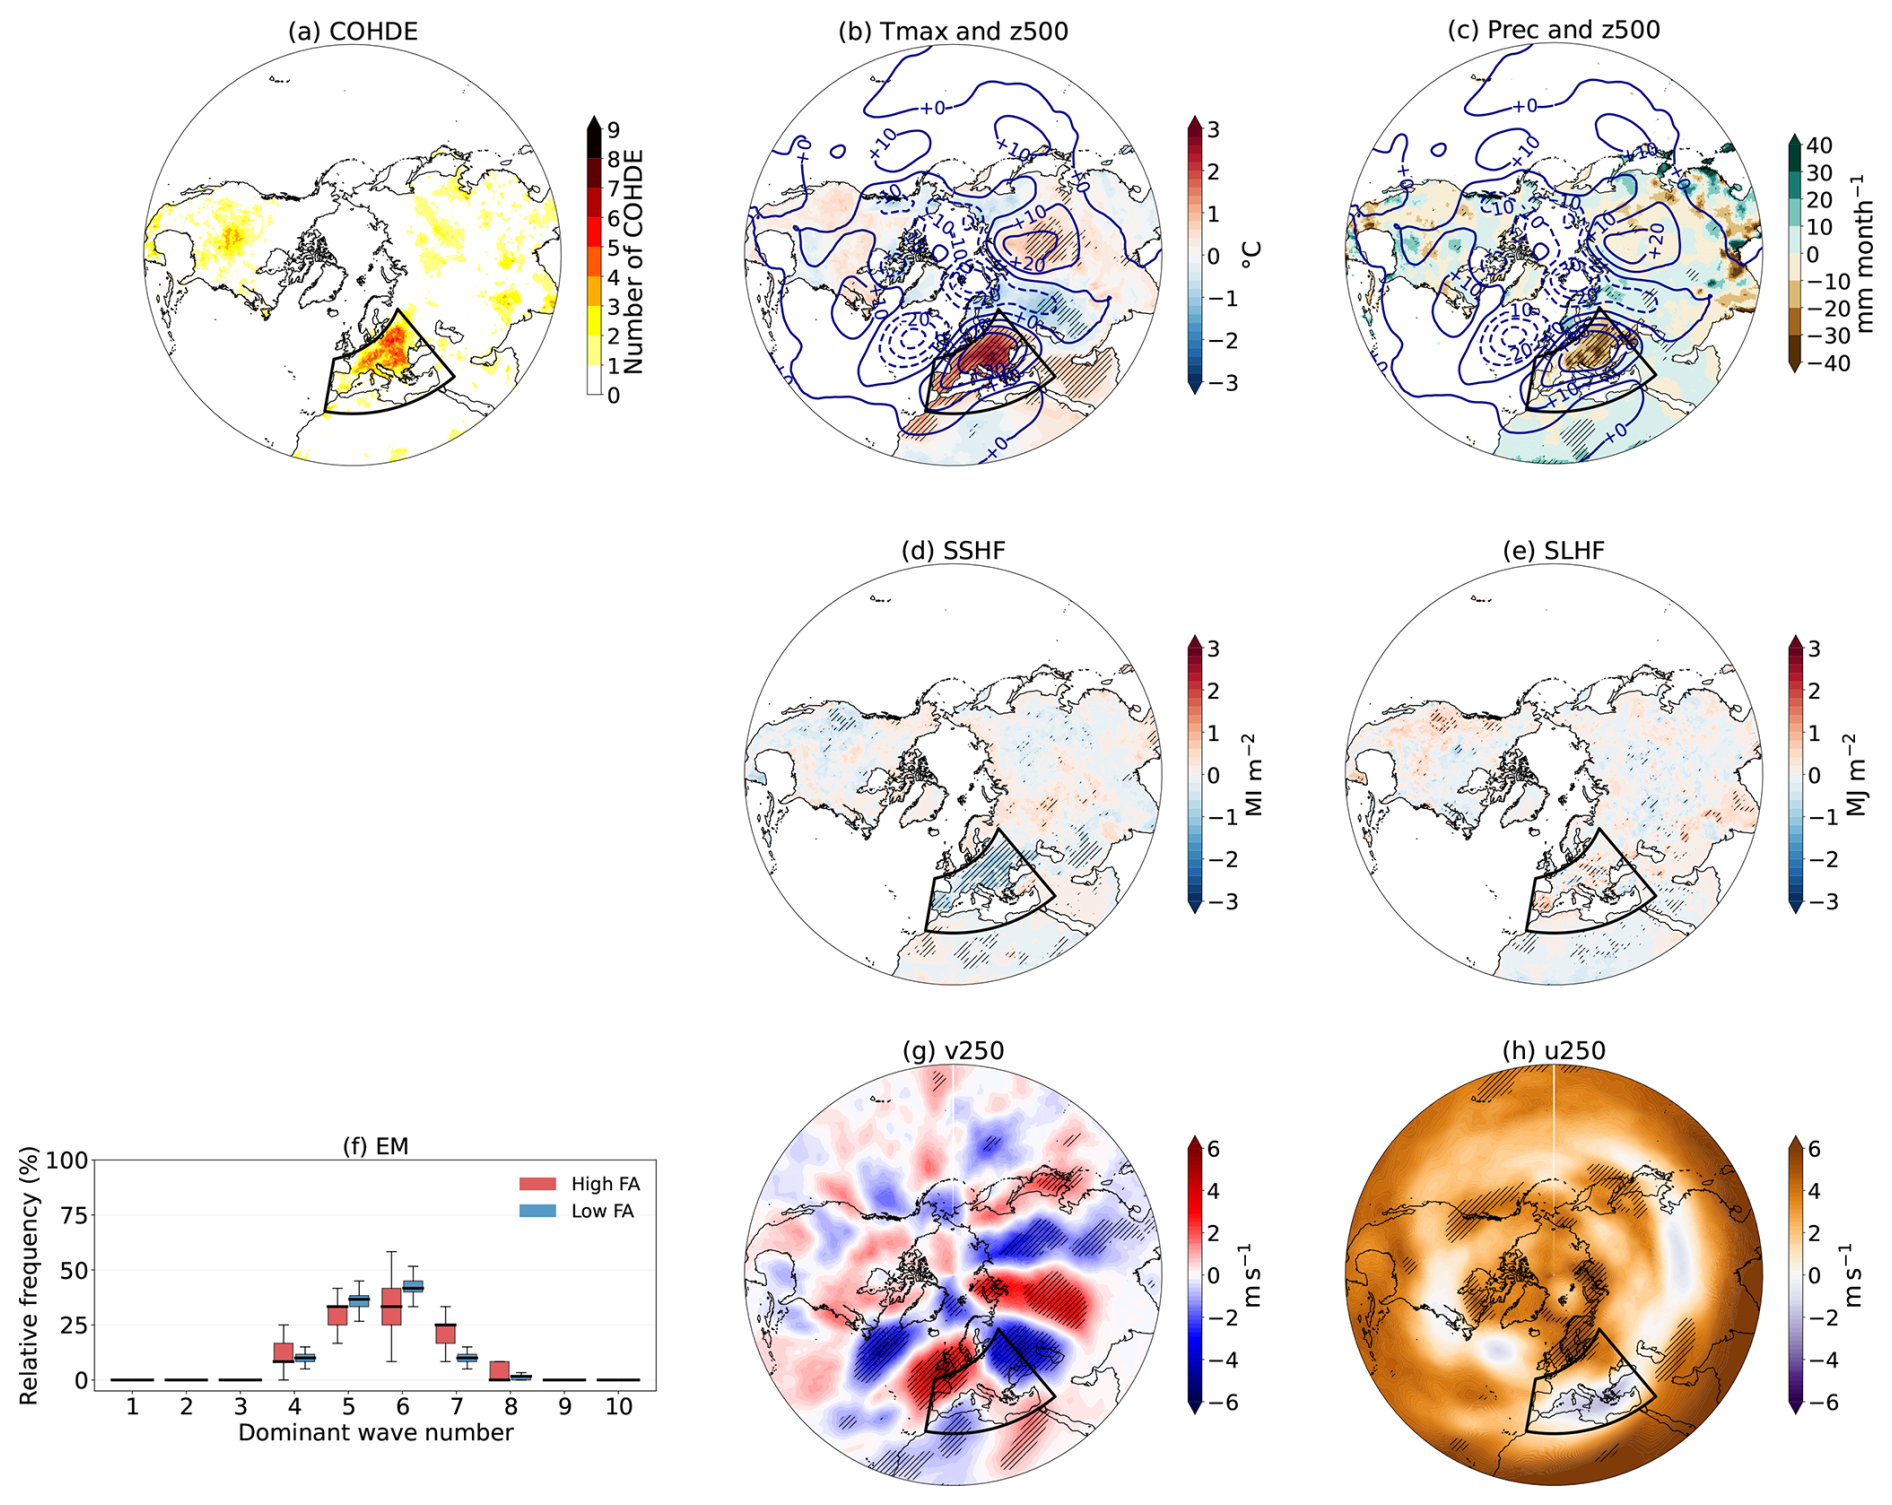
Figure 7Same as Fig. 5 but for high FA events in the Euro-Mediterranean (EM) region, highlighted by the black contours.
In the EM region, the coupling between atmospheric circulation and surface fluxes is also evident although less pronounced than in NA. Positive anomalies of z500 favour subsidence and enhance surface warming, which manifests as upward SSHF (negative SSHF anomalies; Fig. 7d). The precipitation deficits to the east of the region limit moisture availability, suppressing evaporative cooling. This reduction in latent heat loss is visible as positive anomalies statistically significant in SLHF (Fig. 7e), in areas where COHDEs hotpots emerge (eastern side). However, these SLHF anomalies are weaker than over North America. This difference may partly reflect the heterogeneous hydroclimatic conditions of the Euro-Mediterranean region, including the influence from the Mediterranean Sea. Previous work has identified the Mediterranean as a transitional climate region in which summer evapotranspiration is constrained by soil-moisture availability (Materia et al., 2022).
In the upper-level atmosphere, the Rossby wave pattern is dominant in the z500 (Figs. A2h and 7b) and v250 (Fig. 7g) composites. The v250 (Fig. 7g) show a meandering structure with positive values in the northwest of this region, which is consistent with the behavior in lower levels of the atmosphere (z500 and the compound events in Fig. 7a) and contributes to the installation of the circulation that drives more heat and less precipitation than normal (Fig. 7c). The anticyclonic circulation anomaly (z500) is linked to the northward shift of the jet in u250 (Fig. 7h) which deflects Atlantic storms from Europe. During high FA events wavenumber 6 is the most frequent in the distribution and wavenumber 7 shows twice its frequency than low FA events (Fig. 7f), although the Rossby wave pattern is not circumglobal and limited to the North Atlantic-Eurasian sector.
The daily composites show a transition from irregular z500 anomalies to a pronounced European ridge configuration near the event onset (Fig. 8a). Positive z500 anomalies become more organized over the region around 25 d before the event, and a wave train emerging around 30 d before intensifies the amplification of a through to the west of EM that help to strength the regional ridge. This ridge eventually weakens and starts moving eastward at the termination of the event (Fig. 8a). The evolution of the z500 anomalies indicates a slowdown of a transient westerly wave-like circulation pattern, which evolve in a quasi-stationary ridge above EM during the event. The ridge amplification is accompanied by weaker upper-level westerlies within the central EM latitude band before the event onset, and stronger flow north and southwards (Fig. 8b) the region. This separation of the anomalous westerlies suggests a possible split jet configuration. The surface heat fluxes evolve consistently with the development of the hot and dry conditions. As the ridge strengthens near the events start, the already negative SSHF anomalies become more negative during the first part of the events, indicating enhanced sensible heating (Fig. 8c). In contrast, the regional SLHF composite show positive values 35 d before the event, which then decrease 20 d before and increase again at the start and through the event (Fig. 8d), consistently with anomalously low SPI3 values. This indicates a reduction in the upward latent heat flux and weaker evaporative cooling within the EM region due to the persistence of the atmospheric ridge. However, the positive SLHF anomalies associated with EM events are less robust with respect to those observed for the NA events.
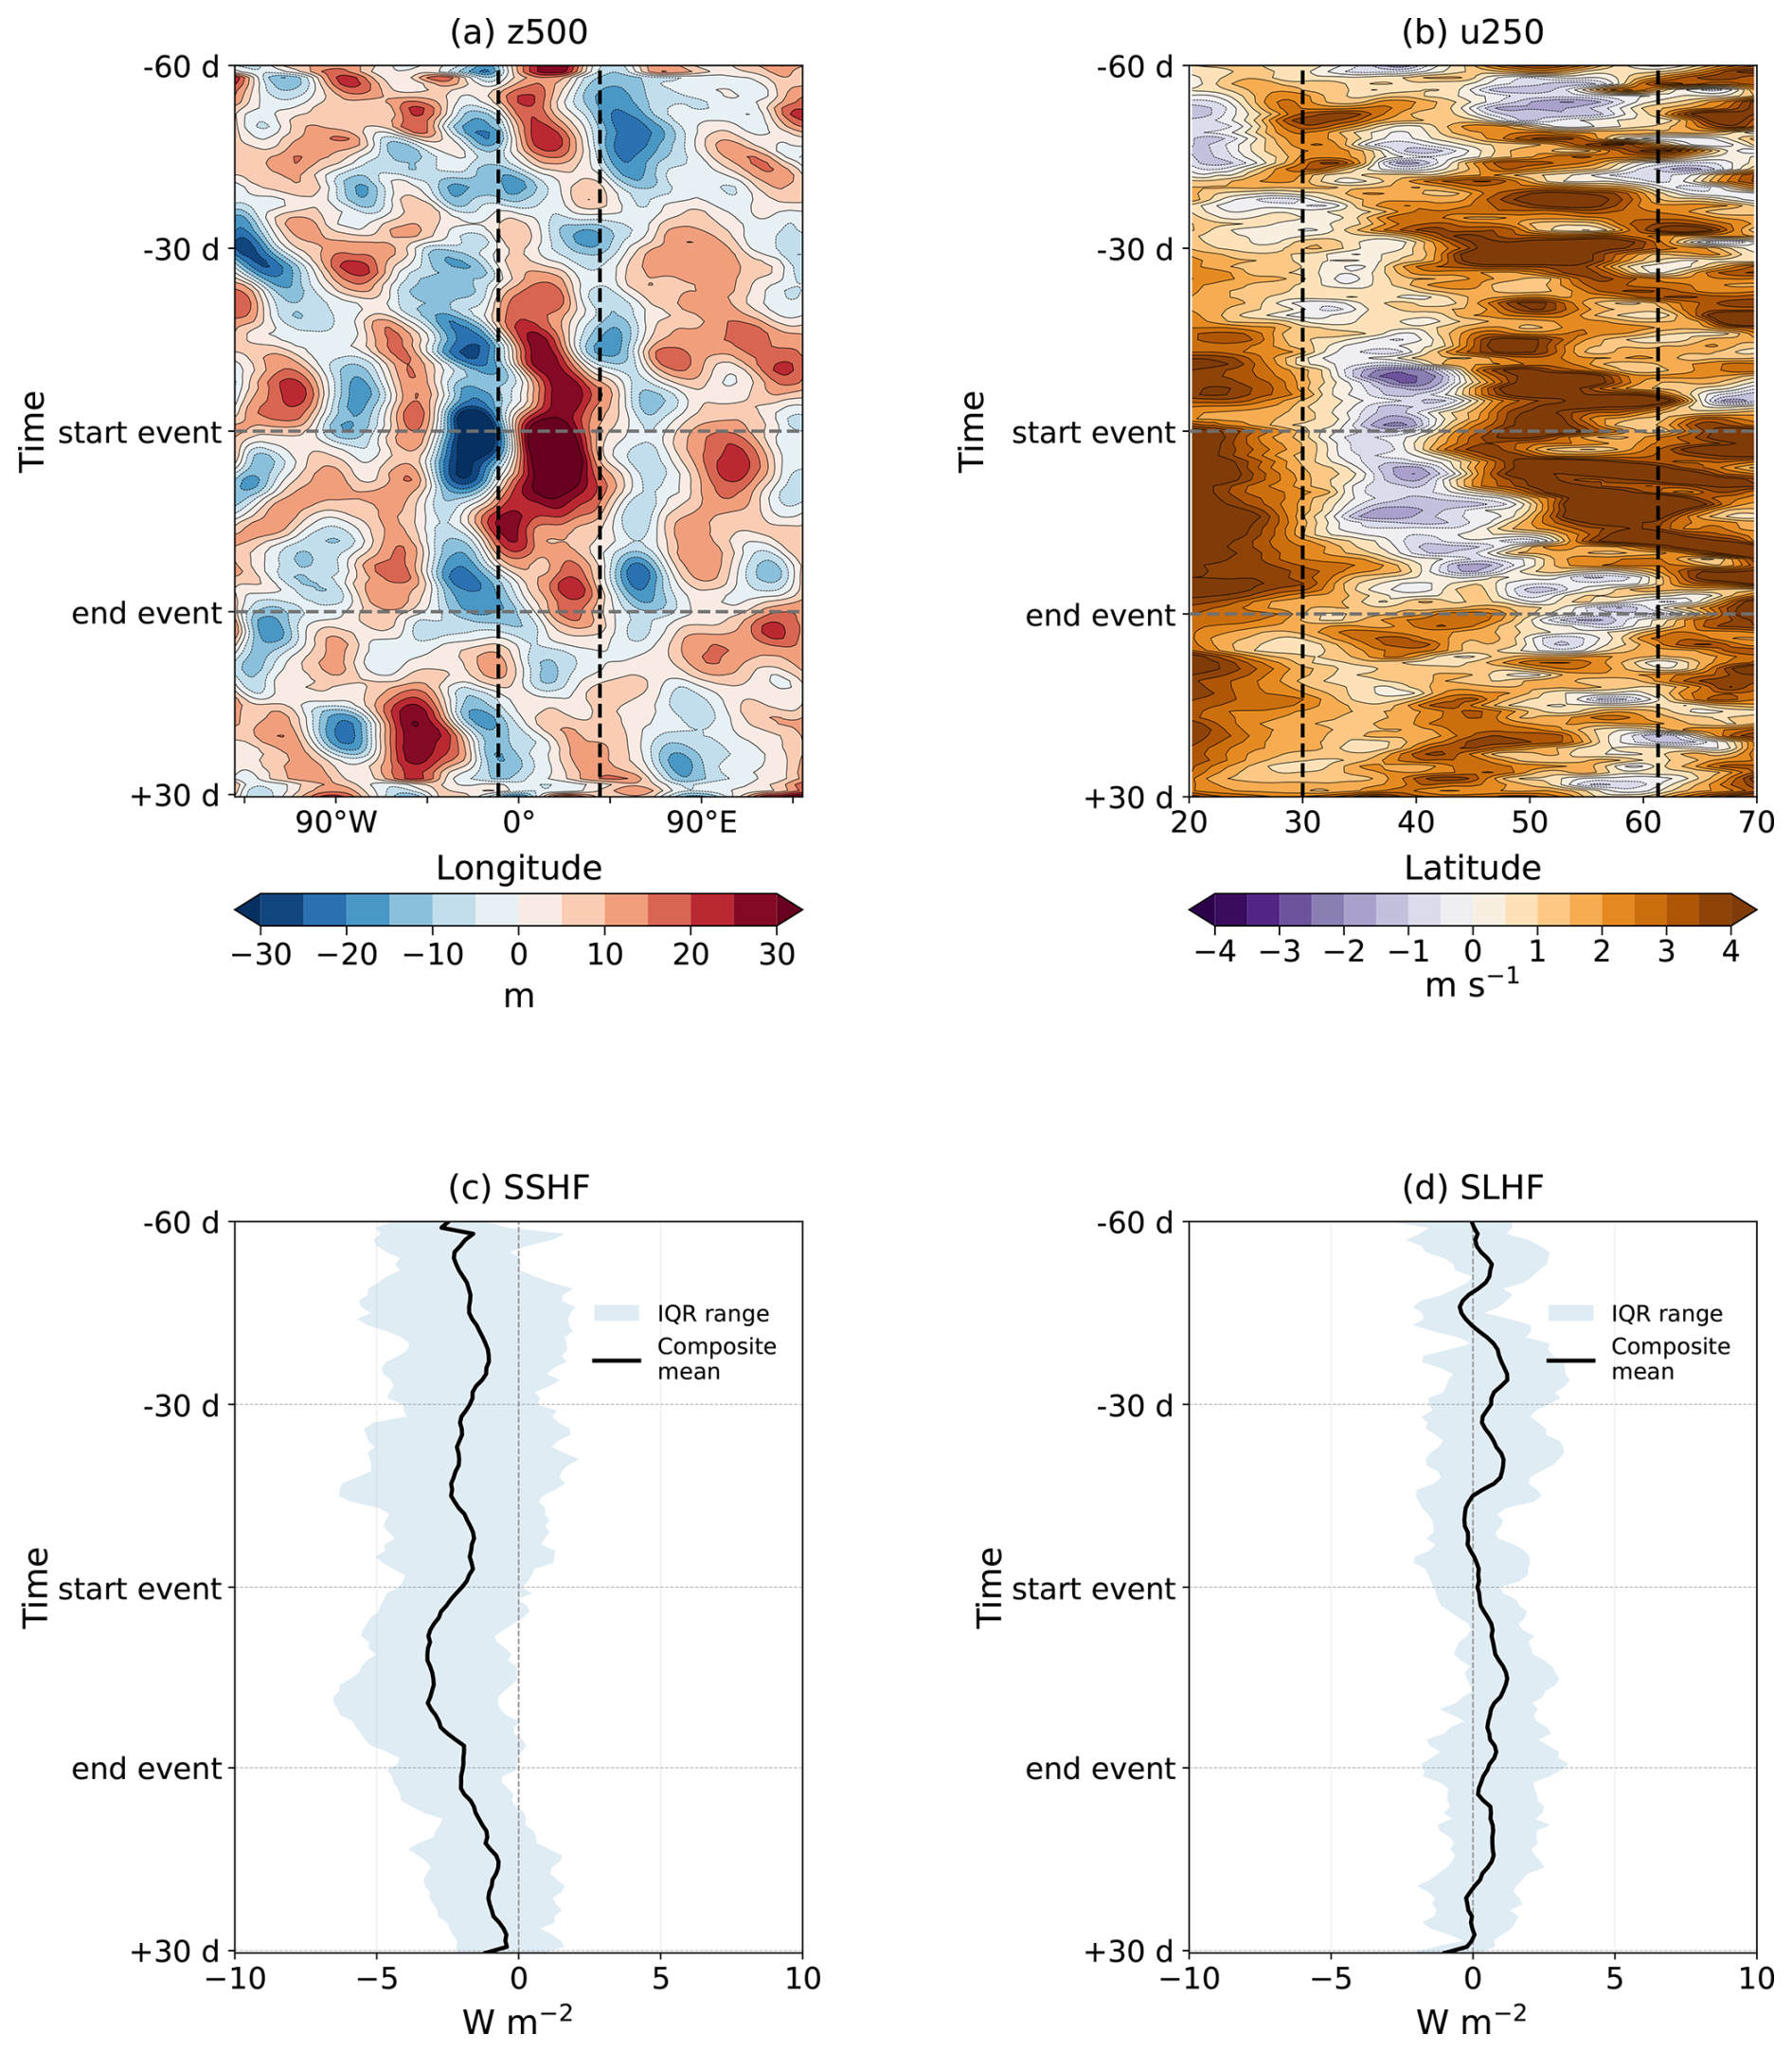
Figure 8Same as Fig. 6 but for EM. In (b), 250 hPa zonal wind anomalies were averaged over 20° W–45° E.
This indicates that the events in EM are associated with the development and persistence of a mid-tropospheric ridge from a westerly disturbance, consistent with the observed hot conditions, while the northward displacement of the jet stream leads to a precipitation deficit. The feedback triggered by the reduction in the evaporative cooling contributes to maintaining the surface heat and dryness during the event. However, the limited amplitude of the SLHF negative anomalies, likely due to the availability of moisture from the Mediterranean Sea, indicates that the temperature-evaporation feedback is less efficient, explaining the lower frequency in the EM events with respect to NA.
3.4 COHDEs and associated large circulation patterns in AS region
The composites associated to high FA events in the AS region show maximum values of COHDEs (up to 5) in the central continental region (Fig. 9a), linked with positive temperature anomalies of up to 1.5 °C (Fig. 9b) and with negative precipitation anomalies of (Fig. 9c). Furthermore, there are two events that are spatially compounding between AS and EM regions: June and July of 2000 (Fig. A4).
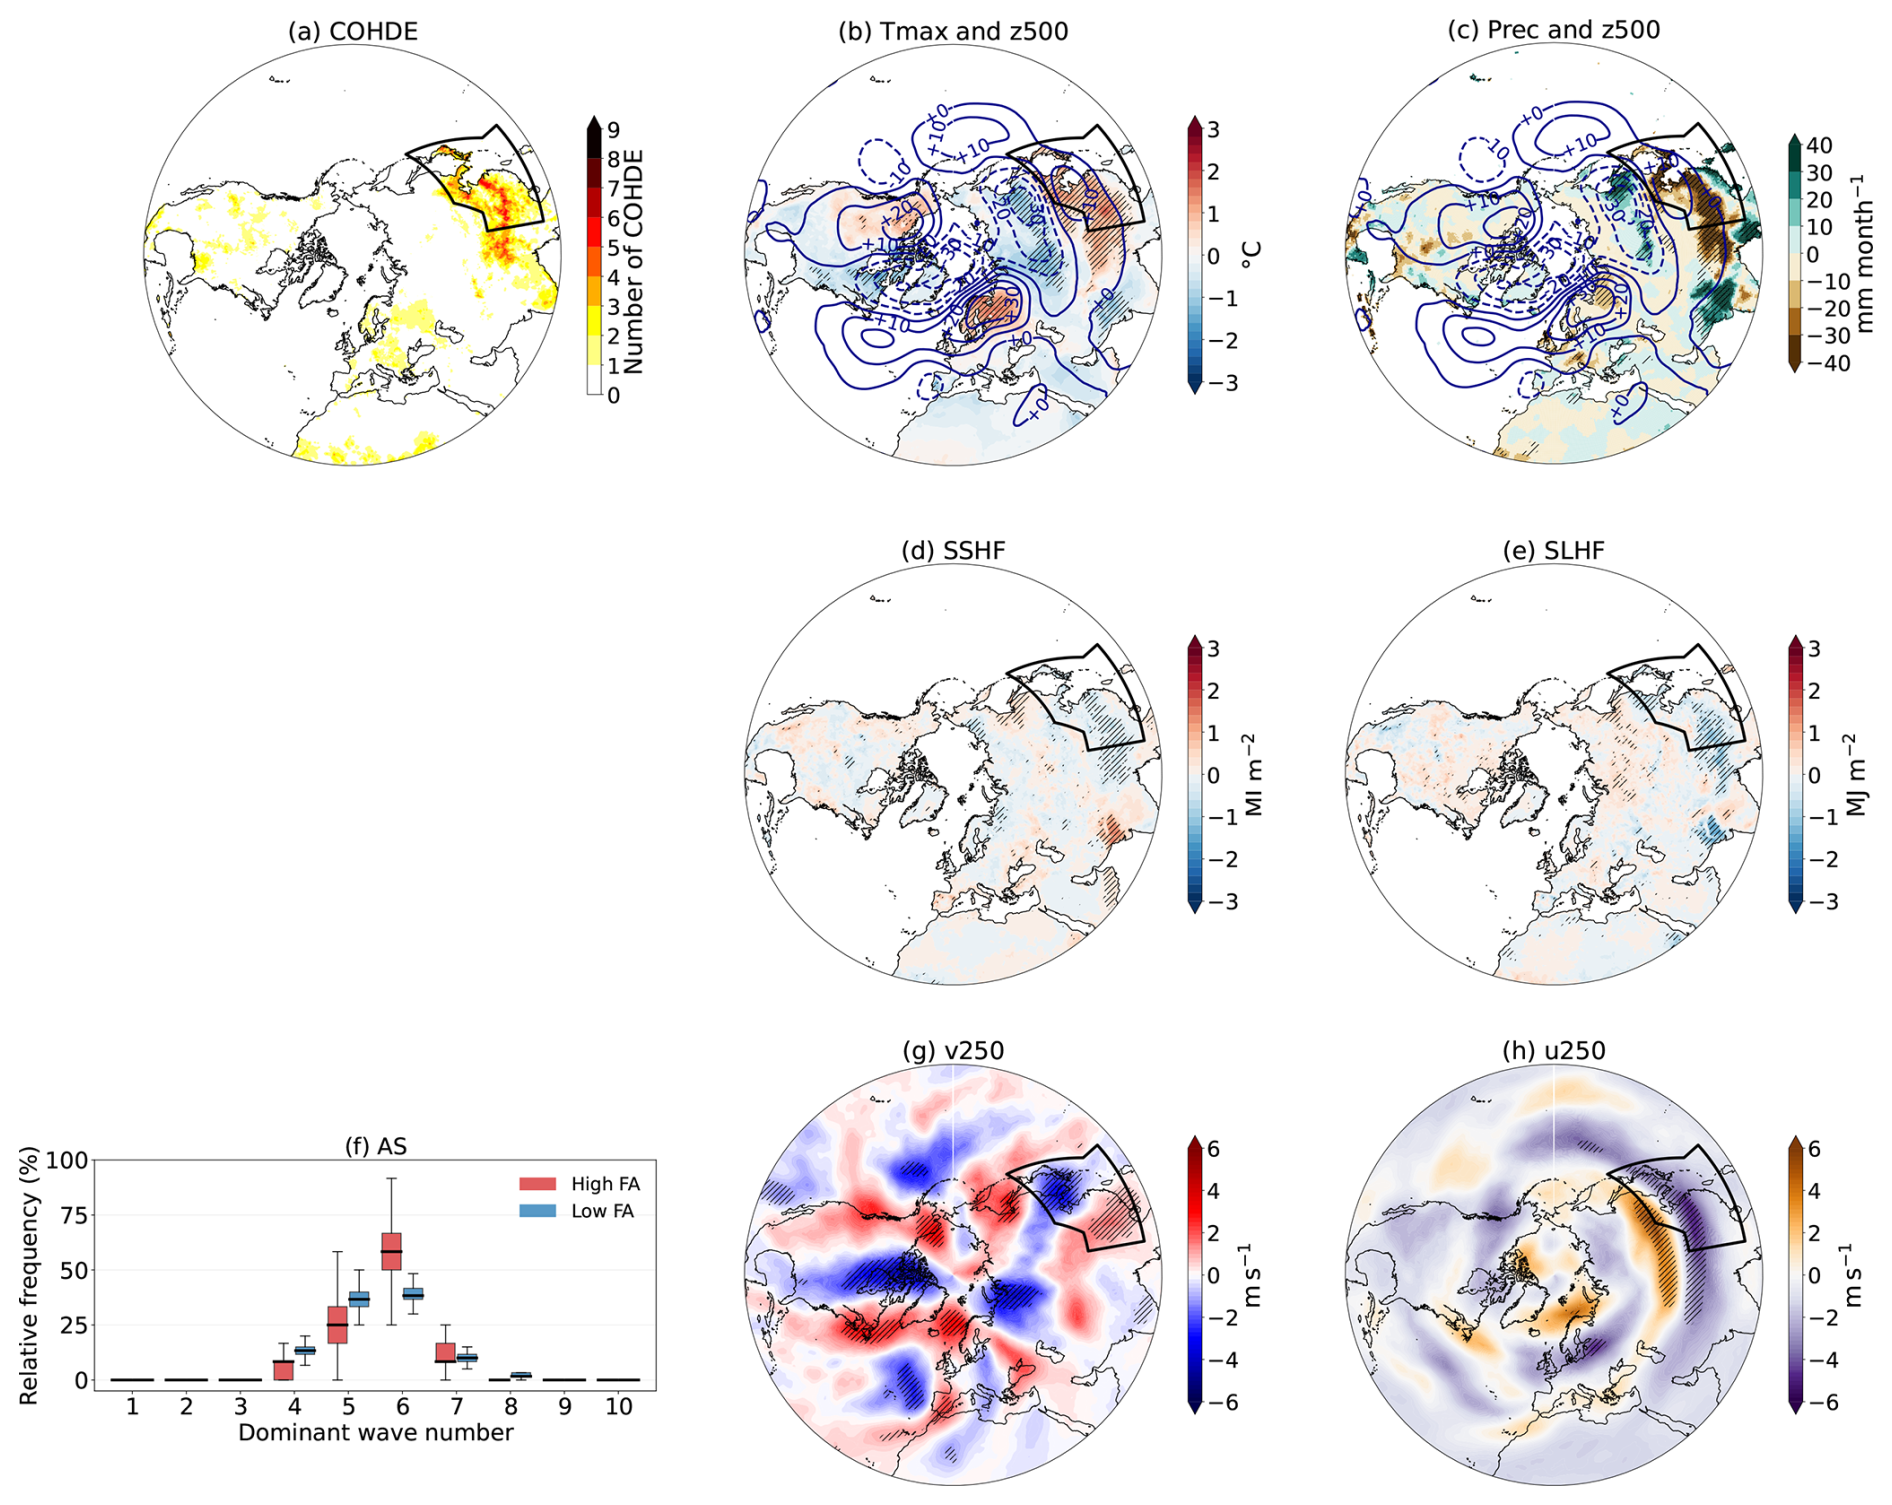
Figure 9Same as Fig. 7 but for high FA events in the Eastern Asia (AS) region, highlighted by the black contours.
The negative anomalies of SSHF (Fig. 9d) indicate an upward transfer of heat from the surface to the atmosphere, although these anomalies are weaker with respect the NA and EM regions. The negative anomalies of latent-heat flux (Fig. 9e) imply that, despite the negative precipitation anomalies, evaporation is enhanced by the surface warming, likely in association with the large humidity available in this monsoonal region. This suggests that, in AS, part of the additional energy provided to the surface during high FA events is dissipated through evaporation westwards this region, limiting the dominance of sensible heating.
The upper atmosphere exhibits a well-structured meander and circumglobal Rossby wave pattern (Figs. 9b, f, g and A2i), along with zonal wind anomalies indicating a northward displacement of the jetstream (Fig. 9h).
The z500 reaches values up to 20 m above normal conditions in the north of the AS region (Figs. 9b, c and A2i), while the v250 forms a dipole with positive statistically significant values in the southwest and negative anomalies in the northeast of this region (Fig. 9g). Relative to the climatological v250 structure, this dipole shows an opposite sign and is consistent with enhanced anticyclonic circulation around the strengthened ridge. The strong jet displaced northwards, together with a meandering upper-level flow, is evident in u250 and v250 (Fig. 9h and g) and contributes to storms deflection. The wave-6 pattern, which is the most frequent during these events (Fig. 9f), is associated with installation of blocking-like conditions over the region (Figs. 9b, c and A2i). Furthermore, a chi-squared test at 95 % level of confidence indicates that, the frequencies observed during high FA events are significantly different from the frequencies expected during low FA events. In particular, high FA events are associated with wavenumber 6 in AS.
The daily composites of z500 show circulation changes west and east of the region 60 d before the composite events (Fig. 10a). During this period, positive and negative z500 anomalies alternate over Eurasia, west of the AS boundary, while stronger anomalies develop downstream over the Pacific. Through the event onset, negative anomalies are shown within the AS region while a positive anomaly forms outside the region during the last days and towards the end of the event. At the same time, the v250 daily circulation anomalies display a westerly disturbance transiting above the region (not shown) without resulting in any stationary ridging (Fig. 10a). This indicates that the mid-latitude Rossby-wave dynamics has limited effect on the occurrence of hot and dry events in AS. However, a sensitive analysis using a lower latitude band (25–45° N) reveals positive z500 anomalies before, during and after the event month within the region. This indicates that the main positive anomalies are located southwards and that the common midlatitude average captures its northern side. The anomaly evolves through time and is less continuous than the ridges identified for NA and EM, which suggests a more transient circulation configuration. The u250 composite shows weak positive anomalies within and northwards the region 60 d prior to the event (Fig. 10b). Afterwards, the positive anomalies within the region decrease and a stationary dipole is observed during the event, indicating weakened upper-level westerlies over central and southern AS and a stronger flow to the north, respectively. Those anomalies are consistent with a northward displacement of the subtropical jet stream. The displacement of the jet stream results in anticyclonic circulation over the southern part of the region leading the weak negative SSHF anomalies 60 d before, which then become more negative throughout most of the event (Fig. 10c). This indicates a slight enhancement of upward sensible heat transfer from surface to the atmosphere. Negative SLHF anomalies occur in episodes from 60 d before and through the event (Fig. 10d), indicating enhanced upward latent heat flux and evaporative cooling which may buffer the surface warming. In this non-water-limited monsoonal region, a precipitation deficit does not necessarily imply a depletion of soil moisture, and evaporation may be maintained under high atmospheric evaporative demand while soil moisture is still available. In addition, the spatial heterogeneity of eastern Asia, and the averaging of SLHF across the full region may obscure contrasting responses between grid cells affected and unaffected by compound events. This is supported by the broad interquartile range, particularly for SLHF, indicating large variability among the individual events.
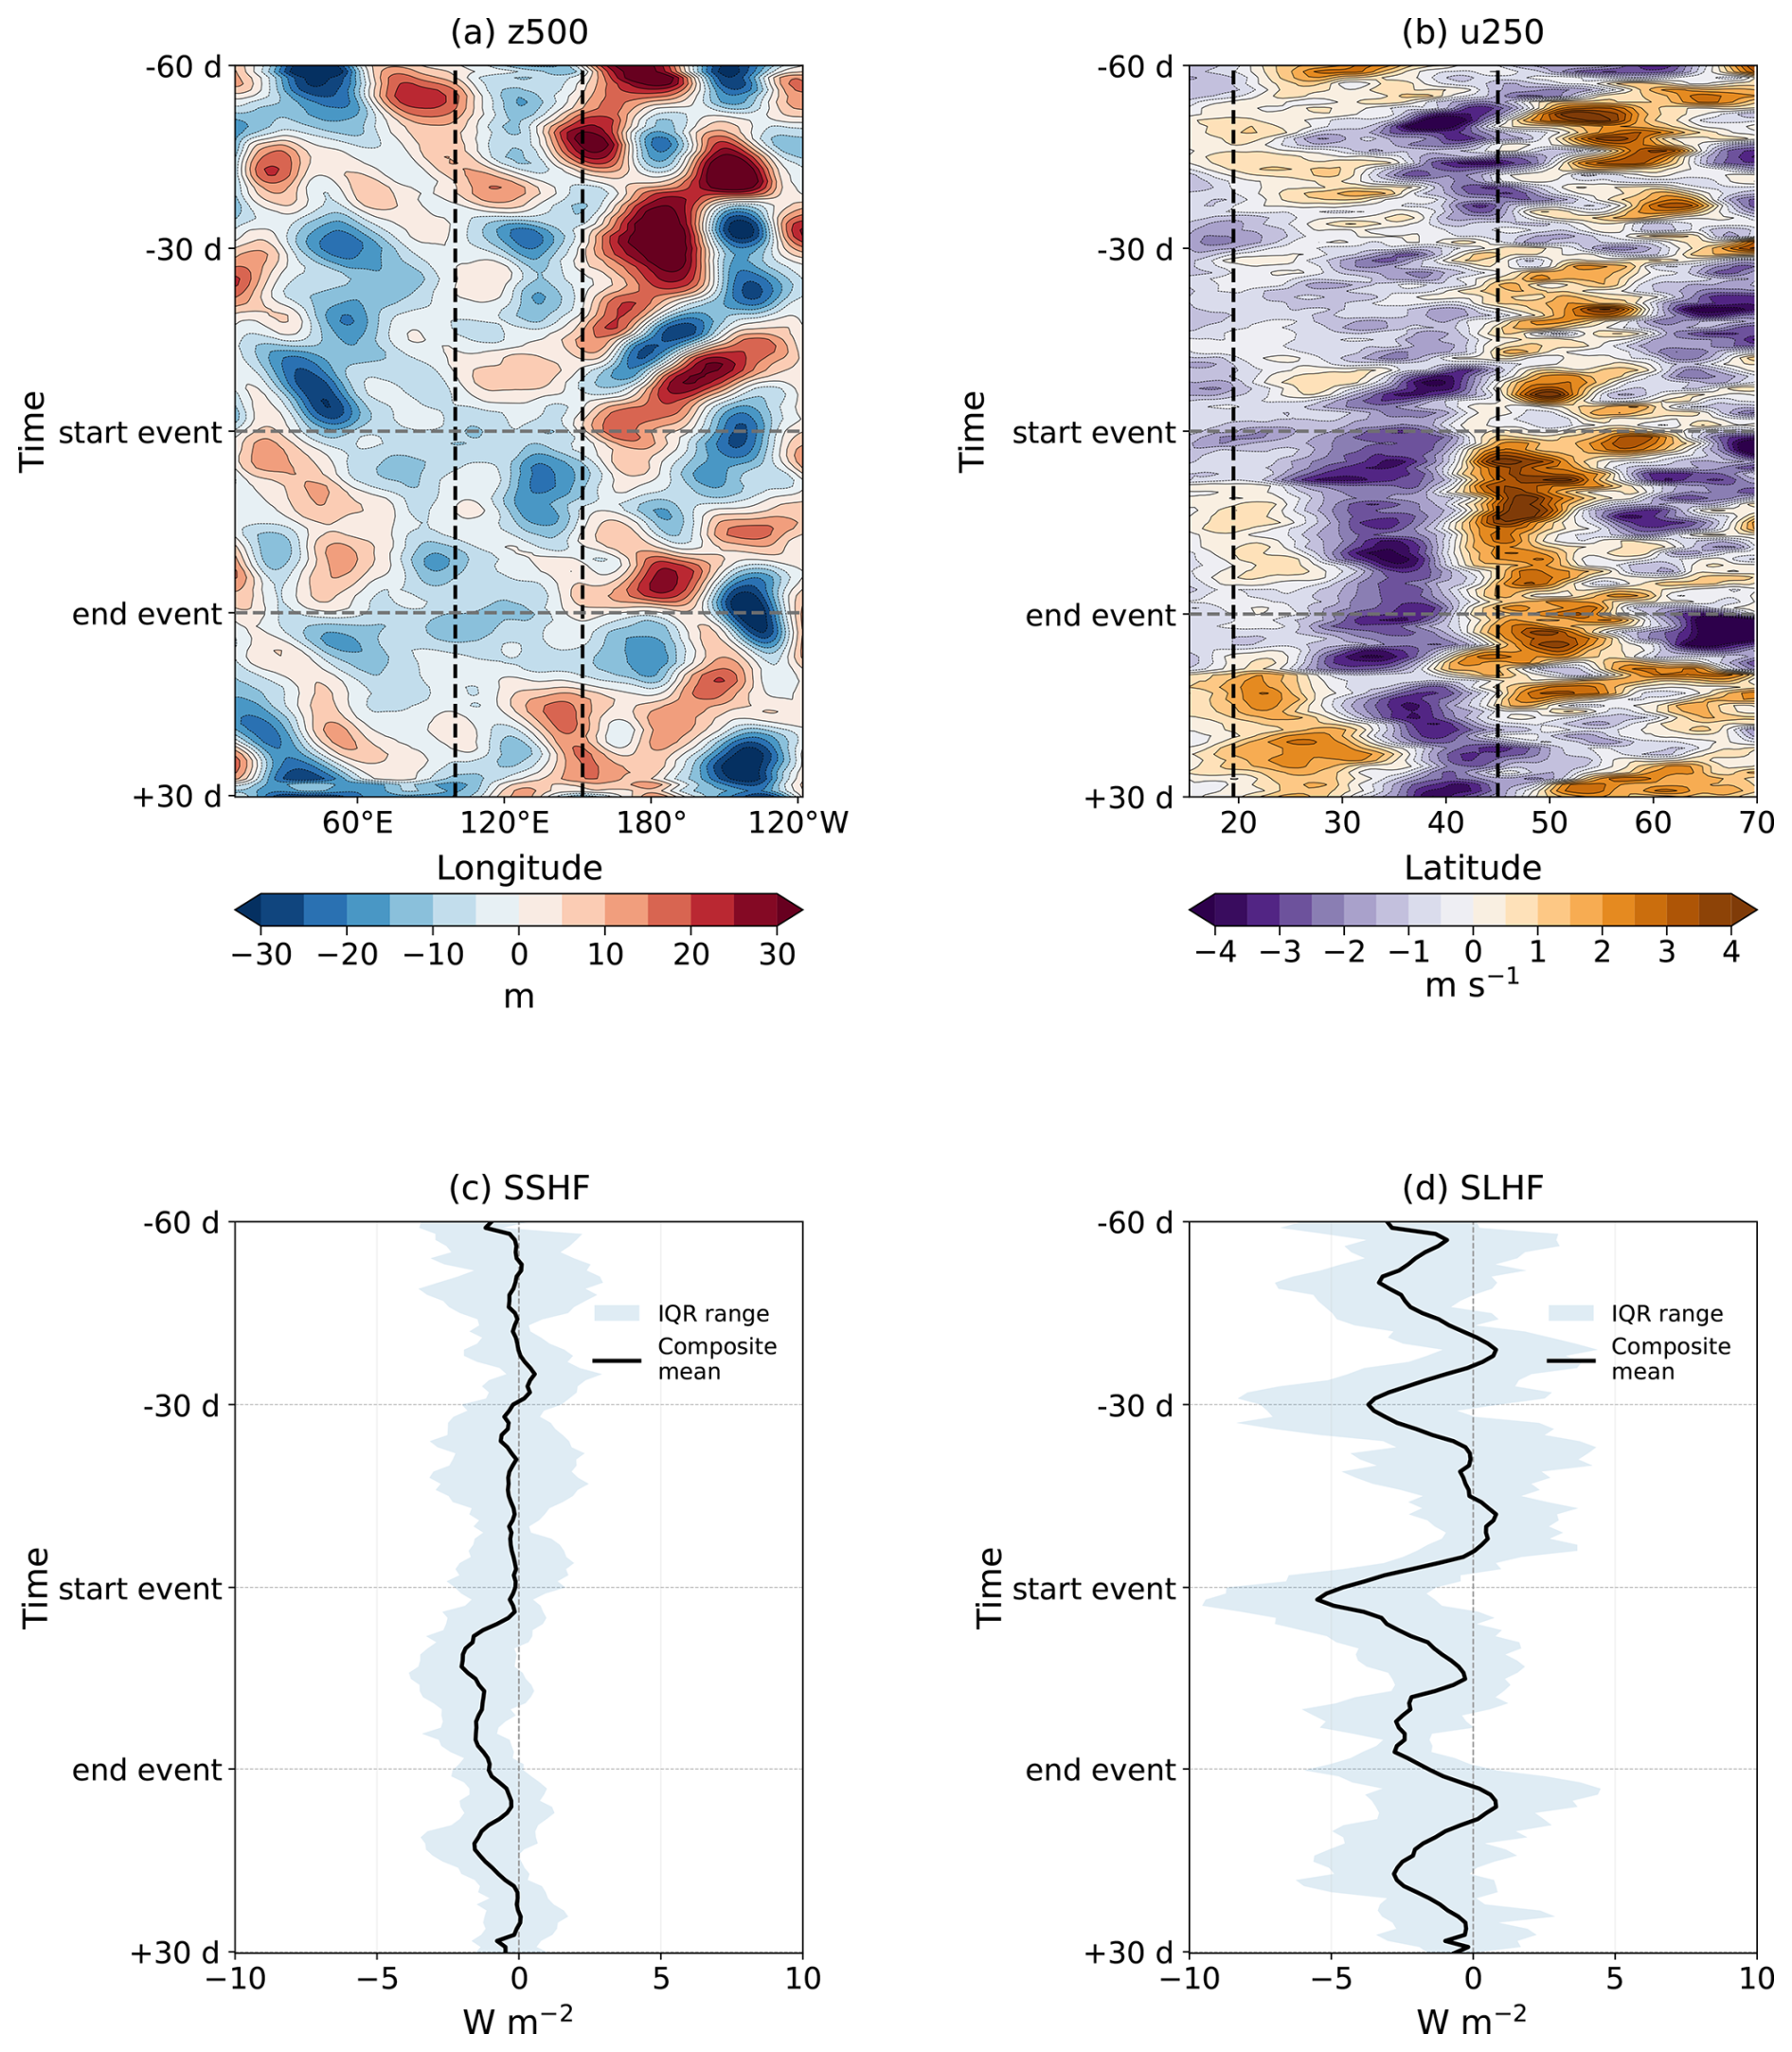
Figure 10Same as Fig. 6 but for AS. In (b), 250 hPa zonal wind anomalies were averaged over 95-160° E.
These results suggest that the high FA compound hot dry events in AS are associated with a transient, southward centred anticyclonic circulation resulting from the northward displacement of the subtropical jet stream. Due to the moisture availability in the region the evaporative cooling is more effective than in NA and the EM, leading to less frequent events associated with weaker temperature anomalies.
We analyse the Compound Occurrence of Hot and Dry Events during boreal summer (June–July–August) from 1960–2020 across three Northern Hemisphere breadbasket regions. We also identified the large circulation patterns associated with events characterised by high fraction of area affected by these compound events.
We find that high fraction of area events have been occurring in the three breadbasket regions and in the Northern Hemisphere across the whole analyzed period. This aligns with previous studies that, using different compound event definitions, found these events in decades earlier than the 1990s, for example over Europe during the 1950s (Ionita et al., 2021) and over global land areas during the 1960s (Feng et al., 2020). Moreover, we find that the fraction of area with compound hot and dry events is, on average, larger in the three breadbasket regions than in the Northern Hemisphere. Previous research found high frequency of compound hot and dry extremes over land areas (Hao et al., 2022), especially in Europe (Böhnisch et al., 2025; Felsche et al., 2024) and East Asia (Hao et al., 2022) using a different methodology to identify these concurrent extremes. Since these regions are a maize, soybean and rice hot spots, such compounds can potentially lead to failures in these crops.
Given that our methodology defines thresholds using a shifting 30 year reference period, univariate trends in temperature and precipitation are removed. The limited reanalysis and observational record (61 years) constrains the number of large areas with compound hot and dry events available for analysis. The sample size does not alter our findings that compound hot and dry events recur throughout the record and are not confined to recent decades, indicating that they represent a persistent feature of the historical climate in the studied regions. Alizadeh et al. (2020) found that the number of climate divisions affected by compound hot and dry years increased after the 1950s for some regions in US, but this trend disappeared when considering a longer record, suggesting the recurrence of such events across the historical period. Our study differs and extends from this analysis by applying a different compound event definition to other Northern Hemisphere regions (EM and AS).
Furthermore, we showed that in almost the whole Northern Hemisphere and within the breadbasket regions there is a positive dependence between the hot and dry events, i.e., there are physical processes in summer that causes hot months to be more prone to drought than cold summers and dry summers to be hotter than wet summers. The identified physical processes are enhanced sensible heat fluxes and soil-moisture loss, which create a self-amplifying thermodynamic feedback (Coumou et al., 2018). The compound events are also governed by atmospheric dynamics that trigger and enhance hot anomalous heating and drying. Here, by analysing different atmospheric variables, we find that the large atmospheric patterns associated to the compound hot and dry highest fraction of area events in the three breadbasket regions are dominated by wavy circulation patterns in the upper and middle troposphere, resulting in highs widespread across the whole domain of the selected regions.
Over North America, events with a large fraction of area affected by compound hot and dry events are characterized by an upper atmosphere circumglobal planetary-wave pattern with dominant zonal wavenumbers 5 and 6. This structure is consistent with the summertime Circumglobal Teleconnection, a recurrent wave-5 pattern along the jet waveguide that modulates midlatitude precipitation anomalies in summer (Ding and Wang, 2005). These high FA events also show a meandric configuration in v250 and z500, which is consistent with previous work that identified stationary wave trains originating in the North Pacific/Aleutian sector and propagating into North America in previous major US hot-drought summers (e.g. 1980 and 1988) (Lyon and Dole, 1995). Furthermore, in our composites for North America region, the ridging coincides with increased temperature, suppressed precipitation, and surface energy partitioning, reduced latent heat and enhanced sensible heating. This redistribution of the surface energy warms and dries the near surface atmosphere (Miralles et al., 2019), thereby reinforcing the compound and dry conditions in this region.
In the Euro-Mediterranean region our composites with large fraction of area affected by compound hot and dry events show anticyclonic ridges in the middle-upper troposphere. Together with the meridional wind patterns in the hemispheric composites, the thermodynamical evolution described above is consistent with upstream Rossby wave activity contributing to the establishment and reinforcement of the European ridge. The two bands of stronger westerly flow over EM are also compatible with a double jet like configuration. This circulation anomaly is consistent with the established role of blocking anticyclones and double jet stream structures in shaping European summer heat extremes (Brunner et al., 2018; Rousi et al., 2022). Rossby wave breaking followed by blocking may contribute to the splitting of the upper-level jet, although double jets and blocking can also be interpreted as dynamically coupled components of the same circulation configuration (Rousi et al., 2022). While Rossby-wave breaking is not explicitly diagnosed in the present study, the amplified Atlantic-European through-ridge pattern and the accompanying reorganisation of the upper-level westerlies resemble circulation configurations previously associated with anticyclonic Rossby wave breaking. Such breaking over Europe and Mediterranean has been identified in association with persistent hot spells in southwestern Europe, together with a northward–shifted jet (Pappert et al., 2025). The occurrence of anticyclonic circulation has previously been linked to remote forcing from tropical Atlantic heating and to a positive summer North Atlantic Oscillation phase (Cassou et al., 2005), which may also contribute to the persistence of compound hot and dry events in this region.
Furthermore, the dominant large circulation pattern during compound hot and dry events is a wave train confined to the North Atlantic-Eurasian sector. The ridges align with a northward-displaced jet which deflects storm tracks, favouring suppressed precipitation. Our composites indicate that sensible heat flux anomalies amplify surface temperature during compound hot and dry events, with statistically significant sensible heat flux values over most of the region. These flux anomalies rise because anticyclonic circulation reduces precipitation, leading to soil moisture deficits that limit evaporation and latent cooling, thereby enhancing sensible heating of the near surface air. This mechanism is consistent with previous findings for extreme events such as the hot event in 2003 (Fischer et al., 2007) and the hot and dry event in 2018 (Dirmeyer et al., 2021), where soil-moisture-atmosphere interactions were shown to reinforce surface warming.
In eastern Asia region, our analysis reveals a well-defined circumglobal Rossby wave pattern, with wave number 6 as the most dominant feature. This wave structure helps to explain the well localized compound extremes in AS, as well as the occurrence of spatially compounding summers with hot and dry conditions in AS and EM regions. Previous studies indicated that summer Rossby wave activity can influence Northern Hemisphere teleconnection mechanisms that further affect Asian climate. For example, it has been shown that Artic Sea ice loss generates polar low-pressure anomalies which trigger south-eastward Rossby wave trains from northern Europe towards East Asia (Folland et al., 2024; Zhang et al., 2020). Furthermore, it has been shown that stationary wave trains originating from the North Atlantic Ocean and Indo-Pacific warm pool are linked to the occurrence of extreme hot days over east Asia in recent decades (Lee et al., 2023). Our results extend these studies, by linking the dominant wave 6 circulation pattern to the co-occurrence of hot and dry events, rather than heat alone. Moreover, we find spatial differences across Asia: inland areas exhibit the highest numbers of compound events, characterized by upward sensible heat fluxes in combination of suppressed evaporative fluxes (not strong enough as in the other regions), whereas coastal regions exhibit enhanced evaporation (negative SLHF) and weaker SSHF, leading to fewer compound events. These spatial differences are consistent with previous research, which found that during the past two decades the strength of land atmosphere coupling has been enhanced across inland Asia, where heatwave frequency has increased and closely follows a persistent drying trend of soil moisture. In contrast, this relationship is not as robust in southern and coastal East Asia, due to the influence of the East Asian summer monsoon (Zhang et al., 2020).
Taken together, the regional patterns over NA, EM and AS target to a common hemispheric driver, amplified planetary wave activity that drives hot and dry events across different regions. Kornhuber et al. (2020) linked amplified wave-5 and wave-7 configurations to simultaneous heat extremes across breadbasket regions. Our analysis is complementary but distinct: we focus on compound hot and dry events using a longer record, and we find that wave 56 configurations are the most frequent during summers with high fraction of area affected by compound events in these regions.
Our study provides a hemispheric-scale perspective on the drivers of compound hot and dry events (COHDEs), using 61 years of reanalysis and observational data. By using trend insensitive metrics, i.e. not affected by long-term changes in the occurrence of individual hot and dry events, we show that COHDEs are a recurrent feature of the internal climate dynamics in the Northern Hemisphere and in the selected regions. We also show by explicitly testing the dependence between hot and dry conditions that the observed spatial associations are unlikely to arise by chance. Unlike previous work focusing on trends or individual extremes, this approach provides a way to compare compound impacts across regions.
In analyzing the large circulation patterns associated to these compound extremes, we found that widespread COHDEs are consistenly linked to large-scale planetary wave patterns, particularly Rossby wave 5 and 6, which are the dominant drivers along with anticyclonic ridging in the upper-medium troposphere for each breadbasket region. These circulation anomalies trigger land–atmosphere feedbacks to reinforce extremes: in North America and some areas of the Euro-Mediterranean region, enhanced radiative heating and suppressed evaporation act together to intensify hot and dry conditions. Conversely, East Asia coastal regions show enhanced evaporation, which limit the temperature anomalies associated with the COHDEs, while inland regions are controlled by sensible and latent heat flux feedbacks. Together, these findings advance our understanding of COHDEs by showing that their occurrence appears from recurrent hemispheric-scale circulation patterns and land atmosphere interactions, rather than isolated regional anomalies.
These findings highlight the importance of understanding not only regional processes but also the global circulation patterns that raise compound extremes. Targeted model experiments are needed to better understand how the intensity and frequency of COHDEs might evolve under climate change. In particular, single-model initial condition large ensembles (SMILEs) can provide the large sample sizes required to robustly separate the role of internal variability from forced changes, and to test whether the circulation patterns identified here remain the dominant drivers of compound hot and dry events in the future.
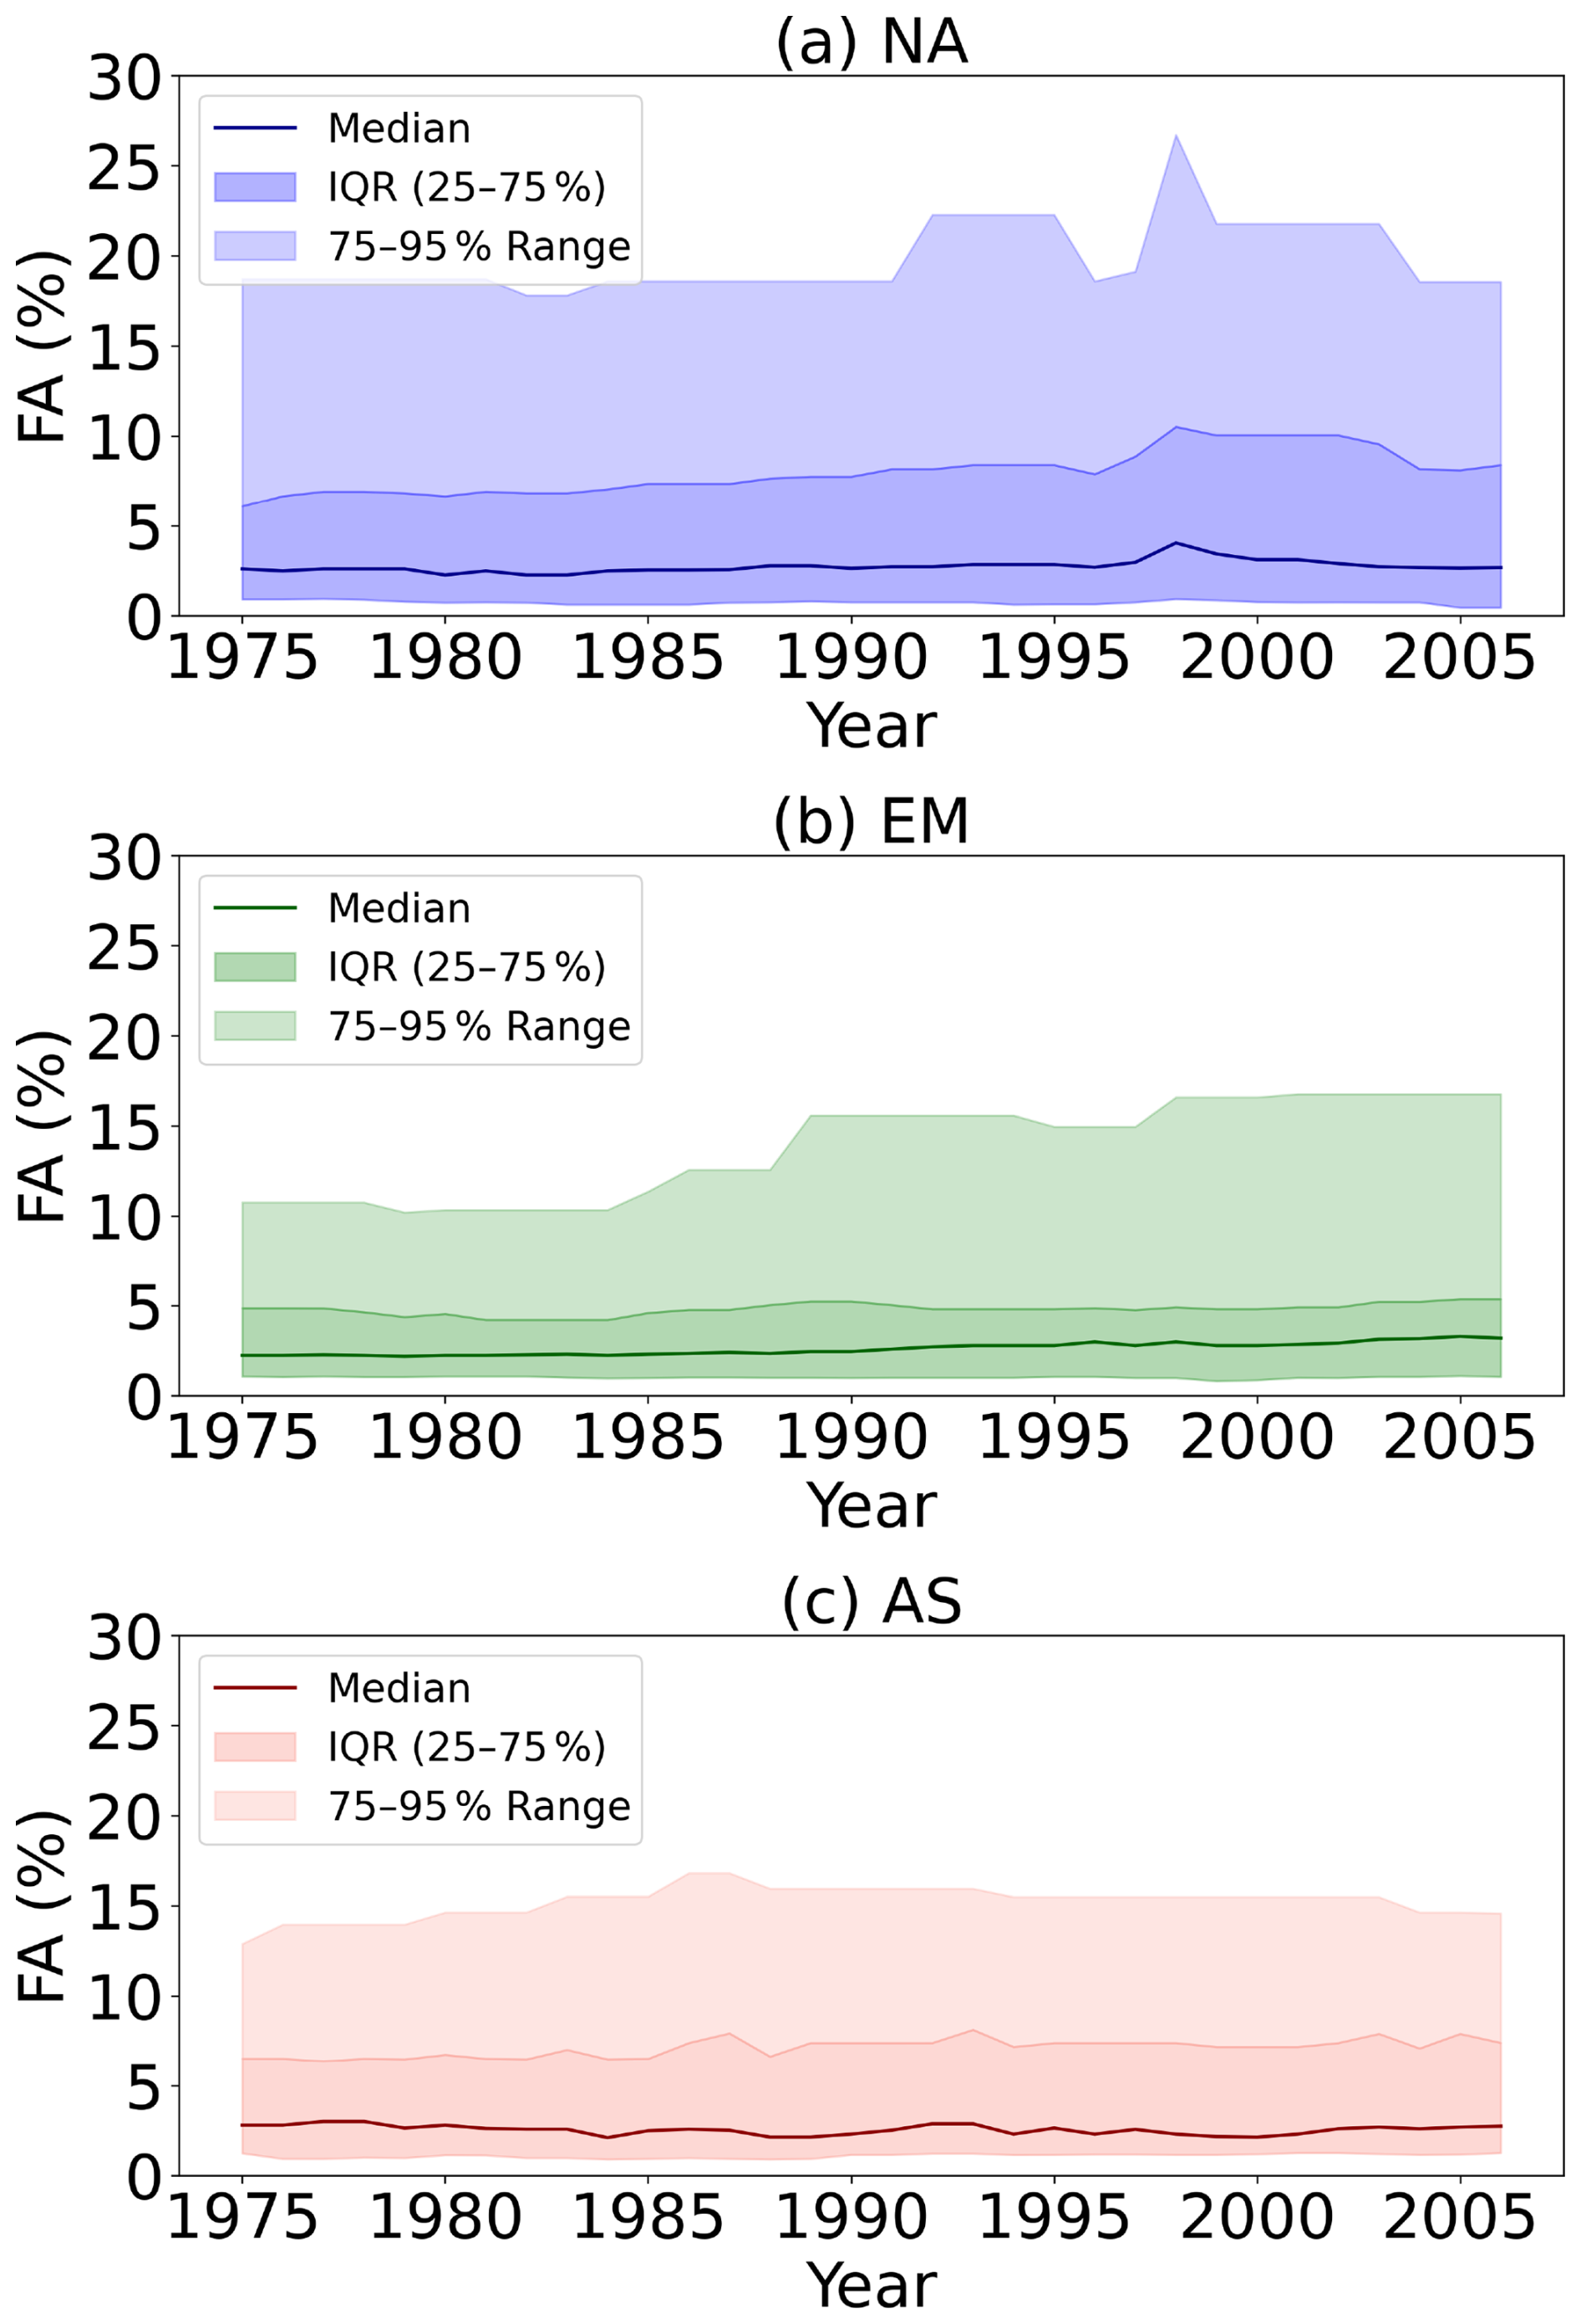
Figure A1Median, interquartile, and upper quartile time series of the fraction of area (FA) affected by compound hot and dry events for the North America (a), Euro-Mediterranean (b) and Eastern Asia regions (c). Means, interquartiles and upper quartiles are computed using a 30 year sliding window.
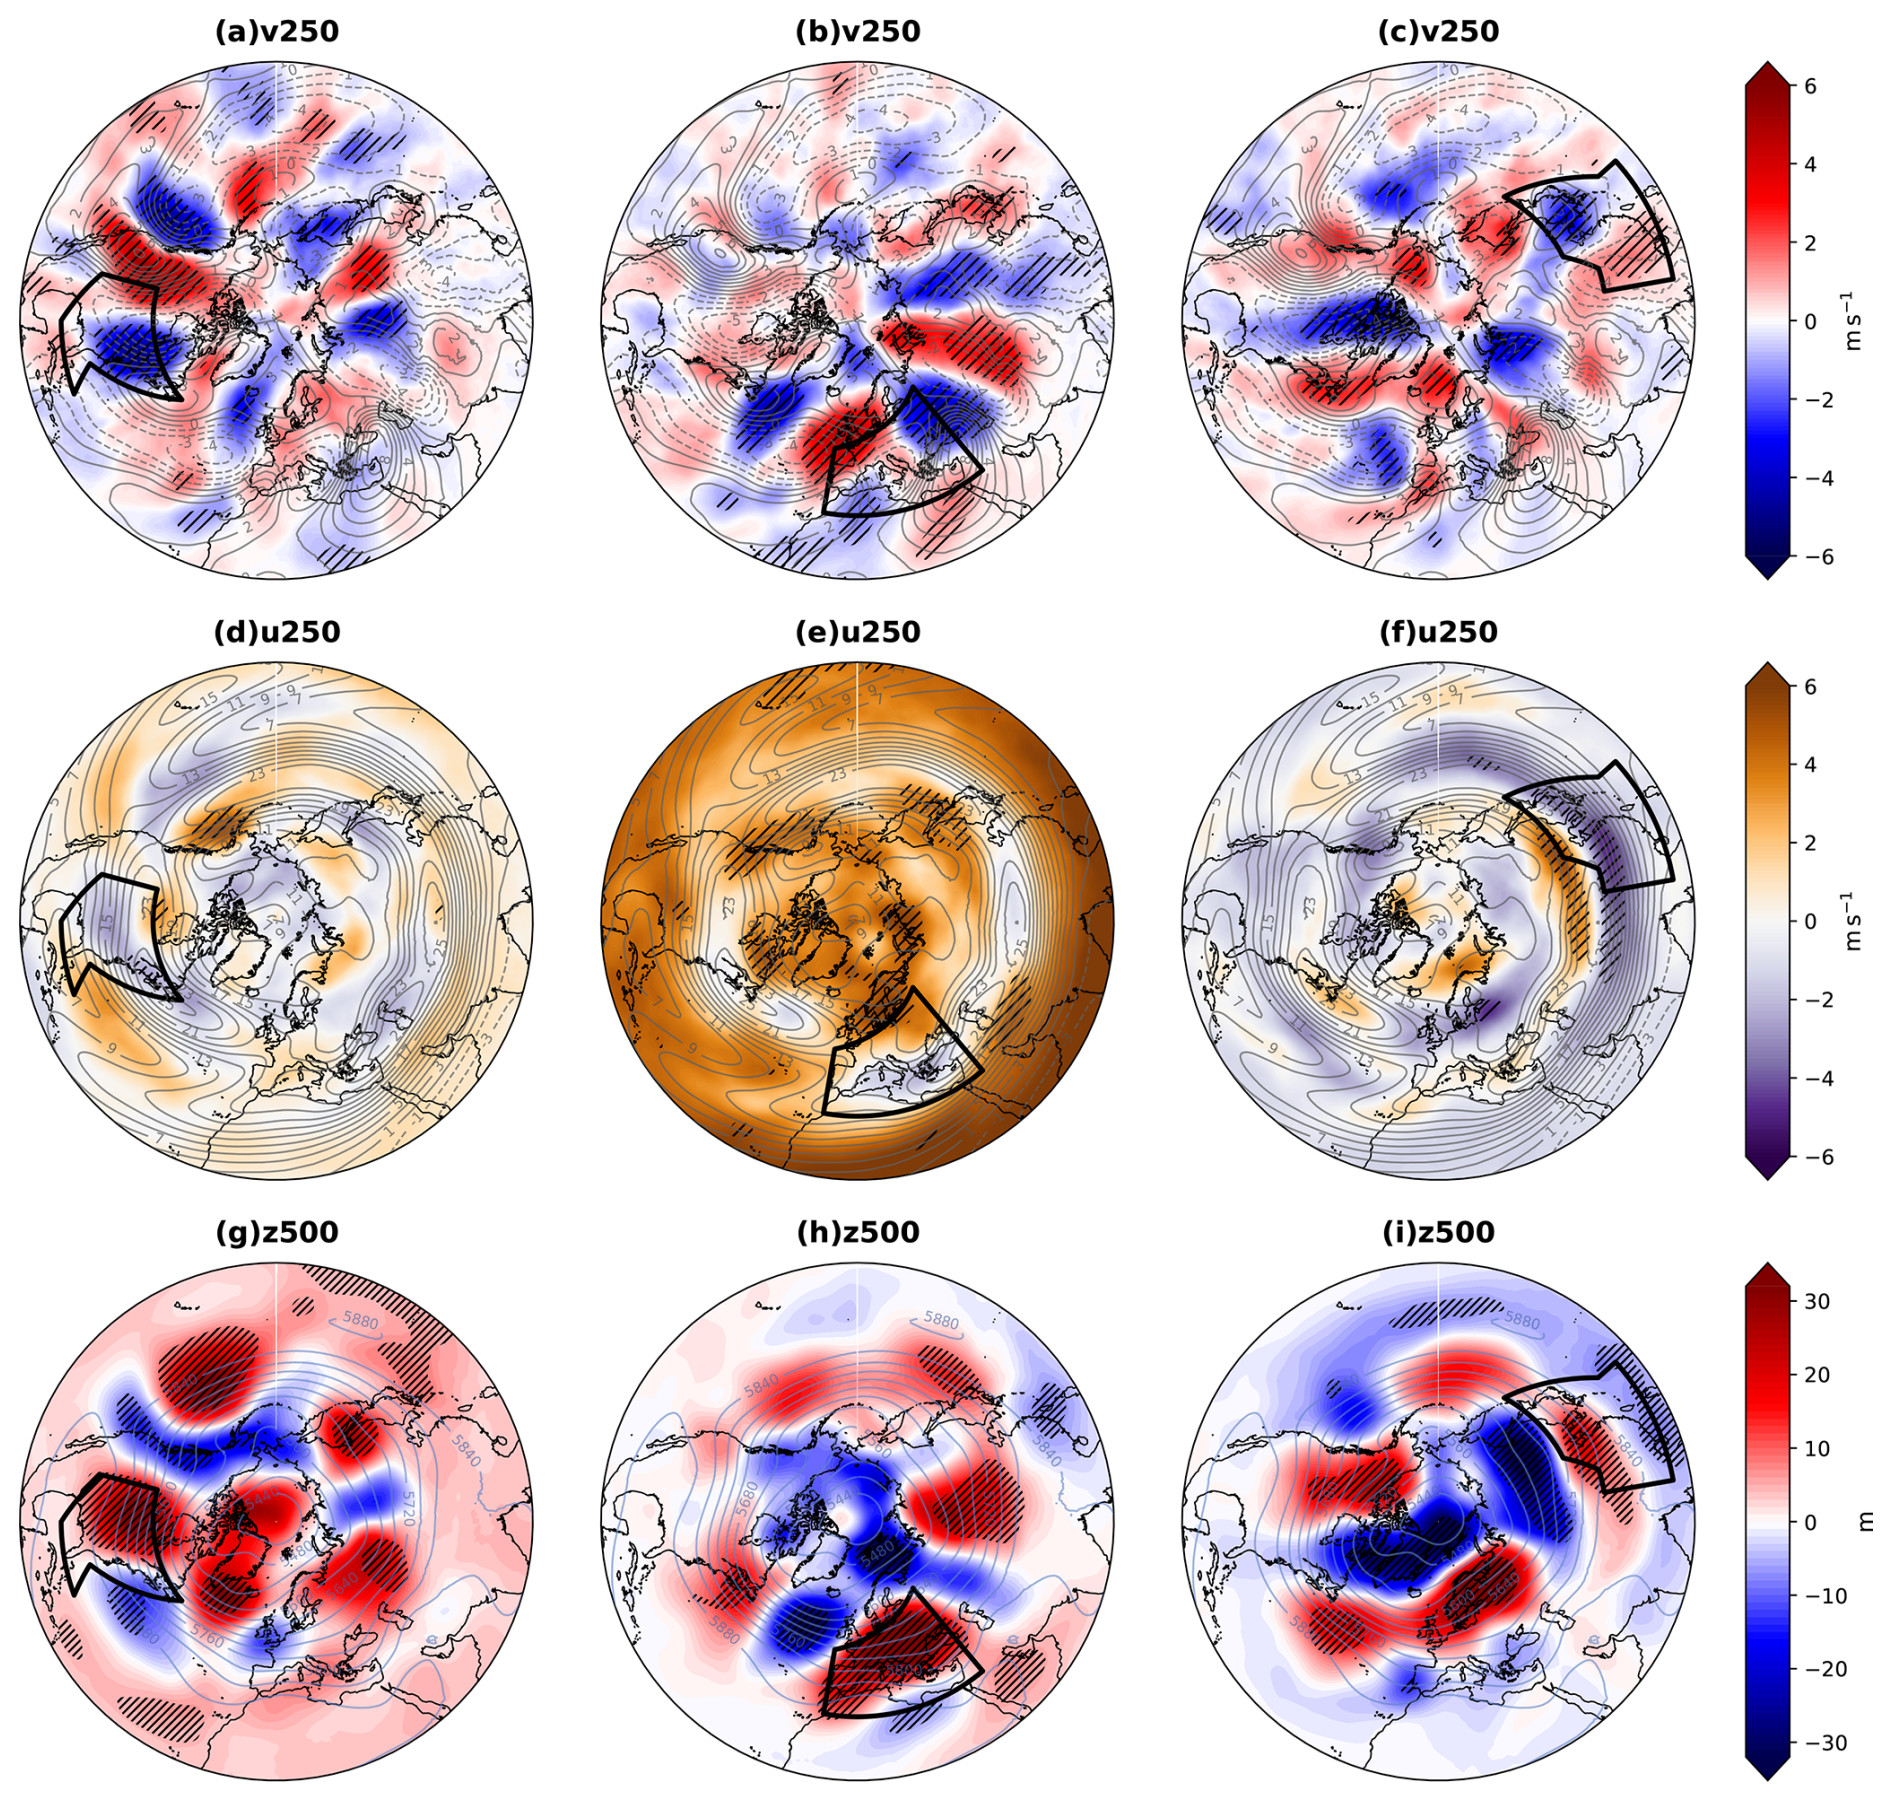
Figure A2Composite anomalies during high FA events in North America (first column; a, d, g), the Euro-Mediterranean (second column; b, e, h) and Eastern Asia (third column; c, f, i). Shading shows composites of the meridional wind at 250 hPa (v250, a–c), zonal wind at 250 hPa (u250, d–f), and geopotential height at 500 hPa (z500; g–i). Gray contours show the corresponding climatological mean fields, calculated from the original non deseasonalized monthly data. Black contours delineate the respective study regions. Hatched areas indicate anomalies that are statistically significant at 90 % confidence level, based on a Student's t-test.
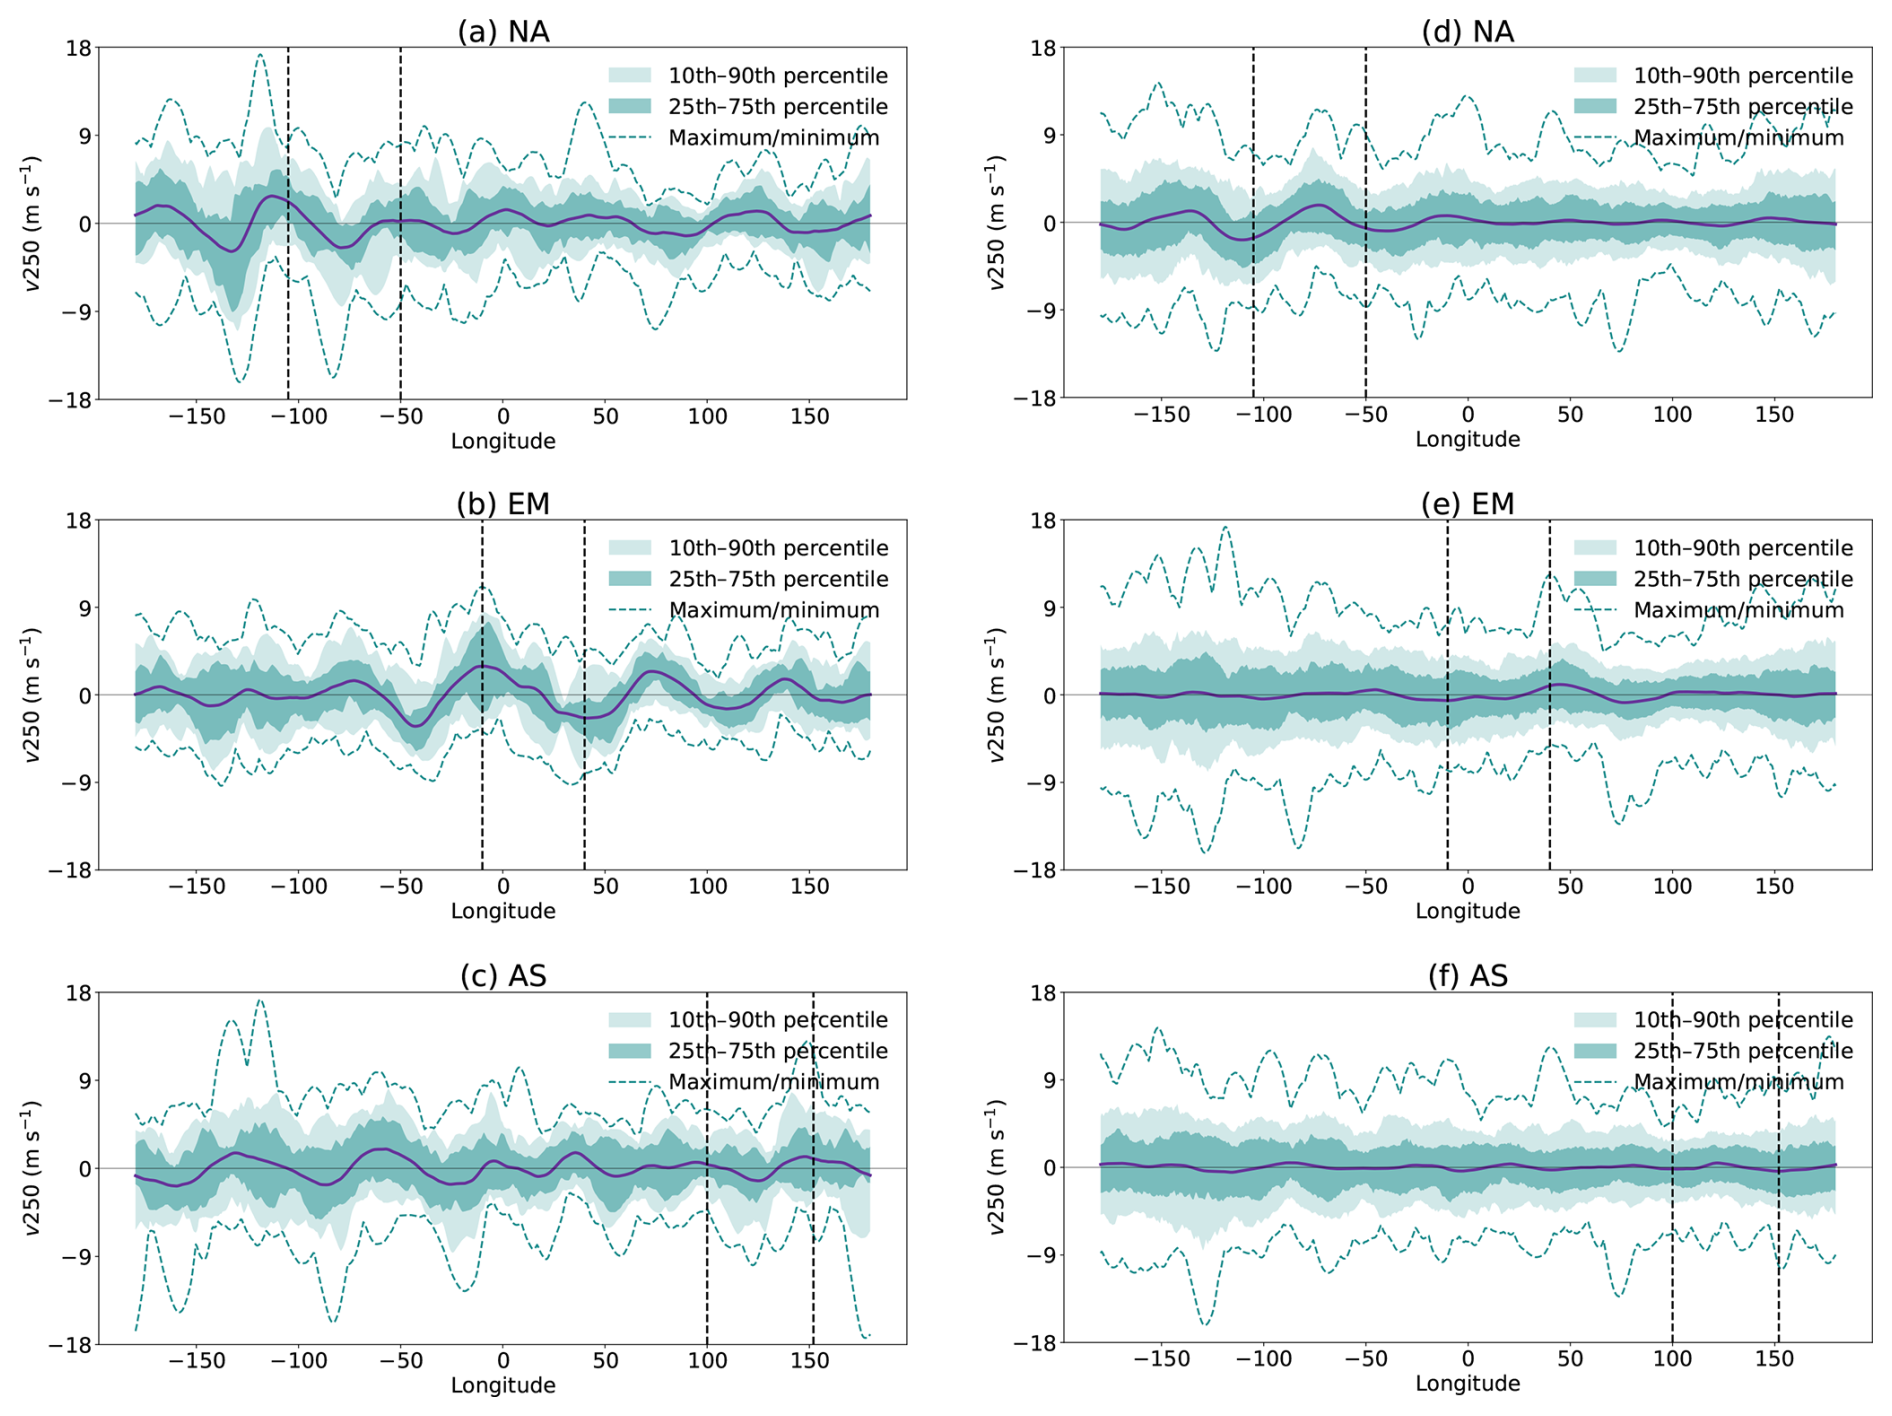
Figure A3Meridional component of the wind at 250 (v250), averaged over the 57.5–37.5° N belt. On the left column, composites of 19 high FA events; on the right column, composites of 92 low FA events, in (a, d) North America (NA), (b, e) Euro-Mediterranean (EM) and (c, f) Eastern Asia (AS). Purple lines indicate the composite mean, dark green bands indicate the interquartile range, light green bands indicate the 10th–90th percentile range, dashed green lines indicate maxima and minima, while vertical black dashed lines indicate the longitudinal extension of the selected regions.
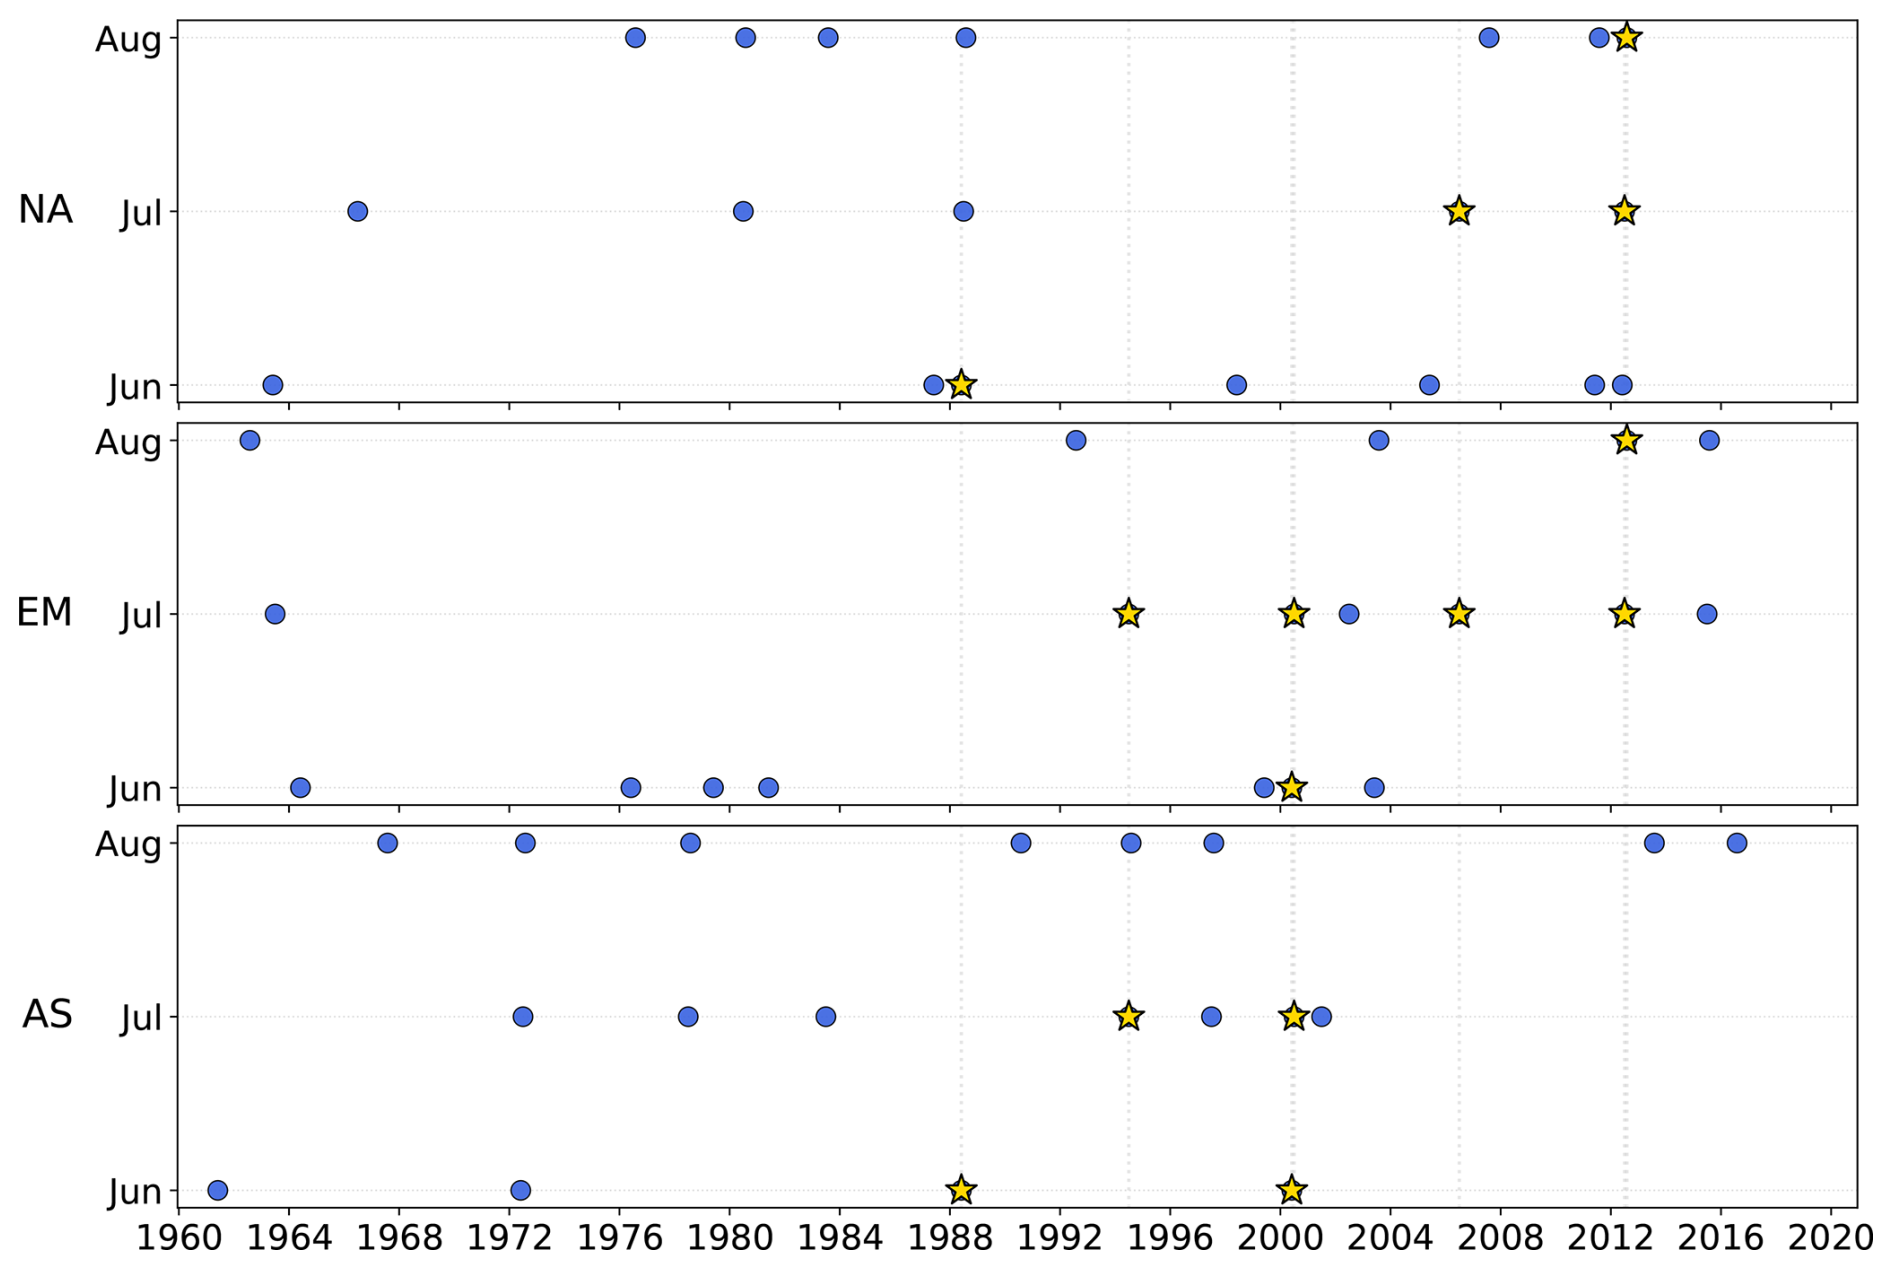
Figure A4High Fraction of Area (FA) events for the three breadbasket regions in blue circles. The yellow stars indicate the months where two regions experienced at the same time high FA events.
The code used in this study implement standard statistical and data processing methods, using publicly available software (python and Climate Data Operators, CDO) and free packages, which are described in detail in the Methods section. Because these are standard methods, they are not uploaded to a repository. These scrips are available upon request.
ERA5 is freely available at: https://cds.climate.copernicus.eu/cdsapp#!/search?type=dataset (last access: 7 September 2026). CRU can be found at: https://crudata.uea.ac.uk/cru/data/hrg/cru_ts_4.07/ (last access: 17 May 2023).
NCB and MG conceived the analysis. NCB did the analysis and wrote the manuscript with feedback and contribution from all authors (MG, LFB, BP, LB, JS, MM). BP Prepared Fig. 2.
The contact author has declared that none of the authors has any competing interests.
Publisher's note: Copernicus Publications remains neutral with regard to jurisdictional claims made in the text, published maps, institutional affiliations, or any other geographical representation in this paper. The authors bear the ultimate responsibility for providing appropriate place names. Views expressed in the text are those of the authors and do not necessarily reflect the views of the publisher.
This paper was produced while Natalia Castillo Bautista was attending the PhD programme in Sustainable Development and Climate Change at the University School for Advanced Studies IUSS Pavia, Cycle XXXVIII. Natalia Castillo Bautista thanks the Climate Extremes group in the Research Unit for Sustainability and Climate Risks for the support during her research stay at the University of Hamburg to complete the analysis. The authors thank E. Bevacqua and J. Riboldi for insightful and useful discussion.
This research was supported by the Space It Up project funded by the Italian Space Agency, ASI, and the Ministry of University and Research, MUR, under contract n. 2024-5-E.0 – CUP n. I53D24000060005. NCB was supported by a scholarship funded by the Ministerial Decree no. 352 of 9 April 2022, based on the PNRR-funded by the European Union-Next GenerationEU-Mission 4 “Education and Research”, component “Innovative PhD courses”-Investment 3.3 “Innovative doctorates that meet the innovation needs of companies”. MG was supported by funding provided under the bilateral scientific cooperation agreement between the National Research Council of Italy (CNR) and the National Research Foundation of Korea (NRF), through the joint research project “Enhancing Drought Prediction at Seasonal to Decadal Timescales to Strengthen Climate Adaptation Strategies” (2026–2027). MG and MLVM were supported by the project “Dipartimento di Eccellenza 2023–2027”, funded by the Italian Ministry of Education, University and Research at IUSS Pavia. LBo, LBr, BP, and JS were supported by the Deutsche Forschungsgemeinschaft (DFG, German Research Foundation) under Germany’s Excellence StrategyEXC 2037 “CLICCS – Climate, Climatic Change, and Society” - Project No. 390683824, a contribution to the Center for Earth System Research and Sustainability (CEN) of University of Hamburg.
This paper was edited by Pedram Hassanzadeh and reviewed by two anonymous referees.
Alizadeh, M. R., Adamowski, J., Nikoo, M. R., AghaKouchak, A., Dennison, P., and Sadegh, M.: A century of observations reveals increasing likelihood of continental-scale compound dry-hot extremes, Sci. Adv., 6, eaaz4571, https://doi.org/10.1126/sciadv.aaz4571, 2020.
Berg, A., Lintner, B. R., Findell, K., Seneviratne, S. I., Van Den Hurk, B., Ducharne, A., Chéruy, F., Hagemann, S., Lawrence, D. M., Malyshev, S., Meier, A., and Gentine, P.: Interannual Coupling between Summertime Surface Temperature and Precipitation over Land: Processes and Implications for Climate Change, J. Climate, 28, 1308–1328, https://doi.org/10.1175/JCLI-D-14-00324.1, 2015.
Bevacqua, E., Zappa, G., Lehner, F., and Zscheischler, J.: Precipitation trends determine future occurrences of compound hot–dry events, Nat. Clim. Change, 12, 350–355, https://doi.org/10.1038/s41558-022-01309-5, 2022.
Böhnisch, A., Felsche, E., Mittermeier, M., Poschlod, B., and Ludwig, R.: Future Patterns of Compound Dry and Hot Summers and Their Link to Soil Moisture Droughts in Europe, Earth's Future, 13, e2024EF004916, https://doi.org/10.1029/2024EF004916, 2025.
Brett, L., White, C. J., Domeisen, D. I. V., van den Hurk, B., Ward, P., and Zscheischler, J.: Review article: The growth in compound weather and climate event research in the decade since SREX, Nat. Hazards Earth Syst. Sci., 25, 2591–2611, https://doi.org/10.5194/nhess-25-2591-2025, 2025.
Brunner, L., Schaller, N., Anstey, J., Sillmann, J., and Steiner, A. K.: Dependence of Present and Future European Temperature Extremes on the Location of Atmospheric Blocking, Geophys. Res. Lett., 45, 6311–6320, https://doi.org/10.1029/2018GL077837, 2018.
Cassou, C., Terray, L., and Phillips, A. S.: Tropical Atlantic Influence on European Heat Waves, J. Climate, 18, 2805–2811, https://doi.org/10.1175/JCLI3506.1, 2005.
Coumou, D., Di Capua, G., Vavrus, S., Wang, L., and Wang, S.: The influence of Arctic amplification on mid-latitude summer circulation, Nat. Commun., 9, 2959, https://doi.org/10.1038/s41467-018-05256-8, 2018.
Dietz, V., Baehr, J., Suarez-Gutierrez, L., Sillmann, J., and Borchert, L.: The future of hot and dry events in the breadbasket regions of maize, Environ. Res. Lett., 20, 074009, https://doi.org/10.1088/1748-9326/adda63, 2025.
Ding, Q. and Wang, B.: Circumglobal Teleconnection in the Northern Hemisphere Summer, J. Climate, 18, 3483–3505, https://doi.org/10.1175/JCLI3473.1, 2005.
Dirmeyer, P. A., Balsamo, G., Blyth, E. M., Morrison, R., and Cooper, H. M.: Land–Atmosphere Interactions Exacerbated the Drought and Heatwave Over Northern Europe During Summer 2018, AGU Advances, 2, e2020AV000283, https://doi.org/10.1029/2020AV000283, 2021.
Farahmand, A. and AghaKouchak, A.: A generalized framework for deriving nonparametric standardized drought indicators, Adv. Water Resour., 76, 140–145, https://doi.org/10.1016/j.advwatres.2014.11.012, 2015.
Faranda, D., Pascale, S., and Bulut, B.: Persistent anticyclonic conditions and climate change exacerbated the exceptional 2022 European-Mediterranean drought, Environ. Res. Lett., https://doi.org/10.1088/1748-9326/acbc37, 2023.
Felsche, E., Böhnisch, A., Poschlod, B., and Ludwig, R.: European hot and dry summers are projected to become more frequent and expand northwards, Commun. Earth Environ., 5, 410, https://doi.org/10.1038/s43247-024-01575-5, 2024.
Feng, S., Wu, X., Hao, Z., Hao, Y., Zhang, X., and Hao, F.: A database for characteristics and variations of global compound dry and hot events, Weather and Climate Extremes, 30, 100299, https://doi.org/10.1016/j.wace.2020.100299, 2020.
Field, C. B., Barros, V., Stocker, T. F., Dahe, Q., Dokken, D. J., Ebi, K. L., Mastrandrea, M. D., Pauline, K. J. M., Plattner, G.-K., Allen, S. K., Tignor, M., and Midgley, P. M.: Special Report of the Intergovernmental Panel on Climate Change Edited, 30 pp., https://doi.org/10.1017/CBO9781139177245, 2011.
Field, C. B., Barros, V., Stocker, T. F., and Dahe, Q. (Eds.): Managing the Risks of Extreme Events and Disasters to Advance Climate Change Adaptation: Special Report of the Intergovernmental Panel on Climate Change, 1st edn., Cambridge University Press, https://doi.org/10.1017/CBO9781139177245, 2012.
Fink, A. H., Brücher, T., Krüger, A., Leckebusch, G. C., Pinto, J. G., and Ulbrich, U.: The 2003 European summer heatwaves and drought – synoptic diagnosis and impacts, Weather, 59, 209–216, https://doi.org/10.1256/wea.73.04, 2004.
Fioravanti, G., Toreti, A., Cammalleri, C., Muñoz, C. A., Bavera, D., De Jager, A., Hrast Essenfelder, A., Di Ciollo, C., Masante, D., Magni, D., Navarro, J. A., Mazzesch, M., and Maetens, W.: A dataset for monitoring agricultural drought in Europe, Sci. Data, 12, 308, https://doi.org/10.1038/s41597-024-04199-8, 2025.
Fischer, E. M. and Schär, C.: Consistent geographical patterns of changes in high-impact European heatwaves, Nat. Geosci., 3, 398–403, https://doi.org/10.1038/ngeo866, 2010.
Fischer, E. M., Seneviratne, S. I., Vidale, P. L., Lüthi, D., and Schär, C.: Soil Moisture–Atmosphere Interactions during the 2003 European Summer Heat Wave, J. Climate, 20, 5081–5099, https://doi.org/10.1175/JCLI4288.1, 2007.
Folland, C. K., Ou, T., Linderholm, H. W., Scaife, A. A., Knight, J., and Chen, D.: The Summer North Atlantic Oscillation, Arctic sea ice, and Arctic jet Rossby wave forcing, Sci. Adv., 10, https://doi.org/10.1126/sciadv.adk6693, 2024.
García-Herrera, R., Díaz, J., Trigo, R. M., Luterbacher, J., and Fischer, E. M.: A Review of the European Summer Heat Wave of 2003, Crit. Rev. Env. Sci. Tec., 40, 267–306, https://doi.org/10.1080/10643380802238137, 2010.
Gaupp, F., Hall, J., Mitchell, D., and Dadson, S.: Increasing risks of multiple breadbasket failure under 1.5 and 2 °C global warming, Agr. Syst., 175, 34–45, https://doi.org/10.1016/j.agsy.2019.05.010, 2019.
Gaupp, F., Hall, J., Hochrainer-Stigler, S., and Dadson, S.: Changing risks of simultaneous global breadbasket failure, Nat. Clim. Change, 10, 54–57, https://doi.org/10.1038/s41558-019-0600-z, 2020.
Gringorten, I. I.: A plotting rule for extreme probability paper, J. Geophys. Res., 68, 813–814, https://doi.org/10.1029/JZ068i003p00813, 1963.
Guo, J., Wang, F., Wen, Y., Wang, X., Hao, Z., Zheng, H., Fan, Y., and Shen, C.: Rising compound hot-dry extremes engendering more inequality in human exposure risks, npj Nat. Hazards, 2, 66, https://doi.org/10.1038/s44304-025-00119-x, 2025.
Hao, Z. and AghaKouchak, A.: A Nonparametric Multivariate Multi-Index Drought Monitoring Framework, J. Hydrometeorol., 15, 89–101, https://doi.org/10.1175/JHM-D-12-0160.1, 2014.
Hao, Z., Hao, F., Singh, V. P., and Zhang, X.: Quantifying the relationship between compound dry and hot events and El Niño–southern Oscillation (ENSO) at the global scale, J. Hydrol., 567, 332–338, https://doi.org/10.1016/j.jhydrol.2018.10.022, 2018.
Hao, Z., Hao, F., Xia, Y., Feng, S., Sun, C., Zhang, X., Fu, Y., Hao, Y., Zhang, Y., and Meng, Y.: Compound droughts and hot extremes: Characteristics, drivers, changes, and impacts, Earth-Sci. Rev., 235, 104241, https://doi.org/10.1016/j.earscirev.2022.104241, 2022.
Harris, I., Osborn, T. J., Jones, P., and Lister, D.: Version 4 of the CRU TS monthly high-resolution gridded multivariate climate dataset, Sci. Data, 7, 109, https://doi.org/10.1038/s41597-020-0453-3, 2020.
Hersbach, H., Bell, B., Berrisford, P., Hirahara, S., Horányi, A., Muñoz-Sabater, J., Nicolas, J., Peubey, C., Radu, R., Schepers, D., Simmons, A., Soci, C., Abdalla, S., Abellan, X., Balsamo, G., Bechtold, P., Biavati, G., Bidlot, J., Bonavita, M., De Chiara, G., Dahlgren, P., Dee, D., Diamantakis, M., Dragani, R., Flemming, J., Forbes, R., Fuentes, M., Geer, A., Haimberger, L., Healy, S., Hogan, R. J., Hólm, E., Janisková, M., Keeley, S., Laloyaux, P., Lopez, P., Lupu, C., Radnoti, G., de Rosnay, P., Rozum, I., Vamborg, F., Villaume, S., and Thépaut, J. N.: The ERA5 global reanalysis, Q. J. Roy. Meteor. Soc., 146, 1999–2049, https://doi.org/10.1002/qj.3803, 2020.
Hoerling, M., Kumar, A., Dole, R., Nielsen-Gammon, J. W., Eischeid, J., Perlwitz, J., Quan, X.-W., Zhang, T., Pegion, P., and Chen, M.: Anatomy of an Extreme Event, J. Climate, 26, 2811–2832, https://doi.org/10.1175/JCLI-D-12-00270.1, 2013.
Huang, S., Huang, Q., Chang, J., Leng, G., and Xing, L.: The response of agricultural drought to meteorological drought and the influencing factors: A case study in the Wei River Basin, China, Agr. Water Manage., 159, 45–54, https://doi.org/10.1016/j.agwat.2015.05.023, 2015.
Ionita, M., Caldarescu, D. E., and Nagavciuc, V.: Compound Hot and Dry Events in Europe: Variability and Large-Scale Drivers, Frontiers in Climate, 3, 1–19, https://doi.org/10.3389/fclim.2021.688991, 2021.
Iturbide, M., Gutiérrez, J. M., Alves, L. M., Bedia, J., Cerezo-Mota, R., Cimadevilla, E., Cofiño, A. S., Di Luca, A., Faria, S. H., Gorodetskaya, I. V., Hauser, M., Herrera, S., Hennessy, K., Hewitt, H. T., Jones, R. G., Krakovska, S., Manzanas, R., Martínez-Castro, D., Narisma, G. T., Nurhati, I. S., Pinto, I., Seneviratne, S. I., van den Hurk, B., and Vera, C. S.: An update of IPCC climate reference regions for subcontinental analysis of climate model data: definition and aggregated datasets, Earth Syst. Sci. Data, 12, 2959–2970, https://doi.org/10.5194/essd-12-2959-2020, 2020.
Jiménez-Donaire, M. P., Tarquis, A., and Giráldez, J. V.: Evaluation of a combined drought indicator and its potential for agricultural drought prediction in southern Spain, Nat. Hazards Earth Syst. Sci., 20, 21–33, https://doi.org/10.5194/nhess-20-21-2020, 2020.
Kopp, R. E., Hayhoe, K., Easterling, D. R., Hall, T., Horton, R., Kunkel, K. E., and LeGrande, A. N.: Potential surprises – compound extremes and tipping elements, in: Climate Science Special Report: Fourth National Climate Assessment, Volume I, edited by: Wuebbles, D. J., Fahey, D. W., Hibbard, K. A., Dokken, D. J., Stewart, B. C., and Maycock, T. K., U.S. Global Change Research Program, Washington, DC, USA, pp. 411–429, https://doi.org/10.7930/J0GB227J, 2017.
Kornhuber, K., Osprey, S., Coumou, D., Petri, S., Petoukhov, V., Rahmstorf, S., and Gray, L.: Extreme weather events in early summer 2018 connected by a recurrent hemispheric wave-7 pattern, Environ. Res. Lett., 14, https://doi.org/10.1088/1748-9326/ab13bf, 2019.
Kornhuber, K., Coumou, D., Vogel, E., Lesk, C., Donges, J. F., Lehmann, J., and Horton, R. M.: Amplified Rossby waves enhance risk of concurrent heatwaves in major breadbasket regions, Nat. Clim. Change, 10, 48–53, https://doi.org/10.1038/s41558-019-0637-z, 2020.
Kornhuber, K., Lesk, C., Schleussner, C. F., Jägermeyr, J., Pfleiderer, P., and Horton, R. M.: Risks of synchronized low yields are underestimated in climate and crop model projections, Nat. Commun., 14, 3528, https://doi.org/10.1038/s41467-023-38906-7, 2023.
Lee, Y., Yeh, S., Hong, J., Shin, J., and An, S.: Regime shift increase in East Asia's summer extreme hot day frequency across the late 1990s, Int. J. Climatol., 43, 2305–2317, https://doi.org/10.1002/joc.7976, 2023.
Leonard, M., Westra, S., Phatak, A., Lambert, M., Van Den Hurk, B., McInnes, K., Risbey, J., Schuster, S., Jakob, D., and Stafford-Smith, M.: A compound event framework for understanding extreme impacts, WIREs Clim. Change, 5, 113–128, https://doi.org/10.1002/wcc.252, 2014.
Lian, X., Li, Y., Liu, J., Kornhuber, K., and Gentine, P.: Northern ecosystem productivity reduced by Rossby-wave-driven hot–dry conditions, Nat. Geosci., 18, 615–623, https://doi.org/10.1038/s41561-025-01722-3, 2025.
Lyon, B. and Dole, R. M.: A diagnostic comparison of the 1980 and 1988 US summer heat wave-droughts, J. Climate, 8, 1658–1675, 1995.
Ma, M., Qu, Y., Lyu, J., Zhang, X., Su, Z., Gao, H., Yang, X., Chen, X., Jiang, T., Zhang, J., Shen, M., and Wang, Z.: The 2022 extreme drought in the Yangtze River Basin: Characteristics, causes and response strategies, River, 1, 162–171, https://doi.org/10.1002/rvr2.23, 2022.
Malcolm, A. H.: Drought disaster declared by US, The New York Times, 3 September, https://www.nytimes.com/1983/09/03/us/drought-disaster-declared-by-us.html (last access: 18 October 2026), 1983.
Materia, S., Ardilouze, C., Prodhomme, C., Donat, M. G., Benassi, M., Doblas-Reyes, F. J., Peano, D., Caron, L.-P., Ruggieri, P., and Gualdi, S.: Summer temperature response to extreme soil water conditions in the Mediterranean transitional climate regime, Clim. Dynam., 58, 1943–1963, https://doi.org/10.1007/s00382-021-05815-8, 2022.
Miralles, D. G., Gentine, P., Seneviratne, S. I., and Teuling, A. J.: Land–atmospheric feedbacks during droughts and heatwaves: state of the science and current challenges, Ann. NY Acad. Sci., 1436, 19–35, https://doi.org/10.1111/nyas.13912, 2019.
Mishra, A. K. and Singh, V. P.: A review of drought concepts, J. Hydrol., 391, 202–216, https://doi.org/10.1016/j.jhydrol.2010.07.012, 2010.
Mo, K. C., Zimmerman, J. R., Kalnay, E., and Kanamitsu, M.: A GCM Study of the 1988 United States Drought, Mon. Weather Rev., 119, 1512–1532, https://doi.org/10.1175/1520-0493(1991)119%3C1512:AGSOTU%3E2.0.CO;2, 1991.
Mukherjee, S., Ashfaq, M., and Mishra, A. K.: Compound Drought and Heatwaves at a Global Scale: The Role of Natural Climate Variability-Associated Synoptic Patterns and Land-Surface Energy Budget Anomalies, J. Geophys. Res.-Atmos., 125, https://doi.org/10.1029/2019JD031943, 2020.
Nasong, D., Zhou, S., Kornhuber, K., and Yu, B.: Concurrent Heat Extremes in Relation to Global Warming, High Atmospheric Pressure and Low Soil Moisture in the Northern Hemisphere, Earth's Future, 13, e2024EF005256, https://doi.org/10.1029/2024EF005256, 2025.
NOAA National Centers for Environmental Information: Monthly Global Climate Report for Annual 2022, NOAA National Centers for Environmental Information, https://www.ncei.noaa.gov/access/monitoring/monthly-report/global/202213 (last acess date: October 2026), 2023a.
NOAA National Centers for Environmental Information: Monthly National Climate Report for Annual 2022, NOAA National Centers for Environmental Information, https://www.ncei.noaa.gov/access/monitoring/monthly-report/national/202213 (last access: 23 October 2026), 2023b.
Pappert, D., Tuel, A., Coumou, D., Vrac, M., and Martius, O.: Long vs. short: understanding the dynamics of persistent summer hot spells in Europe, Weather Clim. Dynam., 6, 769–788, https://doi.org/10.5194/wcd-6-769-2025, 2025.
Petoukhov, V., Rahmstorf, S., Petri, S., and Schellnhuber, H. J.: Quasiresonant amplification of planetary waves and recent Northern Hemisphere weather extremes, P. Natl. Acad. Sci. USA, 110, 5336–5341, https://doi.org/10.1073/pnas.1222000110, 2013.
Poschlod, B., Zscheischler, J., Sillmann, J., Wood, R. R., and Ludwig, R.: Climate change effects on hydrometeorological compound events over southern Norway, Weather and Climate Extremes, 28, 100253, https://doi.org/10.1016/j.wace.2020.100253, 2020.
Raymond, C., Horton, R. M., Zscheischler, J., Martius, O., AghaKouchak, A., Balch, J., Bowen, S. G., Camargo, S. J., Hess, J., Kornhuber, K., Oppenheimer, M., Ruane, A. C., Wahl, T., and White, K.: Understanding and managing connected extreme events, Nat. Clim. Change, 10, 611–621, https://doi.org/10.1038/s41558-020-0790-4, 2020.
Raymond, C., Suarez-Gutierrez, L., Kornhuber, K., Pascolini-Campbell, M., Sillmann, J., and Waliser, D. E.: Increasing spatiotemporal proximity of heat and precipitation extremes in a warming world quantified by a large model ensemble, Environ. Res. Lett., 17, 035005, https://doi.org/10.1088/1748-9326/ac5712, 2022.
Röthlisberger, M. and Martius, O.: Quantifying the Local Effect of Northern Hemisphere Atmospheric Blocks on the Persistence of Summer Hot and Dry Spells, Geophys. Res. Lett., 46, 10101–10111, https://doi.org/10.1029/2019GL083745, 2019.
Rousi, E., Kornhuber, K., Beobide-Arsuaga, G., Luo, F., and Coumou, D.: Accelerated western European heatwave trends linked to more-persistent double jets over Eurasia, Nat. Commun., 13, 1–11, https://doi.org/10.1038/s41467-022-31432-y, 2022.
Salvadori, G., Durante, F., De Michele, C., Bernardi, M., and Petrella, L.: A multivariate copula-based framework for dealing with hazard scenarios and failure probabilities, Water Resour. Res., 52, 3701–3721, https://doi.org/10.1002/2015WR017225, 2016.
Sarhadi, A., Ausín, M. C., Wiper, M. P., Touma, D., and Diffenbaugh, N. S.: Multidimensional risk in a nonstationary climate: Joint probability of increasingly severe warm and dry conditions, Sci. Adv., 4, eaau3487, https://doi.org/10.1126/sciadv.aau3487, 2018.
Schmutz, J., Vrac, M., François, B., and Bulut, B.: Spatial structures of emerging hot and dry compound events over Europe from 1950 to 2023, Nat. Hazards Earth Syst. Sci., 26, 881–900, https://doi.org/10.5194/nhess-26-881-2026, 2026.
Schulzweida, U.: CDO User Guide, https://doi.org/10.5281/zenodo.10020800, 2023.
Schumacher, D. L., Zachariah, M., Otto, F., Barnes, C., Philip, S., Kew, S., Vahlberg, M., Singh, R., Heinrich, D., Arrighi, J., van Aalst, M., Thalheimer, L., Raju, E., Hauser, M., Hirschi, M., Gudmundsson, L., Beaudoing, H. K., Rodell, M., Li, S., Yang, W., Vecchi, G. A., Vautard, R., Harrington, L. J., and Seneviratne, S. I.: High temperatures exacerbated by climate change made 2022 Northern Hemisphere soil moisture droughts more likely, World Weather Attribution, 55 pp., https://www.worldweatherattribution.org/wp-content/uploads/WCE-NH-drought-scientific-report.pdf (last access: 20 October 2026), 2022.
Seneviratne, S. I., Zhang, X., Adnan, M., Badi, W., Dereczynski, C., Di Luca, A., Ghosh, S., Iskandar, I., Kossin, J., Lewis, S., Otto, F., Pinto, I., Satoh, M., Vicente-Serrano, S. M., Wehner, M., and Zhou, B.: Weather and Climate Extreme Events in a Changing Climate, in: Climate Change 2021: The Physical Science Basis. Contribution of Working Group I to the Sixth Assessment Report of the Intergovernmental Panel on Climate Change, edited by: Masson-Delmotte, V., Zhai, P., Pirani, A., Connors, S. L., Péan, C., Berger, S., Caud, N., Chen, Y., Goldfarb, L., Gomis, M. I., Huang, M., Leitzell, K., Lonnoy, E., Matthews, J. B. R., Maycock, T. K., Waterfield, T., Yelekçi, O., Yu, R., and Zhou, B., Cambridge University Press, Cambridge, United Kingdom and New York, NY, USA, 1513–1766, https://doi.org/10.1017/9781009157896.013, 2021.
Skliris, N., Zika, J. D., Nurser, G., Josey, S. A., and Marsh, R.: Global water cycle amplifying at less than the Clausius–Clapeyron rate, Sci. Rep.-UK, 6, 38752, https://doi.org/10.1038/srep38752, 2016.
Smith, K. E., Sen Gupta, A., Amaya, D., Benthuysen, J. A., Burrows, M. T., Capotondi, A., Filbee-Dexter, K., Frölicher, T. L., Hobday, A. J., Holbrook, N. J., Malan, N., Moore, P. J., Oliver, E. C. J., Richaud, B., Salcedo-Castro, J., Smale, D. A., Thomsen, M., and Wernberg, T.: Baseline matters: Challenges and implications of different marine heatwave baselines, Prog. Oceanogr., 231, 103404, https://doi.org/10.1016/j.pocean.2024.103404, 2025.
Teleubay, Z., Quiring, S. M., and Leasor, Z.: Estimation of impacts-based drought thresholds for the US Corn Belt, Agr. Forest Meteorol., 372, 110715, https://doi.org/10.1016/j.agrformet.2025.110715, 2025.
The New York Times: St. Louis bears brunt of heat wave as U.S. toll rises, 24 July, https://www.nytimes.com/1983/07/24/us/st-louis-bears-brunt-of-heat-wave-as-us-toll-rises.html (last access: 20 October 2026), 1983.
Toreti, A., Bavera, D., Avanzi, F., Cammalleri, C., De Felice, M., De Jager, A., Di Ciollo, C., Gabellani, S., Maetens, W., Magni, D., Manfron, G., Masante, D., Mazzeschi, M., Mccormick, N., Naumann, G., Niemeyer, S., Rossi, L., Seguini, L., Spinoni, J., and Van Den Berg, M.: Drought in northern Italy March 2022: GDO analytical report, Publications Office, LU, https://doi.org/10.2760/781876, 2022.
Trenberth, K. E., Branstator, G. W., and Arkin, P. A.: Origins of the 1988 North American Drought, Science, 242, 1640–1645, https://doi.org/10.1126/science.242.4886.1640, 1988.
UNEP: Impacts of summer 2003 heat wave in Europe, Environment Alert Bulletin, No. 2, United Nations Environment Programme, DEWA/GRID-Europe, Geneva, Switzerland, 4 pp., https://wedocs.unep.org/handle/20.500.11822/40942 (last access: 18 October 2026), 2004.
Ward, P. J., Daniell, J., Duncan, M., Dunne, A., Hananel, C., Hochrainer-Stigler, S., Tijssen, A., Torresan, S., Ciurean, R., Gill, J. C., Sillmann, J., Couasnon, A., Koks, E., Padrón-Fumero, N., Tatman, S., Tronstad Lund, M., Adesiyun, A., Aerts, J. C. J. H., Alabaster, A., Bulder, B., Campillo Torres, C., Critto, A., Hernández-Martín, R., Machado, M., Mysiak, J., Orth, R., Palomino Antolín, I., Petrescu, E.-C., Reichstein, M., Tiggeloven, T., Van Loon, A. F., Vuong Pham, H., and de Ruiter, M. C.: Invited perspectives: A research agenda towards disaster risk management pathways in multi-(hazard-)risk assessment, Nat. Hazards Earth Syst. Sci., 22, 1487–1497, https://doi.org/10.5194/nhess-22-1487-2022, 2022.
Wilhite, D. A. and Glantz, M. H.: Understanding: the Drought Phenomenon: The Role of Definitions, Water Int., 10, 111–120, https://doi.org/10.1080/02508068508686328, 1985.
Witte, J. C., Douglass, A. R., da Silva, A., Torres, O., Levy, R., and Duncan, B. N.: NASA A-Train and Terra observations of the 2010 Russian wildfires, Atmos. Chem. Phys., 11, 9287–9301, https://doi.org/10.5194/acp-11-9287-2011, 2011.
World Meteorological Organization: Standardized Precipitation Index User Guide, edited by: Svoboda, M., Hayes, M., and Wood, D., WMO-No. 1090, Geneva, Switzerland, https://library.wmo.int/records/item/39629-standardized-precipitation-index-user-guide (last access: 20 October 2026), 2012.
Wu, H., Su, X., and Singh, V. P.: Blended Dry and Hot Events Index for Monitoring Dry-Hot Events Over Global Land Areas, Geophys. Res. Lett., 48, e2021GL096181, https://doi.org/10.1029/2021GL096181, 2021.
Zhang, R., Sun, C., Zhu, J., Zhang, R., and Li, W.: Increased European heat waves in recent decades in response to shrinking Arctic sea ice and Eurasian snow cover, npj Climate and Atmospheric Science, 3, https://doi.org/10.1038/s41612-020-0110-8, 2020.
Zhang, W., Wu, Y., Guo, H., Li, W., An, J., and Wang, S.: Temporal and spatial response of agricultural drought to meteorological drought in inner Mongolia plateau inland river basin, Sci. Rep.-UK, 15, 28225, https://doi.org/10.1038/s41598-025-14236-0, 2025.
Zhou, S., Yu, B., and Zhang, Y.: Global concurrent climate extremes exacerbated by anthropogenic climate change, Sci. Adv., 9, eabo1638, https://doi.org/10.1126/sciadv.abo1638, 2023.
Zou, X., Zhai, P., and Zhang, Q.: Variations in droughts over China: 1951–2003, Geophys. Res. Lett., 32, 2004GL021853, https://doi.org/10.1029/2004GL021853, 2005.
Zscheischler, J. and Seneviratne, S. I.: Dependence of drivers affects risks associated with compound events, Sci. Adv., 3, 1–11, https://doi.org/10.1126/sciadv.1700263, 2017.
Zscheischler, J., Westra, S., Van Den Hurk, B. J. J. M., Seneviratne, S. I., Ward, P. J., Pitman, A., Aghakouchak, A., Bresch, D. N., Leonard, M., Wahl, T., and Zhang, X.: Future climate risk from compound events, Nat. Clim. Change, 8, 469–477, https://doi.org/10.1038/s41558-018-0156-3, 2018.
Zscheischler, J., Martius, O., Westra, S., Bevacqua, E., Raymond, C., Horton, R. M., van den Hurk, B., AghaKouchak, A., Jézéquel, A., Mahecha, M. D., Maraun, D., Ramos, A. M., Ridder, N. N., Thiery, W., and Vignotto, E.: A typology of compound weather and climate events, Nature Reviews Earth and Environment, 1, 333–347, https://doi.org/10.1038/s43017-020-0060-z, 2020.