
the Creative Commons Attribution 4.0 License.
the Creative Commons Attribution 4.0 License.
 | 05 Nov 2026
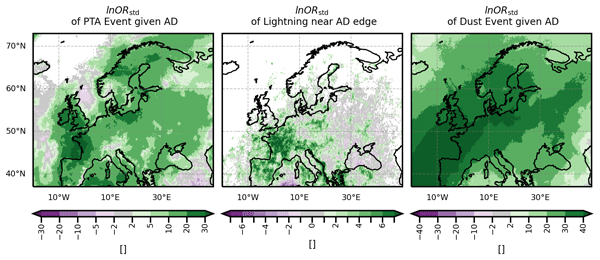
Co-occurrence of atmospheric deserts over Europe with strong positive temperature anomalies, thunderstorms, and dust events

Achim Zeileis
Isabell Stucke
Reto Stauffer
Georg J. Mayr
Atmospheric deserts are air masses originating in hot, dry, and deep convective boundary layers over arid and/or elevated regions and are advected across cooler, moister regions while possibly being modified by diabatic processes and differential advection. They are frequently advected over Europe and can modify temperature profiles throughout the free troposphere, with implications for convective potential. Atmospheric deserts generalise elevated mixed layers, which are known to influence near-surface temperatures and the formation of thunderstorms, but it remains unknown how frequently atmospheric deserts co-occur with strong positive temperature anomalies and lightning. We also investigate if atmospheric deserts frequently co-occur with dust events, since the source region for European atmospheric deserts is also the main source region for dust events.
Atmospheric desert air is tracked during the study period from May 2022 to April 2024, using a direct detection method based on Lagrangian trajectories initiated at a very high spatio-temporal resolution. Positive temperature anomaly events, thunderstorms, and dust events are identified from reanalysis datasets and ground based lightning observation data. Conditional probabilities and corresponding standardised log-odds ratios provide insight into whether the mentioned extreme events occur more frequently in the presence of atmospheric deserts.
The probability of events with strong positive temperature anomalies, thunderstorms, or dust anomalies is enhanced in the presence of atmospheric deserts in almost the entire domain. In most of the domain, strong positive temperature anomaly events are more likely given the presence of atmospheric desert air, but it could not be confirmed that the limitation of boundary layer growth by the capping stable layer was the main driver. Lightning probability is clearly enhanced along the atmospheric desert edges, and, in contrast to expectations, also in the atmospheric desert centres. In western Europe, up to 50 % of occurrences of atmospheric desert air are accompanied by unusually high amounts of dust. Dust events co-occur almost exclusively with atmospheric deserts.
- Article
(6794 KB) - Full-text XML
- BibTeX
- EndNote


Elevated mixed layers (EML) have long been linked to high near surface temperatures (e.g. Sibley, 2012; Cordeira et al., 2017; de Villiers, 2020) and severe thunderstorms (e.g. Carlson and Ludlam, 1968; Lanicci and Warner, 1991b; Dahl and Fischer, 2016). EMLs can form when the warm, well-mixed convective boundary layer (CBL) of arid and/or elevated regions is advected over cooler and moister regions, while retaining its well-mixed vertical structure (Carlson and Ludlam, 1968).
However, during multi-day transport, diabatic processes and differential advection will degrade the well-mixed structure (evidence also found in Schultz et al., 2025a, for a Spanish plume event). It can be expected that also this modified EML air can alter the stability in the target region and have implications for temperature and thunderstorm formation, even if it is not necessarily recognisable as a well-mixed layer anymore (Farrell and Carlson, 1989; Johns and Dorr, 1996; Gitro et al., 2019; Fix et al., 2024; Schultz et al., 2025a). Little is known about their prevalence and impacts, however, as EML detection methods cannot track these modified air masses once their well-mixed structure is eroded (Gitro et al., 2019).
Therefore, we introduced atmospheric deserts (ADs) as a new concept for this more general case (Fix et al., 2024; Fix-Hewitt et al., 2026): ADs are air masses that originate in the hot, dry, deep convective boundary layers (CBLs) of desert, (semi-) arid and/or elevated regions and are subsequently advected downstream, including cases where the original well-mixed structure has been modified. Unlike EMLs, which are defined by their well-mixed vertical structure (even in the target region), ADs are defined by their origin, allowing for enroute modification. Our direct detection approach via Lagrangian tracking allows the investigation of ADs for the first time, as it does not require prior knowledge about the vertical structure of the AD – unlike EML detection methods (i.e. Carlson and Ludlam, 1968; Andrews et al., 2024).
Applying this approach, the most relevant findings from our previous studies (Fix et al., 2024; Fix-Hewitt et al., 2026) are: ADs occur frequently in Europe and affect large parts of the European domain, however only 2.5 % of identified air streams conserve their thermodynamic properties like expected for EMLs, indicating that most cases would go undetected by the EML detection methods. In an AD case study in mid June 2022 lightning occurred close to the AD edge at 800 hPa, and high near-surface temperatures were recorded, yet it remains unknown how often ADs are accompanied by high near-surface temperatures and thunderstorms. The well-documented links between EMLs, high temperatures (Carlson and Ludlam, 1968; Cordeira et al., 2017), and convective initiation (e.g. Carlson and Ludlam, 1968; Keyser and Carlson, 1984; Lanicci and Warner, 1991b) motivate the investigation of whether these connections extend to ADs more generally.
This work therefore addresses the following questions: Do ADs frequently co-occur with events of strong positive temperature anomalies (PTAs)? Is the probability of thunderstorms elevated near AD edges? Is thunderstorm probability in the AD centre reduced or enhanced? Additionally, the source region of ADs in Europe is North Africa, which contains the largest and most persistently active dust sources (Prospero et al., 2021), which makes ADs prone to transport dust towards Europe. So another research question becomes: How often do ADs and strong dust events co-occur? We aim to assess co-occurrence and spatial associations, not causality. Extending the concept from EMLs to the more general ADs will advance our understanding of how desert-origin air masses – including modified EMLs – shape temperature extremes, convection, and dust events across Europe.
This article is structured as follows: necessary background on ADs, EMLs, and dust events is given in Sect. 2. The data and methods used to investigate the co-occurrence of ADs with positive temperature anomalies, thunderstorms and dust events are presented in Sects. 3 and 4. Results for the co-occurrence of ADs with positive temperature anomalies, thunderstorms, and dust are shown and discussed in Sects. 5, 6, and 7, respectively. A summary is presented in Sect. 8.
Understanding how EMLs affect near-surface heat and convection provides the basis for investigating the broader impacts of ADs. As warm and dry air masses, EMLs are advected over cooler and moister local air masses. They then form an elevated, well-mixed layer with high potential temperature, which often leads to a layer of very strong stability – a “cap” or even capping inversion – immediately atop the local boundary layer (BL; e.g. Carlson and Ludlam, 1968; Carlson et al., 1983; Farrell and Carlson, 1989; Lanicci and Warner, 1991a; Andrews et al., 2024). Strong capping can confine small-scale convection to a shallow layer and hinder the growth of the local boundary layer, leading to near-surface warming (Cordeira et al., 2017). The consequences are high near surface temperatures, higher wet bulb temperatures and increased instability (Carlson and Ludlam, 1968; Carlson et al., 1983; Cordeira et al., 2017, and others).
In spite of the resulting increased convective available potential energy (CAPE), thunderstorms are unlikely to initiate in the centre of EMLs, where convective inhibition (CIN) is large due to the stable stratification above the BL (e.g. Carlson et al., 1980, 1983; Banacos and Ekster, 2010; Cordeira et al., 2017; Ribeiro and Bosart, 2018). Near the edges, however, the cap (and CIN) tends to be weaker and its base height higher, so that thunderstorms can develop. Various processes have been suggested to erode the cap and trigger convection near the EML edges, for example underrunning of the moist air from below (Carlson et al., 1983; Farrell and Carlson, 1989; Johns and Dorr, 1996), and ageostrophic circulations at the midlevel baroclinic zone or a convergence line near the edge (Keyser and Carlson, 1984; Dahl and Fischer, 2016). Several studies associated severe weather events like tornados, mesoscale convective systems, and mesocyclones with EMLs (Farrell and Carlson, 1989; Johns and Dorr, 1996; Lewis and Gray, 2010; Peyraud, 2013; Cordeira et al., 2017; Feldmann et al., 2021). The severity, as well as size and location of convection are influenced by the EML cap (Lanicci and Warner, 1991b; Li et al., 2021). The consequence is that especially severe storms are observed near the EML edge (Carlson and Ludlam, 1968; Carlson et al., 1980, 1983; Keyser and Carlson, 1984; Dahl and Fischer, 2016), a feature that has proven useful for thunderstorm forecasting (Young and Grahame, 2023).
Extending this framework to ADs is therefore of interest, particularly given their frequent occurrence across Europe. Fix-Hewitt et al. (2026) show that ADs over Europe are frequent (up to 60 % of the time in some regions), albeit short-lived (persistence of approximately one day duration on average). They find that ADs can cover large parts of Europe (up to 72 % of the land-area, results based on May 2022–April 2024, 30° W to 60° E and 37 to 73°), and extend through most of the free troposphere, but rarely reside near the BLH forming a lid. The associated synoptic patterns are characterised by either a trough extending far south, or a ridge extending far north, leading to east- or north-eastward transport of air from the source to the target region. Lightning was also observed near the air mass edge by Fix et al. (2024) in the more general case of an AD. Multiple air streams can be distinguished, following different trajectories and thermodynamic evolution (e.g. increase or decrease in potential temperature possibly by condensation, evaporation, mixing, and/or radiation). Only one of five air streams – the rarest one – almost conserves its thermodynamic properties, which makes it EML-like (Fix-Hewitt et al., 2026). Hence, often the AD air is altered during the transport and the well-mixed properties can be lost, so investigating whether processes known for EMLs also extend to the more general case of ADs is necessary and will further the understanding of how this large scale phenomenon can affect the local weather.
Northern Africa contains the largest and most active dust sources in the world (Prospero et al., 2021), so ADs can transport dust to the target region by definition, but whether they carry significant loads depends on mobilisation processes in the source region, controlled by wind and soil properties (e.g. Knippertz, 2014; Barkan et al., 2005). The synoptic situations associated with dust events in Europe (e.g. Barkan et al., 2005; Varga et al., 2013; Rostási et al., 2022) resemble those connected to extensive AD events (Fix-Hewitt et al., 2026). The Saharan air layer (Carlson and Prospero, 1972; Prospero and Carlson, 1972) provides a link between dust, EMLs, and ADs. Although it is often characterised as a dust-laden air mass advected westward from the Sahara across the tropical Atlantic (Prospero and Carlson, 1972; Gutleben et al., 2020), several studies also describe it as well mixed (i.e., an EML; Carlson and Prospero, 1972; Karyampudi et al., 1999; Carlson, 2016; Gutleben et al., 2020). However, Gkikas et al. (2016) argue that dust outbreaks towards Europe and the Mediterranean differ in vertical structure from those towards the Atlantic. Since the amount of dust carried by ADs varies, understanding its prevalence is important given its wide-ranging impacts: beyond effects on visibility, air quality, and deposition (Penner et al., 2001; Barkan et al., 2005; Helmert et al., 2007; Varga et al., 2013; Bangert et al., 2012; Knippertz and Stuut, 2014), dust can reduce incoming solar radiation at the surface while warming the atmosphere aloft, stabilising the column, although the magnitude of this effect is uncertain given dust's strong spatiotemporal variability (e.g., Nabat et al., 2015; Highwood and Ryder, 2014). Beyond its radiative effects, dust also modifies cloud microphysics and precipitation, including dusty cirrus formation (Seifert et al., 2023; Hermes et al., 2024), suppression of warm rain (Rosenfeld et al., 2001), and intensification of storms, heavier precipitation, and favoured hail formation (Xi et al., 2026; Brennan and Wilhelm, 2025).
We analyse the 2-year period from 1 May 2022, 00:00 UTC to 30 April 2024, 23:00 UTC (consistent with Fix-Hewitt et al., 2026). To investigate the co-occurrence of ADs and positive temperature anomalies (PTAs), thunderstorms, and dust, we employ an atmospheric reanalysis dataset (ERA5, Sect. 3.1; Hersbach et al., 2020), lightning data (Blitzortung.org, Sect. 3.2; Wanke et al., 2014), and a reanalysis of the atmospheric composition (EAC4, Sect. 3.3; Inness et al., 2019).
3.1 Atmospheric reanalyis
The latest global reanalysis, ERA5, from the European Centre for Medium Range Weather Forecasts (ECMWF; Hersbach et al., 2020), is used in this study. The model configuration corresponds to IFS Cy41r2 and data is available at 0.25° horizontal grid spacing. The data are provided hourly on 137 vertical model levels extending up to 1 Pa (Hersbach et al., 2020). Consequently, the vertical spacing is approximately 20 m near the surface and around 300 m at 500 hPa. In this work, ERA5 single-level and model-level fields on the lowest 74 model levels (from the surface up to roughly 120 hPa) are employed. The domain encompasses northern Africa and Europe, specifically from 30° W to 60° E and 15 to 73° N, to calculate the trajectories, while the analysis is restricted to north of 37° N. For climatological reference, we use the 30-year period prior to the study period, hence January 1992–December 2021.
3.2 Lightning data
A lightning measurement dataset is used as a proxy for thunderstorm location. We use data from the lightning location network “Blitzortung” (Wanke et al., 2014). A large number of volunteers around the world have contributed to this network by setting up very low-frequency sensors. The network allows to reliably locate widespread lightning activity, although it cannot detect weak strokes at this frequency range, and isolated single-stroke detections are more prone to false positives (e.g., from noise or misclassification). Physically, genuine convective lightning activity is expected to produce spatially clustered strokes rather than a single isolated detection. We therefore exclude grid cells where only a single flash is recorded with no other flashes in the adjacent ERA5 grid-cells in the same hour. This filtering is conservative and consistent with our focus on widespread lightning activity associated with ADs. Data are aggregated to the ERA5 grid and timestamps are floored to the previous full hour to match the hourly resolution. This results in a gridded dataset recording the presence or absence of lightning for each ERA5 grid cell and hour. In this work, “lightning occurrence” or “lightning probability” will refer to these binary, cell-aggregated lightning data, not individual strokes.
3.3 Atmospheric composition reanalysis
The fourth generation ECMWF global reanalysis of atmospheric composition, EAC4 (ECMWF Atmospheric Composition Reanalysis 4; Inness et al., 2019), is used as a dust reanalysis product. It provides dust aerosol optical depth at 550 nm (AOD550 nm) every 3 h and at 0.75° grid spacing. For comparability, we bi-linearly remap (in space) and linearly interpolate (in time) the EAC4 data to match the spatio-temporal resolution of the ERA5 data (0.25°, 1 h; using cdo, Schulzweida, 2023). Dust aerosol optical depth (AOD550 nm) is a single level variable which we use to determine unusually dusty periods during the study time period. Since the EAC4 data is only available from 2003 onwards, the years 2003–2021 are used for climatological reference in this case.
A trajectory model is needed for the AD detection (LAGRANTO, Sect. 4.1; Sprenger and Wernli, 2015). The detection of the AD edge is explained in Sect. 4.2. The calculation of the anomalies, definition of events and statistical methods for the event association are presented in Sect. 4.3 and 4.4.
4.1 Trajectory calculation and detection of the atmospheric desert air mass
The calculation of the trajectories and detection of the AD – the air mass originating in the BL of desert, (semi-) arid and/or elevated source regions – follows Fix-Hewitt et al. (2026): trajectories are calculated forward in time with the Lagrangian Trajectory Analysis Tool (LAGRANTO; Sprenger and Wernli, 2015). They are initiated hourly along a “curtain” marking the northern boundary of the source region in North Africa (see Fig. 1). The grid spacing of initialisation locations is 5 km in the horizontal and 10 hPa in the vertical between 1100 and 400 hPa. Only those trajectories are calculated forward that have a northward (Europe-ward) wind component and start below the interpolated boundary layer height BLHi (linearly interpolated between daily maxima of the BLH, as a way to take into account former BLH air that resides above the night-time BLH as residual layer). Trajectories are integrated for 120 h. This results in approximately 108 million trajectories, of which 61 million pass 37° N and are therefore taken into account in this analysis. Trajectories are aggregated to grid boxes of 0.25° × 0.25° × 500 m. A grid box containing at least one trajectory is defined as an AD-cell, and the AD air mass consists of all AD-cells combined. If there is any AD-cell in a column, this is defined as an AD-column. For the statistical analysis in this study, “AD presence” refers to the presence of an AD-column, unless noted otherwise. For more details on the detection method refer to Fix-Hewitt et al. (2026).
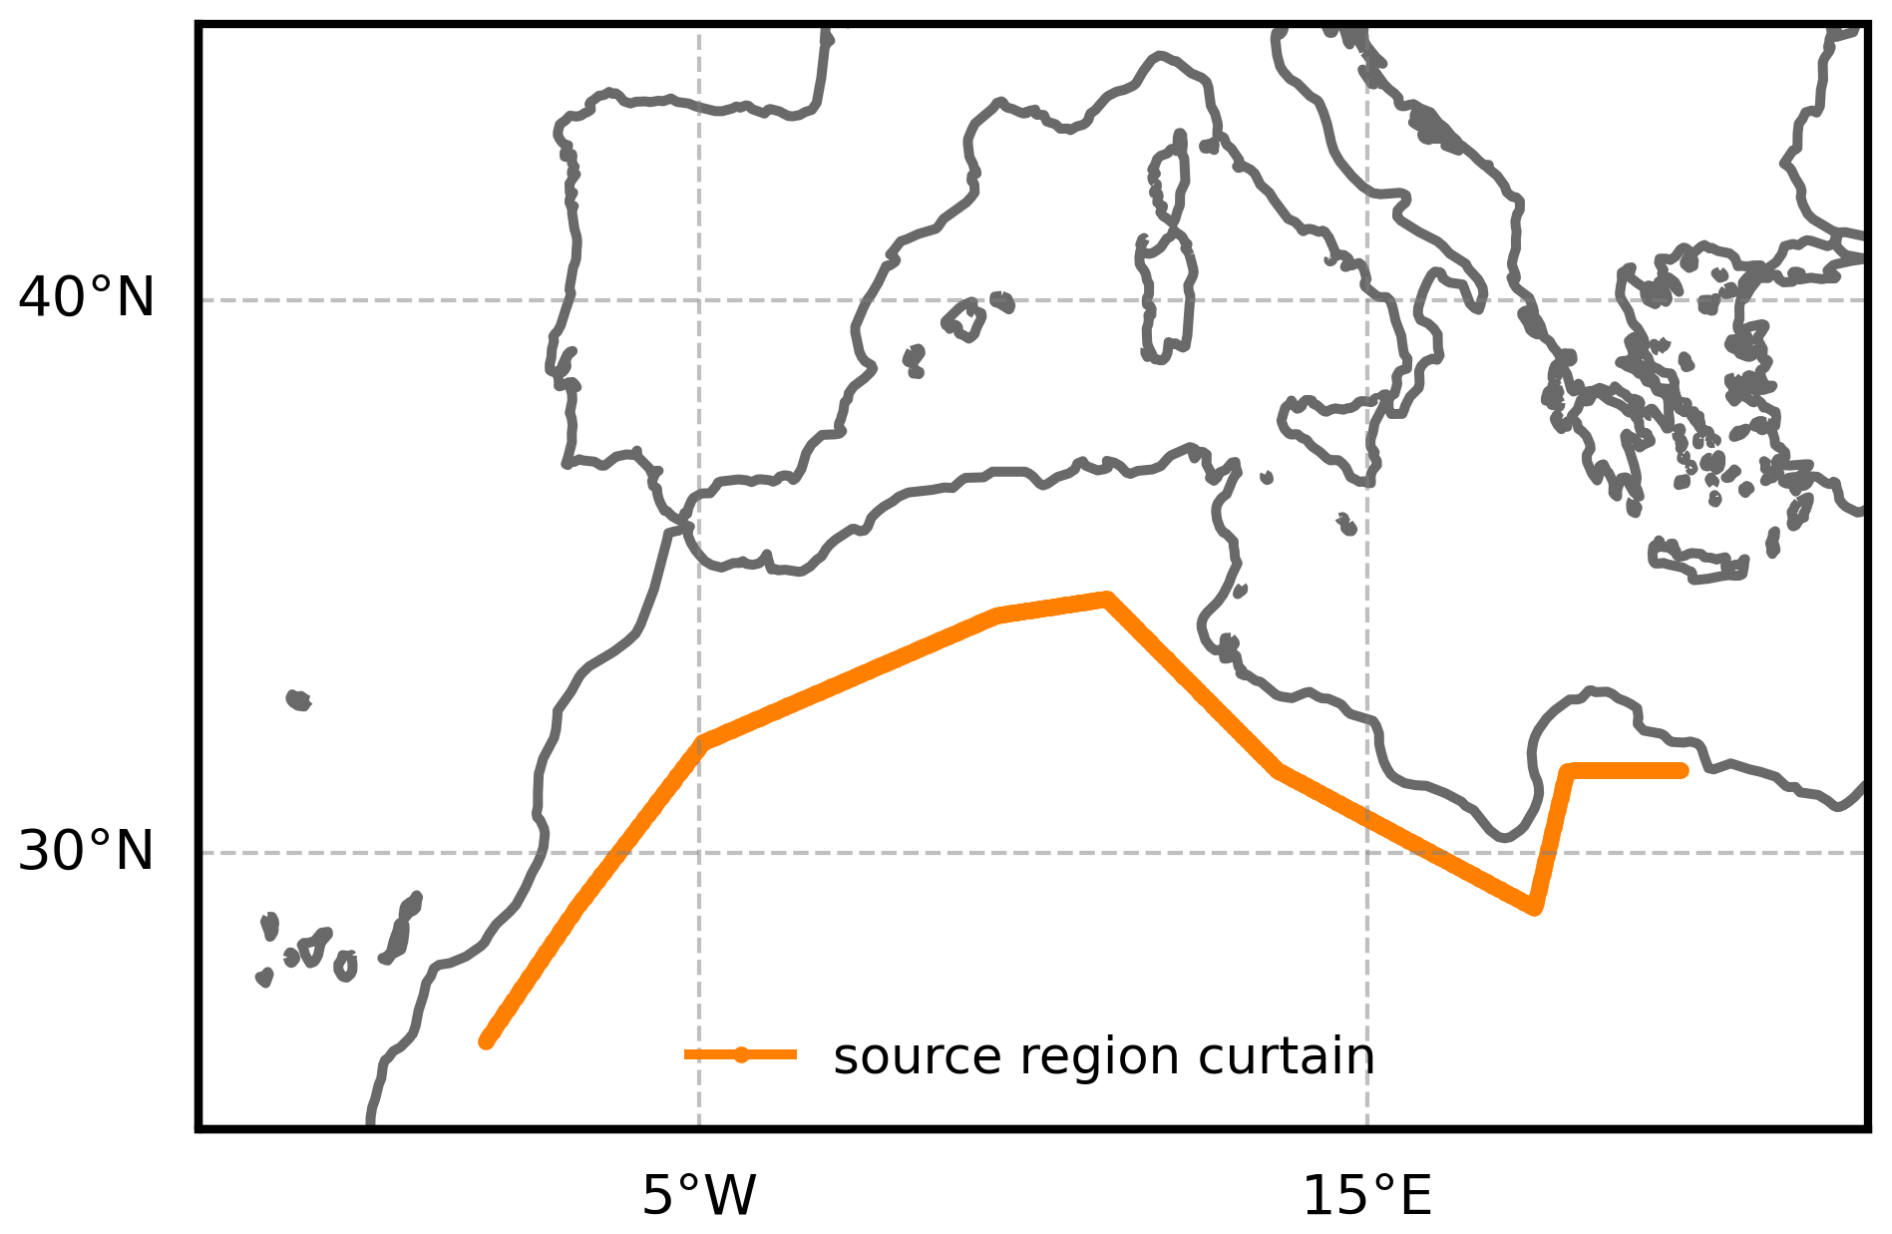
Figure 1Map of the location of the curtain from which the trajectories are initiated.
4.2 Detection of the AD edge
In order to analyse effects (especially thunderstorm occurrence) that are connected to the edge of the AD, the air mass edge has to be detected from the binary AD-cell data in a respective layer, L. To obtain a smoother and more continuous boundary, small isolated gaps within detected AD regions and isolated noisy pixels or pixel clusters outside the main regions were removed prior to edge detection. This is done using standard mathematical morphology operations used in image processing. The edge is then detected from this smoothed AD region, again using a morphology operation. A more detailed description and schematic figure of the edge detection algorithm can be found in Appendix A (Sect. A1).
To assess effects caused by proximity to the edge or the air mass centre, we classify grid cells by their distance to the AD edge. Let L be the layer for which the edge is detected, d the shortest distance from a cell to the detected edge (Euclidean distance in number of cells), and D1 < D2 two distance criteria. Then cells are classified as follows:
The cells with AD in L but D1 ≤ d < D2 are excluded to allow for a clear separation between “near-edge” and “centre” cells. Cells that do not have AD in L and satisfy d ≥ D2 are not considered, as they are neither close to the edge at the level of interest nor within the AD centre, even if they might have AD air present at other levels.
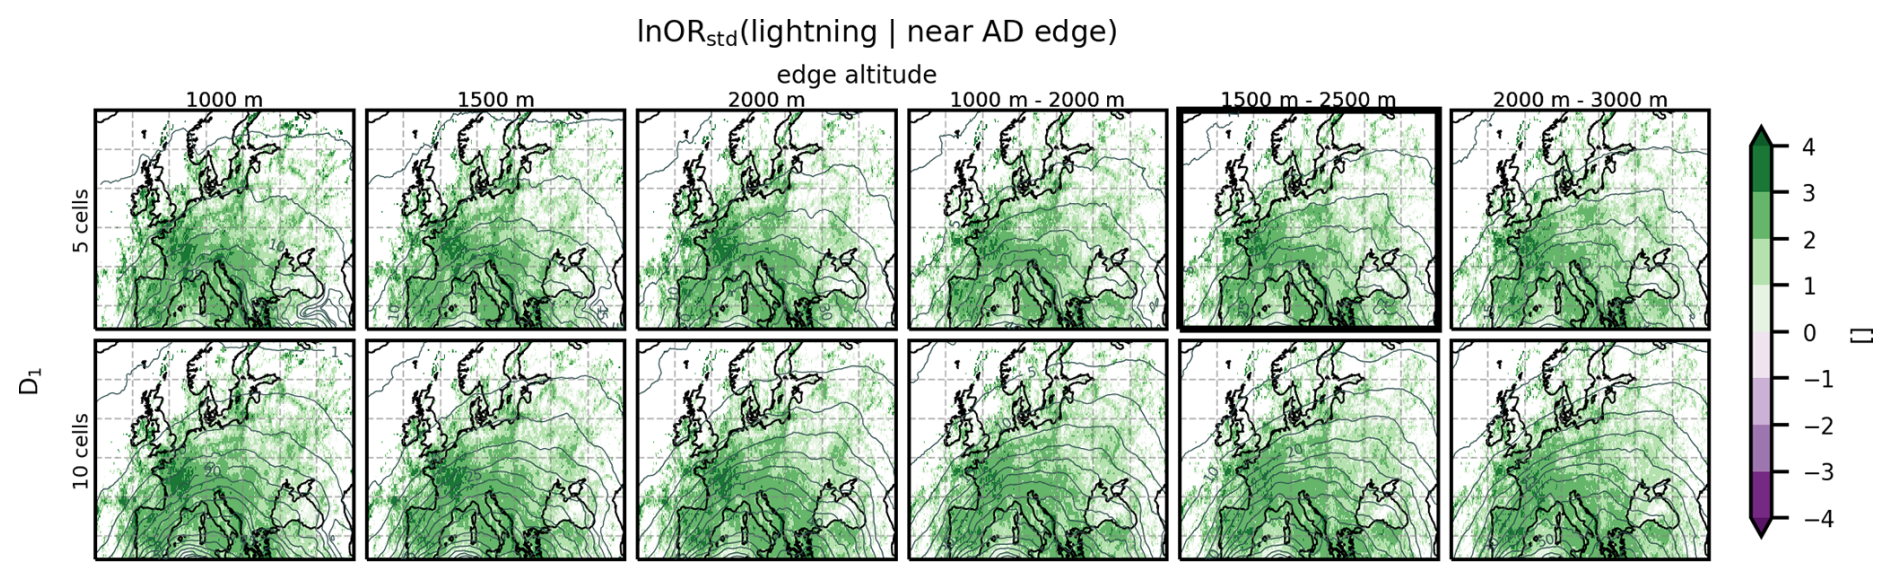
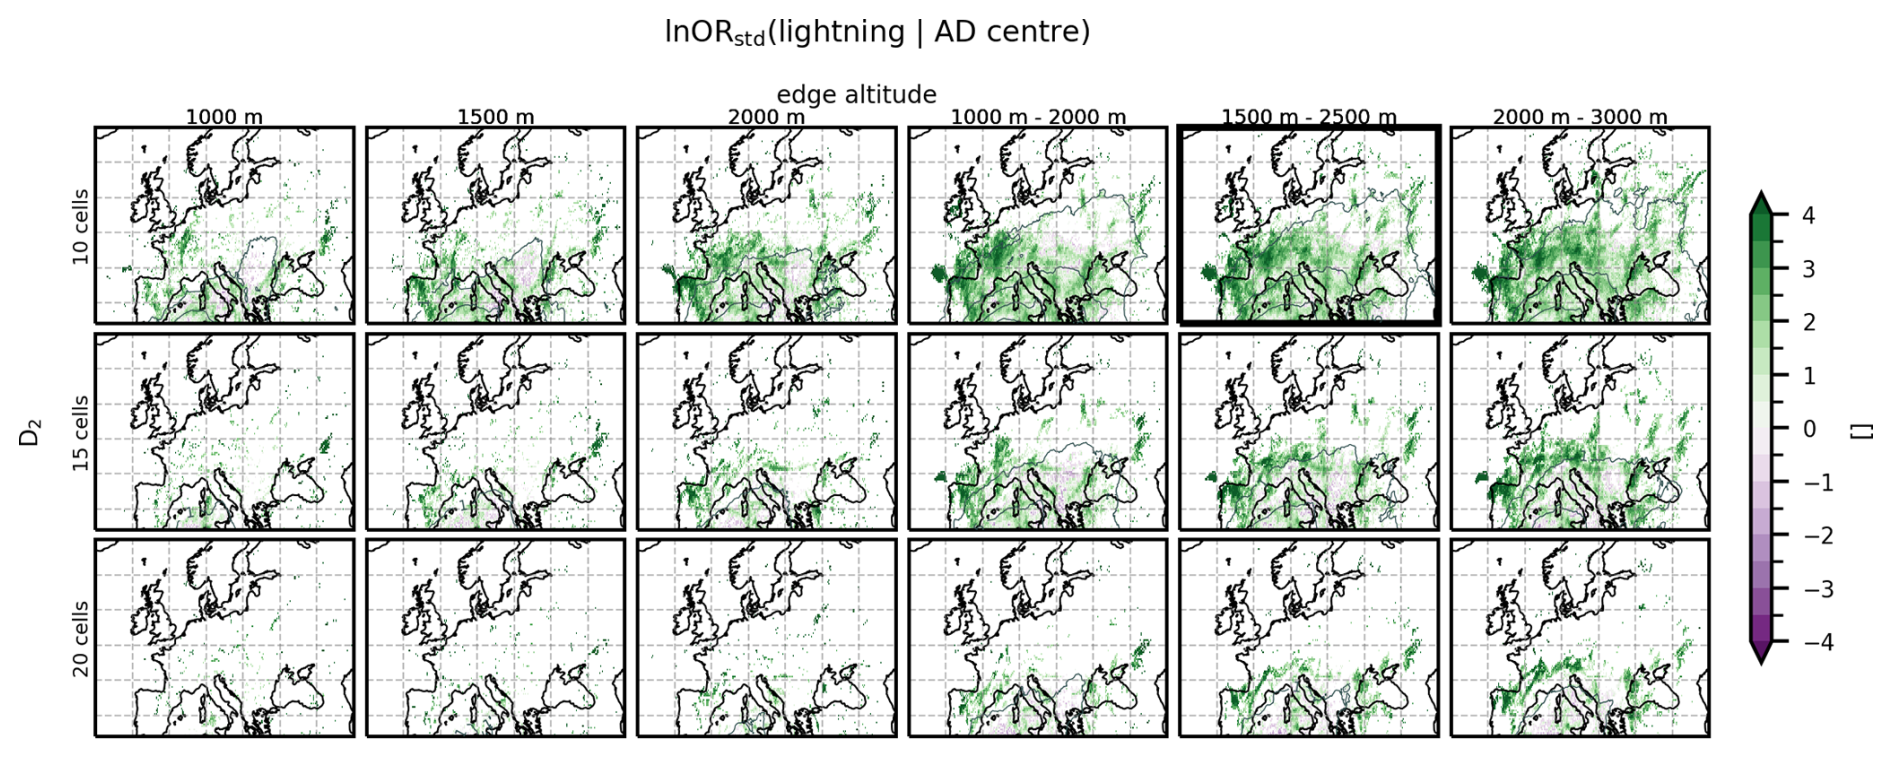
The edge detection can be applied for different layers L, which can be individual levels, or vertically aggregated layers. We applied the edge detection algorithm to individual levels (1500, 2000, 2500 m) and to 1.5 km thick layers (AD-cell centre in 1–2, 1.5–2.5, 2–4 km). The results showed little sensitivity to the exact altitude or layer thickness (Figs. A2, A3), but using a layer of 1.5 km (3 levels thick) instead of only one level makes the edge less noisy. We therefore define the AD edge from a layer extending from 1250 to 2750 m (AD-cell centres at 1.5, 2.0, and 2.5 km), approximately corresponding to the region at and above the local BL and including the 800 hPa AD edge where lightning occurred in the study by Fix et al. (2024).
A sensitivity analysis showed that the results are largely insensitive to whether D1 is chosen as 5 or 10 grid cells (approx. 150 or 300 km, Fig. A2). We therefore adopt D1 = 5 (≈ 150 km) cells for the near-edge definition. Increasing D2 from 10 to 15 or 20 cells substantially reduces the number of AD-centre cells, hence the number of observations to interpret (Fig. A3). We use D2 = 10 cells (≈ 300 km) for the AD centre definition, to retain as many observations as possible. We consider 10 cells sufficiently far from the edge to avoid edge-related influences. With these thresholds, 64.4 million grid cells were classified as near-edge and 9.2 million as AD-centre, while 12.2 million cells were excluded from either category to maintain a clear distinction between the two regions.
4.3 Anomalies and event definition
We identify hours with strong positive temperature anomaly and anomalously high amounts of dust, respectively, using standardised anomalies of T2 m and AOD550 m. For T2 m we use 1992–2021 as the reference period, to follow the standard 30-year climatological window, which yields more robust estimates than a shorter period (especially in the presence of a climate trend). Because a climate-change signal can be expected in T2 m, the full T2 m time-series (January 1992–April 2024) is linearly detrended prior to anomaly calculation for each cell (using cdo, Schulzweida, 2023). The dust reanalysis data is only available from 2003 onward, so we use 2003–2021 as reference period. As no significant long-term trend is present in the dust time series (January 2003–April 2024, area-weighted, annually averaged domain means; Theil–Sen trend: −1.32 × 10⁻⁵ yr−1, p = 0.96), we do not detrend it and consider the shorter 2003–2021 reference period sufficient.
For each hour of the year, we define the climatological background as the median over the respective reference period, denoted medianclim(x), and the corresponding climatological standard deviation σclim(x). To smooth out synoptic scale variations, a 4th-order Butterworth low-pass filter is applied using a 30 d cutoff period (fc = d−1). To preserve the diurnal cycle, the filtering is performed separately for each hour of the day for T2 m. Standardised anomalies are then calculated as:
where x is the respective variable (AOD550 m or detrended T2 m) and x′ is its standardised anomaly (dimensionless). Strong events are defined by a threshold of 2 (as in Gkikas et al., 2009). This results in the following event definitions:
“Event” refers to individual hours in this study, i.e. it is not an analysis of heat waves but of individual hours (events) with strong positive temperature (or dust) anomalies. For thunderstorms, we use lightning as a proxy, so that an event is defined as any hour with a lightning flash.
4.4 Event association and log-odds ratio
We quantify the association between AD occurrence and extreme weather events using conditional probabilities and log-odds ratios (lnOR; similar approaches used in Stephenson, 2000; Mohr et al., 2019; Röthlisberger and Martius, 2019; Taszarek et al., 2020). The conditional probability P(Event∣AD) can help answer what percentage of AD occurrences comes with an event, or how likely an event is to occur, given the presence of AD air. The odds ratio (OR) compares the odds of an event in the presence of AD to those of an event in the absence of AD. The standardised log-odds ratio, ln ORstd, is based on the full 2 × 2 contingency table of joint occurrences and accounts for all combinations of event and AD presence. It is defined as the logarithm of the odds ratio divided by its standard error:
Here, OR is the odds ratio and SE is the standard error (derivation provided in Appendix A, Sect. A2). ln ORstd is centred around zero with positive values indicating increased odds of the event in the presence of AD or decreased odds in the absence of ADs. Negative values indicate decreased odds in the presence of AD or increased odds in its absence. Larger magnitudes indicate stronger evidence relative to sampling variability. Increased odds can indicate that the event may be a consequence of an AD, or that they have a common driver.
This analysis is applied to strong positive temperature anomaly events and dust events. For lightning, the same framework is additionally applied using “near AD edge” or “AD centre” as conditioning states. The shown quantities are the same, but the colour scales may vary to ensure visibility for different magnitudes.
In this section, the co-occurrence of ADs with events with strong positive temperature anomalies (PTA, > 2) is investigated. Note that we are not investigating heat waves here specifically, as we do not require longer periods of strong positive temperature anomalies, but we examine strong positive temperature anomaly events hour-by-hour. Results are shown in Sect. 5.1 before they are interpreted and discussed in Sect. 5.2.
5.1 Results for strong positive temperature anomalies
The co-occurrence of strong positive temperature anomalies and ADs is investigated using the conditional probability and the standardised ln OR for a strong positive temperature anomaly event given the presence of AD air. Figure 2a shows the total, unconditional probability of a strong positive temperature anomaly event P(PTA Event). In some regions, particularly in western Europe and over the sea, strong positive temperature anomaly events occur in more than 9 % of the time during the study period. Figure 2b shows the probability of a strong positive temperature anomaly event, given the presence of an AD (P(PTA Event ∣ AD), shading), and the conditioning probability (P(AD), contours). Conditional probabilities are highest in an arc from southwestern to northern Europe, where temperatures are unusually high during more than 10 % of the time that AD air is present (orange colours in Fig. 2b). Figure 2c shows the standardised ln OR. Positive values (green colours) in Fig. 2c indicate that strong positive temperature anomaly events are more likely to occur in the presence of AD than during its absence. It is obvious that this is the case in most of the domain, and the large values indicate strong evidence with respect to the variability. The strongest effect is visible over the Bay of Biscay and the British Isles, as well as over the Mediterranean Sea and regions neighbouring the Baltic Sea, while in the Alps and over the Anatolian peninsula the effect is much smaller or non-existent. This pattern is also reflected in the mean and median of the standardised anomalies during AD and non-AD periods: the mean and median are higher during AD than during non-AD periods in the entire domain (median is shown in Fig. B1 in Appendix B). The difference is largest in the region of the Bay of Biscay and over the British Isles, where the difference between AD and non-AD median standardised temperature anomalies reaches 1.
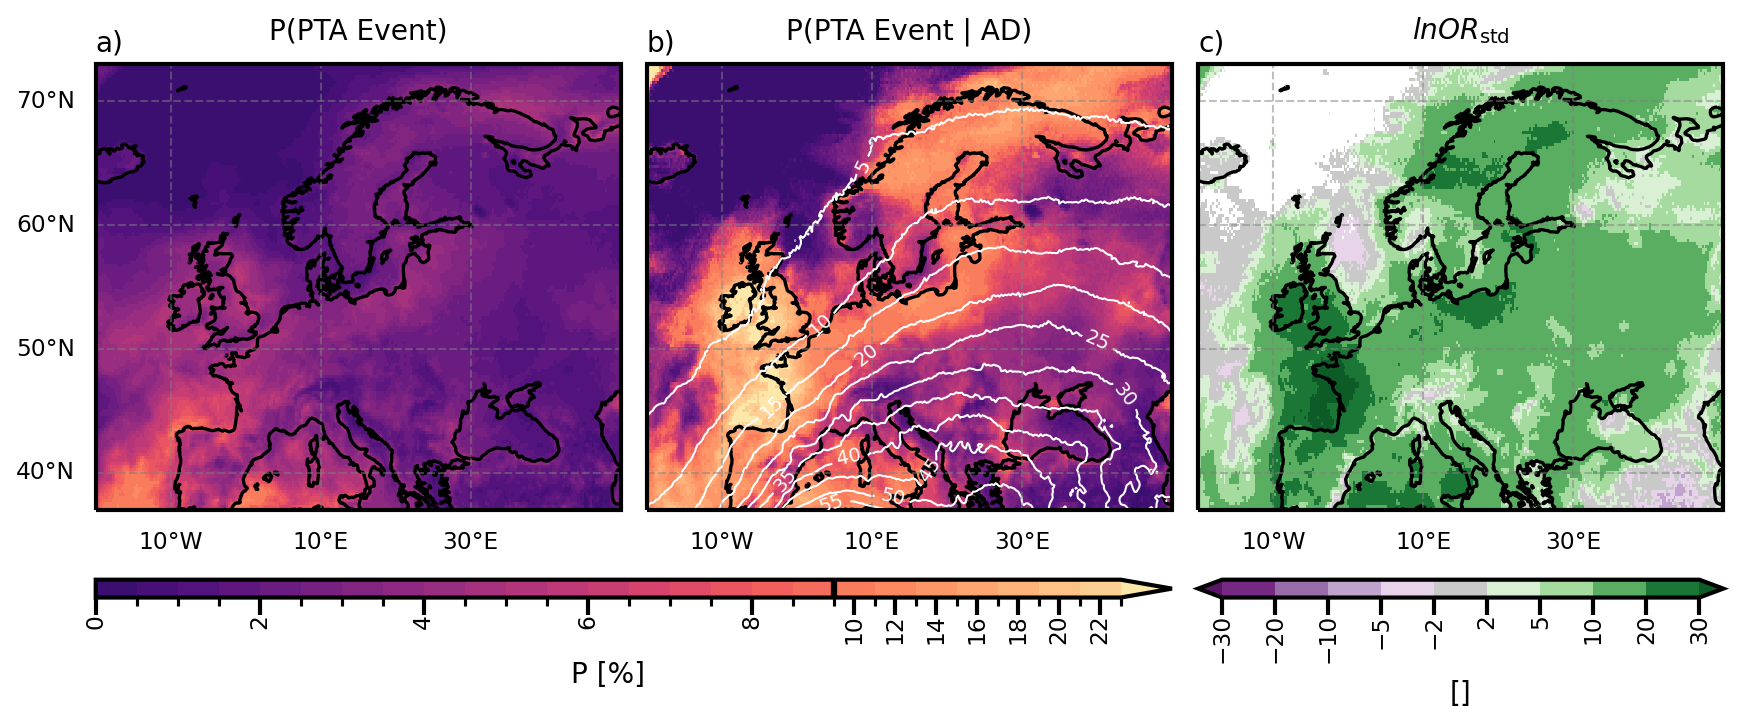
Figure 2(a) Total probability of a strong positive temperature anomaly event (PTA event, > 2) per grid cell and hour. (b) Probability of a PTA event, given the presence of AD air. Contour lines show the conditioning probability, P(AD), per cell and hour in percent, 5 percentage-points spacing. (c) Standardised ln OR for a PTA event given AD presence. Note that the colourbar for the probabilities has irregular spacing to highlight gradients at both the low and high ends of the probability range.
5.2 Discussion of strong positive temperature anomalies
A striking feature in Fig. 2a is the increased probability of positive temperature anomalies in the western Mediterranean Sea and the Atlantic, especially close to the Iberian and French coasts. This pattern is likely linked to marine heat waves that occurred in the North Atlantic and Mediterranean during the study period (e.g. Juza et al., 2024; England et al., 2025), as unusually high sea surface temperatures in these regions could explain unusually high near-surface air temperatures. To test this, we repeated the analysis excluding the periods of the two major marine heat waves (summer 2022 and summer 2023) as a diagnostic check. This reduced the probability of strong positive anomalies around the British Isles and in the western Mediterranean, supporting the interpretation that these heat waves substantially contribute to the observed pattern. We emphasize that this exclusion was used only for diagnostic purposes and is not applied in the final analysis presented here. Removing these two summers would substantially shrink our already limited two-year dataset and would eliminate summer data entirely. Extending the time series to dilute the influence of these events is not feasible given data storage constraints.
The standardised ln OR is largest in the Bay of Biscay and over the British Isles, as well as over the western Mediterranean Sea, indicating that the effect of the presence of AD air on positive temperature anomalies is strongest there (Fig. 2c). Interestingly, the British Isles experience AD air less than 10 % of the time, but more than 20 % of those cases co-occur with positive temperature anomalies (Fig. 2b). Several studies report positive temperature anomalies over the UK during Spanish plume events (de Villiers, 2020; Sibley, 2012). The Spanish plume is an EML originating over the Iberian Peninsula, although the term has frequently been misused (Schultz et al., 2025b). Some studies suggest that during Spanish plume events air also originates in northern Africa (Sibley, 2012; de Villiers, 2020; Schultz et al., 2025a), so that some Spanish plume air streams can be seen as a subset of ADs. Given that Spanish plumes are reported to produce strong warming over the UK, it may seem surprising that only around 20 % of AD events co-occur with a strong positive temperature anomaly there, even though the British Isles are among the regions where this co-occurrence is most likely. This has an important implication: even in the region where the standardised log-odds ratio suggests the strongest relationship between strong positive temperature anomaly events and the presence of ADs, AD occurrence alone is not a sufficient indicator. Therefore, additional conditions like the presence of subsidence, near-surface advection, or the stability of the AD layer, may determine whether such events occur. This emphasises the need to extend the EML (and Spanish plume) concept to the more general case of ADs, and to investigate systematically which of these conditions determine whether high temperatures accompany a given AD event.
In Fig. 2c the Alps and the Anatolian peninsula stand out as the only land regions that do not have a strongly positive standardised log-odds ratio. In these regions, also the probability of intrusion of AD air into the local BL is increased (Fix-Hewitt et al., 2026, their Fig. 7). Additionally, these regions have the lowest number of joint occurrences of AD air and strong positive temperature anomaly events (fewer than 100 occurrences, see Fig. B2). This indicates that, although the BL in these regions frequently reaches potential temperatures similar to those in the AD and thus allows penetration, other processes play a larger role in producing strong positive temperature anomalies. This is not the case for all regions with elevated terrain; the most prominent counterexample is the Iberian Peninsula, another region of elevated topography. There, the probability of AD air intruding into the local BL is likewise increased (Fix-Hewitt et al., 2026, their Fig. 7), yet ADs also co-occur with strong positive temperature anomaly events more frequently, and the odds of strong temperature anomaly events are increased in the presence of AD (Fig. 2c). One possible explanation is the near-surface intrusion of warm air into the Western Mediterranean region in combination with the AD, as described by Cos et al. (2025).
In Fix-Hewitt et al. (2026), 66 dates with extensive AD coverage were identified. On 19 of those dates at least 10 % of the area covered by AD (north of 37° N) also experienced strong positive temperature anomalies. Often, the area with strong positive temperature anomaly events is on the upstream side of the ridge axis, sometimes coinciding with areas without or with only high clouds (not shown). We do not have further explanation for this behaviour and further investigations are beyond the scope of this study or the available data. As ERA5 is not informed of the aerosol optical depth, its radiation variables are of limited use in investigating the reasons behind the patterns in strong positive temperature anomalies.
The proposed mechanism for enhanced near-surface temperatures during an EML (and thus during an AD) is that a cap of stable stratification limits the vertical growth of the CBL. Convective turbulence distributes the surface sensible heat input through the mixed layer. When that layer remains shallow, the same heat input produces larger temperature increase (Cordeira et al., 2017). According to Carlson and Ludlam (1968) one day of insolation in the presence of a capping EML can be enough to increase the wet-bulb temperature in the underlying BL significantly. However, the joint occurrence of a strong positive temperature event with an AD-imposed cap (defined as the lowest AD trajectory residing within 500 m above the BLH and the stratification in that 500 m-layer being nearly isothermal) is too rare to permit meaningful analysis. This suggests that the increased odds of strong positive temperature anomalies in the presence of AD air seen in Fig. 2c are unlikely to be primarily due to situations in which a cap of stable stratification limits BL growth leading to larger temperature increase in a shallower layer. While investigating the direct co-occurrence of ADs with strong positive temperature anomaly events already yields insightful results, potential time-lagged responses may not be captured by our co-occurrence analysis.
Moreover, strong positive temperature anomaly events frequently co-occur with ADs, but this does not necessarily imply a causal relationship. Fix-Hewitt et al. (2026) showed that the average duration of AD streaks is below one day across most of the domain (their Fig. 4) and that the lowest AD-cell resides close to the BLH is uncommon (their Fig. 6). High near-surface temperatures during ADs could be due to short-lived AD-related capping stable layers and reduced cloudiness, or unrelated diabatic heating, subsidence-driven adiabatic warming, and/or warm-air advection (Röthlisberger and Papritz, 2023). Disentangling these contributions and whether or how they are related to ADs or confounding factors is beyond the scope of this study.
Nonetheless, several processes discussed in the heat-wave literature share features with ADs and may help contextualise our findings. For example, Cos et al. (2025) describe low-level warm air intrusions from the Sahara into the Mediterranean, although Zschenderlein et al. (2019) find horizontal advection to play a minor role in European high temperatures. When air ascends in a warm conveyor belt, it releases latent heat and brings low potential vorticity air to higher levels, which can lead to an intensification of the ridge (or even atmospheric blocking; Pfahl et al., 2015). Since one air stream identified within the AD is similar to a warm conveyor belt (although from a drier source region), and ADs often occur within amplified ridges (Fix-Hewitt et al., 2026), ADs may also intensify these ridges. High temperatures can be observed in ridge situations, and especially in summer they are caused by diabatic heating due to increased insolation, and to a lesser degree due to adiabatic heating from subsidence, or even advection (Sousa et al., 2018; Lemburg et al., 2026).
EMLs are known to suppress convection in their centre due to a cap, while convective initiation preferentially occurs along their edges (e.g. Carlson and Ludlam, 1968; Keyser and Carlson, 1984; Farrell and Carlson, 1989; Cordeira et al., 2017; Ribeiro and Bosart, 2018, and many more). In the following, we examine whether this also holds for the more general case of ADs.
6.1 Results for lightning along the AD-edge versus in the AD-centre
Lightning throughout the year is a rare event locally. The unconditional probability of lightning is generally below 2 % (Fig. 3a). Higher probabilities coincide with land areas, especially mountainous regions (see white contours, Fig. 3a), where orographic lifting of the larger scale flow and orographically induced circulations provide additional mechanisms for releasing CAPE (in agreement with Enno et al., 2020). As lightning is already a rare event, conditioning it on the presence of ADs, their edges, or their centres results in relatively small datasets (tens to hundreds of occurrences per grid cell). We therefore interpret the following analysis as an exploratory assessment which is still useful as it establishes a foundational understanding of AD behaviour in relation to lightning.
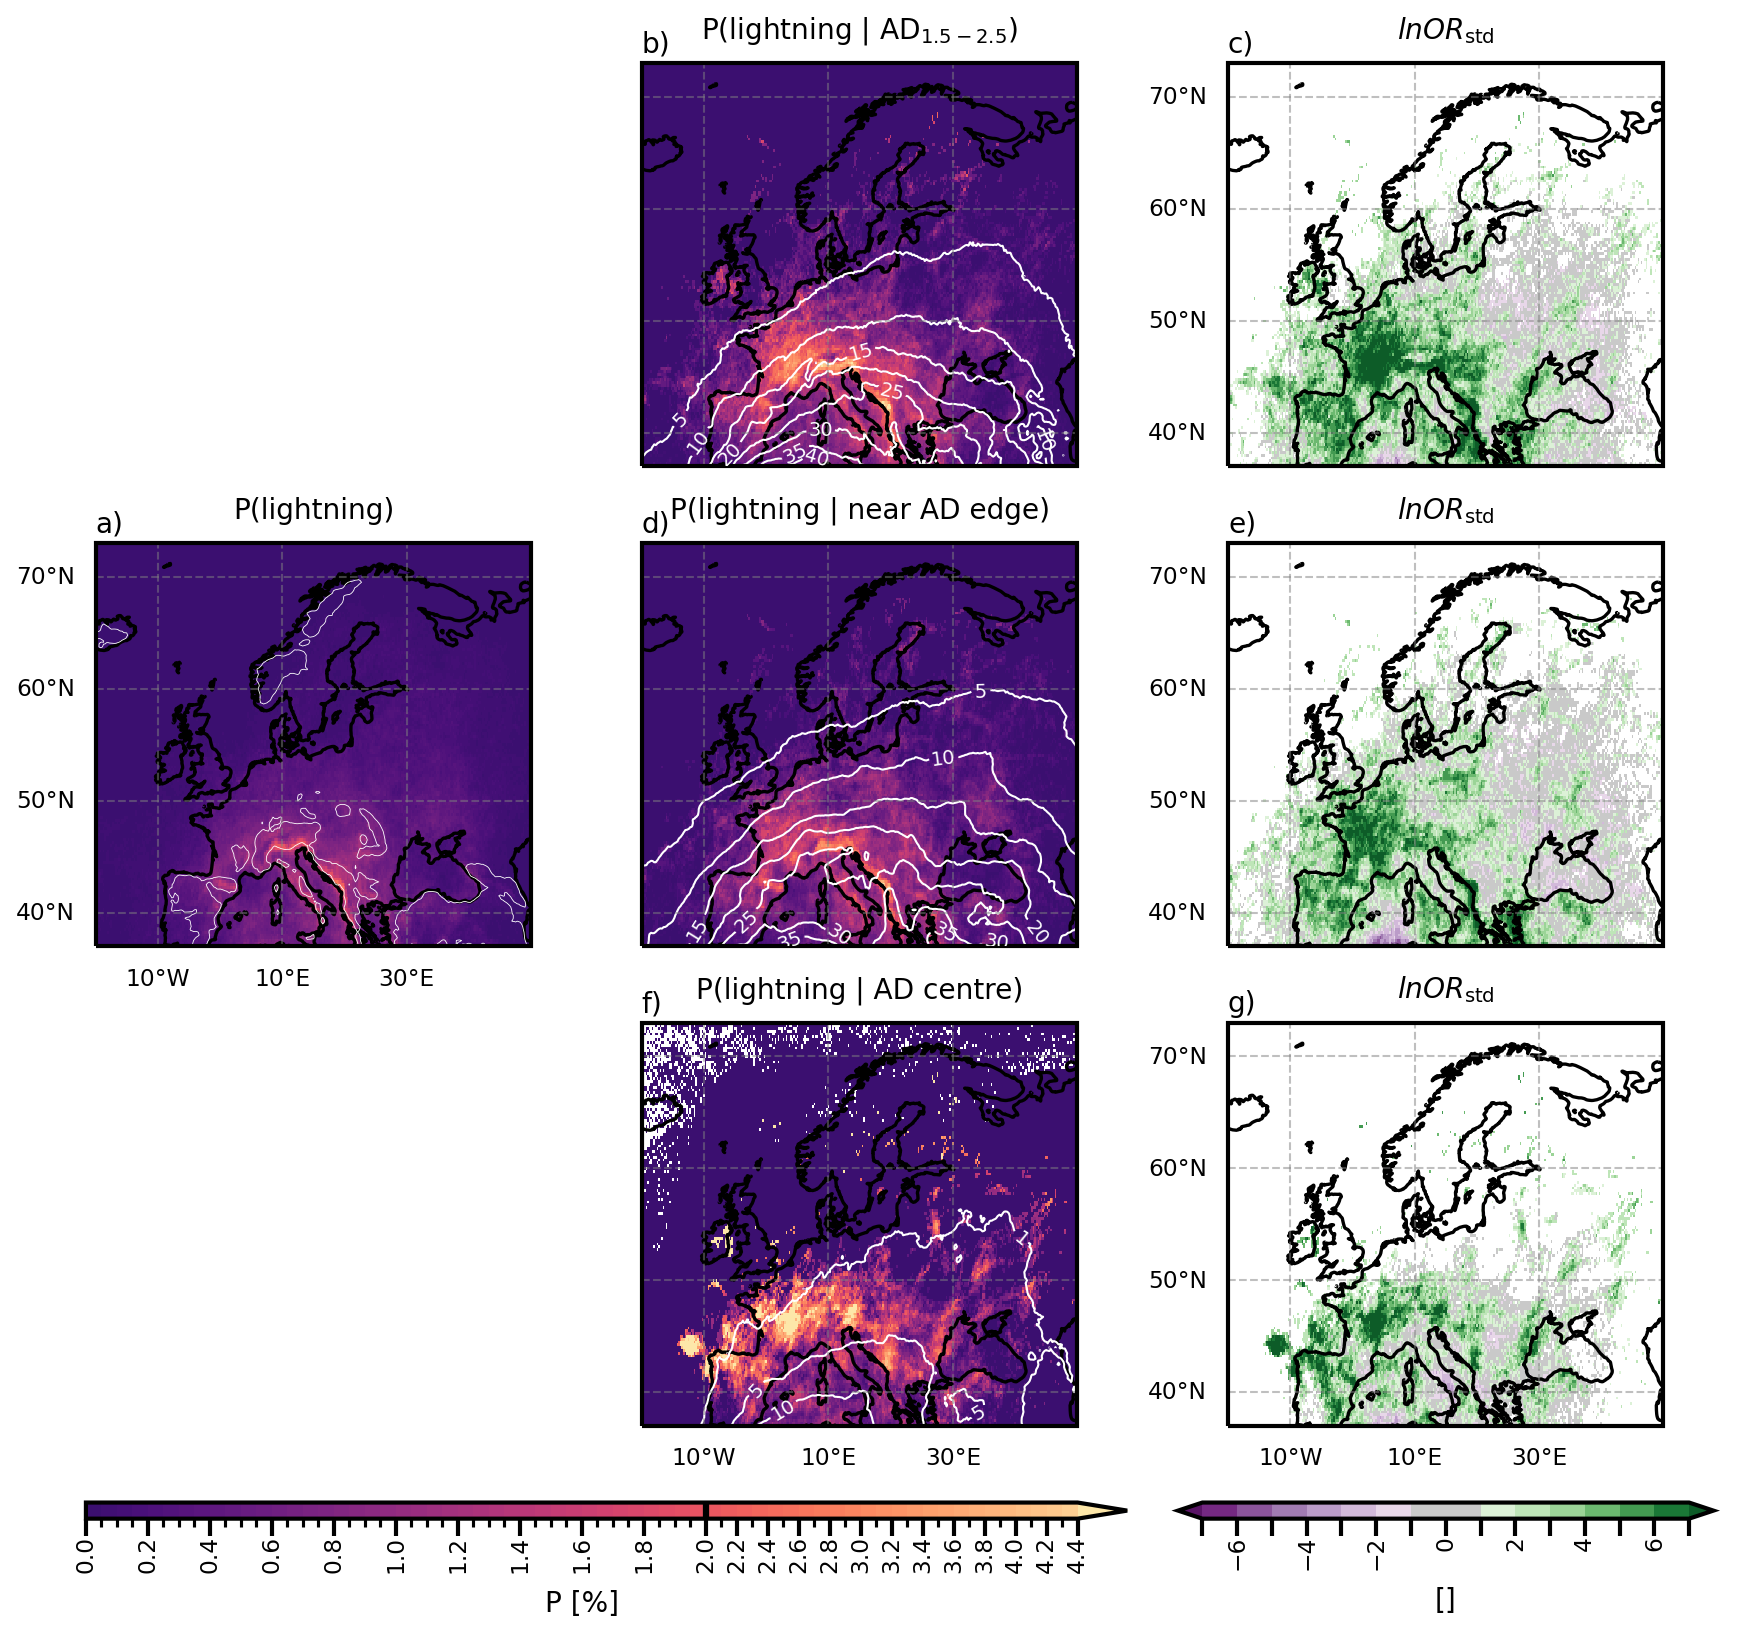
Figure 3(a) Total probability of lightning per grid cell and hour. White contour lines indicate the 600 m topographic isoline. b) Probability of lightning, given AD air is present at the 1.5, 2, and 2.5 km levels (AD1.5−2.5). Contour lines show the conditioning probability, P(AD1.5−2.5), per cell and hour in percent, 5 percentage-points spacing. (c) Standardised ln OR of lightning within AD1.5−2.5. (d) Probability of lightning, given it is close to the AD edge. Contour lines show the conditioning probability, P(near AD edge), per cell and hour in percent, 5 percentage-points spacing. (e) Standardised ln OR of lightning near AD edge. (f) Probability of lightning, given it is within the AD centre (≥ 10 cells away from edge). Contour lines show the conditioning probability, P(AD centre), per cell and hour in percent (contours for 1 %, 5 %, and 10 % are shown). (g) Standardised ln OR of lightning in the AD centre. Note that the colourbar for the probabilities has irregular spacing to highlight gradients at both the low and high ends of the probability range.
Figure 3b shows that lightning probability approximately doubles when AD air is present in the levels 1.5, 2, and 2.5 km, which is the case in up to 40 % over the Mediterranean (white contours, Fig. 3b). Also the standardised log-odds ratio confirms that lightning is more likely in the presence of AD air at those levels by being strongly positive (green, Fig. 3c) in large parts of the study region.
ERA5 grid cells can be within a swath of about 1.25° (5 cells) on either side of the AD edge in an astonishing 30 % of the time in the Mediterranean (Fig. 3d, white contours). This probability gradually decreases northwards to 5 % in northern Europe. In a large part of the domain, the probability of lightning is strongly increased, given an AD edge is close (Fig. 3d, shading), which is also supported by strongly positive values in the standardised log-odds ratio (green, Fig. 3e). In fact, almost 27 % of all lightning occurs within the 5 cell margin around the AD edge (not shown).
The probability of an ERA5 cell being in the centre of an AD (at least 10 cells ≈ 2.5° interior of the edge) is lower than for the edge, with 10 % in the Mediterranean, decreasing northwards and being negligible in northern Europe (Fig. 3f, white contours). The probability of lightning conditional on the presence of the AD centre is increased (yellow colours in Fig. 3f) and the standardised log-odds ratio is positive (Fig. 3), indicating that lightning is more likely in the presence of the AD centre.
6.2 Discussion of lightning occurrence
Several past studies have investigated the initiation of particularly violent thunderstorms near the edges of EMLs, and the processes discussed therein provide a framework for understanding convective initiation at AD edges. It is described that near the edge, a convergence zone forms, possibly ahead of a cold front or dryline (Carlson et al., 1983; Keyser and Carlson, 1984; Dahl and Fischer, 2016). In this region, a strong stability gradient is present (Carlson et al., 1983) and it is characterised by a baroclinic zone. Keyser and Carlson (1984) describe how due to confluence and anticyclonic shear in this baroclinic zone, a thermally direct ageostrophic circulation forms at the midlevel air mass boundary, while a thermally indirect cell forms higher up. This leads to ascent near the EML edge, which is likely too weak to initiate convection, but can diminish the strength of the cap and, together with other lifting mechanisms, lead to the initiation of thunderstorms along EML edges. Another mechanism fostering convective outbreaks near EML edges is “underrunning” (Carlson et al., 1983; Farrell and Carlson, 1989), where the moist and heated air in the local BL moves horizontally, until it reaches the lateral edges of the EML, where inhibition is weaker, so that convection can occur.
The results presented above also show increased odds for lightning near the AD edge across large parts of continental Europe, which indicates that the processes described for EMLs also occur along AD edges and foster thunderstorm formation. The increased odds of lightning in western and central Europe near the AD edges are also supported by Feldmann et al. (2025) who find that western and central Europe are regions with “temperature-limited severe convective outbreak types”. In temperature-limited regions, the advection of warm and moist air leads to instability. They also appreciate that EMLs support this instability for these types. Convective outbreaks happen on the western flank of a ridge, ahead of a trough, and strong positive temperature anomalies are found within the ridge – hence, a synoptic set-up that is similar to those leading to ADs, and convective outbreaks in regions where their edges can be expected. Only in the Slavic and Balkan regions the standardised log-odds ratio of lightning occurrence near the edge is small, or even negative (Fig. 3e). This likely reflects the low joint occurrence of lightning and AD-edge conditions in these areas, which results in large uncertainty and therefore low values of the standardised log-odds ratio.
The fact that lightning is more likely in the presence of the AD centre is surprising, as in the centres of EMLs, thunderstorms are thought to be suppressed as a capping stable layer confines convection to the layer below (Carlson and Ludlam, 1968). While strong convective inhibition (CIN) hinders convection, medium values of CIN (50–200 J kg−1) can actually be favourable. Thunderstorm initiation is delayed, which allows for further surface heating and destabilisation until strong enough triggers overcome the inhibition (Andrews et al., 2024). Air that originates within a deep, warm CBL in the source region is typically well-mixed with a near-dry-adiabatic lapse rate. If this air is advected downstream with modest modification, it causes steep lapse rates and conditionally unstable stratification over a moister local BL. Once an air parcel is lifted beyond its level of free convection and CIN is overcome, e.g. by surface heating, low-level convergence, or synoptic ascent, deep moist convection can initiate – even in the centre of the AD, if it causes low values of CIN.
A layer is conditionally unstable when the saturation equivalent potential temperature decreases with height = km < 0 K km−1. The top row of Fig. 4 (panels a–d) shows daytime conditions for the edge of the AD, the bottom row (panels e–h) for its centre. On average, the layer above the BL is not, or only weakly, conditionally unstable everywhere along the AD edge (grey and light yellow colours in Fig. 4b). For the AD centre, is strongly negative (orange colours in Fig. 4) in regions, where AD centre occurrence is non-negligible (≥ 1 %, white contours in Fig. 3f). Figure 4c and g show the minimum on days on which lightning occurs near the AD edge or in the AD centre, respectively (daily minimum is computed from only those sub-daily samples when the cell is classified as near-edge or centre, respectively). The time of maximal instability (minimal gradient of ) is used here, because the profile at the time of the lightning may no longer be representative for the (pre-) convective environment. Figure 4, panels (c) and (g) show that on days, when lightning occurred near the AD edge or in its centre, the most unstable profile was strongly conditionally unstable (orange colours). CIN at the times of the greatest instability on days when lightning occurred near the AD edge or in its centre, is, on average, in the favourable range of less than 200 J kg−1 (Fig. 4d and h, CIN at the same times as used in panels c and g). Moderate, non-zero values of CIN can delay thunderstorm initiation which allows for further surface heating and destabilisation. A parcel that overcomes the CIN and is lifted beyond its lifting condensation level, will freely rise in the conditionally unstable layer aloft. The combination of a conditionally unstable layer provided by the AD and modest CIN values therefore creates conditions favourable for thunderstorm development even in the centre of ADs, which can explain why the standardised log-odds ratio for lightning is positive both near the AD edges and in the AD centre (Fig. 4a, e, green colours).
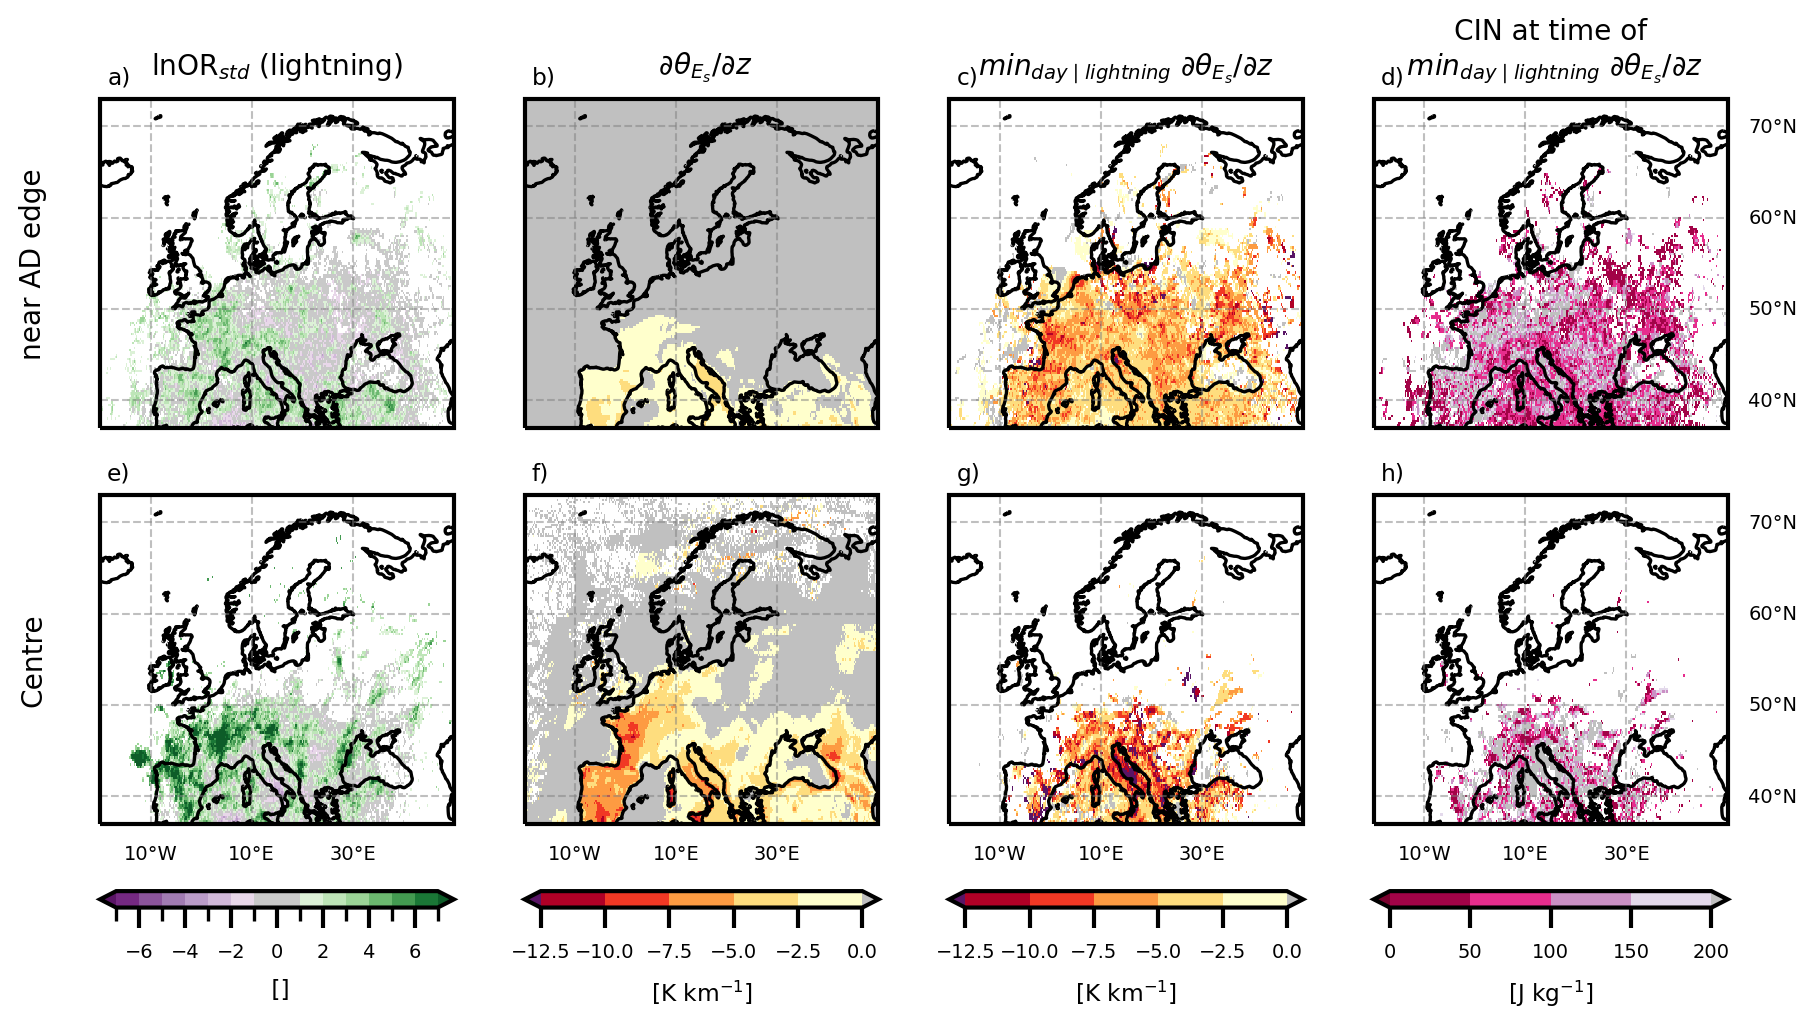
Figure 4Daytime hours (10:00–15:00 UTC) only. Panels (a)–(d) show results for near AD edge cells, panels (e)–(h) for AD centre cells. Panels (a) and (e) show the standardised ln OR for lightning occurrence, given the proximity of the AD edge (a) or the presence of the AD centre (e) (as Fig. 3e, f, but for daytime only). Panels (b) and (f) show the average in the 2 km above the local BLH, given the cell is near the AD edge (b) or in its centre (f). Panels (c) and (g) show average daily minimum on days that have a lightning occurrence near the AD edge (c) or in its centre (g) at least once that day. The daily minimum is computed from only those sub-daily samples when the cell is classified as near-edge (c) or centre (g). Panels (d) and (h) show the average CIN for those same time steps.
The fact that the combination of conditionally unstable air aloft and modest CIN is favourable for thunderstorms along the edges of ADs has been extensively documented (for the special case of EMLs, e.g. Carlson and Ludlam, 1968; Carlson et al., 1983; Keyser and Carlson, 1984; Farrell and Carlson, 1989; Lanicci and Warner, 1991b; Johns and Dorr, 1996; Banacos and Ekster, 2010; Lewis and Gray, 2010; Dahl and Fischer, 2016; Ribeiro and Bosart, 2018; Li et al., 2021). The favourable vertical profiles also help explain how lightning can occur at AD centres, contrary to the expectation that ADs, like EMLs, inhibit convection (Carlson and Ludlam, 1968).
Since the patterns of standardised log-odds ratios for daytime hours (Fig. 4a, e) are very similar to those for the entire day (Fig. 3e, g), we expect the explanation to also approximately hold for the whole day. Considering that the joint occurrence of lightning and AD centre is very rare (only on the order of tens of events, Fig. B3c), the values of individual cells of Fig. 3g and the bottom row of Fig. 4 have to be interpreted carefully, because they might be driven by single long-loved or highly organised systems such as mesoscale convective systems. An example is the isolated extremum over southern France in Fig. 3f, g. Despite this limitation, these results are interpretable: first, the log-odds ratios are suitably standardised to reduce the influence of rare events with large variances. Second, the band of elevated log-odds ratios extending across the Iberian Peninsula and along the northern flank of the Alps (Fig. 3g) is coherent over several hundred kilometres and hundreds of independent grid cells. Thus, this cannot be driven a single convective system. The same arguments hold for the analysis of lightning in the presence of AD and near the AD edge, for which the joint occurrences are also rare but less so than for the AD centre (Fig. B3).
Dust can be swept up into the CBL in the arid and desert source regions of ADs and subsequency lead to dust events in the target regions. In Sect. 7.1 we show how often ADs co-occur with dust events, which is then discussed in Sect. 7.2.
7.1 Results for dusty ADs
We define a dust event to occur when the standardised dust aerosol optical depth at 550 nm anomaly (AOD, Eq. 1) exceeds 2 at the given time (Sect. 4.3). Figure 5a shows the total, unconditional probability of dust events, P(dust). The Mediterranean region experiences strong dust events more than 9 % of the time, and also regions around the Baltic Sea and north-east of the Black Sea have enhanced dust event probabilities. It becomes apparent that the pattern of the unconditional probability for dust (Fig. 5a, shading) is similar to the pattern of the probability of AD (Fig. 5b, contours), with higher values in the southern part of the domain, and a north-eastward extension of the region with enhanced values. Figure 5b shows the probability of a dust event, given the presence of an AD (P(Dust Event ∣ AD), shading), and the conditioning probability (P(AD), contours, same as in Fig. 2b). Conditional probabilities are enhanced compared to the unconditional probability throughout the domain, and they are highest north and northwest of the Iberian peninsula. In these regions, ADs occur less than 10 % of the time, yet several hundred co-occurrences of ADs with dust events are recorded, resulting in conditional probabilities of beyond 40 % (Fig. 5b). Figure 5c shows the standardised ln OR. Positive values (green colours) in Fig. 5c highlight that dust events are more likely to occur in the presence of AD than during its absence. It is obvious that this is the case everywhere in the domain, and the very large values indicate strong evidence with respect to the variability. This is most pronounced from the Iberian Peninsula, across the English Channel and to southern Scandinavia, but less pronounced over the Mediterranean and the far east of the domain. However even in the Mediterranean log ORstd exceeds 10, which is clearly robust with respect to the sample variability.
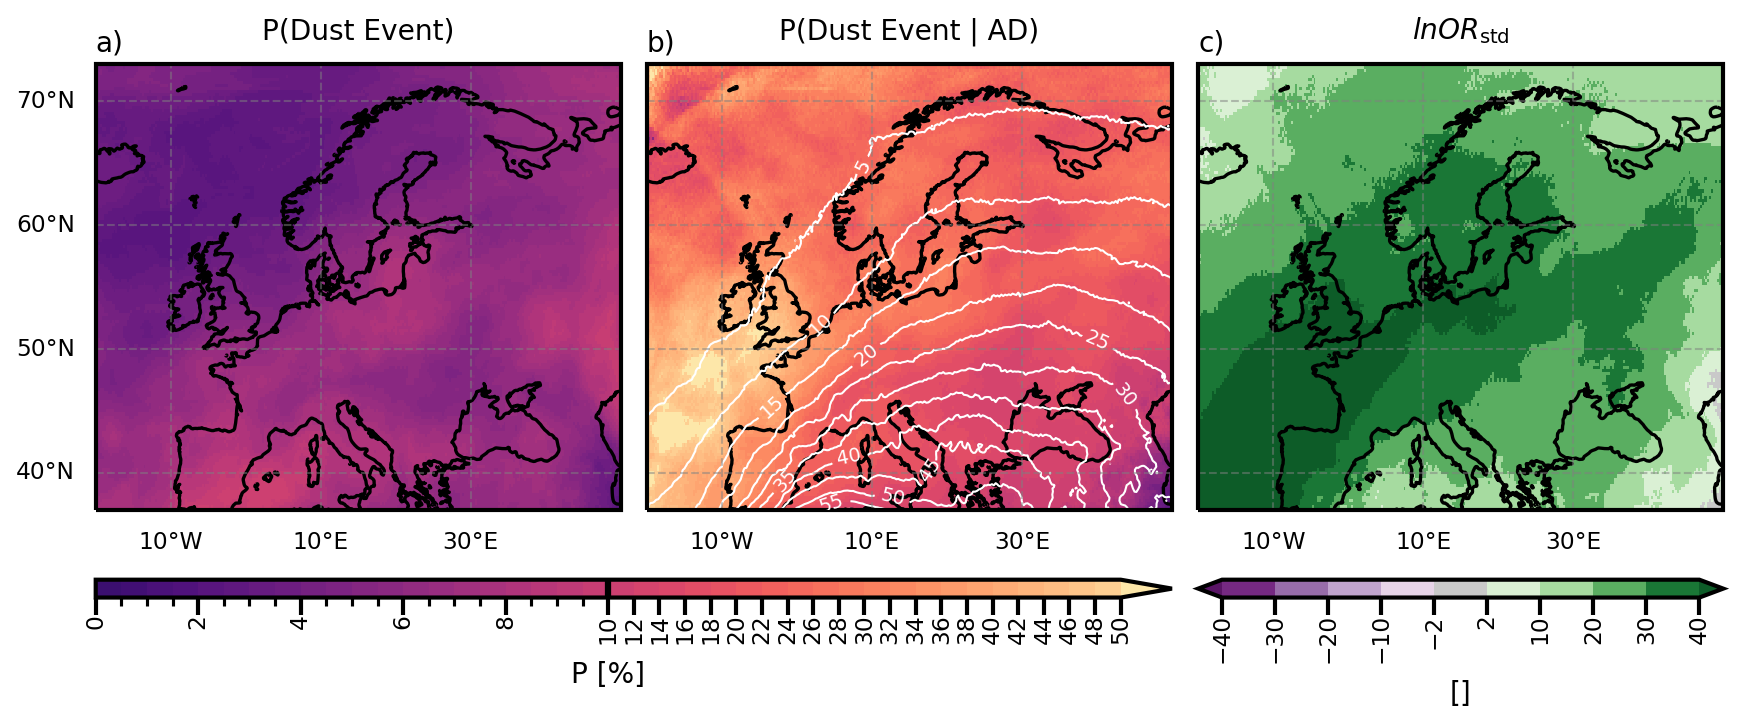
Figure 5(a) Total probability of a dust event (AOD > 2) per grid cell and hour. (b) Probability of a dust event, given the presence of AD air. Contour lines show the conditioning probability, P(AD), per cell and hour in percent, 5 percentage-points spacing. (c) Standardised ln OR for a dust event given AD presence. Note that the colourbar for the probabilities has irregular spacing to highlight gradients at both the low and high ends of the probability range.
The conditional probability of dust events given that an AD is present in the column (P(Dust Event | AD); Fig. 5b, shading) also gives insight into what fraction of AD events are dusty. While the probability of AD (P(AD); Fig. 5b, contours) decreases towards the north and northwest, the probability of a dust event given the presence of AD (P(Dust Event ∣ AD), Fig. 5b, shading) increases towards the northwest. Especially in the western part of the domain (western Europe and southern British Isles), more than 40 % of AD occurrences also bring dust events (yellow colours in Fig. 5b).
7.2 Discussion of dusty ADs
The pattern of P(Dust Event) (Fig. 5a) is similar to P(AD), and logically so. The probability for a dust event is highest closest to the source region, while regions further away have a reduced probability – because the dust-carrying air does not reach as far as often, and because more dust can be deposited during the longer journey. The only region that draws attention is the very east of the domain. Here, the probability of a dust event is higher than in neighbouring regions, and the effect of the AD is less pronounced (light colours in Fig. 5c). Additionally, east of 30° E is the only region, where P(dust event ∣ ) exceeds 5 %. This indicates that in the very east of the domain, the presence of ADs is not as important for the occurrence of a dust event as in the rest of the domain. Two reasons are possible: (1) The dust may originate from source regions not represented in our study, such as the Arabian peninsula or central Asian arid regions. (2) The air may take longer than 120 h to reach eastern Europe and thus is no longer tracked as AD air by our algorithm.
The frequent co-occurrence of dust events and ADs is in agreement with the results from Hermes et al. (2024) and Barkan et al. (2005) who find that dust over Europe typically occurs when a far-south-reaching trough over the Iberian peninsula transports dust towards Europe across the western Mediterranean. Cuevas-Agulló et al. (2024) find that during more than half of the late winter/early spring dust events in the western Mediterranean region, a cut-off low was present west of the Iberian peninsula. They also find increased blocking over the Euro-Atlantic sector. Israelevich et al. (2012) identify dust transport pathways towards Europe across the Mediterranean and via recirculation from the Atlantic. These are all synoptic situations and trajectory pathways that resemble those typical for ADs, found by Fix-Hewitt et al. (2026).
An interesting intersection with aerosol atmospheric rivers (AAR) and atmospheric rivers (ARs) emerges: ARs are narrow, elongated regions of enhanced water vapour transport (Ralph et al., 2018). Chakraborty et al. (2021) apply this concept to narrow, elongated regions of aerosol transport and define AARs. They attribute 40 % to > 100 % of the total integrated aerosol transport over many regions to these AARs. By definition, AARs originating in the boundary layers of desert regions will also be ADs. A combination of the concepts is presented by Dezfuli et al. (2021) and Francis et al. (2022), who describe that ARs can pick up dust, when travelling over desert areas, forming dusty atmospheric rivers. Francis et al. (2022) also describe how the phenomena are interlinked: ARs cause higher near-surface wind, which makes dust air-borne. They report that 78 % of ARs crossing Northwest Africa are linked to dust events in Europe. In this context, it could be interesting for future research to examine the extent and nature of the overlap among (dusty) atmospheric rivers (ARs), aerosol atmospheric rivers (AARs), and atmospheric deserts (ADs).
Atmospheric deserts (ADs) are air masses that are advected away from the convective boundary layers (CBLs) of their desert, (semi-) arid, and/or elevated source regions towards typically cooler, moister target regions. During their transport over thousands of kilometres, the air mass can be modified and lose its well-mixed properties. They are a generalisation of elevated mixed layers (EMLs), which are former boundary layer (BL) air masses that overlie cooler, moister local air masses, are well-mixed and often form a lid or capping inversion. Since ADs have been found to be frequent over Europe (Fix-Hewitt et al., 2026) and EMLs are known to influence thunderstorm and heat wave formation (e.g. Carlson and Ludlam, 1968; Carlson et al., 1980, 1983; Keyser and Carlson, 1984; Banacos and Ekster, 2010; Cordeira et al., 2017; Ribeiro and Bosart, 2018), this study aimed to investigate whether ADs behave similarly. Due to their origin in North Africa, European ADs are also prone to bring dust towards Europe. In this study, we therefore examined how frequently strong positive temperature anomalies, lightning, and dust events co-occur with ADs. Through investigation of conditional probabilities and standardised log-odds ratios, we come to the following conclusions:
-
The probability of anomalously high near-surface temperatures is significantly increased in the presence of ADs. However, co-occurrence of high near-surface temperatures with AD-induced caps is so rare that limited BL growth and resulting distribution of surface sensible heat input through a shallower layer (e.g. Cordeira et al., 2017) could not be confirmed as the main driver.
-
Lightning occurrence is clearly enhanced near the AD edges in western and central Europe. This is consistent with the well-documented tendency for severe thunderstorms to initiate near EML edges, and extends this finding to the more general case of ADs.
-
Conditional instability above the local BL and moderate CIN provide favourable environments for thunderstorm formation in the presence of ADs, both near their edges as well as in their centres.
-
In 10 % to more than 40 % of AD occurrences (depending on the region), anomalously high dust aerosol optical depths are also present, and almost all events with strong positive anomalies in dust aerosol optical depth co-occur with ADs.
These findings advance prior knowledge about EMLs and their implications: ADs frequently co-occur with strong positive temperature anomaly events and lightning probability is increased both near their edges and in their centres. Extending the concept of EMLs to ADs is therefore a useful step to understanding and forecasting such events, which becomes more and more important to warn the affected populations, especially as temperatures rise. Our results highlight, that while ADs, just as EMLs, co-occur with hot events, the cause remains unclear. Similarly, while enhanced lightning near AD edges is consistent with expectations from EML studies, the enhancement in AD centres is a novel and unexpected result, which may point towards additional destabilisation mechanisms that are not present in the case of EMLs.
This opens several questions that should be addressed in future research. Of particular interest are the causal relations. Why are ADs often accompanied by anomalously high near surface temperatures? Do they have a common driver, or could the AD be cause? Which processes lead to the triggering of thunderstorms near the AD edges? Can the suggested processes of underrunning (Farrell and Carlson, 1989) and ageostrophic circulations at a resulting convergence line (Dahl and Fischer, 2016) or mid-level baroclinic zone (Keyser and Carlson, 1984) be confirmed for ADs?
While it has been described that dusty Saharan air layers can qualify as EMLs (Carlson and Prospero, 1972; Karyampudi et al., 1999; Carlson, 2016; Gutleben et al., 2020), the presence of dust within EMLs other than over the tropical Atlantic is rarely discussed, although EML (and AD) source regions are often also possible dust source regions. And indeed, ADs often co-occur with dust events in the target region. Future research could investigate the vertical distribution of dust within the AD and the influences it has on e.g. temperature and cloudiness. Moreover, we investigated the individual co-occurrences, but it may be of interest to also include concurrent events, i.e. dusty ADs that are also accompanied by high near-surface temperatures or thunderstorms. It can be expected that the different effects influence each other: dust can absorb or scatter radiation, reducing the surface incoming solar radiation and therefore the near-surface temperature as well as stratification (Helmert et al., 2007; Bangert et al., 2012; Nabat et al., 2015). Dust can also serve as condensation nuclei, altering cloud properties and favouring hail formation (Rosenfeld et al., 2001; Seifert et al., 2023; Brennan and Wilhelm, 2025). Furthermore, high near surface temperatures can increase CAPE and lead to more violent convection. The interplay between these AD-related effects therefore warrants further investigation, requiring datasets with larger sample sizes of concurrent events.
While there are many open questions to be addressed, the findings in this study present a valuable next step towards establishing ADs as a new air stream type: one that generalises the well-studied EML concept and demonstrates that desert-origin air masses – whether or not they retain a well-mixed structure – are systematically associated with temperature extremes, enhanced convection, and dust transport across Europe.
A1 Edge detection
The air-mass edge is detected from the binary AD-cell data within a given layer L as follows:
-
Layer definition: a layer L can consist of several levels, l. If desired, combine the binary data of the altitude levels l by logical “or”:
(Fig. A1a–d). -
Pad domain edges: to prevent artificial edge truncation at the domain boundary, pad L with replicate values (Fig. A1d, light grey).
-
Smooth AD layer: to obtain a smoother and more continuous boundary, remove small isolated gaps within detected AD regions and isolated noisy pixels or pixel clusters outside the main regions (Fig. A1e, f). This is achieved using multidimensional binary closing followed by binary opening with a structuring element S that includes all spatially neighbouring cells (including the diagonals, 3×3 Moore neighbourhood; Haralick et al., 1987). The resulting smoothed field is denoted Ls.
-
Edge detection: edge cells are defined as the outer boundary of the smoothed field Ls, obtained as the set difference between Ls and its morphological erosion: Edge = (Haralick et al., 1987, Fig. A1g, orange).
Distances to the detected edge are used in the main text to classify grid cells into near-edge (light orange in Fig. A1g) and centre regions (dark blue in Fig. A1g) using thresholds D1 and D2. The results of the sensitivity analysis for the altitude in which the edge should be detected (l, L), as well as for the distances used to define near-edge and centre regions (D1,D2) are shown in Figs. A2 and A3.
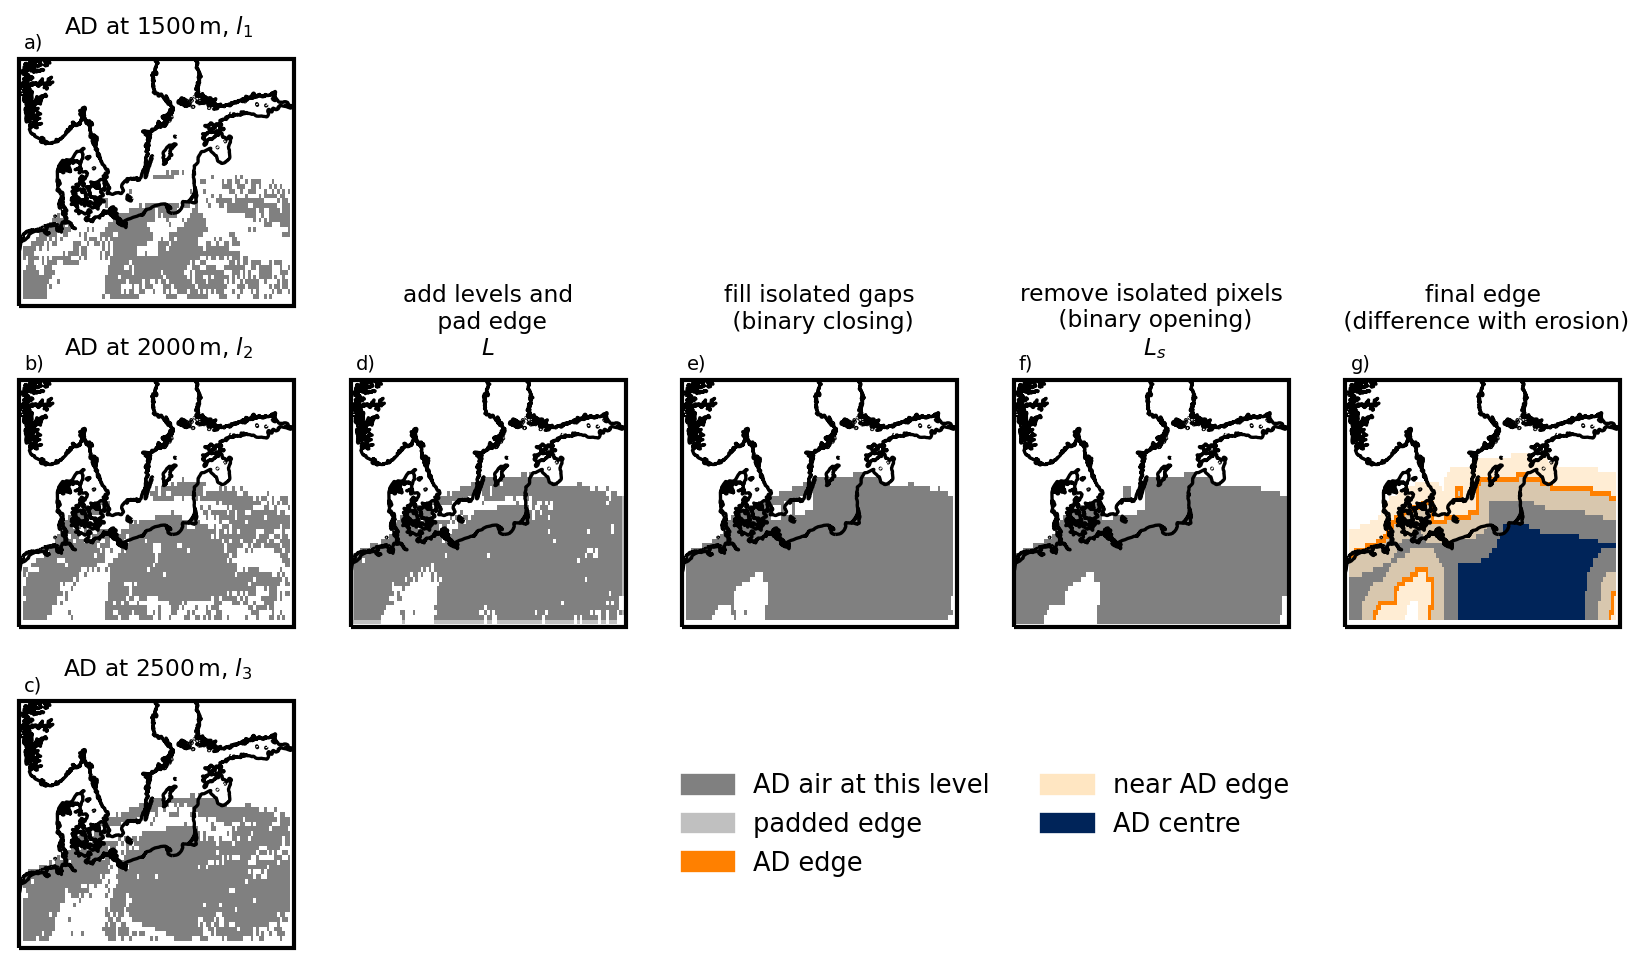
Figure A1Schematic of edge detection algorithm. (a–c) AD extent at the respective levels 1500, 2000, and 2500 m. (d) AD extent in the combined layer, L. (e) Isolated gaps were filled, using binary closing. (f) Isolated pixels or small pixel groups were removed using binary opening, results in smoothed AD extent Ls. (g) Final result with smoothed AD extent (grey), AD edge (orange), cells near the AD edge (light orange), and cells within AD centre (dark blue).
A2 Conditional probability and odds ratios
Table A1Contingency table. n is the number of observations, a, b, c, d the absolute frequencies for the respective combination of events. “Event” refers to an extreme weather event (e.g. strong positive temperature anomaly (PTA) or dust event). “AD” refers to an AD-column being present.
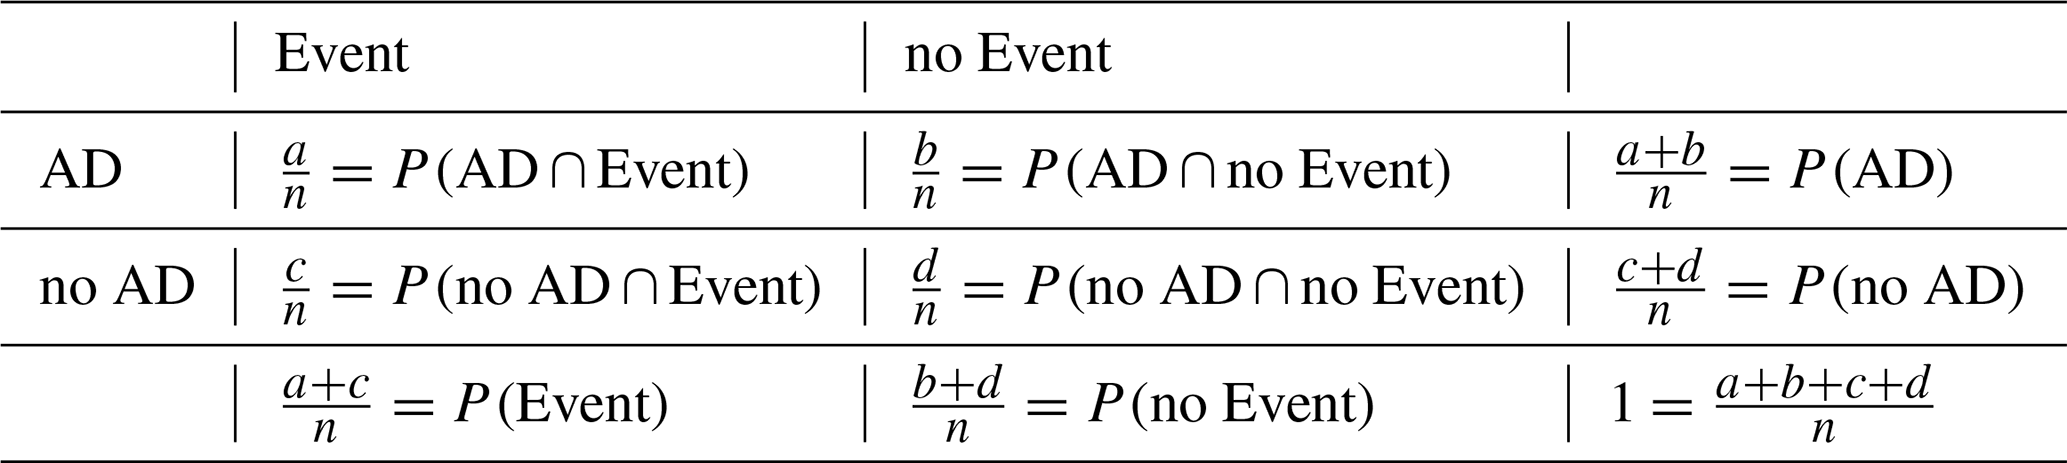
In this section the standardised log-odds ratio used in Sect. 4.4 is derived. We consider a 2×2 contingency-table as in Table A1 (reporting relative frequencies), with absolute frequencies a, b, c, d and a total number of observations n = . The joint and conditional probabilities are defined as
From these, the odds of an event occurring given AD presence and absence are
Their ratio is the odds ratio, OR:
The standard error of the log-odds ratio, SE(lnOR), can be calculated as (Stephenson, 2000):
The standardised log-odds ratio is then defined as
Figure B1a shows the median of the standardised anomaly of T2 m () given that AD air is present in the same column, while Fig. B1b shows the median given there is no AD air present. Their difference is shown in Fig. B1c. The entire domain has higher standardised anomalies for AD periods than for non-periods, most strikingly in western France and over the British Isles.
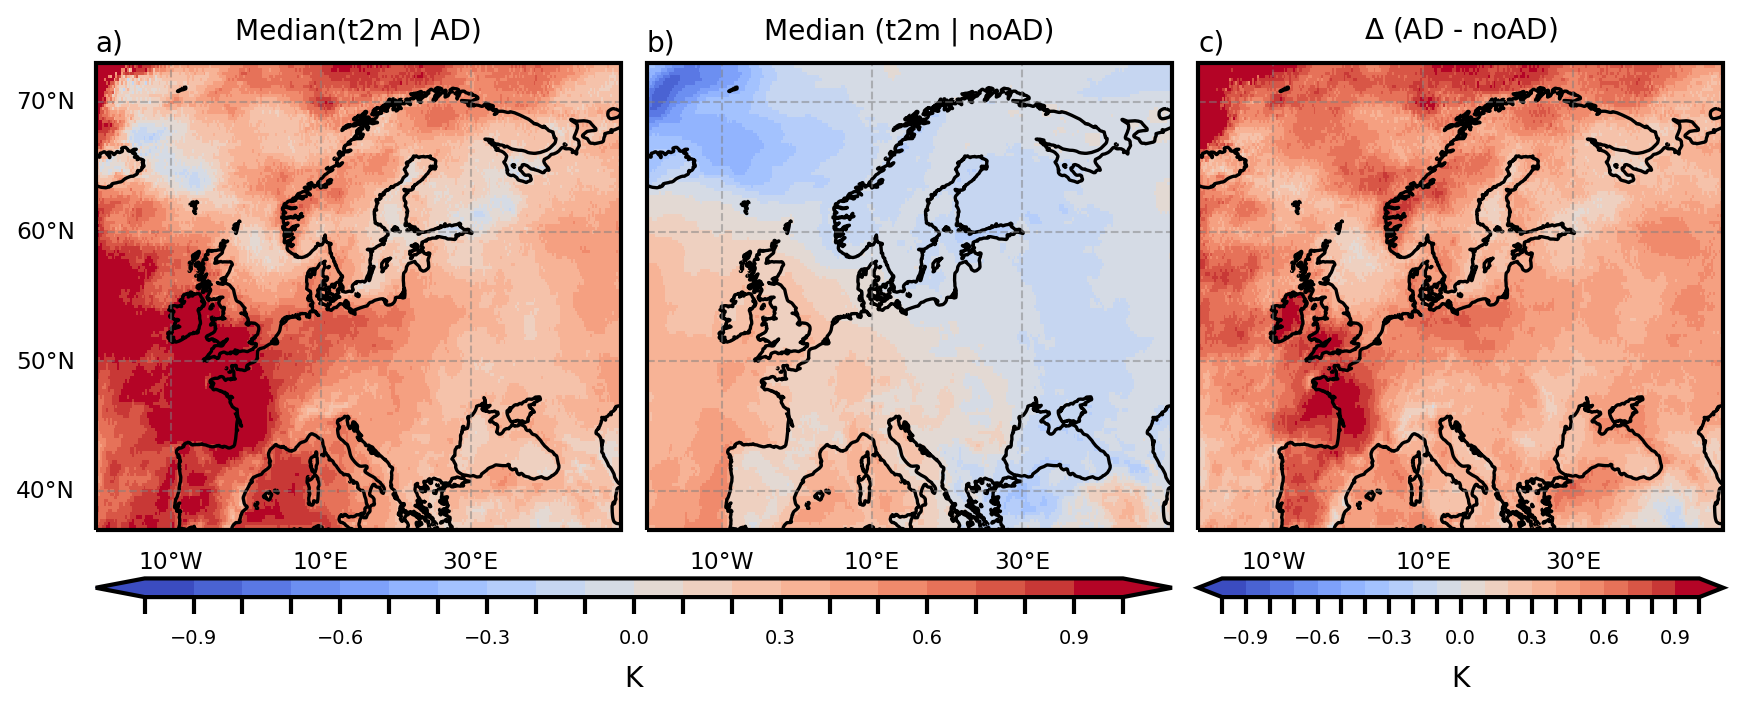
Figure B1(a) Median given the presence of AD. (b) Median given the absence of AD. (c) The difference between AD and non-AD periods.
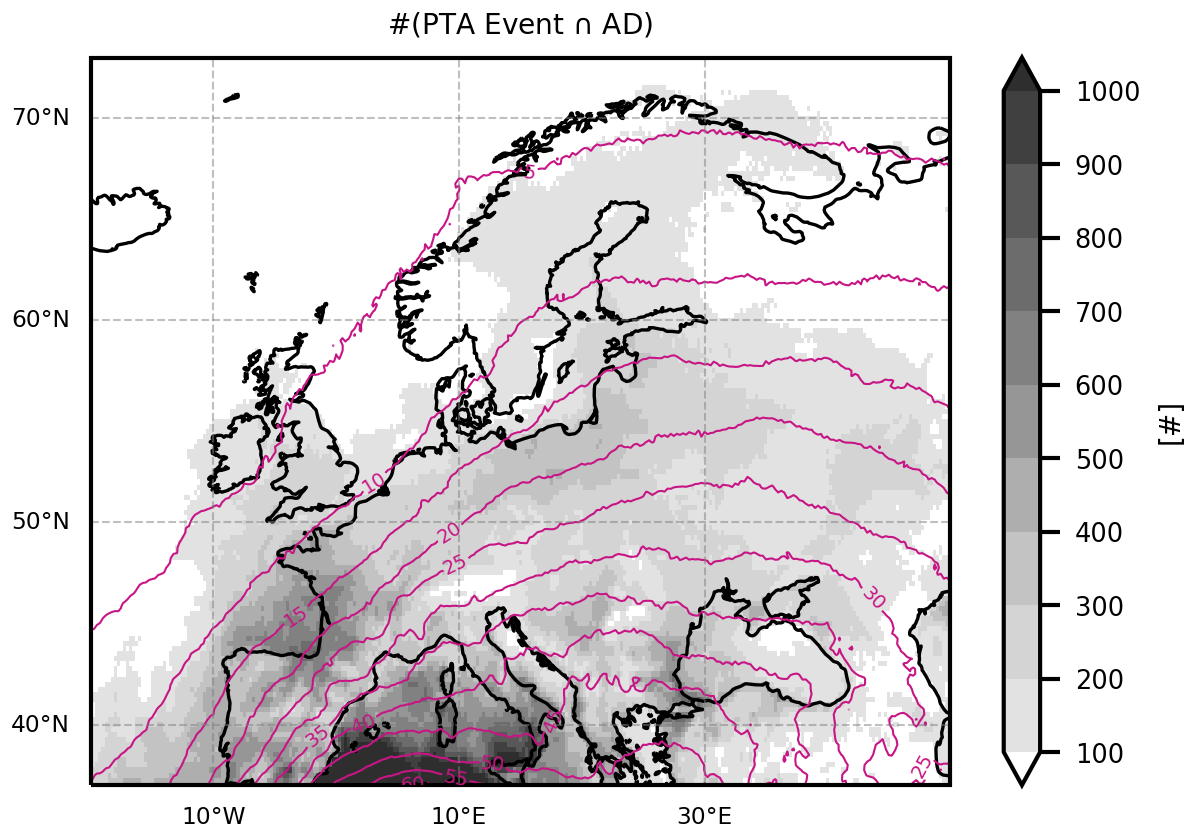
Figure B2Joint occurrences of PTA event and AD. Joint occurrence numbers in shading. The probability of AD is denoted in contours, as in Fig. 2b.
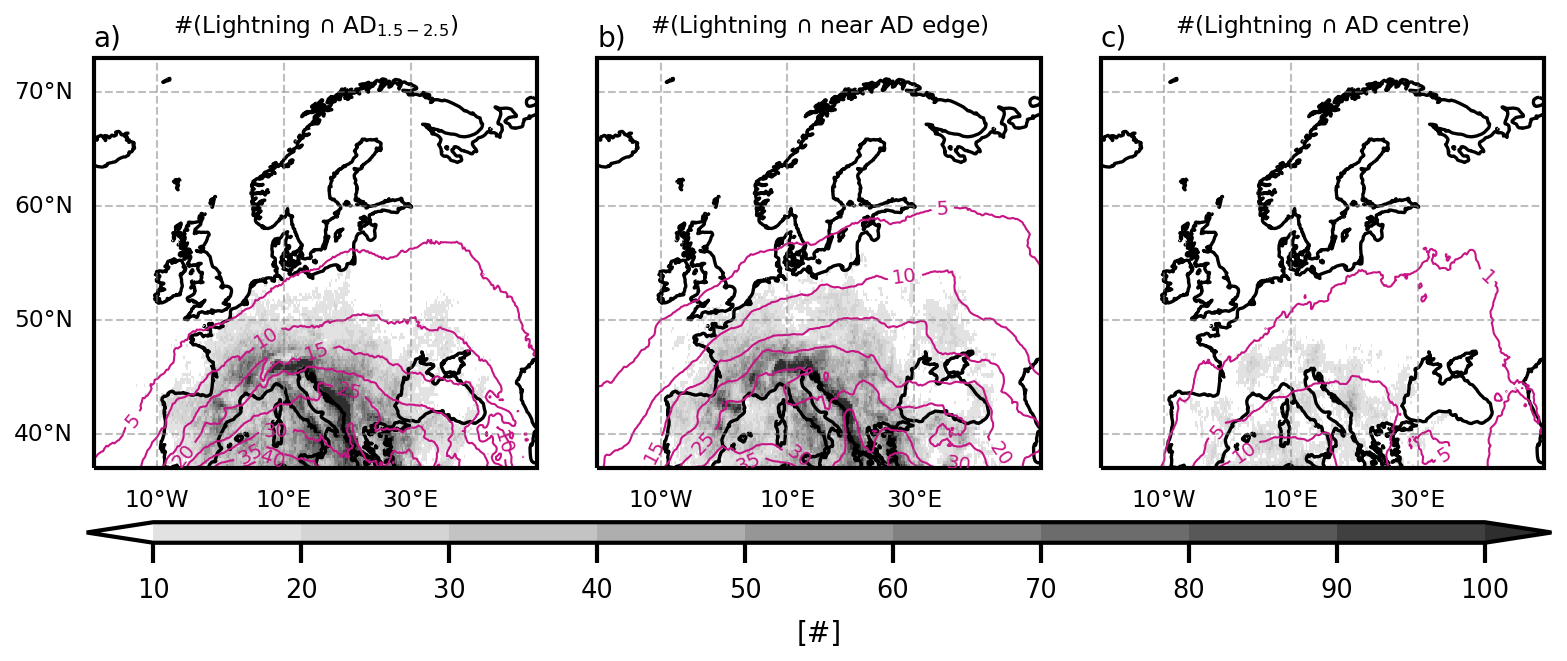
Figure B3Joint occurrences of lightning (a) with AD between 1.5 and 2.5 km, (b) near AD edge, (c) in AD centre. Contours mark the probabilities of AD1.5−2.5 km, AD edge, and AD centre, respectively, as in Fig. 3b, d, f.
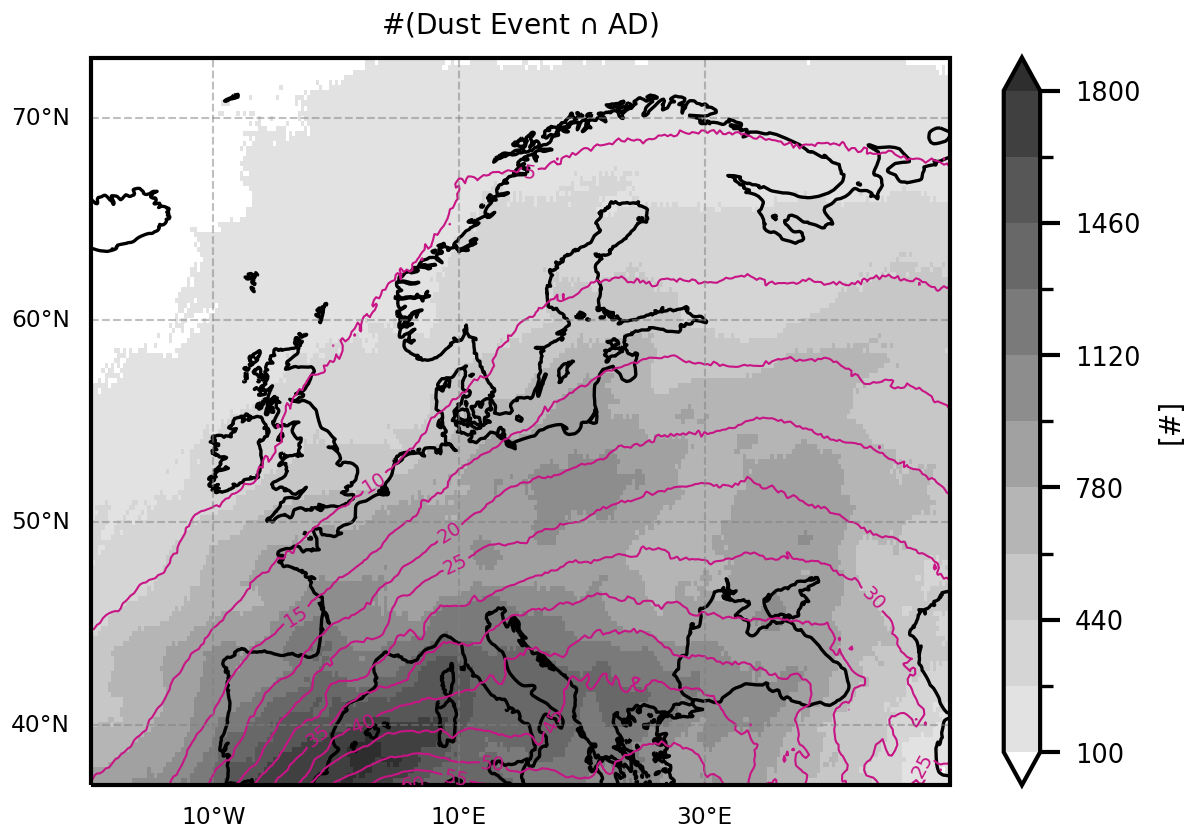
Figure B4Joint occurrences of dust event and AD. Joint occurrence numbers in shading. The probability of AD is denoted in contours, as in Fig. 5b.
Much of the data processing is done with the climate data operators (cdo; Schulzweida, 2023) and python. All code used for the analysis is made available at https://doi.org/10.5281/zenodo.19658813 (Fix-Hewitt, 2026).
ERA5 data is freely available at the Copernicus Climate Change Service (C3S) Climate Data Store (https://doi.org/10.24381/cds.adbb2d47, Hersbach et al., 2023). EAC4 data is freely available at the Copernicus Atmosphere Monitoring Service (CAMS) Atmosphere Data Store (https://doi.org/10.24381/04a0b097, Copernicus Atmosphere Monitoring Service, 2021). The results contain modified C3S information 2020. Results are generated using Copernicus Atmosphere Monitoring Service information 2025. Neither the European Commission nor ECMWF is responsible for any use that may be madeof the Copernicus information or data it contains. Lightning data from Blitzortung.org (https://www.blitzortung.org/en/cover_your_area.php; Wanke et al., 2014) is available as participant of measurement network. LAGRANTO is available from https://iacweb.ethz.ch/staff/sprenger/lagranto/ (Sprenger and Wernli, 2015).
GM and AZ acquired the funding for this project. All co-authors contributed to the study design. FFH conducted the calculations, the analysis, and wrote the manuscript under supervision by GM and AZ, with the support of IS and RS. IS and FFH acquired the data and RS supported in software development. GM, AZ, IS, and RS reviewed and revised the manuscript prepared by FFH.
The contact author has declared that none of the authors has any competing interests.
Publisher's note: Copernicus Publications remains neutral with regard to jurisdictional claims made in the text, published maps, institutional affiliations, or any other geographical representation in this paper. The authors bear the ultimate responsibility for providing appropriate place names. Views expressed in the text are those of the authors and do not necessarily reflect the views of the publisher.
We thank Deborah Morgenstern for setting up LAGRANTO and running the first explorative trajectory calculations. We thank all colleagues who were involved in discussions, in particular also those the first author talked to at the Workshop on “Dynamics of Rossby Waves, Compound Extremes and Their Impacts” in Amsterdam (January 2026). The computational results presented have been achieved [in part] using the Austrian Scientific Cluster (ASC). Large language models have been used to support code development and language improvements.
This research was funded in whole by the Austrian Science Fund (FWF) https://doi.org/10.55776/P35780. For open access purposes, the authors have applied a CC BY public copyright license to any author accepted manuscript version arising from this submission.
This paper was edited by Johannes Dahl and reviewed by Monika Feldmann and one anonymous referee.
Andrews, M. S., Gensini, V. A., Haberlie, A. M., Ashley, W. S., Michaelis, A. C., and Taszarek, M.: Climatology of the Elevated Mixed Layer over the Contiguous United States and Northern Mexico Using ERA5: 1979–2021, J. Climate, 37, 1833–1851, https://doi.org/10.1175/JCLI-D-23-0517.1, 2024. a, b, c
Banacos, P. C. and Ekster, M. L.: The Association of the Elevated Mixed Layer with Significant Severe Weather Events in the Northeastern United States, Weather Forecast., 25, 1082–1102, https://doi.org/10.1175/2010WAF2222363.1, 2010. a, b, c
Bangert, M., Nenes, A., Vogel, B., Vogel, H., Barahona, D., Karydis, V. A., Kumar, P., Kottmeier, C., and Blahak, U.: Saharan dust event impacts on cloud formation and radiation over Western Europe, Atmos. Chem. Phys., 12, 4045–4063, https://doi.org/10.5194/acp-12-4045-2012, 2012. a, b
Barkan, J., Alpert, P., Kutiel, H., and Kishcha, P.: Synoptics of dust transportation days from Africa toward Italy and central Europe, J. Geophys. Res.-Atmos., 110, D07208, https://doi.org/10.1029/2004JD005222, 2005. a, b, c, d
Brennan, K. P. and Wilhelm, L.: Saharan dust linked to European hail events, Atmos. Chem. Phys., 25, 10823–10836, https://doi.org/10.5194/acp-25-10823-2025, 2025. a, b
Carlson, T.: The Saharan Elevated Mixed Layer and its Aerosol Optical Depth, The Open Atmospheric Science Journal, 10, 26–38, https://doi.org/10.2174/1874282301610010026, 2016. a, b
Carlson, T. and Prospero, J. M.: The Large-Scale Movement of Saharian Air Outbreaks over the Northern Equatorial Atlantic, J. Appl. Meteor. Clim., 11, 283–297, https://doi.org/10.1175/1520-0450(1972)011<0283:TLSMOS>2.0.CO;2, 1972. a, b, c
Carlson, T. N. and Ludlam, F. H.: Conditions for the occurrence of severe local storms, Tellus, 20, 203–226, https://doi.org/10.1111/j.2153-3490.1968.tb00364.x, 1968. a, b, c, d, e, f, g, h, i, j, k, l, m, n
Carlson, T. N., Anthes, R. A., Schwartz, M., Benjamin, S. G., and Baldwin, D. G.: Analysis and Prediction of Severe Storms Environment, American Meteorological Society, Tech. rep., Report Number AD-A94141, https://doi.org/10.1175/1520-0477-61.9.1018, 1980. a, b, c
Carlson, T. N., Benjamin, S. G., and Forbes, G. S.: Elevated Mixed Layers in the Regional Severe Storm Environment: Conceptual Model and Case Studies, Mon. Weather Rev., 111, 1453–1473, https://doi.org/10.1175/1520-0493(1983)111<1453:EMLITR>2.0.CO;2, 1983. a, b, c, d, e, f, g, h, i, j
Chakraborty, S., Guan, B., Waliser, D. E., da Silva, A. M., Uluatam, S., and Hess, P.: Extending the Atmospheric River Concept to Aerosols: Climate and Air Quality Impacts, Geophys. Res. Lett., 48, https://doi.org/10.1029/2020GL091827, 2021. a
Copernicus Atmosphere Monitoring Service: CAMS global atmospheric composition forecasts, Copernicus Atmosphere Monitoring Service (CAMS) Atmosphere Data Store [data set], https://doi.org/10.24381/04a0b097, 2021. a
Cordeira, J. M., Metz, N. D., Howarth, M. E., and Galarneau, T. J.: Multiscale upstream and in situ precursors to the elevated mixed layer and high-impact weather over the Midwest United States, Weather Forecas., 32, 905–923, https://doi.org/10.1175/WAF-D-16-0122.1, 2017. a, b, c, d, e, f, g, h, i, j
Cos, P., Olmo, M., Campos, D., Marcos-Matamoros, R., Palma, L., Muñoz, Á. G., and Doblas-Reyes, F. J.: Saharan warm-air intrusions in the western Mediterranean: identification, impacts on temperature extremes, and large-scale mechanisms, Weather Clim. Dynam., 6, 609–626, https://doi.org/10.5194/wcd-6-609-2025, 2025. a, b
Cuevas-Agulló, E., Barriopedro, D., García, R. D., Alonso-Pérez, S., González-Alemán, J. J., Werner, E., Suárez, D., Bustos, J. J., García-Castrillo, G., García, O., Barreto, Á., and Basart, S.: Sharp increase in Saharan dust intrusions over the western Euro-Mediterranean in February–March 2020–2022 and associated atmospheric circulation, Atmos. Chem. Phys., 24, 4083–4104, https://doi.org/10.5194/acp-24-4083-2024, 2024. a
Dahl, J. M. and Fischer, J.: The origin of western European warm-season prefrontal convergence lines, Weather Forecast., 31, 1417–1431, https://doi.org/10.1175/WAF-D-15-0161.1, 2016. a, b, c, d, e, f
de Villiers, M. P.: Europe extreme heat 22–26 July 2019: was it caused by subsidence or advection?, Weather, 75, 228–235, https://doi.org/10.1002/wea.3717, 2020. a, b, c
Dezfuli, A., Bosilovich, M. G., and Barahona, D.: A Dusty Atmospheric River Brings Floods to the Middle East, Geophys. Res. Lett., 48, https://doi.org/10.1029/2021GL095441, 2021. a
England, M. H., Li, Z., Huguenin, M. F., Kiss, A. E., Gupta, A. S., Holmes, R. M., and Rahmstorf, S.: Drivers of the extreme North Atlantic marine heatwave during 2023, Nature, 642, 636–643, https://doi.org/10.1038/s41586-025-08903-5, 2025. a
Enno, S. E., Sugier, J., Alber, R., and Seltzer, M.: Lightning flash density in Europe based on 10 years of ATDnet data, Atmos. Res., 235, https://doi.org/10.1016/j.atmosres.2019.104769, 2020. a
Farrell, R. J. and Carlson, T. N.: Evidence for the Role of the Lid and Underrunning in an Outbreak of Tornadic Thunderstorms, Mon. Weather Rev., 117, 857–871, https://doi.org/10.1175/1520-0493(1989)117<0857:EFTROT>2.0.CO;2, 1989. a, b, c, d, e, f, g, h
Feldmann, M., Germann, U., Gabella, M., and Berne, A.: A characterisation of Alpine mesocyclone occurrence, Weather Clim. Dynam., 2, 1225–1244, https://doi.org/10.5194/wcd-2-1225-2021, 2021. a
Feldmann, M., Domeisen, D. I. V., and Martius, O.: A pan-European analysis of large-scale drivers of severe convective outbreaks, Weather Clim. Dynam., 6, 1089–1106, https://doi.org/10.5194/wcd-6-1089-2025, 2025. a
Fix, F., Mayr, G., Zeileis, A., Stucke, I., and Stauffer, R.: Detection and consequences of atmospheric deserts: insights from a case study, Weather Clim. Dynam., 5, 1545–1560, https://doi.org/10.5194/wcd-5-1545-2024, 2024. a, b, c, d, e
Fix-Hewitt, F.: Code used in preparation of the manuscript “Co-occurrence of atmospheric deserts over Europe with strong positive temperature anomalies, thunderstorms, and dust events” by Fix-Hewitt et al., 2026 - reviewed submission, Zenodo [code], https://doi.org/10.5281/zenodo.19658813, 2026. a
Fix-Hewitt, F., Zeileis, A., Stucke, I., Stauffer, R., and Mayr, G. J.: Properties and characteristics of atmospheric deserts over Europe: a first statistical analysis, Weather Clim. Dynam., 7, 17–35, https://doi.org/10.5194/wcd-7-17-2026, 2026. a, b, c, d, e, f, g, h, i, j, k, l, m, n, o
Francis, D., Fonseca, R., Nelli, N., Bozkurt, D., Picard, G., and Guan, B.: Atmospheric rivers drive exceptional Saharan dust transport towards Europe, Atmos. Res., 266, 105959, https://doi.org/10.1016/j.atmosres.2021.105959, 2022. a, b
Gitro, C. M., Bikos, D., Szoke, E. J., Jurewicz, M. L., Cohen, A. E., and Foster, M. W.: A Demonstration of Modern Geostationary and Polar-Orbiting Satellite Products for the Identification and Tracking of Elevated Mixed Layers, Journal of Operational Meteorology, 7, 180–192, https://doi.org/10.15191/NWAJOM.2019.0713, 2019. a, b
Gkikas, A., Hatzianastassiou, N., and Mihalopoulos, N.: Aerosol events in the broader Mediterranean basin based on 7-year (2000–2007) MODIS C005 data, Ann. Geophys., 27, 3509–3522, https://doi.org/10.5194/angeo-27-3509-2009, 2009. a
Gkikas, A., Basart, S., Hatzianastassiou, N., Marinou, E., Amiridis, V., Kazadzis, S., Pey, J., Querol, X., Jorba, O., Gassó, S., and Baldasano, J. M.: Mediterranean intense desert dust outbreaks and their vertical structure based on remote sensing data, Atmos. Chem. Phys., 16, 8609–8642, https://doi.org/10.5194/acp-16-8609-2016, 2016. a
Gutleben, M., Groß, S., Wirth, M., and Mayer, B.: Radiative effects of long-range-transported Saharan air layers as determined from airborne lidar measurements, Atmos. Chem. Phys., 20, 12313–12327, https://doi.org/10.5194/acp-20-12313-2020, 2020. a, b, c
Haralick, R. M., Sternberg, S. R., and Zhuang, X.: Image Analysis Using Mathematical Morphology, IEEE T. Pattern Anal., PAMI-9, 532–550, https://doi.org/10.1109/TPAMI.1987.4767941, 1987. a, b
Helmert, J., Heinold, B., Tegen, I., Hellmuth, O., and Wendisch, M.: On the direct and semidirect effects of Saharan dust over Europe: A modeling study, J. Geophys. Res.-Atmos., 112, https://doi.org/10.1029/2006JD007444, 2007. a, b
Hermes, K., Quinting, J., Grams, C. M., Hoose, C., and Hoshyaripour, G. A.: Impact of Saharan dust outbreaks on short-range weather forecast errors in Europe, Q. J. Roy. Meteor. Soc., 150, 1704–1723, https://doi.org/10.1002/QJ.4666, 2024. a, b
Hersbach, H., Bell, B., Berrisford, P., Hirahara, S., Horányi, A., Muñoz-Sabater, J., Nicolas, J., Peubey, C., Radu, R., Schepers, D., Simmons, A., Soci, C., Abdalla, S., Abellan, X., Balsamo, G., Bechtold, P., Biavati, G., Bidlot, J., Bonavita, M., Chiara, G. D., Dahlgren, P., Dee, D., Diamantakis, M., Dragani, R., Flemming, J., Forbes, R., Fuentes, M., Geer, A., Haimberger, L., Healy, S., Hogan, R. J., Hólm, E., Janisková, M., Keeley, S., Laloyaux, P., Lopez, P., Lupu, C., Radnoti, G., de Rosnay, P., Rozum, I., Vamborg, F., Villaume, S., and Thépaut, J. N.: The ERA5 global reanalysis, Q. J. Roy. Meteor. Soc., 146, 1999–2049, https://doi.org/10.1002/qj.3803, 2020. a, b, c
Hersbach, H., Bell, B., Berrisford, P., Biavati, G., Horányi, A., Sabater, J. M., Nicolas, J., Peubey, C., R., R., Rozum, I., Schepers, D., Simmons, A., Soci, C., Dee, D., and Thépaut, J.-N.: ERA5 hourly data on single levels from 1940 to present, Copernicus Climate Change Service (C3S) Climate Data Store (CDS) [data set], https://doi.org/10.24381/cds.adbb2d47, 2023. a
Highwood, E. J. and Ryder, C. L.: Radiative Effects of Dust, Springer Netherlands, Dordrecht, 267–286, https://doi.org/10.1007/978-94-017-8978-3_11, ISBN 978-94-017-8978-3, 2014. a
Inness, A., Ades, M., Agustí-Panareda, A., Barré, J., Benedictow, A., Blechschmidt, A.-M., Dominguez, J. J., Engelen, R., Eskes, H., Flemming, J., Huijnen, V., Jones, L., Kipling, Z., Massart, S., Parrington, M., Peuch, V.-H., Razinger, M., Remy, S., Schulz, M., and Suttie, M.: The CAMS reanalysis of atmospheric composition, Atmos. Chem. Phys., 19, 3515–3556, https://doi.org/10.5194/acp-19-3515-2019, 2019. a, b
Israelevich, P., Ganor, E., Alpert, P., Kishcha, P., and Stupp, A.: Predominant transport paths of Saharan dust over the Mediterranean Sea to Europe, J. Geophys. Res.-Atmos., 117, 2205, https://doi.org/10.1029/2011JD016482, 2012. a
Johns, R. H. and Dorr, R. A.: Some Meteorological Aspects of Strong and Violent Tornado Episodes in New England and Eastern New York, National Weather Digest, 20, 2–12, 1996. a, b, c, d
Juza, M., de Alfonso, M., and Fernández-Mora, Á.: Coastal ocean response during the unprecedented marine heatwaves in the western Mediterranean in 2022, in: 8th edition of the Copernicus Ocean State Report (OSR8), edited by: von Schuckmann, K., Moreira, L., Grégoire, M., Marcos, M., Staneva, J., Brasseur, P., Garric, G., Lionello, P., Karstensen, J., and Neukermans, G., Copernicus Publications, State Planet, 4-osr8, 14, https://doi.org/10.5194/sp-4-osr8-14-2024, 2024. a
Karyampudi, V. M., Palm, S. P., Reagen, J. A., Fang, H., Grant, W. B., Hoff, R. M., Moulin, C., Pierce, H. F., Torres, O., Browell, E. V., and Melfi, S. H.: Validation of the Saharan Dust Plume Conceptual Model Using Lidar, Meteosat, and ECMWF Data, B. Am. Meteorol. Soc., 80, 1045–1076, https://doi.org/10.1175/1520-0477(1999)080<1045:VOTSDP>2.0.CO;2, 1999. a, b
Keyser, D. and Carlson, T. N.: Transverse Ageostrophic Circulations Associated with Elevated Mixed Layers, Mon. Weather Rev., 112, 2465–2478, https://doi.org/10.1175/1520-0493(1984)112<2465:TACAWE>2.0.CO;2, 1984. a, b, c, d, e, f, g, h, i
Knippertz, P.: Meteorological Aspects of Dust Storms, Springer Netherlands, Dordrecht, 121–147, https://doi.org/10.1007/978-94-017-8978-3_6, ISBN 978-94-017-8978-3, 2014. a
Knippertz, P. and Stuut, J.-B. W.: Introduction, Springer Netherlands, Dordrecht, 1–14, https://doi.org/10.1007/978-94-017-8978-3_1, ISBN 978-94-017-8978-3, 2014. a
Lanicci, J. M. and Warner, T. T.: A Synoptic Climatology of the Elevated Mixed-Layer Inversion over the Southern Great Plains in Spring. Part I: Structure, Dynamics, and Seasonal Evolution, Weather Forecast., 6, 181–197, https://doi.org/10.1175/1520-0434(1991)006<0181:ASCOTE>2.0.CO;2, 1991a. a
Lanicci, J. M. and Warner, T. T.: A Synoptic Climatology of the Elevated Mixed-Layer Inversion over the Southern Great Plains in Spring. Part III: Relationship to Severe-Storms Climatology, Weather Forecast., 6, 214–226, https://doi.org/10.1175/1520-0434(1991)006<0214:ASCOTE>2.0.CO;2, 1991b. a, b, c, d
Lemburg, A., Fink, A. H., Lima, M. M., and Pinto, J. G.: Lagrangian analysis of two flavours of Central European heatwaves: Formation under omega blocking versus initiation by subtropical ridges, Q. J. Roy. Meteor. Soc., 152, e70199, https://doi.org/10.1002/qj.70199, 2026. a
Lewis, M. W. and Gray, S. L.: Categorisation of synoptic environments associated with mesoscale convective systems over the UK, Atmos. Res., 97, 194–213, https://doi.org/10.1016/J.ATMOSRES.2010.04.001, 2010. a, b
Li, F., Chavas, D. R., Reed, K. A., Rosenbloom, N., and Dawson, D. T.: The Role of Elevated Terrain and the Gulf of Mexico in the Production of Severe Local Storm Environments over North America, J. Climate, 34, 7799–7819, https://doi.org/10.1175/JCLI-D-20-0607.1, 2021. a, b
Mohr, S., Wandel, J., Lenggenhager, S., and Martius, O.: Relationship between atmospheric blocking and warm-season thunderstorms over western and central Europe, Q. J. Roy. Meteor. Soc., 145, 3040–3056, https://doi.org/10.1002/QJ.3603, 2019. a
Nabat, P., Somot, S., Mallet, M., Sevault, F., Chiacchio, M., and Wild, M.: Direct and semi-direct aerosol radiative effect on the Mediterranean climate variability using a coupled regional climate system model, Clim. Dynam., 44, 1127–1155, https://doi.org/10.1007/S00382-014-2205-6, 2015. a, b
Penner, J. E., Andreae, M., Annegarn, H., Barrie, L., Feichter, J., Hegg, D., Jayaraman, A., Leaitch, R., Murphy, D., Nganga, J., Pitari, G., Ackerman, A., Adams, P., Austin, P., Boers, R., Boucher, O., Chin, M., Chuang, C., Collins, B., Cooke, W., Demott, P., Feng, Y., Fischer, H., Fung, I., Ghan, S., Ginoux, P., Gong, S.-L., Guenther, A., Herzog, M., Higurashi, A., Kaufman, Y., Kettle, A., Kiehl, J., Koch, D., Lammel, G., Land, C., Lohmann, U., Madronich, S., Mancini, E., Mishchenko, M., Nakajima, T., Quinn, P., Rasch, P., Roberts, D. L., Savoie, D., Schwartz, S., Seinfeld, J., Soden, B., Tanré, D., Taylor, K., Tegen, I., Tie, X., Vali, G., Dingenen, R. V., Weele, M. V., and Zhang, Y.: Aerosols, their Direct and Indirect Effects, in: Climate Change 2001: The Scientific Basis. Contribution of Working Group I to the Third Assessment Report of the Intergovernmental Panel on Climate Change, edited by: Houghton, J. T., Ding, Y., Griggs, D. J., Noguer, M., van der Linden, P. J., Dai, X., Maskell, K., and Johnson, C. A., Cambridge University Press, Cambridge, United Kingdom and New York, NY, USA, 881 pp., ISBN 0521 80767 0 hardback, ISBN 0521 01495 6 paperback, 2001. a
Peyraud, L.: Analysis of the 18 July 2005 Tornadic Supercell over the Lake Geneva Region, Weather Forecast., 28, 1524–1551, https://doi.org/10.1175/WAF-D-13-00022.1, 2013. a
Pfahl, S., Schwierz, C., Croci-Maspoli, M., Grams, C. M., and Wernli, H.: Importance of latent heat release in ascending air streams for atmospheric blocking, Nat. Geosci., 8, 610–614, https://doi.org/10.1038/ngeo2487, 2015. a
Prospero, J. M. and Carlson, T. N.: Vertical and areal distribution of Saharan dust over the western equatorial north Atlantic Ocean, J. Geophys. Res., 77, 5255–5265, https://doi.org/10.1029/JC077I027P05255, 1972. a, b
Prospero, J. M., Delany, A. C., Delany, A. C., and Carlson, T. N.: The Discovery of African Dust Transport to the Western Hemisphere and the Saharan Air Layer: A History, B. Am. Meteorol. Soc., 102, E1239–E1260, https://doi.org/10.1175/BAMS-D-19-0309.1, 2021. a, b
Ralph, F. M., Dettinger, M. C. L., Cairns, M. M., Galarneau, T. J., and Eylander, J.: Defining “Atmospheric River”: How the Glossary of Meteorology Helped Resolve a Debate, B. Am. Meteorol. Soc., 99, 837–839, https://doi.org/10.1175/BAMS-D-17-0157.1, 2018. a
Ribeiro, B. Z. and Bosart, L. F.: Elevated mixed layers and associated severe thunderstorm environments in South and North America, Mon. Weather Rev., 146, 3–28, https://doi.org/10.1175/MWR-D-17-0121.1, 2018. a, b, c, d
Rosenfeld, D., Rudich, Y., and Lahav, R.: Desert dust suppressing precipitation: A possible desertification feedback loop, P. Natl. Acad. Sci. USA, 98, 5975–5980, https://doi.org/10.1073/PNAS.101122798, 2001. a, b
Rostási, Á., Topa, B. A., Gresina, F., Weiszburg, T. G., Gelencsér, A., and Varga, G.: Saharan Dust Deposition in Central Europe in 2016 – A Representative Year of the Increased North African Dust Removal Over the Last Decade, Frontiers in Earth Science, 10, https://doi.org/10.3389/feart.2022.869902, 2022. a
Röthlisberger, M. and Martius, O.: Quantifying the Local Effect of Northern Hemisphere Atmospheric Blocks on the Persistence of Summer Hot and Dry Spells, Geophys. Res. Lett., 46, 10101–10111, https://doi.org/10.1029/2019GL083745, 2019. a
Röthlisberger, M. and Papritz, L.: Quantifying the physical processes leading to atmospheric hot extremes at a global scale, Nat. Geosci., 16, 210–216, https://doi.org/10.1038/s41561-023-01126-1, 2023. a
Schultz, D. M., Herrerías‐Azcué, F., Lowe, D., Kirshbaum, D. J., and Young, M. V.: Rethinking the Spanish plume: An airstream analysis challenges the canonical conceptual model, Q. J. Roy. Meteor. Soc., 151, https://doi.org/10.1002/QJ.5070, 2025a. a, b, c
Schultz, D. M., Young, M. V., and Kirshbaum, D. J.: The Spanish Plume Elevated Mixed Layer: A Review of Its Use and Misuse within the Scientific Literature, Mon. Weather Rev., 153, 737–761, https://doi.org/10.1175/MWR-D-24-0139.1, 2025b. a
Schulzweida, U.: CDO User Guide, Zenodo, https://doi.org/10.5281/zenodo.10020800, 2023. a, b, c
Seifert, A., Bachmann, V., Filipitsch, F., Förstner, J., Grams, C. M., Hoshyaripour, G. A., Quinting, J., Rohde, A., Vogel, H., Wagner, A., and Vogel, B.: Aerosol–cloud–radiation interaction during Saharan dust episodes: the dusty cirrus puzzle, Atmos. Chem. Phys., 23, 6409–6430, https://doi.org/10.5194/acp-23-6409-2023, 2023. a, b
Sibley, A.: Thunderstorms from a Spanish Plume event on 28 June 2011, Weather, 67, 143–146, https://doi.org/10.1002/wea.1928, 2012. a, b, c
Sousa, P. M., Trigo, R. M., Barriopedro, D., Soares, P. M., and Santos, J. A.: European temperature responses to blocking and ridge regional patterns, Clim. Dynam., 50, 457–477, https://doi.org/10.1007/s00382-017-3620-2, 2018. a
Sprenger, M. and Wernli, H.: The LAGRANTO Lagrangian analysis tool – version 2.0, Geosci. Model Dev., 8, 2569–2586, https://doi.org/10.5194/gmd-8-2569-2015, 2015 (data available at: https://iacweb.ethz.ch/staff/sprenger/lagranto/, last access: 21 December 2022). a, b, c
Stephenson, D. B.: Use of the “Odds Ratio” for Diagnosing Forecast Skill, Weather Forecast., 15, 221–232, https://doi.org/10.1175/1520-0434(2000)015<0221:UOTORF>2.0.CO;2, 2000. a, b
Taszarek, M., Allen, J. T., Pucik, T., Hoogewind, K. A., and Brooks, H. E.: Severe Convective Storms across Europe and the United States. Part II: ERA5 Environments Associated with Lightning, Large Hail, Severe Wind, and Tornadoes, J. Climate, 33, 10263–10286, https://doi.org/10.1175/JCLI-D-20-0346.1, 2020. a
Varga, G., Kovács, J., and Újvári, G.: Analysis of Saharan dust intrusions into the Carpathian Basin (Central Europe) over the period of 1979–2011, Global Planet. Change, 100, 333–342, https://doi.org/10.1016/J.GLOPLACHA.2012.11.007, 2013. a, b
Wanke, E., Andersen, R., and Volgnandt, T.: A World-Wide Low-Cost Community-Based Time-of-Arrival Lightning Detection and Lightning Location Network, https://www.blitzortung.org/en/cover_your_area.php (last access: 21 April 2026), 2014. a, b, c
Xi, J., Wang, Y., Li, R., Wu, B., Fan, X., Ma, X., and Meng, Z.: The impact of Sahara dust aerosols on the three-dimensional structure of precipitation systems of different sizes in spring, Atmos. Chem. Phys., 26, 15–32, https://doi.org/10.5194/acp-26-15-2026, 2026. a
Young, M. V. and Grahame, N. S.: The history of UK weather forecasting: the changing role of the central guidance forecaster. Part 6: the late twentieth century: forecasting smaller-scale features, Weather, 78, 304–312, https://doi.org/10.1002/WEA.4370, 2023. a
Zschenderlein, P., Fink, A. H., Pfahl, S., and Wernli, H.: Processes determining heat waves across different European climates, Q. J. Roy. Meteor. Soc., 145, 2973–2989, https://doi.org/10.1002/QJ.3599, 2019. a
- Abstract
- Introduction
- Background
- Data
- Methods
- Co-occurrence of ADs and strong positive temperature anomalies
- Co-occurrence of ADs and thunderstorms
- Co-occurrence of ADs and dust events
- Summary and conclusions
- Appendix A: In-depth explanation of methods
- Appendix B: Supporting figures
- Code availability
- Data availability
- Author contributions
- Competing interests
- Disclaimer
- Acknowledgements
- Financial support
- Review statement
- References
- Abstract
- Introduction
- Background
- Data
- Methods
- Co-occurrence of ADs and strong positive temperature anomalies
- Co-occurrence of ADs and thunderstorms
- Co-occurrence of ADs and dust events
- Summary and conclusions
- Appendix A: In-depth explanation of methods
- Appendix B: Supporting figures
- Code availability
- Data availability
- Author contributions
- Competing interests
- Disclaimer
- Acknowledgements
- Financial support
- Review statement
- References