
the Creative Commons Attribution 4.0 License.
the Creative Commons Attribution 4.0 License.
 | 09 Nov 2026
Dynamical precursors to summer temperature extremes on the Antarctic Peninsula

Amanda C. Maycock
Andrew N. Ross
Ryan S. Williams
Thomas J. Bracegirdle
Extreme warm summer near-surface temperatures over the Antarctic Peninsula (AP) can lead to surface melting and the disintegration of ice shelves. While individual case studies have linked such events to anomalous large-scale circulation, a systematic assessment of the dynamical pathways leading to AP-wide extreme austral summer warm events remains limited. This study uses ERA5 reanalysis data to investigate the large-scale dynamical precursors associated with extreme warm days over the Antarctic Peninsula. We apply k-means clustering to mean sea level pressure anomalies during high temperature extremes and identify five distinct circulation patterns with different dominant zonal wavenumbers. We investigate the spatio-temporal evolution and persistence of near-surface wind, temperature and pressure for each cluster. Four clusters are associated with rapidly amplifying planetary-scale wave patterns, while a fifth resembles a negative Southern Annular Mode–like state with enhanced persistence prior to event onset. Despite these differing pathways, all regimes promote anomalous northerly flow toward the AP, driving strong meridional temperature advection and regional warming. We demonstrate that extreme Antarctic Peninsula warm events arise from distinct circulation pathways, reflecting diverse dynamical states likely influenced by hemispheric-scale teleconnections and planetary wave interactions.
- Article
(10337 KB) - Full-text XML
-
Supplement
(977 KB) - BibTeX
- EndNote


The Antarctic Peninsula (AP) has undergone marked multi-decadal variability in surface air temperature since the mid-20th century. Warming trends calculated over periods longer than approximately 30 years appear robust, particularly during austral summer and autumn (González and Fortuny, 2018), with late 20th century increases exceeding the global mean in several observational records (Marshall et al., 2006; Oliva et al., 2017; Wang et al., 2022a). Concurrently, the late 1990s marked the onset of a period of relative cooling consistent with internal variability (Carrasco et al., 2021; Turner et al., 2016). However, more recent analyses suggest that this early 21st century cooling may be weakening, with temperature evolution closely tied to changes in large-scale circulation modes and regional pressure systems (Carrasco et al., 2019; Bozkurt et al., 2020).
During austral summer (December–February), episodes of extreme warm surface air temperatures over the AP – frequently exceeding 0 °C – are projected to become increasingly common under future scenarios that include continued increases in greenhouse gases (e.g. Siegert et al., 2019). Similarly, pronounced increases in high extremes (p90; 90th percentile compared to mean background climate) in precipitation and westerly wind anomalies are projected to occur on the AP over the 21st century compared to increases in background climatology (Bracegirdle et al., 2024). Such extreme weather events can drive surface melt (Gorodetskaya et al., 2023), firn air depletion (Dunmire et al., 2024), and, in some cases, contribute to the destabilisation and collapse of ice shelves (Scambos et al., 2009; Wille et al., 2022). Improving our understanding of the atmospheric drivers of extreme warm temperatures is therefore critical for assessing Antarctica's vulnerability to climate change and its broader implications for the Earth system.
Extreme warm events over the AP are typically associated with strong poleward meridional wind anomalies near the AP at synoptic timescales, which are often associated with atmospheric blocking, atmospheric rivers and enhanced moisture transport towards Antarctica (Banwell et al., 2021; Bozkurt et al., 2024; Gorodetskaya et al., 2023; Wille et al., 2022; Zou et al., 2023; Wang et al., 2022a, b). The synoptic scale circulation anomalies can be linked with remote forcing, and their effects on temperature may be modulated by local scale processes, including föhn warming on the eastern Peninsula (Bevan et al., 2020; Bae et al., 2022; Guarino et al., 2026; Kirchgaessner et al., 2021; Xu et al., 2021; Zou et al., 2023, 2026).
Anomalous tropical convection associated with the Madden–Julian Oscillation (MJO) and the El Niño-Southern Oscillation (ENSO) can initiate poleward propagating Rossby wave trains that favour blocking highs over the South Pacific and Drake Passage (Renwick and Revell, 1999; Tseng et al., 2019; Clem et al., 2022; Barrett et al., 2025). In addition, a Rossby wave train from the tropical Atlantic has been shown to modulate the intensity of the Amundsen–Bellingshausen Seas Low (ABSL) on decadal timescales, thereby priming the regional circulation to influence conditions across the AP (Li et al., 2014, 2015). Furthermore, anomalous sea surface temperatures across the South Pacific Convergence Zone (SPCZ) have been linked to anticyclonic blocking over coastal West Antarctica through enhanced Rossby wave propagation (Deb et al., 2025). Together, these tropical-extratropical teleconnections can promote poleward transport of heat and moisture toward the Peninsula (e.g., Rondanelli et al., 2019; Clem et al., 2022).
Atmospheric circulation near the AP is also modified by the Southern Annular Mode (SAM) (e.g. Fogt et al., 2012; Clem and Fogt, 2013; Clem et al., 2013; Montano Bello and Villegas Bolanos, 2025). Post 1979, the SAM has become less zonally symmetric, with an increase in zonal wave-3 structure and an eastward shift in phase, modulating the likelihood of more northerly flow anomalies over the AP during positive SAM conditions, consistent with an eastward displacement of the Amundsen–Bellingshausen Sea Low (Marshall et al., 2022). The SAM has also exhibited a positive trend in austral summer and autumn since the late 20th century, with the summer trend driven primarily by stratospheric ozone depletion (e.g. Thompson and Solomon, 2002; Marshall, 2003; Fogt and Marshall, 2020), alongside a deepening of the ABSL (England et al., 2016). The shift toward more positive summer SAM conditions has contributed to long-term warming over the AP through the intensification of high-latitude cyclones, strengthening of meridional flow onto the AP via amplification of the ABSL, and enhancement of lee-side föhn winds along the eastern AP (Marshall, 2007; Orr et al., 2008; Fogt et al., 2010, 2012; Turner et al., 2013; Hosking et al., 2013). Importantly, SAM variability has been linked to changes in the frequency of Peninsula-centred pressure dipole patterns and ABSL-dominated regimes (Hosking et al., 2013; Raphael et al., 2016), including an increased occurrence of an AP-centred dipole during summer between 1979 and 2016 (González et al., 2018)
While the typical circulation features necessary to drive anomalous high temperatures over the AP have been described in the literature (e.g. Balay and Renom, 2026; Clem et al., 2022; Gorodetskaya et al., 2023; Wang et al., 2022a; Wille et al., 2022), there has been relatively little investigation into the diversity in circulation features amongst extremes. In particular: are all dynamically-driven AP extremes made equal? Gonzalez et al. (2018) performed daily clustering of circulation patterns around the AP during the entire year, and therefore did not isolate circulation features associated with extreme high temperatures. Nielsen et al. (2025) applied clustering to surface air temperature trends over the entire Antarctic continent and identified threeclusters that encompassed the AP and analysed their associated extremes. However, they did not specifically examine the diversity of circulation features amongst AP temperature extremes. As a result, a systematic characterisation of the circulation pathways producing summer high temperatures over the AP is lacking.
This study uses ERA5 reanalysis data to examine the synoptic and large-scale circulation patterns linked to extreme austral summer temperature events across the AP. We define extremes over the AP and apply k-means clustering (cf. Nielsen et al., 2025) to mean sea level pressure (MSLP) anomalies at the onset of the extreme temperatures to identify their characteristic clusters which are then studied. The remainder of the paper is structured as follows. Section 2 outlines the methods, Sect. 3 presents the results, and Sect. 4 discusses the implications for understanding and anticipating future extreme events in a warming climate.
2.1 Data
Daily mean near-surface air temperature, 10 m wind fields, sea level pressure and 500 hPa geopotential height data were obtained from ERA5 for the period 1979–2024 on a regular 0.25°×0.25° grid (Hersbach et al., 2020). Hourly zonal and meridional winds and temperature fields at 300 hPa were utilised in the meridional temperature advection analysis. ERA5 exhibits regionally varying near-surface biases at coastal stations and a general warm bias ( K) (Zhu et al., 2021) over the AP; however, it demonstrates generally high agreement in temporal variability with Antarctic station observations (DJF seasonal mean correlation coefficient = 0.82) (Zhu et al., 2021) and is considered to effectively capture the spatial structure and temporal variability of near surface temperature and circulation climate across the AP (Tetzner et al., 2019; Hillebrand et al., 2021; Zhu et al., 2021). This makes ERA5 well suited for analysing synoptic scale circulation associated with austral summer temperature extremes across the AP.
2.2 Methods
2.2.1 Definition of temperature extremes
Extreme high temperature days are identified based on 2 m temperature anomalies calculated relative to a 21 d running mean climatology. Alternative climatological window lengths (7, 10, 14, 30 d) were tested (Fig. S1 in the Supplement), with 21 d chosen to best capture the seasonal cycle without oversmoothing. The AP temperature anomalies are then calculated as the area-weighted average over the whole region [80–50° W; 60–75° S]. Extreme summer temperature anomalies are defined as days when the temperature anomaly exceeds the DJF 95th percentile of departures from the 21 d running mean. This approach aims to capture coherent high temperature events which have the potential to impinge on ice shelf surface melting, and are most likely driven by large-scale regional circulation anomalies (e.g. Wille et al., 2022). The seasonal DJF temperature trend over 1979–2019 is not significant across the AP region in ERA5 (Zhu et al., 2021), and we find no systematic trend in the frequency of extreme high temperature days during the analysis period (Fig. S2).
Extreme high temperature days are grouped into events allowing up to 2 consecutive non-extreme days within a sequence (cf. Baldwin et al., 2019; Ruosteenoja and Jylhä, 2023). Sequences separated by >2 d were treated as independent events. This definition captures 87 events (mean duration 2.4 d), with most lasting 1 d (n=35, 40 %) and 82 % lasting 3 d or fewer.
2.2.2 K-means clustering
K-means clustering has been applied to understand Antarctic climate in previous work (Coggins et al., 2014; Nielsen et al., 2025; Gonzalez et al., 2018). Here, we apply k-means clustering using Lloyd's algorithm (Lloyd, 1982), to the daily MSLP anomaly fields over the region [50–90° S, 180–0° W] for days −3 to +1 relative to the event onset (day 0). The −3 to +1 d window is chosen to capture the immediate synoptic evolution preceding and during extreme high temperature events, while limiting the inclusion of unrelated background variability. Each day within this window is treated as an independent sample in the clustering procedure. That is, daily MSLP anomaly fields from all events spanning days −3 to +1 are input to the clustering. This allows the temporal evolution of circulation patterns leading up to event onset to be assessed through the event duration. For event-based analyses each event was assigned to a single cluster according to the cluster membership of the day 0 circulation pattern. Lead-lag composites outside the clustering window were grouped according to the cluster assignment determined during the clustering stage and were not independently clustered.
To assess whether the clustering window constrains circulation states associated with warm extremes, we computed the Euclidean distance between daily MSLP fields and their associated cluster centroids as a function of lag. We tested for discontinuities at the clustering window boundaries (lag −3 to −4 and +1 to +2), which would indicate a mismatch between clustered and unclustered regimes. Instead, distances vary smoothly with lag, with boundary changes comparable to typical day-to-day variability (not shown).
Lloyd's algorithm is iterative and centroid-based, partitioning the dataset X containing n observations into K distinct groups CK, such that each day is assigned to the cluster with the nearest centroid UK. The goal is to reduce the total within-cluster variance by minimizing the sum of the squared distance between each data point and the center of its assigned cluster. Mathematically, this is expressed as:
Starting from an initial set of centroids, the algorithm first assigns each data point to the cluster whose centroid is nearest in terms of distance:
Then, for the given clusters, the centroids are repositioned to the mean of all points belonging to each cluster:
This iterative process continues until they converge, minimising the sum of squares in the clustering arrangement. We determined the optimal number of clusters (k=5) based on the peak in the silhouette coefficient (Fig. S3) (Rousseeuw, 1987). We further tested (k=4) and (k=6) observing that the centroids derived from the represents a coarser partitioning of the regime space. In contrast, the (k=6) solution yields a reduction in the silhouette score and primarily results in subdivision of the existing regimes (Figs. S4 and S5). Importantly, the solution retains an additional zonal-like circulation regime that is not resolved at and which is dynamically distinct from the other clusters.
2.2.3 Horizontal thermal advection
Horizontal thermal advection was calculated using ERA5 reanalysis data at hourly resolution (see Sect. 2.1) following the formula:
where ∇p denotes the horizontal gradient on a constant pressure surface, u and v represent the zonal and meridional components of wind and T represents air temperature.
Temperature gradients are calculated using centred finite differences on the native grid, with grid spacing in units derived from spherical geometry assuming an Earth radius of 6371 km. The results were converted to units of K d−1. To minimise the influence of orographic effects, the analysis was performed on a constant pressure level of 300 hPa. Sensitivity test using alternative tropospheric pressure levels including 500 hPa produced qualitatively similar results, although lower levels exhibited a greater influence of topography. The horizontal thermal advection diagnostic should not be interpreted as a complete temperature tendency budget, as it does not account for adiabatic processes associated with vertical motion or diabatic heating and latent heat release, which have been shown to contribute to observed temperature extremes (e.g. Röthlisberger and Papritz, 2023).
3.1 Spatial patterns of extreme high temperature events
The composite 2 m temperature anomalies for high temperature extremes show spatially coherent positive temperature anomalies across the AP (Fig. 1a), with typical magnitudes exceeding 4 K. Figure 1b shows the extreme events identified based on the 95th percentile of AP average 2 m temperature coincide with local temperature anomalies above the 95th percentile on average at least 50 % of the time at most locations. Coherence is strongest across the central and southern AP, with somewhat weaker correspondence toward the northern tip. The presence, on average, of high temperature anomalies across the entire AP in the set of extreme events confirms they are typically large-scale events that are likely to have a primary origin from synoptic scale atmospheric circulation drivers.

Figure 1(a) Composite daily mean 2 m temperature anomalies over the Antarctic Peninsula on summer days where the temperature exceeds the 95th percentile. (b) Percentage of extreme events (see Methods) from (a) during which the local 2 m temperature exceeds the local 95th percentile threshold at least once.
3.2 Circulation clusters for high temperature events
To motivate the applicability of k-means clustering to distinguish circulation patterns associated with extreme high temperature events over the AP, we first review three well-documented case studies. Figure 2a–c shows daily 2 m temperature anomalies for: 6–11 February 2020 – the record breaking heatwave over AP triggered by deep convection in the central tropical Pacific (González-Herrero et al., 2022; Clem et al., 2022); 31 December 1988; and 25 January 1985 – corresponding to extreme warm days recorded at the Faraday/Vernadsky station on the west of the Peninsula (Turner et al., 2020). The temperature anomalies during the three events exhibit pronounced spatial heterogeneity and duration. Coincident with the February 2020 event (Fig. 2a), positive anomalies exceeding +5 K were observed across Southwest and West Antarctica (WA), whereas over Dronning Maud Land (DML) and East Antarctica (EA) temperatures remained near climatology. The AP warming coincided with an anomalous ridge positioned to the west of the AP and associated westerly wind anomalies of approximately 3 m s−1 (Fig. 2d). In contrast, the extreme warm event in December 1988 (Fig. 2b) was more confined to the AP, with coincident negative temperature anomalies across central and EA and weaker warm anomalies over Queen Mary Land and the Ross Ice Shelf. This event is characterised by a dipole MSLP anomaly straddling the AP, with a ridge extending along its axis and anomalous northwesterly flow exceeding 5 m s−1. The January 1985 event (Fig. 2c) coincided with widespread positive temperature anomalies that extended across EA. The corresponding MSLP and near-surface wind anomalies (Fig. 2f) resemble those of the December 1988 event, although the high-pressure centre is displaced closer to the AP and shifted westward. The contrasting spatial footprints and circulation anomalies associated with these events serve to highlight the diversity of regional circulation patterns driving extreme high temperatures on the AP and their related anomalies across the continent.

Figure 2Three extreme warm summer events recorded across AP. (a, d) 6–11 February 2020, (b, e) 31 December 1988, (c, f) 25 January 1985. (a–c) Shading: daily near-surface temperature anomalies; contours: MSLP anomalies (interval 2 hPa, solid = positive, dashed = negative). (d–f) Shading: 500 hPa geopotential height anomalies; vectors: near-surface winds [domain 280–320° E, 60–90° S].
The MSLP anomalies associated with the five k-means cluster centroids are presented in Fig. 3a. Cluster 1 is characterised by a high pressure anomaly centred over the Drake Passage and a low pressure anomaly centred between the Amundsen Sea and Ross Sea, with peaks in the mean power spectrum at zonal wavenumbers 1 and 3 (Fig. 3ai and b). Cluster 2 exhibits a dipole structure straddling the AP, consistent with a zonal wavenumber-2 pattern (Fig. 3aii). Cluster 3 features a broad low pressure anomaly centred over the Amundsen Sea with negative anomalies extending over continental WA, with a peak in the mean power spectrum at zonal wavenumber 1 (Fig. 3aiii and b). Cluster 4 shows a peak in the mean power spectrum at zonal wavenumber 2 and is associated with high pressure across WA and the eastern Bellingshausen Sea and a pronounced anticyclone centred northeast of the AP (Fig. 3aiv and b). Cluster 5 exhibits a wave-like circulation pattern with a dipole structure flanking the Antarctic Peninsula. The zonal wavenumber spectrum indicates broadly enhanced power across low wavenumbers (ZW2–ZW4), consistent with a broadband wave structure rather than a single dominant zonal mode (Fig. 3av and b).

Figure 3(a) Centroids (in hPa) and their associated wind vectors (in m s−1) for the 5 clusters shown across the hemisphere over which they were defined [50–90° S, 180–360° E]. (b) Composite average zonal wavenumber power spectrum for each cluster calculated over the hemipshere [50–90° S, 180–360° E]. Shading represents ±1 standard error of the mean.
3.3 Temporal behaviour of high temperature events by cluster
Figure 4 summarises the differences between clusters in terms of event duration and the associated AP temperature anomalies, with the accompanying statistics presented in Table 1. Clear distinctions emerge in both the persistence and intensity of extreme high temperature events between the clusters. Cluster 1 comprises the longest and most intense events with durations ranging from 1 to 7 d and the largest mean AP temperature anomaly. In contrast, Clusters 2–4 represent intermediate-duration events with weaker mean anomalies compared to those from Cluster 1. Cluster 5, which contains the second largest number of events, is characterised by the shortest durations and the weakest mean anomalies. To quantify within-cluster variability, we calculated the mean Euclidean distance between individual samples and their assigned centroid. Larger clusters generally exhibit lower mean distances (not shown), indicating that the most frequently occurring circulation regimes are also among the most dynamically coherent.

Figure 4(a) Histogram showing the duration of each extreme event separated by each k-means cluster. (b) Histogram showing the area-weighted mean 2 m temperature anomaly over the Antarctic Peninsula across all the days of the extreme high temperature events.
Table 1Summary of event statistics by cluster, including event duration and associated temperature anomalies, highlighting differences in cluster characteristics. Uncertainty values represent 95 % confidence range.

Figure 5a shows the temporal evolution of AP-mean temperature anomalies during extreme high temperature events for each cluster, with the corresponding temperature growth rates, calculated using centred finite differences, shown in Fig. 5b. Temperature anomalies remain below 2 K for all clusters until 2 d prior to onset. At this point, Clusters 3–5 exhibit steadily increasing anomalies, reaching peaks of approximately 4.0–4.5 K at day 0. By contrast, Cluster 1 shows weaker anomalies during days −2 to −1, followed by a rapid intensification in the final day before onset, with growth rates approaching ∼2 K d−1 and peak anomalies near 5 K. Cluster 2 also exhibits rapid pre-onset growth but attains a slightly lower peak (∼4.3 K), representing, on average, a fast-developing yet more moderate extreme event.

Figure 5(a) Mean temperature anomaly across the Antarctic Peninsula for the events in each cluster between days −5 and +3. (b) As in (a) but for average temperature growth rate (), calculated using a centred finite-difference scheme method. Shading represents ±1 standard error of the mean. (c) Fraction of events in each cluster whose circulation patterns are assigned to all clusters as a function of lag. Percentages shown in the bars give the proportion of days classified to each cluster. Bars are ordered by decreasing fraction.
Figure 5c shows the fraction of events assigned to each cluster at day 0 that are assigned to all clusters at different lead and lag times. It should not be interpreted as the evolution of individual events, but rather as an aggregate measure of cluster coherence through time. It therefore quantifies how consistently each synoptic regime is retained relative to its day-0 classification. By construction, 100 % of events are assigned to their respective clusters at day 0. Only 55 % of Cluster 1 events are assigned to the same cluster at day −5, indicating substantial variability in circulation in the lead-up to the extreme event. Cluster coherence on day −5 is lower for Clusters 2 (28 %) and 3 (27 %), but higher for Cluster 4 (53 %). Cluster 3 exhibits higher coherence at day −3 (78 %), although this fraction declines at days −2 and −1, suggesting that the circulation patterns associated with many events are located between centroids prior to onset. Similar temporal evolution is observed for Clusters 1, 4, and 5 in the days preceding onset, with Cluster 5 showing the highest persistence, as 70 % of events retain their cluster assignment at day −3. Together, these results indicate that some clusters represent relatively stable, long-lived large-scale circulation anomalies (e.g., Cluster 5), whereas others are characterised by rapidly evolving or transitional synoptic conditions leading up to extreme high temperature events.

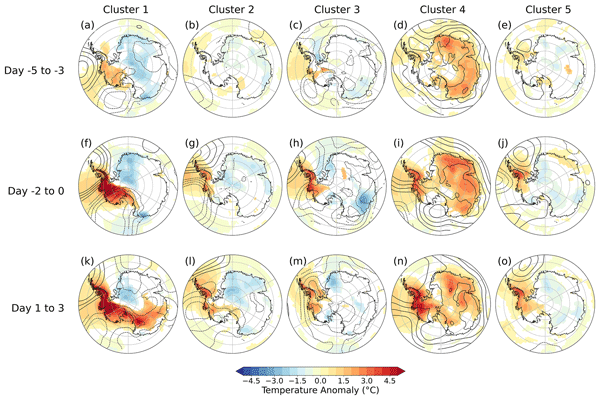
Figure 6Time-averaged lagged composites of events in each cluster for (a–e) days −5 to −3; (f–j) days −2 to 0 and (k–o) days 1 to 3. Day 0 = first day of the extreme event. Shading: near-surface temperature anomalies; contours: MSLP anomalies (interval 2 hPa, solid = positive, dashed = negative). Non-significant anomalies (p>0.05) are not plotted.
To further explore this temporal evolution, Fig. 6 shows composites of MSLP and 2 m temperature anomalies for the days preceding, during and following the onset of the extreme high temperature events for each cluster. The composite MSLP anomalies closely resemble the respective centroids, reinforcing the robustness of the k-means classification. The associated temperature anomaly patterns display substantial differences in spatio-temporal structure between the clusters.
Figure 6a–e shows composite anomalies over days −5 to −3 prior to the onset of extreme warm conditions across AP. In Cluster 1, the warming over WA evident at event onset is already established, though warm anomalies are absent from AP (Fig. 6a). During Cluster 2 events, anomalies remain close to climatological values over days −5 to −3 prior to onset (Fig. 6b). For Cluster 3, there is warming evident in the Bellingshausen Sea and cooling across the Weddell Sea evident in the lead-up period (Fig. 6c). In Cluster 4, there is continental wide warm anomalies with the exception of parts of WA prior to the onset of extreme high temperatures on the AP (Fig. 6d). Temperature anomalies associated with Cluster 5 are broadly close to climatological values prior to the onset of extreme high temperatures on the AP (Fig. 6e).
During the event onset phase (days −2 to 0), Cluster 1 exhibits widespread warm anomalies across the AP, extending into WA and across the Ross Ice Shelf, while cold anomalies are present over Dronning Maud Land (Fig. 6f). Following the event onset (days 1–3), the warm temperature anomalies extend further across to East Antarctica (Fig. 6k) while the cold anomalies near the Dronning Maud Land return towards climatology. Cluster 2 is characterised by warming over the AP and the Bellingshausen Sea, accompanied by cooling at the South Pole and across coastal East Antarctica including Dronning Maud Land (Fig. 6g). The warm anomalies expand into the Ross Ice Shelf area in the period after event onset, with areas of EA characterised by an intensification of their cold anomalies (Fig. 6l). In Cluster 3, the warm anomalies are largely restricted to the AP and WA, while cooling is observed over Wilkes Land (Fig. 6h). After the event onset, warming is largely confined to the same region whilst the cold anomalies found over Wilkes Land return towards climatology (Fig. 6m). Cluster 4 exhibits extensive warm anomalies spanning most of the Antarctic continent (Fig. 5i), which persist in the days following event onset (Fig. 6n). Cluster 5 shows warming over the AP, Weddell Sea and Bellingshausen Sea and cooling over much of EA (Fig. 6j). Following the event, the warm anomalies grow across WA whilst cold anomalies persist over much of EA (Fig. 6o).

Figure 7As in Fig. 6, but for 500 hPa geopotential height anomalies (shading) and near-surface wind speed anomalies (vectors) for the sector 280–320° E, 60–90° S. Non-significant anomalies (p>0.05) are not plotted.
Figure 7 shows composite 500 hPa geopotential height anomalies and 10 m wind anomalies over the AP for days −5 to −3, −2 to 0, and 1 to 3 relative to the onset of high AP temperature events. Across all clusters, there are positive mid-tropospheric height anomalies over or near the AP, indicating the presence of an anomalous ridge, although the amplitude and position of the ridge varies between clusters.
During the preconditioning phase (days −5 to −3), an anomalous ridge is established close to the AP, with the high-pressure centre located to the west and migrating eastward towards the AP by the onset phase (days −2 to 0). An exception occurs in Clusters 4 and 5, where the high-pressure centre is positioned to the east of the AP during preconditioning, placing the AP beneath the western flank of the ridge. The 10 m wind anomalies exhibit substantial inter-cluster differences in both magnitude and direction. Cluster 1 is characterised by strong (∼5 m s−1) and statistically significant anticyclonic anomalies across the Bellingshausen Sea and AP during event onset, with southerlies evident across the Weddell Sea (Fig. 7f). These anomalies are approximately twice the magnitude of the climatological winds in this region, consistent with enhanced meridional warm-air advection. The wind anomalies persist in the days following onset, while the ridge which remains quasi-stationary. Clusters 3 and 4 also exhibit significant anticyclonic wind anomalies of comparable magnitude, with ridges centred primarily over the Bellingshausen Sea (Cluster 3) and the northern AP Sea (Cluster 4) (Fig. 7h and i). Following onset, the ridge in Cluster 4 persists over the AP, albeit with reduced intensity, whereas the anomalous ridge in Cluster 3 dissipates. Cluster 2 displays anomalous northerly near-surface winds across the AP and to the east of the AP (Weddell Sea) during event onset (Fig. 7c), and the associated ridge migrates northward away from the AP in the post-onset period. Cluster 5 exhibits a ridge centred over the Weddell Sea during event onset, with associated anticyclonic wind anomalies, with the ridge migrating further northeast after onset. These patterns suggest that while elevated mid-tropospheric geopotential heights are a common precursor to extreme warm events, differences in the strength, location, and timing of low-level meridional flow likely modulate the magnitude and spatial footprint of surface warming through thermal advection and interactions with AP topography that favour föhn-like warming in some regions.

Figure 8As in Fig. 6, but for anomalies in 300 hPa horizontal thermal advection (shading) and wind speed (vectors) for the sector 105–45° W, 45–80° S.
3.4 Role of thermal advection for high temperature events
Figure 8 quantifies the anomalous upper tropospheric horizontal thermal advection associated with extreme high AP temperature events for each cluster. In the days immediately preceding event onset, all clusters exhibit pronounced positive horizontal thermal advection to the west of the AP, locally exceeding 4 K d−1 (Fig. 8f–j). These strong warming tendencies represent a marked intensification from the preconditioning period, during which comparable advection magnitudes occur only in Cluster 3, across the Bellingshausen Sea and centred near ∼50° S west of South America (Fig. 8c). Although all clusters show anomalous warming tendencies in the region of the AP, as anticipated, their spatial structures differ. Cluster 5 displays weaker and more geographically confined warming, with anomalies of ∼3 K d−1 largely restricted to the AP region. In contrast, Clusters 1–4 exhibit broader horizontal advection patterns extending from further west across the Bellingshausen Sea. Across all clusters, anomalous negative meridional advection (cooling) occurs over the Weddell Sea, consistent with anomalous southerly flow in that region.
Following event onset (Fig. 8k–o), more pronounced cluster-dependent behaviour emerges. Cluster 2 shows widespread positive advection across much of the AP, whereas Clusters 1 and 4 continue to be dominated by warming originating from the lower-latitude Bellingshausen Sea. In Cluster 3, the advection signal weakens across the Bellingshausen Sea region substantially after onset whilst showing warming in the Weddell Sea and north of AP; this is also seen in Cluster 5.
A decomposition of the anomalous upper tropospheric thermal advection for all high temperature events reveals that the meridional component is dominant and this is largely explained by anomalous meridional wind anomalies (Fig. S6). In the zonal component, zonal wind anomalies contribute more than variations in the zonal temperature gradient. These results indicate that anomalous warming during extreme events is driven primarily by changes in flow strength and direction, rather than by modulation of the background temperature gradients.
Together, these results provide further evidence that enhanced poleward heat transport via anomalous meridional flow is a fundamental mechanism underpinning extreme warm events across all clusters, while differences in the location, magnitude, and persistence of this advection help put into context the contrasting growth rates, spatial footprints, and lifetimes of temperature anomalies.
González et al. (2018) identified five recurrent synoptic-scale circulation patterns over the Drake Passage and AP region using a similar method applied over the full annual cycle. These included patterns characterised by low pressure in the Weddell Sea, Amundsen–Bellingshausen Seas, and Drake Passage, as well as zonal flow and a ridge over the AP. Our results suggest that extreme high AP temperatures in austral summer are associated with a subset of the broad circulation regimes identified by González et al. (2018), particularly those featuring ridging over or immediately upstream of the AP. To draw further comparison, they find that a cluster featuring a low over the Drake Passage is the most frequent pattern during austral summer, followed by a more zonally oriented flow, which qualitatively agrees with our findings where Cluster 5 is the most abundant cluster, albeit with its low centre of action located further north. Furthermore, we identify circulation patterns specifically associated with extreme high AP temperature events that were not separated in González et al. (2018); for example conditioning on temperature extremes can reveal additional nuances in the patterns of synoptic scale flow during extreme events such as between clusters 2 and 4, which might otherwise be grouped into a single broad cluster. In this sense, the present study extends González et al. (2018) by demonstrating how specific synoptic patterns are selectively associated with temperature extremes, and by documenting the distinct dynamical signatures associated with each extreme-favouring regime.
The hemispheric-scale atmospheric circulation anomalies show signatures consistent with zonal wavenumber-3 and wavenumber-2 patterns, demonstrated in cluster 1 and clusters 2 and 4, respectively, indicating a hemispheric-scale connection through planetary-scale Rossby wave trains between the tropics, midlatitudes and polar regions (e.g., Ding and Steig, 2013; Boschat et al., 2023; Goyal et al., 2021). Such wave trains are frequently initiated by anomalous tropical convection associated with ENSO and the MJO (e.g. Lee and Seo, 2019; Schneider et al., 2012), and can promote persistent blocking highs over the South Pacific and Drake Passage that favour warm air advection toward the AP (Rondanelli et al., 2019; Clem et al., 2022). Nevertheless, there is evidence to suggest that there is a spatial dependency regarding the impacts of the different modes of climate variability on regions of the AP (e.g. Clem and Fogt, 2013; Clem et al., 2016). Our results suggest a role for planetary scale modes in driving high AP temperature events. In particular, Cluster 4 exhibits a more persistent and extensive high-pressure anomaly over Antarctica in the lead-up to the onset of extreme warm temperatures across AP, suggestive of a negative SAM-like state, consistent with circulation patterns that are known to weaken the circumpolar westerlies and shift the storm track equatorward, which can promote warm air intrusions into the AP (Turner et al., 2013; Raphael et al., 2016). This is consistent with well established evidence that variations in SAM strongly modulate AP temperature extremes (Fogt et al., 2012; Clem et al., 2016; Turner et al., 2020).
The spatial footprint of warming differs markedly between clusters, with some exhibiting continent-wide warming while others show warming largely confined to West Antarctica or the AP alone. This behaviour mirrors continental-scale analyses showing that West Antarctic temperature extremes tend to be spatially confined and closely linked to meridional flow anomalies, whereas East Antarctic temperature extremes are often associated with inland high-pressure systems and katabatic wind enhancement (Nielsen et al., 2025). The present results support this evidence and suggest that the AP occupies a dynamical regime in which both large-scale advection and local topographic effects strongly influence extreme temperature expression.
Our results have shown that large-scale thermal advection plays a key role in driving high temperature events on the AP. However, the thermal advection diagnostic presented here does not constitute a complete temperature tendency budget. Adiabatic temperature changes associated with vertical motion and diabatic heating will also contribute in part to Antarctic temperature extremes. Furthermore, latent heat release associated with moist heat fluxes has been identified as an important contributor to Antarctic heat extremes (e.g. Blanchard-Wrigglesworth et al., 2023) but is not explicitly quantified here. Station-based analyses indicate that the majority of record local temperature extremes on the AP occur following flow across steep orography, consistent with an important contribution from föhn warming (Turner et al., 2020). In addition, the presence of high pressure and near-surface wind anomalies extending for several days over the AP, particularly in Clusters 1 and 5, supports a mechanism whereby anomalous anticyclonic flow drives warm, dry northwesterly winds onto the upwind side of the AP, producing föhn-like conditions on the leeward side. ERA5 does not fully resolve the dynamics of föhn flow due to its coarse spatial resolution, however, the presence of northwesterly low-level wind anomalies in several clusters suggests there would be a central role of föhn processes in the high AP temperature events identified as found in various studies (Elvidge et al., 2015; Laffin et al., 2021; Turton et al., 2020). These dynamics are well-established contributors to surface melt and firn air depletion on the AP (e.g. Cape et al., 2015; Zou et al., 2023; Kirchgaessner et al., 2021), and have been implicated in major melt events over ice shelves such as Larsen C (Elvidge et al., 2014). Case study events pertaining to each cluster, using observations and high-resolution modelling tools such as dynamically downscaled regional climate model outputs, should be looked at in future to help understand the relative role of local-scale (föhn wind) from background forcing due to large-scale drivers.
This study has identified five distinct circulation patterns associated with extreme high summer temperatures across AP in austral summer using k-means clustering applied to daily MSLP on days when the 2 m AP averaged temperature exceeds the 95th percentile. The resulting clusters exhibit substantial diversity in the patterns of continental 2 m temperature, 10 m wind, and mid-tropospheric geopotential height anomalies, demonstrating that high temperature extremes on the AP are driven by a range of synoptic circulation states. While Cluster 4 shows continent-wide warming, Clusters 1 and 3 show warming confined to WA. The warming in Cluster 2 and 5 is more confined to the AP with coincident cooling across parts of EA. Unsurprisingly, all clusters are associated with a ridge over the northern AP, though the magnitude, orientation and persistence of this feature varies significantly.
The classification of dynamical patterns associated with similar high AP summer temperatures extends prior work on circulation patterns throughout the seasonal cycle (Gonzalez et al., 2018) and continental trends and extremes (Turner et al., 2020; Nielsen et al., 2025) and reveals that extreme high AP temperatures arise not from a single canonical pattern, but from a range of distinct synoptic states. Future work could examine the connection of these states to remote large-scale drivers such as tropical and subtropical convection (e.g., Turner et al., 2016; Pezza et al., 2012), the SAM and the stratospheric polar vortex (e.g., Lim et al., 2018), as well as assess their representation in climate models in order to better understand their predictability across future timescales.
While this study has applied k-means clustering to circulation fields in order to focus on the role of atmospheric dynamics, it may be interesting in the future to include other information in the clustering related to thermodynamic preconditioning and radiative effects, which have been shown to contribute to extreme melt and temperature events (e.g. Gorodetskaya et al., 2023; Wille et al., 2022), and to quantify thermal tendencies from adiabatic descent, turbulent mixing, and cloud-radiative effects.
The ERA5 reanalysis data sets (Hersbach et al., 2020) can be obtained from the Copernicus Climate Data Store (https://cds.climate.copernicus.eu/, last access: 1 Deccember 2025). All figures are prepared using Python (version 3.11; https://www.python.org/downloads/release/python-3110/, last access: 31 October 2026).
The supplement related to this article is available online at https://doi.org/10.5194/wcd-7-2213-2026-supplement.
WJD, ACM and ANR designed the study. WJD performed the analysis and produced the figures. WJD wrote the manuscript draft; ACM and ANR edited the manuscript with comments from RSW, TJB.
The contact author has declared that none of the authors has any competing interests.
Publisher's note: Copernicus Publications remains neutral with regard to jurisdictional claims made in the text, published maps, institutional affiliations, or any other geographical representation in this paper. The authors bear the ultimate responsibility for providing appropriate place names. Views expressed in the text are those of the authors and do not necessarily reflect the views of the publisher.
We are grateful to the wider NERC-funded ExtAnt project team for their contributions to the discussion of the results. We thank Tony Phillips for assistance with data handling. We are also grateful to NERC's JASMIN facility for providing resources to conduct the analysis.
This research has been supported by the Natural Environment Research Council (grant nos. NE/Y503307/1 and NE/Y503319/1).
This paper was edited by David Battisti and reviewed by two anonymous referees.
Bae, H. J., Kim, S. J., Kim, B. M., and Kwon, H.: Causes of the Extreme Hot Event on February 9, 2020, in Seymour Island, Antarctic Peninsula, Front. Environ. Sci., 10, 865775, https://doi.org/10.3389/FENVS.2022.865775, 2022.
Balay, F. and Renom, M.: Characterization of extreme warm temperature events (1998–2016) on King George Island, Antarctic Peninsula, Antarct. Sci., 38, 146–160, https://doi.org/10.1017/S0954102025100552, 2026.
Baldwin, J. W., Dessy, J. B., Vecchi, G. A., and Oppenheimer, M.: Temporally Compound Heat Wave Events and Global Warming: An Emerging Hazard, Earths Future, 7, 411–427, https://doi.org/10.1029/2018EF000989, 2019.
Banwell, A. F., Datta, R. T., Dell, R. L., Moussavi, M., Brucker, L., Picard, G., Shuman, C. A., and Stevens, L. A.: The 32-year record-high surface melt in 2019/2020 on the northern George VI Ice Shelf, Antarctic Peninsula, The Cryosphere, 15, 909–925, https://doi.org/10.5194/tc-15-909-2021, 2021.
Barrett, B. S., Lafleur, D. M., and Henderson, G. R.: Madden–Julian Oscillation Modulation of Antarctic Sea Ice, Glacies, 2, 16, https://doi.org/10.3390/GLACIES2040016, 2025.
Bevan, S., Luckman, A., Hendon, H., and Wang, G.: The 2020 Larsen C Ice Shelf surface melt is a 40-year record high, The Cryosphere, 14, 3551–3564, https://doi.org/10.5194/tc-14-3551-2020, 2020.
Blanchard-Wrigglesworth, E., Cox, T., Espinosa, Z. I., and Donohoe, A.: The Largest Ever Recorded Heatwave – Characteristics and Attribution of the Antarctic Heatwave of March 2022, Geophys. Res. Lett., 50, e2023GL104910, https://doi.org/10.1029/2023GL104910, 2023.
Boschat, G., Purich, A., Rudeva, I., and Arblaster, J.: Impact of Zonal and Meridional Atmospheric Flow on Surface Climate and Extremes in the Southern Hemisphere, J. Climate, 36, 5041–5061, https://doi.org/10.1175/JCLI-D-22-0251.1, 2023.
Bozkurt, D., Bromwich, D. H., Carrasco, J., Hines, K. M., Maureira, J. C., and Rondanelli, R.: Recent Near-surface Temperature Trends in the Antarctic Peninsula from Observed, Reanalysis and Regional Climate Model Data, Adv. Atmos. Sci., 37, 477–493, https://doi.org/10.1007/s00376-020-9183-x, 2020.
Bozkurt, D., Marín, J. C., Verdugo, C., and Barrett, B. S.: Atmospheric blocking and temperatures in the Antarctic Peninsula, Sci. Total Environ., 931, 172852, https://doi.org/10.1016/j.scitotenv.2024.172852, 2024.
Bracegirdle, T. J., Caton Harrison, T., Holmes, C. R., Lu, H., Martineau, P., and Phillips, T.: Antarctic extreme seasons under 20th and 21st century climate change, npj Climate and Atmospheric Science, 7, 276, https://doi.org/10.1038/s41612-024-00822-y, 2024.
Cape, M. R., Vernet, M., Skvarca, P., Marinsek, S., Scambos, T., and Domack, E.: Foehn winds link climate-driven warming to ice shelf evolution in Antarctica, J. Geophys. Res.-Atmos., 120, 11037–11057, https://doi.org/10.1002/2015JD023465, 2015.
Carrasco, J. F., Bozkurt, D., and Cordero, R. R.: A review of the observed air temperature in the Antarctic Peninsula. Did the warming trend come back after the early 21st hiatus?, Polar Sci., 28, 100653, https://doi.org/10.1016/j.polar.2021.100653, 2021.
Clem, K. R. and Fogt, R. L.: Varying roles of ENSO and SAM on the Antarctic Peninsula climate in austral spring, J. Geophys. Res.-Atmos., 118, 11481–11492, https://doi.org/10.1002/JGRD.50860, 2013.
Clem, K. R., Bozkurt, D., Kennett, D., King, J. C., and Turner, J.: Central tropical Pacific convection drives extreme high temperatures and surface melt on the Larsen C Ice Shelf, Antarctic Peninsula, Nat. Commun., 13, 3906, https://doi.org/10.1038/s41467-022-31119-4, 2022.
Coggins, J. H. J., McDonald, A. J., and Jolly, B.: Synoptic climatology of the Ross Ice Shelf and Ross Sea region of Antarctica: K-means clustering and validation, Int. J. Climatol., 34, 2330–2348, https://doi.org/10.1002/JOC.3842, 2014.
Deb, P., Bromwich, D., Orr, A., Sen, A., and Clem, K. R.: Recent increase in surface melting of West Antarctic ice shelves linked to Interdecadal Pacific Oscillation, Commun. Earth Environ., 6, 99, https://doi.org/10.1038/s43247-025-02077-8, 2025.
Ding, Q., Steig, E. J., Ding, Q., and Steig, E. J.: Temperature Change on the Antarctic Peninsula Linked to the Tropical Pacific, J. Climate, 26, 7570–7585, https://doi.org/10.1175/JCLI-D-12-00729.1, 2013.
Dunmire, D., Wever, N., Banwell, A. F., and Lenaerts, J. T. M.: Antarctic-wide ice-shelf firn emulation reveals robust future firn air depletion signal for the Antarctic Peninsula, Commun. Earth Environ., 5, 100, https://doi.org/10.1038/s43247-024-01255-4, 2024.
Elvidge, A. D., Renfrew, I. A., King, J. C., Orr, A., Lachlan-Cope, T. A., Weeks, M., and Gray, S. L.: Foehn jets over the Larsen C Ice Shelf, Antarctica, Q. J. Roy. Meteor. Soc., 141, 698–713, https://doi.org/10.1002/QJ.2382, 2015.
England, M. R., Polvani, L. M., Smith, K. L., Landrum, L., and Holland, M. M.: Robust response of the Amundsen Sea Low to stratospheric ozone depletion, Geophys. Res. Lett., 43, 8207–8213, https://doi.org/10.1002/2016GL070055, 2016.
Fogt, R. L. and Marshall, G. J.: The Southern Annular Mode: Variability, trends, and climate impacts across the Southern Hemisphere, WIRes Clim. Change, 11, e652, https://doi.org/10.1002/WCC.652, 2020.
Fogt, R. L., Bromwich, D. H., and Hines, K. M.: Understanding the SAM influence on the South Pacific ENSO teleconnection, Clim. Dynam., 36, 1555–1576, https://doi.org/10.1007/S00382-010-0905-0, 2010.
Fogt, R. L., Jones, J. M., and Renwick, J.: Seasonal Zonal Asymmetries in the Southern Annular Mode and Their Impact on Regional Temperature Anomalies, J. Climate, 25, 6253–6270, https://doi.org/10.1175/JCLI-D-11-00474.1, 2012.
Gonzalez, S. and Fortuny, D.: How robust are the temperature trends on the Antarctic Peninsula?, Antarct. Sci., 30, 322–328, https://doi.org/10.1017/S0954102018000251, 2018.
Gonzalez, S., Vasallo, F., Recio-Blitz, C., Guijarro, J. A., and Riesco, J.: Atmospheric Patterns over the Antarctic Peninsula, J. Climate, 31, 3597–3608, https://doi.org/10.1175/JCLI-D-17-0598.1, 2018.
González-Herrero, S., Barriopedro, D., Trigo, R. M., López-Bustins, J. A., and Oliva, M.: Climate warming amplified the 2020 record-breaking heatwave in the Antarctic Peninsula, Commun. Earth Environ., 3, 122, https://doi.org/10.1038/s43247-022-00450-5, 2022.
Gorodetskaya, I. V., Durán-Alarcón, C., González-Herrero, S., Clem, K. R., Zou, X., Rowe, P., Rodriguez Imazio, P., Campos, D., Leroy-Dos Santos, C., Dutrievoz, N., Wille, J. D., Chyhareva, A., Favier, V., Blanchet, J., Pohl, B., Cordero, R. R., Park, S. J., Colwell, S., Lazzara, M. A., Carrasco, J., Gulisano, A. M., Krakovska, S., Ralph, F. M., Dethinne, T., and Picard, G.: Record-high Antarctic Peninsula temperatures and surface melt in February 2022: a compound event with an intense atmospheric river, npj Climate and Atmospheric Science, 6, 202, https://doi.org/10.1038/s41612-023-00529-6, 2023.
Goyal, R., Jucker, M., sen Gupta, A., Hendon, H. H., and England, M. H.: Zonal wave 3 pattern in the Southern Hemisphere generated by tropical convection, Nat. Geosci., 14, 732–738, https://doi.org/10.1038/s41561-021-00811-3, 2021.
Guarino, M.-V., Ridley, J. K., Colwell, S., Farneti, R., Giuliani, G., Hindley, N., King, J., Kucharski, F., Polichtchouk, I., Tompkins, A. M., Vignon, É., and Wright, C.: A Long-Term Shift in Flow Regimes over the Antarctic Peninsula, J. Climate, 39, 749–767, https://doi.org/10.1175/jcli-d-25-0330.1, 2026.
Hersbach, H., Bell, B., Berrisford, P., Hirahara, S., Horányi, A., Muñoz-Sabater, J., Nicolas, J., Peubey, C., Radu, R., Schepers, D., Simmons, A., Soci, C., Abdalla, S., Abellan, X., Balsamo, G., Bechtold, P., Biavati, G., Bidlot, J., Bonavita, M., de Chiara, G., Dahlgren, P., Dee, D., Diamantakis, M., Dragani, R., Flemming, J., Forbes, R., Fuentes, M., Geer, A., Haimberger, L., Healy, S., Hogan, R. J., Hólm, E., Janisková, M., Keeley, S., Laloyaux, P., Lopez, P., Lupu, C., Radnoti, G., de Rosnay, P., Rozum, I., Vamborg, F., Villaume, S., and Thépaut, J. N.: The ERA5 global reanalysis, Q. J. Roy. Meteor. Soc., 146, 1999–2049, https://doi.org/10.1002/QJ.3803, 2020.
Hillebrand, F. L., Bremer, U. F., Arigony-Neto, J., da Rosa, C. N., Mendes, C. W., Costi, J., de Freitas, M. W. D., and Schardong, F.: Comparison between Atmospheric Reanalysis Models ERA5 and ERA-Interim at the North Antarctic Peninsula Region, Ann. Am. Assoc. Geogr., 111, 1147–1159, https://doi.org/10.1080/24694452.2020.1807308, 2021.
Hosking, J. S., Orr, A., Marshall, G. J., Turner, J., and Phillips, T.: The Influence of the Amundsen–Bellingshausen Seas Low on the Climate of West Antarctica and Its Representation in Coupled Climate Model Simulations, J. Climate, 26, 6633–6648, https://doi.org/10.1175/JCLI-D-12-00813.1, 2013.
Kirchgaessner, A., King, J. C., and Anderson, P. S.: The Impact of Föhn Conditions Across the Antarctic Peninsula on Local Meteorology Based on AWS Measurements, J. Geophys. Res.-Atmos., 126, e2020JD033748, https://doi.org/10.1029/2020JD033748,2021.
Laffin, M. K., Zender, C. S., Singh, S., van Wessem, J. M., Smeets, C. J. P. P., and Reijmer, C. H.: Climatology and Evolution of the Antarctic Peninsula Föhn Wind-Induced Melt Regime From 1979–2018, J. Geophys. Res.-Atmos., 126, e2020JD033682, https://doi.org/10.1029/2020JD033682, 2021.
Lee, H. J. and Seo, K. H.: Impact of the Madden–Julian oscillation on Antarctic sea ice and its dynamical mechanism, Sci. Rep.-UK, 9, 10761, https://doi.org/10.1038/s41598-019-47150-3, 2019.
Li, X., Holland, D. M., Gerber, E. P., and Yoo, C.: Impacts of the north and tropical Atlantic Ocean on the Antarctic Peninsula and sea ice, Nature, 505, 538–542, https://doi.org/10.1038/NATURE12945, 2014.
Li, X., Gerber, E. P., Holland, D. M., and Yoo, C.: A Rossby Wave Bridge from the Tropical Atlantic to West Antarctica, J. Climate, 28, 2256–2273, https://doi.org/10.1175/JCLI-D-14-00450.1, 2015.
Lim, E. P., Hendon, H. H., and Thompson, D. W. J.: Seasonal Evolution of Stratosphere-Troposphere Coupling in the Southern Hemisphere and Implications for the Predictability of Surface Climate, J. Geophys. Res.-Atmos., 123, 12002–12016, https://doi.org/10.1029/2018JD029321, 2018.
Lloyd, S. P.: Least Squares Quantization in PCM, IEEE T. Inform. Theory, 28, 129–137, https://doi.org/10.1109/TIT.1982.1056489, 1982.
Marshall, G. J.: Trends in the Southern Annular Mode from Observations and Reanalyses, J. Climate, 16, https://doi.org/10.1175/1520-0442(2003)016<4134:TITSAM>2.0.CO;2, 2003.
Marshall, G. J.: Half-century seasonal relationships between the Southern Annular Mode and Antarctic temperatures, Int. J. Climatol., 27, 373–383, https://doi.org/10.1002/JOC.1407, 2007.
Marshall, G. J., Orr, A., van Lipzig, N. P. M., and King, J. C.: The Impact of a Changing Southern Hemisphere Annular Mode on Antarctic Peninsula Summer Temperatures, J. Climate, 19, 5388–5404, https://doi.org/10.1175/JCLI3844.1, 2006.
Marshall, G. J., Fogt, R. L., Turner, J., and Clem, K. R.: Can current reanalyses accurately portray changes in Southern Annular Mode structure prior to 1979?, Clim. Dynam., 59, 3717–3740, https://doi.org/10.1007/s00382-022-06292-3, 2022.
Montaño Bello, D. and Villegas Bolaños, N. L.: Influence of ENSO and SAM on the occurrence of absolute extremes and behavior of Ta, SST, and SIC anomalies in the western Antarctic Peninsula, Atmosfera, 39, 437–450, https://doi.org/10.20937/ATM.53423, 2025.
Nielsen, E. B., Katurji, M., Zawar-Reza, P., and Cullen, N.: Air Temperature Trends and Extreme Warming Events Across Regions of Antarctica for the Period 2003–2021, J. Geophys. Res.-Atmos., 130, e2024JD043042, https://doi.org/10.1029/2024JD043042, 2025.
Oliva, M., Navarro, F., Hrbáček, F., Hernández, A., Nývlt, D., Pereira, P., Ruiz-Fernández, J., and Trigo, R.: Recent regional climate cooling on the Antarctic Peninsula and associated impacts on the cryosphere, Sci. Total Environ., 580, 210–223, https://doi.org/10.1016/J.SCITOTENV.2016.12.030, 2017.
Orr, A., Marshall, G. J., Hunt, J. C. R., Sommeria, J., Wang, C. G., van Lipzig, N. P. M., Cresswell, D., and King, J. C.: Characteristics of Summer Airflow over the Antarctic Peninsula in Response to Recent Strengthening of Westerly Circumpolar Winds, J. Atmos. Sci., 65, 1396–1413, https://doi.org/10.1175/2007JAS2498.1, 2008.
Pezza, A. B., Rashid, H. A., and Simmonds, I.: Climate links and recent extremes in antarctic sea ice, high-latitude cyclones, Southern Annular Mode and ENSO, Clim. Dynam., 38, 57–73, https://doi.org/10.1007/S00382-011-1044-Y, 2012.
Raphael, M. N., Marshall, G. J., Turner, J., Fogt, R. L., Schneider, D., Dixon, D. A., Hosking, J. S., Jones, J. M., and Hobbs, W. R.: The Amundsen Sea Low: Variability, Change, and Impact on Antarctic Climate, B. Am. Meteorol. Soc., 97, 111–121, https://doi.org/10.1175/BAMS-D-14-00018.1, 2016.
Renwick, J. A. and Revell, M. J.: Blocking over the South Pacific and Rossby Wave Propagation, Mon. Weather Rev., 127, https://doi.org/10.1175/1520-0493(1999)127<2233:BOTSPA>2.0.CO;2, 1999.
Rondanelli, R., Hatchett, B., Rutllant, J., Bozkurt, D., and Garreaud, R.: Strongest MJO on Record Triggers Extreme Atacama Rainfall and Warmth in Antarctica, Geophys. Res. Lett., 46, 3482–3491, https://doi.org/10.1029/2018GL081475, 2019.
Röthlisberger, M. and Papritz, L.: Quantifying the physical processes leading to atmospheric hot extremes at a global scale, Nat. Geosci., 16, 210–216, https://doi.org/10.1038/s41561-023-01126-1, 2023.
Rousseeuw, P. J.: Silhouettes: A graphical aid to the interpretation and validation of cluster analysis, J. Comput. Appl. Math., 20, 53–65, https://doi.org/10.1016/0377-0427(87)90125-7, 1987.
Ruosteenoja, K. and Jylhä, K.: Average and extreme heatwaves in Europe at 0.5–2.0 °C global warming levels in CMIP6 model simulations, Clim. Dynam., 61, 4259–4281, https://doi.org/10.1007/S00382-023-06798-4, 2023.
Scambos, T., Fricker, H. A., Liu, C. C., Bohlander, J., Fastook, J., Sargent, A., Massom, R., and Wu, A. M.: Ice shelf disintegration by plate bending and hydro-fracture: Satellite observations and model results of the 2008 Wilkins ice shelf break-ups, Earth Planet. Sc. Lett., 280, 51–60, https://doi.org/10.1016/J.EPSL.2008.12.027, 2009.
Schneider, D. P., Deser, C., and Okumura, Y.: An assessment and interpretation of the observed warming of West Antarctica in the austral spring, Clim. Dynam., 38, 323–347, https://doi.org/10.1007/S00382-010-0985-X, 2012.
Siegert, M., Atkinson, A., Banwell, A., Brandon, M., Convey, P., Davies, B., Downie, R., Edwards, T., Hubbard, B., Marshall, G., Rogelj, J., Rumble, J., Stroeve, J., and Vaughan, D.: The Antarctic Peninsula under a 1.5 °C global warming scenario, Front. Environ. Sci., 7, 465700, https://doi.org/10.3389/FENVS.2019.00102, 2019.
Tetzner, D., Thomas, E., and Allen, C.: A Validation of ERA5 Reanalysis Data in the Southern Antarctic Peninsula – Ellsworth Land Region, and Its Implications for Ice Core Studies, Geosciences, 9, 289, https://doi.org/10.3390/GEOSCIENCES9070289, 2019.
Thompson, D. W. J. and Solomon, S.: Interpretation of recent Southern Hemisphere climate change, Science, 296, 895–899, https://doi.org/10.1126/SCIENCE.1069270, 2002.
Tseng, K.-C., Maloney, E., and Barnes, E.: The Consistency of MJO Teleconnection Patterns: An Explanation Using Linear Rossby Wave Theory, J. Climate, 32, 531–548, https://doi.org/10.1175/JCLI-D-18-0211.1, 2019.
Turner, J., Maksym, T., Phillips, T., Marshall, G. J., and Meredith, M. P.: The impact of changes in sea ice advance on the large winter warming on the western Antarctic Peninsula, Int. J. Climatol., 33, 852–861, https://doi.org/10.1002/JOC.3474, 2013.
Turner, J., Lu, H., White, I., King, J. C., Phillips, T., Hosking, J. S., Bracegirdle, T. J., Marshall, G. J., Mulvaney, R., and Deb, P.: Absence of 21st century warming on Antarctic Peninsula consistent with natural variability, Nature, 535, 411–415, https://doi.org/10.1038/nature18645, 2016.
Turner, J., Marshall, G. J., Clem, K., Colwell, S., Phillips, T., and Lu, H.: Antarctic temperature variability and change from station data, Int. J. Climatol., 40, 2986–3007, https://doi.org/10.1002/JOC.6378, 2020.
Turton, J. V., Kirchgaessner, A., Ross, A. N., King, J. C., and Kuipers Munneke, P.: The influence of föhn winds on annual and seasonal surface melt on the Larsen C Ice Shelf, Antarctica, The Cryosphere, 14, 4165–4180, https://doi.org/10.5194/tc-14-4165-2020, 2020.
Wang, S., Ding, M., Liu, G., Wei, T., Zhang, W., Chen, W., Dou, T., and Xiao, C.: On the drivers of temperature extremes on the Antarctic Peninsula during austral summer, Clim. Dynam., 59, 2275–2291, https://doi.org/10.1007/S00382-022-06209-0, 2022a.
Wang, S., Ding, M., Liu, G., and Chen, W.: Processes and Mechanisms of Persistent Extreme Rainfall Events in the Antarctic Peninsula during Austral Summer, J. Climate, 35, 3643–3657, https://doi.org/10.1175/JCLI-D-21-0834.1, 2022b.
Wille, J. D., Favier, V., Jourdain, N. C., Kittel, C., Turton, J. V., Agosta, C., Gorodetskaya, I. V., Picard, G., Codron, F., dos Santos, C. L., Amory, C., Fettweis, X., Blanchet, J., Jomelli, V., and Berchet, A.: Intense atmospheric rivers can weaken ice shelf stability at the Antarctic Peninsula, Commun. Earth Environ., 3, 1–14, https://doi.org/10.1038/S43247-022-00422-9, 2022.
Xu, M., Yu, L., Liang, K., Vihma, T., Bozkurt, D., Hu, X., and Yang, Q.: Dominant role of vertical air flows in the unprecedented warming on the Antarctic Peninsula in February 2020, Commun. Earth Environ., 2, 133, https://doi.org/10.1038/s43247-021-00203-w, 2021.
Zhu, J., Xie, A., Qin, X., Wang, Y., Xu, B., and Wang, Y.: An Assessment of ERA5 Reanalysis for Antarctic Near-Surface Air Temperature, Atmosphere-Basel, 12, 217, https://doi.org/10.3390/ATMOS12020217, 2021.
Zou, X., Rowe, P. M., Gorodetskaya, I., Bromwich, D. H., Lazzara, M. A., Cordero, R. R., Zhang, Z., Kawzenuk, B., Cordeira, J. M., Wille, J. D., Ralph, F. M., and Bai, L. S.: Strong Warming Over the Antarctic Peninsula During Combined Atmospheric River and Foehn Events: Contribution of Shortwave Radiation and Turbulence, J. Geophys. Res.-Atmos., 128, e2022JD038138, https://doi.org/10.1029/2022JD038138, 2023.
Zou, X., Rowe, P. M., Gorodetskaya, I. V., Orr, A., Bromwich, D. H., Lubin, D., Lazzara, M. A., Zhang, Z., Brian, K., Wille, J. D., Cordeira, J. M., Hansen, N., Li, J., Gan, P., and Ralph, F. M.: Föhn-induced melting over Larsen C modulated by atmospheric river shape, direction and landfall location, Nat. Commun., 17, 4788, https://doi.org/10.1038/s41467-026-71359-2, 2026.