
the Creative Commons Attribution 4.0 License.
the Creative Commons Attribution 4.0 License.
 | 09 Nov 2026

TurboMeter: an attribution framework for aviation turbulence events in a changing climate

Davide Faranda
Mohamed Foudad
Erika Coppola
Lia Rapella
Rachel Burbidge
Miguel A. C. Teixeira
Paul D. Williams
Understanding the influence of climate change on aviation turbulence is critical for ensuring flight safety and developing adaptive strategies. Thus, we present TurboMeter, a circulation-conditioned attribution framework that combines objectively observed aircraft turbulence reports with atmospheric analogues to quantify how turbulence-favourable environments evolve under comparable large-scale synoptic circulation conditions. Atmospheric analogues are identified using the complete 500 hPa geopotential height field (Z500), which constrains the large-scale circulation, while additional dynamical and thermodynamical diagnostics, i.e. upper-level wind speed, sea surface temperature (SST), 2-m air temperature (T2m), total column water vapour (TCWV), Convective Available Potential Energy (CAPE), and Convective Inhibition (CIN), are subsequently analysed to provide a physical interpretation of the analogue populations. Turbulence diagnostics, namely the Turbulence Index (TI1) and its two components, vertical wind shear and total deformation, are used to characterize cruise-level moderate-or-greater (MOG) turbulence events reported during 2024 across four major aviation corridors: the North Atlantic, North Pacific, East Asia, and the Contiguous US (CONUS).
Under comparable synoptic conditions, present-day analogues consistently exhibit enhanced upper-level wind shear and higher values of the turbulence diagnostics, i.e. more turbulence-favourable environments, together with warmer lower-boundary conditions and increased atmospheric moisture. The oceanic corridors (North Atlantic and North Pacific) are primarily characterized by coherent increases in SST, TCWV, upper-level wind speed, and vertical wind shear, whereas the continental regions (East Asia and CONUS) additionally exhibit stronger thermodynamic responses, including localized increases in CAPE. Attribution diagnostics indicate that all events are at least partially influenced by anthropogenic climate change, with approximately 68 % (2142 of 3123 reports) classified as being mainly strengthened by anthropogenic forcing, particularly over the North Atlantic, CONUS, and East Asia. A smaller but non-negligible share (about 32 %) is associated with a combination of climate change and natural variability. In contrast, over the North Pacific, the majority of events (81 %) fall into this latter category, highlighting a comparatively stronger role of internal climate variability in that region, consistent with previous studies showing a regionally dependent interplay between anthropogenic forcing and internal climate variability. These findings are further supported by the observed spatial patterns of increased turbulence-favourable conditions and suggest that anthropogenic climate change modifies not only the dynamical but also the thermodynamic environments in which aviation turbulence develops, although through regionally distinct physical pathways. Together, these findings underscore the growing relevance of climate-informed diagnostics for aviation risk planning by considering both anthropogenic climate change and internal climate variability in projecting future turbulence risk.
- Article
(18856 KB) - Full-text XML
-
Supplement
(46695 KB) - BibTeX
- EndNote


Aviation turbulence is a major concern for modern air travel, with important implications for aviation safety, passenger comfort, and operational efficiency (Sharman and Lane, 2016). Each year, turbulence causes numerous injuries, damages aircraft cabins, leads to flight delays and diversions, and increases fuel consumption due to avoidance maneuvers and longer flight paths (Burbidge et al., 2024). Recent advances in automated in situ turbulence observations based on the eddy dissipation rate (EDR) have substantially improved the objective characterization of aviation turbulence, enabling the construction of long-term climatologies and supporting both operational forecasting and climate studies (Sharman et al., 2014; Kim et al., 2020). Compared with traditional pilot reports (PIREPs), EDR is the standard ICAO metric for reporting aircraft turbulence intensity and it provides a quantitative and largely aircraft-independent measure of turbulence intensity, making it particularly suitable for climatological and attribution analyses (ICAO, 2020).
While turbulence has always been an inherent part of atmospheric flight, recent studies suggest that its frequency and intensity – particularly that of clear-air turbulence (CAT) – may be increasing over time (Williams, 2017; Storer et al., 2019; Alberti et al., 2024; Foudad et al., 2024; Lee et al., 2023; Prosser et al., 2023; Jaeger and Sprenger, 2007). Unlike turbulence associated with convective storms or clouds over mountainous terrain (Lane et al., 2012; Guarino et al., 2018), CAT occurs in clear skies, often at cruising altitudes, making it difficult to detect and avoid using conventional radar systems (Dutton, 1971; Foudad et al., 2024). Nevertheless, aviation turbulence is intrinsically a multiscale phenomenon. Although clear-air turbulence frequently develops in association with upper-level jets and strong vertical shear, turbulence may also result from mountain-wave breaking, convectively induced gravity waves, frontal circulations, tropical-cyclone outflow, and other mesoscale dynamical processes (Kim and Chun, 2010, 2012; Kim et al., 2014; Trier et al., 2020; Kim et al., 2021; Baek et al., 2024; Lee et al., 2025). The relative contribution of these mechanisms varies considerably among regions and individual events, making the attribution of observed turbulence particularly challenging.
The prospect that climate change may be intensifying aviation turbulence has therefore become an active area of scientific investigation (Williams and Joshi, 2013; Storer et al., 2017; Gratton et al., 2022). As global temperatures rise due to anthropogenic greenhouse gas emissions, the structure and dynamics of the atmosphere are undergoing substantial changes. In particular, the upper troposphere and lower stratosphere (UTLS), where most commercial aircraft operate (Sharman and Lane, 2016), has experienced changes in wind shear and meridional temperature gradients, especially over East Asia (Lee et al., 2023), two of the primary dynamical ingredients controlling upper-level turbulence through the thermal wind relationship. Simultaneously, the warming of the troposphere and the cooling of the stratosphere, both well-established fingerprints of anthropogenic climate change, are expected to modify the strength and structure of the upper-level jet streams (Shaw and Miyawaki, 2023), thereby influencing the atmospheric environments favourable to turbulence development (Smith et al., 2023).
Previous modelling studies (Williams and Joshi, 2013; Williams, 2017) have projected a significant increase in moderate-to-severe turbulence over major flight corridors by the end of the century under high-emission scenarios. However, determining whether such changes are already detectable in present-day observations – and quantifying the respective contributions of anthropogenic climate change and natural atmospheric variability – remains considerably more challenging (Alberti et al., 2024; Rapella et al., 2025). This difficulty arises because turbulence is a localized and intermittent phenomenon whose generation depends on interactions across multiple spatial scales. Consequently, long-term analyses generally rely on reanalysis datasets together with turbulence diagnostics, such as the Ellrod indices (Ellrod and Knapp, 1992; Ellrod and Knox, 2010), rather than on direct observations alone (Prosser et al., 2023; Jaeger and Sprenger, 2007; Foudad et al., 2024).
In this study, we introduce TurboMeter, a conditional analogue-based attribution framework that builds upon the rapid-attribution methodology developed within ClimaMeter (Faranda et al., 2024). Rather than attempting to identify the specific physical mechanism responsible for each turbulence encounter, TurboMeter constrains the large-scale atmospheric circulation through atmospheric analogues and subsequently evaluates whether turbulence-relevant atmospheric diagnostics differ between historical and present-day climates under comparable synoptic conditions. This circulation-conditioned approach provides a physically interpretable framework for separating changes associated with large-scale atmospheric variability from those emerging under different climatic backgrounds.
We assess the framework using 3123 upper-level (≥8 km) moderate-or-greater (MOG) turbulence reports corresponding to 31 turbulence days observed during 2024 across four major flight corridors: the North Atlantic, North Pacific, East Asia, and the continental US (CONUS). The attribution analysis focuses on the 200–250 hPa layer, corresponding approximately to cruising altitudes (10–12 km), where commercial aircraft operate and where turbulence is closely associated with upper-level jet dynamics. Additional diagnostics of upper-level winds, total column water vapour (TCWV), convective available potential energy (CAPE), and convective inhibition (CIN) are incorporated to provide an additional physical assessment of the selected analogues and to strengthen the interpretation of the attribution results. Representative case studies for each flight corridor are discussed in the main text, while the complete set of analysed events is provided in the Supplement.
2.1 Data
This study combines objective in situ aircraft turbulence observations with atmospheric fields from the ERA5 reanalysis. Turbulence events are identified from automated EDR reports, while ERA5 is used both to characterize the large-scale atmospheric circulation associated with each event and to evaluate the corresponding turbulence-relevant atmospheric diagnostics.
ERA5 is the fifth-generation global atmospheric reanalysis produced by the European Centre for Medium-Range Weather Forecasts (ECMWF). ERA5 provides a physically consistent reconstruction of the global atmosphere with hourly temporal resolution and approximately 31 km horizontal resolution, covering the period from 1950 to the present (Hersbach et al., 2020). Owing to its temporal consistency and comprehensive representation of the atmospheric state, ERA5 has become one of the standard datasets for climatological analyses and analogue-based attribution studies.
Observed turbulence events are identified using automated in situ aircraft reports based on the EDR, which provides an objective and largely aircraft-independent measure of turbulence intensity (Sharman et al., 2014; Kim et al., 2020) and it is the standard ICAO metric for reporting aircraft turbulence intensity (ICAO, 2020). Unlike PIREPs, EDR offers a quantitative estimate of turbulence that is largely independent of aircraft type and operational conditions, making it particularly suitable for climatological analyses. Following operational practice, this study focuses on moderate-or-greater turbulence reports (EDR≥0.2 ). This threshold is used exclusively to identify objectively observed turbulence events and should not be interpreted as an operational definition of “extreme” turbulence.
To investigate changes in aviation-relevant atmospheric environments and assess the influence of climate change, we analyse the following atmospheric variables:
-
500 hPa geopotential height (Z500): used exclusively to identify circulation analogues by characterizing the large-scale atmospheric circulation associated with each event. Z500 provides a robust description of synoptic-scale weather systems, including ridges, troughs, cut-off lows, cyclones and anticyclones, which control the upper-level dynamical environment.
-
Vertical Wind Shear (VWS) quantifies wind variations with height,
where u and v denote the zonal and meridional wind components, respectively, and z is the vertical coordinate. VWS provides a measure of dynamical instability that is closely associated with clear-air turbulence.
-
Total Deformation (DEF) describes the horizontal stretching and shearing deformation of the flow,
where x and y are the horizontal coordinates.
-
Ellrod Turbulence Index (TI1) combines vertical wind shear and horizontal deformation into a diagnostic proxy for upper-level turbulence potential (Ellrod and Knapp, 1992),
-
Upper-level wind speed (250 hPa), TCWV, CAPE, CIN, 2-m temperature (t2m) and sea surface temperature (SST). These variables are not used during the analogue-selection procedure but are analysed a posteriori to provide an additional physical assessment of the selected analogues and to support the interpretation of the attribution results.
Throughout the analysis, Z500 is used exclusively to identify circulation analogues, whereas the remaining atmospheric variables are evaluated only after analogue selection. Furthermore, VWS, DEF and TI1 are calculated around 250 hPa being representative of commercial flights cruise altitude. ERA5 ensures spatial and temporal consistency across decades, making it possible to identify robust circulation analogues and perform circulation-conditioned attribution analyses (Faranda et al., 2023; Alberti et al., 2024).
2.2 Conditional analogue-based attribution
To evaluate whether observed changes in turbulence metrics are linked to anthropogenic climate change, we implement an analogue-based attribution framework based on ClimaMeter (Yiou et al., 2017; Faranda et al., 2024). This approach identifies atmospheric analogues to isolate the contribution of climate change while conditioning the analysis on comparable large-scale circulation patterns (Jézéquel et al., 2018; Faranda et al., 2023). Rather than attempting to reproduce the complete atmospheric state associated with each turbulence encounter, TurboMeter constrains the synoptic-scale circulation and subsequently evaluates whether turbulence-relevant atmospheric diagnostics differ between historical and present-day climates under comparable circulation conditions. The framework consists of the following steps:
-
Event Selection. Turbulence-prone days are identified using automated in situ reports from commercial aircraft, obtained from the Meteorological Assimilation Data Ingest System (MADIS) archive maintained by the National Oceanic and Atmospheric Administration (NOAA). These reports are based on the Aircraft Communications Addressing and Reporting System (ACARS) and provide estimates of EDR. We retain only quality-controlled reports above 8 km altitude. Full details of the dataset and preprocessing are given in Kaluza et al. (2026).
Here, we focus on days in 2024 for which EDR≥0.2 , corresponding to MOG turbulence events, over four domains: North Atlantic (643 reports), North Pacific (425), East Asia (150), and CONUS (1905)1. The event definition is intentionally observation-based rather than process-based. Consequently, no distinction is made between clear-air turbulence, mountain-wave turbulence, convectively induced turbulence, or other turbulence-generation mechanisms. These processes are instead discussed a posteriori through additional atmospheric diagnostics.
-
Analogue Identification. For each event day, we search for historical (1950–2023) analogue days sharing similar Z500 patterns over the analysed domain and within the same season. The 500 hPa geopotential height field is used because it provides a robust representation of the synoptic-scale atmospheric circulation controlling the upper-level dynamical environment in which aviation turbulence develops. Analogues are identified as the top 1 % of circulation patterns minimizing the Euclidean distance between the event Z500 field and all candidate Z500 fields in the ERA5 archive (Faranda et al., 2024). It is important to emphasize that similarity in Z500 does not imply identical turbulence-generation mechanisms or identical atmospheric states. Instead, it identifies comparable large-scale circulation configurations suitable for circulation-conditioned attribution. We also stress that the observed event is used only to define the target circulation pattern: neither the historical nor the present-day analogues are selected on the basis of observed turbulence. Both analogue populations consist of ERA5 days sharing a Z500 configuration similar to that of the event, and whether turbulence actually occurred on each analogue day cannot be verified, since automated EDR reports are not available for most of the 1950–2023 period.
-
Climate Attribution. Once the analogues have been identified, we compare the distributions of turbulence-related diagnostics, e.g. TI1, between the present climate (1987–2023) and the historical climate (1950–1986)2. An increase in turbulence diagnostics within the present-day analogue population, despite comparable large-scale circulation, is interpreted as evidence of a climate-change fingerprint. It is worth noting that the comparison is not performed between the observed (turbulent) event and past (possibly non-turbulent) days, but between two analogue populations of the same kind, drawn from the historical and the present-day climate, respectively. The attributed quantity is therefore the change in the turbulence-favourable environment, as measured by the turbulence diagnostics, under comparable large-scale circulation, rather than the occurrence of turbulence on individual analogue days. Conditioning on the large-scale circulation is the essence of conditional, circulation-based attribution (Yiou et al., 2017; Jézéquel et al., 2018; Faranda et al., 2023): it asks how the same dynamical configuration translates into different outcomes in a different climate. In this framework, finding higher turbulence diagnostics under the same circulation pattern is itself the information sought, since it indicates that changes are not explained by a change in the frequency of the synoptic configuration. Moreover, the composites of the turbulence diagnostics over both analogue populations display enhanced VWS and TI1 in the same regions as during the observed event, indicating that the selected analogues are also turbulence-favourable days in a diagnostic sense. This is consistent with reanalysis-based studies of long-term changes in clear-air turbulence, which also rely on turbulence diagnostics rather than on direct observations (Prosser et al., 2023; Foudad et al., 2024). Additional atmospheric diagnostics, including upper-level wind speed at 250 hPa, TCWV, CAPE, CIN, t2m, and SST are also analysed independently of the analogue-selection procedure to support the physical interpretation. Statistical significance in the differences between the two periods is assessed at each grid point using bootstrap resampling (Faranda et al., 2024) from repeated resamples of the analogue pool by selecting 95 % as significance level.
-
Assessment. Results are expressed in terms of likelihoods, such as “a 30 % increase in TI1 values due to climate change”.
-
Visual summary. Results are summarized using the same graphical framework adopted by ClimaMeter through two gauge charts (Faranda et al., 2024): the attribution gauge (left-hand gauge) and the rarity gauge (right-hand gauge). These diagnostics are complemented by additional dynamical and thermodynamical analyses that provide an additional physical assessment of the selected analogues and support the interpretation of the attribution results.
The attribution gauge indicates the relative influence of natural climate variability vs. climate change on the event, providing information on whether the event was strengthened by climate change or influenced by natural variability. This attribution is based on the differences in the distribution of three major modes of climate variability between the past and present periods as in Faranda et al. (2024): El Niño–Southern Oscillation (ENSO), Atlantic Multidecadal Oscillation (AMO), and Pacific Decadal Oscillation (PDO). Firstly, the statistical significance of the difference in phase distributions between the two periods is assessed by using a two-tailed von Mises test as in Faranda et al. (2024). Then, by considering each mode as equally contributing, we assign a weight to each mode such that the possible gauge positions are (Faranda et al., 2024):
-
pointing to the right: no significant differences across ENSO, AMO, or PDO, i.e. there is no influence of natural variability;
-
pointing to the right: one mode shows a significant difference;
-
pointing to the left: two modes show significant differences;
-
pointing to the left: all three modes show significant differences.
The rarity gauge quantifies the rarity of the event's synoptic pattern. This is assessed using the analogue quality metric Q, as defined in Faranda et al. (2024), which measures the mean Euclidean distance between the event and its best analogues. To contextualize this value, Q is compared to a reference distribution Qa, representing the Euclidean distances between the best analogues of the analogues of the event. The gauge position is determined as follows:
-
pointing to the left: for both the past and present periods, Q<P75(Qa), that is similar events have occurred in the past.
-
pointing to the left: for both periods, , that is, a moderately rare event.
-
pointing to the right: Q exceeds P95(Qa) in one period and lies between P75(Qa) and P95(Qa) in the other, that is, an increasingly quite exceptional.
-
pointing to the right: Q>P95(Qa) in both periods, that is the event is very exceptional within the data record.
High percentiles are used to determine gauge thresholds since the analysis focuses on rare events, which are, by definition, rarely observed.
In both gauges, the needle can take four discrete positions serving as ordinal categories reflecting increasing confidence in the attribution or rarity assessment. These values, designed as visual indicators to convey complex diagnostic outcomes in an intuitive way, are also used to classify the event in the following categories as in Faranda et al. (2024):
-
strengthened by human-driven climate change: both gauge indicators are on red;
-
mostly strengthened by human-driven climate change: one of the gauge indicators is on red and the other is on gray/orange;
-
likely influenced by both human-driven climate change and natural variability: both gauge indicators are on gray/orange or one is on green/yellow and one on gray/orange;
-
mostly driven by natural variability: the left gauge indicator is on green and the right gauge is on yellow;
-
low confidence: if the attribution gauge indicator is on green and the rarity gauge indicator is on red.
This method, as its original source-based ClimaMeter (Faranda et al., 2024), offers a physically interpretable, observationally grounded alternative to model-only attribution studies. It allows us to evaluate whether the atmosphere, under similar synoptic configurations, is now more prone to producing turbulence than it was decades ago. To display the results we use the same format of ClimaMeter thus presenting in the first row the attribution gauges, in the second row the meteorological and turbulence conditions during the event of interest, in the third row the differences between the present and the past, while the bottom row reports the changes in the monthly occurrence in the two periods and the changes observed over airports. Since our events are all upper-level ones, we cannot detect changes at airports' level. However, we decided to maintain the structure to provide a more general format that can be used also to assess changes at low levels in future works.
We present detailed case studies over the four regions to provide a comprehensive overview of the methodology, focusing on representative days with a large number of reported events. The full set of events for each region is shown in the Supplement.
3.1 North Atlantic
The North Atlantic represents one of the busiest flight corridors worldwide and is characterized by strong baroclinicity and a persistent upper-level jet stream, making it particularly prone to clear-air turbulence. For the North Atlantic region, 643 MOG turbulence reports (EDR≥0.2 ) from the NOAA MADIS archive were recorded during 2024, with 25 February 2024 corresponding to the day with the highest number of reports (88). As shown in Fig. 1, 89 % () of the reports are concentrated over the western North Atlantic, primarily along the eastern coast of North America and extending northeastward towards Newfoundland and the Labrador Sea.
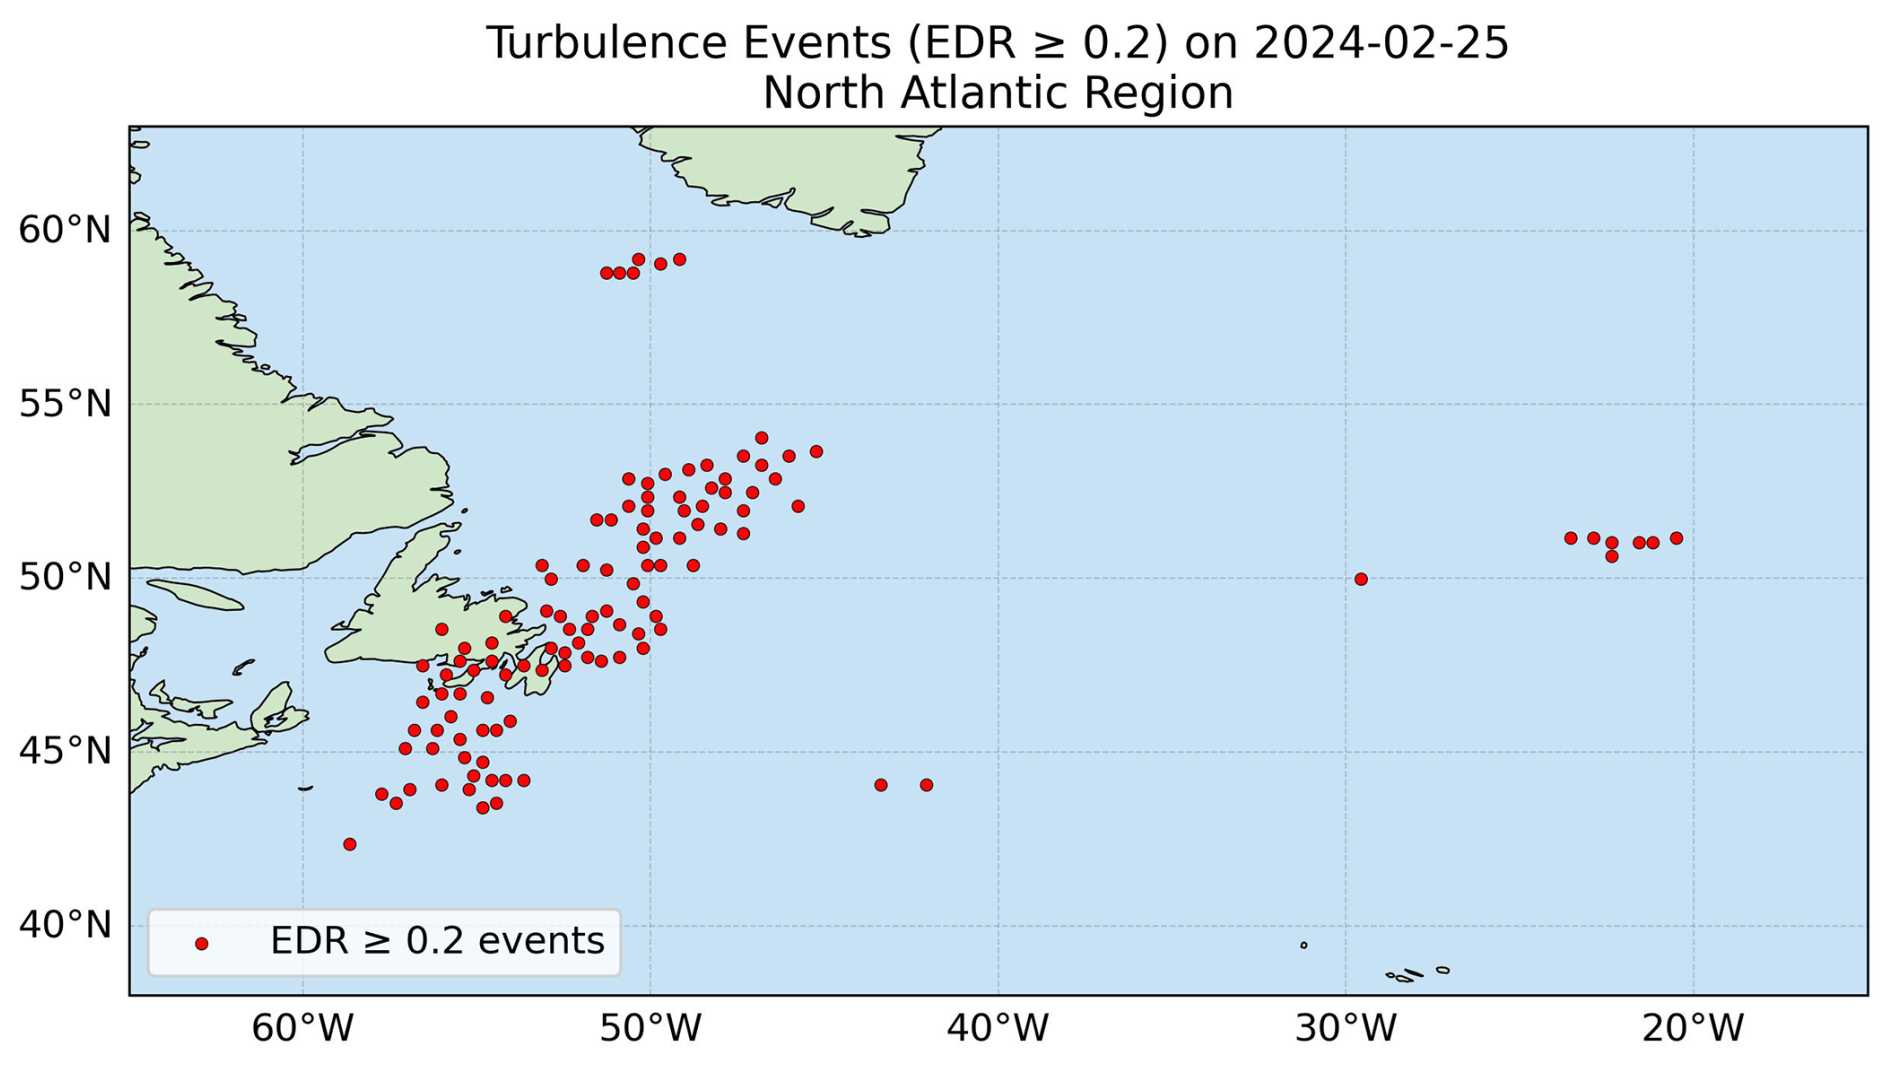
Figure 1Distribution of moderate-or-greater (MOG) turbulence reports (EDR≥0.2 ) from the NOAA MADIS archive on 25 February 2024 over the North Atlantic region.
The circulation-conditioned attribution analysis for this event is summarized in Fig. 2. The observed atmospheric configuration is characterized by a pronounced upper-level ridge extending across the central North Atlantic (Fig. 2a), associated with a broad jet stream exceeding 50 m s−1 (Fig. 2b). Enhanced vertical wind shear develops along the southern flank of the jet (Fig. 2c), producing elevated values of the Ellrod turbulence index (TI1; Fig. 2d) over the central and eastern portions of the basin, in good agreement with the spatial distribution of the observed turbulence reports (Fig. 1).

Figure 2TurboMeter analysis for the North Atlantic turbulence event on 25 February 2024. The top row shows the attribution gauge (left) and the rarity gauge (right), defined in Sect. 2.2. Panels (a)–(d) show the observed atmospheric conditions during the event: (a) Z500 anomaly (m) with respect to the 1950–2023 daily climatology, (b) 250 hPa wind speed (m s−1), (c) vertical wind shear VWS (s−1), and (d) Ellrod index TI1 (s−2), with VWS and TI1 computed around 250 hPa. Panels (e)–(h) present the circulation-conditioned present-day (1987–2023) minus historical (1950–1986) analogue differences of the same quantities, expressed in m for Z500 (e) and as relative differences (%) for panels (f)–(h). Panel (i) shows the monthly distribution of analogue occurrence for the two climate periods, while panel (j) summarizes the changes in near-surface atmospheric variables (temperature, precipitation and wind speed) over the available airports; it is retained for consistency with the standard ClimaMeter layout and is empty when no airport lies within the domain. Black stippling denotes regions where the differences are not statistically significant at the 95 % confidence level.
The historical and present-day analogues reproduce highly comparable synoptic-scale circulation patterns, as evidenced by the relatively small differences in the Z500 field (Fig. 2e), although not statistically significant over almost all the domain. This indicates that the analogue-selection procedure successfully constrains the large-scale circulation associated with the observed event and that changes in synoptic-scale patterns are not statistically different. In contrast, the upper-level jet exhibits a moderate strengthening over portions of the eastern North Atlantic and south of Iceland (Fig. 2f), accompanied by coherent increases in vertical wind shear (Fig. 2g). These dynamical changes translate into a pronounced enhancement of TI1 over the central North Atlantic (Fig. 2h), with the close spatial correspondence between VWS and TI1 indicating that the strengthened turbulence-favourable environment is primarily associated with enhanced upper-level shear rather than changes in horizontal deformation.
The attribution gauge indicates that the event was predominantly strengthened by climate change, whereas the rarity gauge suggests that similar synoptic configurations remain characteristic of the winter season in both climatological periods. This interpretation is further supported by the seasonal distribution of the analogues (Fig. 2i), which remains concentrated during December, January and February in both climate periods, indicating that the comparison is performed under similar seasonal circulation regimes. Although airport-scale diagnostics (Fig. 2j) are of limited relevance for this upper-level event, they are retained to preserve the standard TurboMeter visualization and facilitate future applications to lower-tropospheric hazards.
To further investigate the physical environment associated with the selected analogues, Figs. 3 and 4 present complementary diagnostics that are independent of the analogue-selection procedure.

Figure 3Additional atmospheric and surface diagnostics for the North Atlantic analogues. Panels (a)–(d) show the Z500 anomaly (m) with respect to the 1950–2023 daily climatology for the observed event, the historical analogue composite (1950–1986), the present-day analogue composite (1987–2023), and the corresponding present-minus-past differences. Panels (e)–(h) show the same for SST (°C), while panels (i)–(l) for 10 m wind speed (m s−1). Black stippling denotes regions where the differences are not statistically significant at the 95 % confidence level.
The additional surface diagnostics reveal that the historical and present-day analogues retain highly comparable synoptic-scale circulation patterns, as confirmed by the limited (and not significant) differences in Z500 (Fig. 3d). In contrast, sea surface temperatures exhibit widespread positive anomalies across much of the North Atlantic (Fig. 3h), particularly along the Gulf Stream extension and toward the Labrador Sea, where warming locally exceeds 1–2 °C. Surface wind speed also displays moderate positive anomalies over the central North Atlantic (Fig. 3l), suggesting a slightly more energetic lower-tropospheric environment under present-day climate conditions. Together, these changes indicate that the analogues evolve over a systematically warmer ocean while maintaining nearly identical large-scale circulation.
The surface warming is reflected in the thermodynamic environment (Fig. 4). CAPE remains generally low throughout the basin (Fig. 4a–d), while CIN exhibits only weak and spatially fragmented differences between the two analogues (Fig. 4e–h), indicating that large-scale convective instability plays only a secondary role for this event. In contrast, total column water vapour displays a coherent increase across the central and western North Atlantic (Fig. 4l), consistent with the warmer and moister atmospheric background expected under present-day climate conditions. These suggest that analogues develop within a systematically moister atmosphere that can favor convection and then upper-level turbulence. These thermodynamic changes are indeed accompanied by enhanced upper-level wind shear (Fig. 2g), ultimately producing larger TI1 values (Fig. 2h).

Figure 4Additional thermodynamical diagnostics for the North Atlantic analogues. Panels (a)–(d) show the Convective Available Potential Energy (CAPE) for the observed event, the historical analogue composite (1950–1986), the present-day analogue composite (1987–2023), and the corresponding present-minus-past differences. Panels (e)–(h) show the same for Convective Inhibition (CIN), while panels (i)–(l) for Total Column Water Vapour (TCWV). CAPE and CIN are in J kg−1, TCWV in kg m−2. Black stippling denotes regions where the differences are not statistically significant at the 95 % confidence level.
By considering all the 643 MOG turbulence reports (EDR≥0.2 ) in the North Atlantic region that occurred in 2024 (see the Supplement) we observe that the meteorological conditions in around 8 % (51 over 643) of events have been strengthened by human-driven climate change, 71 % (457 over 643) have been mostly strengthened by human-driven climate change, and the remaining 21 % (135 over 643) have been likely influenced by both human-driven climate change and natural variability. We do not detect any event only driven by natural variability and for all events we have medium-to-high confidence in our claims.
3.2 North Pacific
The North Pacific constitutes one of the most dynamically active aviation corridors, where intense upper-level jet streams, strong baroclinicity, and frequent cyclonic activity create favourable conditions for aviation turbulence throughout the cold season. For the North Pacific region, 425 MOG turbulence reports (EDR≥0.2 ) from the NOAA MADIS archive were recorded during 2024, with 20 December 2024 corresponding to the day with the highest number of reports (104). As shown in Fig. 5, the observed turbulence reports are organized into two distinct clusters: a northern cluster located close to the west coast of North America (27 %, ) and a larger subtropical cluster extending across the central North Pacific (73 %, ), reflecting the broad-scale structure of the upper-level jet.

Figure 5Distribution of moderate-or-greater (MOG) turbulence reports (EDR≥0.2 ) from the NOAA MADIS archive on 20 December 2024 over the North Pacific region.
The circulation-conditioned attribution analysis for this event is summarized in Fig. 6. The observed atmospheric configuration is characterized by a deep upper-level trough over the central North Pacific (Fig. 6a), associated with a broad jet stream exceeding 70 m s−1 (Fig. 6b). Enhanced vertical wind shear develops along the southern flank of the jet (Fig. 6c), producing a broad region of elevated TI1 values (Fig. 6d) matching the spatial distribution of the observed turbulence reports (Fig. 5).
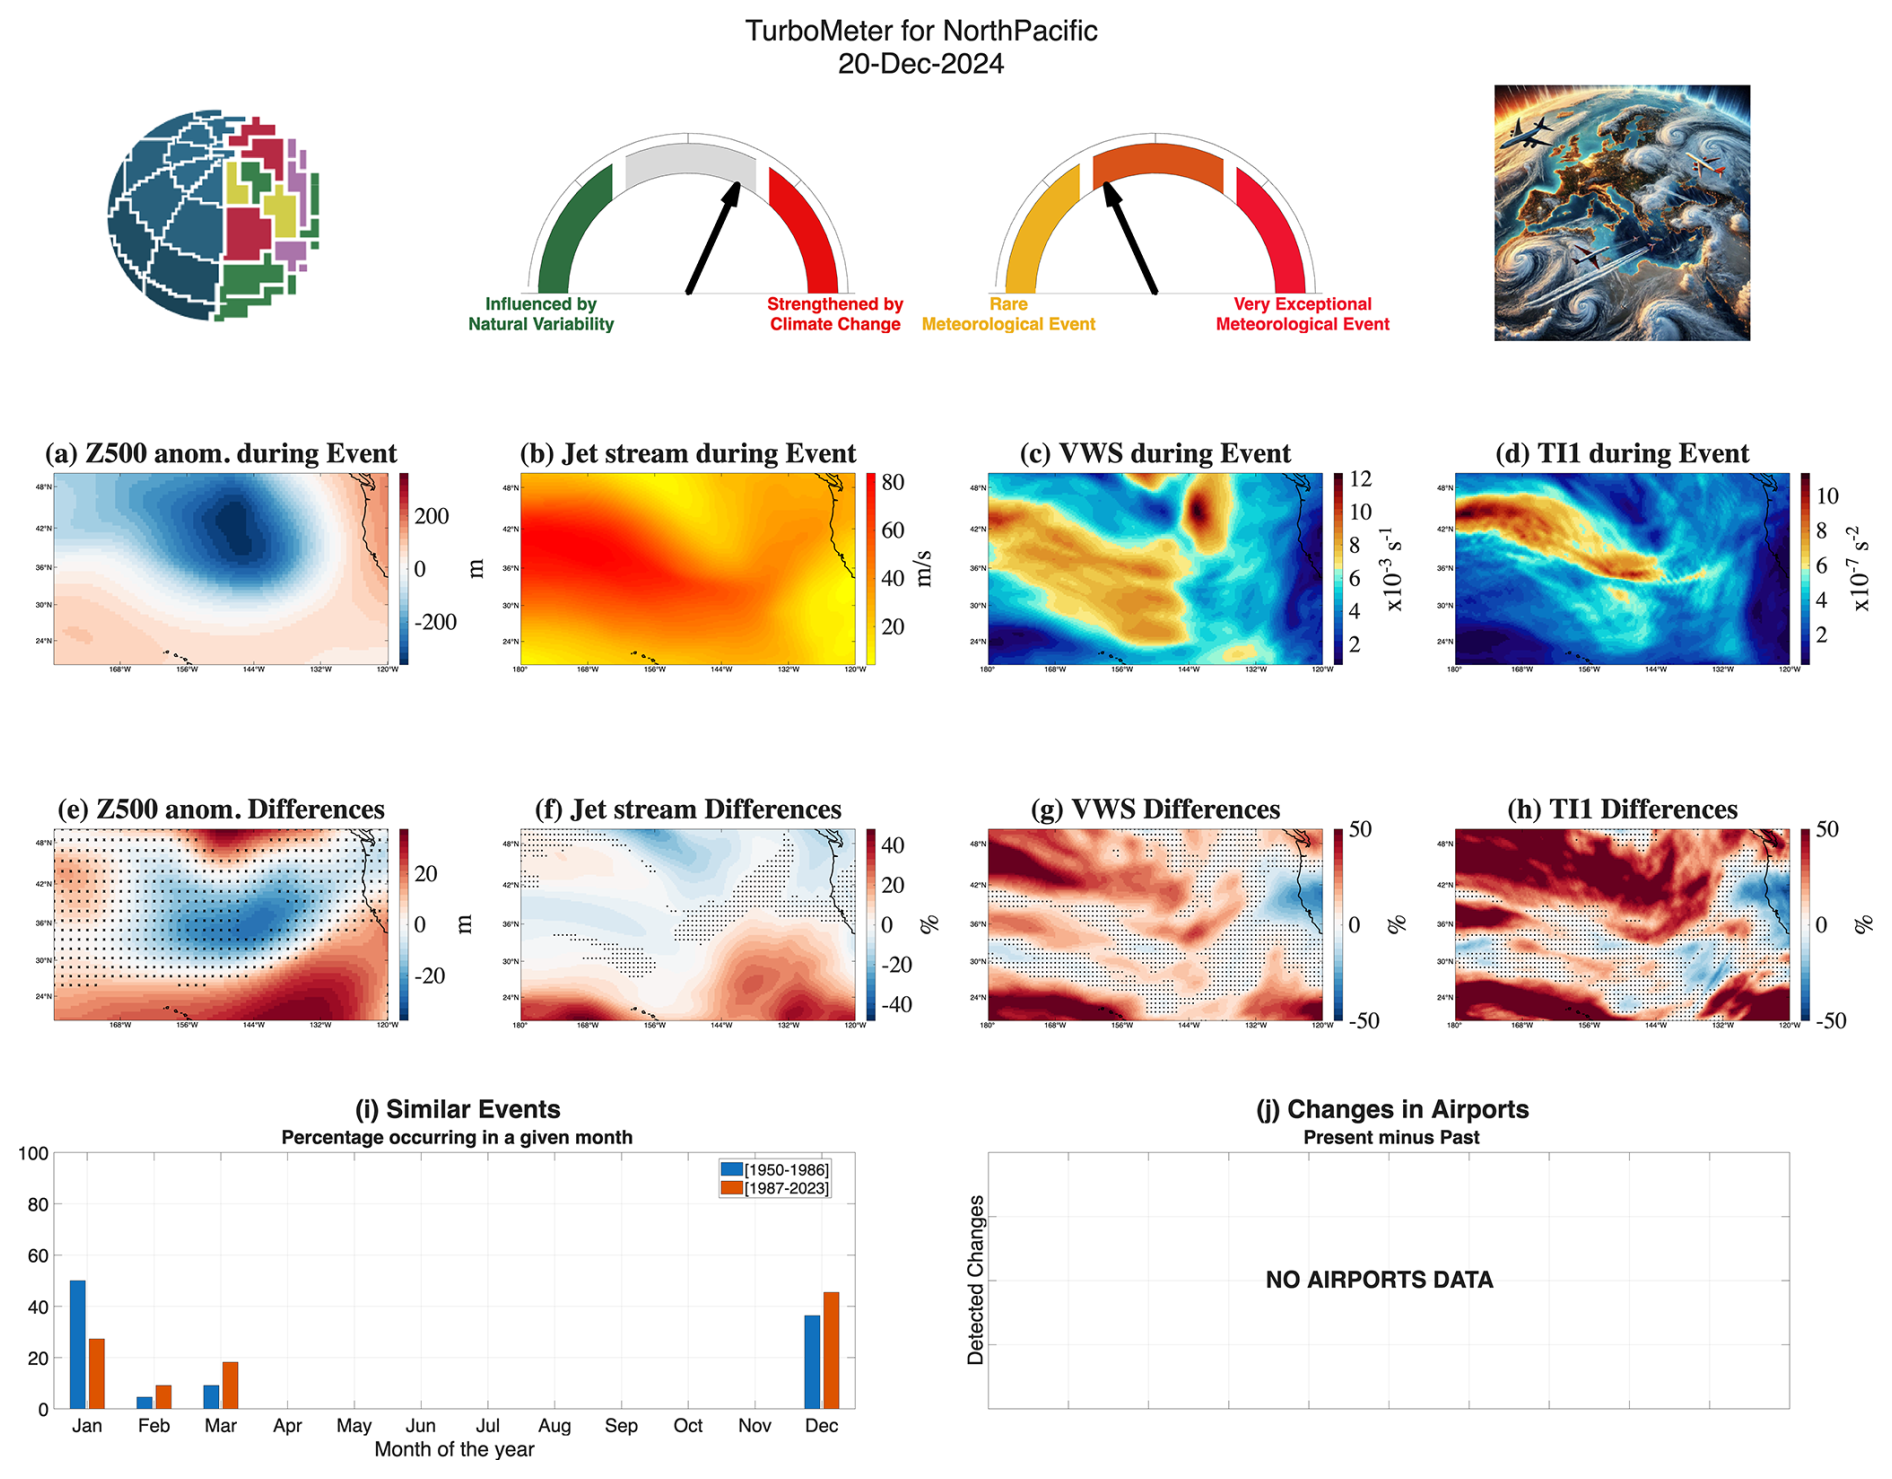
Figure 6TurboMeter analysis for the North Pacific turbulence event on 20 December 2024. The top row shows the attribution gauge (left) and the rarity gauge (right), defined in Sect. 2.2. Panels (a)–(d) show the observed atmospheric conditions during the event: (a) Z500 anomaly (m) with respect to the 1950–2023 daily climatology, (b) 250 hPa wind speed (m s−1), (c) vertical wind shear VWS (s−1), and (d) Ellrod index TI1 (s−2), with VWS and TI1 computed around 250 hPa. Panels (e)–(h) present the circulation-conditioned present-day (1987–2023) minus historical (1950–1986) analogue differences of the same quantities, expressed in m for Z500 (e) and as relative differences (%) for panels (f)–(h). Panel (i) reports the monthly distribution of analogue occurrence for the two climate periods, while panel (j) summarizes the changes in near-surface atmospheric variables (temperature, precipitation and wind speed) over the available airports; it is retained for consistency with the standard ClimaMeter layout and is empty when no airport lies within the domain. Black stippling denotes regions where the differences are not statistically significant at the 95 % confidence level.
The historical and present-day analogues reproduce remarkably similar synoptic-scale circulation patterns, with relatively weak differences in Z500 (Fig. 6e), again confirming that the analogue-selection procedure successfully constrains the large-scale atmospheric circulation. The largest changes appear in the upper-level dynamical diagnostics. Although the jet stream exhibits only moderate strengthening (Fig. 6f), widespread and statistically significant increases (>50 %) in vertical wind shear are observed over large portions of the basin (Fig. 6g). These changes translate into a pronounced enhancement of TI1 (Fig. 6h, >50 %), whose spatial pattern closely follows that of the vertical wind shear anomalies, indicating that the strengthened turbulence-favourable environment is primarily associated with modifications of the upper-level dynamical structure rather than substantial changes in the jet position itself.
The attribution gauge indicates that the events was influenced by both climate change and natural variability, whereas the rarity gauge classifies the synoptic configuration as rare. The seasonal distribution of the analogues (Fig. 6i) remains concentrated during the boreal cold season, with both historical and present-day analogues occurring predominantly during December and January. This consistency supports the circulation-conditioned nature of the attribution and indicates that the comparison is performed between analogues representative of the same seasonal circulation regime. Again, although airport-scale diagnostics (Fig. 6j) are not available for this upper-level event, the panel is retained to preserve the standard TurboMeter layout.
The additional surface diagnostics (Fig. 7) confirm that the analogues retain nearly identical large-scale circulation patterns, with only weak differences in the Z500 field (Fig. 7d). In contrast, sea surface temperatures exhibit widespread positive anomalies across most of the North Pacific basin (Fig. 7h), with statistically significant warming extending over much of the subtropical and mid-latitude Pacific. Surface wind speeds also display moderate positive anomalies over the central basin (Fig. 7l), indicating a slightly more energetic lower-tropospheric environment under present-day climate conditions. These results suggest that present-day analogues evolve over a systematically warmer ocean while preserving nearly identical synoptic circulation.

Figure 7Additional atmospheric and surface diagnostics for the North Pacific analogues. Panels (a)–(d) show the Z500 anomaly (m) with respect to the 1950–2023 daily climatology for the observed event, the historical analogue composite (1950–1986), the present-day analogue composite (1987–2023), and the corresponding present-minus-past differences. Panels (e)–(h) show the same for SST (°C), while panels (i)–(l) for 10 m wind speed (m s−1). Black stippling denotes regions where the differences are not statistically significant at the 95 % confidence level.
Furthermore, CAPE remains generally modest throughout the basin, with only localized statistically significant increases near the eastern boundary of the domain (Fig. 8d), in agreement with the spatial distribution of the observed turbulence reports (Fig. 5). CIN exhibits comparatively weak and spatially fragmented differences (Fig. 8h), indicating that large-scale convective instability undergoes only limited modifications between the historical and present-day analogues. By contrast, total column water vapour displays a coherent increase across much of the North Pacific (Fig. 8l), consistent with the enhanced atmospheric moisture expected under a warmer climate. These results indicate that the enhanced turbulence environment over the North Pacific is primarily associated with changes in the upper-level dynamical structure acting within a warmer and moister atmospheric background. Unlike the North Atlantic case, where the increase in atmospheric moisture is concentrated over specific sectors of the basin, the North Pacific exhibits a more spatially homogeneous thermodynamic response, whereas the dominant contribution to the enhanced turbulence signal remains the widespread increase in vertical wind shear.

Figure 8Additional thermodynamical diagnostics for the North Pacific analogues. Panels (a)–(d) show the Convective Available Potential Energy (CAPE) for the observed event, the historical analogue composite (1950–1986), the present-day analogue composite (1987–2023), and the corresponding present-minus-past differences. Panels (e)–(h) show the same for Convective Inhibition (CIN), while panels (i)–(l) for Total Column Water Vapour (TCWV). CAPE and CIN are in J kg−1, TCWV in kg m−2. Black stippling denotes regions where the differences are not statistically significant at the 95 % confidence level.
By considering all the 425 MOG turbulence reports (EDR≥0.2 ) in the North Pacific region occurred in 2024 (see the Supplement) we observe that there are no events for which the meteorological conditions strengthened uniquely by human-driven climate change, while 19 % (81 over 425) have been mostly strengthened by human-driven climate change, and the remaining 81 % (344 over 425) have been likely influenced by both human-driven climate change and natural variability. We do not detect any event only driven by natural variability and for all events we have medium-to-high confidence in our claims.
3.3 East Asia
East Asia represents one of the most dynamically complex aviation corridors, where strong upper-level jet streams interact with intense baroclinicity, subtropical moisture transport, and frequent convective activity. For the East Asia region, 150 MOG turbulence reports (EDR≥0.2 ) from the NOAA MADIS archive were recorded during 2024, with 12 April 2024 corresponding to the day with the highest number of reports (41). As shown in Fig. 9, most turbulence reports are concentrated along the Japanese archipelago and the adjacent western North Pacific, closely following the position of the upper-level jet.

Figure 9Distribution of moderate-or-greater (MOG) turbulence reports (EDR≥0.2 ) from the NOAA MADIS archive on 12 April 2024 over the East Asia region.
The circulation-conditioned attribution analysis for this event is summarized in Fig. 10. The observed atmospheric configuration is characterized by a broad upper-level ridge extending across East Asia (Fig. 10a) and a strong subtropical jet exceeding 60 m s−1 (Fig. 10b). Enhanced vertical wind shear develops along the equatorward flank of the jet (Fig. 10c), producing elevated TI1 values (Fig. 10d) over Japan and the adjacent western North Pacific.
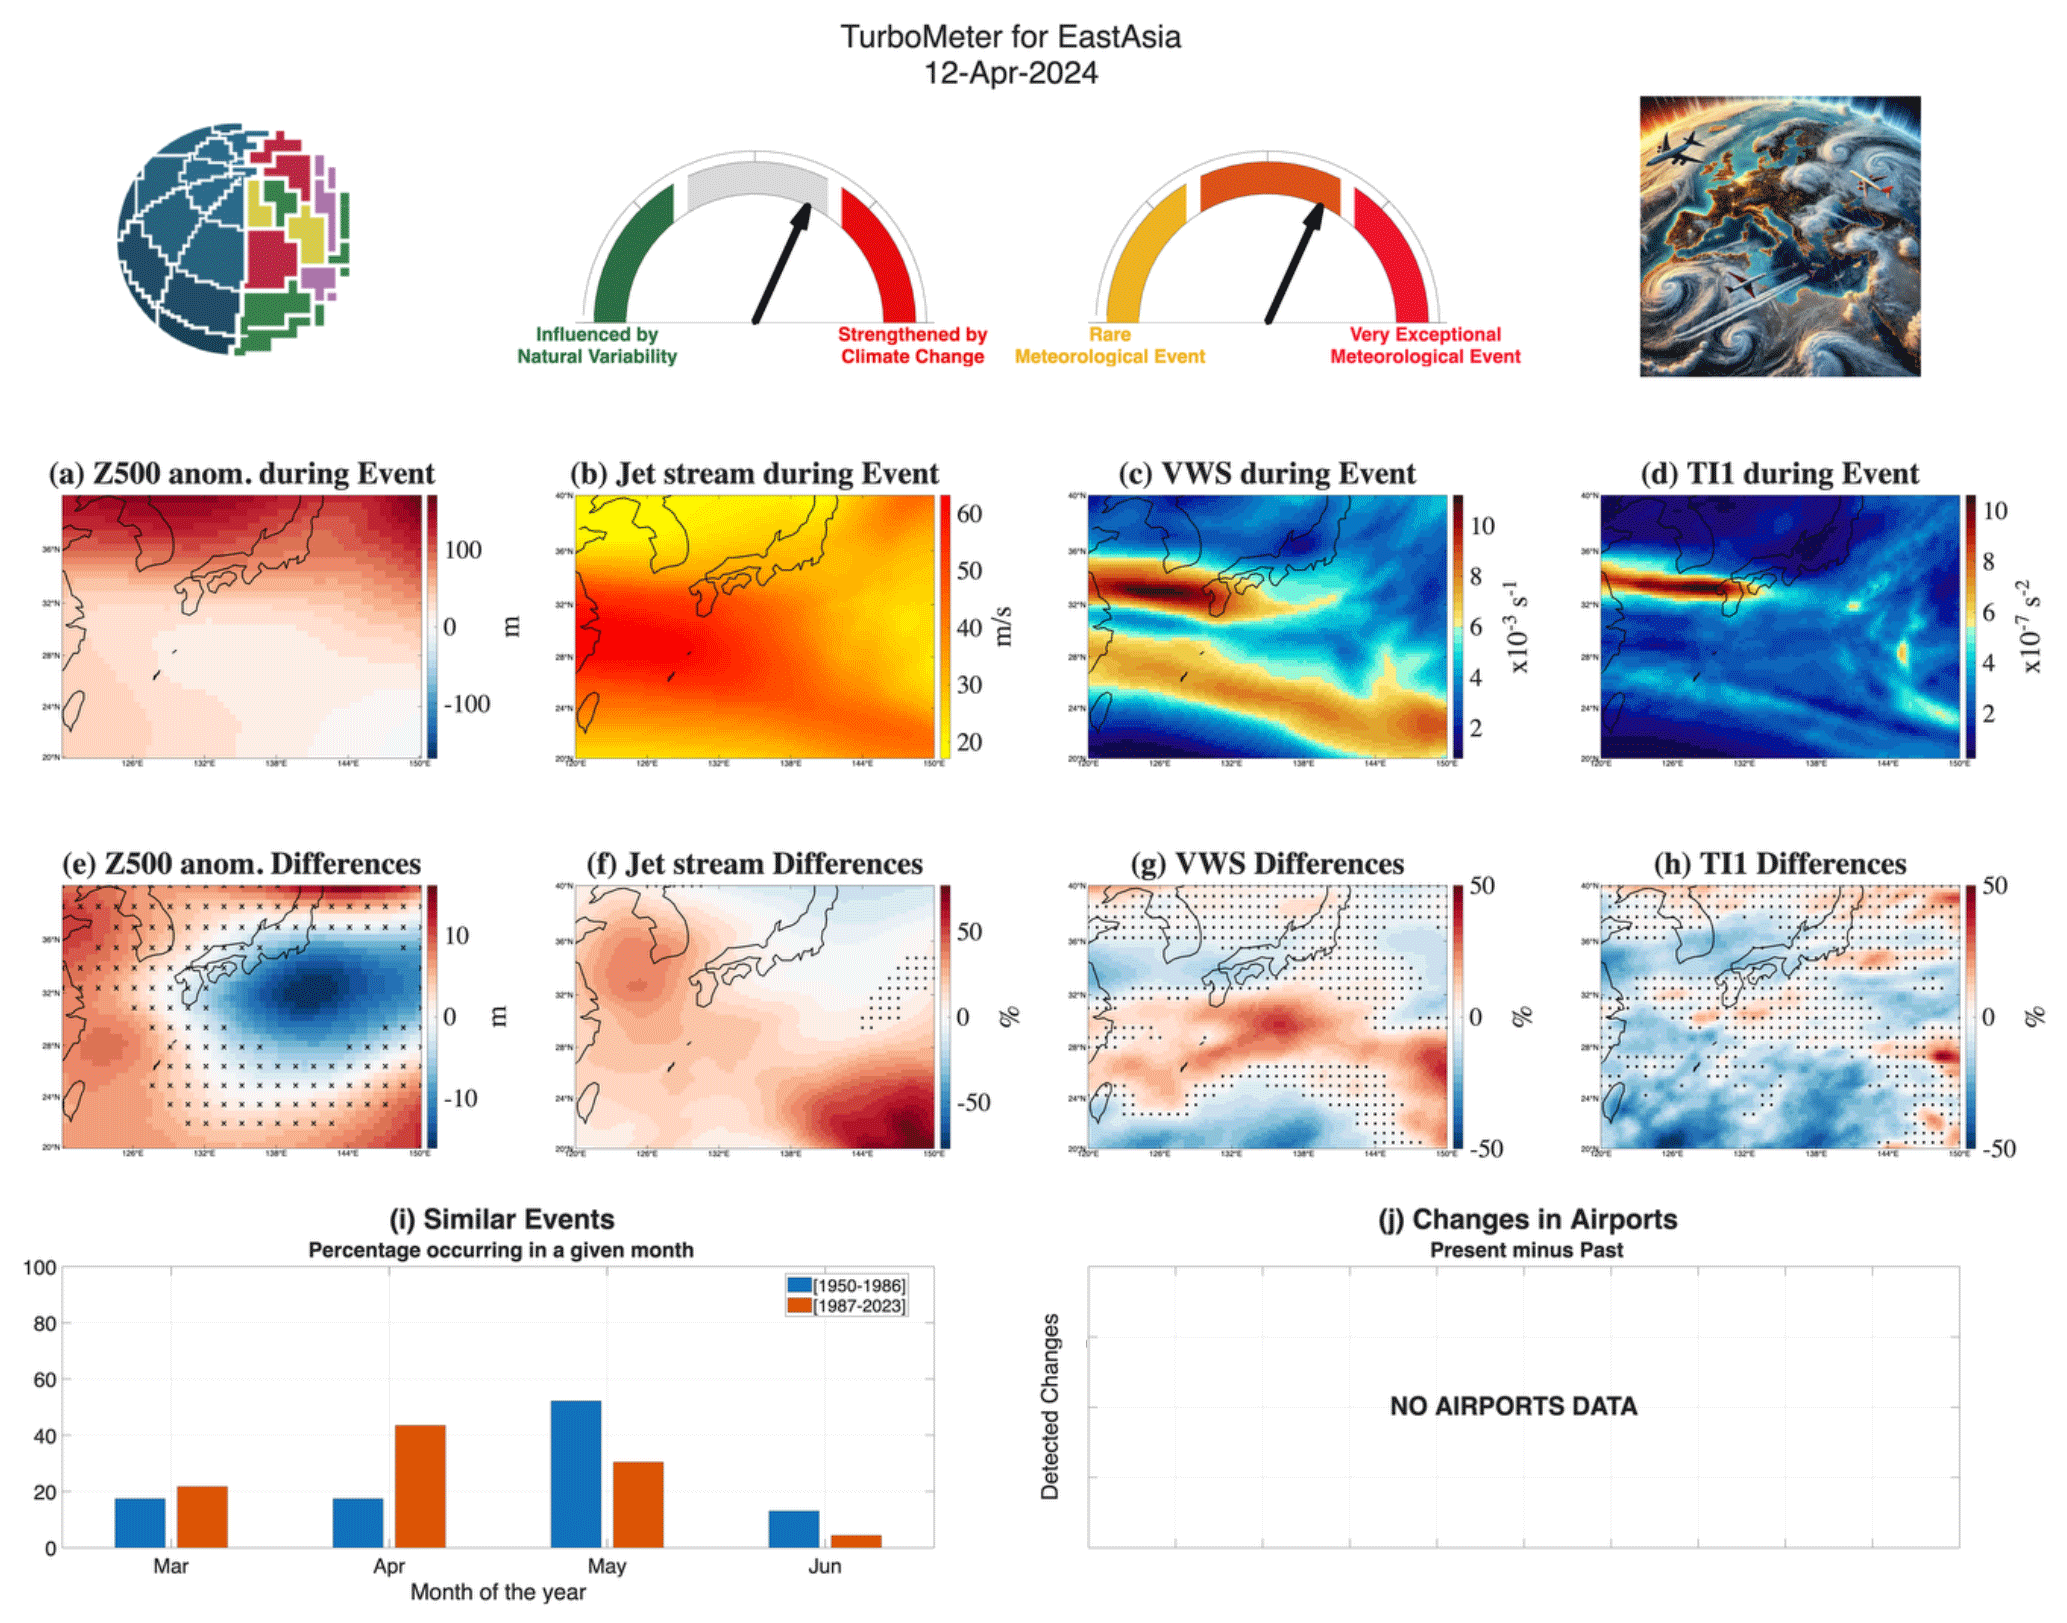
Figure 10TurboMeter analysis for the East Asia turbulence event on 12 April 2024. The top row shows the attribution gauge (left) and the rarity gauge (right), defined in Sect. 2.2. Panels (a)–(d) show the observed atmospheric conditions during the event: (a) Z500 anomaly (m) with respect to the 1950–2023 daily climatology, (b) 250 hPa wind speed (m s−1), (c) vertical wind shear VWS (s−1), and (d) Ellrod index TI1 (s−2), with VWS and TI1 computed around 250 hPa. Panels (e)–(h) present the circulation-conditioned present-day (1987–2023) minus historical (1950–1986) analogue differences of the same quantities, expressed in m for Z500 (e) and as relative differences (%) for panels (f)–(h). Panel (i) reports the monthly distribution of analogue occurrence for the two climate periods, while panel (j) summarizes the changes in near-surface atmospheric variables (temperature, precipitation and wind speed) over the available airports; it is retained for consistency with the standard ClimaMeter layout and is empty when no airport lies within the domain. Black stippling denotes regions where the differences are not statistically significant at the 95 % confidence level.
The analogues reproduce remarkably similar large-scale circulation patterns, as confirmed by the relatively weak Z500 differences (Fig. 10e). The upper-level jet also retains nearly the same spatial configuration (Fig. 10f), although modest strengthening is evident over portions of the western North Pacific. Despite these comparatively small circulation changes, the present-day analogue population exhibits coherent increases in vertical wind shear (Fig. 10g), while TI1 shows more fragmented changes (Fig. 10h). This suggests a primary role of enhanced upper-level shear, while the horizontal deformation seems to act in reducing changes in TI1.
The attribution indicates that the event was influenced by both climate change and natural variability, not red, while the rarity gauge classifies the circulation pattern as rare. The analogues remain confined to the spring season (Fig. 10i), although present-day analogues occur more frequently during April than during May compared with the historical climate, suggesting a modest seasonal redistribution of the circulation patterns associated with turbulence occurrence.
The surface diagnostics (Fig. 11) confirm that the analogues retain nearly identical large-scale circulation patterns, while weak changes emerge in sea surface temperature and near-surface winds (Fig. 11). Unlike the North Atlantic and North Pacific cases, East Asia does not exhibit a basin-wide warming signal. Instead, SST anomalies remain comparatively weak and spatially heterogeneous, whereas moderate increases in near-surface wind speed are observed over portions of the western North Pacific. These results suggest that surface forcing plays a less dominant role in this region than over the major oceanic flight corridors.

Figure 11Additional atmospheric and surface diagnostics for the East Asia analogues. Panels (a)–(d) show the Z500 anomaly (m) with respect to the 1950–2023 daily climatology for the observed event, the historical analogue composite (1950–1986), the present-day analogue composite (1987–2023), and the corresponding present-minus-past differences. Panels (e)–(h) show the same for SST (°C), while panels (i)–(l) for 10 m wind speed (m s−1). Black stippling denotes regions where the differences are not statistically significant at the 95 % confidence level.
The thermodynamic diagnostics reveal a more structured response than observed over the two oceanic flight corridors. CAPE exhibits localized negative changes (Fig. 12d), while CIN shows regional changes (Fig. 12h). Total column water vapour (Fig. 12l) also is characterized by slightly increased moisture over East Asia and reduced values farther offshore. Thus, these results indicate that the strengthened turbulence-favourable environment over East Asia is associated not only with enhanced upper-level shear but also with regional and localized changes in atmospheric moisture, suggesting a stronger coupling between upper-level dynamics and regional thermodynamic processes than observed over the North Atlantic and North Pacific.

Figure 12Additional thermodynamical diagnostics for the East Asia analogues. Panels (a)–(d) show the Convective Available Potential Energy (CAPE) for the observed event, the historical analogue composite (1950–1986), the present-day analogue composite (1987–2023), and the corresponding present-minus-past differences. Panels (e)–(h) show the same for Convective Inhibition (CIN), while panels (i)–(l) for Total Column Water Vapour (TCWV). CAPE and CIN are in J kg−1, TCWV in kg m−2. Black stippling denotes regions where the differences are not statistically significant at the 95 % confidence level.
By considering all the 150 MOG turbulence reports (EDR≥0.2 ) in the East Asia region (see the Supplement), we observe that there are no events for which the meteorological conditions have been strengthened uniquely by human-driven climate change, while the 73 % (109 over 150) have been mostly strengthened by human-driven climate change, and the remaining 27 % (41 over 150) have been likely influenced by both human-driven climate change and natural variability. We do not detect any event only driven by natural variability and for all events we have medium-to-high confidence in our claims.
3.4 Continental US (CONUS)
CONUS encompasses one of the most dynamically diverse aviation environments, where strong upper-level jets interact with complex orography, frontal systems, deep convection, and subtropical moisture transport. Consequently, turbulence observed over this corridor may arise from a broad spectrum of interacting dynamical processes, providing a particularly challenging test case for the circulation-conditioned attribution framework.
For the CONUS region, 1905 MOG turbulence reports (EDR≥0.2 ) from the NOAA MADIS archive were recorded during 2024, with 26 March 2024 corresponding to the day with the highest number of reports (332). As shown in Fig. 13, most turbulence reports are concentrated over the southeastern US, particularly over Georgia and Alabama, immediately north of the Gulf of Mexico, a region characterized by the interaction between subtropical moisture transport and strong upper-level dynamics.

Figure 13Distribution of moderate-or-greater (MOG) turbulence reports (EDR≥0.2 ) from the NOAA MADIS archive on 26 March 2024 over the CONUS region.
The observed atmospheric configuration is characterized by a deep upper-level trough extending across western North America (Fig. 14a), producing a strong southwesterly jet over northern Mexico and the central US (Fig. 14b). The resulting upper-level shear generates an elongated band of enhanced vertical wind shear (Fig. 14c), which closely coincides with elevated values of TI1 (Fig. 14d).

Figure 14TurboMeter analysis for the CONUS turbulence event on 26 March 2024. The top row shows the attribution gauge (left) and the rarity gauge (right), defined in Sect. 2.2. Panels (a)–(d) show the observed atmospheric conditions during the event: (a) Z500 anomaly (m) with respect to the 1950–2023 daily climatology, (b) 250 hPa wind speed (m s−1), (c) vertical wind shear VWS (s−1), and (d) Ellrod index TI1 (s−2), with VWS and TI1 computed around 250 hPa. Panels (e)–(h) present the circulation-conditioned present-day (1987–2023) minus historical (1950–1986) analogue differences of the same quantities, expressed in m for Z500 (e) and as relative differences (%) for panels (f)–(h). Panel (i) reports the monthly distribution of analogue occurrence for the two climate periods, while panel (j) summarizes the changes in near-surface atmospheric variables (temperature, precipitation and wind speed) over the available airports; it is retained for consistency with the standard ClimaMeter layout and is empty when no airport lies within the domain. Black stippling denotes regions where the differences are not statistically significant at the 95 % confidence level.
The analogues reproduce remarkably similar large-scale circulation patterns, as indicated by the relatively weak differences in Z500 (Fig. 14e). The upper-level jet also undergoes only moderate modifications (Fig. 14f), whereas considerably larger increases are observed in vertical wind shear (Fig. 14g). These dynamical changes translate into widespread positive TI1 anomalies (Fig. 14h), particularly over the southern US and the Gulf of Mexico, indicating that the strengthened turbulence-favourable environment is primarily associated with enhanced upper-level shear.
The attribution gauge indicates that the event was strongly strengthened by anthropogenic climate change while the rarity gauge classifies the associated circulation pattern as highly exceptional. The analogues remain concentrated during the boreal spring (Fig. 14i), with present-day analogues occurring slightly more frequently during April than in the historical period, suggesting a modest seasonal redistribution of favourable circulation patterns.
The surface diagnostics (Fig. 15) confirm that the analogues retain highly comparable synoptic-scale circulation patterns (Fig. 15d). In contrast to the predominantly oceanic flight corridors, the CONUS case exhibits coherent warming of the near-surface atmosphere over large portions of the southern US (Fig. 15h), accompanied by positive sea surface temperature anomalies over the Gulf of Mexico (Fig. 15l). Together, these changes indicate that the circulation analogues evolve within a warmer land–ocean environment under present-day climate conditions.

Figure 15Additional atmospheric and surface diagnostics for the CONUS analogues. Panels (a)–(d) show the Z500 anomaly (m) with respect to the 1950–2023 daily climatology for the observed event, the historical analogue composite (1950–1986), the present-day analogue composite (1987–2023), and the corresponding present-minus-past differences. Panels (e)–(h) show the same for 2 m temperature anomaly with respect to the 1950–2023 daily climatology (t2m, °C), while panels (i)–(l) for SST (°C). Black stippling denotes regions where the differences are not statistically significant at the 95 % confidence level.
The thermodynamical diagnostics reveal the strongest thermodynamic response among the four analysed flight corridors (Fig. 16). CAPE exhibits pronounced positive anomalies over the Gulf of Mexico and the southeastern US (Fig. 16d), indicating increasingly favourable conditions for convection. Consistently, CIN displays localized reductions over portions of the same region (Fig. 16h), suggesting a weaker inhibition of convective development. Total column water vapour also increases over much of the southern US and the Gulf of Mexico (Fig. 16l), indicating enhanced atmospheric moisture availability under present-day climate conditions. These indicate that the circulation-conditioned strengthening of the turbulence-favourable environment over CONUS results from the combined influence of enhanced upper-level dynamics and a warmer, moister, and locally more unstable lower atmosphere. Compared with the North Atlantic and North Pacific cases, where the dominant signal is primarily associated with upper-level dynamics, the CONUS event exhibits a substantially stronger coupling between atmospheric dynamics and regional thermodynamic conditions while the large-scale circulation remains remarkably consistent between the historical and present-day analogues.

Figure 16Additional thermodynamical diagnostics for the CONUS analogues. Panels (a)–(d) show the Convective Available Potential Energy (CAPE) for the observed event, the historical analogue composite (1950–1986), the present-day analogue composite (1987–2023), and the corresponding present-minus-past differences. Panels (e)–(h) show the same for Convective Inhibition (CIN), while panels (i)–(l) for Total Column Water Vapour (TCWV). CAPE and CIN are in J kg−1, TCWV in kg m−2. Black stippling denotes regions where the differences are not statistically significant at the 95 % confidence level.
By considering all the 1905 MOG turbulence reports (EDR≥0.2 ) in the CONUS region that occurred in 2024 (see the Supplement), we observe that more than 27 % (522 over 1905) of events have been strengthened by human-driven climate change, 48 % (922 over 1905) have been mostly strengthened by human-driven climate change, and the remaining 25 % (461 over 1905) have been likely influenced by both human-driven climate change and natural variability. We do not detect any event only driven by natural variability and for all events we have medium-to-high confidence in our claims.
An analogue-based attribution framework is presented to investigate the dynamical drivers, spatial characteristics, and climatic context of MOG turbulence events across four major aviation regions: the North Atlantic, North Pacific, East Asia, and CONUS.
Several physically coherent signals consistently emerge across all four flight corridors. Days with the largest number of MOG turbulence reports are associated with enhanced upper-tropospheric jet activity, vertical wind shear, and increased Ellrod index values. The close spatial correspondence between the observed EDR reports and the diagnosed turbulence fields provides further support for the physical relevance of the adopted diagnostics. The additional surface and thermodynamic analyses further indicate that these dynamical changes generally develop within warmer and moister atmospheric environments, although the associated thermodynamic response varies substantially among regions. Independent satellite brightness temperatures (not shown) further suggest that the dominant cloud environments differ among regions, with CONUS events more frequently associated with cold cloud tops, whereas North Atlantic and North Pacific events are more often associated with warm brightness temperatures, consistent with a larger proportion of clear-air events.
The two oceanic flight corridors, namely the North Atlantic and North Pacific, exhibit remarkably consistent behaviour. In both cases, the analogues preserve nearly identical synoptic-scale circulation patterns while developing over systematically warmer ocean surfaces, favoring moisture and vertical shears. The increased sea surface temperatures are accompanied by coherent increases in total column water vapour, whereas changes in CAPE and CIN remain comparatively weak and spatially fragmented. These results suggest that the primary climate signal over the oceanic corridors is not associated with substantial changes in large-scale convective instability, but rather with a warmer and moister atmospheric background that accompanies enhanced upper-level wind shear and increased turbulence diagnostics. Interestingly, the strengthening of TI1 is much more closely associated with enhanced vertical wind shear than with substantial modifications of the jet-stream position itself, indicating that climate change primarily alters the dynamical structure of the upper-tropospheric flow while preserving the overall synoptic organization.
East Asia exhibits a somewhat different behaviour. While the circulation-conditioned attribution still indicates that enhanced vertical wind shear remains the dominant dynamical driver of the strengthened turbulence environment, the thermodynamic response is different than over the oceanic basins. Localized increases in CAPE, regional changes in CIN, and a coherent redistribution of atmospheric moisture suggest that modifications of the thermodynamic environment accompany the strengthening of the upper-level dynamics. Although TurboMeter does not distinguish among individual turbulence-generation mechanisms, these results are broadly consistent with the complex multiscale interactions between jet dynamics, subtropical moisture transport, and convective activity that characterize the East Asian upper troposphere (Kim and Chun, 2012; Kim et al., 2014; Trier et al., 2020; Kim et al., 2021; Baek et al., 2024; Lee et al., 2025).
The CONUS case represents the strongest coupling between atmospheric dynamics and thermodynamics. Compared with the oceanic corridors, the analogues develop within a markedly warmer lower atmosphere, accompanied by increased atmospheric moisture, enhanced CAPE, and locally reduced CIN over the Gulf of Mexico and the southeastern US. These thermodynamic changes occur together with widespread increases in vertical wind shear and TI1 while the large-scale circulation remains highly comparable between the historical and present-day analogues. The results therefore suggest that, over continental regions where moisture availability and convection play a larger role, climate change modifies not only the upper-level dynamical environment but also the thermodynamic conditions within which turbulence develops.
Monthly analogues occurrences across the four regions further indicate that climate-related changes are not limited to turbulence intensity. Oceanic corridors maintain a pronounced winter maximum, whereas East Asia and CONUS exhibit peaks during the transition seasons. In several cases, the present-day analogues show a tendency toward earlier seasonal occurrence or more concentrated monthly analogues distributions compared with the historical period. Although this signal requires confirmation using larger datasets, it suggests that climate change may also influence the seasonal timing of atmospheric environments favourable to aviation turbulence. Such seasonal shifts could have practical implications for flight operations, including seasonal route planning, turbulence forecasting, and risk management.
Finally, the attribution gauges provide a concise synthesis of both the dynamical and statistical characteristics of each event. While not every analysed event is classified as meteorologically exceptional, most display a measurable contribution from climate change. This distinction is particularly important because it indicates that increased turbulence risk does not necessarily arise from the emergence of entirely new circulation patterns. Instead, the results consistently suggest that comparable synoptic configurations now evolve within atmospheric environments characterized by enhanced upper-level shear, increased atmospheric moisture, and, in some regions, more favourable conditions for convection.
This work demonstrates the value of an analogue-based and physically grounded framework for diagnosing MOG turbulence events and assessing their relationship to climate variability and anthropogenic climate change. By integrating turbulence diagnostics, large-scale circulation patterns, and historical atmospheric analogues, the TurboMeter framework provides a physically interpretable link between observed aviation turbulence and the atmospheric environments in which it develops.
Table 1Summary of attribution results across all analyzed regions. For each region, the table reports the number of days classified in each attribution category and the corresponding number of turbulence reports with EDR≥0.2. No events were classified as mostly driven by natural variability or as low confidence.
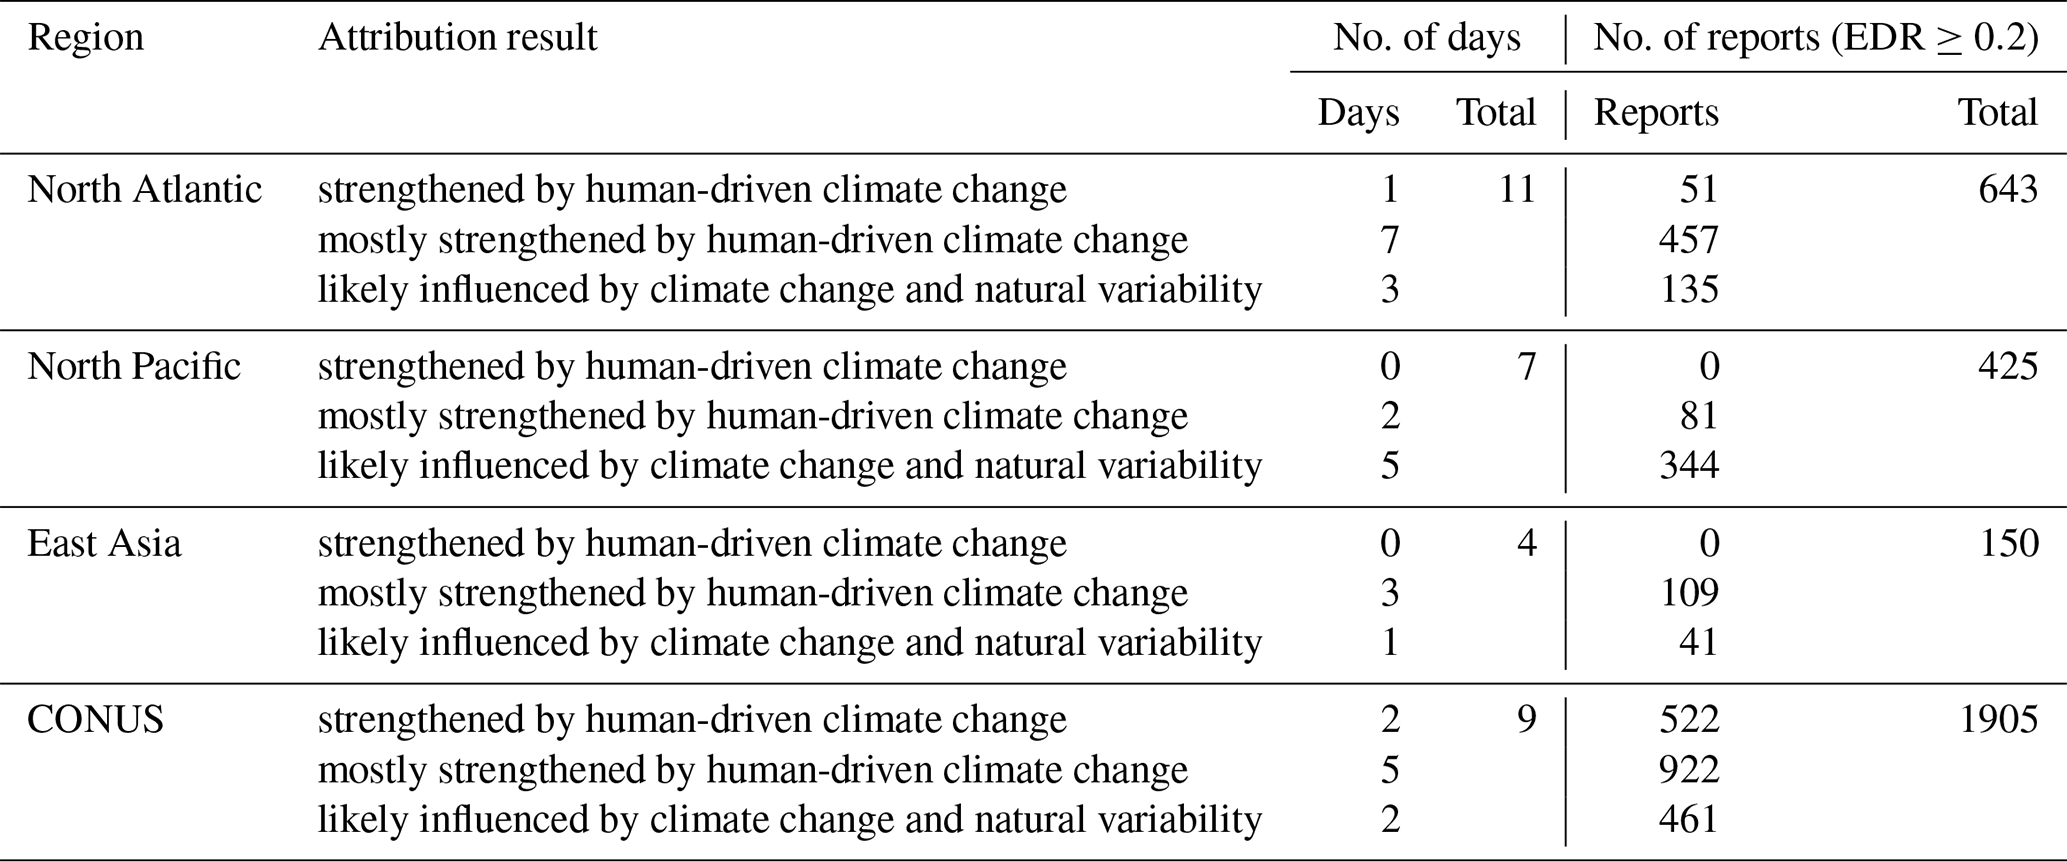

Figure 17Summary of turbulence events and their climate attribution. (a) Geographic distribution of the analysed turbulence events, with symbols indicating event locations and colours denoting attribution categories: strengthened by anthropogenic climate change (red), mostly strengthened by anthropogenic climate change (orange), and likely influenced by both climate change and natural variability (blue). (b) Number of analysed days associated with each attribution category across the four flight corridors. (c) Number of turbulence reports (EDR≥0.2) associated with each attribution category and region.
Our analysis reveals that turbulence events with a detectable contribution from climate change are present across several major aviation corridors, including CONUS, the North Atlantic, and East Asia (Table 1 and Fig. 17a). In contrast, the signal is comparatively weaker over the North Pacific, although regional comparisons should be interpreted with caution given the limited number of events available in some regions, particularly East Asia. Overall, approximately 68 % of the analysed events are classified as strengthened or mostly strengthened by anthropogenic climate change (Fig. 17b), whereas the remaining events are likely influenced by a combination of climate change and natural variability. These results indicate that, although natural variability continues to play an important role in shaping atmospheric circulation, anthropogenic forcing is increasingly modifying the atmospheric environments associated with aviation turbulence.
Our findings are broadly consistent with Foudad et al. (2024), who used large initial-condition ensembles to demonstrate that the observed increase in clear-air turbulence over recent decades can largely be attributed to climate change, while natural variability remains important in several regions. Although the methodologies differ, the convergence of the results supports a physically coherent interpretation of the climate signal affecting upper-tropospheric turbulence. The analogue-based framework adopted here provides an independent observational perspective that complements large-ensemble climate simulations by explicitly conditioning the attribution on comparable synoptic-scale circulation patterns.
A key aspect of the TurboMeter approach is that the analogue-selection procedure relies exclusively on the large-scale atmospheric circulation represented by the 500 hPa geopotential height field. This choice intentionally constrains the synoptic environment associated with each turbulence encounter. The additional diagnostics, including sea surface temperature, near-surface temperature, upper-level wind speed, total column water vapour, CAPE, and CIN, provide a physically consistent interpretation of the selected analogues. This separation between circulation conditioning and atmospheric interpretation represents one of the principal strengths of the TurboMeter framework and allows additional diagnostics to be incorporated without modifying the usual underlying attribution methodology based on circulation analogues (e.g. Faranda et al., 2024).
Across all analysed regions, the results consistently indicate that climate change primarily modifies the atmospheric environments in which aviation turbulence develops rather than the large-scale circulation patterns themselves. Oceanic flight corridors are characterized by coherent increases in sea surface temperature, atmospheric moisture, and upper-level wind shear, whereas continental regions additionally exhibit stronger thermodynamic responses, including enhanced CAPE and reduced CIN. Although the relative importance of these processes varies among regions, the strengthening of upper-level vertical wind shear emerges as the most robust dynamical signature associated with enhanced turbulence-favourable environments.
We need to underline some limitations of the present framework. Aviation turbulence encompasses multiple physical mechanisms, including clear-air turbulence, mountain-wave turbulence, convectively induced turbulence, near-cloud turbulence, and gravity-wave breaking, which frequently coexist and interact. While the analogue framework successfully constrains the large-scale atmospheric circulation associated with observed turbulence events, ERA5 cannot explicitly resolve many of the mesoscale and microscale processes responsible for individual aircraft-scale turbulence encounters. Consequently, TurboMeter should not be interpreted as attributing individual turbulence-generation mechanisms or to capture the turbulence generated by unresolved processes, such as mountain waves, partly convection, etc. Rather, it quantifies how the atmospheric environments favourable to aviation turbulence evolve under comparable synoptic circulation conditions. For the same reason, the framework does not assess whether turbulence was actually encountered on the individual analogue days, which cannot be verified over most of the ERA5 record. As the archive of automated EDR reports lengthens, a natural extension will be to verify whether present-day analogues are also associated with a higher frequency of observed MOG turbulence. Furthermore, here we focus on a single clear-air turbulence diagnostic (TI1), while future work could incorporate multiple turbulence indices to better capture the diversity of physical mechanisms associated with aviation turbulence. More broadly, the framework could be extended to other turbulence types, including convectively induced turbulence, mountain-wave turbulence, and mid- and lower-tropospheric turbulence, allowing a more comprehensive assessment of turbulence risk across different flight phases (including landing and take-off). We also need to acknowledge that the analysed turbulence reports are regionally unbalanced because the NOAA MADIS dataset is dominated by observations from U.S. airlines. Consequently, more than 50 % of the reported events occur over CONUS, whereas substantially fewer cases are available over the North Pacific and especially East Asia, which is represented by only about 150 reports. This imbalance inevitably affects the robustness of regional comparisons, making the CONUS statistics more representative than those obtained over East Asia. Furthermore, the East Asian analysis is based on only four representative days (occurring in February, April, May and July), with no wintertime cases despite the well-known winter maximum of upper-level turbulence in this region. These limitations primarily reflect the current observational availability and motivate future studies based on more spatially and seasonally homogeneous datasets.
Nevertheless, the results presented here support the growing evidence that anthropogenic climate change is already modifying the atmospheric environments associated with aviation turbulence. By combining circulation-conditioned attribution with additional physical diagnostics, TurboMeter provides a flexible attribution framework that complements process-based numerical studies and offers new opportunities for turbulence characterization, risk assessment, and long-term climate adaptation strategies for the aviation sector. Future developments may combine the circulation-conditioned approach of TurboMeter with objective turbulence classification algorithms, higher-resolution numerical simulations, satellite observations, airborne measurements, and machine-learning approaches. Such developments would allow the relative contribution of different turbulence-generation mechanisms to be investigated while preserving the physically interpretable analogue-based framework introduced here.
All codes used for the analysis and generating the figures can be obtained from the authors upon request.
The data that support the findings of this study are openly available. ERA5 is the latest climate reanalysis being produced by ECMWF as part of implementing the EU- funded Copernicus Climate Change Service (C3S), providing hourly data on atmospheric, land-surface and sea-state parameters together with estimates of uncertainty from 1950 to present day. ERA5 data are available on the C3S Climate Data Store on regular latitude-longitude grids at 0.25° × 0.25° resolution at https://cds.climate.copernicus.eu/#!/home (last access: 15 July 2026). The teleconnection indices (ENSO, AMO, PDO) are computed from the NOAA/ERSSTv5 data and retrieved from KNMI's climate explorer at https://climexp.knmi.nl/start.cgi (last access: 15 July 2026). ACARS EDR turbulence reports were obtained from the public NOAA MADIS archive and are available at https://madis.ncep.noaa.gov (last access: 15 July 2026). The turbulence event dataset analysed in this study was derived from these reports and is available from the authors upon reasonable request.
The supplement related to this article is available online at https://doi.org/10.5194/wcd-7-2229-2026-supplement.
TA conceived the study, performed the analyses, and wrote the draft of the manuscript. DF conceived the study and the methodology. MF provided the suitable list of turbulence events to be analyzed. All authors contributed to discuss the results and to write the paper.
The contact author has declared that none of the authors has any competing interests.
Publisher's note: Copernicus Publications remains neutral with regard to jurisdictional claims made in the text, published maps, institutional affiliations, or any other geographical representation in this paper. The authors bear the ultimate responsibility for providing appropriate place names. Views expressed in the text are those of the authors and do not necessarily reflect the views of the publisher.
Tommaso Alberti and Davide Faranda acknowledge useful discussions within the FutureMed COST Action (CA22162) community. Tommaso Alberti acknowledges the funding from Ministero dell'Università e della Ricerca. Davide Faranda acknowledges the European Union Horizon 2020 research and innovation programme for funding. The turbulence observations used in this study were made available to the National Oceanic and Atmospheric Administration (NOAA) through contributions from several commercial airlines, including American, Delta, Federal Express, Northwest, United, and United Parcel Service. Mohamed Foudad thanks Thorsten Kaluza for helpful discussions and his assistance with the ACARS turbulence reports. Mohamed Foudad and Paul Williams acknowledge the funding from the Leverhulme Trust. Miguel A. C. Teixeira acknowledges the Portuguese Fundacao para a Ciencia e Tecnologia (FCT) for funding.
Tommaso Alberti received funding from Ministero dell'Università e della Ricerca under the call Fondo Italiano per la Scienza 2022–2023 (FIS-2) for the project “Mediterranean Extreme Events and Tipping elements in a changing climate on multiple spatiotemporal scales”, grant no. FIS-2023-00159, CUP: D53C24005450001. Davide Faranda received funding from the European Union Horizon 2020 research and innovation programme under grant agreement no. 101003469 (XAIDA). Mohamed Foudad and Paul Williams received funding from the Leverhulme Trust, under grant no. RPG-2023-138. Miguel A. C. Teixeira received financial support from the Portuguese Fundacao para a Ciencia e Tecnologia (FCT) via the LAETA Associated Laboratory (project https://doi.org/10.54499/UID/50022/2025).
This paper was edited by Silvio Davolio and reviewed by Jung-Hoon Kim and one anonymous referee.
Alberti, T., Faranda, D., Rapella, L., Coppola, E., Lepreti, F., Dubrulle, B., and Carbone, V.: Impacts of changing atmospheric circulation patterns on aviation turbulence over Europe, Geophys. Res. Lett., 51, e2024GL111618, 2024. a, b, c
Baek, S.-H., Kim, J.-H., Kim, S.-H., Lee, Y., Noh, Y.-J., and Lee, S.-M.: Characteristics of convectively induced turbulence in East Asia using geostationary korea multi-purpose Satellite-2A (GK-2A) and in situ aircraft data, J. Geophys. Res.-Atmos., 129, e2024JD041671, https://doi.org/10.1029/2024JD041671, 2024. a, b
Burbidge, R., Paling, C., and Dunk, R. M.: A systematic review of adaption to climate change impacts in the aviation sector, Transport Rev., 44, 8–33, 2024. a
Dutton, J. A.: Clear-air turbulence, aviation, and atmospheric science, Rev. Geophys., 9, 613–657, 1971. a
Ellrod, G. P. and Knapp, D. I.: An objective clear-air turbulence forecasting technique: verification and operational use, Weather Forecast., 7, 150–165, https://doi.org/10.1175/1520-0434(1992)007<0150:AOCATF>2.0.CO;2, 1992. a, b
Ellrod, G. P. and Knox, J. A.: Improvements to an operational clear-air turbulence diagnostic index by addition of a divergence trend term, Weather Forecast., 25, 789–798, https://doi.org/10.1175/2009WAF2222290.1, 2010. a
Faranda, D., Messori, G., Jezequel, A., Vrac, M., and Yiou, P.: Atmospheric circulation compounds anthropogenic warming and impacts of climate extremes in Europe, P. Natl. Acad. Sci. USA, 120, e2214525120, https://doi.org/10.1073/pnas.2214525120, 2023. a, b, c
Faranda, D., Messori, G., Coppola, E., Alberti, T., Vrac, M., Pons, F., Yiou, P., Saint Lu, M., Hisi, A. N. S., Brockmann, P., Dafis, S., Mengaldo, G., and Vautard, R.: ClimaMeter: contextualizing extreme weather in a changing climate, Weather Clim. Dynam., 5, 959–983, https://doi.org/10.5194/wcd-5-959-2024, 2024. a, b, c, d, e, f, g, h, i, j, k, l, m
Foudad, M., Sanchez-Gomez, E., Jaravel, T., Rochoux, M. C., and Terray, L.: Past and future trends in clear-air turbulence over the northern hemisphere, J. Geophys. Res.-Atmos., 129, e2023JD040261, https://doi.org/10.1029/2023JD040261, 2024. a, b, c, d, e
Gratton, G. B., Williams, P. D., Padhra, A., and Rapsomanikis, S.: Reviewing the impacts of climate change on air transport operations, The Aeronautical Journal, 126, 209–221, 2022. a
Guarino, M.-V., Teixeira, M. A. C., Keller, T. L., and Sharman, R. D.: Mountain-wave turbulence in the presence of directional wind shear over the Rocky Mountains, J. Atmos. Sci., 75, 1285–1305, 2018. a
Hersbach, H., Bell, B., Berrisford, P., Hirahara, S., Horányi, A., Muñoz-Sabater, J., Nicolas, J., Peubey, C., Radu, R., Schepers, D., Simmons, A., Soci, C., Abdalla, S., Abellan, X., Balsamo, G., Bechtold, P., Biavati, G., Bidlot, J., Bonavita, M., De Chiara, G., Dahlgren, P., Dee, D., Diamantakis, M., Dragani, R., Flemming, J., Forbes, R., Fuentes, M., Geer, A., Haimberger, L., Healy, S., Hogan, R. J., Hólm, E., Janisková, M., Keeley, S., Laloyaux, P., Lopez, P., Lupu, C., Radnoti, G., de Rosnay, P., Rozum, I., Vamborg, F., Villaume, S., and Thépaut, J.-N.: The ERA5 global reanalysis, Q. J. Roy. Meteor. Soc., 146, 1999–2049, 2020. a
International Civil Aviation Organization (ICAO): Seventh Meeting of the MOG, https://www.icao.int/sites/de fault/files/METP/Documents/Nov-2020-New-WAFS-Hazard-da ta-training-material.pdf (last access: 27 October 2026), 2020. a, b
Jaeger, E. B. and Sprenger, M.: A Northern Hemispheric climatology of indices for clear air turbulence in the tropopause region derived from ERA40 reanalysis data, J. Geophys. Res.-Atmos., 112, https://doi.org/10.1029/2006JD008189, 2007. a, b
Jézéquel, A., Dépoues, V., Guillemot, H., Trolliet, M., Vanderlinden, J.-P., and Yiou, P.: Behind the veil of extreme event attribution, Climatic Change, 149, 367–383, https://doi.org/10.1007/s10584-018-2252-9, 2018. a, b
Kaluza, T., Williams, P. D., Schultz, D. M., and Banyard, T. P.: Climatology of upper-tropospheric turbulence: capabilities and limitations of aircraft reports and ERA5 reanalysis diagnostics, Q. J. Roy. Meteor. Soc., 152, e70073, 2026. a
Kim, J.-H. and Chun, H.-Y.: A numerical study of clear-air turbulence encounters over South Korea on 2 April 2007, J. Appl. Meteorol., 49, 2381–2403, 2010. a
Kim, J.-H. and Chun, H.-Y.: A numerical simulation of convectively induced turbulence above deep convection, J. Appl. Meteorol., 51, 1180–1200, 2012. a, b
Kim, J.-H., Chun, H.-Y., Sharman, R. D., and Trier, S. B.: The role of vertical shear on aviation turbulence within cirrus bands of a simulated Western Pacific Cyclone, Mon. Weather Rev., 142, 2794–2813, 2014. a, b
Kim, S.-H., Chun, H.-Y., Kim, J.-H., Sharman, R. D., and Strahan, M.: Retrieval of eddy dissipation rate from derived equivalent vertical gust included in Aircraft Meteorological Data Relay (AMDAR), Atmos. Meas. Tech., 13, 1373–1385, https://doi.org/10.5194/amt-13-1373-2020, 2020. a, b
Kim, S.-H., Chun, H.-Y., Lee, D.-B., Kim, J.-H., and Sharman, R. D.: Improving Numerical Weather Prediction-Based Near-Cloud Aviation Turbulence Forecasts by Diagnosing Convective Gravity Wave Breaking, Weather Forecast., 36, 1735–1757, 2021. a, b
Lane, T. P., Sharman, R. D., Trier, S. B., Fovell, R. G., and Williams, J. K.: Recent Advances in the Understanding of Near-Cloud Turbulence, B. Am. Meteorol. Soc., 93, 499–515, https://doi.org/10.1175/BAMS-D-11-00062.1, 2012. a
Lee, J. H., Kim, J.-H., Sharman, R. D., Kim, J., and Son, S.-W.: Climatology of clear-air turbulence in upper troposphere and lower stratosphere in the Northern Hemisphere using ERA5 reanalysis data, J. Geophys. Res.-Atmos., 128, e2022JD037679, https://doi.org/10.1029/2022JD037679, 2023. a, b
Lee, J. H., Kim, J.-H., Trier, S. B., Sharman, R. D., and Doyle, J. D.: Generation mechanisms of near-cloud turbulence events in the upper-level outflow of tropical cyclone Hagibis, Mon. Weather Rev., 153, 521–542, https://doi.org/10.1175/MWR-D-24-0116.1, 2025. a, b
Prosser, M. C., Williams, P. D., Marlton, G. J., and Harrison, R. G.: Evidence for large increases in clear-air turbulence over the past four decades, Geophys. Res. Lett., 50, e2023GL103814, https://doi.org/10.1029/2023GL103814, 2023. a, b, c
Rapella, L., Alberti, T., Faranda, D., and Drobinski, P.: Anthropogenic climate change has increased severity of mid-latitude storms and impacted airport operations, Weather Clim. Dynam., 6, 1339–1363, https://doi.org/10.5194/wcd-6-1339-2025, 2025. a
Sharman, R. and Lane, T.: Aviation Turbulence, Springer International Publishing, Switzerland, 10, https://doi.org/10.1007/978-3-319-23630-8, ISBN: 978-3-319-23630-8, 2016. a, b
Sharman, R., Cornman, L., Meymaris, G., Pearson, J., and Farrar, T.: Description and derived climatologies of automated in situ eddy-dissipation-rate reports of atmospheric turbulence, J. Appl. Meteorol., 53, 1416–1432, 2014. a, b
Shaw, T. A. and Miyawaki, O.: Fast upper-level jet stream winds get faster under climate change, Nat. Clim. Change, 14, 61–67, https://doi.org/10.1038/s41558-023-01884-1, 2023. a
Smith, I. H., Williams, P. D., and Schiemann, R.: Clear-air turbulence trends over the North Atlantic in high-resolution climate models, Clim. Dynam., 61, 1–17, 2023. a
Storer, L. N., Williams, P. D., and Joshi, M. M.: Global response of clear-air turbulence to climate change, Geophys. Res. Lett., 44, 9976–9984, 2017. a
Storer, L. N., Williams, P. D., and Gill, P. G.: Aviation turbulence: dynamics, forecasting, and response to climate change, Pure Appl. Geophys., 176, 2081–2095, 2019. a
Trier, S. B., Sharman, R. D., Muñoz-Esparza, D., and Lane, T. P.: Environment and mechanisms of severe turbulence in a midlatitude cyclone, J. Atmos. Sci., 77, 3869–3889, https://doi.org/10.1175/JAS-D-20-0095.1, 2020. a, b
Williams, P. D.: Increased light, moderate, and severe clear-air turbulence in response to climate change, Adv. Atmos. Sci., 34, 576–586, 2017. a, b
Williams, P. D. and Joshi, M. M.: Intensification of winter transatlantic aviation turbulence in response to climate change, Nat. Clim. Change, 3, 644–648, https://doi.org/10.1038/nclimate1866, 2013. a, b
Yiou, P., Jézéquel, A., Naveau, P., Otto, F. E. L., Vautard, R., and Vrac, M.: A statistical framework for conditional extreme event attribution, Adv. Stat. Clim. Meteorol. Oceanogr., 3, 17–31, https://doi.org/10.5194/ascmo-3-17-2017, 2017. a, b
The turbulence dataset from NOAA MADIS is dominated by U.S. airlines, with more than 50 % of reports occurring over CONUS, whereas East Asia is represented by only about 150 reports. Consequently, conclusions for East Asia should be regarded as preliminary and motivate future analyses based on more regionally balanced datasets.
Following the standard ClimaMeter methodology (Faranda et al., 2024), the ERA5 record is divided into two equal-length climatological periods.