the Creative Commons Attribution 4.0 License.
the Creative Commons Attribution 4.0 License.
 | 04 Feb 2026
QBOi El Niño Southern Oscillation experiments: assessing relationships between ENSO, MJO, and QBO
Dillon Elsbury
Federico Serva
Julie M. Caron
Seung-Yoon Back
Clara Orbe
Jadwiga H. Richter
James A. Anstey
Neal Butchart
Chih-Chieh Chen
Javier García-Serrano
Anne Glanville
Yoshio Kawatani
Tobias Kerzenmacher
Francois Lott
Hiroaki Naoe
Scott Osprey
Froila M. Palmeiro
Seok-Woo Son
Masakazu Taguchi
Stefan Versick
Shingo Watanabe
Kohei Yoshida
This study uses an ensemble of climate model experiments coordinated by the Quasi-Biennial Oscillation initiative (QBOi) to analyze the Madden-Julian Oscillation (MJO) in the presence of either perpetual El Niño or La Niña sea surface temperatures during boreal winter. In addition to the prescribed El Niño Southern Oscillation (ENSO) conditions, the nine models internally generate QBOs, meaning each may influence the MJO. Objectives of our analyses are to assess the response of the MJO to strong idealized ENSO forcing and look for evidence of a QBO influence on the MJO in a multi-model context. The diagnostics used include wavenumber-frequency spectra of tropical convective and dynamical fields, measures of MJO lifetime, an evaluation of MJO diversity and visualization of MJO vertical structure, as well as an assessment of QBO morphology and the QBO's impact on tropical convection. Kelvin wave spectral power increases in the El Niño simulations whereas equatorial Rossby waves power is stronger in the La Niña simulations. All models simulate faster MJO propagation under El Niño conditions. This change in speed is corroborated by the MJO diversity analysis, which reveals that models better reproduce the observed “fast propagating” and “standing” MJO archetypes given perpetual El Niño and La Niña, respectively. Regardless of ENSO, QBO descent into the lower stratosphere is underestimated and we detect little QBO influence on tropical tropopause stability and MJO activity. With little influence from the QBO on the MJO activity in these runs, we can be confident that the aforementioned changes in the MJO indeed arise from the different ENSO boundary conditions.
- Article
(8486 KB) - Full-text XML
- Companion paper
-
Supplement
(587 KB) - BibTeX
- EndNote


The tropical circulation is influenced by various forms of internal variability, each operating at different timescales, yet still influencing each other. The Madden-Julian Oscillation (MJO) is dominant at intraseasonal timescales (Madden and Julian, 1994; Lin, 2022). It consists of large-scale eastward propagating fluctuations in tropical precipitation and circulation that traverse the Indian Ocean and Maritime Continent through to the Pacific over roughly 30 to 60 d (Hendon and Salby, 1994). MJO variability fluctuates a lot year to year as does other variability in the climate system.
At interannual timescales, the El Niño Southern Oscillation (ENSO; Philander, 1990) is one of the most consequential sources of tropical tropospheric variability. It is characterized by shifting patterns of sea surface temperatures (SSTs) and associated changes in ocean and atmospheric circulations in the tropical Pacific. ENSO varies on timescales between 2 and 7 years, and consists of three phases, the warm El Niño, the cold La Niña and a “neutral” phase where neither polarity dominates. Also operating at interannual timescales is the Quasi Biennial Oscillation (QBO), which is the dominant mode of variability in the lower tropical stratosphere, defined by alternating easterly and westerly zonal wind shear zones descending from 5 to 100 hPa with an average periodicity of 28 months (Baldwin et al., 2001).
The MJO, ENSO, and QBO are known to influence each other in various ways. ENSO's La Niña and El Niño phases are associated with shifts of intraseasonal tropical atmospheric variability like the MJO towards the Indo-Pacific Warm Pool and Date Line, respectively (Kessler, 2001; Tam and Lau, 2005). In addition, ENSO can influence the amount of time the MJO spends in particular Wheeler and Hendon (2004) MJO phases and the duration of MJO events overall, which are shorter during El Niño and longer during La Niña (Pohl and Matthews, 2007; Pang et al., 2016; Wei and Ren, 2019; Wang et al., 2019; Dasgupta et al., 2021; Fernandes and Grimm, 2023).
Nonetheless, not all research finds strong links between ENSO and seasonal-mean MJO activity. Slingo et al. (1999) found that the observed intraseasonally filtered zonal mean 200 hPa zonal wind (their metric of “MJO activity”) is weakly dependent on ENSO phase. They affirmed this further by using an ensemble of AMIP simulations. Hendon et al. (1999) validated and refined their definition of MJO activity, finding it to capture the salient features of the MJO and again that its variability is mostly independent of ENSO. With these results in mind, it is less clear how the MJO should respond to the ENSO conditions prescribed in our simulations. In fact, a common idea amongst the studies just mentioned is that the MJO's interannual variability originates predominantly from internal atmospheric processes other than those associated with ENSO.
It is increasingly recognized that the easterly and westerly phases of the QBO exert an influence on the MJO (Yoo and Son, 2016; Son et al., 2017; Sakaeda et al., 2020; Martin et al., 2021; Jin et al., 2023; Huang et al., 2023). The MJO's amplitude is stronger during easterly QBO boreal winters compared to westerly QBO winters over the observed record since 1979 (Yoo and Son, 2016; Densmore et al., 2019). However, despite improvement in the representation of simulated QBOs (Richter et al., 2020) and MJOs (Ahn et al., 2020) across model generations, current free-running Earth system models generally do not simulate the QBO-MJO relationship (Kim et al., 2020; Lim and Son, 2020; Martin et al., 2023), nor do they simulate a sufficiently strong tropical tropopause response to the QBO (Serva et al., 2022). Further complicating interpretation is a tendency for easterly QBO boreal winters to co-occur with La Niña events, introducing ambiguity about the source of MJO modulation (Randall et al., 2023).
In this study, we document the influence of ENSO on the MJO using a multi-model ensemble of idealized experiments with perpetual El Niño and La Niña forcings. These simulations were coordinated by the Atmospheric Processes And their Role in Climate (APARC, previously “SPARC”) Quasi-Biennial Oscillation initiative (QBOi, Butchart et al., 2018). In addition to prescribing ENSO, the models internally generate QBOs, meaning both types of interannual internal variability may modulate the MJO in these experiments. Our aim is to assess the extent to which model behavior is consistent with previously reported ENSO-MJO relationships, recognizing that past studies have found different ENSO-MJO links and that the simulated QBOs may also project onto the MJOs. The coordinated QBOi protocol allows us to revisit these relationships in a controlled framework that isolates atmospheric responses to fixed, high-amplitude ENSO SSTs across many models. These perpetual ENSO conditions represent the strongest observed El Niños and La Niñas and offer an upper bound on ENSO's effect on MJO characteristics, providing a high signal-to-noise database for studying this connection. We also selectively incorporate Phase 1 QBOi experiments, performed as 1979–2009 Atmospheric Model Intercomparison Project experiments, and hence, more representative of typical ENSO amplitudes (Butchart et al., 2018, Experiment 1). Unlike Coupled or Atmospheric Model Intercomparison Project experiments, or historical reanalysis datasets, these simulations avoid complications associated with time-evolving forcings, event-to-event ENSO variability, and background SST biases. On the other hand, while perpetual ENSO conditions help isolate atmospheric responses, they also preclude direct comparison with observation-based datasets, which include event-to-event variability, for example. The perpetual-ENSO experiments used here are a continuation of the QBOi Phase 1 experiments and have companion studies that examine ENSO's effect on the QBO (Kawatani et al., 2025) and the combined influence of ENSO and the QBO on global teleconnections (Naoe et al., 2025).
2.1 Experimental setup
Butchart et al. (2018) established a set of simplified modeling experiments for Phase 1 of the QBOi. Their Experiment 2, the “present-day time slice” simulation, forms the basis for these perpetual ENSO simulations. It was designed to allow for an evaluation of the accuracy of modeled QBOs under present-day conditions, that is, how the model QBOs operate in a climate forced with fixed repeating annual cycles of global sea surface temperature (SSTs), sea ice concentration (SIC), and external forcings representative of the time averaged 1988–2007 state.
The perpetual ENSO runs analyzed here are equivalent to Experiment 2, but with global El Niño or La Niña SST anomalies superimposed on top of the climatological SST forcing. An assessment of the MJO is not conducted for Experiment 2 because essential variables such as daily horizontal winds, outgoing longwave radiation (OLR), and precipitation, were not archived. In creating the composite El Niño or La Niña forcings, the characterization of ENSO follows the Japan Meteorological Agency (JMA) convention, where ENSO is defined by the spatially averaged NINO.3 (5° S–5° N, 150° W–90° W) monthly SST anomalies from 1950–2016. Anomalies are defined as deviations from the climatological seasonal cycle and computed relative to the most recent sliding 30-year period of JMA COBE-SST version 1 data (JMA, 2006). The anomalies are smoothed using a 5-month running mean and the periods during which the anomalies exceed 0.5 °C (−0.5 °C) for at least 6 consecutive months are labeled as El Niño (La Niña) periods. However, after averaging the SST anomalies for all El Niño Januarys, Februarys, etc., and doing the same for La Niña, the composite average annual cycles of El Niño and La Niña SSTs show only modest amplitudes (e.g., 1.92 °C for El Niño Januarys). To amplify the atmospheric response to ENSO in the simulations and increase the signal-to-noise ratio, the annual cycles are multiplied by 1.8 and 1.4, respectively, making their amplitudes comparable to the strongest observed ENSO events. A similar scaling is applied to the corresponding global signatures in NINO.3 SST anomalies (Fig. 1), which are superimposed on 1988–2007 climatological SSTs and prescribed in the models. Note that this procedure does not completely capture the development, mature phase, and decay of all observed El Niño events, due to diversity in the evolutions of events. We refer the reader to Kawatani et al. (2025) for more details on the experimental design and sensitivity of the model QBOs.
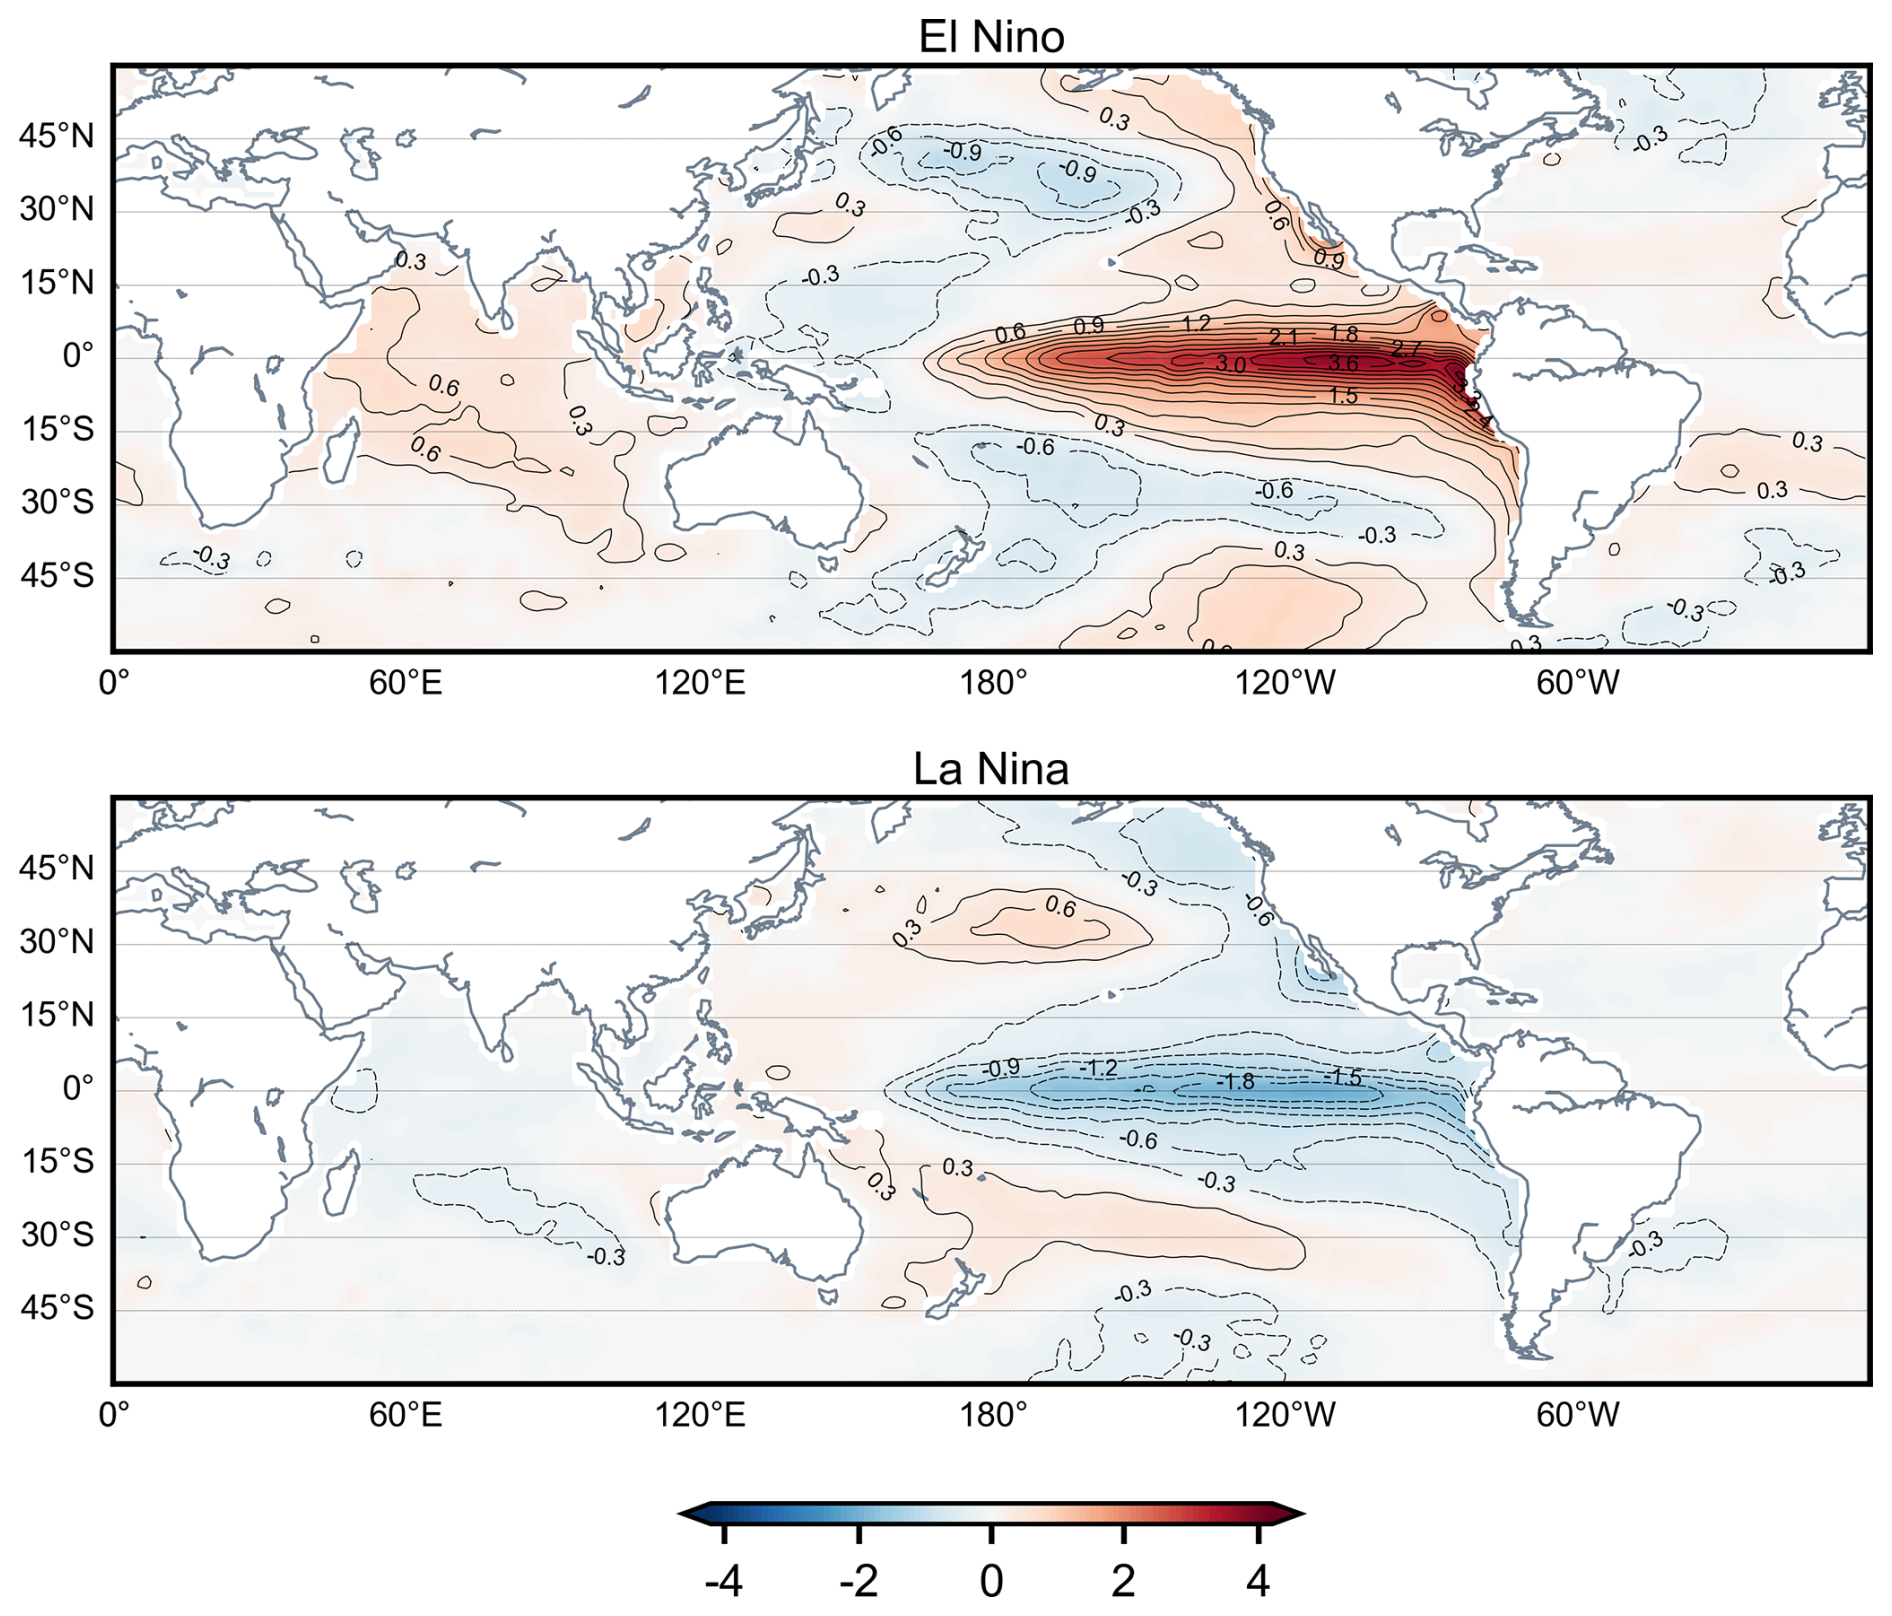
Figure 1November–April composites of the El Niño (top) and La Niña (bottom) JMA COBE SST anomalies (units K) that are prescribed in the perpetual ENSO simulations.
In addition to the prominent El Niño and La Niña signals, the November-April (NDJFMA) SSTs shown in Fig. 1 include the signatures of the basin-scale Interdecadal Pacific Oscillation (IPO) (Henley et al., 2015) and Indian Ocean SSTs that are in phase with ENSO. In some regions like the tropical Pacific and Indian Oceans, the amplitude of the global SSTs associated with the El Niño are roughly double that of La Niña (Fig. 1).
2.2 Models
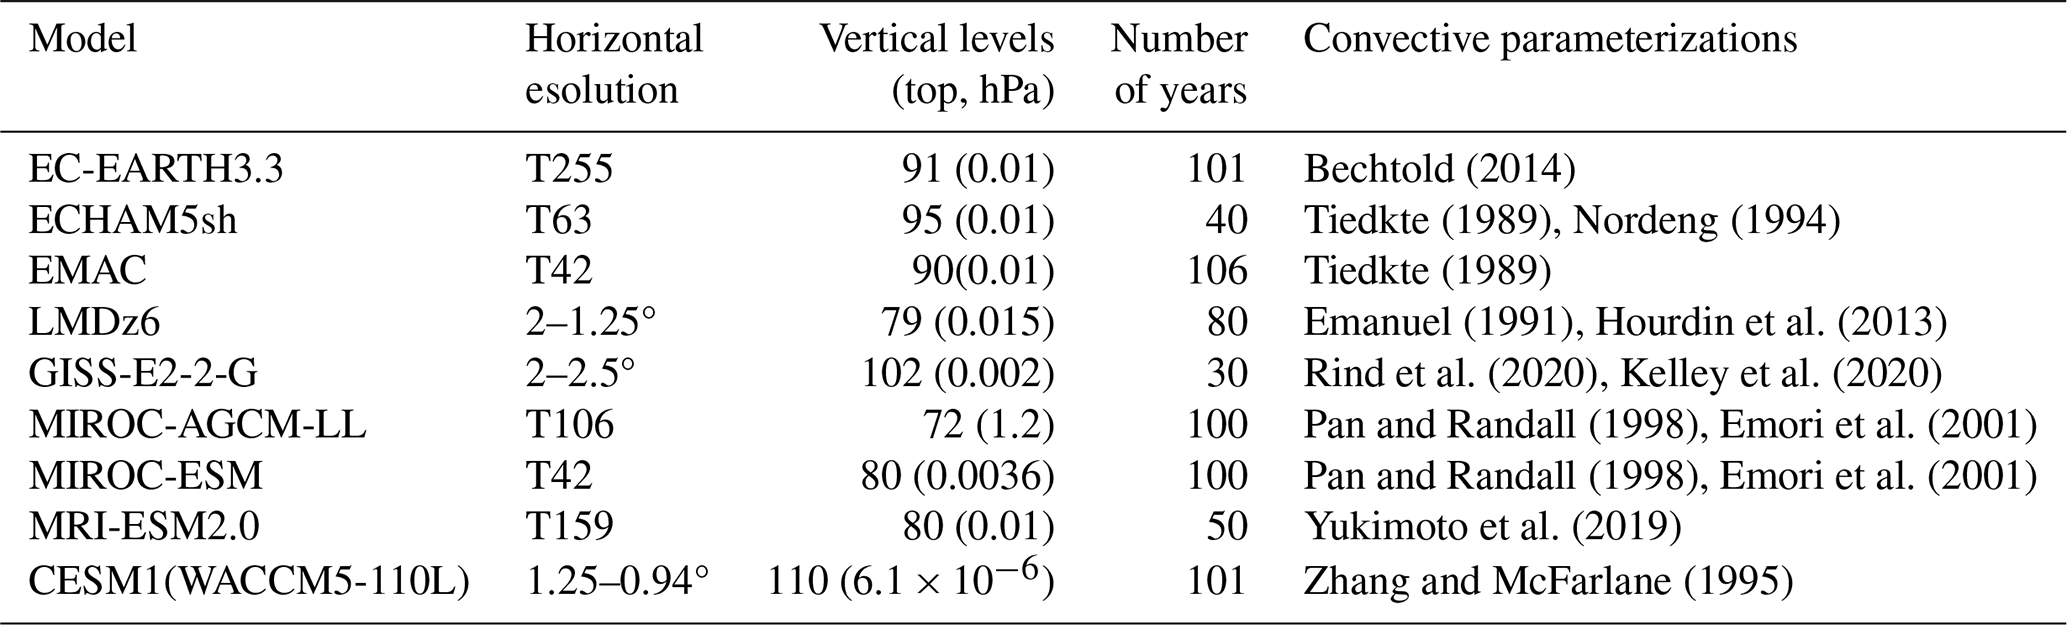
The models considered are listed in Table 1 along with the number of years analyzed for each model and references on each model's convective parameterization. These parameterizations impact the representation of tropical phenomena (Holt et al., 2020; Kawatani et al., 2025), including the simulation of intraseasonal oscillations (Ham and Hong, 2013). For example, past sensitivity tests with the version of MIROC-ESM that we use here have shown that its cumulus parameterization struggles to simulate an MJO of realistic amplitude with capability to propagate over the Maritime Continent (Miura et al., 2012). The updated scheme (Chikira and Sugiyama 2010) in use in newer versions of the model, MIROC6, has helped ameliorate these issues (Ahn et al., 2017; 2020). The importance of simulated convection-circulation coupling has been identified for other models (Kim et al., 2014; Zhu et al., 2020; Wang et al., 2022).
Table 1The models used in this study, the horizontal (given as spectral triangular truncation, T, or longitude-latitude increments) and vertical configuration (number of levels and model top, in hPa), the number of years per simulation, and relevant literature for the convective schemes. Only one realization is used from each model.
2.3 Observation-based reference data
To be consistent with previous studies (e.g., Wei and Ren, 2019), the ENSO-MJO relationship is considered during November–April. The 6 historical La Niña years, where the year is associated with November, are 1970, 1984, 1988, 2017, 2020, and 2021 and the 8 El Niño years are 1968, 1982, 1986, 1991, 1997, 2009, 2015, 2018. Each corresponds to an instance when the smoothed Niño3 anomalies exceed ±0.5° for at least 6 consecutive months. For comparison with the models, the subsequent analyses include “observed” El Niño and La Niña composites, formed by averaged deseasonalized 1959–2022 ERA5 reanalysis (Hersbach et al., 2020) over the years. Unlike the model simulations, which prescribe ENSO SST anomalies scaled by factors of 1.8 (El Niño) and 1.4 (La Niña), the ERA5 composites reflect unscaled, event-based variability. While this distinction makes direct comparison between models and reanalysis imperfect, ERA5 nonetheless provides a useful benchmark for expected atmospheric responses. The ERA5 El Niño and La Niña composites are best interpreted in relation to each other, rather than as strict analogs to the simulations.
Satellite-based daily precipitation estimates from a 1996–2023 Global Precipitation Climatology Project (GPCP, v1.3) record (Huffman et al., 2001; Adler et al., 2017) are used to assess ENSO-related precipitation anomalies, as is NOAA Interpolated Outgoing Longwave Radiation (Liebmann and Smith 1996). For these analyses, El Niño and La Niña years are defined as ± 1 variations in standardized November–April Niño3 anomalies, yielding 1997, 2009, and 2015, and La Niña years as 1999, 2007, and 2010. Unlike ERA5, where cloud fields and precipitation are parameterized without direct assimilation, satellite-based datasets provide a more direct observational reference, particularly valuable in the tropics where reanalysis precipitation is known to be less reliable (Gehne et al., 2016).
2.4 MJO analyses
We implement a number of widely-used methods to evaluate the MJO in the perpetual ENSO simulations. In the interest of exploring changes to MJO lifetime by ENSO phase as well as visualizing the MJO's vertical structure, we compute Real-time Multivariate MJO indices (RMMs) for each perpetual ENSO simulation using a similar methodology to Wheeler and Hendon (2004, WH04). The RMMs are derived from a combined empirical orthogonal function (EOF) analysis of tropically averaged (15° S–15° N) anomalous daily outgoing longwave radiation (OLR), 200 hPa zonal wind (U200), and 850 hPa zonal wind (U850). As in WH04, we deseasonalize, remove interannual variability, and normalize the anomalies by their global variance. To enable a fairer comparison between the models and reanalysis, we project the anomalous model fields onto 1959–2022 ERA5 WH04 EOFs, which are computed by using ERA5 winds and ERA5 OLR; projecting onto each model's respective ENSO simulation instead does not change the conclusions and using NOAA OLR in the EOFs has minimal impact on model the RMMs (not shown). Daily OLR and U200 were not available for two models (GISS-E2-2-G and LMDz6) so their RMMs are computed using U250 and U850.
The number of MJO events within a given data set is tallied like in Pohl and Matthews (2007) by counting the number of times the MJO makes a complete rotation through its RMM1 and RMM2 phase space. Average lifetime and MJO amplitudes are computed across events. To visualize the MJO's vertical structure, latitudinally averaged 10° S–10° N longitude-pressure cross-section of zonal wind and temperature are projected onto the RMMs using the same steps as Hendon and Abhik (2018), but applied across ENSO years in the present study rather than QBO years.
The MJO is visualized using two related wavenumber–frequency approaches. Both Fourier transform deseasonalized and detrended, highpass filtered, tapered time-longitude data, reorder coefficients into eastward/westward components, and compute power spectra to isolate intraseasonal variability. The CLIVAR/MJO metric (Waliser et al., 2009) applies this to centered November–April segments of tropical U850, yielding single variable power for eastward and westward disturbances (Fig. 3). The Wheeler and Kiladis (1999) style analysis is similar, but designed to diagnose the broader family of convectively coupled equatorial waves alongside the MJO: we linearly detrend multiyear daily fields, highpass filter at 96 d, use overlapping 96 d segments (65 d overlap), perform successive longitude–time transforms, recover symmetric and antisymmetric spectra about the equator, and normalize by a smoothed background; results are presented as the ratio of raw symmetric daily mean precipitation power to background (Fig. 2). Our Wheeler–Kiladis implementation also subsets data to November–April. For model evaluation, spectra are divided by each model's perpetual ENSO background, whereas GPCP (ERA5) El Niño and La Niña spectra are compared to a common 1996–2022 (1959–2022) background.
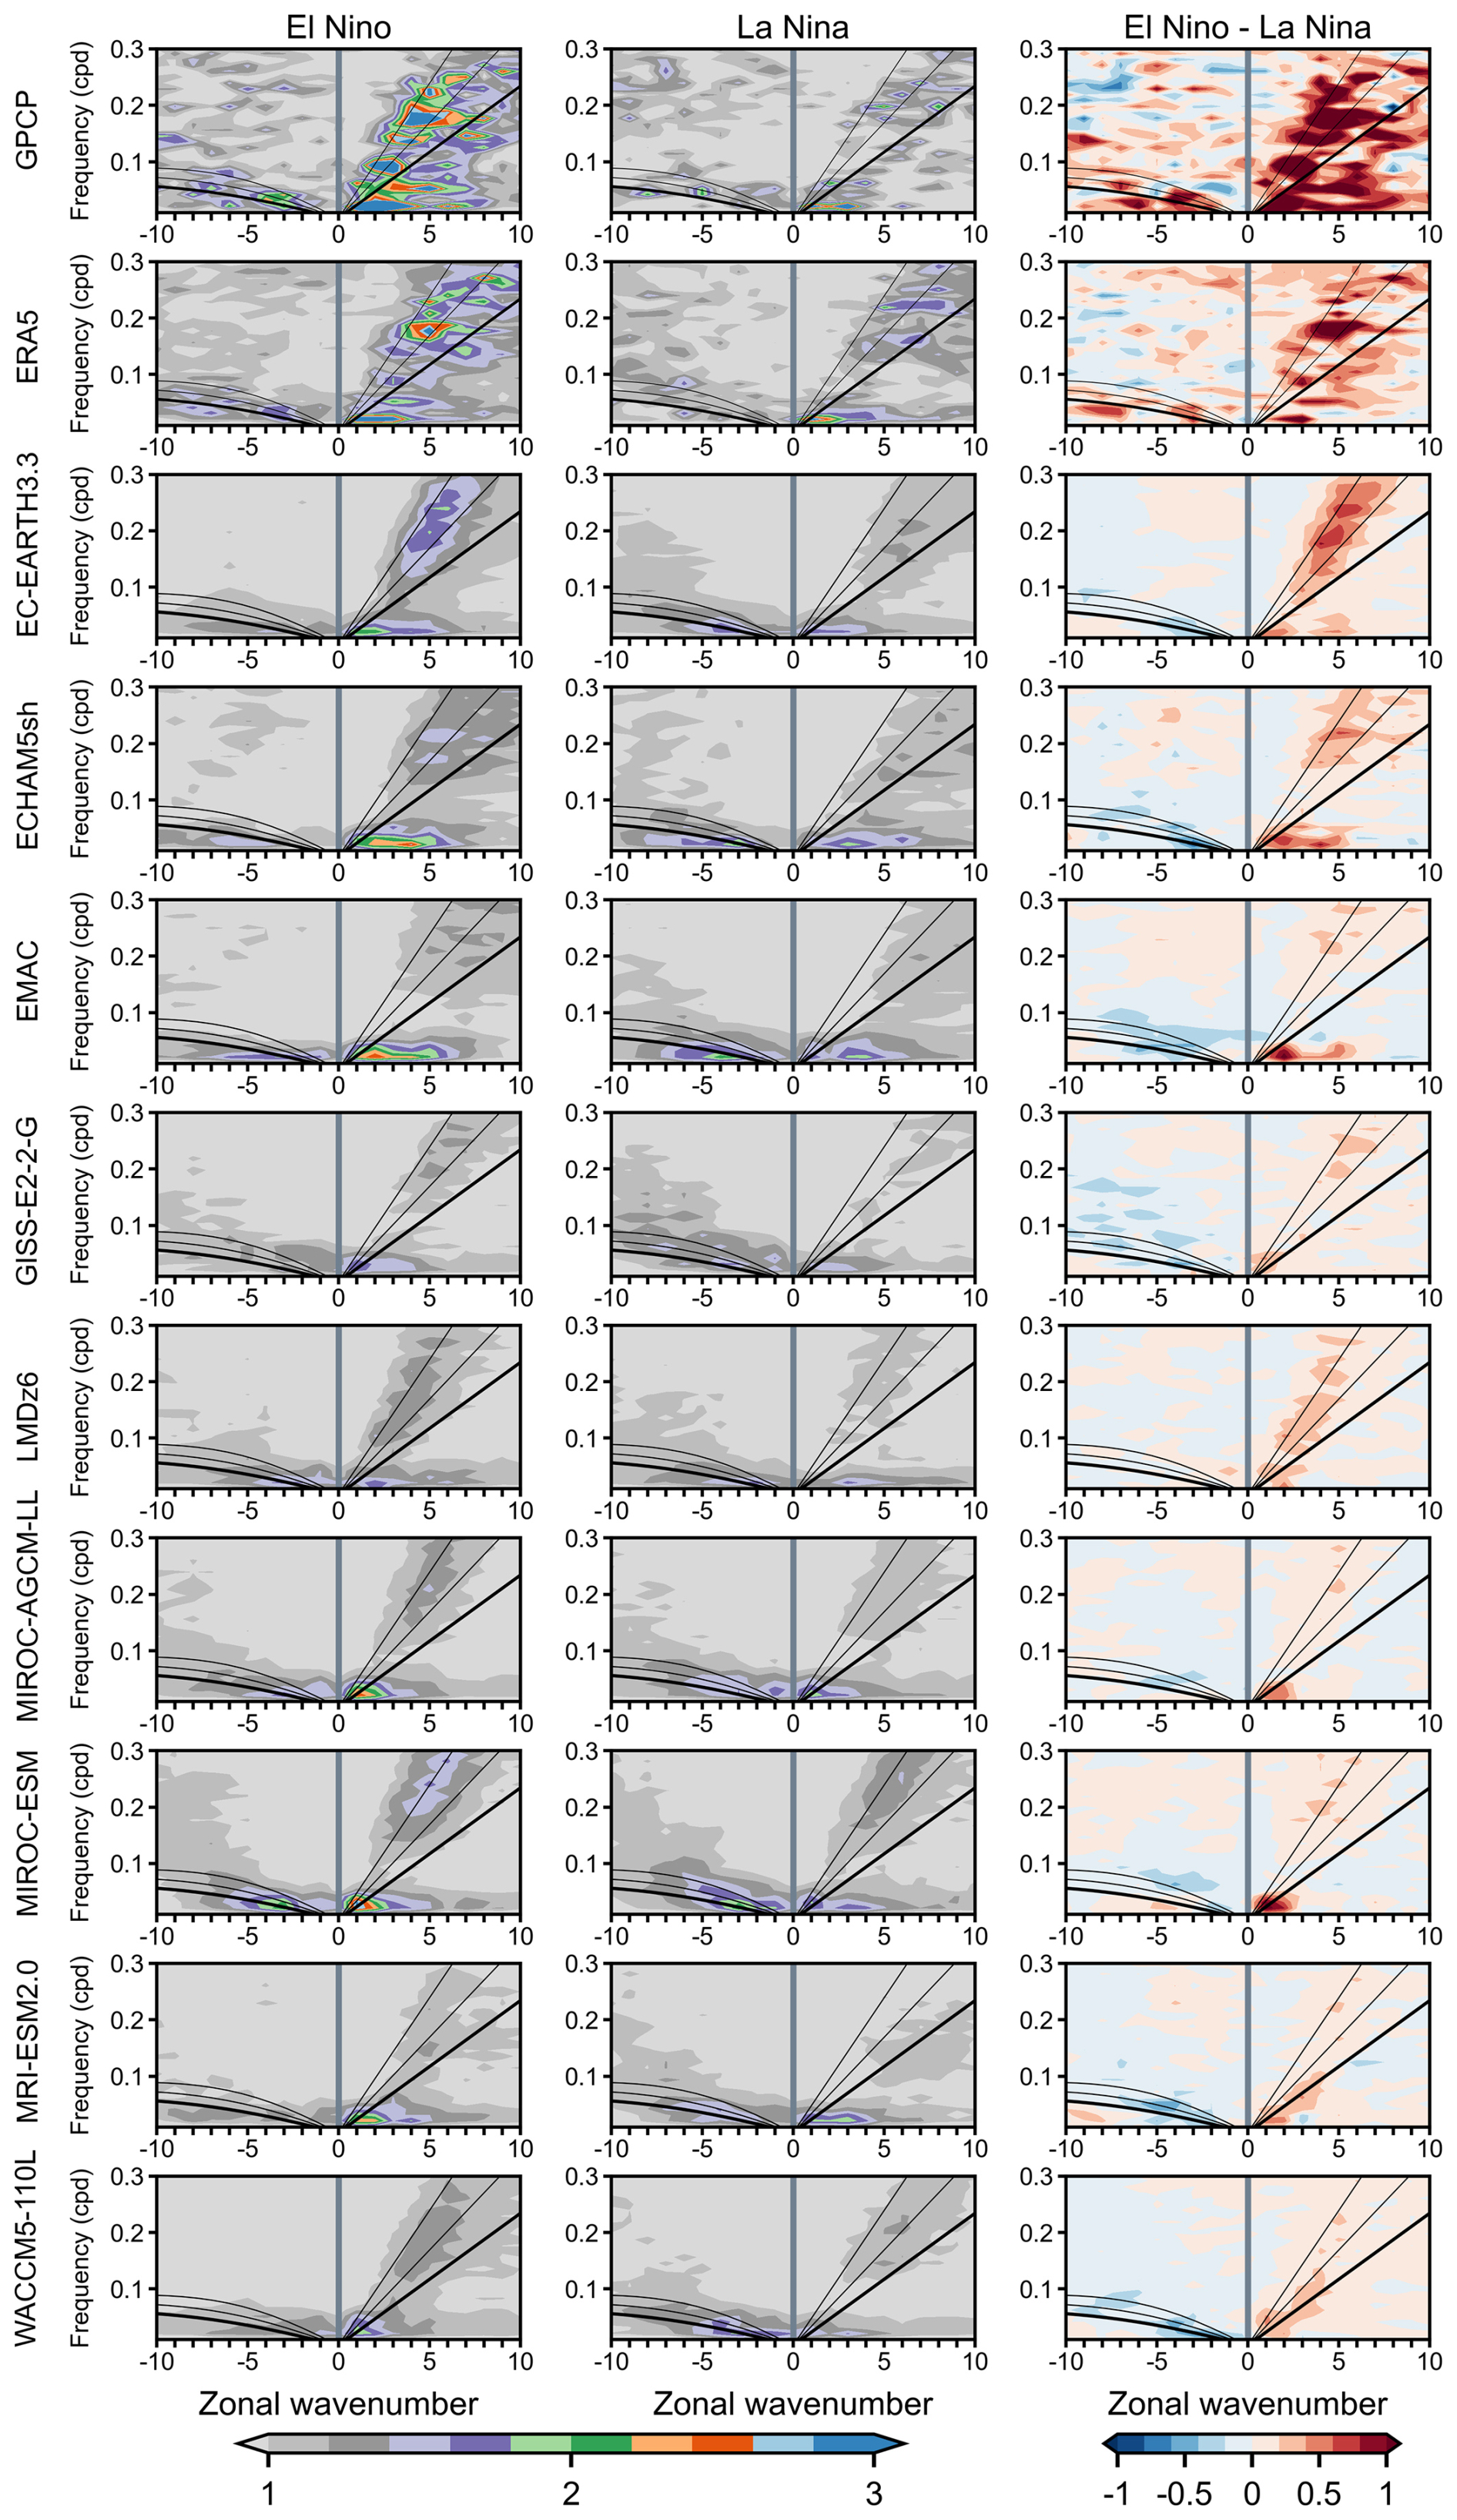
Figure 2Wavenumber-frequency spectrum of the symmetric component of 15° S–15° N November–April precipitation plotted as the ratio between raw symmetric precipitation and a smoothed red noise background spectrum. The eastward (right) side of the spectrum includes three Kelvin wave dispersion curves in black, of which the thickest curve corresponds to the equivalent depth of 12 m, and the others to 25 and 50 m, respectively. Similar dispersion curve plotting conventions are used on the westward (left) side of the spectrum where the curves overlay the equatorial Rossby wave power. Column one corresponds to El Niño, column two to La Niña, and column three to their difference, which is computed as (El Niño symmetric/El Niño background) minus (La Niña symmetric/La Niña background). Computing the third column as (El Niño symmetric) minus (La Niña symmetric) yields similar conclusions (not shown).
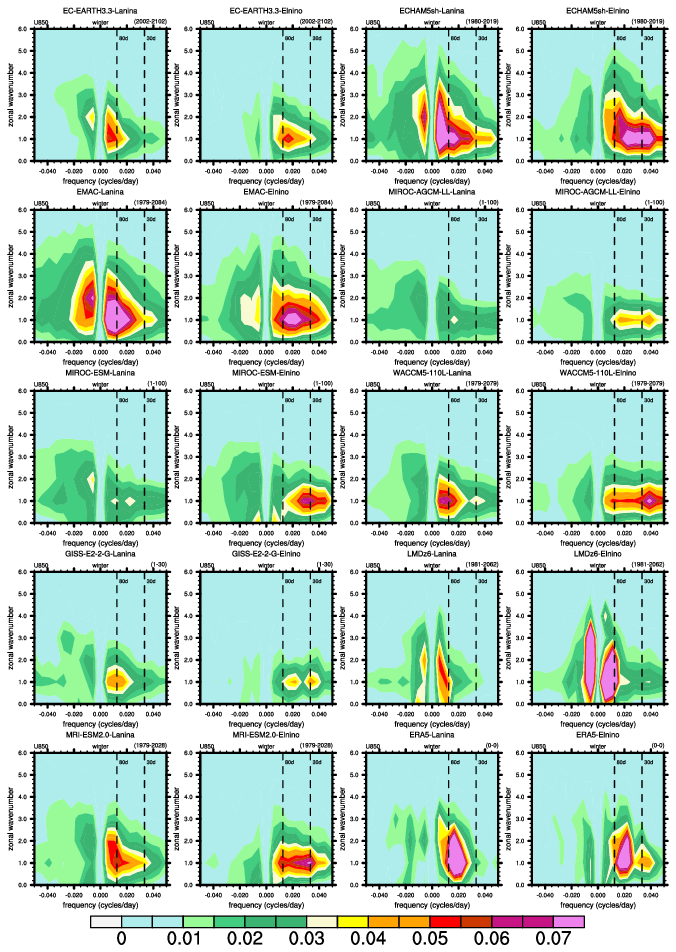
Figure 3November–April wavenumber-frequency power spectra of 10° S–10° N averaged U850. Units of the U850 spectrum are m2 s−2 per frequency interval per wavenumber interval. We interpret the power at ∼ 180 day frequencies as a by-product of using centered November–April segments.
We also implement an MJO diversity analysis in which MJO events are classified into distinct types based on their propagation characteristics using k-means clustering (Wang et al., 2019). Each MJO event is binned as one of four archetypes, “standing” or “jumping” MJOs, which propagate across the Indian Ocean, but are distinguished by reemergence of the MJO over the western Pacific during jumping events, and “slow” or “fast” MJOs, which both continuously propagate across the Maritime Continent, but at different speeds. An MJO event occurs when the 20–70 d bandpass-filtered OLR anomalies (from seasonal cycle) averaged over the equatorial Indian Ocean (10° S–10° N, 75–95° E) are smaller than negative 1 standard deviation for 5 successive days; the reference day (day 0) is the day of minimum OLR. The MJO events are categorized by a k-means clustering of the enhanced convective signal (OLR anomalies under −5 W m−2) of the latitudinally averaged 10° S–10° N time-longitude OLR anomalies taken over 60–180° E and over a 31-day period from day −10 to day 20. For brevity, we omit further diversity analysis methodological details, for which we refer the reader to Back et al. (2024) for all steps. Unlike Wang et al. (2019), in which initial centroids for clustering are randomly chosen, initial centroids for model MJO events are set to those of the four observation-based clusters, allowing the present study to evaluate how well climate models reproduce observed MJO diversity with minimal subjectivity.
2.5 QBO and analyses
The space-time form of the QBOs varies from model to model as each is generated with different amounts of forcing from resolved waves and parameterized non-orographic gravity wave drag. Properties of these models that are particularly relevant for simulating the QBOs are listed in Butchart et al. (2018), details on QBO morphology (e.g., its amplitude, latitudinal width) given the observed SST record are presented in Bushell et al. (2022), and the relative contribution of resolved and parameterized tropical waves to forcing the QBO is analyzed in detail in Holt et al. (2020). Of note, MIROC-AGCM-LL's QBO is forced solely by resolved waves. As EC-EARTH and GISS-E2-2-G did not contribute to some of the earliest QBOi analyses, relevant details on their internal QBOs can be found in Serva et al. (2024) and Rind et al. (2014, 2020), respectively. For a thorough analysis of how the QBO responds to the perpetual ENSO simulations, we refer the reader to Kawatani et al. (2025).
To help clarify the ability of the QBOs to interact with the MJOs, we use established metrics to characterize the morphology of the ERA5 and model QBOs. The main field used to document QBO morphology is the monthly zonal-mean zonal wind. “QBO cycles” (consecutive easterly/westerly phases) are identified by marking the first month when the deseasonalized and smoothed (5-month running mean) 20 hPa 5° S–5° N wind changes from westerly to easterly, ending 1 month before the next transition at 20 hPa (Kawatani et al., 2019). From these cycles, we calculate average QBO easterly, westerly, and total amplitudes using the QBO “transition time” methodology of Richter et al. (2020). The easterly (westerly) amplitude is equal to the average of the minimum (maximum) monthly QBO winds from each QBO cycle. The QBO cycles are used further to calculate minimum, mean, and maximum QBO periodicity statistics. These statistics are a key result of Kawatani et al. (2025) and are discussed thoroughly there. In short, the periodicity of the QBO decreases in all El Niño simulations and increases in all La Niña simulations, which is attributed to ENSO modulating convection and the low-frequency circulation, thereby influencing generation of tropical waves and their filtering by the large-scale circulation and the QBO. For the purposes of the present study, the minimum and maximum periodicities are required to evaluate the QBO's spatial structure, defined as the latitude-pressure cross sections of each data set's QBO Fourier amplitude. These are made by applying a discrete Fourier transform in time to the multi-year monthly zonal-mean zonal wind at each pressure-latitude grid point and dividing the sum of squares of the amplitudes of the harmonics corresponding to periods between the minimum and maximum QBO periods by the sum of squares of the amplitudes of all harmonics. This ratio is subsequently multiplied by the standard deviation of the zonal-mean zonal wind (Pascoe et al., 2005). Using this QBO Fourier amplitude, the lowest altitude the QBO reaches, its vertical extent (i.e., how tall it is), and its latitudinal extent are defined as in Schenzinger et al. (2017), except that here the QBO's maximum amplitude is assumed to be at 20 hPa for all models and ERA5.
QBO impact on the MJO is assessed using the techniques of Klotzbach et al. (2019) and Kim et al. (2020). Following the prior, we make scatterplots of December–February warm-pool (10° S–10° N, 45–180° E) averaged tropopause stability (100 hPa minus 200 hPa temperature) versus December–February MJO amplitude as a function of QBO phase (sign of DJF averaged 5° S–5° N 50 hPa zonal mean zonal-wind) for each of the simulations. MJO amplitude is expected to increase as tropopause stability decreases, which happens during the easterly QBO phase. As in Kim et al. (2020), MJO activity is also computed as a function of QBO phase. Specifically, MJO-filtered OLR is calculated following Wheeler and Kiladis (1999) with one exception, the full time series is detrended rather than using 96 d overlapping segments. To minimize spectral leakage, 5 % of the data are tapered to zero at the ends of the timeseries. After tapering, a complex Fourier Transform is performed, and the spectral wavenumber-frequency data are filtered to retain only the eastward propagating coefficients for 20–100 d periods and wavenumbers 1–5. MJO activity is then defined as the standard deviation of the MJO-filtered OLR across all December–February days that fall into a particular category, for instance all years, easterly QBO years or westerly QBO years. For this analysis, easterly and westerly QBO years are defined as those which exceed ±0.5 standard deviation of the 50 hPa monthly zonal wind anomalies, seasonally smoothed and averaged over 10° S to 10° N. We allow the QBO to be defined differently between the Klotzbach et al. (2019) and Kim et al. (2020) analyses; here we prioritize using the aforementioned metrics in their original form rather than using customizing them.
3.1 Impact of perpetual ENSO conditions on the MJO
3.1.1 Role of convectively coupled waves
Before examining the influence of ENSO on MJO, we evaluate some of the other large-scale tropical phenomena that the models simulate. Convectively coupled waves are relevant because they comprise the space-time structure of the MJO and can influence its propagation by modulating the tropical circulation and the distribution of moisture that the MJO encounters (Kiladis et al., 2009; Wang et al., 2019; Wei and Ren, 2019; Berrington et al., 2022; Wang and Li, 2022). Aspects of the waves, such as their phase speed and what longitudinal domain they propagate in, vary depending on the seasonal-mean circulation and convective activity (Roundy, 2012; Yang et al., 2023). Hence, the amplification of the Walker Circulation by La Niña and the weakening of it by El Niño (Fig. S1 in the Supplement) provide a pathway for the perpetual ENSO forcings to modulate the waves and perhaps the MJO. Applying similar methods to Wheeler and Kiladis (1999), we visualize the waves by computing the spectral power of GPCP, ERA5, and model daily-averaged precipitation as a function of wavenumber and frequency. Figure 2 shows the precipitation spectra for phenomena symmetric about the equator, taken over November–April and 15° S–15° N. Three dispersion curves, as in Matsuno (1966), corresponding to equivalent depths of 10, 25, and 50 m are also superimposed; these curves are derived using the dispersion relations for equatorially trapped waves and they are co-located with modes of organized convection, with larger equivalent depths corresponding to faster phase speeds.
The GPCP panels in row one draw on only 3 La Niña and 3 El Niño years, while the ERA5 panels in row two use just 6 La Niña and 8 El Niño years, resulting in signals that are noisier than the models' multi-decade averages. Power is typically the highest amplitude in GPCP, then ERA5, and weakest in the models. Spectral signals associated with the eastward propagating Kelvin wave move up and to the right on each panel, spanning sub-planetary low frequency (∼ k = 3, 25 d) scales to synoptic (k = 4+) sub-weekly scales. Relative to GPCP and ERA5, the models underestimate the strength of the Kelvin wave irrespective of the type of ENSO forcing, but have worse difficulties in the El Niño simulation. Power associated with the westward propagating equatorial Rossby wave is evident on the left side of each panel between wavenumbers 1–10 and timescales of 10 d to 5 weeks. Overall, the models do a reasonable job of simulating the spectral amplitude of equatorial Rossby waves, although it is too strong for some models (EMAC, MIROC-ESM), especially in their La Niña simulations.
3.1.2 ENSO effects on convectively coupled waves
The effect of ENSO phase on each wave is revealed by the rightmost column of Fig. 2, which shows El Niño (column one) minus La Niña (column two) differences, where red means stronger power during El Niño and blue means larger power during La Niña. All models simulate stronger Kelvin waves in their El Niño simulation, particularly along the deeper equivalent depth (n = 25, 50 m) dispersion curves. This implies faster Kelvin wave phase speeds during El Niño. Examining the El Niño column, the alignment of the Kelvin wave power along these particular curves is demonstrated by EC-EARTH3.3, GISS-E2-2-G, LMDz6, MIROC-AGCM-LL, MIROC-ESM, MRI-ESM2.0 and (CESM1) WACCM5-110L, hereafter just “WACCM5-110L.” The remaining models, ECHAM5sh and EMAC (both ECHAM-based models), differ in that their El Niño Kelvin wave power is weighted towards higher zonal wavenumbers for frequencies below 0.2 cpd. GPCP and ERA5 shows large sporadic increases in Kelvin wave power along deeper equivalent depth dispersion curves during El Niño compared to La Niña. It is suggested that the Kelvin wave intensifies during observed El Niños because SST-driven increases in equatorial convection, combined with a weakened upper-tropospheric westerly duct over the eastern Pacific, enhance the convective and dynamical coupling that supports Kelvin wave growth. La Niña produces the reverse effect (Yang and Hoskins, 2013; Yang et al., 2023).
In contrast, for the westward propagating equatorial Rossby wave, GPCP and ERA5 indicate stronger power during El Niño, whereas all models simulate stronger Rossby wave power during La Niña. This discontinuity arises with models having weaker El Niño Rossby wave spectral power than the GPCP and ERA5 composites (not shown), but stronger power given the La Niña forcing. It should be noted that equatorial Rossbywaves exhibit strong regional variations in observations, varying with the strength and position of seasonal-mean tropical westerlies and in response to extratropical Rossby waves entering low latitudes (Yang and Hoskins, 2016) factors we do not examine here. Such regional impacts may help explain why the GPCP and ERA5 composites differ from the model-simulated ENSO responses. Our observed composites show some consistenty with Yang et al. (2023) who found stronger equatorial Rossby waves during El Nino when the satellite-based OLR spectra were restricted to the western hemisphere (their Fig. 13).
The ENSO-related differences in convectively coupled waves highlighted above motivate investigation into whether the MJO, as represented in the models, also varies systematically by ENSO phase. Observational and modeling studies report that ENSO modulates MJO propagation, amplitude, and regional impact, with notable differences in MJO structure between El Niño and La Niña (Wei and Ren, 2019; Fernandes and Grimm, 2023). This raises the question of whether the model MJOs analyzed here capture these ENSO-dependent features, a topic addressed in the next section.
3.1.3 MJO representation and ENSO dependence
Having found changes in the convectively coupled waves due to ENSO, perhaps the model MJOs also behave differently given ENSO state. Broadly speaking, Fig. 2 shows that the models include MJOs as indicated by the maxima in spectral power at intraseasonal timescales (≪ 0.1 cpd) between eastward propagating wavenumbers 1–5. Holt et al. (2020) also found MJOs to be simulated by these models in historical AMIP simulations (QBOi Exp 1). The highest MJO power in GPCP is concentrated between wavenumbers 1 and 3 irrespective of ENSO phase and exceeds that of ERA5 and the models. The ENSO simulations for EC-EARTH3.3, MIROC-AGCM-LL, MIROC-ESM, MRI-ESM2.0 correctly position MJO power between wavenumbers 1–3 whereas ECHAM5sh, EMAC (sharing convective parameterizations) and LMDz6 exhibit spectral power that is incorrectly shifted towards higher wavenumbers. The amplitude of the MJO is comparatively small in GISS-E2-2-G, LMDz6, and WACCM5-110L, which may adversely affect their stratospheric waves, since these three models adopted interactive GW sources. The El Niño minus La Niña differences in the rightmost column of Fig. 2 show that MJO spectral power is stronger in the presence of the El Niño basic state. Differing from the other models, EC-EARTH3.3, ECHAM5sh, and EMAC have fairly large El Niño minus La Niña MJO power differences at wavenumber 4 and 5.
Irrespective of ENSO phase, the amplitude of the model MJOs as shown in Fig. 2 is systematically weaker than in GPCP or ERA5. This may have something to do with dividing each simulation's symmetric power by its respective background power, the latter of which is contaminated, in a sense, by the perpetual ENSO conditions. Note that recomputing the third column of Fig. 2 without dividing each El Niño and La Niña composite by their respective background does not change our conclusions (not shown). To get around this potential issue with the background power and further inspect the model MJOs as opposed to the convectively coupled waves, in Fig. 3 we consider the westward and eastward wavenumber-frequency spectra of U850 taken over the intraseasonal timescale and over MJO-like zonal wavenumber scales. These analyses yield more holistic views of the MJO than in Fig. 2 because they incorporate the MJO's signals in these fields that are both symmetric and antisymmetric about the equator.
As shown by ERA5, the MJO timescale variance of dynamical fields such as U850 are known to have a narrow spectral peak around zonal wavenumber-1 (Hendon and Salby, 1994). The models are fairly good at reproducing this (Fig. 3), despite large inter-model differences in terms of peak amplitudes. Independent of the ENSO phase, ERA5's wavenumber-frequency shows the highest power between frequencies of 30–80 d (vertical dashes), a so-called “MJO band” (Ahn et al., 2017). Considering only the ERA5 MJO band, the MJO is stronger given lower zonal wavenumbers and longer periodicities during La Niña compared to El Niño. Similarly, the model spectra broadly indicate that the periodicity of the MJO decreases during El Niño and increases during La Niña. However, as was the case for the symmetric precipitation spectra (Fig. 2), there are notable differences in the amplitude of the spectral power between models and reanalysis. Of the models, MJO band amplitude in ECHAM5sh and EMAC is most like ERA5, whereas other models, particularly MIROC-AGCM-LL, MIROC-ESM, and GISS-E2-2-G significantly underestimate the strength of the MJO in this metric. Another issue is that models exhibit too large of an MJO signal for zonal wavenumbers three and up, which is unrealistic and common amongst GCMs (Ahn et al., 2017), with exaggerated high-wavenumber amplitudes in ECHAM5sh, EMAC, and LMDz6, as previously noted for precipitation. The clustering of models related to each other, such as MIROC and ECHAM-based models, affirm that the tropospheric wind response to imposed ENSO anomalies is strongly influenced by model configuration and convective schemes.
To further explore the MJO timescale changes suggested by Fig. 3, Fig. 4a shows the ratio of eastward to westward MJO spectral power in symmetric precipitation from GPCP, ERA5, and the models. The E W ratio measures how robust MJO eastward propagation is (Jiang et al., 2015; Ahn et al., 2017). El Niño and La Niña responses in GPCP and ERA5 (red and blue X's) are derived from composites of previously defined strong ENSO seasons, while gray dots represent interannual E W ratios across all years (GPCP: 1996–2022; ERA5: 1959–2022), providing a baseline of internal variability. Both data sets show modestly higher E W ratios during El Niño than La Niña.
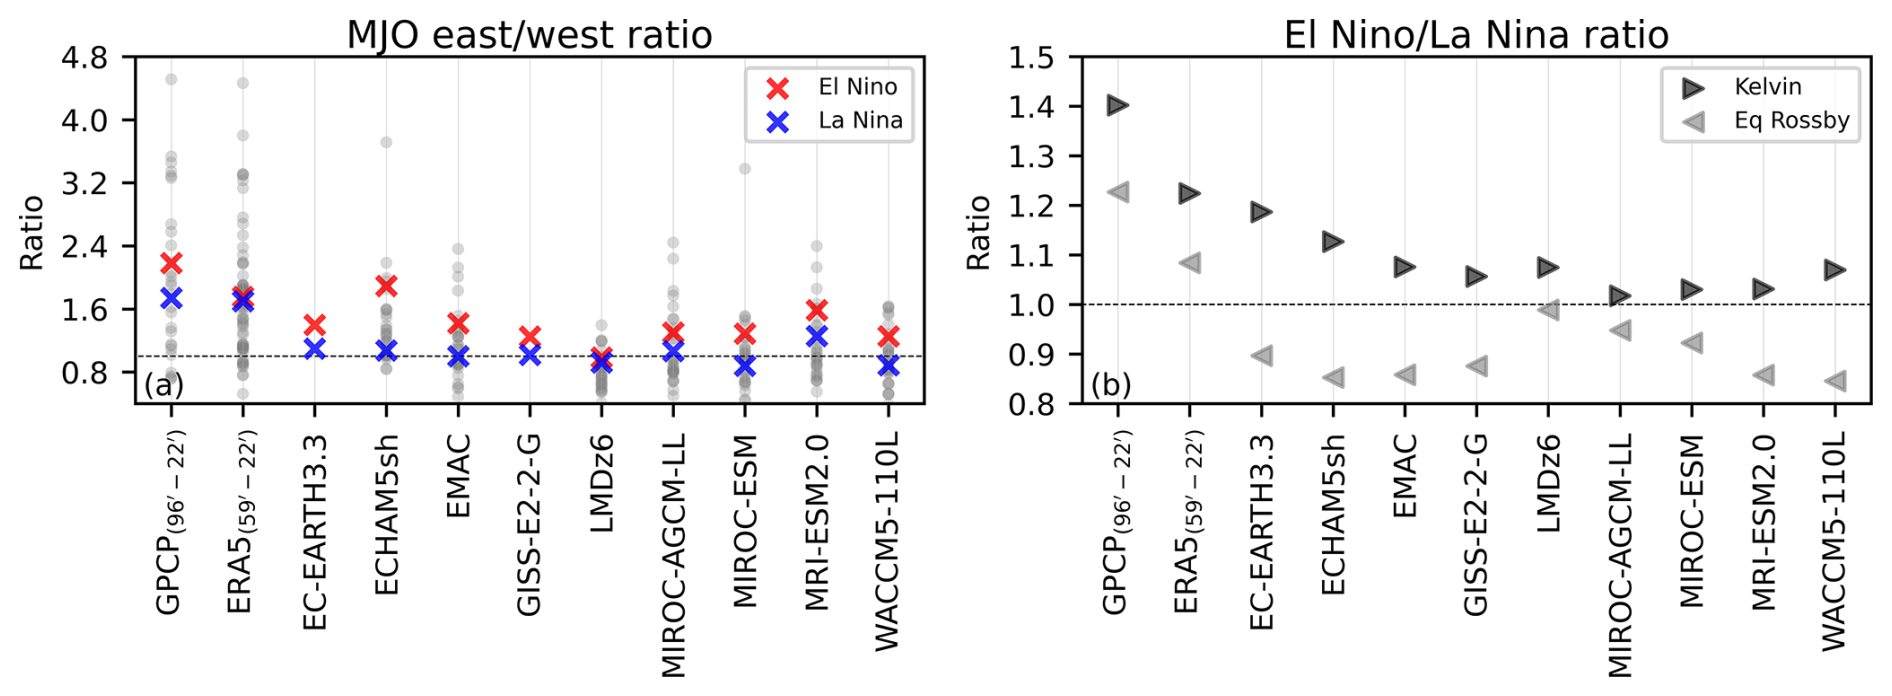
Figure 4(a) Ratio of eastward to westward MJO precipitation spectral power (from Fig. 2) filtered for wavenumbers ±1 to 3 and 30 to 96 d frequencies. Red and blue X's denote El Niño and La Niña, respectively, using the same notation for both the GPCP and ERA5 composite averages and the climatological values from the perpetual El Niño and La Niña simulations. Gray dots indicate interannual east/west ratios from GPCP, ERA5, and the QBOi Experiment 1 simulations (1979–2009 AMIP) by these same models; EC-EARTH3.3 and GISS-E2-2G did not run Experiment 1. (b) Ratio of Kelvin wave and equatorial Rossby wave power in El Niño to that in La Niña. Each wave is filtered using equivalent depths of 8 to 90 m, with wavenumbers of 1 to 14 for the Kelvin wave and −1 to −10 for the equatorial Rossby wave.
It is worth iterating that the models' ratios are derived from the climatological means of the perpetual ENSO simulations, in contrast with the event-based composites of GPCP and ERA5. Model gray dots are interannual ratios from QBOi Experiment 1 AMIP 1979–2009 simulations, which contextualizes internal variability. E W ratios are higher in El Niño simulations, shifting towards the upper tail of the AMIP-based sampling variability. Conversely, many of La Niña E W ratios are around one (dashed line), indicating subdued MJO propagation. The response to ENSO is relatively small in models with a weak MJO, such as GISS, LMDz6 and MIROC-AGCM-LL.
Building on the observed ENSO-related changes in MJO propagation, Fig. 4b further quantifies how convectively coupled equatorial waves, Kelvin and equatorial Rossby, respond to ENSO forcing, given their known links to MJO variability. Figure 4b shows the ratio of El Niño to La Niña precipitation-based spectral power, filtered from Fig. 2 for each wave type. GPCP and ERA5 composites indicate that both waves are stronger during El Niño than La Niña. Models generally reproduce stronger Kelvin waves in their El Niño simulations. However, equatorial Rossby waves are consistently stronger in La Niña simulations, in contrast to GPCP and ERA5. This disagreement between observational products and models is difficult to attribute given the differences in how spectra for each are computed and known biases in modeled precipitation spectra (Holt et al., 2020, Experiment 1). This discrepancy arises with model equatorial Rossby waves being weaker in the El Niño simulation than in GPCP and ERA5, but stronger than the observational benchmarks in the La Niña simulation (not shown).
The modulation of Kelvin and equatorial Rossby wave activity by ENSO, as evidenced in the historical records and models, is expected to impact the MJO's propagation speed and spatial structure (Wang et al., 2019). Since the balance between these waves impacts the MJO's eastward progression, it is helpful to assess how such dynamical changes are reflected in the statistical properties of MJO events, specifically their lifetime and diversity, across different ENSO backgrounds.
3.1.4 MJO lifetime and event diversity
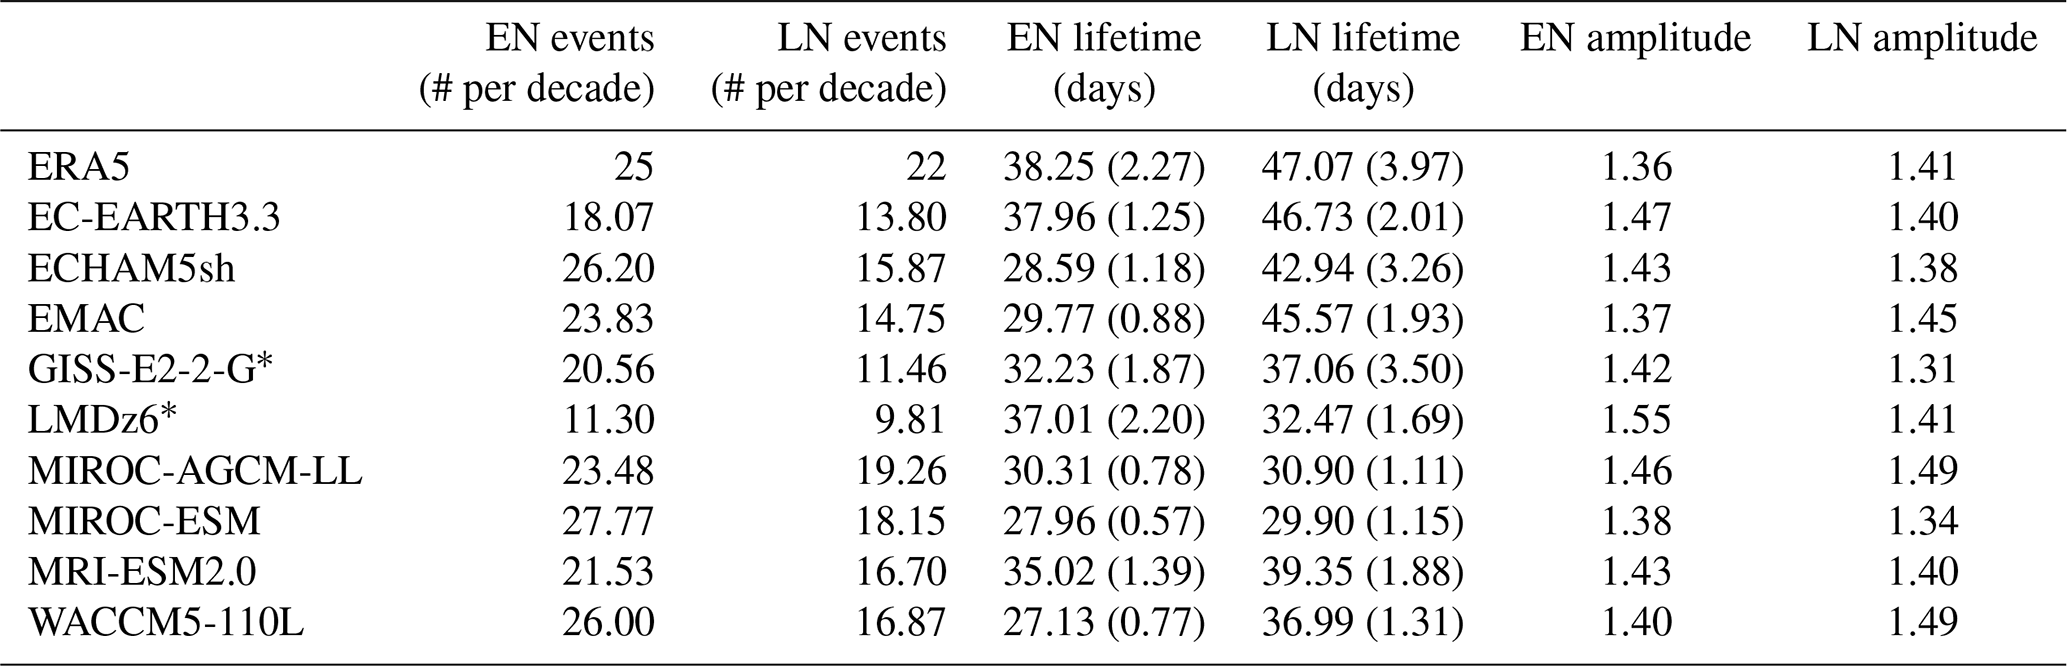
Based on ERA5, La Niña events are roughly nine days longer than El Niño events on average. Wei and Ren (2019) found La Niña to support both high-frequency (lifetime ∼ 40 d) and low frequency (lifetime ∼ 80 d) MJOs, which conceivably explains the much larger ERA5 lifetime standard errors during La Niña compared with El Niño. Strikingly, the difference in lifetime and its standard error between ENSO phases is nearly ubiquitous across the models. With the exception of LMDz6, La Niña lifetimes are between 0.59 (MIROC-AGCM-LL) and 15.8 (EMAC) days longer than El Niño lifetimes. Models in similar families, for instance ECHAM5sh and EMAC as well as MIROC-AGCM-LL and MIROC-ESM, typically have similar magnitude differences in their Pohl and Matthews (2007) statistics between ENSO phases. All models simulate more MJO events during El Niño, which is consistent with ERA5, however the difference in the number of events between ENSO phases is generally larger in the models than in ERA5. MJO amplitude is only marginally larger during La Niña based on ERA5 whereas six of the nine models have larger amplitudes during El Niño.
Analyzing MJO diversity offers further insight into its propagation characteristics. k-means clustering of empirical OLR Hovmöller diagrams reveals four dominant archetypes: standing, jumping, slow, and fast propagating MJOs (Wang et al., 2019). Associated SST composites show standing MJOs tend to coincide with La Niña, fast MJOs with El Niño, while jumping and slow events show no clear ENSO linkage (Back et al., 2024). The experimental design allows us to test whether certain archetypes become more robust under persistent ENSO forcing. Fast and slow events can occur during either ENSO phase (Yadav and Straus 2017), suggesting some sensitivity of the established archetype-ENSO associations to internal variability. Figure 5 lists the number of each archtype's events simulated by each model (at the base of each bar). Four of seven models produce more standing events during La Niña and four models produce more jumping events during El Niño, results that do not indicate a consistent ENSO dependence. In contrast, slow and fast MJOs are modestly more frequent in El Niño simulations for six of seven models.
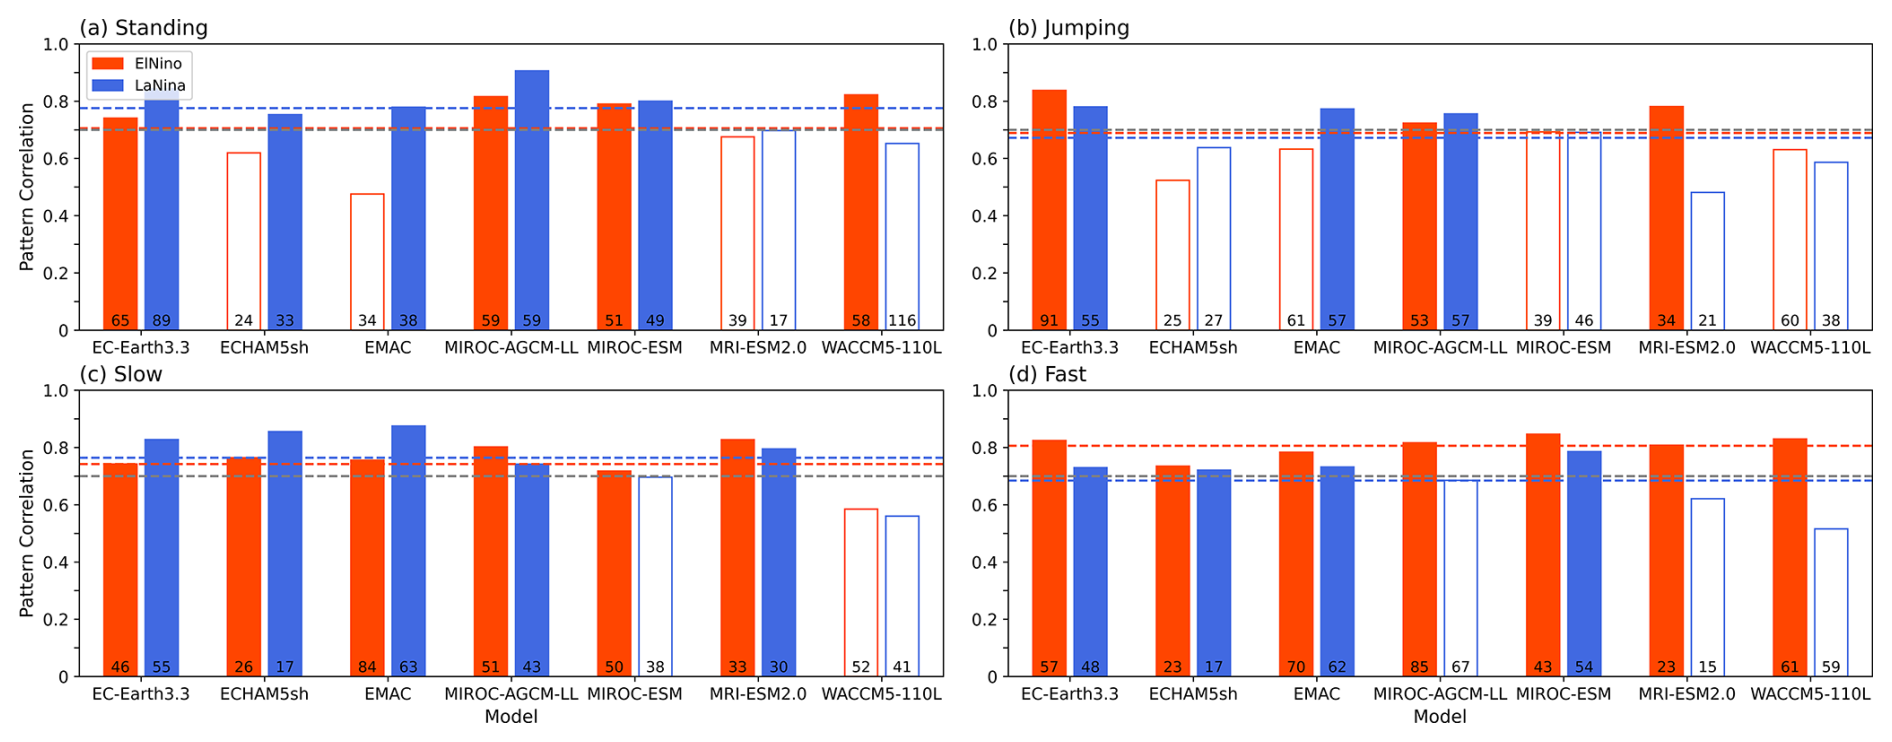
Figure 5Pattern correlations between the ERA5 and simulated time-longitude (Hovmöller) 10° S–10° N convective OLR anomaly composites (OLR < −5 W m−2) corresponding to each of the four k-means clusters MJO archetypes defined in Wang et al. (2019). Multi-model average El Niño and La Niña correlations are shown by red and blue dashed lines, respectively. The gray dashed line marked at a correlation of 0.7 is a heuristic threshold (Back et al., 2024) to decide when a particular model's MJO archetype is well captured by a model and bars are shaded in red or blue when correlation exceeds this threshold. Number of events is printed at the bottom of each bar.
To assess how closely model archetypes resemble those in reanalysis, we calculate pattern correlations between ERA5 and model time-longitude tropical OLR anomaly composites for each cluster. This evaluates how well models capture observed MJO archetypes and whether representation improves under ENSO forcing. Prior multi-model studies (Back et al., 2024) suggest a pattern correlation of 0.7 as a threshold for distinguishing well-simulated OLR Hovmöllers. For the standing MJO (Fig. 5a), five of 14 models fall below this threshold and are shaded white. Although roughly a third of simulations poorly represent the standing cluster, model skill improves during La Niña, with the multi-model mean correlation exceeding the El Niño value by 0.09. For jumping MJOs (Fig. 5b), correlations fall below 0.7 in over half the models, indicating widespread difficulty in simulating this archetype. As jumping MJOs are not thought to be ENSO-sensitive, they are not analyzed further.
Studies suggest slowly propagating MJOs often coincide with La Niña, though the associated SST pattern is weak and statistically insignificant (Wang et al., 2019; Back et al., 2024). Similarly, model skill is slightly higher in La Niña simulations, but likely indistinguishable from El Niño (Fig. 5c). In contrast, fast MJOs are better represented in every El Niño simulation, with the multi-model mean correlation exceeding the La Niña mean by 0.11 (Fig. 5d). In summary, model skill in representing fast and standing MJOs tends to be higher during El Niño and La Niña simulations, respectively, and models simulate a modestly higher number of fast events in their El Niño simulation.
3.1.5 MJO vertical structure and ENSO dependence
The vertical structure of the MJO differs between slow and fast propagating events (Wang et al., 2019). To consider this further, we regress the latitudinally averaged 10° S–10° N zonal wind and temperature from ERA5 and the models onto their phase 3/4 RMM indices as in Hendon and Abhik (2018) and form pressure-longitude cross-sections (Fig. 6). Phases 3/4, when the MJO convection is over the western Maritime Continent, are of interest because ENSO modulates the low-frequency circulation here through its effect on the Walker Circulation, giving it a pathway to influence MJO propagation (Sun et al., 2019; Suematsu and Miura, 2022). Irrespective of the ENSO phase, the MJO in ERA5 exhibits a quadrupole structure in zonal wind, all of which is centered around a tropospheric warming at 140° E that peaks in amplitude near 300 hPa (cf. Jiang et al., 2015).
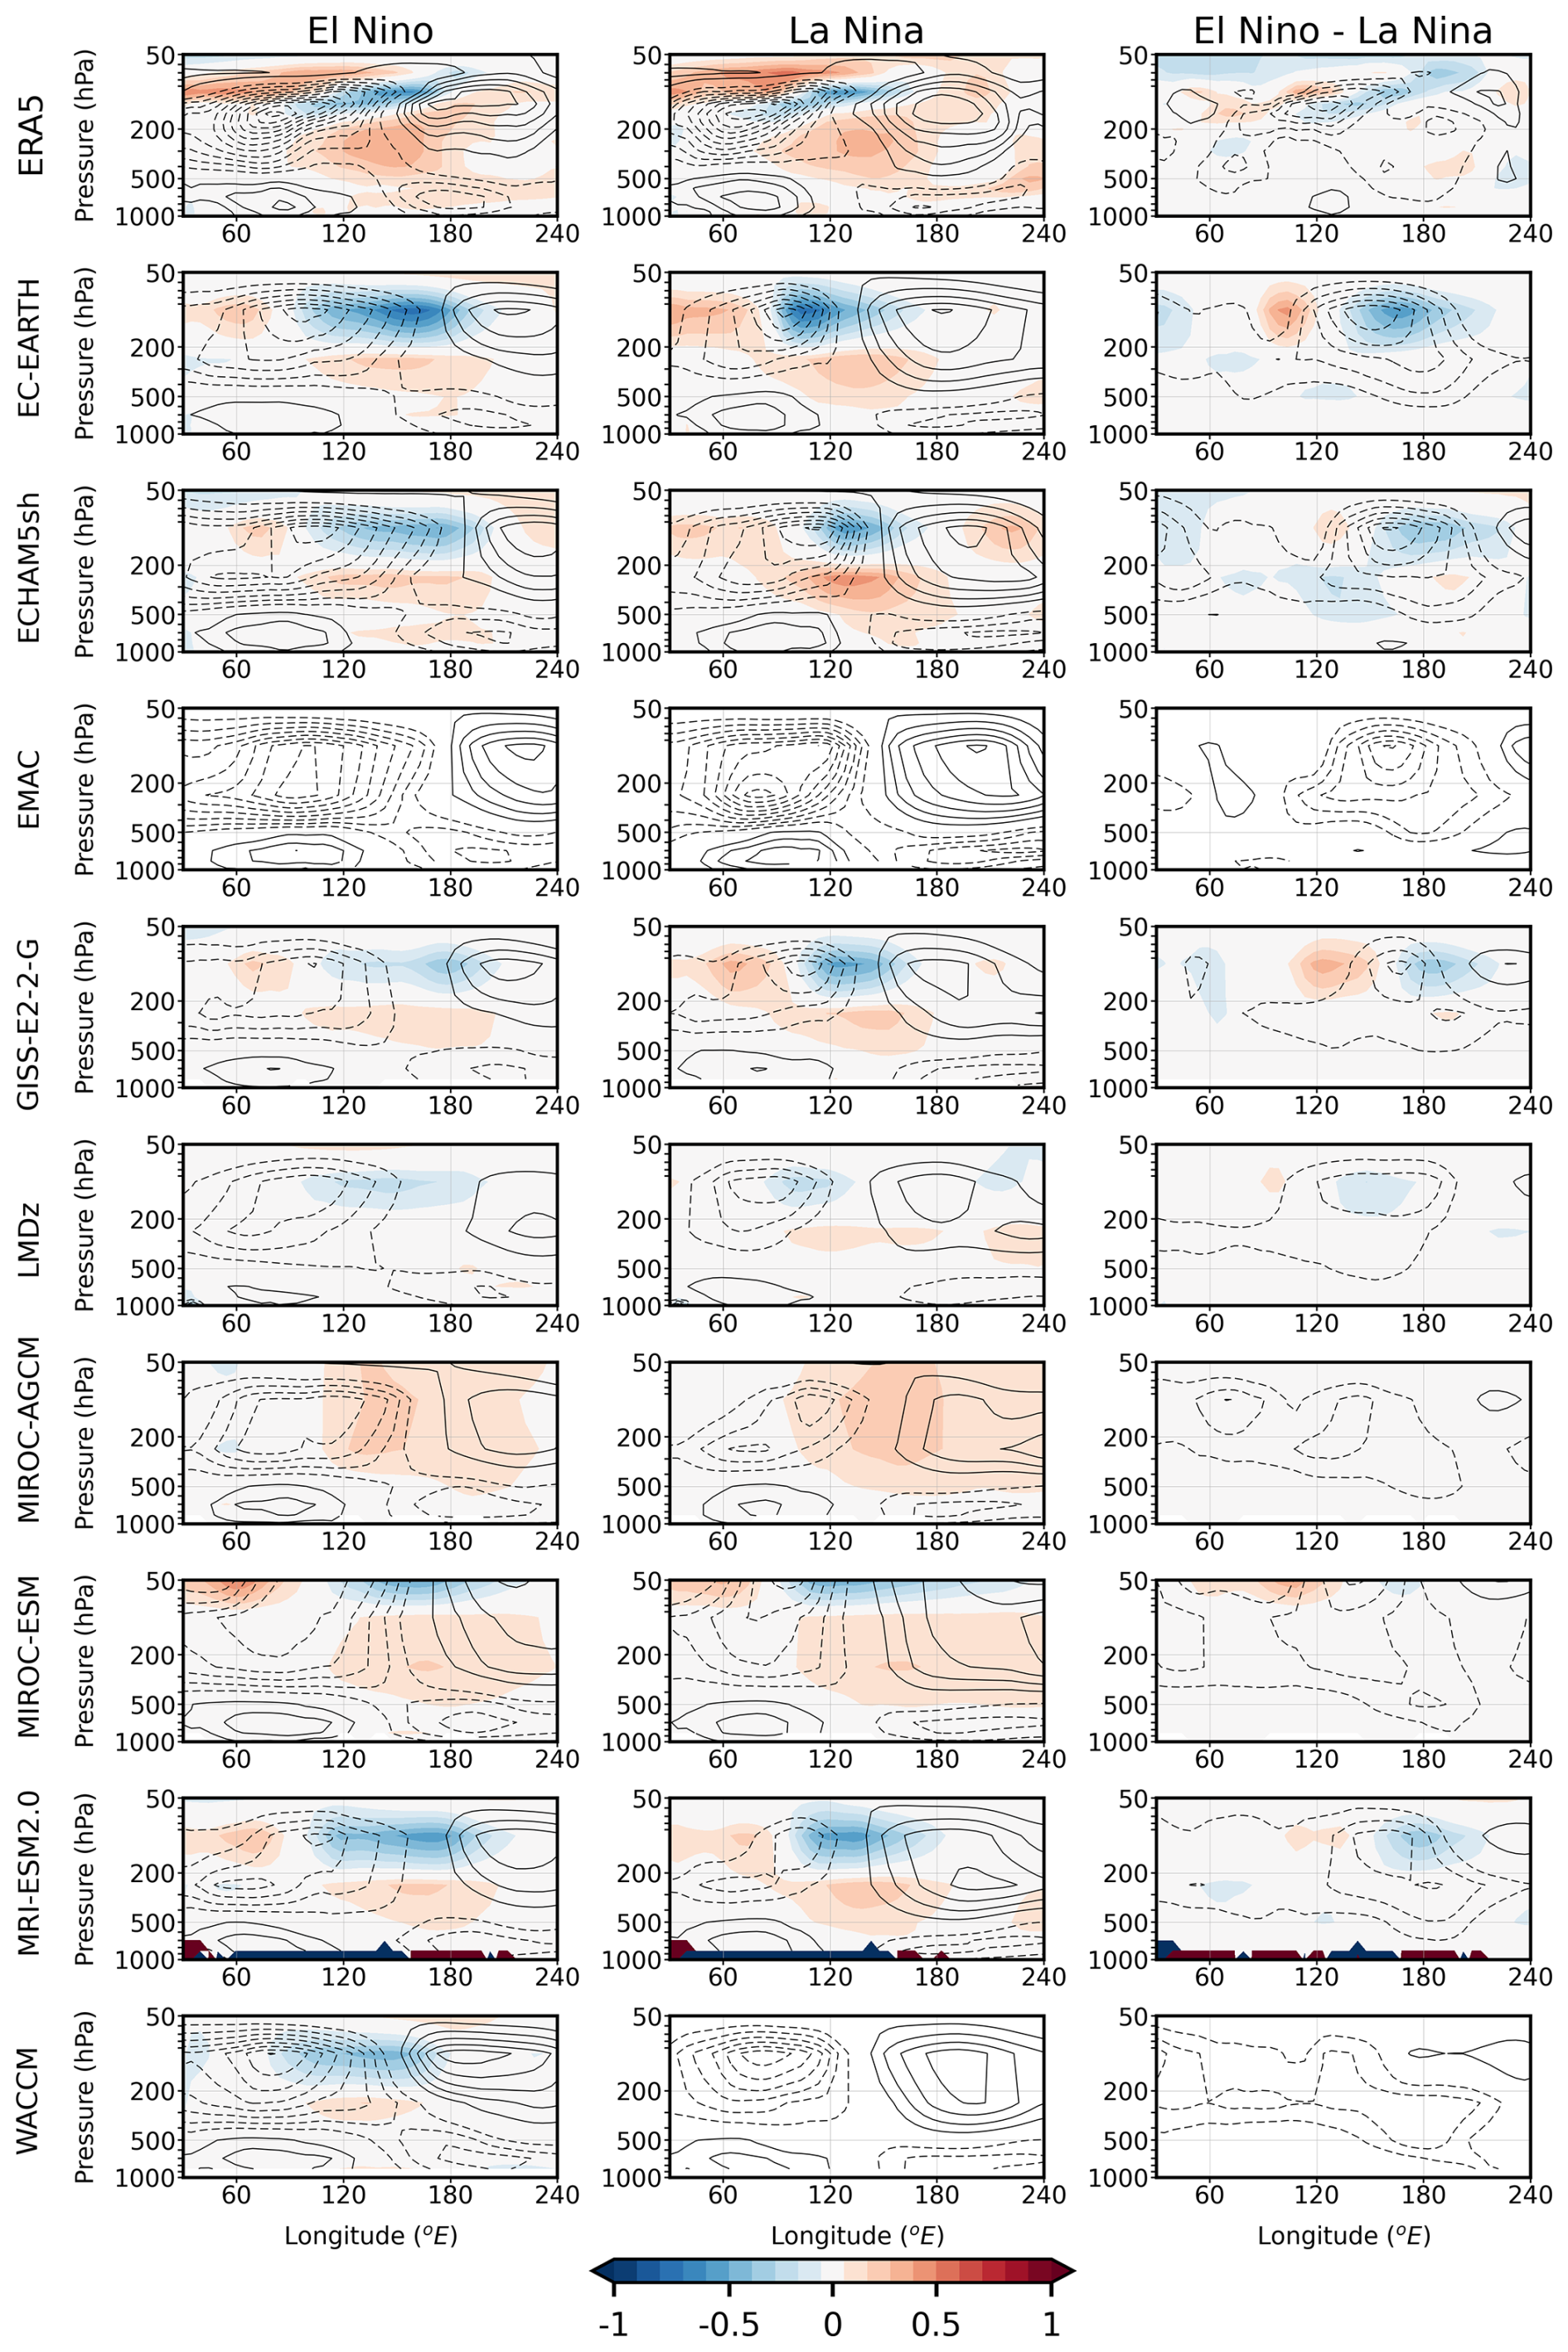
Figure 6Pressure-longitude cross-sections of the 10° S–10° N zonal wind and temperature regressed onto the Phase 3/4 RMMs as in Hendon and Abhik (2018). Black contours show zonal wind (intervals of ±0.5, 1.5, 2.5 m s−1...) and temperature is shaded between −1 and 1 °C. EMAC is missing temperature and we omit WACCM's La Nina temperature due to a conspicuous artifact.
Although the ERA5 El Niño and La Niña composites are similar overall, subtracting the two reveals that they differ due to the El Niño composite including a stronger Kelvin wave, evidenced by the stronger tropospheric easterlies to the east of MJO convection (cf. Fig. 2). In addition, the composites reveals a dry Kelvin wave signature, its characteristic features being a cold cap temperature anomaly in the UTLS, which is slightly out of phase with easterly zonal wind anomalies, all of which tilt eastward with increasing height above ∼ 200 hPa and westward with increasing height below (Straub and Kiladis, 2002; Kim et al., 2013; Yuni et al., 2019; Nakamura and Takayabu, 2022). Judging by the longitude of the ERA5 100 hPa cold cap maximas, the dry Kelvin wave embedded in the composite El Niño MJO is shifted further east compared to its La Niña equivalent.
Consistent with recent studies, the surface easterlies positioned east of the MJO convection are indeed stronger during El Niño in reanalysis (Wang et al., 2019; Wei and Ren, 2019). We attribute the amplification of these easterlies to the Kelvin wave's signature in wind, which better bridges the MJO lower tropospheric easterlies over the Pacific with the upper tropospheric easterly outflow over the Indian Ocean; compare the 500 hPa zonal winds at 150° E between El Niño and La Niña. This enhanced continuity of the MJO easterlies during El Niño is a robust feature amongst the models and is particularly clear in the El Niño minus La Niña composites of EC-EARTH3.3, ECHAM5sh, MIROC-AGCM-LL, MIROC-ESM and MRI-ESM2.0.
It is also possible that the amplification of the equatorial Rossby wave during La Niña (cf. Fig. 2) projects onto the MJO's vertical structure. These waves (when located in the eastern hemisphere) have a first baroclinic structure in zonal wind that consists of low-level westerlies and upper-level easterlies (Kiladis et al., 2009; Yuni et al., 2019; Nakamura and Takayabu, 2022). Following from the robust amplification of the equatorial Rossby wave across the models during La Niña, it was hypothesized that the low-level westerlies west of the MJO convection would be stronger during La Niña than El Niño like in Wei and Ren (2019). This does not appear to be the case though and no first baroclinic zonal wind structure stands out in the El Niño minus La Niña composites. The signal of the equatorial Rossby wave does, however, appear to be visible in the temperature field. These waves are associated with a mid to upper tropospheric warming that is centered around 300 hPa (Kiladis et al., 2009, their Fig. 18c). This region of the upper troposphere is warmer in all of the La Niña simulations, with the exception of MIROC-ESM in which the warming is marginally stronger in the El Niño composite.
3.2 The lack of QBO-MJO interaction
The results in the previous section indicate that ENSO modulates the MJO's propagation, promoting faster MJOs during El Niño and the opposite during La Niña. However, it is possible that aliased signals from the spontaneously generated QBOs are embedded in the aforementioned results. Therefore, in this section we look for evidence of QBO-MJO interaction. As a first step, the representation of the QBO is documented using previously defined metrics, with a specific interest in quantifying the “lowest level” that the QBO descends to in the lower stratosphere. Insufficient descent is a known bias, which may hinder the QBO from modulating other potentially important variables near the tropopause such as temperature (Richter et al., 2020; Kim et al., 2020). Similar to Schenzinger et al. (2017), the lowest level that QBO reaches is found by averaging the QBO Fourier amplitude (see Methods) over 5° S–5° N, identifying the maximum amplitude (fixed at 20 hPa here), and then finding the isobar in the lower stratosphere where the amplitude equals 10 % of the maximum.
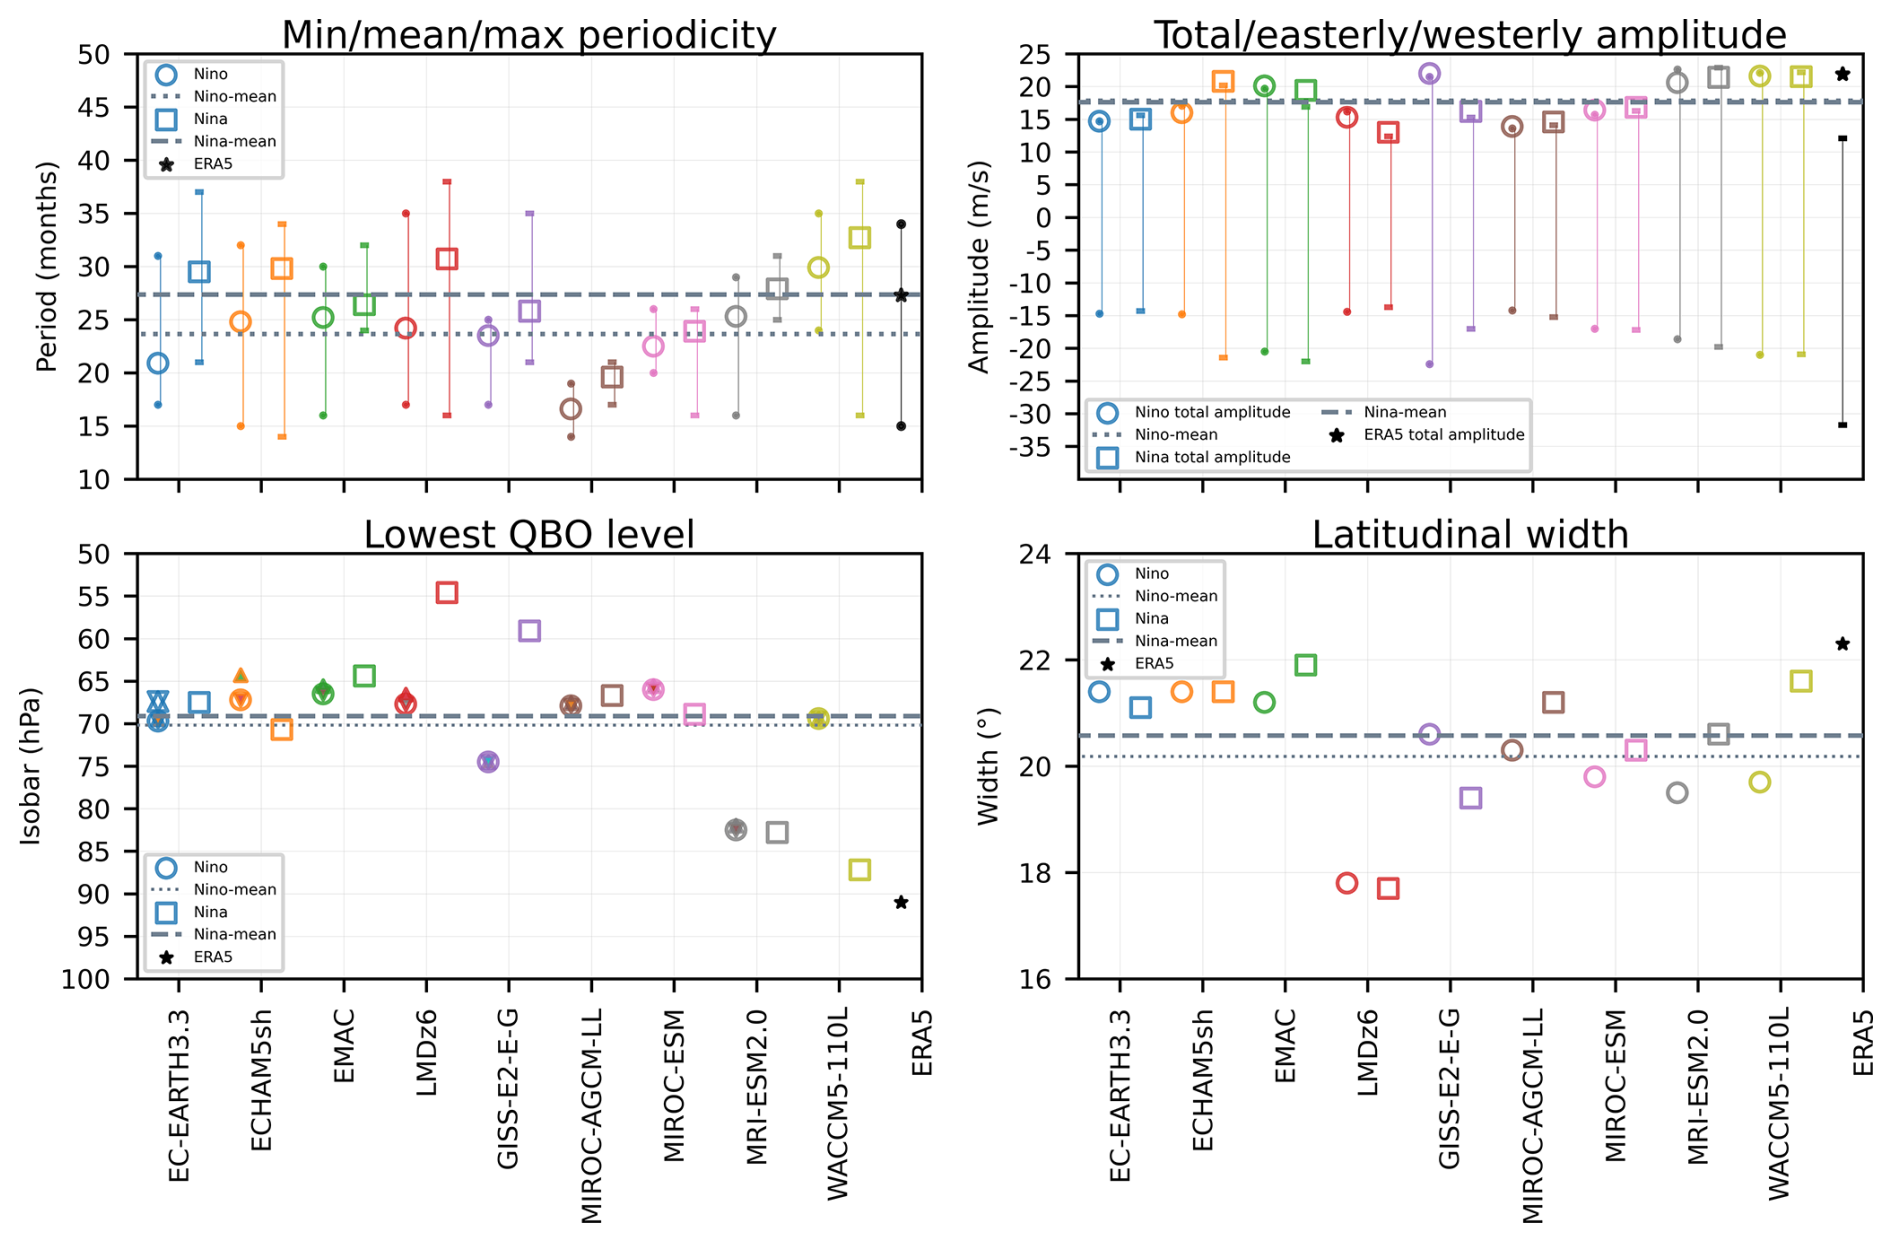
Figure 7Periodicity, amplitude, lowest level of descent, and latitudinal width of the QBO in El Niño (circles) and La Niña (squares) simulations. (a) Mean periodicity, where whiskers extend to the minimum and maximum period, El Niño mean is dotted, La Niña mean is dashed, and ERA5 is shown in black. (b) Circles and squares show total amplitudes (“TT amplitude” from Richter et al., 2020), tops of whiskers show westerly amplitudes, and bottoms of whiskers show easterly amplitudes. (c) Lowest isobar the QBO descends to, the level at which the QBO Fourier amplitude falls to 10 % of its maximum. (d) Latitudinal width of QBO, full width at half amplitude maximum of a Gaussian fit to the QBO Fourier amplitude.
The QBO descends to 92.2 hPa in ERA5 (Fig. 7c). Of the simulated QBOs, the majority do not reach beneath 70 hPa, indicating that they are likely too high in altitude to influence the tropical atmosphere beneath 100 hPa as observed (Tegtmeier et al., 2020). One outlier is the WACCM5-110L's La Niña simulation whose lowest isobar of 87 hPa is fairly similar to the ERA5 benchmark. Nonetheless, sensitivity tests with this simulation in which MJO amplitude is computed as a function of lower stratospheric QBO phase reveals its MJO to be insensitive to the QBO in the observed way (not shown), which may also be attributable to the weak MJO signal in the model. ENSO phase does not have consistent effects on what lowest isobar a given model's QBO reaches. For example, GISS-E2-2-G and LMDz6 favor much stronger descent of the QBO into the lower stratosphere during El Niño whereas WACCM5-110L's ENSO simulations reflect a strong opposite signed response.
QBO periodicity varies systematically with ENSO phase in these simulations, being longer during La Niña and shorter during El Niño (Fig. 7a); see Kawatani et al. (2025) for a detailed analysis of this result. However, none of the QBO spatial metrics exhibit consistent ENSO-phase dependence across models. For example, total QBO amplitude is marginally stronger during La Niña in five of the nine models (Fig. 7b). El Niño and La Niña total QBO amplitudes differ by less than 1 m s−1 for all models except ECHAM5sh, GISS-E2-2-G, and LMDz6. ECHAM5sh favors a stronger QBO amplitude during La Niña, owing to intensified QBO easterlies and westerlies during this ENSO phase. Conversely, GISS-E2-2-G, and LMDz6 favor stronger easterly, westerly, and total QBO amplitudes during El Niño. Of the 12 simulations corresponding to the six other models, EC-EARTH3.3, EMAC, MIROC-AGCM-LL, MIROC-ESM, MRI-ESM2.0, and WACCM5-110L, the magnitude of their easterly and westerly QBO amplitudes is stronger during La Niña in eight of the 12 simulations. Although the models ubiquitously underestimate the latitudinal extent of the QBOs relative to ERA5, six of nine models have wider QBO latitudinal extents during La Niña (Fig. 7d). This may be noteworthy because the boreal winter polar stratospheric wind response to the QBO is stronger when the QBO is wider (Hansen et al., 2013) and there is a preference for this teleconnection to happen during La Niña over the observed record (Kumar et al., 2022).
While the aforementioned QBO metrics help to broadly characterize the form of each model's QBO, they are non-time-varying quantities and have less value for better understanding seasonal phenomena such as the predominantly boreal winter QBO-MJO interaction. To incorporate the effects of seasonality, scatterplots of December-February warm-pool averaged tropopause stability versus December–February MJO amplitude are made as a function of QBO phase for each of the simulations (Klotzbach et al., 2019). MJO amplitude is expected to increase as tropopause stability decreases (Son et al., 2017; Klotzbach et al., 2019), as is apparent based on ERA5 (Fig. 8). This metric is relevant for considering QBO-MJO coupling because the QBO's effect on lower stratospheric stability (e.g., Densmore et al., 2019) is one of the suspected physical mechanisms coupling the QBO and MJO. In general, the models do not reproduce the observed inverse relation between MJO amplitude and 100–200 hPa stability and stratifying the results either by ENSO phase or QBO phase does not change this. The linear response of the MJO amplitude to the tropopause stability, which is negative in observations, does not change consistently with the ENSO phase. It is worth noting that the mean DJF stability in the models is generally close to that of ERA5 (−28.7 K) except for the GISS model, which showcases a smaller gradient (−23.3 K), and all models appear to underestimate its interannual variability, as evident by the smaller range compared to ERA5 (recall however that imposed SSTs do not vary interannually). Furthermore, the stratification by QBO phase (with EQBO associated with lower stability values, and vice versa for the WQBO) is also small or absent in models, possibly due to a limited influence of the QBO at tropopause heights (Serva et al., 2022). Further sensitivity tests were done to see if the model QBOs simulate a QBO-MJO amplitude relationship when the MJO is in a particular phase (e.g., Lim and Son, 2020; Lawrence et al., 2023); no systematic effect was detected (not shown).
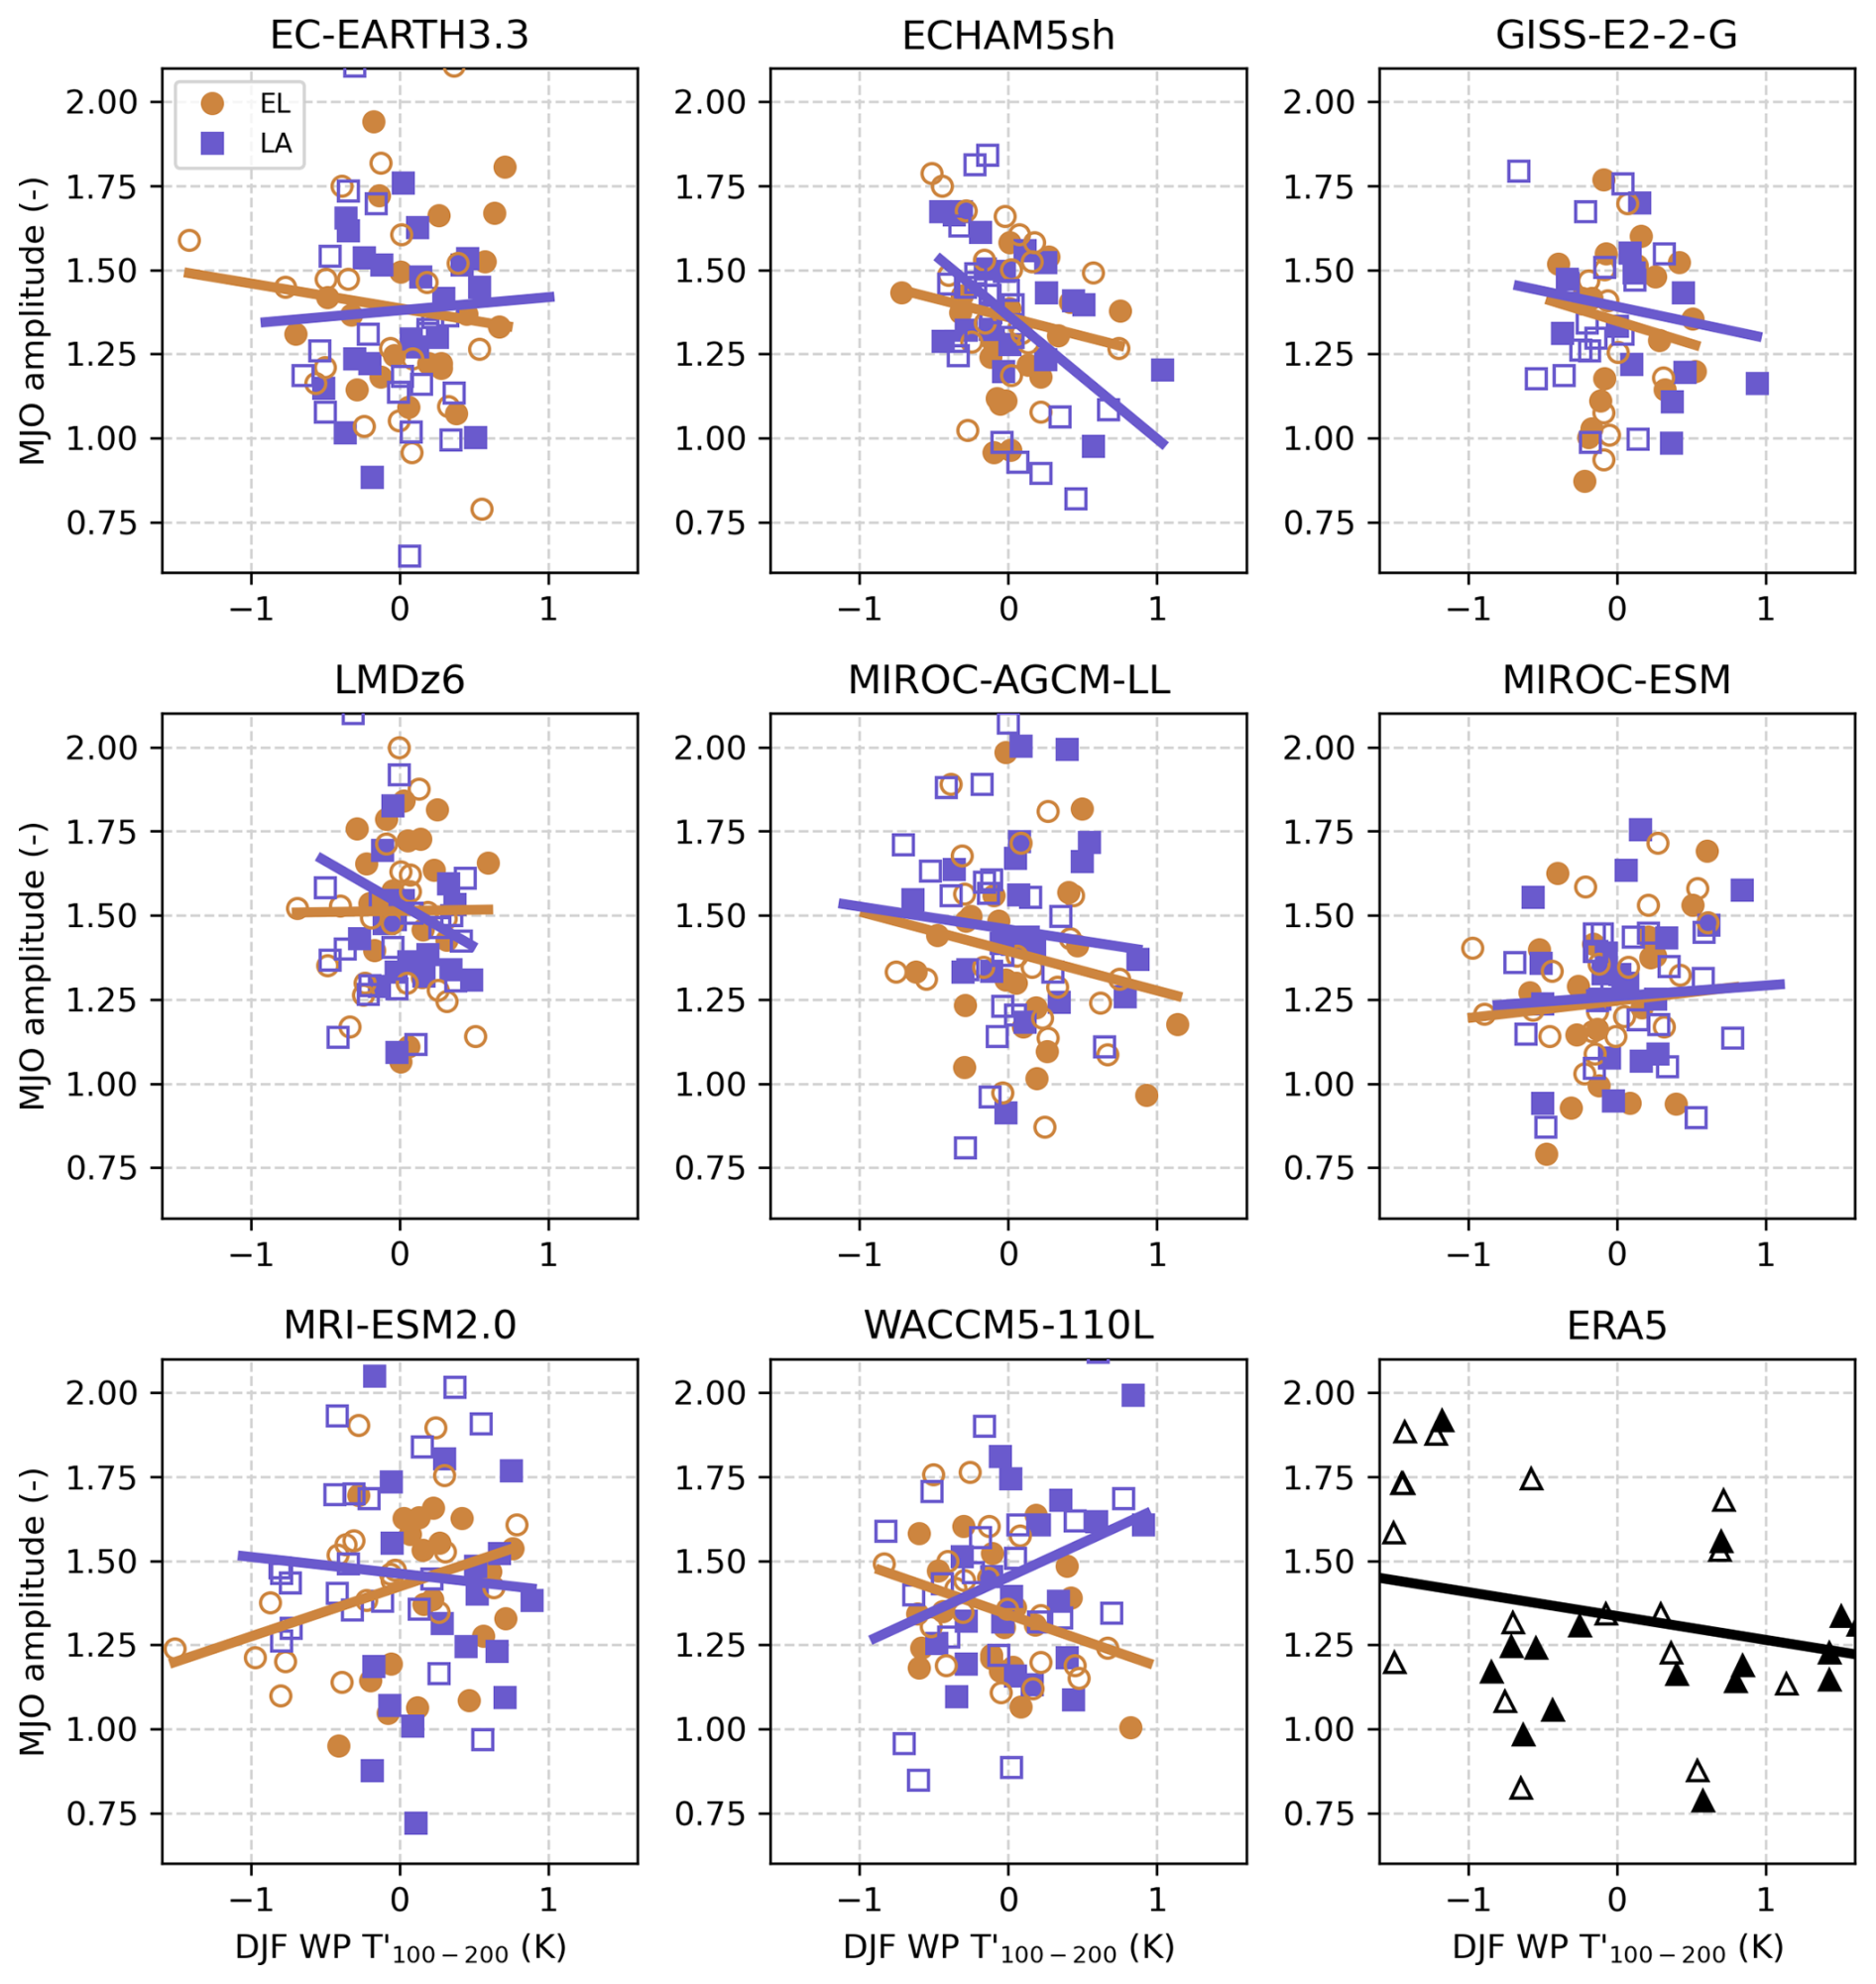
Figure 8Scatter plot of warm-pool averaged (10° S–10° N, 45° E–180° E) tropopause stability anomalies (100 hPa minus 200 hPa temperature) versus December–February MJO amplitude. Lines represent the slope of the regression line during El Niño (orange) or La Niña (purple). Easterly and westerly QBO phases, which are delineated by the sign of the December–February 5° S–5° N 50 hPa zonal mean zonal-wind, are denoted by open and filled markers, respectively.
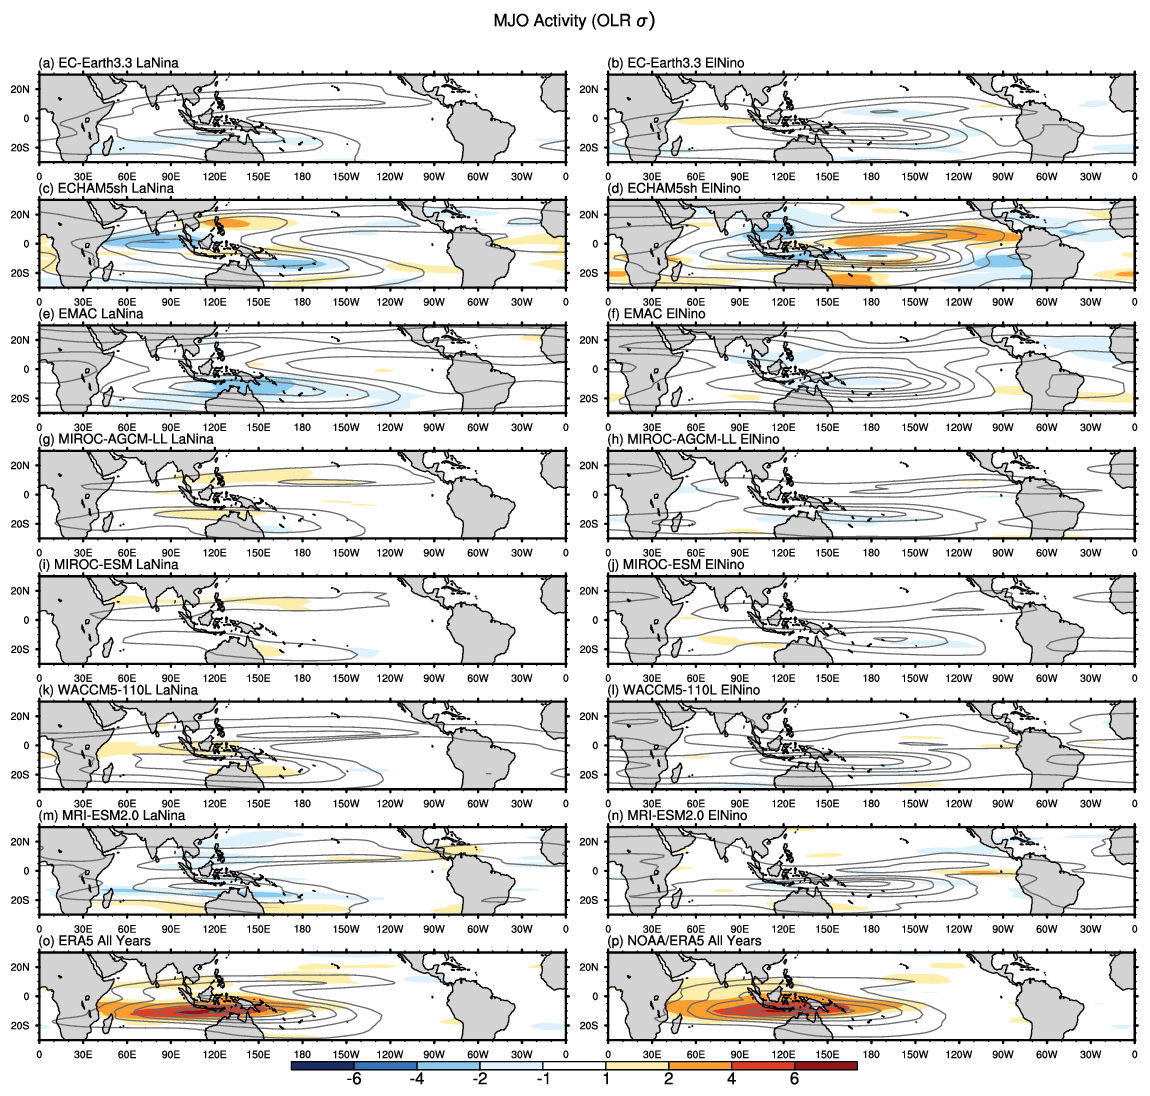
Figure 9Gray contours show the MJO activity defined as the standard deviation of MJO-filtered OLR for each model and ENSO phase, as well as for ERA5 OLR (o) and NOAA OLR (p). The color-filled contours show the MJO-QBO relationship as the difference in MJO activity for the eastward minus westward 50 hPa QBO phases for each model and using the ERA5 wind in panels (o) and (p).
To further evaluate the representation of QBO-MJO coupling in the models, Fig. 9 presents the effect of QBO phase on MJO activity (see Methods). As shown in previous studies (e.g., Kim et al., 2020), the models do not capture the observed QBO-MJO relationship, which has maximum signal over the maritime continent region (Fig. 9m) illustrating the enhancement of MJO activity during easterly QBO phase. With La Niña forcing, MIROC-AGCM-LL and WACCM5-110L show a weak positive signal over the Maritime Continent (Fig. 9g, k), however EC-EARTH3.3, ECHAM5sh, and EMAC exhibit rather different responses. In MIROC models, the MJO activity is further shifted off-equator, possibly hampering any QBO control on MJO convection. No change in the MJO activity by QBO phase is evident in the El Niño simulations either, except for some negative signal in the central and eastern Pacific in ECHAM5sh, which may be due to an irregular QBO in this experiment (Kawatani et al., 2025). There is, however, a clear eastward shift of the MJO activity towards the Pacific during El Niño, corroborating the observational work of Kessler (2001) and the climate model based study of Tam and Lau (2005).
The observed interannual variability of the MJO is influenced by multiple parts of the climate system. Due to their impact on the tropical troposphere and prominent fluctuations at interannual timescales, ENSO and the QBO are known drivers of the MJO's year to year variability, however it is difficult to definitively isolate their influence on the MJO because of how short and noisy the observational record is (Randall et al., 2023). Building on previous work, our aim here is to evaluate the extent to which model behavior is consistent with previously reported ENSO-MJO relationships by analyzing the representation of the MJO in nine climate models forced by prescribed perpetual El Niño and La Niña conditions, each with a spontaneously generated QBO. While the imposed SST anomalies represent an upper bound for the observed record, they are relevant given the projected intensity increase of ENSO extremes.
Although the models exhibit difficulties simulating the MJO, several previously reported effects of the ENSO phase on the MJO are corroborated by this coordinated set of experiments. These effects include faster propagation of the MJO during El Niño versus slower propagation during La Niña, manifesting as shorter and longer lifetimes, respectively, stronger amplitude of the MJO during El Niño, and east-west shifting of the MJO timescale variance towards the east Pacific during El Niño and towards the west Pacific and Indian Ocean during La Niña.
It is likely that the high-amplitude SST forcings used here, particularly the amplified El Niño forcing, contribute to the magnitude of these ENSO associated MJO changes, consistent with prior work linking exceptionally warm Pacific SSTs to enhanced or farther-east MJO propagation (e.g., Marshall et al., 2016). To assess this sensitivity to ENSO amplitude, in one analysis we compare a broad measure of MJO quality and propagation, the MJO E W ratio, between the perpetual ENSO simulations and each model's 1979–2009 AMIP simulations, the latter of which are more representative of typical ENSO amplitudes. Across models, the amplified El Niño forcing increases the E W ratio relative to La Niña, shifting it toward the upper tail of the AMIP-based internal variability distribution and indicating more robust eastward MJO propagation. All perpetual ENSO E W still ratios remain within the spectrum of their AMIP-based values, underscoring that the modeled responses, while produced by extreme forcings, are consistent with how the MJO behaves under normal SSTs. For GPCP and ERA5, however, their composite El Niño and La Niña MJO E W ratios sit centrally within the distribution of sampling variability (Fig. 4a), which supports Slingo et al. (1999) and Hendon et al. (1999)'s conclusion that ENSO does not strongly modulate seasonal-mean MJO activity. Thus, the ENSO-MJO sensitivity expressed in the models is less clearly present in observations, implying either reduced sensitivity in nature or an exaggerated response to the imposed SST anomalies.
Table 2The number of MJO events, their mean lifetimes and standard errors (reported in parentheses), and their mean amplitudes given either perpetual El Niño or La Niña conditions in a model. An asterisk (*) next to a model name indicates that the RMMs were retrieved using only 250 and 850 hPa zonal wind. Different from the models, for ERA5, MJO event statistics are calculated using 8 El Niño and 6 La Niña winters subsampled from the entire 1959–2022 RMM record.
Beyond the E W ratio, other indicators of MJO activity demonstrate strong responses to ENSO forcing in these simulations, differing from these studies. Hendon et al. (1999) found that increased MJO activity coincides with an increased number of MJO events and enhanced intraseasonal convective activity around the Maritime Continent. While these attributes of the MJO were largely insensitive to SSTs in their study, the models here unambiguously simulate more events in their perpetual El Niño simulation (Table 2), which are of stronger MJO activity than their La Niña equivalents (Fig. 9). We suspect that the distinction between our results and previous research is related to the timescale over which the oceanic component of ENSO modulates the atmosphere. Recent studies show that while the likelihood of MJO occurrence and its propagation speed are only weakly correlated with tropical intraseasonally filtered SSTs, they are strongly correlated with low-frequency (e.g., > 90 d) SSTs (Suematsu and Miura, 2018, 2022). In light of this and our use of a simplified climate system in which smoothed monthly SSTs are prescribed, intraseasonal and interannual SST fluctuations are explicitly ignored, and the downward impact of the MJO on intraseasonal SSTs (Zhang and Gottschalk, 2002; Hendon et al., 2007; Newman et al., 2009) is not simulated, we deduce that the different basic state circulations set up by the indefinite ENSO forcings enables distinct MJOs. This interpretation of the low-frequency SSTs as an important modulator of the MJO aligns with studies which have attributed variability in the MJO's propagation to ENSO (Wei and Ren, 2019; Wang et al., 2019; Dasgupta et al., 2021; Back et al., 2024) as well as studies employing climate models in which MJO propagation can be modulated by changing the horizontal gradients of the background SST field (Kang et al., 2013; Jiang et al., 2020).
We note that, besides SST amplitude, the representation of MJOs in models appears to be particularly sensitive to convective schemes, as discussed by Rind et al. (2020) for GISS, by Park et al. (2019) for WACCM, by Miura et al. (2012) for MIROC and Holt et al. (2020) for other Phase 1 QBOi models. The impact of the convective scheme, for example, appears outsized compared to horizontal resolution, which is finely resolved in EC-EARTH3.3, MIROC-AGCM-LL, MRI-ESM2.0, and WACCM, none of which are exceptional at reproducing the MJO's wavenumber frequency spectra or E W ratios. Moreover, models within the same family (MIROC-based, ECHAM-based) exhibit similar MJO spectra (Figs. 2, 4), despite having intra-family differences in horizontal and vertical resolution (Table 2; Holt et al., 2020, their Fig. 18). As shown by Orbe et al. (2020) for the WACCM and GISS models, refinement of key parameterization has potential to improve simulated MJOs.
As in the observational record, it is possible that aliasing from the QBO is superimposed on what are thought to be MJO changes due to ENSO. However, we find that the climate models considered here show little evidence of QBO-MJO coupling. This may be due to various factors, such as biases in the descent of the QBO, and the location and characteristics of tropical convection, which appears to be less organized in some of the models compared to GPCP. While this limits our ability to diagnose the mechanisms linking the QBO and MJO, it suggests that, in these experiments, the MJO changes we detect are primarily driven by the ENSO forcings. Experiments with specified rather than internally generated QBO aspects can help understanding the processes at play, which remain elusive (Martin et al., 2023; Huang et al., 2023). One speculative reason for the missing QBO-MJO signal is the representation of upper tropospheric Kelvin waves. Observations show that during EQBO, the Kelvin wave associated with the MJO penetrates higher into the lower stratosphere, coinciding with an eastward-tilting cold anomaly in the UTLS (Hendon and Abhik, 2018). We find a similar dry Kelvin wave signature in our ERA5 El Niño minus La Niña MJO vertical structure composite, but in models, the UTLS wave structure is much more coarsely resolved (Fig. 6). Such deficiencies, perhaps linked to vertical resolution (Holt et al., 2020, their Fig. 18a), lower-stratospheric wind biases that develop in the absence of sufficient QBO descent (Fig. 7c), or perhaps just weak MJOs, may weaken this dry Kelvin wave component and, in turn, suppress QBO–MJO interaction.
Compared with the La Niña simulations, all El Niño simulations include amplified Kelvin waves whereas equatorial Rossby waves intensify in the presence of perpetual La Niña conditions. Consistent with the reported relationship between the these waves and the MJO (Wei and Ren, 2019), all models simulate faster MJO propagation in their El Niño simulation. This is further supported by the MJO diversity analysis, which reveals that models reproduce the observed fast and standing MJO archetype OLR Hovmöllers well in the presence of perpetual El Niño and La Niña conditions, respectively. In addition, the MJO's phase 3/4 vertical structures highlight that lower tropospheric easterlies do intensify to the east of the MJO's major convection during El Niño across most models, which we interpret to result from the intensification of the Kelvin wave.
The strengthening of model equatorial Rossby and Kelvin waves under La Niña and El Niño forcing, respectively, is broadly consistent with observational studies (Wei and Ren, 2019; Wang et al., 2019), yet the striking uniformity of these responses across models and underlying mechanisms are not fully understood. Both waves exhibit substantial longitudinal variation in observations, and their behavior depends on multiple aspects not considered in detail here, including seasonal-mean convection, ambient zonal wind, and the extent to which extratropical planetary waves can intrude into the tropics (Yang et al., 2023). These factors, in turn, are further shaped by the model-dependent tropospheric responses to the internally generated QBOs (Naoe et al., 2025). Because these degrees of freedom are not isolated in our study, we cannot yet diagnose with confidence why the models produce such consistent equatorial Rossby and Kelvin wave responses to the ENSO forcings. Nevertheless, the fact that this coherence emerges despite these unconstrained influences underscores the robustness of the simulated wave responses and motivates a closer examination of the waves in subsequent work.
While the modeled relationship between Kelvin waves, equatorial Rossby waves, and ENSO is well supported by previous studies employing empirical data and reanalysis, this is the first time, to the best of our knowledge, that this relationship has been ubiquitously affirmed by a coordinated set of climate model experiments with prescribed strong ENSO forcings. The robustness of this result across models suggests that it is worthwhile considering how these wave responses to ENSO influence other parts of the climate system. For instance, Kelvin waves are a source of resolved wave forcing for the QBO (Baldwin et al., 2001; Taguchi, 2010; Pahlavan et al., 2021) and more rapid descent of the QBO's westerly shear zones during El Niño in observations has been attributed to their intensification (Das and Pan, 2016). The periodicity of the QBO in the El Niño simulations is in fact shorter than in the La Niña simulations across all models considered here (Kawatani et al., 2025), however, the extent to which Kelvin waves are responsible for this as opposed to other waves (e.g., Kawatani et al., 2019), is yet to be quantified across all of the models. The convectively coupled wave responses presented here may also be relevant for better understanding of the observed ENSO diversity. El Niño events vary in type and intensity due to the influence of westerly wind bursts, which introduce asymmetry and irregularity into ENSO's phase changes (Chen et al., 2015). Westerly wind bursts are more frequent during the convective phases of equatorial Rossby waves and the MJO, especially strong MJOs (Puy et al., 2016). Hence, the atmospheric responses to ENSO, such as the amplifications of the MJO during El Niño (Figs. 2–4) and of the convectively coupled Rossby wave during La Niña, have a pathway to influence ENSO's oceanic component.
The code used for the wavenumber-frequency analysis is publicly available through the National Center for Atmospheric Research (NCAR) Command Language (NCL): https://www.ncl.ucar.edu/Applications/mjoclivar.shtml (last access: 18 July 2025). A reproduction of NCL's Wheeler-Kiladis (Wheeler and Kiladis, 1999) routine in Python is available here: https://github.com/brianpm/wavenumber_frequency (last access: 30 November 2025). Python code, which assesses QBO morphology is available here: https://github.com/NOAA-GFDL/MDTF-diagnostics/blob/main/diagnostics/stc_qbo_enso/stc_qbo_enso.py (last access: 18 July 2025).
Storage for the QBOi multi-model data set is provided by the Centre for Environmental Data Analysis (CEDA) whose data and processing service is called JASMIN. Interested users must obtain a JASMIN login account and take the necessary steps to access the QBOi group workspace within JASMIN, which contains the perpetual ENSO simulations. Certain derived model products (e.g., the MJO RMMs) may be made available upon request.
The supplement related to this article is available online at https://doi.org/10.5194/wcd-7-317-2026-supplement.
DE, FS, JC, SYB, CO, and JR contributed to the conceptualization of this study. DE, FS, JC, and SYB performed the data analyses and produced the figures and tables. All authors contributed to the review and editing of this manuscript.
The contact author has declared that none of the authors has any competing interests.
Publisher's note: Copernicus Publications remains neutral with regard to jurisdictional claims made in the text, published maps, institutional affiliations, or any other geographical representation in this paper. The authors bear the ultimate responsibility for providing appropriate place names. Views expressed in the text are those of the authors and do not necessarily reflect the views of the publisher.
The authors appreciate the helpful suggestions and questions from two anonymous reviewers and the editor, whose involvement improved this manuscript. Dillon Elsbury appreciates helpful discussions with John Albers, Juliana Dias, George Kiladis, Matthew Newman, Brandon Wolding, and Amy Butler. The ECHAM5sh simulations were performed thanks to an ECMWF Special Project awarded to Federico Serva. The numerical simulations of MIROC models were performed using the Earth Simulator. The GFD-DENNOU Library and GrADS were used to draw the figures. The authors gratefully acknowledge the UK Centre for Environmental Data Analysis for providing archival and analysis resources for the QBOi multimodel dataset.
Dillon Elsbury was supported in part by NOAA Cooperative Agreement NA22OAR4320151. This research has been supported by the Japan Society for the Promotion of Science (JSPS KAKENHI; grant nos. JP22K18743, JP22H01303, JP23K22574, JP22H04493, JP24K07140, and JP24K00710); the Environmental Restoration and Conservation Agency (Environment Research and Technology Development Fund; grant no. JPMEERF20242001); the Ministry of Education, Culture, Sports, Science, and Technology (MEXT; SENTAN program; grant nos. JPMXD0722681344 and JPMXD0722680395). Portions of this study were supported by the Regional and Global Model Analysis (RGMA) component of the Earth and Environmental System Modeling Program of the U.S. Department of Energy's Office of Biological & Environmental Research (BER) under Lawrence Livermore National Lab subaward DE-AC52-07NA27344, Lawrence Berkeley National Lab subaward DE-AC02-05CH11231, and Pacific Northwest National Lab subaward DE-AC05-76RL01830. This work was also supported by the National Science Foundation (NSF) National Center for Atmospheric Research, which is a major facility sponsored by NSF under Cooperative Agreement No. 1852977. Seung-Yoon Back and Seok-Woo Son were supported by Korea Environment Industry & Technology Institute (KEITI) through “Climate Change R&D Project for New Climate Regime”, funded by Korea Ministry of Environment (MOE) (2022003560004). Clara Orbe was supported by the NASA Modeling, Analysis and Prediction program for support for climate modeling at NASA Goddard Institute for Space Studies, as well as support for computing resources from the NASA High-End Computing (HEC) Program through the NASA Center for Climate Simulation at Goddard Space Flight Center. Neal Butchart was funded by the Met Office Climate Science for Service Partnership (CSSP) China project under the International Science Partnerships Fund (ISPF). Javier García-Serrano has been supported by the Spanish DYNCAST project (CNS2022-135312). Tobias Kerzenmacher and Stefan Versick were supported by the state of Baden-Württemberg through bwHPC. Hiroaki Naoe and Kohei Yoshida were supported by JSPS KAKENHI (JP24K00710) and Kohei Yoshida was supported by JSPS KAKENHI (JP24K00706). Shingo Watanabe was supported by MEXT-Program for the advanced studies of climate change projection (SENTAN) Grant Number JPMXD0722681344.
The contact author has declared that none of the authors has any competing interests.
This paper was edited by Daniela Domeisen and reviewed by two anonymous referees.
Adler, R., Wang, J.-J., Sapiano, M., Huffman, G., Bolvin, D., Nelkin, E., and NOAA CDR Program: Global Precipitation Climatology Project (GPCP) Climate Data Record (CDR), Version 1.3 (Daily) [1996–2022], NOAA National Centers for Environmental Information [data set], https://doi.org/10.7289/V5RX998Z, 2017.
Ahn, M.-S., Kim, D., Sperber, K. R., Kang, I.-S., Maloney, E., Waliser, D., and Hendon, H.: MJO simulation in CMIP5 climate models: MJO skill metrics and process-oriented diagnosis, Clim. Dynam., 49, 4023–4045, https://doi.org/10.1007/s00382-017-3558-4, 2017.
Ahn, M., Kim, D., Kang, D., Lee, J., Sperber, K. R., Gleckler, P. J., Jiang, X., Ham, Y., and Kim, H.: MJO Propagation Across the Maritime Continent: Are CMIP6 Models Better Than CMIP5 Models?, Geophys. Res. Lett., 47, e2020GL087250, https://doi.org/10.1029/2020GL087250, 2020.
Back, S.-Y., Kim, D., and Son, S.-W.: MJO Diversity in CMIP6 Models, J. Climate, 37, 4835–4850, https://doi.org/10.1175/JCLI-D-23-0656.1, 2024.
Baldwin, M. P., Gray, L. J., Dunkerton, T. J., Hamilton, K., Haynes, P. H., Randel, W. J., Holton, J. R., Alexander, M. J., Hirota, I., Horinouchi, T., Jones, D. B. A., Kinnersley, J. S., Marquardt, C., Sato, K., and Takahashi, M.: The quasi-biennial oscillation, Rev. Geophys., 39, 179–229, https://doi.org/10.1029/1999RG000073, 2001.
Bechtold, P., Semane, N., Lopez, P., Chaboureau, J.-P., Beljaars, A., and Bormann, N.: Representing Equilibrium and Nonequilibrium Convection in Large-Scale Models, J. Atmos. Sci., 71, 734–753, https://doi.org/10.1175/JAS-D-13-0163.1, 2014.
Berrington, A. H., Sakaeda, N., Dias, J., and Kiladis, G. N.: Relationships Between the Eastward Propagation of the Madden-Julian Oscillation and Its Circulation Structure, J. Geophys. Res.-Atmos., 127, e2021JD035806, https://doi.org/10.1029/2021JD035806, 2022.
Bushell, A. C., Anstey, J. A., Butchart, N., Kawatani, Y., Osprey, S. M., Richter, J. H., Serva, F., Braesicke, P., Cagnazzo, C., Chen, C. -C., Chun, H. -Y., Garcia, R. R., Gray, L. J., Hamilton, K., Kerzenmacher, T., Kim, Y. -H., Lott, F., McLandress, C., Naoe, H., Scinocca, J., Smith, A. K., Stockdale, T. N., Versick, S., Watanabe, S., Yoshida, K., and Yukimoto, S.: Evaluation of the Quasi-Biennial Oscillation in global climate models for the SPARC QBO-initiative, Q. J. Roy. Meteor. Soc., 148, 1459–1489, https://doi.org/10.1002/qj.3765, 2022.
Butchart, N., Anstey, J. A., Hamilton, K., Osprey, S., McLandress, C., Bushell, A. C., Kawatani, Y., Kim, Y.-H., Lott, F., Scinocca, J., Stockdale, T. N., Andrews, M., Bellprat, O., Braesicke, P., Cagnazzo, C., Chen, C.-C., Chun, H.-Y., Dobrynin, M., Garcia, R. R., Garcia-Serrano, J., Gray, L. J., Holt, L., Kerzenmacher, T., Naoe, H., Pohlmann, H., Richter, J. H., Scaife, A. A., Schenzinger, V., Serva, F., Versick, S., Watanabe, S., Yoshida, K., and Yukimoto, S.: Overview of experiment design and comparison of models participating in phase 1 of the SPARC Quasi-Biennial Oscillation initiative (QBOi), Geosci. Model Dev., 11, 1009–1032, https://doi.org/10.5194/gmd-11-1009-2018, 2018.
Chen, D., Lian, T., Fu, C., Cane, M. A., Tang, Y., Murtugudde, R., Song, X., Wu, Q., and Zhou, L.: Strong influence of westerly wind bursts on El Niño diversity, Nat. Geosci., 8, 339–345, https://doi.org/10.1038/ngeo2399, 2015.
Chikira, M. and Sugiyama, M.: A Cumulus Parameterization with State-Dependent Entrainment Rate. Part I: Description and Sensitivity to Temperature and Humidity Profiles, J. Atmos. Sci., 67, 2171–2193, https://doi.org/10.1175/2010JAS3316.1, 2010.
Das, U. and Pan, C. J.: Equatorial atmospheric Kelvin waves during El Niño episodes and their effect on stratospheric QBO, Sci. Total Environ., 544, 908–918, https://doi.org/10.1016/j.scitotenv.2015.12.009, 2016.
Dasgupta, P., Roxy, M. K., Chattopadhyay, R., Naidu, C. V., and Metya, A.: Interannual variability of the frequency of MJO phases and its association with two types of ENSO, Sci. Rep., 11, 11541, https://doi.org/10.1038/s41598-021-91060-2, 2021.
Densmore, C. R., Sanabia, E. R., and Barrett, B. S.: QBO Influence on MJO Amplitude over the Maritime Continent: Physical Mechanisms and Seasonality, Mon. Weather Rev., 147, 389–406, https://doi.org/10.1175/MWR-D-18-0158.1, 2019.
Emanuel, K. A.: A Scheme for Representing Cumulus Convection in Large-Scale Models, J. Atmos. Sci., 48, 2313–2329, https://doi.org/10.1175/1520-0469(1991)048<2313:ASFRCC>2.0.CO;2, 1991.
Emori, S., Nozawa, T., Numaguti, A., and Uno, I.: Importance of Cumulus Parameterization for Precipitation Simulation over East Asia in June, J. Meteorol. Soc. Jpn., 79, 939–947, https://doi.org/10.2151/jmsj.79.939, 2001.
Fernandes, L. G. and Grimm, A. M.: ENSO Modulation of Global MJO and Its Impacts on South America, J. Climate, 36, 7715–7738, https://doi.org/10.1175/JCLI-D-22-0781.1, 2023.
Gehne, M., Hamill, T. M., Kiladis, G. N., and Trenberth, K. E.: Comparison of Global Precipitation Estimates across a Range of Temporal and Spatial Scales, J. Climate, 29, 7773–7795, https://doi.org/10.1175/JCLI-D-15-0618.1, 2016.
Hendon, H. H. and Abhik, S.: Differences in Vertical Structure of the Madden-Julian Oscillation Associated With the Quasi-Biennial Oscillation, Geophys. Res. Lett., 45, 4419–4428, https://doi.org/10.1029/2018GL077207, 2018.
Ham, S. and Hong, S.-Y.: Sensitivity of simulated intraseasonal oscillation to four convective parameterization schemes in a coupled climate model, Asia-Pacific, J. Atmos. Sci., 49, 483–496, https://doi.org/10.1007/s13143-013-0043-9, 2013.
Hansen, F., Matthes, K., and Gray, L. J.: Sensitivity of stratospheric dynamics and chemistry to QBO nudging width in the chemistry-climate model WACCM, J. Geophys. Res.-Atmos., 118, 10464–10474, https://doi.org/10.1002/jgrd.50812, 2013.
Hendon, H. H. and Salby, M. L.: The Life Cycle of the Madden–Julian Oscillation, J. Atmos. Sci., 51, 2225–2237, https://doi.org/10.1175/1520-0469(1994)051<2225:TLCOTM>2.0.CO;2, 1994.
Hendon, H. H., Zhang, C., and Glick, J. D.: Interannual Variation of the Madden–Julian Oscillation during Austral Summer, J. Climate, 12, 2538–2550, https://doi.org/10.1175/1520-0442(1999)012<2538:IVOTMJ>2.0.CO;2, 1999.
Hendon, H. H., Wheeler, M. C., and Zhang, C.: Seasonal Dependence of the MJO–ENSO Relationship, J. Climate, 20, 531–543, https://doi.org/10.1175/JCLI4003.1, 2007.
Henley, B. J., Gergis, J., Karoly, D. J., Power, S., Kennedy, J., and Folland, C. K.: A Tripole Index for the Interdecadal Pacific Oscillation, Clim. Dynam., 45, 3077–3090, https://doi.org/10.1007/s00382-015-2525-1, 2015.
Hourdin, F., Grandpeix, J.-Y., Rio, C., Bony, S., Jam, A., Cheruy, F., Rochetin, N., Fairhead, L., Idelkadi, A., Musat, I., Dufresne, J.-L., Lahellec, A., Lefebvre, M.-P., and Roehrig, R.: LMDZ5B: the atmospheric component of the IPSL climate model with revisited parameterizations for clouds and convection, Clim. Dynam., 40, 2193–2222, https://doi.org/10.1007/s00382-012-1343-y, 2013.
Huang, K., Richter, J. H., and Pegion, K. V.: Captured QBO-MJO Connection in a Subseasonal Prediction System, Geophys. Res. Lett., 50, e2022GL102648, https://doi.org/10.1029/2022GL102648, 2023.
Huffman, G. J., Adler, R. F., Morrissey, M. M., Bolvin, D. T., Curtis, S., Joyce, R., McGavock, B., and Susskind, J: Global Precipitation at One-Degree Daily Resolution from Multi-Satellite Observations, J. Hydrometeorol., 2, 36–50, https://doi.org/10.1175/1525-7541(2001)002<0036:GPAODD>2.0.CO;2, 2001
Jiang, X., Waliser, D. E., Xavier, P. K., Petch, J., Klingaman, N. P., Woolnough, S. J., Guan, B., Bellon, G., Crueger, T., DeMott, C., Hannay, C., Lin, H., Hu, W., Kim, D., Lappen, C., Lu, M., Ma, H., Miyakawa, T., Ridout, J. A., Schubert, S. D., Scinocca, J., Seo, K., Shindo, E., Song, X., Stan, C., Tseng, W., Wang, W., Wu, T., Wu, X., Wyser, K., Zhang, G. J., and Zhu, H.: Vertical structure and physical processes of the Madden-Julian oscillation: Exploring key model physics in climate simulations, J. Geophys. Res.-Atmos., 120, 4718–4748, https://doi.org/10.1002/2014JD022375, 2015.
Jiang, X., Maloney, E., and Su, H.: Large-scale controls of propagation of the Madden-Julian Oscillation, npj Climate and Atmospheric Science, 3, 29, https://doi.org/10.1038/s41612-020-00134-x, 2020.
Jin, D., Kim, D., Son, S.-W., and Oreopoulos, L.: QBO deepens MJO convection, Nat. Commun., 14, 4088, https://doi.org/10.1038/s41467-023-39465-7, 2023.
Kang, I.-S., Liu, F., Ahn, M.-S., Yang, Y.-M., and Wang, B.: The Role of SST Structure in Convectively Coupled Kelvin–Rossby Waves and Its Implications for MJO Formation, J. Climate, 26, 5915–5930, https://doi.org/10.1175/JCLI-D-12-00303.1, 2013.
Kawatani, Y., Hamilton, K., Sato, K., Dunkerton, T. J., Watanabe, S., and Kikuchi, K.: ENSO Modulation of the QBO: Results from MIROC Models with and without Nonorographic Gravity Wave Parameterization, J. Atmos. Sci., 76, 3893–3917, https://doi.org/10.1175/JAS-D-19-0163.1, 2019.
Kawatani, Y., Hamilton, K., Watanabe, S., Taguchi, M., Serva, F., Anstey, J. A., Richter, J. H., Butchart, N., Orbe, C., Osprey, S. M., Naoe, H., Elsbury, D., Chen, C.-C., García-Serrano, J., Glanville, A., Kerzenmacher, T., Lott, F., Palmeiro, F. M., Park, M., Versick, S., and Yoshida, K.: QBOi El Niño–Southern Oscillation experiments: overview of the experimental design and ENSO modulation of the QBO, Weather Clim. Dynam., 6, 1045–1073, https://doi.org/10.5194/wcd-6-1045-2025, 2025.
Kelley, M., Schmidt, G. A., Nazarenko, L. S., Bauer, S. E., Ruedy, R., Russell, G. L., Ackerman, A. S., Aleinov, I., Bauer, M., Bleck, R., Canuto, V., Cesana, G., Cheng, Y., Clune, T. L., Cook, B. I., Cruz, C. A., Del Genio, A. D., Elsaesser, G. S., Faluvegi, G., Kiang, N. Y., Kim, D., Lacis, A. A., Leboissetier, A., LeGrande, A. N., Lo, K. K., Marshall, J., Matthews, E. E., McDermid, S., Mezuman, K., Miller, R. L., Murray, L. T., Oinas, V., Orbe, C., García-Pando, C. P., Perlwitz, J. P., Puma, M. J., Rind, D., Romanou, A., Shindell, D. T., Sun, S., Tausnev, N., Tsigaridis, K., Tselioudis, G., Weng, E., Wu, J., and Yao, M.: GISS-E2.1: Configurations and Climatology, J. Adv. Model. Earth Sy., 12, e2019MS002025, https://doi.org/10.1029/2019MS002025, 2020.
Kessler, W. S.: EOF Representations of the Madden–Julian Oscillation and Its Connection with ENSO, J. Climate, 14, 3055–3061, https://doi.org/10.1175/1520-0442(2001)014<3055:EROTMJ>2.0.CO;2, 2001.
Kiladis, G. N., Wheeler, M. C., Haertel, P. T., Straub, K. H., and Roundy, P. E.: Convectively coupled equatorial waves, Rev. Geophys., 47, RG2003, https://doi.org/10.1029/2008RG000266, 2009.
Kim, D., Xavier, P., Maloney, E., Wheeler, M., Waliser, D., Sperber, K., Hendon, H., Zhang, C., Neale, R., Hwang, Y.-T., and Liu, H.: Process-Oriented MJO Simulation Diagnostic: Moisture Sensitivity of Simulated Convection, J. Climate, 27, 5379–5395, https://doi.org/10.1175/JCLI-D-13-00497.1, 2014.
Kim, H., Caron, J. M., Richter, J. H., and Simpson, I. R.: The Lack of QBO-MJO Connection in CMIP6 Models, Geophys. Res. Lett., 47, e2020GL087295, https://doi.org/10.1029/2020GL087295, 2020.
Kim, J., Grise, K. M., and Son, S.-W.: Thermal characteristics of the cold-point tropopause region in CMIP5 models, J. Geophys. Res.-Atmos., 118, 8827–8841, 2013.
Klotzbach, P., Abhik, S., Hendon, H. H., Bell, M., Lucas, C., G. Marshall, A., and Oliver, E. C. J.: On the emerging relationship between the stratospheric Quasi-Biennial oscillation and the Madden-Julian oscillation, Sci. Rep., 9, 2981, https://doi.org/10.1038/s41598-019-40034-6, 2019.
Kumar, V., Yoden, S., and Hitchman, M. H.: QBO and ENSO Effects on the Mean Meridional Circulation, Polar Vortex, Subtropical Westerly Jets, and Wave Patterns During Boreal Winter, J. Geophys. Res.-Atmos., 127, e2022JD036691, https://doi.org/10.1029/2022JD036691, 2022.
Lawrence, Z. D., Elsbury, D., Butler, A. H., Perlwitz, J., Albers, J. R., Ciasto, L. M., and Ray, E.: Evaluation of Processes Related to Stratosphere–Troposphere Coupling in GEFSv12 Subseasonal Hindcasts, Mon. Weather Rev., 151, 1735–1755, https://doi.org/10.1175/MWR-D-22-0283.1, 2023.
Liebmann, B. and Smith, C. A.: Description of a Complete (Interpolated) Outgoing Longwave Radiation Dataset, B. Am. Meteorol. Soc., 77, 1274–1278, https://doi.org/10.1175/1520-0477-77.6.1274, 1996.
Lim, Y. and Son, S.: QBO-MJO Connection in CMIP5 Models, J. Geophys. Res.-Atmos., 125, e2019JD032157, https://doi.org/10.1029/2019JD032157, 2020.
Lin, H.: The Madden-Julian Oscillation, Atmos. Ocean, 60, 338–359, https://doi.org/10.1080/07055900.2022.2072267, 2022.
Madden, R. A. and Julian, P. R.: Observations of the 40–50-Day Tropical Oscillation – A Review, Mon. Weather Rev., 122, 814–837, https://doi.org/10.1175/1520-0493(1994)122<0814:OOTDTO>2.0.CO;2, 1994.
Martin, Z., Son, S.-W., Butler, A., Hendon, H., Kim, H., Sobel, A., Yoden, S., and Zhang, C.: The influence of the Quasi-Biennial Oscillation on the Madden-Julian Oscillation, Nature Reviews Earth & Environment, 2, 477–489, https://doi.org/10.1038/s43017-021-00173-9, 2021.
Martin, Z. K., Simpson, I. R., Lin, P., Orbe, C., Tang, Q., Caron, J. M., Chen, C., Kim, H., Leung, L. R., Richter, J. H., and Xie, S.: The Lack of a QBO-MJO Connection in Climate Models With a Nudged Stratosphere, J. Geophys. Res.-Atmos., 128, e2023JD038722, https://doi.org/10.1029/2023JD038722, 2023.
Matsuno, T.: Quasi-Geostrophic Motions in the Equatorial Area, J. Meteorol. Soc. Jpn., 44, 25–43, https://doi.org/10.2151/jmsj1965.44.1_25, 1966.
Miura, H., Maeda, T., and Kimoto, M.: A Comparison of the Madden-Julian Oscillation Simulated by Different Versions of the MIROC Climate Model, SOLA, 8, 165–169, https://doi.org/10.2151/sola.2012-040, 2012.
Nakamura, Y. and Takayabu, Y. N.: Convective Couplings with Equatorial Rossby Waves and Equatorial Kelvin Waves. Part I: Coupled Wave Structures, J. Atmos. Sci., 79, 247–262, https://doi.org/10.1175/JAS-D-21-0080.1, 2022.
Naoe, H., García-Franco, J. L., Park, C.-H., Rodrigo, M., Palmeiro, F. M., Serva, F., Taguchi, M., Yoshida, K., Anstey, J. A., García-Serrano, J., Son, S.-W., Kawatani, Y., Butchart, N., Hamilton, K., Chen, C.-C., Glanville, A., Kerzenmacher, T., Lott, F., Orbe, C., Osprey, S., Park, M., Richter, J. H., Versick, S., and Watanabe, S.: QBOi El Niño–Southern Oscillation experiments: teleconnections of the QBO, Weather Clim. Dynam., 6, 1419–1442, https://doi.org/10.5194/wcd-6-1419-2025, 2025.
Newman, M., Sardeshmukh, P. D., and Penland, C.: How Important Is Air–Sea Coupling in ENSO and MJO Evolution?, J. Climate, 22, 2958–2977, https://doi.org/10.1175/2008JCLI2659.1, 2009.
Nordeng, T.-E.: Extended versions of the convective parametrization scheme at ECMWF and their impact on the mean and transient activity of the model in the tropics, ECMWF Technical Memoranda, 206, 41 pp., https://doi.org/10.21957/E34XWHYSW, 1994.
Orbe, C., Van Roekel, L., Adames, Á. F., Dezfuli, A., Fasullo, J., Gleckler, P. J., Lee, J., Li, W., Nazarenko, L., Schmidt, G. A., Sperber, K. R., and Zhao, M.: Representation of Modes of Variability in Six U.S. Climate Models, J. Climate, 33, 7591–7617, https://doi.org/10.1175/JCLI-D-19-0956.1, 2020.
Pahlavan, H. A., Wallace, J. M., Fu, Q., and Kiladis, G. N.: Revisiting the Quasi-Biennial Oscillation as Seen in ERA5. Part II: Evaluation of Waves and Wave Forcing, J. Atmos. Sci., 78, 693–707, https://doi.org/10.1175/JAS-D-20-0249.1, 2021.
Pan, D. and Randall, D. D. A.: A cumulus parameterization with a prognostic closure, Q. J. Roy. Meteor. Soc., 124, 949–981, https://doi.org/10.1002/qj.49712454714, 1998.
Pang, B., Chen, Z., Wen, Z., and Lu, R.: Impacts of two types of El Niño on the MJO during boreal winter, Adv. Atmos. Sci., 33, 979–986, https://doi.org/10.1007/s00376-016-5272-2, 2016.
Pascoe, C. L., Gray, L. J., Crooks, S. A., Juckes, M. N., and Baldwin, M. P.: The quasi-biennial oscillation: Analysis using ERA-40 data, J. Geophys. Res., 110, D08105, https://doi.org/10.1029/2004JD004941, 2005.
Philander, S. G.: El Niño, La Niña, and the southern oscillation, Academic Press, San Diego, 293 pp., ISBN 978-0-12-553235-8, 1990.
Pohl, B. and Matthews, A. J.: Observed Changes in the Lifetime and Amplitude of the Madden–Julian Oscillation Associated with Interannual ENSO Sea Surface Temperature Anomalies, J. Climate, 20, 2659–2674, https://doi.org/10.1175/JCLI4230.1, 2007.
Puy, M., Vialard, J., Lengaigne, M., and Guilyardi, E.: Modulation of equatorial Pacific westerly/easterly wind events by the Madden–Julian oscillation and convectively-coupled Rossby waves, Clim. Dynam., 46, 2155–2178, https://doi.org/10.1007/s00382-015-2695-x, 2016.
Randall, D. A., Tziperman, E., Branson, M. D., Richter, J. H., and Kang, W.: The QBO–MJO Connection: A Possible Role for the SST and ENSO, J. Climate, 36, 6515–6531, https://doi.org/10.1175/JCLI-D-23-0031.1, 2023.
Richter, J. H., Anstey, J. A., Butchart, N., Kawatani, Y., Meehl, G. A., Osprey, S., and Simpson, I. R.: Progress in Simulating the Quasi-Biennial Oscillation in CMIP Models, J. Geophys. Res.-Atmos., 125, e2019JD032362, https://doi.org/10.1029/2019JD032362, 2020.
Rind, D., Jonas, J., Balachandran, N. K., Schmidt, G. A., and Lean, J.: The QBO in two GISS global climate models: 1. Generation of the QBO, J. Geophys. Res.-Atmos., 119, 8798–8824, https://doi.org/10.1002/2014JD021678, 2014.
Rind, D., Orbe, C., Jonas, J., Nazarenko, L., Zhou, T., Kelley, M., Lacis, A., Shindell, D., Faluvegi, G., Romanou, A., Russell, G., Tausnev, N., Bauer, M., and Schmidt, G.: GISS Model E2.2: A Climate Model Optimized for the Middle Atmosphere – Model Structure, Climatology, Variability, and Climate Sensitivity, J. Geophys. Res.-Atmos., 125, e2019JD032204, https://doi.org/10.1029/2019JD032204, 2020.
Roundy, P. E.: The Spectrum of Convectively Coupled Kelvin Waves and the Madden–Julian Oscillation in Regions of Low-Level Easterly and Westerly Background Flow, J. Atmos. Sci., 69, 2107–2111, https://doi.org/10.1175/JAS-D-12-060.1, 2012.
Sakaeda, N., Dias, J., and Kiladis, G. N.: The Unique Characteristics and Potential Mechanisms of the MJO-QBO Relationship, J. Geophys. Res.-Atmos., 125, e2020JD033196, https://doi.org/10.1029/2020JD033196, 2020.
Schenzinger, V., Osprey, S., Gray, L., and Butchart, N.: Defining metrics of the Quasi-Biennial Oscillation in global climate models, Geosci. Model Dev., 10, 2157–2168, https://doi.org/10.5194/gmd-10-2157-2017, 2017.
Schreck, C. J.: Global Survey of the MJO and Extreme Precipitation, Geophys. Res. Lett., 48, e2021GL094691, https://doi.org/10.1029/2021GL094691, 2021.
Serva, F., Anstey, J. A., Bushell, A. C., Butchart, N., Cagnazzo, C., Gray, L. J., Kawatani, Y., Osprey, S. M., Richter, J. H., and Simpson, I. R.: The impact of the QBO on the region of the tropical tropopause in QBOi models: Present-day simulations, Q. J. Roy. Meteor. Soc., 148, 1945–1964, https://doi.org/10.1002/qj.4287, 2022.
Serva, F., Christiansen, B., Davini, P., Von Hardenberg, J., Van Den Oord, G., Reerink, T. J., Wyser, K., and Yang, S.: Changes in Stratospheric Dynamics Simulated by the EC-Earth Model From CMIP5 to CMIP6, J. Adv. Model Earth Sy., 16, e2023MS003756, https://doi.org/10.1029/2023MS003756, 2024.
Slingo, J. M., Rowell, D. P., Sperber, K. R., and Nortley, F.: On the predictability of the interannual behaviour of the Madden-Julian oscillation and its relationship with el Niño, Q. J. Roy. Meteor. Soc., 125, 583–609, https://doi.org/10.1002/qj.49712555411, 1999.
Son, S.-W., Lim, Y., Yoo, C., Hendon, H. H., and Kim, J.: Stratospheric Control of the Madden–Julian Oscillation, J. Climate, 30, 1909–1922, https://doi.org/10.1175/JCLI-D-16-0620.1, 2017.
Straub, K. H. and Kiladis, G. N.: Observations of a Convectively Coupled Kelvin Wave in the Eastern Pacific ITCZ, J. Atmos. Sci., 59, 30–53, https://doi.org/10.1175/1520-0469(2002)059<0030:OOACCK>2.0.CO;2, 2002.
Suematsu, T. and Miura, H.: Zonal SST Difference as a Potential Environmental Factor Supporting the Longevity of the Madden–Julian Oscillation, J. Climate, 31, 7549–7564, https://doi.org/10.1175/JCLI-D-17-0822.1, 2018.
Suematsu, T. and Miura, H.: Changes in the Eastward Movement Speed of the Madden–Julian Oscillation with Fluctuation in the Walker Circulation, J. Climate, 35, 211–225, https://doi.org/10.1175/JCLI-D-21-0269.1, 2022.
Sun, L., Wang, H., and Liu, F.: Combined effect of the QBO and ENSO on the MJO, Atmos. Ocean. Sci. Lett., 12, 170–176, https://doi.org/10.1080/16742834.2019.1588064, 2019.
Tam, C.-Y. and Lau, N.-C.: Modulation of the Madden-Julian Oscillation by ENSO: Inferences from Observations and GCM Simulations, J. Meteorol. Soc. Jpn., 83, 727–743, https://doi.org/10.2151/jmsj.83.727, 2005.
Tegtmeier, S., Anstey, J., Davis, S., Ivanciu, I., Jia, Y., McPhee, D., and Pilch Kedzierski, R.: Zonal Asymmetry of the QBO Temperature Signal in the Tropical Tropopause Region, Geophys. Res. Lett., 47, e2020GL089533, https://doi.org/10.1029/2020GL089533, 2020.
Tiedtke, M.: A Comprehensive Mass Flux Scheme for Cumulus Parameterization in Large-Scale Models, Mon. Weather Rev., 117, 1779–1800, https://doi.org/10.1175/1520-0493(1989)117<1779:ACMFSF>2.0.CO;2, 1989.
Vitart, F.: Madden–Julian Oscillation prediction and teleconnections in the S2S database, Q. J. Roy. Meteor. Soc., 143, 2210–2220, https://doi.org/10.1002/qj.3079, 2017.
Waliser, D., Sperber, K., Hendon, H., Kim, D., Maloney, E., Wheeler, M., Weickmann, K., Zhang, C., Donner, L., Gottschalck, J. and Higgins, W. MJO simulation diagnostics, J. Climate, 22, 3006–3030, https://doi.org/10.1175/2008JCLI2731.1, 2009.
Wang, B., Chen, G., and Liu, F.: Diversity of the Madden-Julian Oscillation, Sci. Adv., 5, eaax0220, https://doi.org/10.1126/sciadv.aax0220, 2019.
Wang, T. and Li, T.: Diversity of MJO Initiation Regions and Processes, J. Climate, 35, 3121–3140, https://doi.org/10.1175/JCLI-D-21-0816.1, 2022.
Wang, Y.-C., Tseng, W.-L., and Hsu, H.-H.: Role of convection–circulation coupling in the propagation mechanism of the Madden–Julian Oscillation over the Maritime Continent in a climate model, Clim. Dynam., 58, 2469–2484, https://doi.org/10.1007/s00382-021-06013-2, 2022.
Wei, Y. and Ren, H.-L.: Modulation of ENSO on Fast and Slow MJO Modes during Boreal Winter, J. Climate, 32, 7483–7506, https://doi.org/10.1175/JCLI-D-19-0013.1, 2019.
Wheeler, M. C. and Hendon, H. H.: An All-Season Real-Time Multivariate MJO Index: Development of an Index for Monitoring and Prediction, Mon. Weather Rev., 132, 1917–1932, https://doi.org/10.1175/1520-0493(2004)132<1917:AARMMI>2.0.CO;2, 2004.
Wheeler, M. and Kiladis, G. N.: Convectively coupled equatorial waves: Analysis of clouds and temperature in the wavenumber–frequency domain, J. Atmos. Sci., 56, 374–399, https://doi.org/10.1175/1520-0469(1999)056<0374:CCEWAO>2.0.CO;2, 1999.
Yadav, P. and Straus, D. M.: Circulation Response to Fast and Slow MJO Episodes, Mon. Weather Rev., 145, 1577–1596, https://doi.org/10.1175/MWR-D-16-0352.1, 2017.
Yadav, P., Garfinkel, C. I., and Domeisen, D. I. V.: The Role of the Stratosphere in Teleconnections Arising From Fast and Slow MJO Episodes, Geophys. Res. Lett., 51, e2023GL104826, https://doi.org/10.1029/2023GL104826, 2024.
Yang, G.-Y. and Hoskins, B. J.: ENSO impact on Kelvin waves and associated tropical convection, J. Atmos. Sci., 70, 3513–3532, https://doi.org/10.1175/JAS-D-13-081.1, 2013.
Yang, G.-Y. and Hoskins, B. J.: ENSO-related variation of equatorial MRG and Rossby waves and forcing from higher latitudes, Q. J. Roy. Meteor. Soc., 142, 2488–2504, https://doi.org/10.1002/qj.2842, 2016.
Yang, G.-Y., Feng, X., and Hodges, K.: Seasonal and interannual variation of equatorial waves in ERA5 and GloSea5, Q. J. Roy. Meteor. Soc., 149, 1109–1134, https://doi.org/10.1002/qj.4460, 2023.
Yoo, C. and Son, S.-W.: Modulation of the boreal wintertime Madden-Julian Oscillation by the stratospheric Quasi-Biennial Oscillation, Geophys. Res. Lett., 43, 1392–1398, 2016.
Yukimoto, S., Kawai, H., Koshiro, T., Oshima, N., Yoshida, K., Urakawa, S., Tsujino, H., Deushi, M., Tanaka, T., Hosaka, M., Yabu, S., Yoshimura, H., Shindo, E., Mizuta, R., Obata, A., Adachi, Y., and Ishii, M.: The Meteorological Research Institute Earth System Model Version 2.0, MRI-ESM2.0: Description and Basic Evaluation of the Physical Component, J. Meteorol. Soc. Jpn., 97, 931–965, https://doi.org/10.2151/jmsj.2019-051, 2019.
Yuni, A. R. E., Lubis, S. W., and Setiawan, S.: Vertical structure of Convectively Coupled Equatorial Waves (CCEWs) during Boreal Summer and Winter, IOP C. Ser. Earth Env., 284, 012010, https://doi.org/10.1088/1755-1315/284/1/012010, 2019.
Zhang, C. and Gottschalck, J.: SST Anomalies of ENSO and the Madden–Julian Oscillation in the Equatorial Pacific, J. Climate, 15, 2429–2445, https://doi.org/10.1175/1520-0442(2002)015<2429:SAOEAT>2.0.CO;2, 2002.
Zhang, G. J. and McFarlane, N. A.: Sensitivity of climate simulations to the parameterization of cumulus convection in the Canadian climate centre general circulation model, Atmos.-Ocean, 33, 407–446, https://doi.org/10.1080/07055900.1995.9649539, 1995.
Zhu, J., Kumar, A., and Wang, W.: Dependence of MJO Predictability on Convective Parameterizations, J. Climate, 33, 4739–4750, https://doi.org/10.1175/JCLI-D-18-0552.1, 2020.