the Creative Commons Attribution 4.0 License.
the Creative Commons Attribution 4.0 License.
 | 12 Jan 2026
Storm Boris (2024) in the current and future climate: a dynamics-centered contextualization, and some lessons learnt
Jacopo Riboldi
Robin Noyelle
Ellina Agayar
Hanin Binder
Marc Federer
Katharina Hartmuth
Michael Sprenger
Iris Thurnherr
Selvakumar Vishnupriya
The response of mean and extreme precipitation to anthropogenic global warming stems both from warming of the troposphere and dynamical changes in the large-scale circulation, especially upward motions. The interaction between these two components complicates future projections and makes the attribution of extreme precipitation events challenging, both using conditional (e.g., analog-based) and unconditional (e.g., extreme value theory-based) methods. In this study we reflect upon this problem and propose some possible solutions to tackle it starting from the case study of Storm Boris, that led to major floods over central Europe in mid-September 2024. The first step is the identification of key circulation features associated with the event, whose representation is deemed crucial to obtain realistic analogs: the presence of a slow-moving, upper-level potential vorticity (PV) cutoff, the peculiar track of the surface cyclone associated with Boris, and the presence of anomalously strong forcing for ascent. Circulation analogs of Boris are then identified in a large ensemble of present-day and future-climate simulations with the CESM1 model, to understand how “Boris-like” storms will change in an end-of-the-century high warming scenario. We find that the combined use of upper-level PV and of a surface cyclone identification algorithm substantially improves the quality of the analogs, both in terms of the large-scale flow pattern and the precipitation associated with the cyclone. Analogs of Boris restricted to the same season in a warmer climate feature on average less precipitation, due to an overall weakening of upper-level-driven ascent over Europe. However, analogs of Boris not restricted to the same season show a seasonality shift: they become less frequent at the end of the warm season and more frequent in the shoulder seasons – when the dynamical and thermal conditions of September in the present-day climate can be recovered again –, and exhibit an increase in mean precipitation in the warmer climate. The results obtained from the analog-based approach are then compared with an unconditional, statistics-based approach focusing only on the seasonal and yearly maxima of precipitation: the latter approach allows to recover the expected intensification of extreme precipitation in a warmer climate – at the price, however, of considering events that do not necessarily have the same dynamics as Storm Boris. The sensitivity of attribution outcomes with respect to implicit and explicit methodological choices is discussed in detail. The systematic comparison of different approaches, the two-step methodology to obtain more reliable analogs of heavy precipitation events, and the focus on process understanding are key ingredients of this study, with general implications for investigating the role of climate change for specific weather extremes.
- Article
(10481 KB) - Full-text XML
-
Supplement
(6444 KB) - BibTeX
- EndNote


Together with heat extremes, daily and multi-day precipitation extremes are globally expected to become more frequent and impactful with global warming (Seneviratne et al., 2021). The main reason behind this trend is the increased availability of atmospheric moisture with higher temperatures (Clausius-Clapeyron scaling; e.g., Hartmann et al., 2013; Ban et al., 2015; Fischer and Knutti, 2016; Kim et al., 2022). This tendency, however, might be regionally counteracted by changes in atmospheric dynamics (O'Gorman and Schneider, 2009; Pfahl et al., 2017a; Allan et al., 2020; Dallan et al., 2024), which are generally less constrained than thermodynamical effects (Shepherd, 2014; Di Capua and Rahmstorf, 2023). Those competing signals make local assessments of future changes in precipitation extremes particularly challenging. The Euro-Mediterranean region is expected to be particularly affected by this negative feedback, with a dynamically-driven mean drying (Seager et al., 2014; D’Agostino and Lionello, 2020) and, at the same time, an increase in frequency and intensity of precipitation extremes (e.g., Rajczak et al., 2013). Changing dynamics can oppose the expected precipitation increase directly, via a weakening of atmospheric vertical motions (Pfahl et al., 2017a; Tandon et al., 2018), and indirectly through changes in frequency or seasonality of the events (Brönnimann et al., 2018; Marelle et al., 2018; Müller et al., 2024; Zhu et al., 2025). The added layer of complexity provided by dynamics calls for a deeper understanding of atmospheric dynamical processes when placing extreme precipitation events in the context of the changing climate, i.e., in detection and attribution studies (Sarojini et al., 2016; Shepherd, 2016; Terray, 2021; Thompson et al., 2024). This piece of research focuses precisely on the complexity of attributing extreme precipitation events to anthropogenic global warming. It moves its steps from the case of Storm Boris (2024), a recent example of a cutoff-related, heavy precipitation event over central Europe, and studies how its characteristics change in a warmer climate as simulated by the medium-resolution climate model CESM1 large ensemble with more than a thousand years of data using an analog-based approach.
Storm Boris led to a record-shattering precipitation event: in the only five days between 12 and 16 September 2024, the equivalent of 2 to 5 times the climatological precipitation totals for September fell over a broad region of central Europe, leading to widespread flooding that severely impacted local communities (Greilinger et al., 2024; Copernicus Climate Change Service and World Meteorological Organization, 2025). This extreme event was linked to the development of an extratropical cyclone, which was named “Boris” by the Italian Meteorological Service. As other European heavy precipitation events (e.g., Grams et al., 2014; Ferreira, 2021; Tradowsky et al., 2023; Flaounas et al., 2025) its cyclogenesis was preceded by Rossby wave breaking over central Europe, that led to the formation of an upper-level PV cutoff over the central Mediterranean Sea. Wave breaking events tend to be associated with enhanced low-level poleward advection of warm, moist air ahead (i.e., to the east) of the incipient PV cutoff and with strong ascending motions, both processes promoting the occurrence of extreme precipitation (Llasat et al., 2007; Moore et al., 2019; de Vries, 2021). Furthermore, the circulation anomalies associated with breaking Rossby waves are strong enough to locally oppose the background westerly flow, leading to a persistent flow pattern that generally increases the multi-day accumulation of precipitation (e.g., Lenggenhager et al., 2019; Lenggenhager and Martius, 2019; Kautz et al., 2022).
While the upper-level flow evolution was important in setting the stage for the event, there were also interesting low-level features at play. Boris started as a Mediterranean surface cyclone that crossed Italy and then moved over the Balkans, following a track reminiscent of the so-called “Vb cyclones” (Van Bebber, 1891; Hofstätter and Chimani, 2012). The occurrence of such cyclones had been related to extreme precipitation events over Central Europe and the northern Alpine region (e.g., Ulbrich et al., 2003; Messmer et al., 2015; Hofstätter et al., 2016). Storm Boris also occurred in a period of anomalously high sea surface temperatures (SSTs) in the Mediterranean, a pre-conditioning that can lead to enhanced precipitation from Vb cyclones (Messmer et al., 2017).
The rapid attribution studies performed so far suggested that anthropogenic global warming likely increased the precipitation totals related to Storm Boris. Athanase et al. (2024) used a nudging method to impose the same large-scale, upper-tropospheric dynamics as during the event in a present-day climate model simulation and found an increase of precipitation with respect to a pre-industrial climate of around 9 % in the impacted region, driven by the increase in vertical motion and available water vapor. The changes with regards to a warmer (+4 K) climate than today are more subtle, with only a small increase in precipitation (+2 %) and some regions even seeing less precipitation. Likewise, using an extreme value analysis over a large number of models and observational data sets, Kimutai et al. (2024) found an increase of the precipitation intensity of the event compared to a pre-industrial climate by 7 %.
Using large-scale circulation analogs in the observational record in the context of the ClimaMeter rapid attribution framework, Faranda et al. (2024) compared analogs of Boris in the present climate (obtained from analogs in the period 2001–2023) and in a counterfactual climate (obtained from analogs in the period 1979–2001). They observed an increase in precipitation, and related it to a deepening of the associated surface cyclone in the present climate with respect to the future counterfactual. However, as discussed in Faranda et al. (2024), confidence in the results is partially limited by the relatively small number of analogs of Boris found in the reanalysis data set, a common issue when studying unusual extreme events. Performing analog-based studies of heavy precipitation events related to upper-level PV cutoffs is particularly challenging, as small differences in the PV distribution can result in notable shifts in the regions affected by heavy precipitation (as noticed by Fehlmann and Quadri, 2000; Fehlmann et al., 2000; Schlemmer et al., 2010; Thompson et al., 2024). This observation further underscores the importance of correctly representing the dynamical setup of extreme precipitation events when performing detection and attribution studies, an aim that can be achieved through improved large-scale circulation analogs.
In this study, we try to harness knowledge about the dynamics of Storm Boris to obtain a dynamics-informed, analog-based assessment of how similar events will look like in a future, warmer climate. While getting to such a result, we will reflect upon how the knowledge of atmospheric dynamics can be effectively implemented in analog-based approaches to study the effects of climate change on extreme precipitation events, and contextualize how different methodological choices affect the outcomes of attribution. The large ensemble simulations, the attribution approach, and the diagnostics used to investigate the dynamics of the event are introduced in Sect. 2. The analysis of future changes in Storm Boris is preceded by a detailed description of the dynamics of the event (Sect. 3), which results in the identification of a small set of salient dynamical features deemed particularly relevant for the unfolding of the extreme event. In Sect. 4.1, the selection of the analogs is then performed in a way that ensures an appropriate representation of these salient dynamical features. A conditional, analog-based attribution of Storm Boris is then performed: its results are contextualized with respect to methodological choices, and compared with an unconditional attribution method in the rest of Sect. 4. As we believe that the explicit consideration of dynamics, and the dependence of attribution outcomes on the chosen approach, might be important for attribution studies of extreme precipitation events in general, we discuss some more generic insights in Sect. 5, before presenting the overall conclusions of the study and some lessons learnt in Sect. 6.
2.1 Data
Meteorological quantities are obtained from 6-hourly analysis data of the Integrated Forecasting System (IFS, version Cycle 48r1) model of the European Centre for Medium-Range Weather Forecasts (ECMWF), interpolated to a horizontal resolution of 0.5° × 0.5°. An estimate of the 5 d accumulated precipitation was also obtained from the ECMWF Reanalysis 5 (ERA5; Hersbach et al., 2020); the same data set is also employed to contextualize the values recorded during Storm Boris with respect to the long-term climatology (i.e., to compute anomalies and determine percentiles). To obtain a more accurate estimate of rainfall during the event, we also use the Late Run IMERG V07 product from the Integrated Multi-satellitE Retrievals for GPM (IMERG) dataset (Huffman et al., 2024), at half-hourly intervals and 0.1° resolution in space, which aligns fairly well with station observations.
The contextualization of Boris with respect to climate change is based on a large ensemble of the Community Earth System Model version 1 (CESM1; Hurrell et al., 2013). Combining the original 35 members of the CESM1 large ensemble (Kay et al., 2015) with other “micro-ensemble” simulations initialized from the first and the second member of the large ensemble (as detailed in Fischer et al., 2013; Röthlisberger et al., 2020), we obtain two sets of 105 10-year members for the periods 1990–1999 (historical) and 2090–2099 (future, run under a Representative Concentration Pathway 8.5 forcing scenario). Model output has a horizontal resolution of 1.25° of longitude by 0.9° of latitude, 6-hourly temporal resolution, and 30 vertical levels, allowing to reliably perform advanced dynamical analyses such as the computation of air parcel trajectories, and of quantities involving vertical gradients, such as PV.
2.2 Analog-based attribution
Attribution of Storm Boris to climate change is performed through the analysis of flow analogs in the available large ensemble of the CESM1 climate model. Flow analogs of an event with atmospheric circulation 𝒞e are days d when the atmospheric circulation 𝒞d is sufficiently similar to 𝒞e according to a certain metric. These analogs give an empirical estimate of the distribution of variables of interest X conditional on atmospheric circulation during the event: ρ(X|𝒞e). Then we can compare the evolution of properties of the conditional distributions in the model between the two periods (F=0 and F=1), for example, the mean change in a variable X: . informs how the expected value of X is changing between the two periods – and therefore with increased anthropogenic forcings in our case – conditional on the atmospheric circulation being similar as the one observed during the event. Contrary to unconditional attribution methods, this method ensures that the atmospheric dynamics of events used to compare to the event observed are similar in both periods and, therefore, that dynamically similar events are compared.
In this study, analogs are defined based on the euclidean distance between 𝒞d and 𝒞e over a broad domain encompassing Europe (32–70° N and 5° W–40° E). While other studies employing the flow-analogs attribution method used either geopotential height at 500 hPa (Z500) or sea-level pressure (SLP) to condition on the large scale circulation 𝒞e of the event (Terray, 2021; Faranda et al., 2022; Noyelle et al., 2023; Thompson et al., 2024; Ginesta et al., 2024) here we prefer to use the 250 hPa PV field to obtain an improved representation of the dynamics of Storm Boris. The reasoning behind this choice will be made explicit in the following sections, but it is worth remembering here that PV is able to provide a powerful and compact representation of the atmospheric flow (as shown by, e.g., Hoskins et al., 1985). We thus seek for analogs of the event based on the daily mean 250 hPa PV field on 14 September, the day with the highest 24 h accumulated precipitation over the impacted region according to the IFS analysis (as will be shown later). Furthermore, for each daily mean PV field, we subtract the daily, spatial mean of the PV field over the domain before computing the euclidean distances: this is done to select analogs with similar PV gradients to the event – rather than raw PV intensity, as this field is expected to change with global warming for a fixed pressure level due to the expansion of the tropical belt (Turhal et al., 2024).
Attribution is then performed by comparing circulation analogs in a factual period of the model with limited anthropogenic forcings (1990–1999, referred to as “the present” in the following) and a future counterfactual (Ermis et al., 2024) period (2091–2100, referred to as “the future” in the following) with high anthropogenic forcings – and a global warming of 4.5 K compared to the present period. In each period we look for analogs in the large ensemble of 105 members of the CESM1 model (Hurrell et al., 2013), which we assume is equivalent to looking for analogs in a 1050-years stationary simulation. We first select the closest n=1050 analogs in each period based on their euclidean distance with respect to the PV field of the event (again, after removing the domain-averaged PV), while imposing that each analog is separated by at least 5 d from a previously selected analog to ensure that they are not taken from the same event in the model. This number of analogs was chosen to have the equivalent of one analog per year in the model, although we do not impose that one analog per year has to be found. Two ways of selecting flow analogs are considered: (1) “seasonal analogs”, by restricting analog computation to the same season of the event (i.e., only the months of August, September, October), and (2) “yearly analogs”, for which no restriction on months is imposed. Both approaches are compared to investigate potential seasonality changes between analogs in the factual and the future counterfactual periods, and to assess the impact of methodological choices on the outcome of the attribution assessment.
For every metric computed on the analogs distribution, we test the significance of the difference between the two periods using a bootstrap method. In each period, we resample inside the set of analogs, with replacement, the same number of analogs and compute the metric of interest. We repeat this resampling 1000 times to get a bootstrap distribution of the metric, and then compute the probability in this resampled distribution that the value 0 (or 1 when considering ratios) is exceeded/subceeded. This gives a bootstrapped p-value for significance at each grid point. We then use a false discovery rate test of 0.1 to take into account spatial correlations (Wilks, 2016) and flagged as significant the grid points that pass this test.
2.3 Dynamical diagnostics
- Warm conveyor belts.
-
Warm conveyor belts (WCBs) are identified in the operational ECMWF analyses and the CESM simulations following the method of Madonna et al. (2014). Forward trajectories are computed over a two-day period using the Lagrangian Analysis Tool (LAGRANTO; Wernli and Davies, 1997; Sprenger and Wernli, 2015). They are started every 6 h from an equidistant grid covering the lower troposphere (1050–790 hPa) of the Northern Hemisphere, with a horizontal resolution of 40 km and a vertical resolution of 20 hPa. Those trajectories that ascend at least 600 hPa within these two days are classified as WCB trajectories. We note here that the CESM model is capable of appropriately representing WCB trajectories despite the relatively small (30) number of vertical levels, as shown in detail by Joos et al. (2023) and Binder et al. (2023).
- Atmospheric blocking.
-
Blocking identification in the operational IFS analysis and CESM simulations follows the approach of Schwierz et al. (2004) and Croci-Maspoli et al. (2007). Regions with a vertically averaged negative PV anomaly (between 150 and 500 hPa) exceeding −0.7 PVU, relative to a 15 d running mean, are classified as blocks if the anomaly persists for at least five consecutive days. The 15 d running mean used to compute the anomalies, on the other hand, is derived from ERA5 reanalysis data. Since Storm Boris occurred in early fall – when PV anomalies tend to be weaker – a lower PV anomaly threshold than the original one of −1.3 PVU was applied (as in e.g., Pfahl and Wernli, 2012).
- Cyclone tracking.
-
The track of Storm Boris was identified manually in the IFS analysis, matching minima in SLP and geopotential height at 850 hPa. This was necessary because the representation of orography in the ECWMF analysis introduces noise to the SLP field, making automatic tracking impractical. Identification and tracking of cyclones in CESM1 is based on the SLP field using the contour search algorithm developed by Wernli and Schwierz (2006) and refined by Sprenger et al. (2017). Each cyclone is characterized by a pressure minimum, which is followed over time to generate a cyclone track.
- Moisture source.
-
Moisture sources were calculated from ten-day backward air parcel trajectories initialized every 50 km within the region impacted by the event (shown in Fig. 1), at pressure levels from 1000 to 500 hPa in 50 hPa increments. Trajectories were computed using LAGRANTO, applied to the 3D wind fields from IFS analysis data. Specific humidity, relative humidity, and boundary layer height were interpolated along each trajectory to compute the moisture source diagnostic following Sodemann et al. (2008). Moisture uptakes were identified as increases in specific humidity exceeding 0.01 g kg−1, and were weighted by moisture losses (larger than −0.01 g kg−1) after uptake. Only trajectories that contributed to precipitation – defined as a decrease in specific humidity greater than 0.01 g kg−1 and a relative humidity above 80 % in the final time step before arrival – were considered. Finally, each uptake was weighted by the final moisture loss of its trajectory and gridded onto a 0.5° latitude-longitude grid. Gridded relative moisture uptakes were then scaled using surface precipitation data from IMERG for each time step in the impacted region. On average, this method explains 90 ± 1 % of the precipitation in the impacted region between 12 and 16 September 2024. To assess the influence of anomalous Mediterranean SSTs on moisture uptake, the same setup was applied using ERA5 reanalysis data (Hersbach et al., 2020), interpolating daily SST values and their 30-year climatology (with respect to the 1994–2024 period) along the trajectories.
- Quasi-geostrophic forcing for ascent.
-
Quasi-geostrophic (QG) forcing of ascent and descent in the operational IFS analysis and the CESM simulations is calculated as in Besson et al. (2021) and Jin et al. (2024). Specifically, all fields are coarse-grained to a 1.5°×1.5° latitude/longitude grid, and then the Q-vector and its divergence are determined as forcing of the vertical motion, thereby distinguishing between forcings from levels above and below 550 hPa. More details on the Q-vector formulation of the QG theory can be found in Davies et al. (2024), and a technical documentation of the calculation method in Reinert (2009).
2.4 Precipitation scaling
To investigate changes in the precipitation between the factual and future counterfactual, we make use of the precipitation scaling proposed by O'Gorman and Schneider (2009). The intensity of precipitation extremes scales as:
where P is a high percentile of the precipitation distribution, ω is the large-scale average over precipitation systems of vertical velocity in pressure coordinates, is the moist-adiabatic derivative of saturation specific humidity conditional on the mean temperature when extreme precipitation occurs and {⋅} is a mass-weighted integral over the troposphere. In the following for simplicity of writing we drop the condition for the saturated specific humidity. Importantly, for the ω term we consider only updrafts, i.e. when ω<0. When ω is positive it will be considered as being equal to 0. Although this scaling is more adapted to intense precipitation events (O'Gorman and Schneider, 2009; Pfahl et al., 2017b), we use it here for every analog even if they do not display intense precipitation, and discuss the validity of this approximation in the results section.
This scaling allows to separate between thermodynamical – change in via the Clausius–Clapeyron relationship – and dynamical – change in ω – contributions to extreme precipitations. In particular, this allows to decompose the evolution of future precipitation into those two components. We note the analogs average in period k. Then for each analog:
where the primes describe the anomalies compared to the analogs average. This implies that the mean precipitation for the analogs can be separated into a contribution from the means and a contribution from the covariance:
where by linearity we switched vertical and analogs averages. We then note the changes in the analogs average between the two periods for any variable X. The change in the analogs average scaling precipitation can thus be written as the sum of four terms:
The first two terms represent respectively the change in scaling precipitation due to changes in the mean vertical wind speed and mean vertical saturated specific humidity. The latter can therefore be understood as a mean dynamical contribution while the former is the mean thermodynamical contribution due to the change in the vertical profile of saturated specific humidity. The third term corresponds to changes of both means at the same time and is likely of second-order importance compared to the first two. Finally the last term represents a change in the covariance between the two periods, i.e. whether anomalies of the vertical wind speed occur more often at the same time as anomalies of the saturated specific humidity in the future compared to the present. This term need not a priori be small compared to the first two. The decomposition in Eq. (4) therefore allows to attribute changes in the scaling precipitation to different changes in atmospheric processes between the two periods.
3.1 Spatial and temporal extent of the event
We focus here on the extended, spatially coherent extreme precipitation event that unfolded over central-eastern Europe in the period between 12 and 16 September 2024, and neglect the shorter-duration, more localized extreme rainfall events that impacted Romania and Italy during the days, respectively, preceding and following the main event (Ferrari et al., 2025). In that time span, locally more than 400 mm of precipitation were recorded between Austria, Germany and Czech Republic, leading to widespread flooding in the Danube river basin (Fig. 1a; see also Greilinger et al., 2024; Magnusson et al., 2025). Despite the systematically lower values, the distributions of precipitation captured by the analysis and reanalysis data sets match well the IMERG observations (Fig. 1b, c), allowing to define the impacted region by Boris as 12–19.5° E, 47.2–51° N. In terms of timing, both data sets highlight the 48 h period between 06:00 UTC of 13 September 2024 and 06:00 UTC of 15 September 2024 as the one featuring the highest precipitation rates over the region (Fig. 1d). Consequently, the analysis will focus on this time interval.
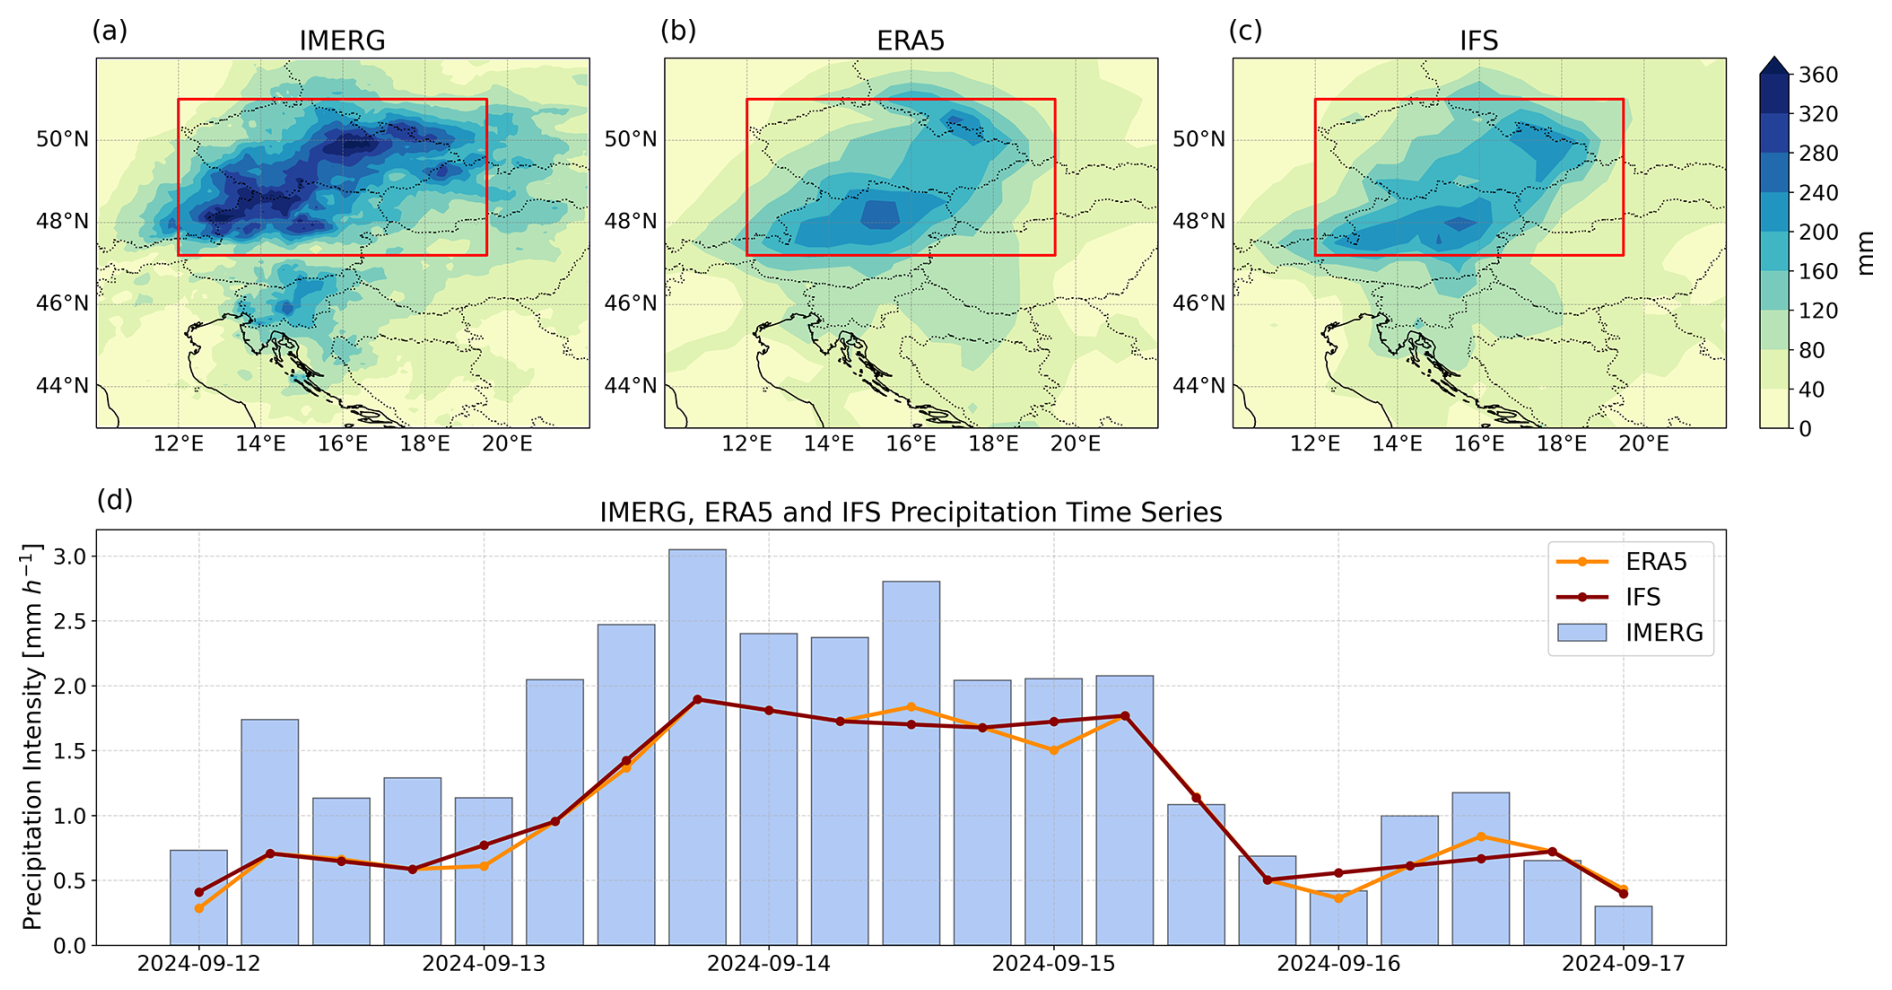
Figure 1Precipitation totals in the 5 d period between 00:00 UTC of 12 and 17 September 2024, as estimated from (a) the IMERG satellite product, (b) hourly ERA5 reanalysis and (c) 6-hourly IFS analysis. (d) Time series of precipitation intensity (in mm h−1, averaged over 6 h intervals) averaged over the impacted region (marked by the red box in a–c), for the data sets listed above.
3.2 Large-scale flow evolution
Cyclone Boris originated from the Rossby wave breaking of a PV streamer (i.e., a filament of stratospheric air intruding in the troposphere, see Appenzeller and Davies, 1992) elongated between Norway and Italy, which was associated with unseasonably cold air masses over western and central Europe in the days preceding the event (Fig. 2a). Heavy precipitation started to affect central Europe already during 13 September, focusing at the north-eastern side of the cyclonically breaking PV streamer (Fig. 2b). Precipitation concentrated along a baroclinic zone between the pre-existing cold air, associated with the PV streamer to the west, and the warm air advected cyclonically around the streamer from the south-east and upgliding above the cold air mass. Ascent was particularly strong at this stage, with many air parcels matching the WCB criterion of 600 hPa uplift in 48 h in correspondence of the baroclinic zone (Fig. 2b). It is also worth noticing that the wave breaking happened in conjunction with an atmospheric blocking over the Barents Sea, a feature that likely hindered the propagation of the PV trough at high latitudes and, consequently, promoted its cyclonic breaking over southern Europe.
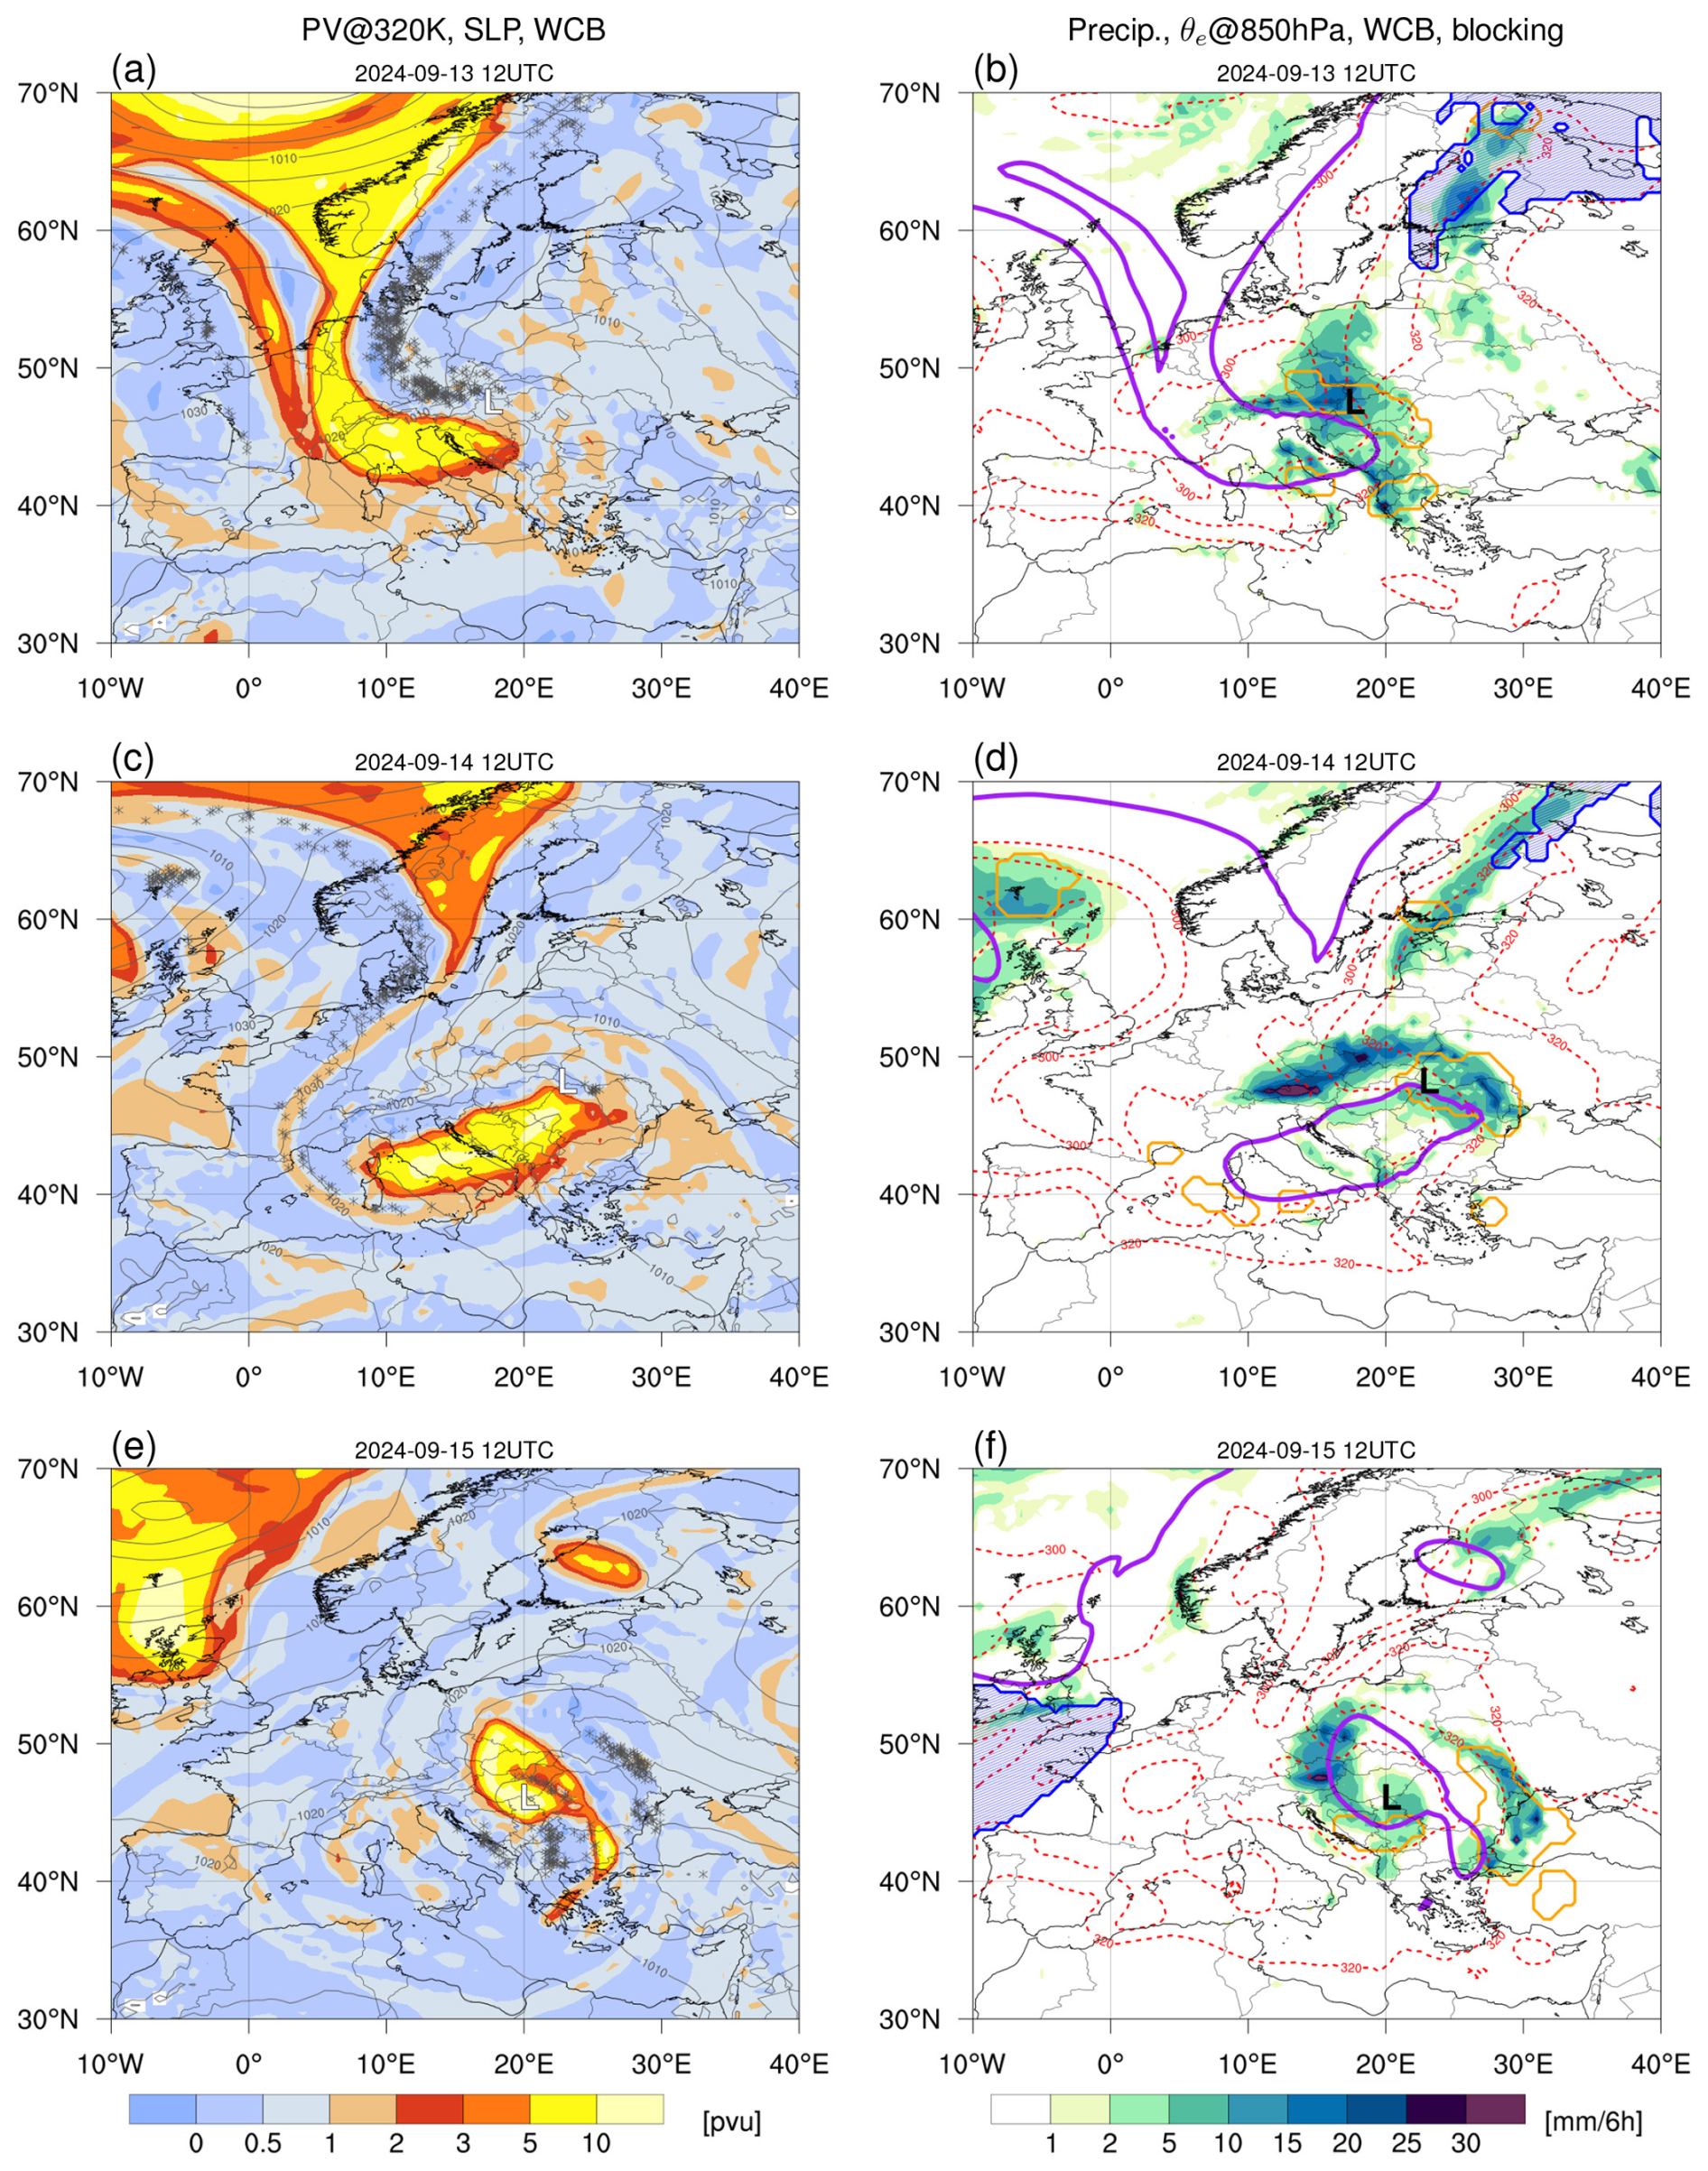
Figure 2Large-scale flow through the evolution of Storm Boris, obtained from the IFS analysis. (left) Potential vorticity at 320 K (shaded), SLP and intersections of WCB trajectories with the 315, 320 and 325 K isentropic surfaces; (right) 6-hourly accumulated precipitation (shaded), equivalent potential temperature at 850 hPa (θe, red dashed contours, only 300, 310 and 320 K), WCB ascent mask (orange contour; gridded WCB trajectories located between 800 and 400 hPa at the considered time), blocking mask (blue contour and stippling) and 2 PVU contour at 320 K (purple contour, smoothed using a 9-point average).
The streamer progressively filamented during 13 September, leading to the formation of a broad PV cutoff between Italy and the Balkans (Fig. 2c). Filamentation was accompanied by substantial WCB activity at both the western and eastern sides of the streamer, as indicated by the many WCB outflow trajectories located in its immediate vicinity (Fig. 2a, c). Precipitation intensity reached at this time a peak over Austria and Czech Republic with maxima located again at the northern edge of the PV cutoff, along the quasi-stationary baroclinic zone, and in correspondence of the Alps over western Austria – indicating an orographic contribution (Fig. 2d). We also notice that WCB activity is now confined at the eastern edge of the PV cutoff, away from the heaviest precipitation falling over the impacted region: this observation points to the contribution of other processes to heavy precipitation during the PV cutoff stage, such as isentropic upgliding and orographic enhancement.
The final part of the event was characterized by more moderate yet persistent precipitation during 15 and 16 September, as the cutoff and the surface cyclone stalled and started to retrograde westward towards northern Italy (Fig. 2e, f). The precipitation swath follows again the region of strong θe gradient between Poland and Austria, indicating the persistence of isentropic upgliding along the now weaker, north-south oriented baroclinic zone. The persistence of the flow pattern can be explained by the presence of high-latitude blocking over northern Europe broadly promoting easterlies over Europe that first halt the eastward propagation of the PV cutoff and then support its retrogression (see Fig. S1 in the Supplement).
3.3 Low-level flow evolution
The surface cyclone associated with Boris originated close to the Gulf of Genoa between 11 and 12 September (Fig. 3a), at the southern edge of a broad upper-level PV streamer located over central Europe. As the streamer proceeded eastward and started to break cyclonically, the center of the cyclone was stirred across Italy towards the Carpathians (Fig. 3b): we verified that such a track fulfills the definition of Vb cyclone introduced by Hofstätter and Chimani (2012) and Messmer et al. (2015). We remind here that the track shown in Fig. 3a, c, e results from an ad-hoc, manually performed tracking of Boris' SLP minimum and geopotential at 850 hPa. The automated tracking algorithm, on the other hand, split Boris' track between two separate lows despite visual evidence of a single, broad, stationary cyclone (not shown).
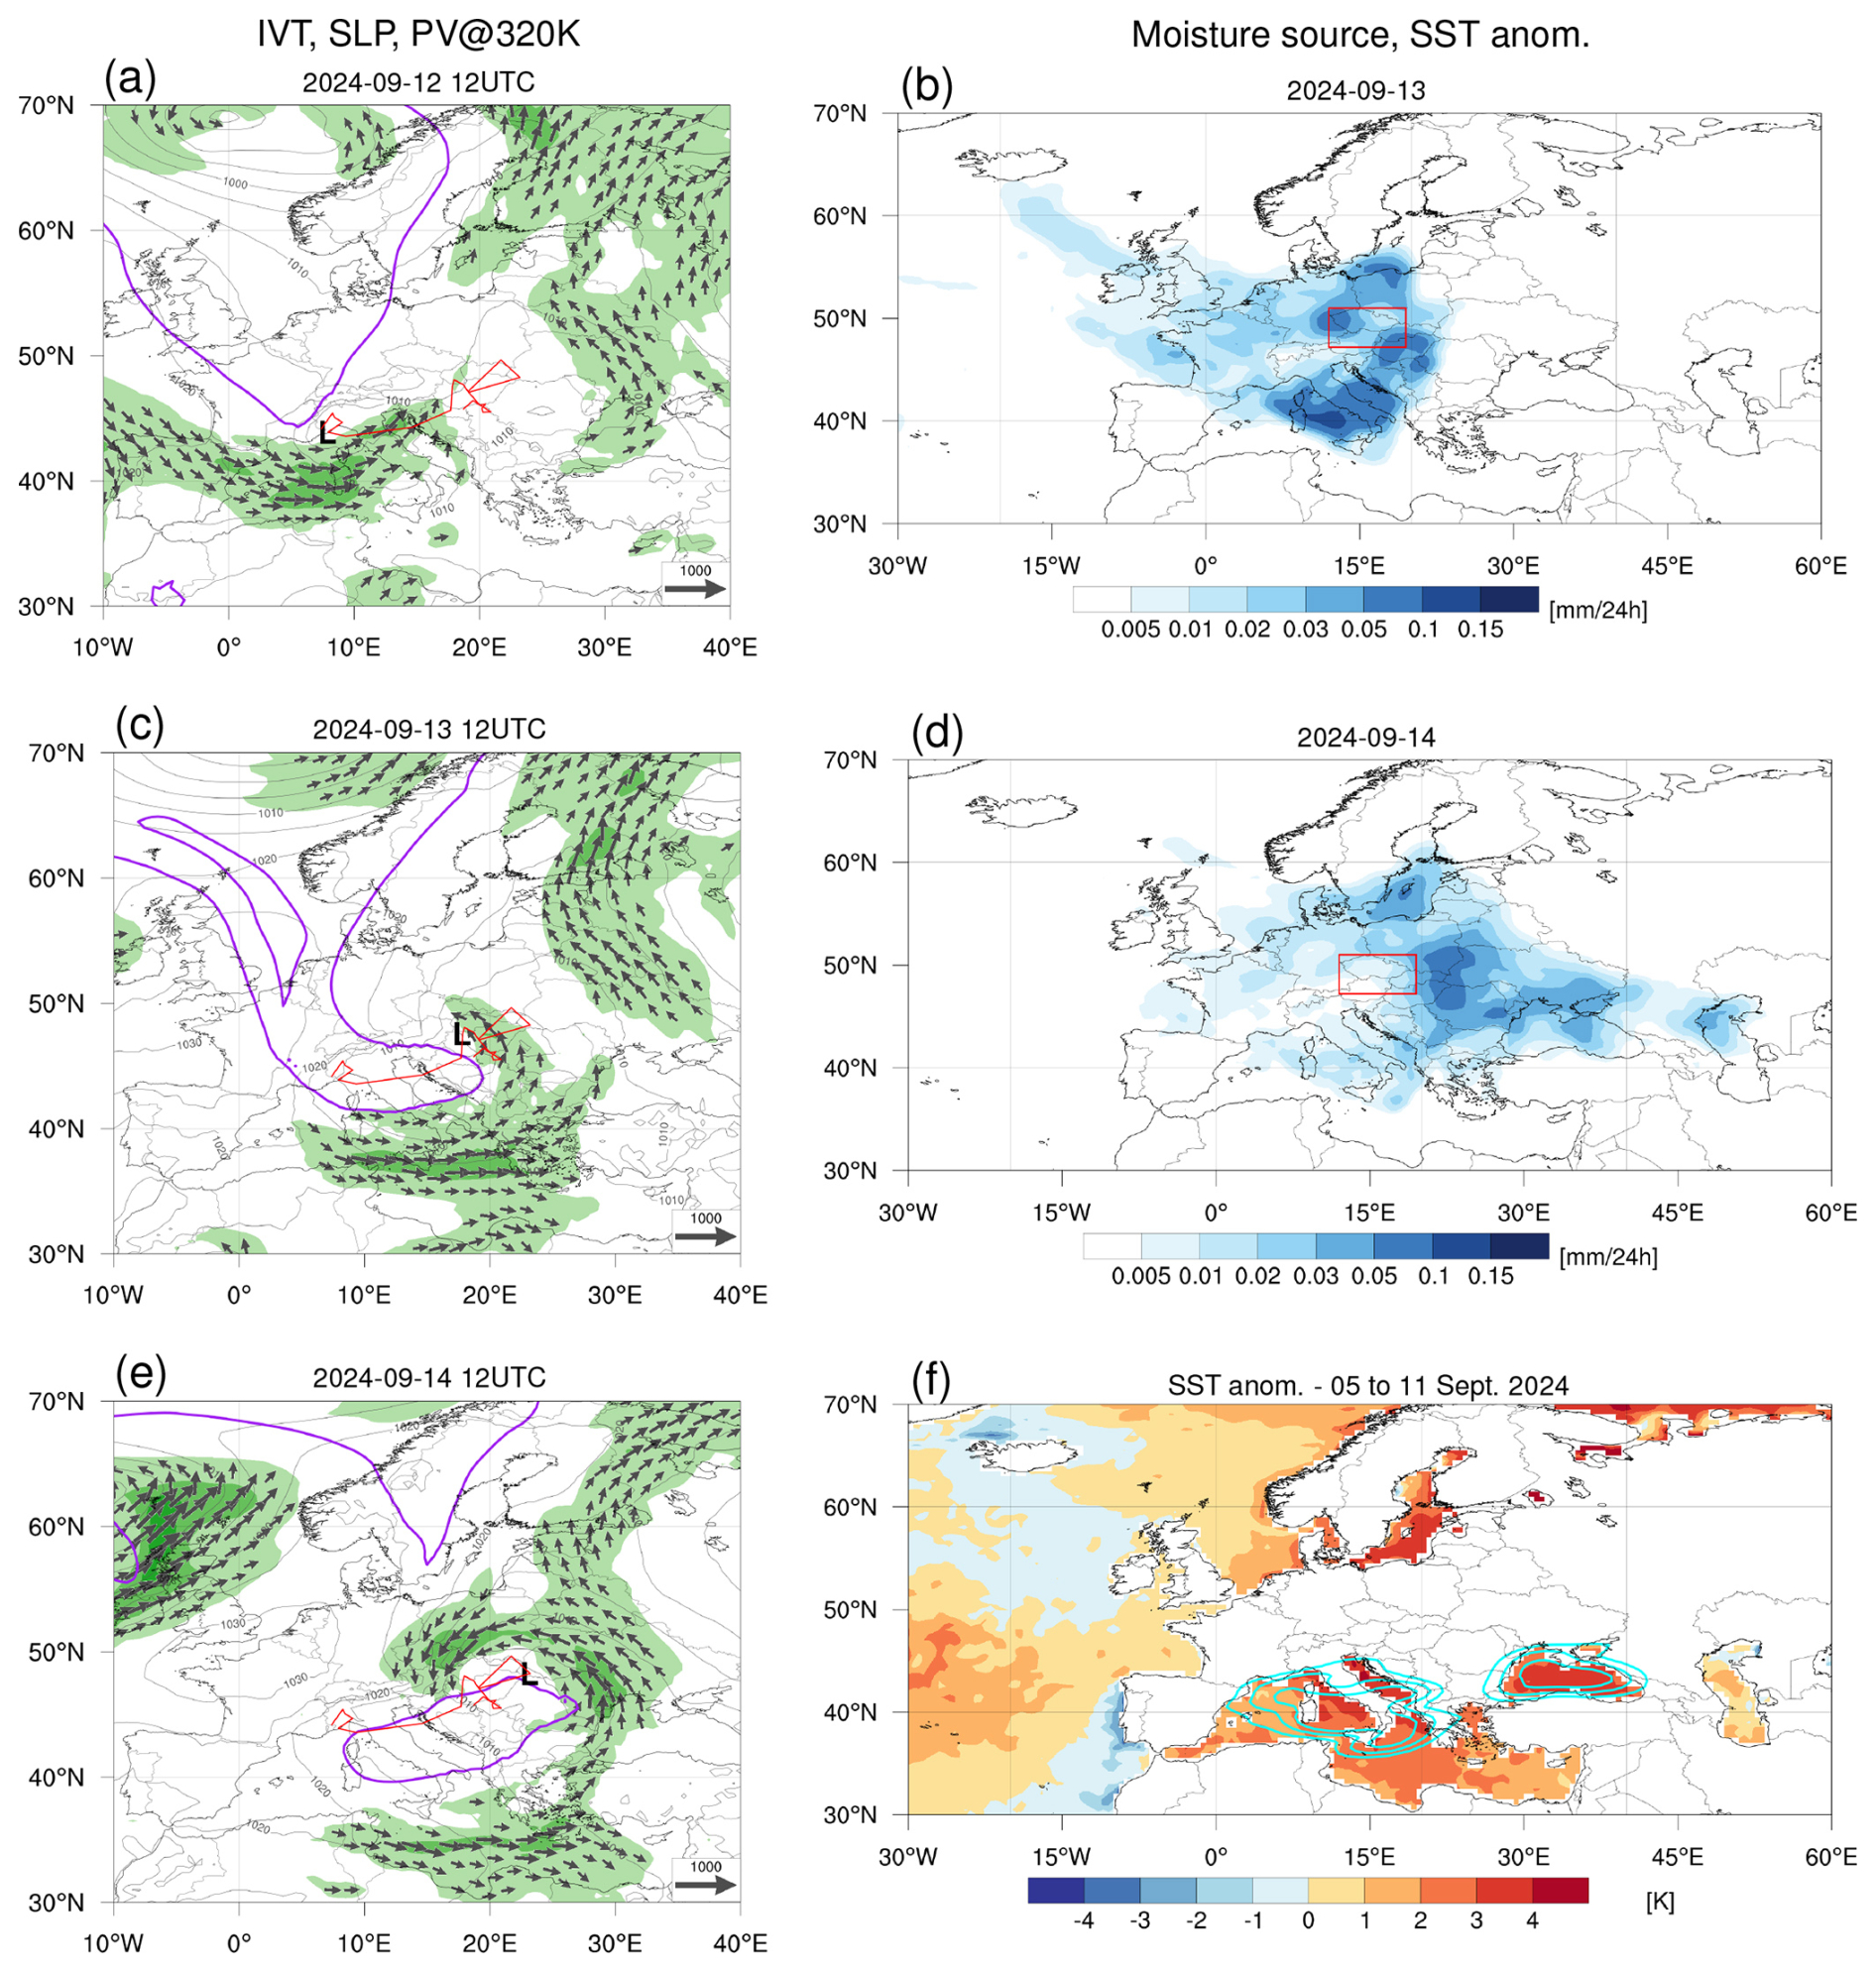
Figure 3Moisture transport and sources of precipitation during the evolution of Storm Boris. (a, c, e) Integrated vapor transport (IVT) magnitude (shaded) and direction (vectors), and sea-level pressure at three different time steps; the 2 PVU contour at 320 K is shown for reference, as in Fig. 2. (b, d) Moisture sources of precipitation in the impacted region (red box) accumulated through (b) 13 and (d) 14 September 2024. (f) Mean SST anomalies for 5 to 11 September 2024 relative to SST climatology for September (1994–2024). Cyan contours denote the location of air parcels representing 90 %, 75 % and 50 % of all air parcels that took up moisture over the Mediterranean and Black Sea.
Analysis of integrated vapor transport (IVT) highlights patterns of moisture advection first to the south of the PV streamer (Fig. 3a) and then around the cutoff cyclone towards the impacted region (Fig. 3c, e). However, since IVT provides only a snapshot of the moisture transport at a given time, we complemented this analysis by a trajectory-based moisture source diagnostic focused on the region impacted by the heaviest precipitation. The diagnostic indicates that, in the first part of the event, most of the moisture contributing to precipitation originated from central to western Europe (40 %), the western and central Mediterranean (18 %) and the North Atlantic (23 %) (Fig. 3d). As the event unfolded, however, contributions from eastern Europe (40 %) and the Black and Caspian Sea (10 %) became increasingly important (Fig. 3e). The detailed partition of moisture uptakes among the different regions is displayed in Fig. S2. Notably, over 80 % of the extended Mediterranean contribution (i.e., conflating together the whole Mediterranean and Black Sea) during the first part of the event originated from areas with ΔSSTanom> 2 °C relative to the 1994–2024 September climatology (Fig. 3f). Such a condition of ΔSSTanom> 2°C was fulfilled only by 64 % of the considered area, suggesting that the elevated SSTs might have enhanced moisture uptake in the region. Further research, however, is required to determine whether the enhanced moisture uptake also resulted in an anomalously high Mediterranean contribution to precipitation totals in central Europe.
3.4 Forcing for vertical motion
Boris developed to the east of an upper-level PV maximum, represented here first by the PV streamer and then by its subsequent evolution as cutoff. Such regions are characterized by upper-tropospheric divergence, which evacuates air from the column and leads to compensating upward motion (Davies et al., 2024). In the case of Boris, the patterns of ascent and descent at 650 hPa are clearly discernible to the east and west, respectively, of the breaking PV streamer (Fig. 4a). QG forcing for ascent was anomalously strong for Storm Boris: evaluating ωQG over the red box in Fig. 1 results in values ranking in the top 0.1 % of the year-round climatological distribution obtained from the ERA5 reanalysis (Fig. 4b; ranking is top 0.16 % when comparing the IFS analysis value with the ERA5 climatology). The high values point to a substantial contribution of the large-scale circulation to the precipitation event, differentiating Boris from other localized, “convection-driven” extreme precipitation events. The particularly favorable environmental conditions substantially contributed to the intensity and extension of the extreme precipitation event related to the storm. This might have happened in two ways: directly, by promoting ascent of moist air masses, and indirectly, by promoting upper-level divergence and thus intensifying the cyclonic circulation associated with Storm Boris.
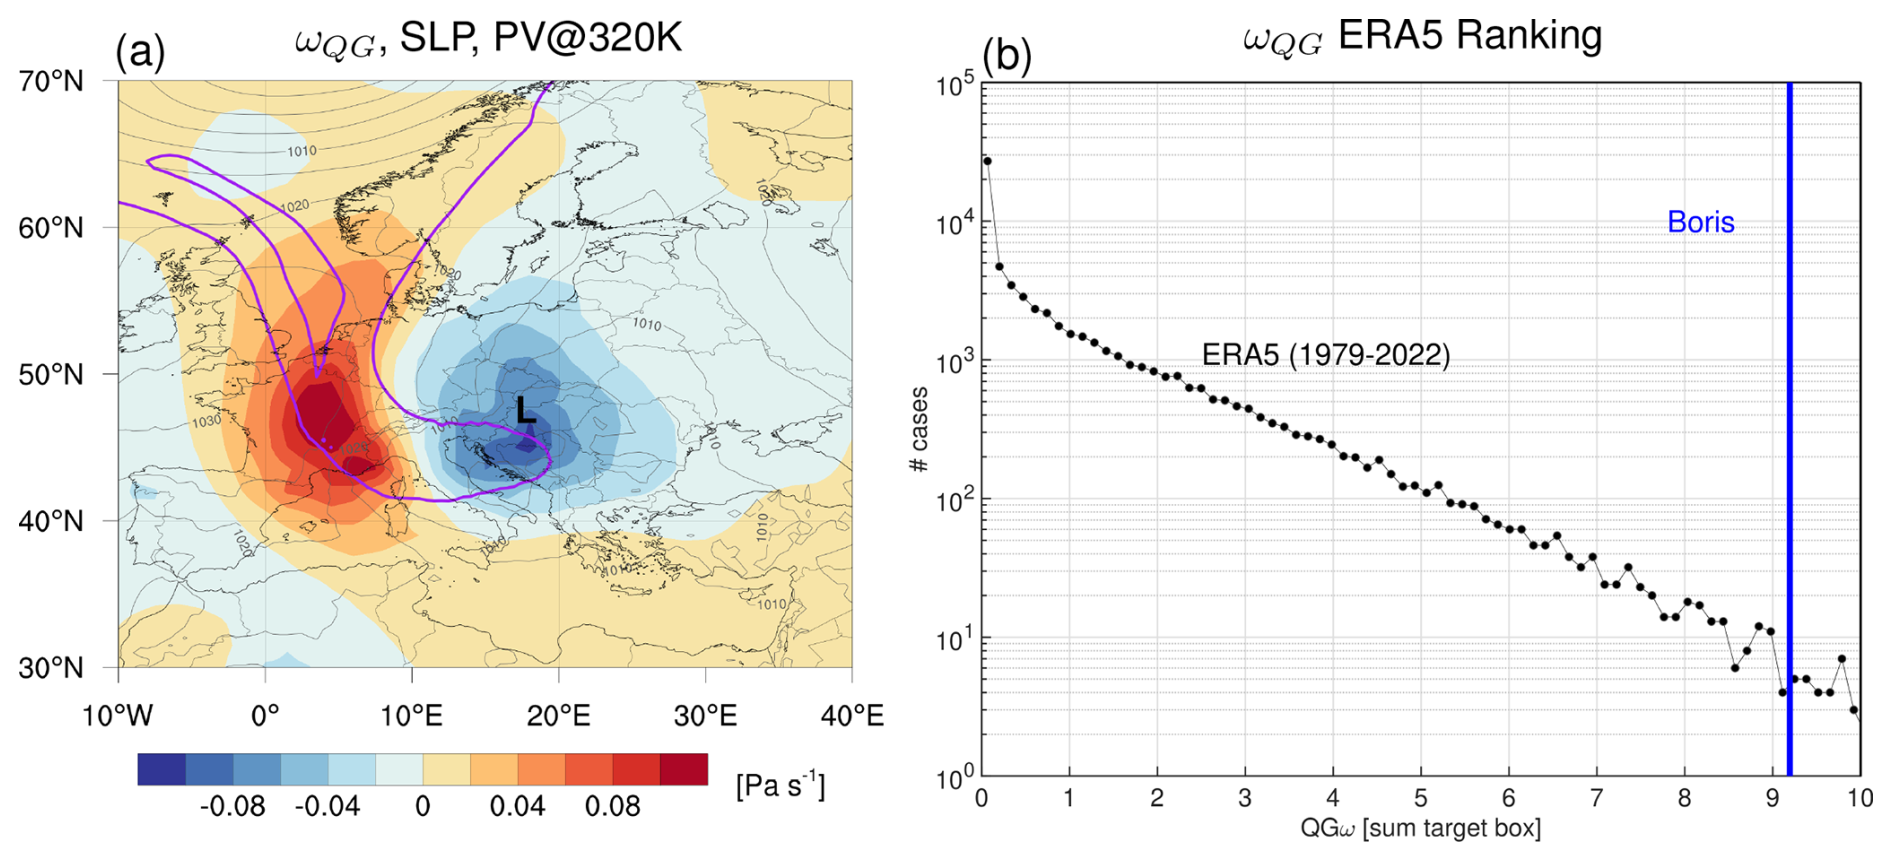
Figure 4(a) QG forcing for ascent due to upper levels for 13 September 2024 12:00 UTC. The QG calculation is based on operational IFS analysis, and the uplift forcing is shown at 650 hPa. Only QG forcing from levels above 550 hPa is shown. Positive values (red) show downward forcing, and negative values (blue) uplift forcing. The 2 PVU contour at 320 K is shown for reference, as in Fig. 2b. (b) Comparison of maximum QG forcing (units: 10) over the impacted region during Storm Boris (bold vertical line, corresponding to peak in timeseries) with the distribution of QG forcing during the full period 1979–2023 (comparison based on ERA5, all-seasons confounded). Only upward forcing evaluated at 650 hPa is considered. Note the logarithmic scale on the y axis.
3.5 Summary: Salient dynamical features of Storm Boris
As a conclusion of the meteorological analysis, three salient dynamical features are identified as particularly important for the unfolding of the heavy precipitation event associated with Storm Boris:
-
The formation of a slow-moving PV cutoff from the thinning and breaking of an upper-level PV streamer, supported by a substantial contribution of upstream moist processes and by the presence of atmospheric blocking (large-scale flow evolution);
-
The track of the low-level cyclone, that allowed to concentrate moisture advection over the impacted region (low-level flow evolution);
-
The presence of anomalously strong large-scale forcing for ascent during the event (vertical motions).
This dynamical information provides the basis for the choice of the large-scale flow analogs to improve their quality, as detailed in the following section.
4.1 Dynamics-informed choice of the analogs
The inclusion of dynamical information in the choice of the analogs starts from the consideration that precipitation is a complex process: it requires both moisture transport – which mostly happens at lower levels – and lifting of the moist air mass – which is mostly driven by topography and the large-scale circulation (e.g., Doswell et al., 1996). We thus adopt a two-step approach to constrain both the upper-level and the low-level circulation while selecting the analogs.
As already mentioned in Sect. 2.2, we use daily mean 250 hPa PV to condition the large-scale circulation over Europe and obtain a flow pattern that resembles – in a composite sense – the one of the Boris event on 14 September 2024, the day with the highest 24 h-accumulated precipitation over the impacted region in the IFS analysis and in ERA5 (cf Fig. 1d). The so-determined analogs feature on average a PV maximum over the central Mediterranean separated from the main PV reservoir over northern Europe (Fig. 2c). Using Z500, on the other hand, results in a pattern that completely misses the position of the breaking PV streamer over Scandinavia, and features instead a broader and weaker cutoff over the northern Mediterranean than the PV analogs (Fig. 5a). The “isolation” of the cutoff is evident in the composite PV difference pattern between the two sets of analogs, in particular by the fact that the Z500 analogs have higher PV values over central Europe than the PV analogs, while the composite derived from the PV analogs features a separate maximum over the Mediterranean and lower PV over central Europe (Fig. 5b, d). The relative PV minimum over central Europe also corresponds to a slightly lower precipitation in the PV analogs with respect to the Z500 analogs, resulting from the relative anticyclonic tendency. Such a difference in precipitation might indicate that events like Boris do not correspond to the most extreme rainfall events that can happen over the impacted region, at least in the CESM1 model climatology: this aspect will be further discussed in Sect. 4.3.
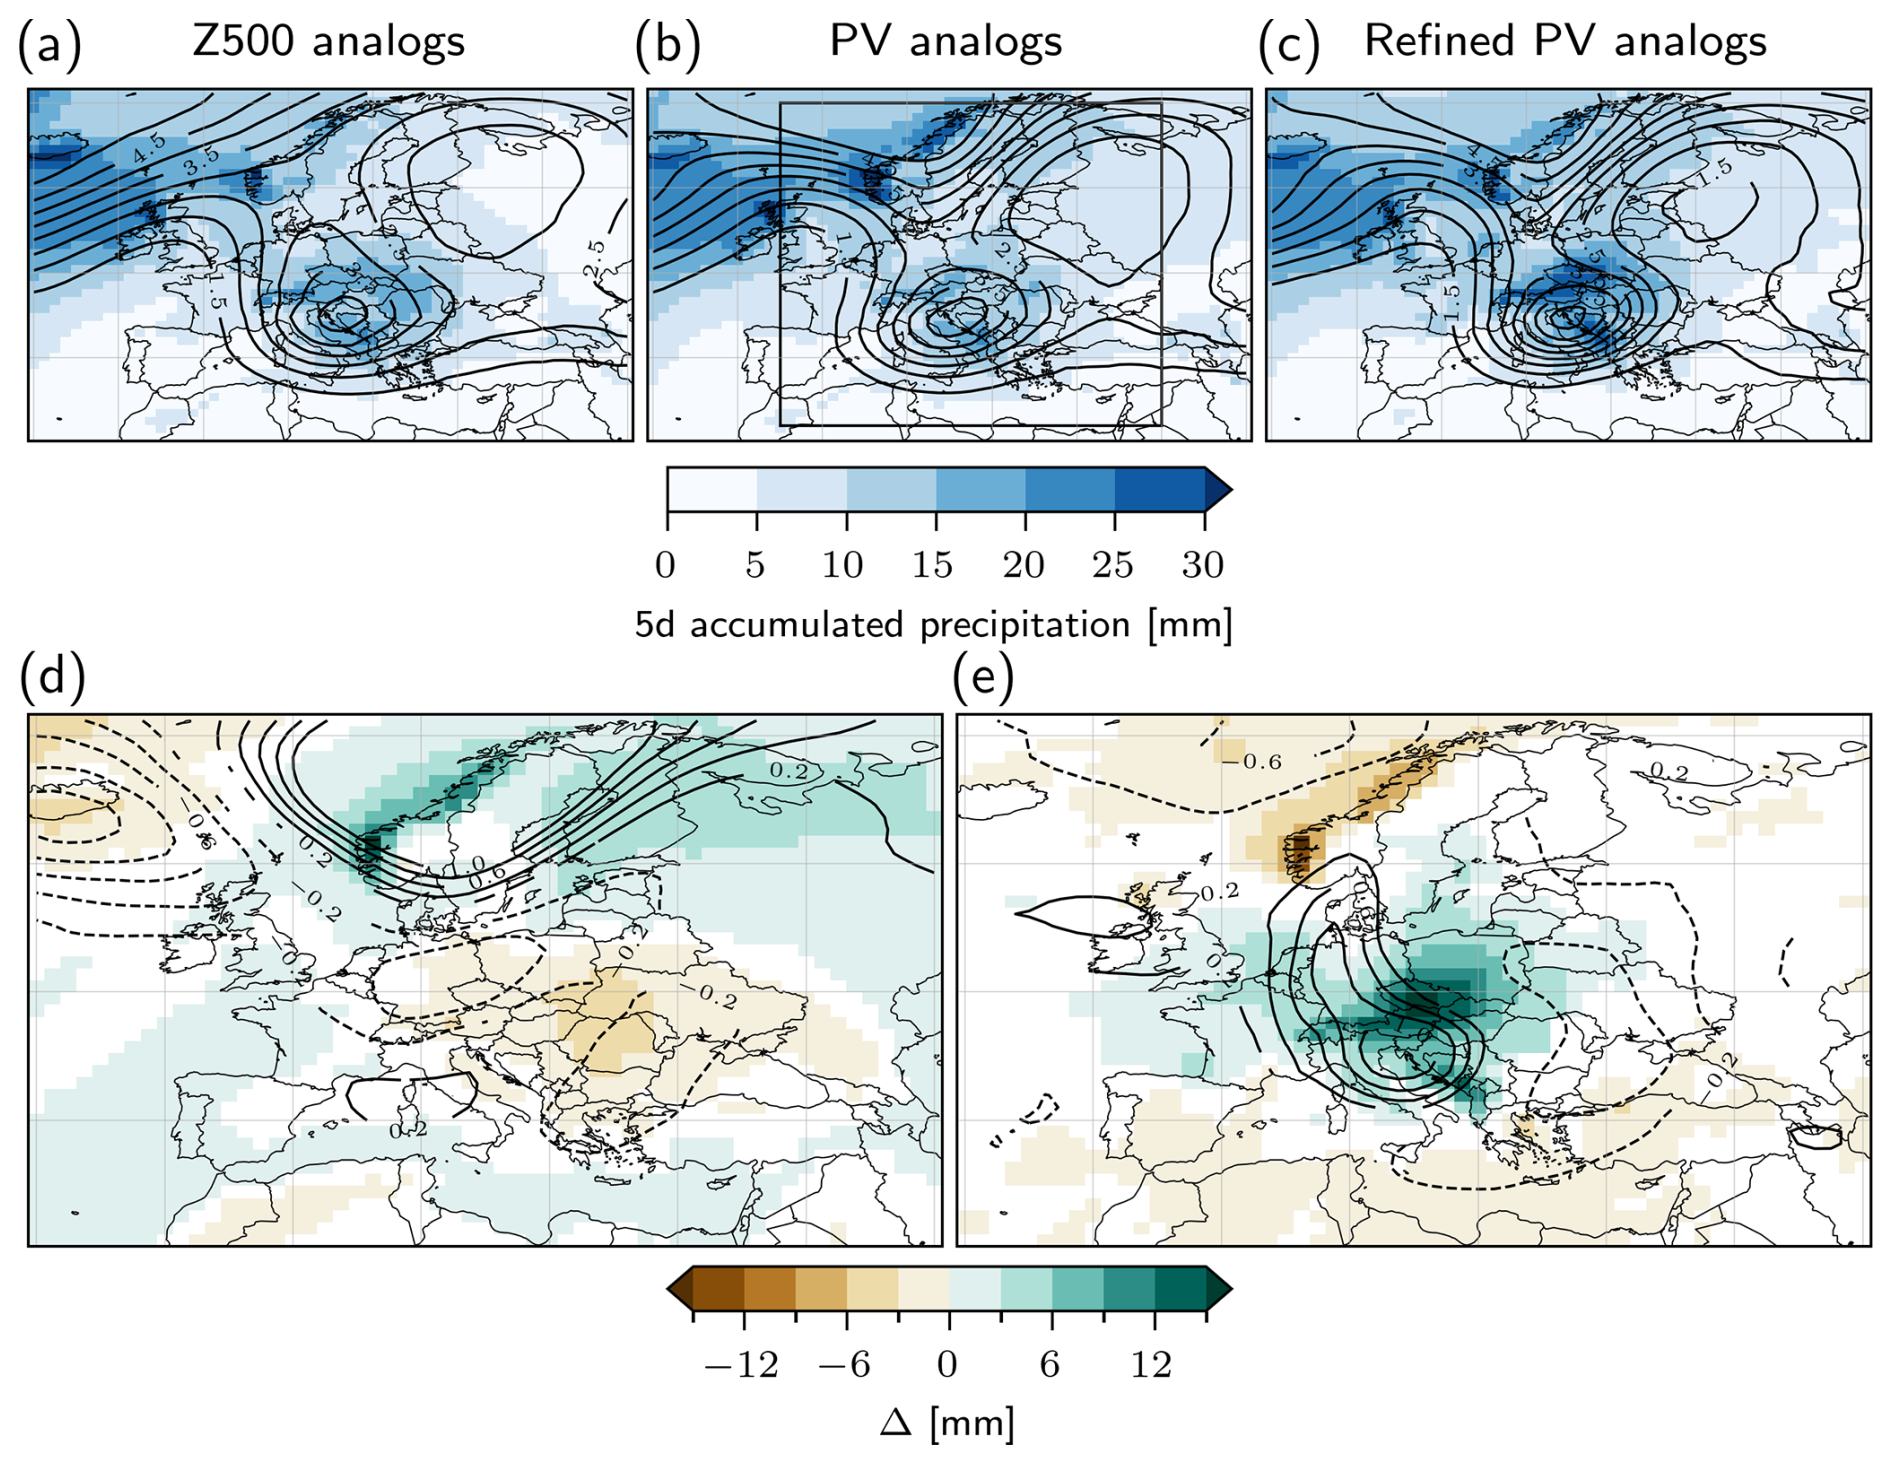
Figure 5Composite mean of PV and precipitation for analogs selected using the Z500 fields, the 250 hPa PV fields and the refined PV analogs. Mean 5 d accumulated precipitation (colors) and 250 hPa PV (contours) for (a) the Z500 analogs (n=1050), (b) all the PV analogs (n=1050) and (c) the refined PV analogs (n=210). All analogs are found in the period 1990–1999 restricted to the August, September, October months (seasonal analogs). The PV contours are drawn every 0.5 PVU. Difference between (d) Z500 and all PV analogs (panel b – panel a) and (e) all PV analogs and refined PV analogs (panel c – panel b). Grid points with no significant differences (see text) are marked as white for the precipitation field and not shown for the PV field.
While the PV analogs condition the upper-tropospheric circulation to be similar to the one of the event, the lower-troposphere may still remain relatively unconstrained, resulting in different patterns of moisture transport. Therefore, we refine the selection of the PV analogs in each period by checking for the presence of a surface cyclone in the region where Boris propagated through. This target region is based on the Vb cyclone track end constraint used by Messmer et al. (2015), slightly shifted northeastward to account for the track of storm Boris (45–53° N, 16–25° E; see Fig. S3). Thus, an analog is selected if a cyclone center is located close to where Storm Boris was located when it reached its maximum precipitation intensity. Remarkably, from the 1050 seasonal PV analogs, only n=210 refined analogs in the period 1990–1999 and n=190 refined analogs in the period 2091–2100 feature a cyclone in the same location as Boris (n=280 in 1990–1999 and n=270 in 2091–2100 for the yearly PV analogs). For the seasonal PV analogs, the majority of tracks originate south of the Alps before propagating northward to the East of the Alps and enter the target region (Fig. S3a, b), bearing similarity to the classic Vb track observed for Storm Boris. Similar cyclone tracks are found in the yearly PV analogs, too, but a larger fraction of them propagates into the target region from the North Atlantic compared to the seasonal PV analogs, remaining north of the Alps (Fig. S3c, d).
The so-obtained set of refined PV analogs features increased precipitation over the same region impacted by Boris, better matching the pattern observed during the event (Fig. 5c, e; see also Fig. S4 for yearly analogs and future climate). In order to quantitatively corroborate the visual impression of Fig. 5, we additionally compute over the same region where the analogs are determined (32–70° N, 5° W–40° E) the euclidean distance between PV and SLP fields in the analogs and the ones of the event, and the Spearman spatial correlation between the analog precipitation field and the one of the event in ERA5 (regridded conservatively at the model resolution). The – not refined – set of 1050 PV analogs has a relatively small distance in the SLP field (around 0.2 hPa per grid-point on average; Fig. S5) and a moderate correlation with the precipitation field of the event (around 0.35 on average). This moderate correlation arises because it is computed over an extended geographical area, and would likely be higher if its computation was restricted to the region in Central Europe with the strongest precipitation (compare also Figs. 6 and 1b). The selection of the correct cyclone position in the lower troposphere improves the representation of precipitation in the analogs: the Spearman spatial correlation increases significantly from 0.35 to 0.42 (p<0.001) for seasonal analogs in the present and from 0.33 to 0.36 (p=0.002) in the future, and from 0.35 to 0.38 (p<0.001) in the present and from 0.35 to 0.38 (p<0.001) in the future for yearly analogs (Fig. S6). On average, events with a low SLP distance tend to have a better precipitation correlation, lending further support to the proposed analog refinement procedure based on the position of the surface cyclone. Refined analogs are also 4 to 8 times more likely to have a 5 d accumulated precipitation exceeding the 75th climatological quantile and belonging to a heavy precipitation object, thus showing that the selection procedure also improves the representation of the most extreme precipitation events (Fig. S7; for the precise definition of heavy precipitation objects, see Sect. S1 in the Supplement). The amplitude of the PV cutoff is also larger for the selected analogs, and the blocking activity downstream of it is enhanced, pinpointing the importance of downstream blocking for Boris' precipitation event (Fig. S8). Note that the reverse procedure could also be implemented, first selecting on SLP analogs and in a second step refining the selection with events featuring an upper-level PV cutoff. We expect that the two procedures would give similar results: however, given that the complex orography of the impacted region might lead to spurious SLP patterns, basing the initial selection on upper tropospheric features seems a preferable option.
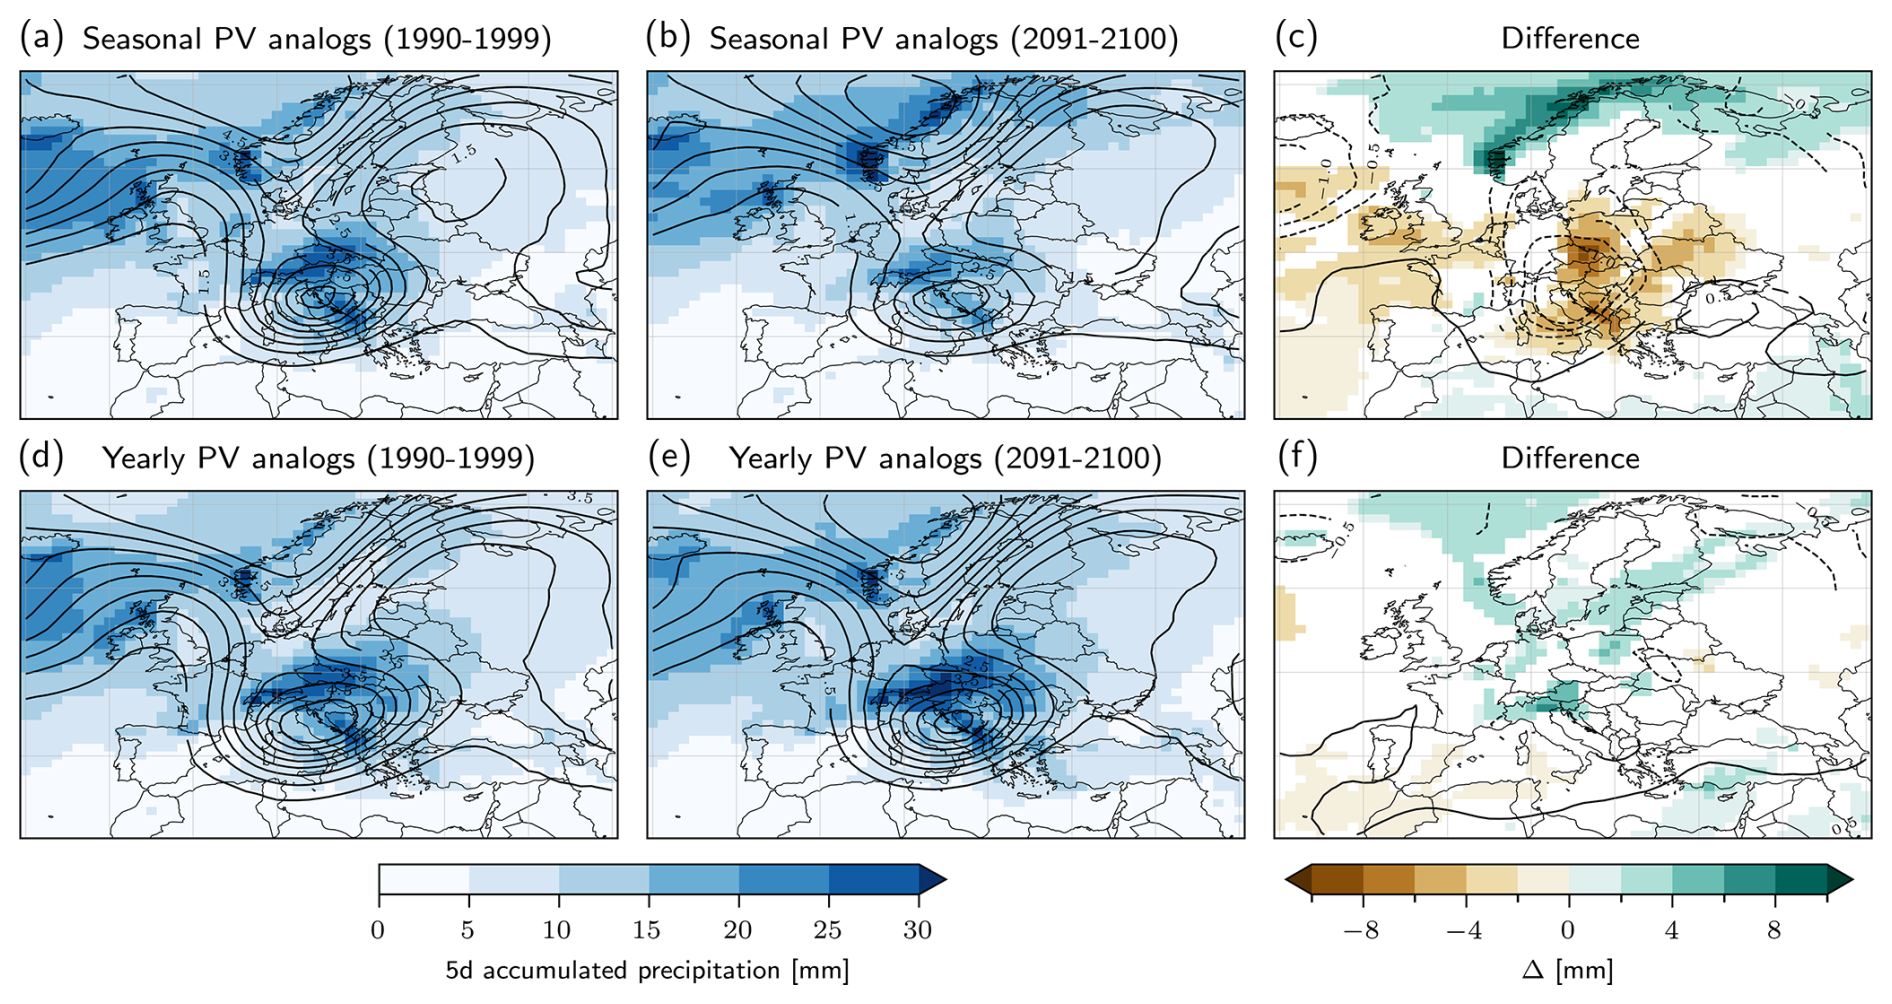
Figure 6Change in the mean precipitation and PV fields of the analogs between the two periods. Mean 5 d accumulated precipitation (colors) and 250 hPa PV (contours) for the (a, b) seasonal and (d, e) yearly PV analogs in the CESM1 simulation in the periods (a, d) 1990–1999 and (b, e) 2091–2100. The PV contours are drawn every 0.5 PVU. Difference between the two periods for (c) seasonal and (f) yearly analogs. Grid points with no significant differences (see text) are marked as white for the precipitation field and not shown for the PV field. For PV, the difference is made after removing a spatial average over the domain shown to take into account the systematic shift in PV with global warming.
In conclusion, the two-step selection procedure outlined above improves the quality of the analogs of Storm Boris, both in terms of large-scale circulation and surface impacts. In the following, unless explicitly specified, we refer to “PV analogs” as the ones obtained from the refined selection procedure. The differences in the characteristics of seasonal and yearly PV analogs between present and future model climate will be discussed in the rest of the study.
4.2 Future changes in Boris-like storms
The 5 d accumulated precipitation and daily mean PV fields averaged over the PV analogs for all periods are displayed in Fig. 6. The mean PV fields are close to the one of the event in all periods (cf. Fig. 2), which gives us confidence in the quality of the analogs found and the relevance of the method for representing the dynamics of Storm Boris. As shown previously with the spatial correlation, the mean precipitation fields are qualitatively similar to the precipitation field of the event, although the values are much less intense. While yearly analogs are almost similar in both their PV and precipitation fields in both periods – except for a small increase in mean precipitation over Austria – there is a large drying in the future for seasonal analogs (Fig. 6c, f). Such a drying is accompanied by a decrease of roughly 2 PVU in the depth of the PV cutoff compared to its environment, a weakening which is also paired with a shallower surface cyclone (Fig. S9a) and reduced downstream blocking activity (Fig. S10a–c).
Because of the large number of analogs, we can additionally look at other quantiles of the conditional distribution of precipitation, especially to extremes. When considering the 90th quantile of the 5 d accumulated precipitation, the seasonal analogs do not display significant changes, which shows that the higher quantiles of the conditional precipitation distribution respond differently (Fig. S11a–c). The yearly PV analogs, conversely, show an intensification of the response of the 90th quantile over the impacted region compared to the mean (Fig. S11d–f). This shift is reflected in the different WCB activity in the analogs, which features no significant change for seasonal analogs but an increase for yearly analogs (Fig. S12). Given the small fraction of analogs which present WCBs over the impacted region (around 10 %), and the local connection between WCBs and extreme precipitation (e.g., Catto et al., 2015; Heitmann et al., 2024), we speculate that WCBs occur during the strongest events and, hence, their change is coherent with the one of the 90th quantile of precipitation.
The different sign of the precipitation change between seasonal and yearly analogs can be understood as a change in the seasonality of Boris-like events. Seasonal PV analogs are uniformly distributed during the months of August, September and October (Fig. S6c). On the contrary, there is a significant (p<0.001) seasonality shift for yearly PV analogs, measured by a χ2 contingency test to estimate changes in frequencies (Fig. S6f). While in the present 29 % of analogs are found in the JJA period, only 19 % are found in JJA in the future. There is also a decrease of analogs found in the SON period (from 31 % to 24 %) which is compensated by an increased frequency in DJF (from 8 % to 14 %) and MAM (from 32 % to 42 %). This leads to a different 2 m air temperature warming response for seasonal and yearly PV analogs, with the former warming twice as rapidly as the latter (+7.2 vs. +3.6 K, see Fig. S13). This shift has important thermodynamical consequences, which will be discussed in Sect. 4.4.
To investigate more systematically the evolution of accumulated precipitation between the two periods, we compute the spatial mean 5 d accumulated precipitation over the impacted region (47.2–51° N and 12–19.5° E) for the analogs (Fig. 7a, b). None of the analogs come close to the actual event in terms of accumulated precipitation, with a difference between the most intense analog event and ERA5 of 50 mm. To make the comparison to ERA5 possible, we use a quantile mapping transformation from the 5 d accumulated precipitation distribution over the period 2000–2024 in ERA5 to the same distribution in CESM1 in the present period in the months August, September, October. Given that Storm Boris is the strongest precipitation event in ERA5 during this period, this is roughly equivalent to rescaling its precipitation to the most intense seasonal extreme in CESM1. The mean precipitation expected in the future model climate from decreases for seasonal analogs (−5.6 mm, p<0.001) while it does not change significantly when considering yearly analogs (+2.5 mm, p=0.06). There is, however, a shape change in the future towards an increase in the variance of +34 % (p=0.2) for seasonal and +57 % (p<0.001) for yearly analogs. To quantify the change in the probability of an event as intense or more than Storm Boris, we fit a Gamma distribution with the maximum likelihood method to the analogs distribution of precipitation in each period and for each analog type. The choice of the Gamma distribution was made for its simplicity of estimation and because it is commonly used to represent precipitation distributions (Martinez-Villalobos and Neelin, 2019). To evaluate the sensitivity of the fit with respect to limited sample size, we estimate the probability of an event as intense as Boris over 1000 resampled analogs – with replacement – of precipitation data, always fitting a Gamma distribution. This translates into an increased probability of observing an event such as Storm Boris for both seasonal and yearly analogs by a factor of 2 to 10, although the probability remains small in both periods, typically around 10−2 (Fig. 7e, f). As the absolute intensity reached by the event is much higher than anything observed in the model, these probabilities should be taken with great care because they depend strongly on the parametric extrapolation with the Gamma distribution. It is nonetheless clear from the histograms of the analogs precipitation that the change in the variance leads to increased probabilities of the most intense events in the future despite the fact that the mean may not change much (yearly analogs) or even decrease (seasonal analogs).
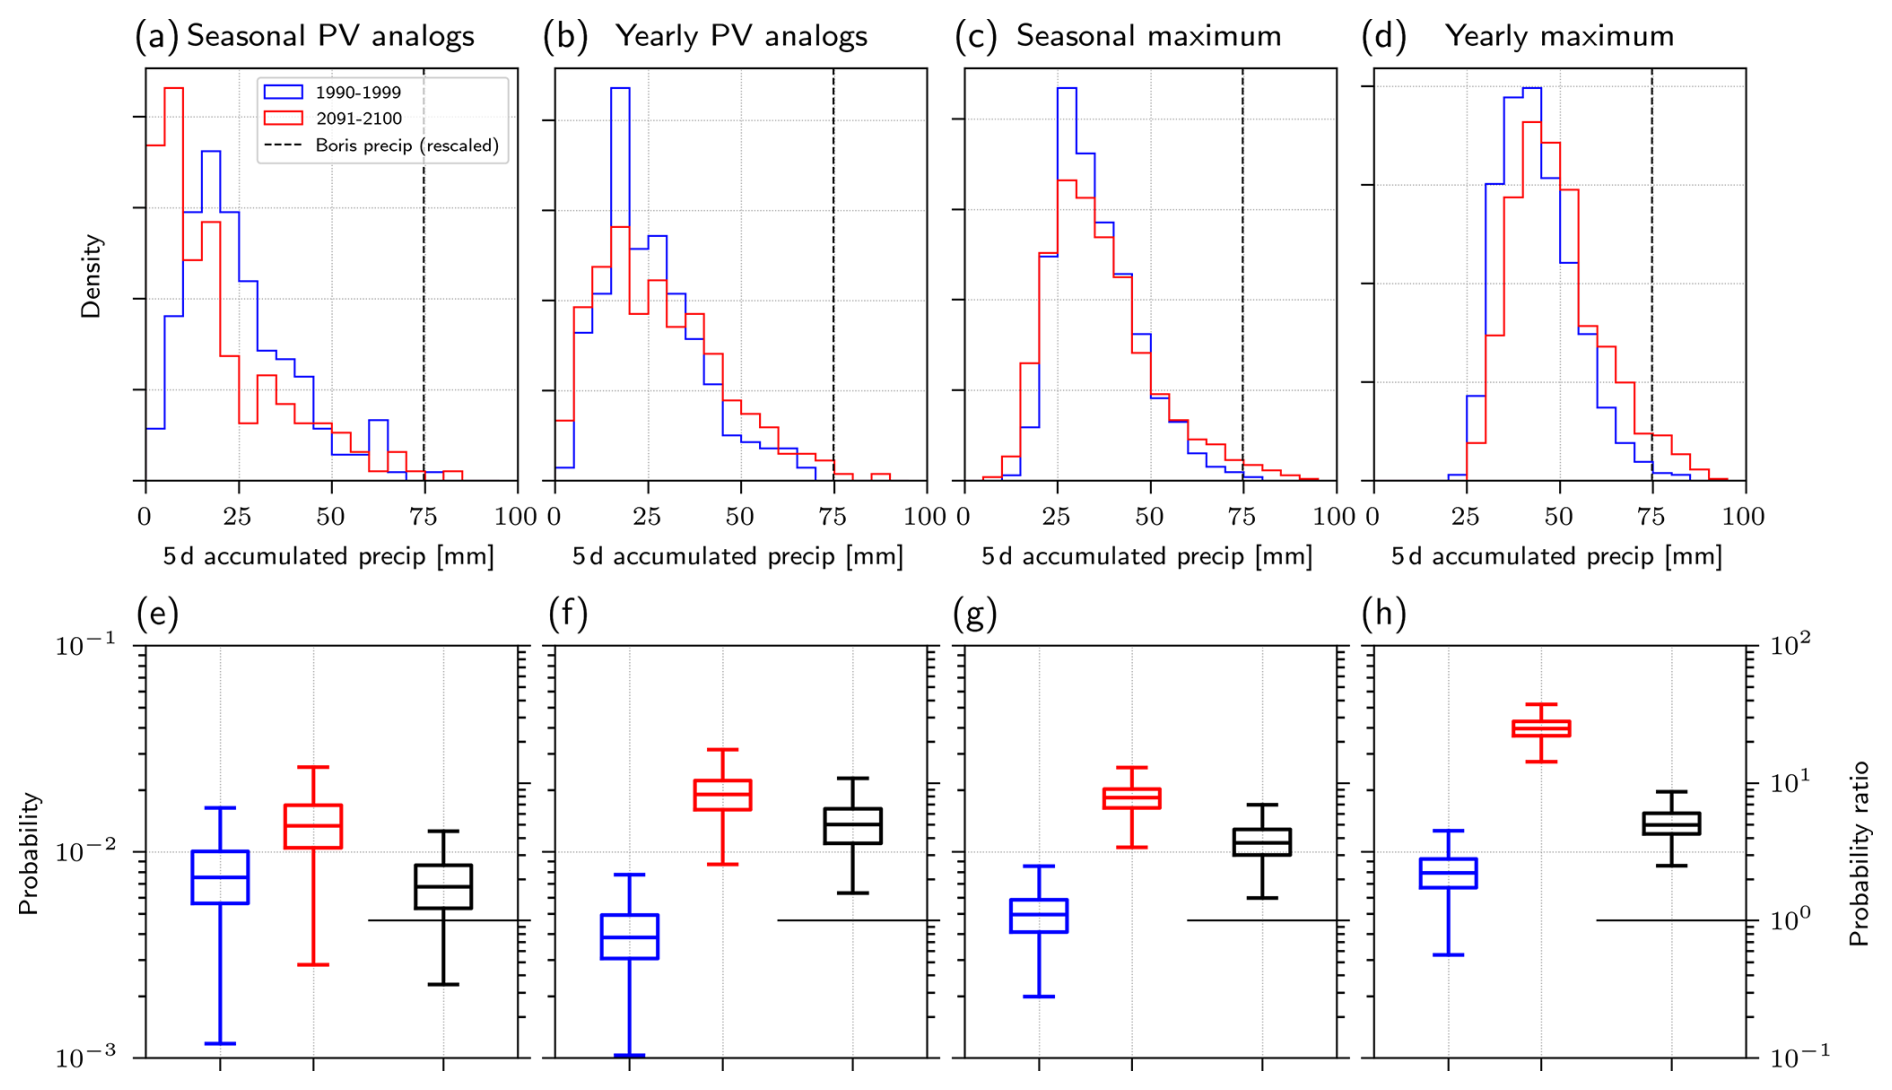
Figure 7Distribution of mean precipitation in the impacted region (47.2–51° N and 12–19.5° E) for analogs and maximum events. Distribution of spatial mean 5 d accumulated precipitation over the impacted region for the (a) seasonal and (b) yearly PV analogs and the maximum (c) seasonal and (d) yearly events in the periods 1990–1999 (blue) and 2091–2100 (red). The number of events vary for the PV analogs (see Sect. 2.2) but not for the seasonal and yearly maximum events (n=1050 in both periods). The corresponding precipitation in ERA5 (after rescaling via quantile mapping to the present CESM1 distribution) for the Storm Boris over the same region are shown with a vertical dashed line. Probability to reach the rescaled ERA5 precipitation over the impacted region for the (e) seasonal and (f) yearly PV analogs and the maximum (g) seasonal and (h) yearly events in the periods 1990–1999 (blue) and 2091–2100 (red). Probabilities are estimated using a Gamma distribution for PV analogs and a GEV distribution for maximum events. The boxplots show the distribution of estimated probabilities over bootstrapped samples (see text). The black boxplots show the corresponding distribution of probability ratios.
4.3 Comparison with an unconditional approach
We now compare the results obtained using flow analogs with the distribution of the yearly and seasonal maximum of the spatially averaged 5 d accumulated precipitation in the model for each period, conditioning only on the occurrence of extreme precipitation regardless of the presence of a similar dynamics as the one observed during Storm Boris (Fig. 7c, d). While there is a significant increase in the mean only for yearly maximum events (+1.1 mm (p=0.06) for seasonal maxima and +5.4 mm (p<0.001) for yearly maxima), there is a similar increase in the variance of the distribution of maximum precipitation in both periods (+70 % (p<0.001) for seasonal maxima and +58 % (p<0.001) for yearly maxima). To quantify the probability of an event as intense or more than Storm Boris we use the previously described bootstrap procedure, but this time fitting a GEV distribution as we now consider block maxima (where such a distribution can be expected, cf. Coles, 2001). This also leads to the most intense events becoming more likely: a similar event as Boris is between 100 and 1000 times more likely in the future (Fig. 7g, h). As previously, these estimated probabilities should be taken with caution because (i) it is not clear that a GEV distribution is adapted to fit yearly maximum precipitation (Alaya et al., 2020) and (ii) none of the events in the model come close to the actual precipitation of Boris.
Although the dynamics of unconditioned precipitation maxima has some similarities with that of Storm Boris, there are also important differences. In contrast to the Boris case, the PV cutoff is not fully isolated from the main flow and the intensity of the anticyclonic structure downstream is lower (Fig. S14a, b, d, e). The precipitation fields generally bears a large spatial similarity with the event, with an increased intensity compared to the analogs mean as one could expect when considering seasonal and yearly maximum events. The change in the dynamics for these events is somewhat similar to the PV analogs found earlier: for seasonal maxima the precipitation field is not associated to major changes in the impacted region while the PV field sees a small reduction in its intensity in the future (Fig. S14c). For yearly maxima events, on the other hand, the PV field does not show important changes with respect to the present climate but precipitation increase strongly over the impacted region and in the Western Balkans (Fig. S14f).
4.4 Extreme precipitation scaling
In the impacted region, the mean 5 d accumulated precipitation changes at a rate of −3.1 % K−1 for seasonal and +2.7 % K−1 for yearly PV analogs – where the mean warming is the difference between the present and the future analogs 2 m air temperature in the impacted region. For yearly PV analogs, the change is close to the mean change in precipitation in the “dry-get-dryer, wet-get-wetter” paradigm of 2 % K−1–3 % K−1 (Held and Soden, 2006; Byrne and O’Gorman, 2015). This is, however, not the case for seasonal PV analogs for which, despite a strong warming of +7.2 K between present and future analogs, the average precipitation decreases. Even though such a decrease might look surprising, it is consistent with previous work that focused on extreme precipitation events over the Mediterranean (Armon et al., 2022) or that resulted from Vb cyclones with a track similar to Boris (Messmer et al., 2020).
We now investigate further this discrepancy between the expected increase in specific humidity under constant relative humidity with the Clausius–Clapeyron relationship of 7 % K−1 and the actual precipitation evolution for the PV analogs using the scaling precipitation introduced in Sect. 2.4. We compute for each analog the 5 d accumulated scaling precipitation over the impacted region based on Eq. (1), and compare it with the actual precipitation in the model for seasonal and PV analogs to verify the approximate validity of the scaling (Fig. 8a, b). The precipitation values obtained from the scaling relationship are generally close to the actual precipitation except in case of – relatively – low precipitation, which happens more often in the future period for seasonal analogs as discussed previously. This discrepancy can be expected because the extreme precipitation scaling of Eq. (1) is applied also to analogs with low or moderate precipitation, where the underlying hypotheses begin to fail (O'Gorman and Schneider, 2009). Nonetheless, the agreement with the actual precipitation in the model are quite good, and we are therefore confident in the capacity of this scaling to explain first-order changes between the present and future distributions of precipitation. As previously, the mean and 90th quantile of the conditional precipitation distributions are close in both periods for seasonal PV analogs but the two of them increase in the future for yearly PV analogs, the 90th quantile responding more strongly to warming than the mean for both actual and scaling precipitation (see the blue and red diamond and squares in Fig. 8a, b). For seasonal PV analogs the scaling precipitation shows no decrease in the mean compared to actual precipitation in the model, another side effect of the overestimation of weak precipitation (< 10 mm) by the extreme precipitation scaling.
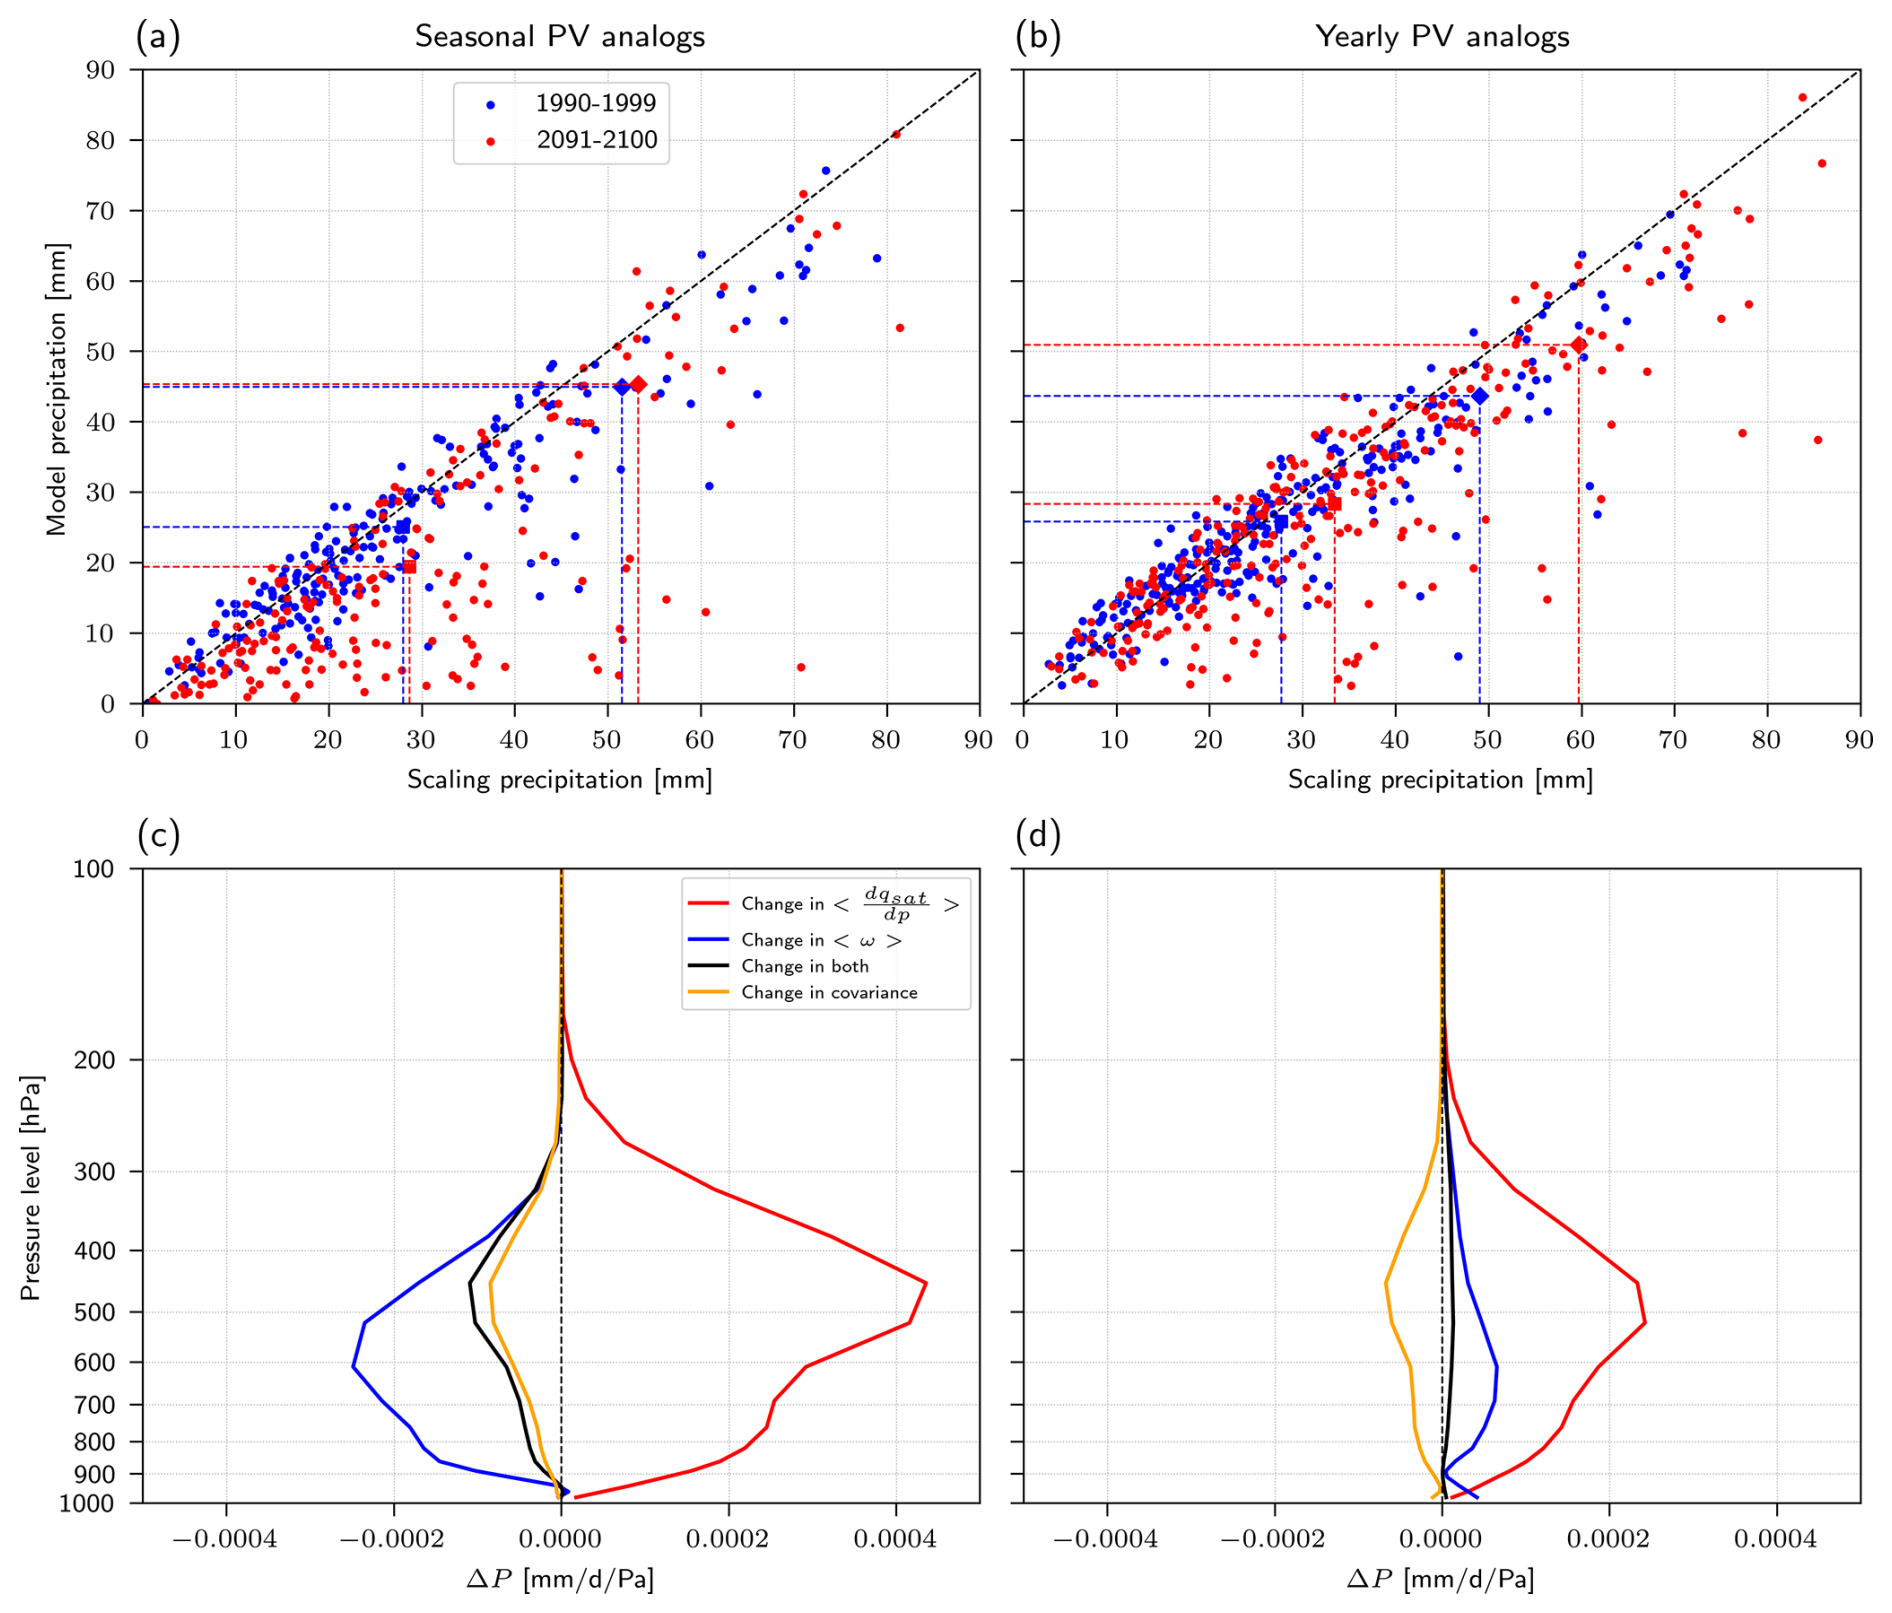
Figure 8Scaling precipitation and attribution of changes to dynamical and thermodynamical components. Mean scaling precipitation vs. model precipitation for the impacted region (47.2–51° N and 12–19.5° E) for (a) seasonal and (b) yearly PV analogs in the periods 1990–1999 (blue) and 2091–2100 (red). The square (resp. diamond) markers show the average (resp. 90th quantile) in each period. The black dashed line shows the y=x line. Scaling precipitation change between the two periods for the (c) seasonal and (d) yearly PV analogs.
As detailed in Sect. 2.4, we then attribute the change in scaling precipitation at each pressure level to thermodynamical changes due to the Clausius–Clapeyron relationship (change in ), dynamical changes due to upward wind speed (change in Δω), change in both of those quantities at the same time and change in their covariance (Fig. 8c, d). For both types of analogs the thermodynamical response is largely positive. It is larger for seasonal analogs because of a larger warming when conditioning on the same season (+7.2 vs. +3.6 K at 2 m) due to a seasonal shift in the yearly PV analogs (Fig. S13c, f). On the contrary, the dynamical contribution is negative for seasonal PV analogs – meaning that the mean vertical velocity decreases between the two periods – while slightly positive for yearly PV analogs. The change in both quantities at the same time is negative for seasonal PV analogs and null for yearly PV analogs, and its amplitude is smaller than the two other terms as expected. Finally, the change in the covariance is slightly negative for both seasonal and yearly analogs, meaning that atmospheric situations with updrafts happen less often in situations with positive anomalies of in the future. As a consequence, the change in the dynamical contribution of precipitation compensate the strong thermodynamical signal in the future which leads to minimal changes in mean scaling precipitation for seasonal PV analogs (Fig. 8a). For yearly analogs – for which by definition the dynamics is closer to the one of the event – the dynamics contribution is small and the response is dominated by the thermodynamical signal, resulting in the positive increase in both scaling and actual precipitation seen in Fig. 8b.
From a dynamical point of view, the reduction in vertical velocity in future seasonal analogs is likely related to the upward displacement of the tropopause expected with tropospheric warming (Meng et al., 2021). This process would result in weaker horizontal PV gradients at 250 hPa (Fig. 6c) and, consequently, in a weaker differential vorticity advection at upper levels (a process forcing vertical motions in the QG-omega equation, see, e.g., Davies, 2015). To check this mechanism we compute the vertical wind speed of analogs predicted by the QG-omega equation in the mid-troposphere (650 hPa), and average it over the analogs to estimate the large-scale forcing for ascent resulting from the upper-level flow. As expected from the change in the PV fields between the two periods, the forcing due to upper levels is much weaker in the impacted region in the future for seasonal analogs, while it does not significantly change for yearly analogs (Fig. 9). The forcing due to lower levels, on the other hand, shows minimal change for both seasonal and yearly analogs, further highlighting the role of upper-level circulation changes (Fig. S15). We additionally computed the scaling equation using the QG-omega vertical wind (Fig. S16) instead of the actual wind and found similar results as in Fig. 8, with the important difference that scaling precipitation using the QG omega wind tends to be 2–3 times smaller because of the underestimation of the vertical wind velocity by the QG approximation.
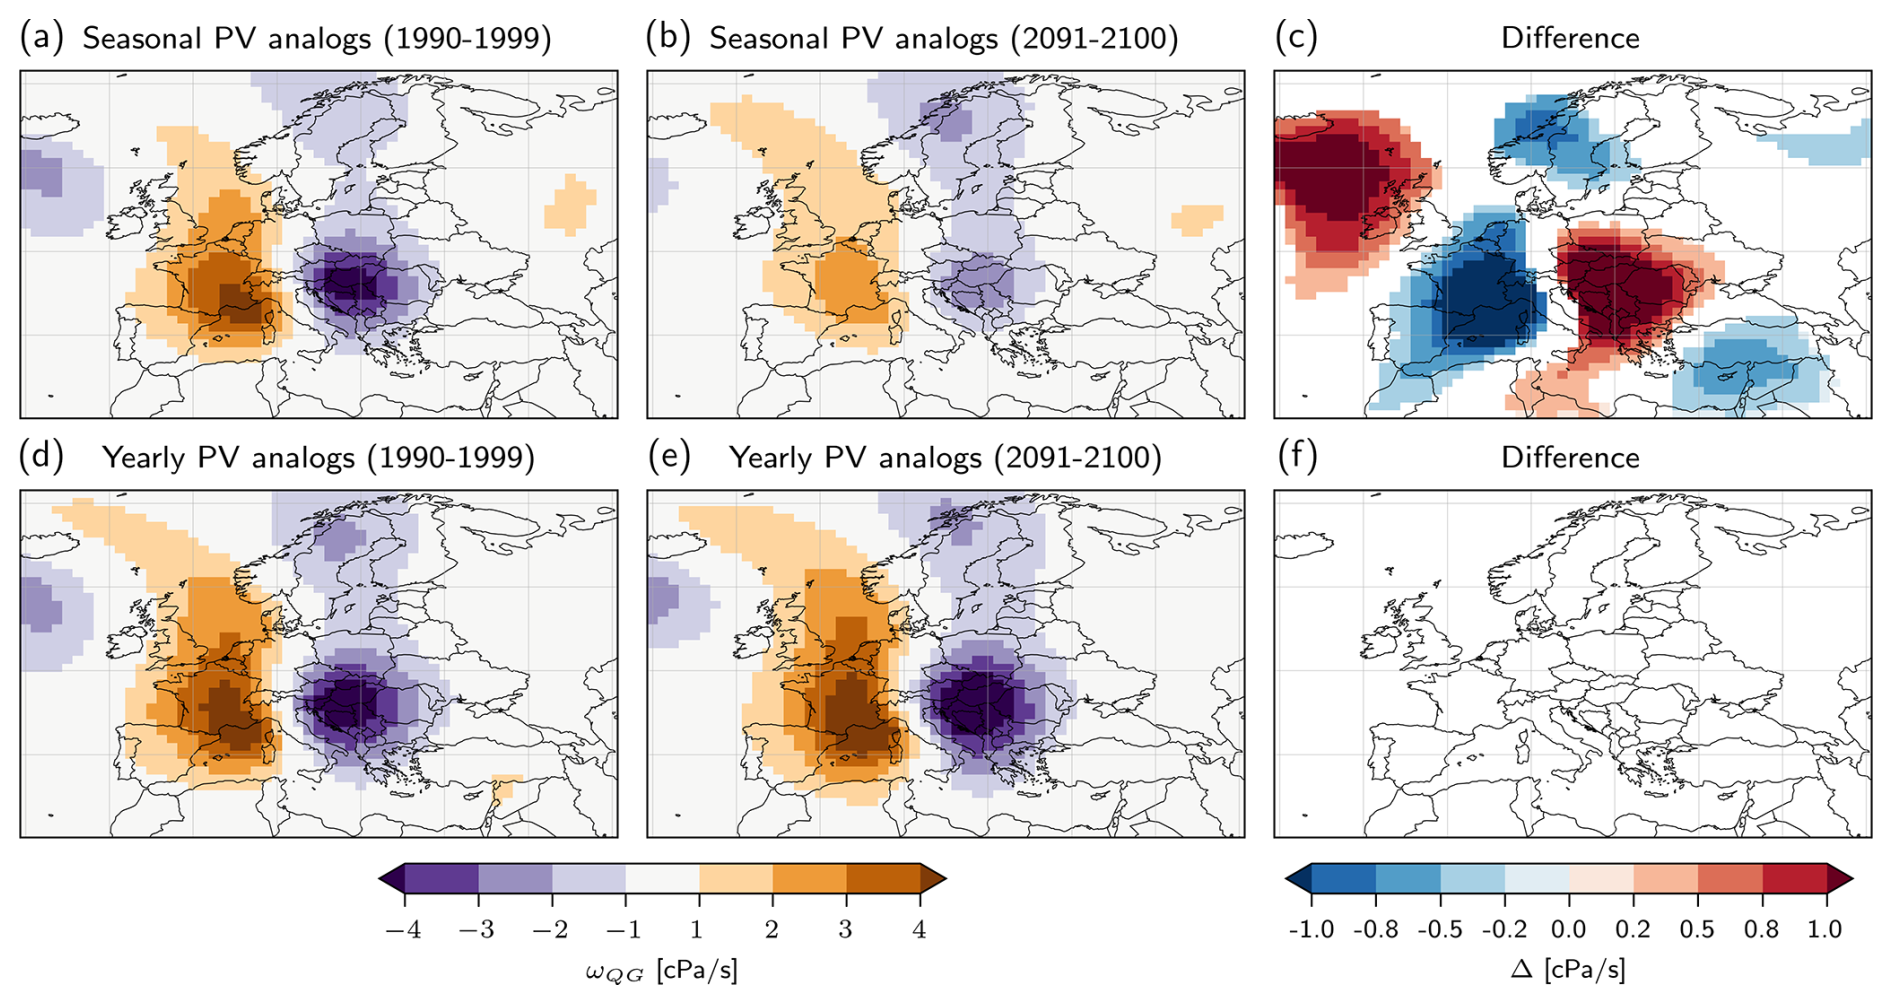
Figure 9Change in the mean QG vertical wind speed. Mean QG ascent at 650 hPa due to upper levels for the (a, b) seasonal and (d, e) yearly PV analogs in the CESM1 simulation in the periods (a, d) 1990–1999 and (b, e) 2091–2100. Only QG forcing from levels above 550 hPa is shown. Positive values show downward forcing and negative values uplift forcing. Difference between the two periods for (c) seasonal and (f) yearly analogs. Grid points with no significant differences (see text) are marked as white.
Finally, we notice that a similar difference in scaling between seasonal and yearly events also exists for the unconditioned extreme precipitation events, which feature a rate of change of precipitation with respect to warming of only +0.7 % K−1 for the seasonal and of +6.8 % K−1 for the yearly maxima of precipitation. While the change in yearly maximum events is close to the expected Clausius–Clapeyron scaling of +7 % K−1 for the strongest events, restricting to the seasonal maximum show a much lower change in maximum precipitation. This likely reflects a change in dynamics similar to the one observed for seasonal and yearly PV analogs, with a lower intensity of the PV cutoff in the future for seasonal maximum events (as can be inferred from Fig. S14).
In conclusion, the outlined results support our interpretation that dynamical changes in the large scale forcing for ascent are able to substantially modulate the occurrence of extreme precipitation related to upper-level PV cutoffs, as in the case of Storm Boris.
In this piece of work, we have framed the question of the effect of anthropogenic global warming on Boris-like storms in the context of different attribution approaches, employing both so-called “conditional/dynamical” and “unconditional/probabilistic” methods. In this section, we would like to draw more general insights about the differences between these methodologies, with the aim to inform future research work relying on these approaches.
5.1 Definition of “Boris-like” events
Although the attribution question – has the likelihood/intensity of a Boris-like storm increased under climate change? – seems simple at first glance, the way such a question is framed in practice can influence the answer to a large extent. Aside from model uncertainties and data limitations, the ambiguity of the question lies first of all in what one means by “Boris-like storms”, as already pointed out by several studies (Cattiaux and Ribes, 2018; Naveau et al., 2020), which showed that how the event is defined spatially and temporally greatly influences the results of the attribution. This is rather intuitive when employing the unconditional approach (based on, e.g., GEV fits): for instance, a too large or too small spatial area to define the event could blur the severity of the event with respect to the background. Here we investigate another ambiguity related to the definition of the event: namely whether we should compare events with similar intensities or similar dynamics. To do so we applied both a conditional and an unconditional approach to the same climate model data. If one defines “Boris-like storms” by conditioning on events with the same atmospheric dynamics and occurring in the same season as the event, then we showed that on average they are expected to lead to less intense precipitation in a warmer world – although the precipitation of the analogs with the most intense precipitation (90th quantile) do not change significantly. If such “Boris-like storms” are allowed to be found in other seasons, however, then they are more intense both on average and for the most extremes – the increase in the extremes being larger than for the average. If one frames the question as in probabilistic attribution methods – i.e. without any conditioning on the actual dynamics of the event and focusing only on the intensity of precipitation – and therefore understand “Boris-like storms” as events producing at least similarly intense precipitation, then this kind of events are expected to become more intense if they occur in the same season, and even more intense if they occur in any season.
5.2 Choice of attribution approach
Conditional and unconditional attribution methods answer different questions and serve different purposes. The unconditional approach is likely the most useful with regards to impacts for the layperson, who may not be interested in whether the next impactful storm will be similar to Boris but whether they can expect more or less intense precipitation from it. However, one does not necessarily need to observe a storm like Boris to answer this question: in this regard, the probabilistic approach only uses the observation of an event as a pretext, without addressing the peculiarities of the actual observed event. This may lead to a form of selection bias when evaluating the evolution of extreme events with climate change (Barlow et al., 2020; van Oldenborgh et al., 2021; Miralles and Davison, 2023). In contrast, conditional attribution methods do consider the dynamics of the event observed and try to assess how an event with similar dynamics would unfold in a warmer/colder world. In this sense they may be less relevant for the layperson, but be more understandable and scientifically accurate than the unconditional approaches, which pose the risk of implicitly comparing events with very different dynamics. The example of Storm Boris shows it clearly, because the large-scale circulation analogs do not necessarily correspond to the occurrences of maximum precipitation in the model climatology. This mismatch may muddle our understanding of how global warming has affected or will affect this type of extreme event: for instance, how could one reliably connect potential trends in the most extreme precipitation events over central Europe to trends in the occurrence of PV cutoffs over the Mediterranean, if such extreme events are not actually related to PV cutoffs? Thus, we believe that attribution studies of real-world events would profit of a more systematic comparison between methods and of an explicit consideration of event dynamics, like the approach employed in this study.
5.3 Implications for modeling-based attribution frameworks
Our results might also have some implications for other conditional attribution methods, such as nudging or PGW. Those two methods can impose the same dynamics as the observed event in a future/past climate, and simulate its evolution with a weather or climate model. The use of analogs, on the other hand, selects events that are as close as possible to the one observed in terms of dynamics, without imposing any external constraint on the model itself. If such events with similar dynamics show a systematic circulation shift between the two periods – i.e., if the closest analogs of the event are not as close in one period compared to the other – this allows to directly recover dynamical changes. As discussed previously, we showed that there are substantial changes in the dynamics of Boris-like storms for analogous events occurring in the same season, with less intense PV cutoffs leading to less intense large-scale forcing for ascent – measured here with the QG vertical wind – which in turns leads to a dynamical damping of extreme precipitation. We believe that representing such a large change in dynamics (i.e., a drop of the central PV in the cutoff from ∼ 5 to ∼ 3 PVU, see Fig. 6a, b) might be challenging for nudging-like methods. Consequently it becomes possible that, by forcing a similar dynamics in both the factual and future counterfactual periods, these methods compare events with vastly different return times: in other words, a similarly deep cutoff as the one associated with Storm Boris would be way more unlikely to occur in September in the future compared to the present. Storyline approaches – whose goal is to isolate the thermodynamical response of a particular event by conditioning on the dynamics in different periods – should therefore seriously consider the possibility that the dynamics constrained may be much more unlikely in future periods. This should be taken into account when assessing the practical implications of such results. The same issue might apply to more refined PGW approaches, such as using nested high-resolution model runs to performed quasi-real-time case study attribution: it is important to be mindful of this potential problem when designing such studies, and address it by an explicit treatment of dynamical changes (see, e.g., Brogli et al., 2023).
5.4 Limitations
The CESM1 climate model used here to evaluate changes in Boris-like storms has a relatively coarse resolution and its capacity to simulate mesoscale extreme events can therefore be questioned, as already pointed out by previous works (Dolores-Tesillos et al., 2022; Joos et al., 2023; Karwat et al., 2024; Binder and Wernli, 2025). We do not expect the model to reproduce correctly the climatology of mesoscale extreme precipitation events, nor the intensity of extreme precipitation (see our discussion of Fig. 7). During Storm Boris, however, an important part of the ascending motions that led to precipitation could be ascribed to the large-scale forcing of the PV cutoff. This mechanism is resolved at the resolution of the model and therefore we can reasonably expect that its evolution in a future climate with weaker cutoffs is well reproduced. Moreover, even if the model could not fully reproduce the climatology of weak cyclones in the Mediterranean or cutoff lows in Central Europe, we expect the bias with respect to the real-world climatology to cancel out because we compare two periods inside the same model, and to obtain a reasonable estimate of the change between the two periods. This is especially true when conditioning on similar atmospheric patterns: the model may be biased in how it represents the frequency of cutoffs and Vb cyclones, but we may also expect that its physics is reasonably close to the truth conditional on the observation of a cutoff and a Vb cyclone.
Another obvious limitation of this study is its reliance on a single model and a single, high-end warming scenario. While we acknowledge that using only one model might indeed constitute a major limitation, especially when it comes to investigating extreme precipitation, we also have to keep in mind that not many climate models have available more than 1000 years of three-dimensional data at 6-hourly resolution, which we have employed for extensive analogs and precipitation scaling analysis. The use of a high-end scenario, on the other hand, results in an improvement of the signal-to-noise ratio when detecting dynamical changes in weather systems, which are known to be much smaller than the thermodynamical changes.
In this study we have employed an analog-based approach to study the unfolding of Boris-like events in a warmer climate. By relying on hundreds of simulated years from reruns of the CESM1 large ensemble with detailed model level output, we are able to circumvent the problem of lack of good analogs for extreme events that usually affects analog-based attribution studies. Furthermore, the relatively high spatial and temporal resolution of the three-dimensional CESM1 output allowed the deployment of sophisticated dynamical diagnostics, that gave important insights into the dynamics of Storm Boris in present and future climates: noteworthy in this regard are the correct depiction of the PV cutoff and of the Vb cyclone track related to Storm Boris, the relevance of atmospheric blocking and WCBs for the occurrence of extreme precipitation, and the quantification of changes in dynamically-driven forcing for ascent. The proposed dynamics-informed approach can be applied to other cutoff related, extreme precipitation events (which are notoriously difficult to study using analog-based approaches, as noticed by Thompson et al., 2024), with the aim to increase the robustness and the physical consistency of attribution statements and of other analog-based studies. From a physical point of view, it is noteworthy that not only the thermodynamical response due to the Clausius–Clapeyron scaling of saturation specific humidity is important for the evolution of the intensity of the event, but also the dynamical response due to changes in the properties of the upper-level cutoff low associated with the storm. We showed that this dynamical response can be strong enough to compensate the thermodynamical response and even reverse the sign of the expected positive intensity change. This dynamical effect is complemented by the seasonality change displayed by Boris-like events in the CESM simulations, whose occurrence shifts towards the shoulder seasons. It is also consistent with the recent work by Zhu et al. (2025) that documents a general shift in the timing of mid-latitude extreme precipitation events towards the cold season as climate warms. Such a seasonality change might bear potential implications for adaptation, because the occurrence of the same extreme precipitation event in a different season might not necessarily lead to the same impacts (e.g., Tarasova et al., 2023).
In addition to the attribution statement for Boris-like events, we propose here three more general “lessons learnt” from the complementary dynamically-informed investigations performed in this study.
It is possible to improve the selection of large-scale flow analogs for extreme precipitation events by including specific dynamical information, e.g., by using upper-level PV or by explicitly checking for the correct position of the surface cyclone in the analogs. The inclusion of dynamics is particularly important for large-scale, heavy precipitation events, which cannot happen if the adequate dynamical forcing for ascent is not present. The synoptic-scale circulation also contributes indirectly to the extremeness of the event by inducing a slow-moving flow pattern (featuring, e.g., the presence of Rossby wave breaking and atmospheric blocking), that exacerbates precipitation over the same regions. Slightly different processes might be at play for mesoscale or local-scale extreme precipitation events that are most often related to trailing convection: for instance, the vicinity to the sea and the enhancement of convection by latent heat release might locally compensate the reduction in QG forcing (Llasat et al., 2007). However, the occurrence of such events still cannot completely prescind from a favorable large-scale setup: an example is the 2024 Valencia flash-flood, that occurred in correspondence to a slow-moving, upper-level PV cutoff, i.e., in a situation with dynamical similarities to Storm Boris. This consideration leads us to speculate that the representation of this type of mesoscale extreme events in analogs could also be improved by an appropriate consideration of atmospheric dynamics.
The methodology chosen to define the extreme event of interest can substantially affect the conclusions of projection/attribution studies, and even result in opposite climate change signals. The case of Storm Boris is emblematic, because the choice of computing yearly or seasonal analogs results in different attribution outcomes. Thanks to the comparison of different methods, we were able to reconcile the diverging results: the weakening observed when focusing on seasonal analogs can be contextualized as part of a shift in event seasonality, that emerges when yearly analogs are considered. Defining a Boris-like event by relying only on the precipitation totals is also problematic, because this choice might lead to events driven by different dynamics to be implicitly compared, hindering the comprehension of the physical processes at play. It is remarkable, although not surprising per se, to notice that even in an “ideal” situation, when enough data are available to correctly identify analogs, one still cannot escape the ambiguity related to the practical definition of the event. This important limitation contextualizes the outcome of every attribution assessment with respect to the chosen methodology, with no approach being a priori better or worse than the other. That's why we believe that this study could be regarded as a sort of “meta-attribution”, where methodologies are compared and their differences understood thanks to the use of dynamical diagnostics, rather than as a final attribution/projection statement about Storm Boris.
The use of model nudging frameworks to replicate extreme precipitation events in a warmer climate should be evaluated with particular care to correctly consider the change of dynamics – and of their coupling with the thermodynamics – between present and future climate. This work shows that, at least in the “model world” of CESM1, such changes can be substantial and may result in an over- or underestimation of the precipitation when not adequately taken into account. Simulating a Boris-like event in a future climate while nudging the same PV structure of the present-climate, for instance, would likely result in an unrealistically strong precipitation event, with return times much larger than the ones of Boris in the current climate.
The IFS analysis and the ERA5 reanalyses (Hersbach et al., 2020) can be obtained from the Copernicus Climate Change Service, Climate Data Store (https://doi.org/10.24381/cds.adbb2d47, Hersbach et al., 2023). IFS analysis data were retrieved from the MARS Catalogue https://apps.ecmwf.int/mars-catalogue (restricted access, ECMWF, 2024). The code for the CESM model (Hurrell et al., 2013) that was used in the CESM-LE simulations is available from https://www.cesm.ucar.edu/models/releases (last access: 20 September 2024). The model outputs of the CESM-LE reruns, together with the climatologies of blocking, warm conveyor belts, extratropical cyclone and QG-forcing for ascent used in this study (both in the model and reanalysis) are available from the authors upon request.
The supplement related to this article is available online at https://doi.org/10.5194/wcd-7-65-2026-supplement.
EA oversaw the analysis of precipitation data, IT performed and interpreted the moisture source diagnostic, VS performed the analysis of atmospheric blocking, HB the analysis of warm conveyor belts, MS the analysis of QG forcing for ascent, KH the computation and analysis the heavy precipitation objects, and MF (together with MS) performed the cyclone identification and tracking, both in observations and model data. RN performed the analogs computation and the connected attribution, scaling and statistical analyses. JR coordinated the project and, together with RN, wrote the manuscript. All authors contributed to the interpretation of the results and the editing of the manuscript.
The contact author has declared that none of the authors has any competing interests.
Publisher's note: Copernicus Publications remains neutral with regard to jurisdictional claims made in the text, published maps, institutional affiliations, or any other geographical representation in this paper. The authors bear the ultimate responsibility for providing appropriate place names. Views expressed in the text are those of the authors and do not necessarily reflect the views of the publisher.
We are thankful to the two anonymous reviewers, whose comments helped to improve and further clarify the manuscript. This work stems from a collaborative effort from several colleagues in the group of Atmospheric Dynamics at the Institute for Atmospheric and Climate Science of ETH Zurich and was initiated by Heini Wernli, whom we thank for the initial idea and for the ongoing fruitful discussions and feedback. We thank MeteoSwiss and ECMWF for granting access to the IFS model analysis and the ERA5 reanalyses, Urs Beyerle (ETH Zurich) for performing the CESM-LE reruns as a contribution to the ERC project INTEXseas, and Franziska Aemisegger for providing the msd-cpp code for the calculation of the moisture sources.
JR received funding from the Swiss National Science Foundation (SNSF) via grant no. 209135. RN has received funding from the Swiss National Science Foundation (SNSF) via grant no. 216710. The contribution of MF is funded by the SNSF via grant no. 196978. The research of KH has been supported by the SNSF grant no. 205419.
This paper was edited by Silvio Davolio and reviewed by two anonymous referees.
Alaya, M. B., Zwiers, F., and Zhang, X.: An evaluation of block-maximum-based estimation of very long return period precipitation extremes with a large ensemble climate simulation, J. Climate, 33, 6957–6970, https://doi.org/10.1175/JCLI-D-19-0011.1, 2020. a
Allan, R. P., Barlow, M., Byrne, M. P., Cherchi, A., Douville, H., Fowler, H. J., Gan, T. Y., Pendergrass, A. G., Rosenfeld, D., Swann, A. L. S., Wilcox, L. J., and Zolina, O.: Advances in understanding large-scale responses of the water cycle to climate change, Ann. N. Y. Acad. Sci., 49–75, https://doi.org/10.1111/nyas.14337, 2020. a
Appenzeller, C. and Davies, H.: Structure of stratospheric intrusions into the troposphere, Nature, 358, 570–572, https://doi.org/10.1038/358570a0, 1992. a
Armon, M., Marra, F., Enzel, Y., Rostkier-Edelstein, D., Garfinkel, C. I., Adam, O., Dayan, U., and Morin, E.: Reduced Rainfall in Future Heavy Precipitation Events Related to Contracted Rain Area Despite Increased Rain Rate, Earth's Future, 10, e2021EF002397, https://doi.org/10.1029/2021EF002397, 2022. a
Athanase, M., Sánchez-Benítez, A., Monfort, E., Jung, T., and Goessling, H. F.: How climate change intensified storm Boris’ extreme rainfall, revealed by near-real-time storylines, Commun. Earth Environ., 5, 676, https://doi.org/10.1038/s43247-024-01847-0, 2024. a
Ban, N., Schmidli, J., and Schär, C.: Heavy precipitation in a changing climate: Does short-term summer precipitation increase faster?, Geophys. Res. Lett., 42, 1165–1172, https://doi.org/10.1002/2014GL062588, 2015. a
Barlow, A. M., Sherlock, C., and Tawn, J.: Inference for extreme values under threshold-based stopping rules, J. R. Statist. Soc. C, 69, 765–789, https://doi.org/10.1111/rssc.12420, 2020. a
Besson, P., Fischer, L. J., Schemm, S., and Sprenger, M.: A global analysis of the dry-dynamic forcing during cyclone growth and propagation, Weather Clim. Dynam., 2, 991–1009, https://doi.org/10.5194/wcd-2-991-2021, 2021. a
Binder, H. and Wernli, H.: Frequency anomalies and characteristics of extratropical cyclones during extremely wet, dry, windy, and calm seasons in the extratropics, Weather Clim. Dynam., 6, 151–170, https://doi.org/10.5194/wcd-6-151-2025, 2025. a
Binder, H., Joos, H., Sprenger, M., and Wernli, H.: Warm conveyor belts in present-day and future climate simulations – Part 2: Role of potential vorticity production for cyclone intensification, Weather Clim. Dynam., 4, 19–37, https://doi.org/10.5194/wcd-4-19-2023, 2023. a
Brogli, R., Heim, C., Mensch, J., Sørland, S. L., and Schär, C.: The pseudo-global-warming (PGW) approach: methodology, software package PGW4ERA5 v1.1, validation, and sensitivity analyses, Geosci. Model Dev., 16, 907–926, https://doi.org/10.5194/gmd-16-907-2023, 2023. a
Brönnimann, S., Rajczak, J., Fischer, E. M., Raible, C. C., Rohrer, M., and Schär, C.: Changing seasonality of moderate and extreme precipitation events in the Alps, Nat. Hazards Earth Syst. Sci., 18, 2047–2056, https://doi.org/10.5194/nhess-18-2047-2018, 2018. a
Byrne, M. P. and O’Gorman, P. A.: The response of precipitation minus evapotranspiration to climate warming: Why the “wet-get-wetter, dry-get-drier” scaling does not hold over land, J. Climate, 28, 8078–8092, https://doi.org/10.1175/JCLI-D-15-0369.1, 2015. a
Cattiaux, J. and Ribes, A.: Defining single extreme weather events in a climate perspective, B. Am. Meteorol. Soc., 99, 1557–1568, https://doi.org/10.1175/BAMS-D-17-0281.1, 2018. a
Catto, J. L., Madonna, E., Joos, H., Rudeva, I., and Simmonds, I.: Global Relationship between Fronts and Warm Conveyor Belts and the Impact on Extreme Precipitation, J. Climate, 28, 8411–8429, https://doi.org/10.1175/JCLI-D-15-0171.1, 2015. a
Coles, S.: An introduction to statistical modeling of extreme values, vol. 208, Springer, https://doi.org/10.1007/978-1-4471-3675-0, 2001. a
Copernicus Climate Change Service (C3S) and World Meteorological Organization (WMO): European State of the Climate 2024, https://doi.org/10.24381/14j9-s541, 2025. a
Croci-Maspoli, M., Schwierz, C., and Davies, H. C.: A multifaceted climatology of atmospheric blocking and its recent linear trend, J. Climate, 20, 633–649, https://doi.org/10.1175/JCLI4029.1, 2007. a
Dallan, E., Marra, F., Fosser, G., Marani, M., and Borga, M.: Dynamical Factors Heavily Modulate the Future Increase of Sub-Daily Extreme Precipitation in the Alpine-Mediterranean Region, Earth's Future, 12, e2024EF005185, https://doi.org/10.1029/2024EF005185, 2024. a
Davies, H. C.: The Quasigeostrophic Omega Equation: Reappraisal, Refinements, and Relevance, Mon. Weather Rev., 143, 3–25, https://doi.org/10.1175/MWR-D-14-00098.1, 2015. a
Davies, H. C., Sprenger, M. A., and Wernli, H.: Quasi-Geostrophic Theory, in: Reference Module in Earth Systems and Environmental Sciences, Elsevier, https://doi.org/10.1016/B978-0-323-96026-7.00085-0, 2024. a, b
de Vries, A. J.: A global climatological perspective on the importance of Rossby wave breaking and intense moisture transport for extreme precipitation events, Weather Clim. Dynam., 2, 129–161, https://doi.org/10.5194/wcd-2-129-2021, 2021. a
Di Capua, G. and Rahmstorf, S.: Extreme weather in a changing climate, Environ. Res. Lett., 18, 102001, https://doi.org/10.1088/1748-9326/acfb23, 2023. a
Dolores-Tesillos, E., Teubler, F., and Pfahl, S.: Future changes in North Atlantic winter cyclones in CESM-LE – Part 1: Cyclone intensity, potential vorticity anomalies, and horizontal wind speed, Weather Clim. Dynam., 3, 429–448, https://doi.org/10.5194/wcd-3-429-2022, 2022. a
Doswell, C. A., Brooks, H. E., and Maddox, R. A.: Flash Flood Forecasting: An Ingredients-Based Methodology, Weather Forecasting, 11, 560–581, https://doi.org/10.1175/1520-0434(1996)011<0560:FFFAIB>2.0.CO;2, 1996. a
D’Agostino, R. and Lionello, P.: The atmospheric moisture budget in the Mediterranean: Mechanisms for seasonal changes in the Last Glacial Maximum and future warming scenario, Quaternary Sci. Rev., 241, 106392, https://doi.org/10.1016/j.quascirev.2020.106392, 2020. a
ECMWF: Operational archive, MARS Catalogue, https://apps.ecmwf.int/mars-catalogue (last access: 3 October 2024), 2024. a
Ermis, S., Leach, N. J., Lott, F. C., Sparrow, S. N., and Weisheimer, A.: Event attribution of a midlatitude windstorm using ensemble weather forecasts, Environ. Res. Clim., 3, 035001, https://doi.org/10.1088/2752-5295/ad4200, 2024. a
Faranda, D., Bourdin, S., Ginesta, M., Krouma, M., Noyelle, R., Pons, F., Yiou, P., and Messori, G.: A climate-change attribution retrospective of some impactful weather extremes of 2021, Weather Clim. Dynam., 3, 1311–1340, https://doi.org/10.5194/wcd-3-1311-2022, 2022. a
Faranda, D., Alberti, T., Coppola, E., and Antonescu, B.: Heavy precipitations in storm Boris exacerbated by both human-driven climate change and natural variability, Tech. rep., ClimaMeter, Institut Pierre Simon Laplace, CNRS, https://doi.org/10.5281/zenodo.14054777, 2024. a, b
Fehlmann, R. and Quadri, C.: Predictability Issues of Heavy Alpine South-Side Precipitation, Weather Forecasting, 15, 4–28, https://doi.org/10.1175/1520-0434(2000)015<0004:AARSTT>2.0.CO;2, 2000. a
Fehlmann, R., Quadri, C., and Davies, H. C.: An Alpine Rainstorm: Sensitivity to the Mesoscale Upper-Level Structure, Meteorol. Atmos. Phys., 72, 223–231, https://doi.org/10.1007/s007030050017, 2000. a
Ferrari, A., Passadore, G., Vacondio, R., Carniello, L., Pivato, M., Crestani, E., Carraro, F., Aureli, F., Carta, S., Stumpo, F., and Mignosa, P.: Brief communication: Hydrological and hydraulic investigation of the extreme September 2024 flood on the Lamone River in Emilia-Romagna, Italy, Nat. Hazards Earth Syst. Sci., 25, 2473–2479, https://doi.org/10.5194/nhess-25-2473-2025, 2025. a
Ferreira, R. N.: Cut-Off Lows and Extreme Precipitation in Eastern Spain: Current and Future Climate, Atmosphere, 12, https://doi.org/10.3390/atmos12070835, 2021. a
Fischer, E., Beyerle, U., and Knutti, R.: Robust spatially aggregated projections of climate extremes, Nat. Clim. Change, 3, 1033–1038, https://doi.org/10.1038/nclimate2051, 2013. a
Fischer, E. M. and Knutti, R.: Observed heavy precipitation increase confirms theory and early models, Nat. Clim. Change, 6, 986–991, https://doi.org/10.1038/nclimate3110, 2016. a
Flaounas, E., Dafis, S., Davolio, S., Faranda, D., Ferrarin, C., Hartmuth, K., Hochman, A., Koutroulis, A., Khodayar, S., Miglietta, M. M., Pantillon, F., Patlakas, P., Sprenger, M., and Thurnherr, I.: Dynamics, predictability, impacts and climate change considerations of the catastrophic Mediterranean Storm Daniel (2023), Weather Clim. Dynam., 6, 1515–1538, https://doi.org/10.5194/wcd-6-1515-2025, 2025. a
Ginesta, M., Flaounas, E., Yiou, P., and Faranda, D.: Anthropogenic climate change will intensify European explosive storms analogous to Alex, Eunice, and Xynthia, J. Climate, https://doi.org/10.1175/JCLI-D-23-0761.1, 2024. a
Grams, C. M., Binder, H., Pfahl, S., Piaget, N., and Wernli, H.: Atmospheric processes triggering the central European floods in June 2013, Nat. Hazards Earth Syst. Sci., 14, 1691–1702, https://doi.org/10.5194/nhess-14-1691-2014, 2014. a
Greilinger, M., Orlik, A., Tilg, A., Schellander, H., Pistotnik, G., Lehner, S., Schlögl, M., and Koch, R.: Klimatologische Analyse betreffend des Niederschlagereignisses vom 12. bis 16. September 2024 in Österreich, Tech. rep., GeoSphere Austria, https://www.geosphere.at/de/aktuelles/news/klimatologische-analyse-niederschlagsereignis-12-16-9.2024 (last access: 11 October 2024), 2024. a, b
Hartmann, D. L., Klein Tank, A. M. G., Rusticucci, M., Alexander, L. V., Brönnimann, S., Charabi, Y., Dentener, F. J., Dlugokencky, E. J., Easterling, D. R., Kaplan, A., Soden, B. J., Thorne, P. W., Wild, M., and Zhai, P. M.: Observations: Atmosphere and Surface, in: Climate Change 2013: The Physical Science Basis. Contribution of Working Group I to the Fifth Assessment Report of the Intergovernmental Panel on Climate Change, edited by: Stocker, T. F., Qin, D., Plattner, G.-K., Tignor, M., Allen, S. K., Boschung, J., Nauels, A., Xia, Y., Bex, V., and Midgley, P. M., Cambridge University Press, Cambridge, United Kingdom and New York, 159–254 pp., https://doi.org/10.1017/CBO9781107415324.008, 2013. a
Heitmann, K., Sprenger, M., Binder, H., Wernli, H., and Joos, H.: Warm conveyor belt characteristics and impacts along the life cycle of extratropical cyclones: case studies and climatological analysis based on ERA5, Weather Clim. Dynam., 5, 537–557, https://doi.org/10.5194/wcd-5-537-2024, 2024. a
Held, I. M. and Soden, B. J.: Robust responses of the hydrological cycle to global warming, J. Climate, 19, 5686–5699, https://doi.org/10.1175/JCLI3990.1, 2006. a
Hersbach, H., Bell, B., Berrisford, P., Hirahara, S., Horányi, A., Muñoz-Sabater, J., Nicolas, J., Peubey, C., Radu, R., Schepers, D., Simmons, A., Soci, C., Abdalla, S., Abellan, X., Balsamo, G., Bechtold, P., Biavati, G., Bidlot, J., Bonavita, M., De Chiara, G., Dahlgren, P., Dee, D., Diamantakis, M., Dragani, R., Flemming, J., Forbes, R., Fuentes, M., Geer, A., Haimberger, L., Healy, S., Hogan, R. J., Hólm, E., Janisková, M., Keeley, S., Laloyaux, P., Lopez, P., Lupu, C., Radnoti, G., de Rosnay, P., Rozum, I., Vamborg, F., Villaume, S., and Thépaut, J.-N.: The ERA5 global reanalysis, Q. J. Roy. Meteor. Soc., 146, 1999–2049, https://doi.org/10.1002/qj.3803, 2020. a, b
Hersbach, H., Bell, B., Berrisford, P., Biavati, G., Horányi, A., Muñoz Sabater, J., Nicolas, J., Peubey, C., Radu, R., Rozum, I., Schepers, D., Simmons, A., Soci, C., Dee, D., and Thépaut, J.-N.: ERA5 hourly data on single levels from 1940 to present, Copernicus Climate Change Service (C3S) Climate Data Store (CDS), https://doi.org/10.24381/cds.adbb2d47, 2023. a
Hofstätter, M. and Chimani, B.: Van Bebber's cyclone tracks at 700 hPa in the Eastern Alps for 1961–2002 and their comparison to Circulation Type Classifications, Meteorol. Z., 21, 459–473, https://doi.org/10.1127/0941-2948/2012/0473, 2012. a, b
Hofstätter, M., Chimani, B., Lexer, A., and Blöschl, G.: A new classification scheme of European cyclone tracks with relevance to precipitation, Water Resour. Res., 52, 7086–7104, https://doi.org/10.1002/2016WR019146, 2016. a
Hoskins, B. J., McIntyre, M. E., and Robertson, A. W.: On the use and significance of isentropic potential vorticity maps, Q. J. Roy. Meteor. Soc., 111, 877–946, https://doi.org/10.1002/qj.49711147002, 1985. a
Huffman, G. J., Stocker, E. F., Bolvin, D. T., Nelki, E., and Tan, J.: GPM IMERG Late Precipitation L3 1 day 0.1 degree x 0.1 degree V07, NASA Open Data Portal, https://doi.org/10.5067/GPM/IMERGDL/DAY/07, 2024. a
Hurrell, J. W., Holland, M. M., Gent, P. R., Ghan, S., Kay, J. E., Kushner, P. J., Lamarque, J.-F., Large, W. G., Lawrence, D., Lindsay, K., Lipscomb, W. H., Long, M. C., Mahowald, N., Marsh, D. R., Neale, R. B., Rasch, P., Vavrus, S., Vertenstein, M., Bader, D., Collins, W. D., Hack, J. J., Kiehl, J., and Marshall, S.: The Community Earth System Model: A framework for collaborative research, B. Am. Meteorol. Soc., 94, 1339–1360, https://doi.org/10.1175/BAMS-D-12-00121.1, 2013. a, b
Jin, C., Reeder, M. J., Gallant, A. J. E., Parker, T., and Sprenger, M.: Changes in Weather Systems during Anomalously Wet and Dry Years in Southeastern Australia, J. Climate, 37, 1131–1153, https://doi.org/10.1175/JCLI-D-23-0305.1, 2024. a
Joos, H., Sprenger, M., Binder, H., Beyerle, U., and Wernli, H.: Warm conveyor belts in present-day and future climate simulations – Part 1: Climatology and impacts, Weather Clim. Dynam., 4, 133–155, https://doi.org/10.5194/wcd-4-133-2023, 2023. a, b
Karwat, A., Franzke, C. L. E., Pinto, J. G., Lee, S.-S., and Blender, R.: Northern Hemisphere Extratropical Cyclone Clustering in ERA5 Reanalysis and the CESM2 Large Ensemble, J. Climate, 37, 1347–1365, https://doi.org/10.1175/JCLI-D-23-0160.1, 2024. a
Kautz, L.-A., Martius, O., Pfahl, S., Pinto, J. G., Ramos, A. M., Sousa, P. M., and Woollings, T.: Atmospheric blocking and weather extremes over the Euro-Atlantic sector – a review, Weather Clim. Dynam., 3, 305–336, https://doi.org/10.5194/wcd-3-305-2022, 2022. a
Kay, J. E., Deser, C., Phillips, A., Mai, A., Hannay, C., Strand, G., Arblaster, J. M., Bates, S. C., Danabasoglu, G., Edwards, J., Holland, M., Kushner, P., Lamarque, J.-F., Lawrence, D., Lindsay, K., Middleton, A., Munoz, E., Neale, R., Oleson, K., Polvani, L., and Vertenstein, M.: The Community Earth System Model (CESM) Large Ensemble Project: A Community Resource for Studying Climate Change in the Presence of Internal Climate Variability, B. Am. Meteorol. Soc., 96, 1333–1349, https://doi.org/10.1175/BAMS-D-13-00255.1, 2015. a
Kim, S., Sharma, A., Wasko, C., and Nathan, R.: Linking Total Precipitable Water to Precipitation Extremes Globally, Earth's Future, 10, e2021EF002473, https://doi.org/10.1029/2021EF002473, 2022. a
Kimutai, J., Vautard, R., Zachariah, M., Tolasz, R., Šustková, V., Cassou, C., Skalák, P., Clarke, B., Haslinger, K., Vahlberg, M., Singh, R., Stephens, E., Cloke, H., Raju, E., Baumgart, N., Thalheimer, L., Chojnicki, B., Otto, F., Koren, G., Philip, S., Kew, S., Haro, P., Vibert, J., and von Weissenberg, A.: Climate change and high exposure increased costs and disruption to lives and livelihoods from flooding associated with exceptionally heavy rainfall in Central Europe, Tech. rep., World Weather Attribution, https://doi.org/10.25561/114694, 2024. a
Lenggenhager, S. and Martius, O.: Atmospheric blocks modulate the odds of heavy precipitation events in Europe, Clim. Dynam., 53, 4155–4171, https://doi.org/10.1007/s00382-019-04779-0, 2019. a
Lenggenhager, S., Croci-Maspoli, M., Brönnimann, S., and Martius, O.: On the dynamical coupling between atmospheric blocks and heavy precipitation events: A discussion of the southern Alpine flood in October 2000, Q. J. Roy. Meteor. Soc., 145, 530–545, https://doi.org/10.1002/qj.3449, 2019. a
Llasat, M. C., Martín, F., and Barrera, A.: From the concept of “Kaltlufttropfen” (cold air pool) to the cut-off low. The case of September 1971 in Spain as an example of their role in heavy rainfalls, Meteorol. Atmos. Phys., 18, 43–60, https://doi.org/10.1007/s00703-006-0220-9, 2007. a, b
Madonna, E., Wernli, H., Joos, H., and Martius, O.: Warm Conveyor Belts in the ERA-Interim Dataset (1979–2010). Part I: Climatology and Potential Vorticity Evolution, J. Climate, 27, 3–26, https://doi.org/10.1175/JCLI-D-12-00720.1, 2014. a
Magnusson, L., Chevallier, M., Haiden, T., Hewson, T., Mazzetti, C., Tanguy, M., Harrigan, S., Prudhomme, C., Mayer, M., Senan, R., and Stockdale, T.: Newsletter No. 182 – Winter 2024/25: Severe rain in central Europe from Storm Boris, Master's thesis, https://doi.org/10.21957/m32jp51ad6, 2025. a
Marelle, L., Myhre, G., Hodnebrog, Ø., Sillmann, J., and Samset, B. H.: The Changing Seasonality of Extreme Daily Precipitation, Geophys. Res. Lett., 45, 11352–11360, https://doi.org/10.1029/2018GL079567, 2018. a
Martinez-Villalobos, C. and Neelin, J. D.: Why do precipitation intensities tend to follow gamma distributions?, J. Atmos. Sci., 76, 3611–3631, https://doi.org/10.1175/JAS-D-18-0343.1, 2019. a
Meng, L., Liu, J., Tarasick, D. W., Randel, W. J., Steiner, A. K., Wilhelmsen, H., Wang, L., and Haimberger, L.: Continuous rise of the tropopause in the Northern Hemisphere over 1980–2020, Sci. Adv., 7, eabi8065, https://doi.org/10.1126/sciadv.abi8065, 2021. a
Messmer, M., Gómez-Navarro, J. J., and Raible, C. C.: Climatology of Vb cyclones, physical mechanisms and their impact on extreme precipitation over Central Europe, Earth Syst. Dynam., 6, 541–553, https://doi.org/10.5194/esd-6-541-2015, 2015. a, b, c
Messmer, M., Gómez-Navarro, J. J., and Raible, C. C.: Sensitivity experiments on the response of Vb cyclones to sea surface temperature and soil moisture changes, Earth Syst. Dynam., 8, 477–493, https://doi.org/10.5194/esd-8-477-2017, 2017. a
Messmer, M., Raible, C. C., and Gómez-Navarro, J. J.: Impact of climate change on the climatology of Vb cyclones, Tellus A: Dynamic Meteorology and Oceanography, 72, 1–18, https://doi.org/10.1080/16000870.2020.1724021, 2020. a
Miralles, O. and Davison, A. C.: Timing and spatial selection bias in rapid extreme event attribution, Weather Clim. Extremes, 41, 100584, https://doi.org/10.1016/j.wace.2023.100584, 2023. a
Moore, B. J., Keyser, D., and Bosart, L. F.: Linkages between Extreme Precipitation Events in the Central and Eastern United States and Rossby Wave Breaking, Mon. Weather Rev., 147, 3327–3349, https://doi.org/10.1175/MWR-D-19-0047.1, 2019. a
Müller, S. K., Pichelli, E., Coppola, E., Berthou, S., Brienen, S., Caillaud, C., Demory, M.-E., Dobler, A., Feldmann, H., Mercogliano, P., Tölle, M., and de Vries, H.: The climate change response of alpine-mediterranean heavy precipitation events, Clim. Dynam., 62, 165–186, https://doi.org/10.1007/s00382-023-06901-9, 2024. a
Naveau, P., Hannart, A., and Ribes, A.: Statistical methods for extreme event attribution in climate science, Annu. Rev. Stat. Appl., 7, 89–110, https://doi.org/10.1146/annurev-statistics-031219-041314, 2020. a
Noyelle, R., Zhang, Y., Yiou, P., and Faranda, D.: Maximal reachable temperatures for Western Europe in current climate, Environ. Res. Lett., 18, 094061, https://doi.org/10.1088/1748-9326/acf679, 2023. a
O'Gorman, P. A. and Schneider, T.: The physical basis for increases in precipitation extremes in simulations of 21st-century climate change, P. Natl. Acad. Sci. USA, 106, 14773–14777, https://doi.org/10.1073/pnas.0907610106, 2009. a, b, c, d
Pfahl, S. and Wernli, H.: Quantifying the relevance of atmospheric blocking for co-located temperature extremes in the Northern Hemisphere on (sub-)daily time scales, Geophys. Res. Lett., 39, l12807, https://doi.org/10.1029/2012GL052261, 2012. a
Pfahl, S., O’Gorman, P., and Fischer, E.: Understanding the regional pattern of projected future changes in extreme precipitationg, Nat. Clim. Change, 7, 423–427, https://doi.org/10.1038/nclimate3287, 2017a. a, b
Pfahl, S., O’Gorman, P., and Fischer, E.: Understanding the regional pattern of projected future changes in extreme precipitationg, Nat. Clim. Change, 7, 423–427, https://doi.org/10.1038/nclimate3287, 2017b. a
Rajczak, J., Pall, P., and Schär, C.: Projections of extreme precipitation events in regional climate simulations for Europe and the Alpine Region, J. Geophys. Res. Atmos., 3610–3626, https://doi.org/10.1002/jgrd.50297, 2013. a
Reinert, P.: Bericht zum Programm zur Berechnung der diagnostischen, quasigeostrophischen Vertikalgeschwindigkeit, Tech. rep., ETH Zurich, https://doi.org/10.3929/ethz-b-000500755, 2009. a
Röthlisberger, M., Sprenger, M., Flaounas, E., Beyerle, U., and Wernli, H.: The substructure of extremely hot summers in the Northern Hemisphere, Weather Clim. Dynam., 1, 45–62, https://doi.org/10.5194/wcd-1-45-2020, 2020. a
Sarojini, B., Stott, P., and Black, E.: Detection and attribution of human influence on regional precipitation, Nat. Clim. Change, 6, 669–675, https://doi.org/10.1038/nclimate2976, 2016. a
Schlemmer, L., Martius, O., Sprenger, M., Schwierz, C., and Twitchett, A.: Disentangling the Forcing Mechanisms of a Heavy Precipitation Event along the Alpine South Side Using Potential Vorticity Inversion, Mon. Weather Rev., 138, 2336–2353, https://doi.org/10.1175/2009MWR3202.1, 2010. a
Schwierz, C., Croci-Maspoli, M., and Davies, H. C.: Perspicacious indicators of atmospheric blocking, Geophys. Res. Lett., 31, l06125, https://doi.org/10.1029/2003GL019341, 2004. a
Seager, R., Liu, H., Henderson, N., Simpson, I., Kelley, C., Shaw, T., Kushnir, Y., and Ting, M.: Causes of Increasing Aridification of the Mediterranean Region in Response to Rising Greenhouse Gases, J. Climate, 27, 4655–4676, https://doi.org/10.1175/JCLI-D-13-00446.1, 2014. a
Seneviratne, S., Zhang, X., Adnan, M., Badi, W., Dereczynski, C., Di Luca, A., Ghosh, S., Iskandar, I., Kossin, J., Lewis, S., Otto, F., Pinto, I., Satoh, M., Vicente-Serrano, S., Wehner, M., and Zhou, B.: Weather and Climate Extreme Events in a Changing Climate, Cambridge University Press, Cambridge, United Kingdom and New York, NY, USA, 1513–1766, https://doi.org/10.1017/9781009157896.013, 2021. a
Shepherd, T. G.: Atmospheric circulation as a source of uncertainty in climate change projections., Nat. Geosci., 7, 703–708, https://doi.org/10.1038/ngeo2253, 2014. a
Shepherd, T. G.: A Common Framework for Approaches to Extreme Event Attribution, Current Climate Change Reports, 2, 28–38, https://doi.org/10.1007/s40641-016-0033-y, 2016. a
Sodemann, H., Schwierz, C., and Wernli, H.: Interannual variability of Greenland winter precipitation sources: Lagrangian moisture diagnostic and North Atlantic Oscillation influence, J. Geophys. Res. Atmos., 113, https://doi.org/10.1029/2007JD008503, 2008. a
Sprenger, M. and Wernli, H.: The LAGRANTO Lagrangian analysis tool – version 2.0, Geosci. Model Dev., 8, 2569–2586, https://doi.org/10.5194/gmd-8-2569-2015, 2015. a
Sprenger, M., Fragkoulidis, G., Binder, H., Croci-Maspoli, M., Graf, P., Grams, C. M., Knippertz, P., Madonna, E., Schemm, S., Škerlak, B., and Wernli, H.: Global Climatologies of Eulerian and Lagrangian Flow Features based on ERA-Interim, B. Am. Meteorol. Soc., 98, 1739–1748, https://doi.org/10.1175/BAMS-D-15-00299.1, 2017. a
Tandon, N. F., Zhang, X., and Sobel, A. H.: Understanding the Dynamics of Future Changes in Extreme Precipitation Intensity, Geophys. Res. Lett., 45, 2870–2878, https://doi.org/10.1002/2017GL076361, 2018. a
Tarasova, L., Lun, D., Merz, R., Blöschl, G., Basso, S., Bertola, M., Miniussi, A., Rakovec, O., Samaniego, L., Thober, S., and Kumar, R.: Shifts in flood generation processes exacerbate regional flood anomalies in Europe, Commun. Earth Environ., 4, 49, https://doi.org/10.1038/s43247-023-00714-8, 2023. a
Terray, L.: A dynamical adjustment perspective on extreme event attribution, Weather Clim. Dynam., 2, 971–989, https://doi.org/10.5194/wcd-2-971-2021, 2021. a, b
Thompson, V., Coumou, D., Galfi, V. M., Happé, T., Kew, S., Pinto, I., Philip, S., de Vries, H., and van der Wiel, K.: Changing dynamics of Western European summertime cut-off lows: A case study of the July 2021 flood event, Atmos. Sci. Lett., 25, e1260, https://doi.org/10.1002/asl.1260, 2024. a, b, c, d
Tradowsky, J. S., Philip, S. Y., Kreienkamp, F., Kew, S. F., Lorenz, P., Arrighi, J., Bettmann, T., Caluwaerts, S., Chan, S. C., De Cruz, L., De Vries, H., Demuth, N., Ferrone, A., Fischer, E. M., Fowler, H. J., Goergen, K., Heinrich, D., Henrichs, Y., Kaspar, F., Lenderink, G., Nilson, E., Otto, F. E. L., Ragone, F., Seneviratne, S. I., Singh, R. K., Skålevåg, A., Termonia, P., Thalheimer, L., Van Aalst, M., Van Den Bergh, J., Van De Vyver, H., Vannitsem, S., Van Oldenborgh, G. J., Van Schaeybroeck, B., Vautard, R., Vonk, D., and Wanders, N.: Attribution of the heavy rainfall events leading to severe flooding in Western Europe during July 2021, Climatic Change, 176, 90, https://doi.org/10.1007/s10584-023-03502-7, 2023. a
Turhal, K., Plöger, F., Clemens, J., Birner, T., Weyland, F., Konopka, P., and Hoor, P.: Variability and trends in the potential vorticity (PV)-gradient dynamical tropopause, Atmos. Chem. Phys., 24, 13653–13679, https://doi.org/10.5194/acp-24-13653-2024, 2024. a
Ulbrich, U., Brücher, T., Fink, A. H., Leckebusch, G. C., Krüger, A., and Pinto, J. G.: The central European floods of August 2002: Part 2 – Synoptic causes and considerations with respect to climatic change, Weather, 58, 434–442, https://doi.org/10.1256/wea.61.03B, 2003. a
Van Bebber, W.: Die Zugstrassen der barometrischen Minima nach den Bahnenkarten der deutschen Seewarte für den Zeitraum 1875–1890, Meteorol. Z., 8, 361–366, https://doi.org/10.1002/wea.7632, 1891. a
van Oldenborgh, G. J., van der Wiel, K., Kew, S., Philip, S., Otto, F., Vautard, R., King, A., Lott, F., Arrighi, J., Singh, R., and van Aalst, M.: Pathways and pitfalls in extreme event attribution, Climatic Change, 166, 13, https://doi.org/10.1007/s10584-021-03071-7, 2021. a
Wernli, H. and Davies, H. C.: A Lagrangian-based analysis of extratropical cyclones. I: The method and some applications, Q. J. Roy. Meteor. Soc., 123, 467–489, https://doi.org/10.1002/qj.49712353811, 1997. a
Wernli, H. and Schwierz, C.: Surface Cyclones in the ERA-40 Dataset (1958–2001). Part I: Novel Identification Method and Global Climatology, J. Atmos. Sci., 63, 2486–2507, https://doi.org/10.1175/JAS3766.1, 2006. a
Wilks, D. S.: “The Stippling Shows Statistically Significant Grid Points”: How Research Results are Routinely Overstated and Overinterpreted, and What to Do about It, B. Am. Meteorol. Soc., 97, 2263–2273, https://doi.org/10.1175/BAMS-D-15-00267.1, 2016. a
Zhu, D., Pfahl, S., Knutti, R., and Fischer, E. M.: Future extreme precipitation may shift to colder seasons in northern mid- and high latitudes, Commun. Earth Environ., 6, 657, https://doi.org/10.1038/s43247-025-02651-0, 2025. a, b