the Creative Commons Attribution 4.0 License.
the Creative Commons Attribution 4.0 License.
 | 15 Jun 2026
A quasi-Lagrangian perspective on the role of dry and moist processes in the formation of blocked North Atlantic–European weather regimes
Seraphine Hauser
Franziska Teubler
Michael Riemer
Christian M. Grams
Atmospheric blocking often triggers extreme events and remains difficult for weather and climate models to represent due to the complex multi-scale processes in its lifecycle. While recent studies highlight the importance of latent heat release in building and maintaining the upper-level anticyclonic anomaly, different perspectives assign varying roles to dry and moist dynamics, and it is still unclear whether their relative roles differ across regions where blocking occurs. This study uses a quasi-Lagrangian potential vorticity (PV) framework applied to ERA5 (1979–2021) to investigate blocking in the North Atlantic–European sector from the perspective of four large-scale blocked weather regimes. We track negative upper-tropospheric PV anomalies (PVAs−) around blocked regime onset and quantify the processes governing their amplitude changes to assess the roles of dry and moist dynamics. Most PVAs− linked to blocked regime onset are not formed in situ but follow two main pathways, arriving either from upstream or from downstream. PVAs− intensify in the days before onset, with moist, divergence-related PV tendencies associated with warm conveyor belt activity and baroclinic PV tendencies contributing strongly to their amplification, independent of blocked regime type or pathway. The position of PVAs− relative to storm tracks determines the strength of the moist contribution, with moist processes exerting a greater influence within the midlatitude storm track over the North Atlantic. Consequently, the magnitude of PVA− amplification depends more on whether a PVA− arrives from upstream or downstream, since the pathway controls the timing, location, and strength of the moist-dynamical processes acting on it, than on the blocked regime type it eventually contributes to. This study highlights the synoptic-scale moist-dynamical evolution of PVAs− associated with different types of blocked regimes from a quasi-Lagrangian perspective. Complementing the quasi-Lagrangian analysis with previous insights from a Eulerian perspective provides a coherent view of blocked regime evolution, linking the remote moist amplification of PVAs− with the local formation of the regime pattern by anomaly re-arrangement, which is dominated by dry, quasi-barotropic dynamics. Given the key role of moist processes in PVA− amplification and the systematic biases of blocking in weather and climate models, our results emphasize the need for better representation of moist baroclinic eddies and scale interactions, from cloud microphysics to the synoptic scale.
- Article
(8339 KB) - Full-text XML
- BibTeX
- EndNote


Atmospheric blocking is a large-scale, persistent circulation pattern characterized by a quasi-stationary high-pressure system that disrupts the westerly flow in midlatitudes (Rex, 1950) and is often linked to prolonged periods of anomalous weather conditions such as heatwaves, cold spells, or droughts (see review article by Kautz et al., 2022). While numerical weather prediction (NWP) models have made significant progress in recent decades (e.g. Davini and D'Andrea, 2016), accurately predicting blocking events still remains challenging due to its non-linear and chaotic nature (Ferranti et al., 2015). Variations in blocking characteristics across regions, particularly between the North Atlantic and Pacific sectors, influence regional predictability and impact NWP and climate projections. Especially in the North Atlantic–European sector, many climate models underestimate the frequency and duration of blocking (e.g. Davini and D'Andrea, 2016; Woollings et al., 2018; Quinting and Vitart, 2019; Maddison et al., 2024).
Understanding the development of blocking patterns is key to improving predictions of blocking events. Existing theories on blocking focus on (i) large-scale wave dynamics (Austin, 1980), (ii) the role of topography in the initiation of blocking on the planetary scale (e.g. Grose and Hoskins, 1979), (iii) wave resonance to a given forcing (e.g. Petoukhov et al., 2013), (iv) the impact of tropical heating (e.g. Henderson et al., 2016), (v) the formation of atmospheric “traffic jams” in terms of wave-activity concepts (e.g. Nakamura and Huang, 2018; Polster and Wirth, 2023), (vi) the effect of transient activity such as upstream cyclones (e.g. Nakamura and Wallace, 1990, 1993), (vii) the absorption of eddies by a block as maintenance mechanism (e.g. Shutts, 1983; Yamazaki and Itoh, 2009; Suitters et al., 2023), (viii) the non-linear interaction and feedbacks between small-scale eddies with a block (e.g. Luo et al., 2014), and (ix) the effect of diabatic processes in modifying the upper-level flow in the troposphere (e.g. Pfahl et al., 2015; Steinfeld and Pfahl, 2019; Lubis et al., 2025). The effect of moist-diabatic processes received much attention in recent years, which often focuses on warm conveyor belts (WCBs), i.e. the rapidly ascending airstreams in the vicinity of extratropical cyclones. From a Lagrangian air-parcel perspective, previous studies highlighted moist dynamics as first-order importance for the onset and maintenance of atmospheric blocking (Wernli, 1997; Madonna et al., 2014; Pfahl et al., 2015). Numerical studies support this hypothesis, showing that omitting latent heat release in “dry simulations” weakens or suppresses blocking and can fundamentally alter its characteristics (Steinfeld et al., 2020; Deshmukh et al., 2025). Blocking is a complex, non-linear scale-interaction phenomenon involving interactions across scales and both dry and moist processes, and despite progress in recent years, a comprehensive understanding of its life-cycle dynamics remains elusive.
Given regional differences in blocking predictability, recent studies have quantified how blocking occurrences and dynamics vary by location. Distinct onset mechanisms are observed over the Atlantic, Europe, Asia, and the Pacific, which are linked to different frequency bands of atmospheric flow (Miller and Wang, 2022), with Pacific blocks influenced by intermediate-frequency processes and Atlantic and European blocks dominated by low- and high-frequency processes, respectively. Baroclinic energy conversion is particularly efficient for blocks over the Bering Sea and near Greenland, but less important for blocks over the Eastern Atlantic (Martineau et al., 2022). The contribution of diabatic heating to blocking formation and maintenance is pattern-dependent (Liu and Wang, 2025) and further varies with region and season (Steinfeld and Pfahl, 2019; Drouard et al., 2021). Oceanic blocks are characterized by a consistently strong diabatic contribution, while continental blocks, especially over Asia, show marked seasonal variability. Polar and European blocks are generally dominated by dry dynamics, and delayed latent heat signals in Arctic and European blocks indicate upstream diabatic heating days before onset (Steinfeld and Pfahl, 2019). Very long-lived blocks occur mostly in high latitudes over Greenland and the North Pacific and are favoured by cyclonic Rossby wave breaking and maintained by transient local mechanisms upstream (Drouard et al., 2021). These results provide a first assessment of regional differences in blocking dynamics, highlighting the need to further refine spatial scales to understand why blocking in the North Atlantic–European domain remains challenging for weather and climate models.
Different blocking patterns over the North Atlantic–European sector have mainly been examined through large-scale weather regimes. The year-round regime definition of Grams et al. (2017), comprising seven regimes, has been widely used to analyse the predictability (Büeler et al., 2021; Osman et al., 2023) and dynamics (e.g. Hauser et al., 2023, 2024b; Teubler et al., 2023; Wandel et al., 2024) of the four different blocked regime types (Fig. 1a), namely the Atlantic ridge (AR), European blocking (EuBL), Scandinavian blocking (ScBL), and Greenland blocking (GL). EuBL and ScBL exhibit the lowest forecast skill, while GL shows comparatively high skill (Büeler et al., 2021; Osman et al., 2023), consistent with dynamical-systems-theory evidence that GL features enhanced stability and persistence whereas EuBL and ScBL rank among the least stable regimes (Faranda et al., 2016; Hochman et al., 2021). Forecast performance for EuBL depends on capturing upstream WCB activity, underscoring the role of moist dynamics in blocking onset (Wandel et al., 2024), and model biases in WCB outflow frequency have been linked to the underestimation of winter blocking over the eastern North Atlantic and Europe (Dolores-Tesillos et al., 2025). From a Eulerian perspective, low-frequency streamfunction-tendency and pattern-projection analyses revealed the importance of wave trains from the western Atlantic and the absence of Rossby wave breaking over western Europe as precursors to blocking (e.g. Feldstein, 2002; Michel and Rivière, 2011; Drouard and Woollings, 2018). Building on this, Teubler et al. (2023) applied a projection framework based on potential vorticity (PV) to the four blocked regimes of Grams et al. (2017) to diagnose processes that locally reinforce or erode the respective anomaly patterns, highlighting the predominant influence of in-situ dry-dynamical processes in the formation of blocked regimes.
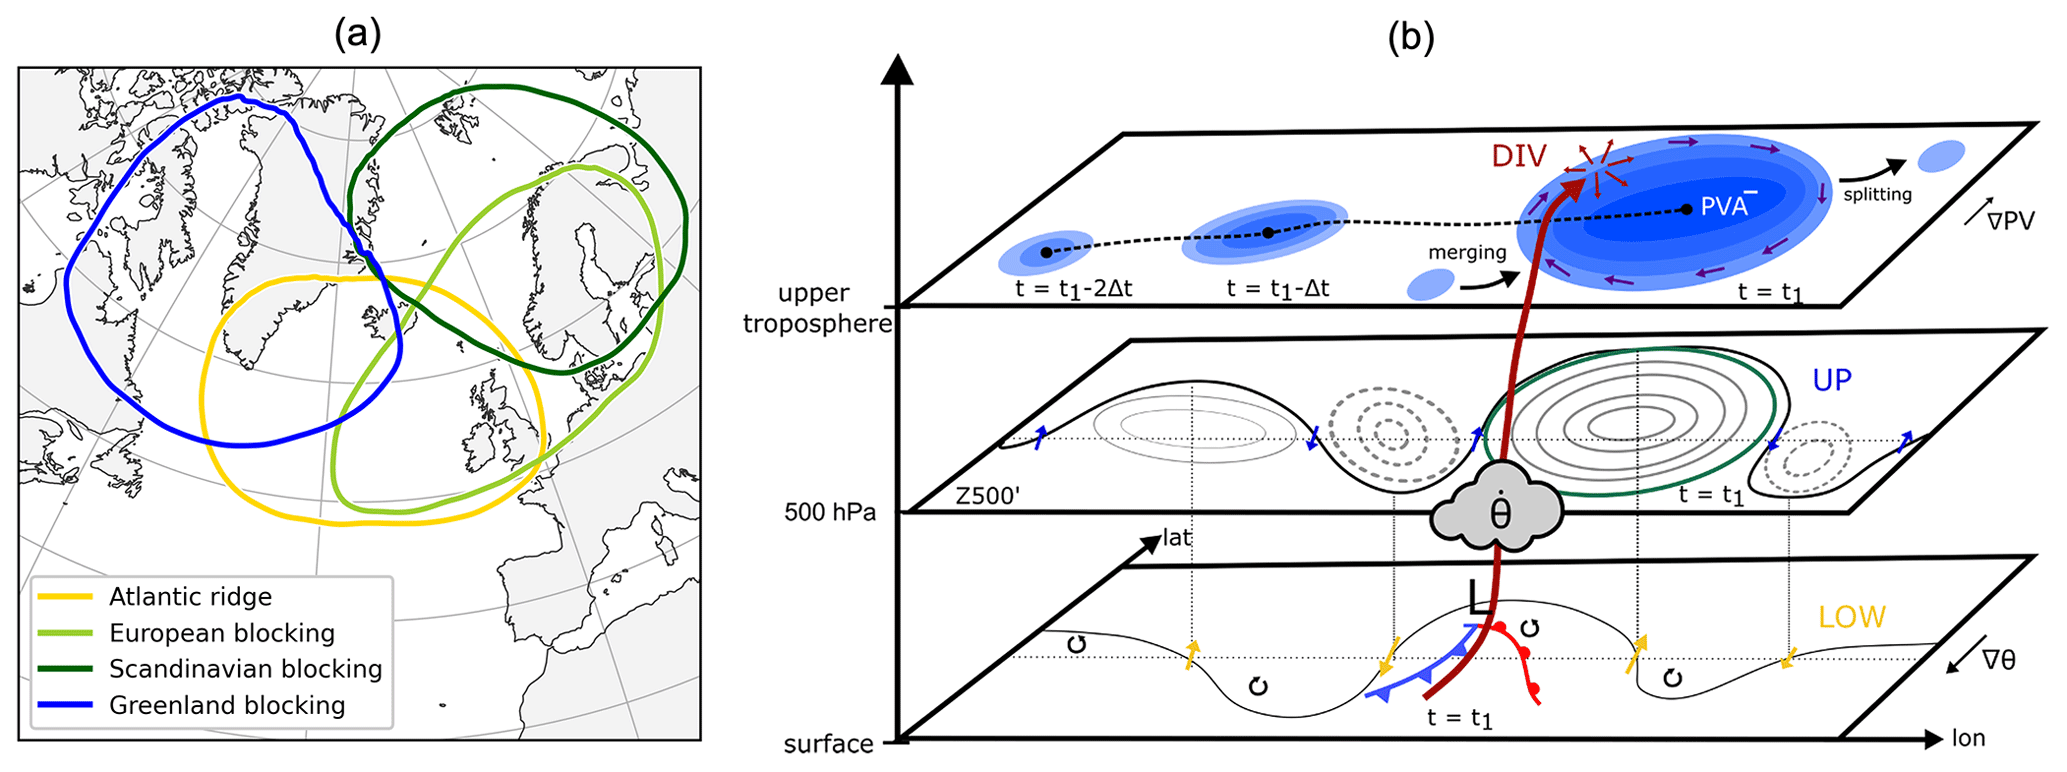
Figure 1(a) Subregions for blocking in the North Atlantic–European sector obtained from a weather regime perspective. The solid, closed contour lines mark the areas of the anticyclonic PV anomaly associated with the four blocked regime. The color coding of the regime masks follow established conventions from previous studies using the same set of regimes (e.g., Büeler et al., 2021). (b) Schematic of the quasi-Lagrangian PV framework (Hauser et al., 2023, 2024b). Upper-troposphere level: Exemplary track (black dashed) of negative PV anomalies (blue shading, PVA−), including splitting and merging of existing anomalies; impact of divergent outflow near the tropopause (DIV, dark-red arrows); and wind fields induced by upper-tropospheric PV anomalies (dark blue arrows). 500 hPa level: absolute geopotential height (Z500; black), Z500 anomalies (Z500'; grey; solid for positive, dashed for negative), contour of the anticyclonic anomaly as in panel (a) (green), and wind fields linked to barotropic phase-propagation tendencies (UP, blue arrows). Surface: temperature wave (solid black line), influence of wind fields linked to low-level PV anomalies on higher levels (LOW, gold arrows), symbolic low-pressure system (L) with cold (blue) and warm (red) fronts, and a WCB airstream (thick dark-red arrow) with diabatic heating in the mid-troposphere (grey cloud).
In a case study, Hauser et al. (2023) demonstrate that assessing the relative importance of moist processes in blocking development depends systematically on the diagnostic framework and argue that a combination of complementary perspectives provides a more holistic understanding of blocking dynamics. The current study employs a quasi-Lagrangian approach, which arguably provides the most important complementary perspective to a Eulerian approach. Specifically, we use the quasi-Lagrangian PV framework introduced in Hauser et al. (2023) (here illustrated schematically in Fig. 1b). This framework tracks negative PV anomalies linked to blocking, hereafter referred to as PVAs−, including anomalies that are not necessarily stationary, in contrast to earlier approaches that focused on stationary features (e.g. Schwierz et al., 2004). This allows us to retain information on the spatial origin and evolution of the involved PVAs−. In addition, the processes governing the amplitude evolution of PVAs− are evaluated, enabling an assessment of the relative importance of dry and moist processes. The separation into different processes is done by decomposing the total change in PV into (i) linear, quasi-barotropic Rossby wave dynamics, (ii) baroclinic interaction, and (iii) divergent outflow. Hauser et al. (2024b) applied the quasi-Lagrangian framework to systematically investigate GL regime life cycles and showed that PVAs− associated with blocked-regime onset originate primarily upstream and downstream of the blocking region rather than forming in situ. Their analysis also highlighted the importance of moist processes in the growth of PVAs− prior to blocked regime onset. A synopsis of the dynamics of all four blocked regimes from a quasi-Lagrangian perspective, as a vital contribution to understanding the processes that initiate and maintain blocking patterns in the North Atlantic–European region, however, is still missing.
In this study, the quasi-Lagrangian framework is applied to the four year-round blocked regime types over the North Atlantic–European region of Grams et al. (2017) for the period 1979–2021. With a very similar interpretation of the governing processes, and considering the same blocked regime types over the same time period, the results of the current study are directly comparable to those of Teubler et al. (2023). Building on these results, and on the new insight offered by the quasi-Lagrangian framework, the current study can thus provide, for the first time, a more holistic understanding across a large number of cases by combining two complementary perspectives. With this synopsis, the study addresses the following key questions:
-
Where do PVAs− linked to blocked regimes develop (upstream, downstream, locally) and is the propagation of those PVAs− linked to certain regime transitions?
-
How do processes (dry vs. moist) differ in the evolution of PVAs− between the blocked regimes and possible pathways of PVAs−?
-
Is the contribution of moist processes dependent on the location of the PVA− relative to the storm track region?
-
How can we optimally combine different perspectives to yield a holistic view of the relevance of local vs. non-local effects of processes involved in blocked regime onsets?
The paper is structured as follows. Section 2 describes the datasets and methods used in this study. Section 3 presents the results, divided into five subsections. This is followed by the discussion in Sect. 4 and concluding remarks in Sect. 5.
2.1 ERA5 reanalysis dataset
The analyses presented in this study are based on the ERA5 reanalysis from the European Centre for Medium-Range Weather Forecasts (ECMWF) and covers the period 1 January 1979–31 December 2021 (Hersbach et al., 2020). We use 3-hourly model level data provided by ECMWF for a high-resolution computation of PV anomalies in the upper troposphere (see Sect. 2.3) on a 0.5°×0.5° latitude-longitude grid, and a coarser dataset (1°×1°) for the PV inversion (Teubler and Riemer, 2021) on 17 pressure levels (1000, 950, 925, 900, 850, 800, 700, 600, 500, 400, 300, 250, 200, 150, 100, 70, and 50 hPa).
2.2 Quasi-Lagrangian PV framework
The quasi-Lagrangian PV framework, developed by Hauser et al. (2023) and further refined in Hauser et al. (2024b), identifies and tracks patches of negative PV anomalies in the upper troposphere and quantifies the contribution of different processes to their amplitude evolution. This approach builds on the θ-PV framework for midlatitude Rossby wave packets by Teubler and Riemer (2016). The central variable is Ertel PV, defined by Ertel (1942): , where g is the gravitational acceleration, ζθ the isentropic relative vorticity, f the Coriolis parameter, θ the potential temperature, and p the pressure. The full framework is documented in detail in Hauser et al. (2024b); here, we briefly summarize the key steps only to avoid redundancy.
Upper-tropospheric PV anomalies are defined as the difference between the vertically averaged PV (VAPV) between 150–500 hPa and its 30 d centred running-mean climatology (1979–2021). We identify the PVAs− as contiguous regions of negative PV anomalies that fall below a seasonally varying threshold (cf. Hauser et al., 2024b, their Fig. A1c), with higher thresholds in winter than in summer. All PVAs− are tracked using an overlap-based tracking algorithm that also accounts for feature splitting and merging. When a merge occurs, instead of assigning a new tracking ID, which would fragment a single life cycle into a disjointed “puzzle” of multiple IDs, the algorithm retains the tracking ID of the larger feature and archives the metadata of the smaller merging feature. A similar strategy is applied when features split. This approach enables the reconstruction of complete life cycles of PVAs−. The dataset of tracked PVAs− within the chosen ERA5 period (1979–2021) is available for the entire Northern Hemisphere in Hauser et al. (2024a).
To investigate the amplitude evolution of PVAs−, we employ the piecewise PV tendency framework, which is based on the PV tendency equation. This equation states that the local change in PV (q) is governed by PV advection and non-conservative PV modification:
Here, v is the horizontal wind field; , ∇θ the gradient operator along an isentropic surface, and 𝒩 the non-conservative PV modification. The full wind field v is decomposed using PV inversion (Davis and Emanuel, 1991; Davis, 1992) and Helmholtz Partitioning, which results in the divergent wind field , the wind fields and associated with upper-tropospheric and lower-tropospheric PV anomalies (non-divergent), the residual wind field , and the background wind field v0, defined as the 30 d running mean climatology of v (1980–2019). The PV inversion yields three-dimensional wind fields defined on pressure levels, which are subsequently interpolated onto isentropic surfaces for the analysis. Equation (1) is further transformed into an equation for the amplitude evolution of enclosed PV anomalies – analogously to Hauser et al. (2024b). As a result, the integrated amplitude evolution over the area A(t) of a PV anomaly feature reads as
with i referring to div, up, low and res wind fields (cf. Eq. 1), S(t) as the boundary of A(t), vs the motion of the boundary S(t) and the climatological background PV q0 which is constructed the same way as v0. The terms enclosed by the mean operator 〈〉 refer to 30 d centred averages of a given term between 1980–2019 for each calendar day. Taking into account these terms, we can quantify the contributions of different processes to the change in background PV (Hauser et al., 2024b, their Appendix A). Equations (1) and (2) are evaluated on isentropic surfaces ranging from 315 to 355 K in steps of 5 K. Following the approach of Teubler et al. (2023) and Hauser et al. (2024b), we compute an isentropic average by including the surfaces ±5 K around the central level. For the year-round analysis of PVAs−, the selection of the representative isentropic level is crucial. Therefore, we adopt the seasonally varying levels recommended by Röthlisberger et al. (2018): 320 K for December–March, 325 K for April and November, 330 K for May and October, 335 K for June and September, and 340 K for July and August.
The physical meaning of each term in Eq. (2) is explained below and schematically shown in Fig. 1b. The term UP refers to upper-tropospheric (quasi-)barotropic dynamics and describes the advection of upper-level background PV by the wind field associated with upper-tropospheric PV anomalies (e.g. Hoskins et al., 1985, Sect. 6a). This describes the intrinsic propagation mechanism of Rossby waves and amplitude changes due to group propagation (blue arrows in Fig. 1b). The term LOW captures baroclinic interaction, namely the amplitude modification of upper-level PV anomalies by the wind field associated with low-level PV anomalies (gold arrows in Fig. 1b), thereby contributing to baroclinic growth when the upper- and lower-level anomalies are suitably phased (e.g. Hoskins et al., 1985, Sect. 6b). Moist processes may strengthen the low-level PV anomaly, but LOW represents the quasi-adiabatic, balanced response to that anomaly rather than its diabatic generation. Numerical and inherent inaccuracies in piecewise PV inversion lead to a residual wind field, which is usually small. The advection of background PV by this residual flow is captured by the term RES. While it lacks physical interpretability (Teubler and Riemer, 2016), it is included for budget closure in the PV tendency equation. Two terms describe the impact of divergent winds (dark red arrows in Fig. 1b) on the amplitude evolution of PV anomalies: (1) DIVadv represents the advection of background PV by the divergent wind field and (2) DIVdiv accounts for divergence or convergence within the PV anomaly itself, which leads to its growth or decay, respectively. Upper-level divergence can arise from both dry dynamical forcing and latent heat release below. In particular, strong divergence is frequently associated with diabatic outflow near the tropopause, such as from WCBs (e.g. Madonna et al., 2014; Pfahl et al., 2015; Hauser et al., 2023). A detailed sensitivity analysis by Teubler and Riemer (2021, their Sect. 5.3) demonstrates, however, that upper-tropospheric divergence is more sensitive to proxies of latent heat release than to proxies of dry dynamics, supporting the interpretation that these terms predominantly reflect indirect moist contributions, while acknowledging that dry dynamical forcing may still contribute and cannot be quantitatively disentangled with the present diagnostics. The term NONCONS represents direct diabatic modification of PV by non-conservative processes such as latent heating (grey cloud in Fig. 1b), radiative effects, friction, and turbulent mixing (e.g. Chagnon et al., 2013). While diabatic PV tendencies can be locally strong – particularly in association with deep convection – their spatially localized nature implies that their contribution to the area-integrated PV budget is typically small (cf. Teubler and Riemer, 2016, their Figs. 9 and 10). In principle, this small net contribution could also arise from cancellation between opposing non-conservative processes; however, available process-based budget analyses for upper-level PV anomalies, based on Year of Tropical Convection (YOTC) data (e.g. Moncrieff et al., 2012), do not indicate such cancellation to be dominant (Teubler and Riemer, 2021). Radiative PV tendencies, although more spatially coherent, exhibit little spatio-temporal variability over the life cycle of upper-level PV anomalies (Teubler and Riemer, 2021). Diabatically generated PV anomalies may nonetheless influence the large-scale flow indirectly through rapid upscale interactions, for example via divergent circulations, which are represented by other terms in the PV budget. NONCONS processes are therefore not expected to substantially affect the integrated amplitude of PVAs− considered here. Because the available reanalysis data do not permit a further separation of individual non-conservative processes beyond the bulk NONCONS term, and given its small magnitude, NONCONS is not analysed explicitly in the present study, following previous studies (e.g. Teubler and Riemer, 2021; Teubler et al., 2023; Hauser et al., 2024b).
The final term on the right-hand side of Eq. (2) is the boundary term ℬnd, that is estimated as follows:
with as the average of q′ along the boundary S(t) and Δ𝒜 as the observed area change of the PV anomaly. The first two terms of ℬnd describe the contribution to amplitude change caused by eddy flux divergence or convergence within the anomaly area. The last term estimates the change in amplitude by the change in anomaly area between two consecutive time steps and can reach high values in case of splitting and merging of different anomaly features. For more details on ℬnd, the reader is referred to Appendix B of Hauser et al. (2024b).
We denote to the diagnosed amplitude change (DIAG) as the sum of all terms in Eq. (2): . DIAG is compared to the observed amplitude change (OBS), which is defined as the forward difference in the area-integrated PV anomaly amplitude between two time steps. Following Hauser et al. (2024b), we exclude time steps where the deviation between DIAG and OBS is large, as this indicates that the PV budget fails to accurately capture the observed evolution. Such large DIAG–OBS deviations primarily occur during non-linear evolution phases, such as large-scale splitting or merging events, or during periods when the VAPV anomaly contour does not fully capture isentropic-level PV anomalies. In line with Teubler and Riemer (2016), the sign convention for the PV tendency terms is such that a positive value indicates an amplification of PVAs−, while a negative value indicates a weakening.
2.3 Year-round definition of North Atlantic–European weather regimes
In this study, we use the year-round weather regime definition for the North Atlantic–European region developed by Grams et al. (2017) and apply it to ERA5 reanalysis data to distinguish between different blocking configurations in this region. A detailed technical documentation of the regime definition is given in Grams (2026) and we briefly repeat the essence in the following. To define the regimes, 6-hourly geopotential height anomalies at 500 hPa (Z500) are calculated using a 90 d centred running-mean climatology (1979–2019) and then filtered with a 10 d low-pass Lanczos filter (Duchon, 1979). After normalizing the anomalies, we perform an empirical orthogonal function (EOF) analysis over the North Atlantic–European domain (80° W–40° E, 30–90° N). The seven leading EOFs, which describe 74.4 % of the total variance, are retained to construct an expanded phase space. A k-means clustering is then applied in this phase space, yielding an optimal number of seven clusters, which correspond to seven distinct weather regimes: Three cyclonic regimes (Zonal regime – ZO, Scandinavian trough – ScTr, Atlantic trough – AT) and four anticyclonic regimes (Atlantic ridge – AR, European blocking – EuBL, Scandinavian blocking – ScBL, Greenland blocking – GL). To assign individual time steps to these regimes, we use the weather regime index (IWR) proposed by Michel and Rivière (2011) and Grams et al. (2017), which quantifies the similarity between a given instantaneous Z500 field at time t and each of the seven weather regimes (WR):
with
PWR(t) describes the projection of the filtered anomaly to the EOF cluster mean within the EOF domain. NT is the total number of time steps within the climatological sample (1979–2019) and the respective longitude/latitude within the EOF domain is noted as (λ,φ). describes the climatological mean of the projection PWR. As a result, IWR is computed as the deviation of PWR(t) from , normalized by the standard deviation. This index, IWR, can also be computed beyond the climatological sample – i.e., for each of the seven regimes and every 3-hourly time step throughout the full ERA5 period considered (1979–2021). Following Grams et al. (2017), we derive objective regime life cycles, associated life cycle stages (onset, mature stage, decay) and regime transitions – all based on the IWR. A detailed description on the algorithms used to determine those characteristics is given in Hauser et al. (2024b) and Grams (2026).
From January 1979 to December 2021, we identified a total of 177 life cycles for AR, 183 for EuBL, 192 for ScBL, and 177 for GL. Figure 2 presents the four blocked regime patterns as year-round mean composites based on upper-tropospheric PV anomalies and calculated over all time steps within the respective life cycles of each blocked regime. All four regimes are characterized by a dominant negative PV anomaly that defines the block; however, the location of this anomaly varies across regimes. For AR, the negative PV anomaly spans the largest area and is centred south of Iceland (Fig. 2a). A comparison between EuBL and ScBL highlights the need to refine the classical four-regime blocking framework (e.g. Vautard, 1990; Michelangeli et al., 1995) by distinguishing these two as separate sub-regimes due to their markedly different spatial structures. EuBL exhibits a pronounced positive PV anomaly over Greenland and displays features indicative of anticyclonic Rossby wave breaking over Europe (Fig. 2b). In contrast, ScBL is associated with a high-latitude block flanked by a strong positive PV anomaly over the eastern North Atlantic, and shows signs of cyclonic Rossby wave breaking extending toward Greenland (Fig. 2c). For GL, the block is associated with a more isolated negative PV anomaly centred over the Labrador Sea (Fig. 2d).
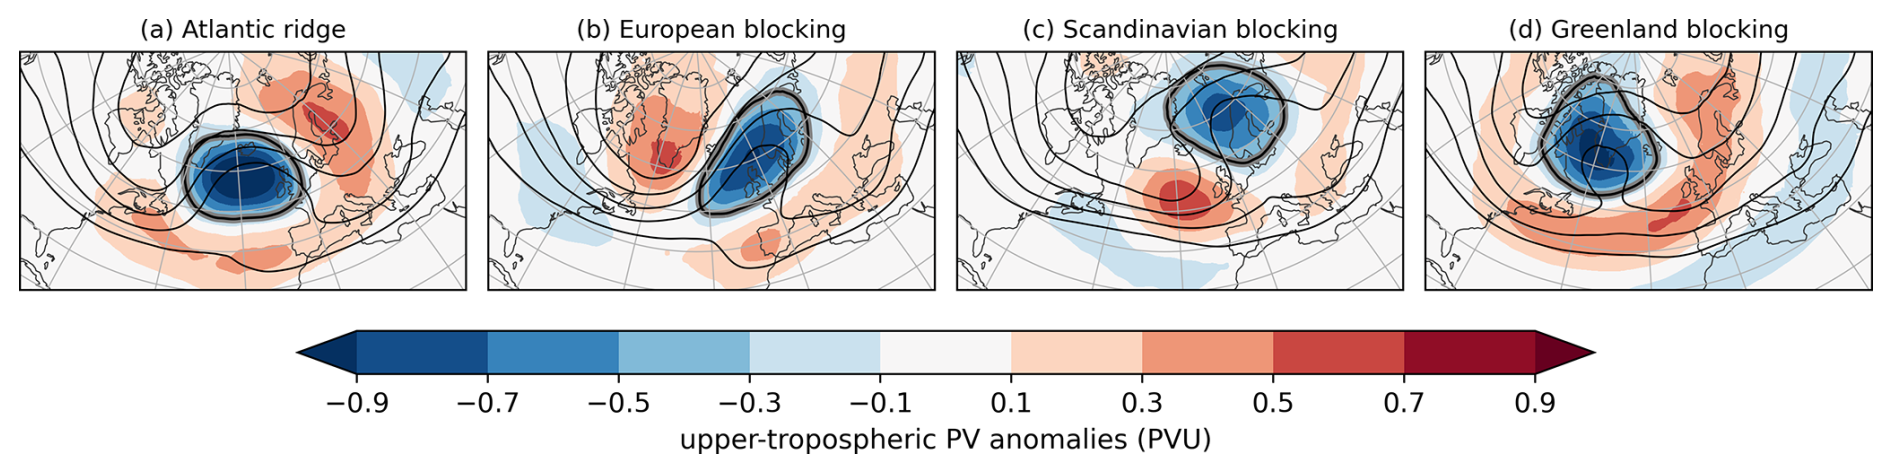
Figure 2Composites of vertically-averaged PV anomalies between 500–150 hPa (shading) and vertically-averaged PV (contours, in PVU, from 1.5 to 3.5 PVU in steps of 0.5 PVU) for all time steps attributed to each of the four blocked regime types. The thick black contour illustrates the regime mask for the respective regime type, defined by the −0.3 PVU contour.
2.4 Eulerian identification of WCBs
This work utilizes the EuLerian Identification of ascending AirStreams (ELIAS 2.0) data set of Quinting and Grams (2022). ELIAS 2.0 uses convolutional neural networks (CNNs) to identify the footprints of three WCB stages, which have been defined from a Lagrangian perspective based on the location of air parcels that classify as WCB (Δp>600 hPa for Δt≤48 h; Madonna et al., 2014): (i) inflow (p≥800 hPa), (2) ascent (800 hPa hPa), and (3) outflow (p≤400 hPa). A step-wise forward selection approach has been applied to identify the five most important meteorological predictors (Quinting and Grams, 2021). The training has been performed on 6-hourly ERA-Interim data (Dee et al., 2011) and applied to 3-hourly ERA5 data. The CNN gives conditional probabilities of WCB stage occurrences as output. This is transformed into a binary WCB occurrence given a seasonal-dependent and grid-point-dependent decision threshold, optimized to minimize the climatological bias and maximize the correlation coefficient in the midlatitude storm-track regions, where WCBs occur most frequently (Madonna et al., 2014).
3.1 Pathways of PVAs− to blocked regime onset
The negative upper-level PV anomaly linked to blocked regime onset over Greenland does not develop in-situ but propagate via different pathways towards Greenland (Hauser et al., 2024b). Consistent with these results, we distinguish two pathways based on whether the anomaly emerges upstream or downstream of the blocking region and examine if these pathways also exist in the other three blocked regimes. First, we define the area where to expect the anticyclonic anomaly during the blocked regimes by the −0.3 PVU-contour in the year-round composite (Fig. 2). Using the traced PVAs− (details in Sect. 2.2), for every blocked regime life cycle, we determine a so-called onset PVA− that exhibits the highest spatial overlap with the respective regime mask around blocked regime onset. To quantify the two pathways, each onset PVA− is assessed for its dominant position relative to the centre of mass longitude of the regime mask (0.5° E for EuBL, 13.0° E for ScBL, 24.0° W for AR, and 51.5° W for GL) in the 3 d before onset.
When split into the two pathways, the majority of onset PVAs− follow the upstream pathway: 76.5 % for EuBL, 65.6 % for ScBL, and 57.1 % for AR. This deviates from the dominant retrogression pathway for GL, where upstream onset PVAs− account for only 42.4 %. These findings are consistent with the climatological storm-track position, characterized by reduced storm-track activity downstream of Europe and upstream of Greenland. Investigating the seasonal occurrence of the pathways reveals more differences between the blocked regimes (Fig. 3). First, the more continental blocked regime types east of the North Atlantic (EuBL, ScBL) show a dominance of the upstream pathway mostly independent of the month (Fig. 3b and c). The differences in pathway frequency are less pronounced for AR with a more frequent retrogression pathway in April, May, and December (Fig. 3a). The seasonality of the pathways for GL is more complex with the dominant retrogression pathway only being prevalent in winter and late spring/early summer (Fig. 3a).
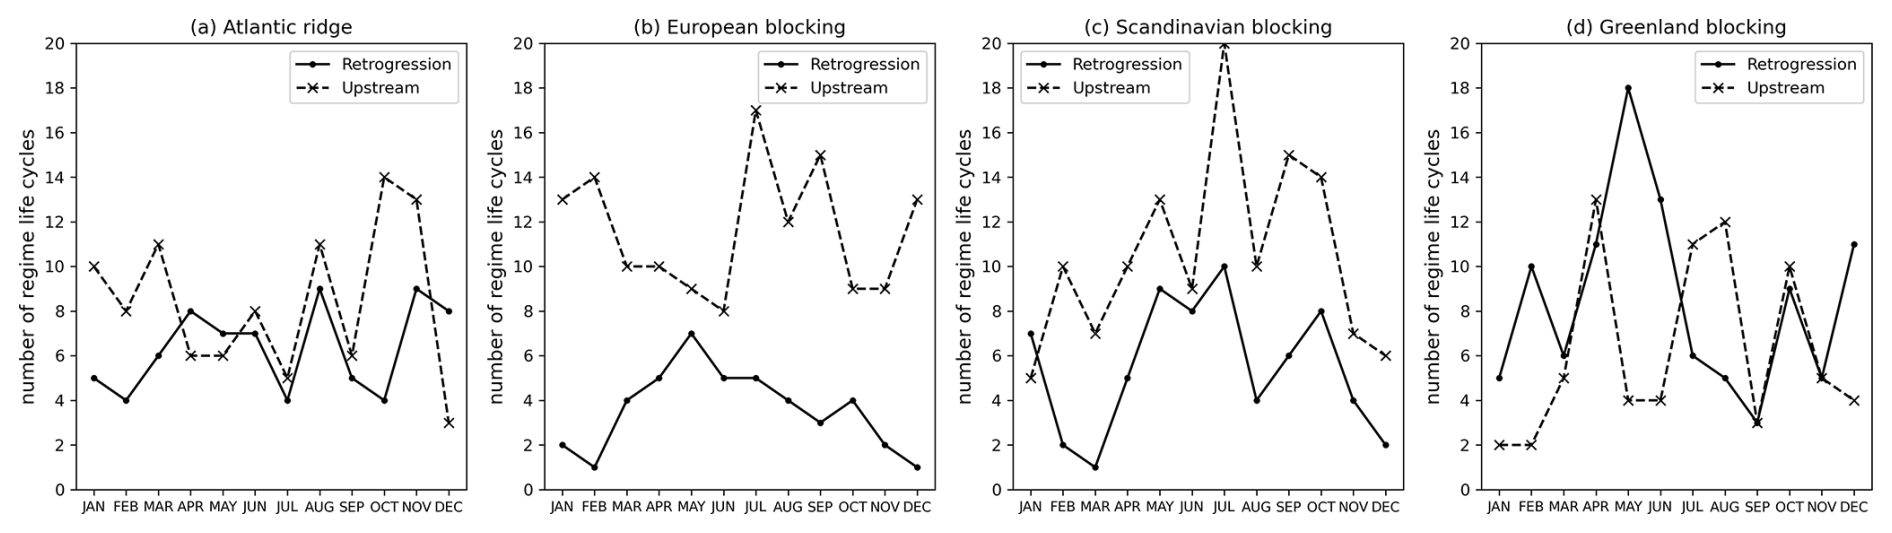
Figure 3Monthly distribution of the absolute number of regime life cycles for the two identified pathways for each of the four blocked regimes. The retrogression pathway is shown with a solid line, and the upstream pathway with a dashed line.
Figure 4 provides more insights into the position of onset PVAs− before blocked regime onset (grey contour lines). Apart from AR, onset PVAs− are located in the mean outside or at the edge of the blocking region 3 d before blocked regime onset, in particular in the southwest quadrant of the regime mask-centred composite (grey contour lines). This highlights the non-stationary development of PVAs− for multiple blocked regimes and extends the previous result found for GL by Hauser et al. (2024b). Although most GL life cycles are assigned to the retrogression pathway, the maximum in onset PVA− frequency is located southwest of the blocking domain (Fig. 4d), suggesting a more confined pathway of upstream onset PVAs− compared to retrograding onset PVAs−.
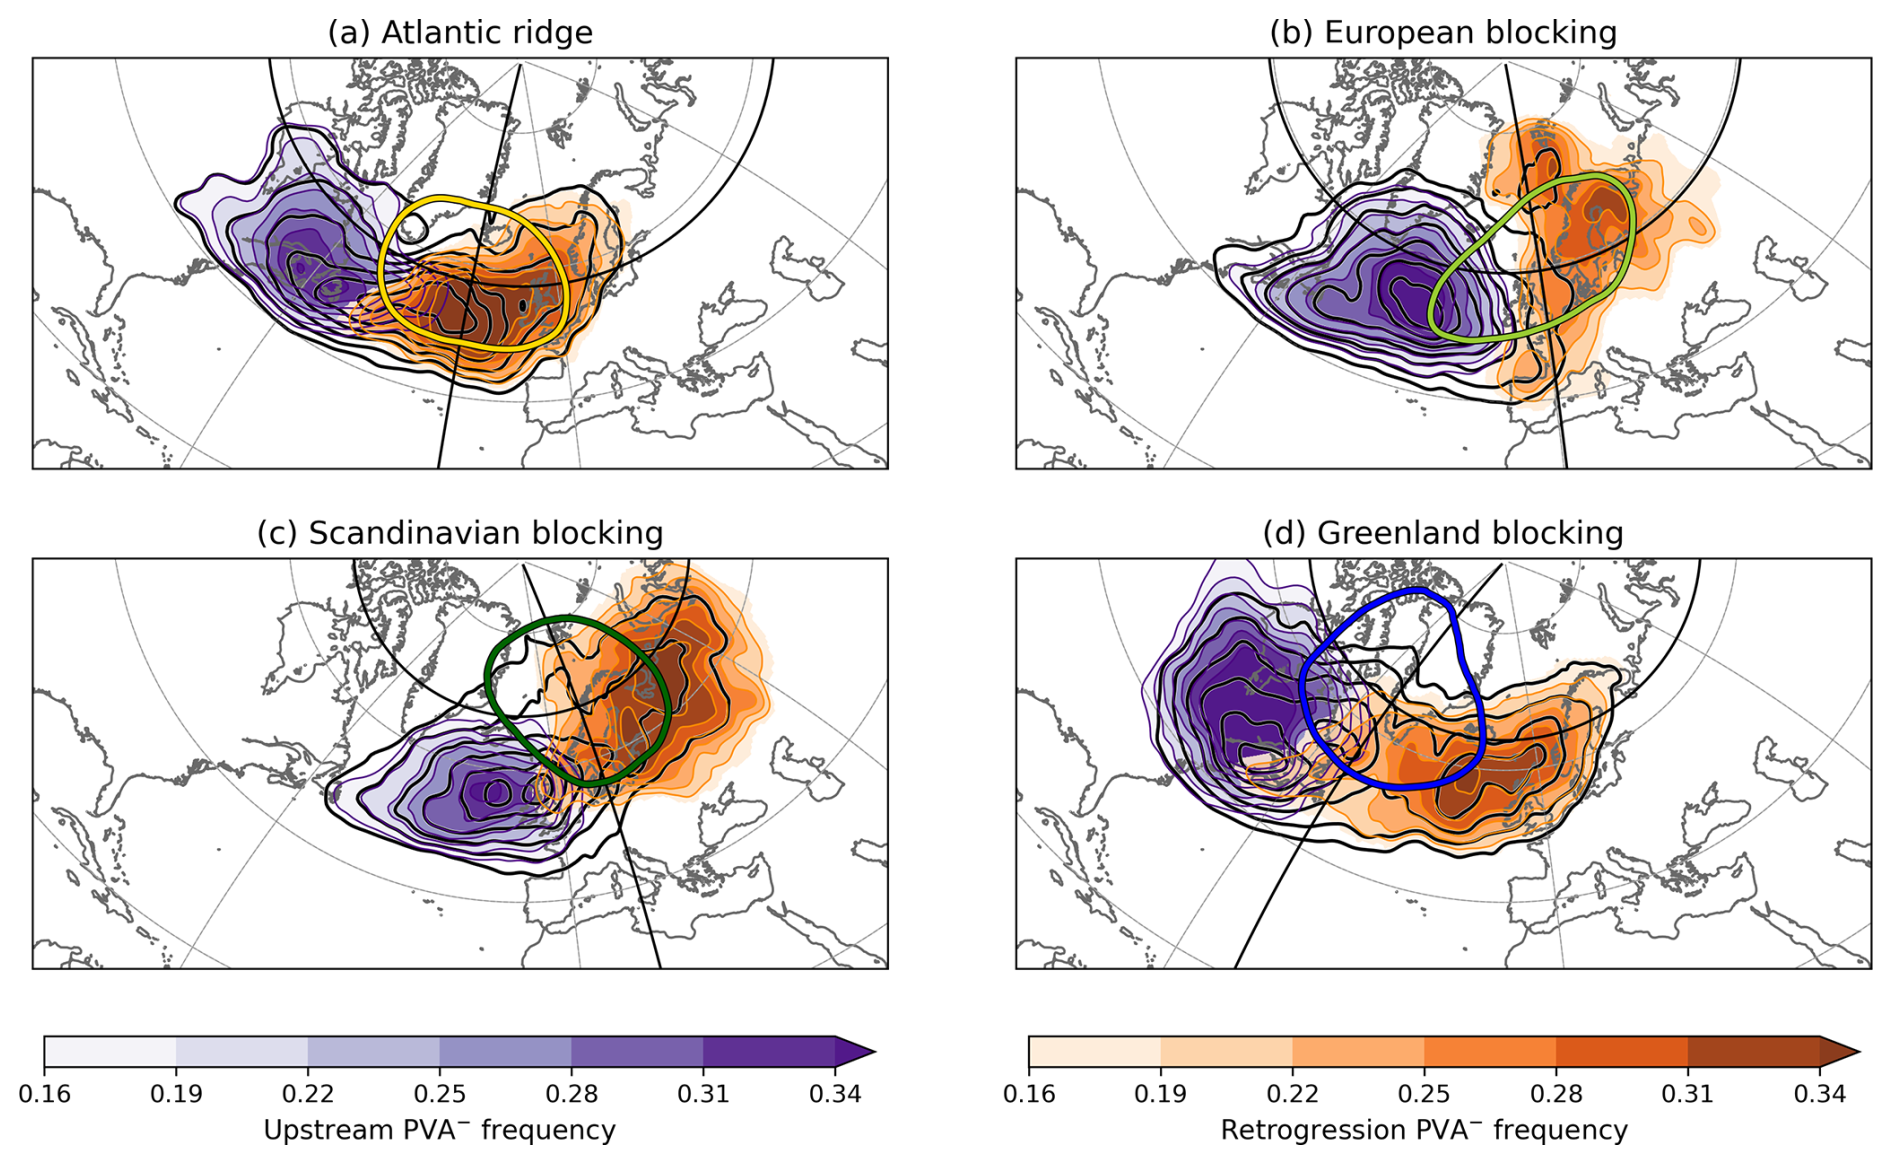
Figure 4Mean composites (shading) of onset PVA− frequency for the two different pathways (orange colours for retrogression pathway, violet colours for upstream pathway) calculated within each respective pathway subset at h before blocked regime onset for the four blocked regimes. The data is smoothed by taking into account the time steps ±6 h around h and using a Gaussian filter with σ=2. Black contours show the total onset PVA− frequency, independent of pathway (0.1–0.4 in increments of 0.03). Coloured closed contours mark the regime masks (same as in Fig. 2). Solid black meridional and zonal lines indicate the centre of mass position of the regime mask, which is used to separate the two pathways.
The location of onset PVAs− in the days preceding blocked regime onset depends on the regime type. For North Atlantic–centred blocked regimes (Fig. 4a and d), both pathways are predominantly oceanic. In contrast, for blocked regimes over Europe and Scandinavia (EuBL and ScBL), retrogression pathways (orange shading) remain confined to continental regions, while upstream pathways (violet shading) extend over the ocean (Fig. 4b and c).
Onset PVAs− along the upstream pathways peak outside the regime mask for all blocked regime types, providing clear evidence that they do not evolve in situ. In contrast, the location of onset PVAs− along the retrogression pathway in the days before blocked regime onset – whether inside, outside, or partially covering the regime mask – depends on the blocked regime type. For AR, retrograding onset PVAs− already reside very centrally in the regime mask 3 d before onset (Fig. 4a). The signal of retrograding onset PVAs− of EuBL is mixed given the low sample size (cf. Fig. 3b), but reveals that PVAs− are distributed both within and outside of the regime mask to its northeast (Fig. 4b). For ScBL, most retrograding onset PVAs− are located at the eastern edge of the regime mask; for GL, they lie further east, entirely outside the mask (Fig. 4c and d). This means that, despite sharing the same temporal reference point (blocked regime onset), the timing at which onset PVAs− enter the blocking region differs not only between individual life cycles but also systematically between blocked regime types. To avoid conflating these differences in timing and evolution in an Eulerian composite framework, a quasi-Lagrangian perspective is particularly well suited here.
3.2 Link between pathways and regime transitions
About 3 d before blocked regime onset, certain regions with high onset PVA− frequency coincide with the location of the regime mask associated with another blocked regime type (Fig. 4). This raises the broader question of whether the pathways of onset PVAs− are linked to preferred regime transitions. Figure 5a shows the climatological frequency of regime transitions for each of the four blocked regimes. All four blocked regimes can arise from any regime type, except for GL, which never transitions from ZO during 1979–2021. The no-regime state is the most frequent origin, accounting for 30 %–42 % of transitions to blocked regimes. When the seven regime types are grouped into cyclonic and blocked regime types, GL and AR most often evolve from other blocked regimes, with transition frequencies of 58 % and 47 %, respectively. After the no-regime state, the most common transitions are ScBL to GL and EuBL to AR. Interestingly, the second most frequent transition into EuBL originates from ZO, showing that cyclonic-to-blocked transitions, while not dominant, occur regularly.
Figure 5b and c show deviations in transition frequencies from the climatological mean for the upstream and retrogression pathways, respectively (positive values indicate higher-than-average frequency). A comparison of regime transitions between the pathways shows that the upstream pathway dominates for blocked regime life cycles that develop from none of the seven regimes. This suggests that blocked regimes forming during periods of more transient large-scale flow are primarily associated with upstream PVAs−. A clear relationship emerges between the pathways and specific regime transitions when considering transitions between blocked regimes. Transitions from blocked regimes whose regime mask is located downstream of the current regime are predominantly linked to the retrogression pathway. Conversely, when the regime mask of the previous blocked regime is located upstream, onset PVAs− tend to follow the upstream pathway. This relationship holds for all blocked-to-blocked transitions, except for the climatologically frequent ScBL-to-GL transition, for which both pathways occur with similar frequency. However, it has been shown that both pathways can occur at the same time, as multiple PVAs− propagate and trigger GL onset, with the onset PVA− merging with another PVA− along the alternative pathway (Teubler et al., 2023).
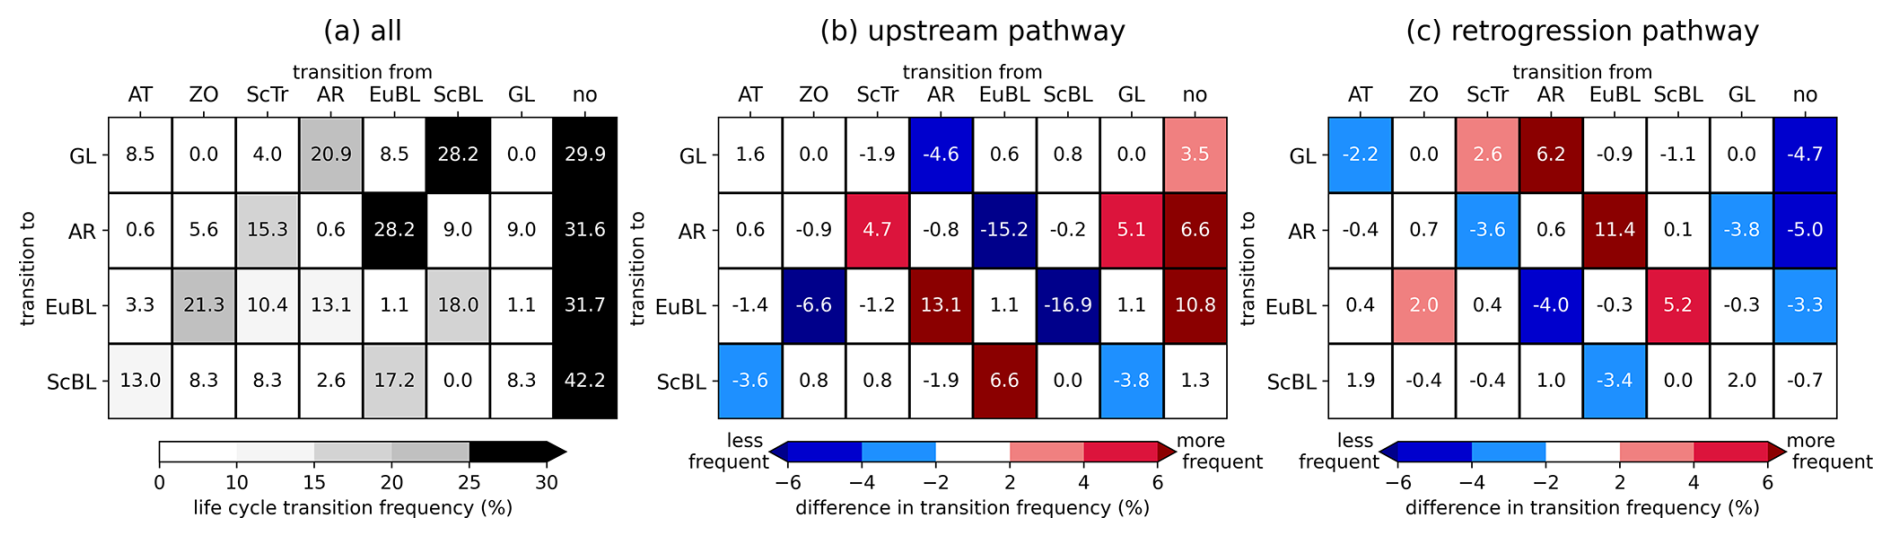
Figure 5(a) Life cycle transition frequency (%) for all transitions into the blocked regimes (y axis) from one of the seven regimes or the no regime (x axis). Each row represents a blocked regime, and each column shows the share of cases (%) with the respective preceding regime. (b) Differences in transition frequency for life cycles linked to the upstream pathway compared to all life cycles, independent of pathway. (c) Same as panel (b), but for the retrogression pathway.
Given the connection between pathways and regime transitions, we analyse whether the onset PVA− of a blocked regime was inherited from the block of the preceding regime. Focusing specifically on blocked-to-blocked regime transitions (40.2 % of all cases), for each time step of an active blocked regime, we identified the PVA− with the largest overlap with the regime mask as the “dominant” PVA−. If the onset PVA− of a blocked-to-blocked transition coincided with the dominant PVA− of the preceding regime, the two regimes could be connected. We find that 57 % of blocked regime onsets are linked to the dominant PVA− from the previous block, whenever the onset follows a blocked regime. This indicates that PVAs− do not necessarily form independently of the previous blocked regime but are instead displaced or reorganized remnants of the earlier blocking configuration. Along the retrogression pathway, notable continuity was found for transitions from ScBL to GL (60 %), EuBL to AR (76 %), and AR to GL (92 %). For the upstream pathway, strong linkages of PVA− were observed for EuBL-to-ScBL (77 %) and AR-to-EuBL (88 %) transitions. However, not all transitions exhibit such continuity. During GL-to-ScBL transitions, the PVA− dominating the onset is unconnected to the preceding GL block in 72 % of cases, which implies that the ScBL block forms in situ rather than as a continuation of the GL anomaly.
3.3 The role of dry and moist processes for amplitude evolution
In this section, we first take a regime-centred perspective and consider the amplitude evolution of onset PVAs− relative to regime onset, consistent with previous studies of weather regime dynamics (e.g. Teubler et al., 2023). Subsequently, we switch to an anomaly-centred perspective and consider the evolution relative to the maximum amplitude of onset PVAs−.
3.3.1 Regime-centred perspective
We start by examining the amplitude evolution of onset PVAs−, irrespective of regime type or pathway (Fig. 6a). The curves show the diagnosed change in amplitude and its contributing terms. From this broad perspective, onset PVAs− amplify on average in the days before blocked regime onset, with a peak 1–2 d before onset (DIAG, black line). Onset PVAs− still amplify during and after onset, reaching their peak amplitude around 1 d after the onset, which is then followed by a weakening. This result highlights that onset PVAs− not only form remotely but also experience much of their amplification before the actual blocked regime onset. On average, the divergent PV tendency associated with divergence or convergence within the PV anomaly itself (DIVdiv, dark red) leads the total diagnosed amplification before the onset, pointing to a dominant contribution of moist processes for the build-up of the PVA− linked to blocked regime onset. After onset, the contribution of DIVdiv weakens but still brings a positive contribution to the amplitude evolution in the mean. The baroclinic interaction term (LOW, gold) shows a quite constant and positive contribution to the amplification of onset PVAs−, which increases even further after onset probably as a result of coupling between the lower and upper troposphere. Upper-tropospheric, quasi-barotropic wave dynamics (UP, blue) provide the second most important contribution to a PVA− strengthening within the period −3 to +1 d around the onset, followed by a weakening beyond that. The impact of the divergent PV tendency due to the advection of background PV by the divergent wind (DIVadv, light red) and the residual PV tendency term (RES, yellow green) are negligibly small and not of any importance for the mean amplitude evolution.
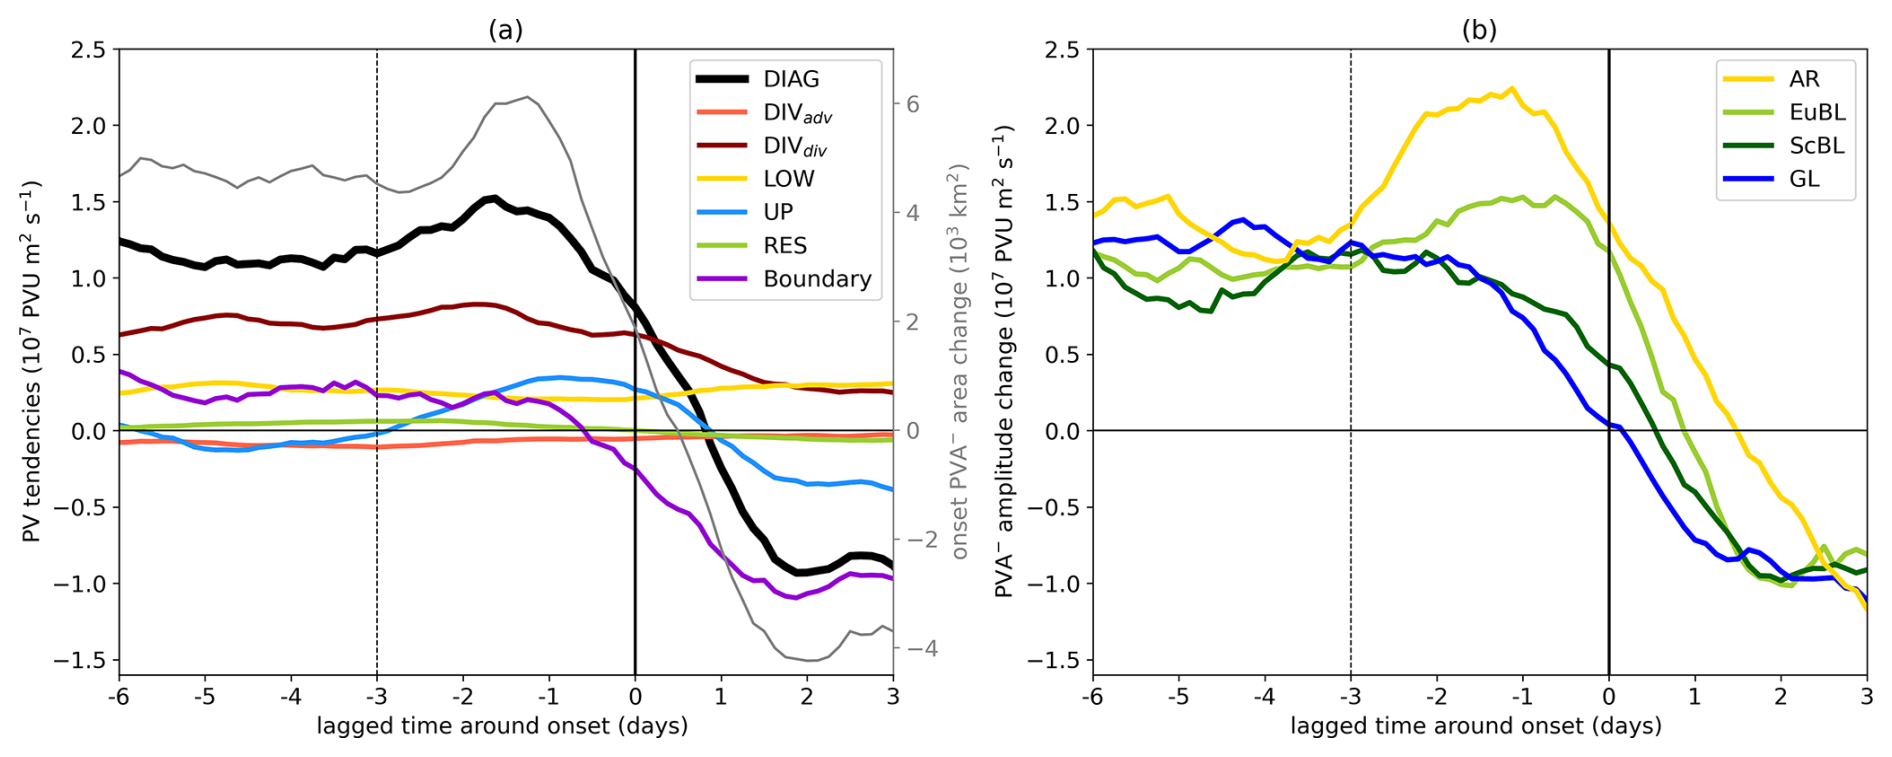
Figure 6(a) Composite of amplitude-modifying contributions (left y axis) to the diagnosed amplitude change of onset PVAs− (DIAG, black) for all blocked regime life cycles independent of type, following Eq. (2): advection part of the divergent outflow term (DIVadv, , light red), divergence part of the divergent outflow term (DIVdiv, , dark red), baroclinic interaction (LOW, , gold), upper-tropospheric wave dynamics (UP, , blue), the residual PV tendency term (RES, , yellow green) and the boundary term (Boundary, dark violet). The sign of the PV tendencies is defined such that positive (negative) values always indicate amplification (weakening) of the PVA− amplitude. The grey line shows the mean change in onset PVA− area (right y axis). (b) Mean diagnosed amplitude change of onset PVAs− around blocked regime onset for the four blocked regimes separately. All curves have been smoothed using a 24 h moving window centred on each time step.
The full boundary term (Boundary, dark violet) shows a positive contribution until about 1 d before onset, followed by a rapid and strong negative contribution that dominates the amplitude weakening afterward. When separated into its components (cf. Eq. 3), the two contributions act in opposite directions before onset (not shown). The eddy PV flux term continuously weakens the onset PVA− amplitude, indicating a net inward PV flux across the anomaly boundary. In contrast, the area-change term suggests spatial growth or merging of smaller anomalies before onset, contributing to amplification. This aligns with the observed increase in anomaly area (grey line, Fig. 6a). After onset, the full boundary term becomes negative as shrinking or splitting PVAs− reduce amplitude. Notably, this sign reversal occurs before the PVAs− reach their maximum size.
Considering the blocked regime types individually (Fig. 6b), we find that for all types the onset PVAs− amplify in the days before onset and then start to weaken in the first 2 d after regime onset. One difference among the regimes is the rate of onset PVA− amplification. Low-latitude regimes – defined here as regimes whose onset PVAs− are typically located at comparatively lower latitudes (AR, EuBL) – tend to amplify more strongly than high-latitude regimes (ScBL, GL). This behaviour is consistent with weaker background PV gradients and more favourable conditions for baroclinic and diabatic amplification at lower latitudes, and may also partly reflect the larger diagnosed spatial extent of PVAs− in these regimes given the use of a fixed upper-tropospheric layer and PV threshold (not shown). A clear difference between the types, however, is found in the timing of the maximum amplification rate: EuBL and AR reach a peak in the 2 d before onset, ScBL peaks earlier, and GL shows a relatively flat amplification without a distinct maximum.
We further stratify by pathway and, given the differences in maximum amplification timing, we analyse three periods: −6 to −3 d (period I), −3 d to onset (period II) and onset to +3 d (period III; see vertical lines in Fig. 6b). Figure 7 provides a compact view on the net effect of the amplitude change of onset PVAs− and the respective PV tendency terms, allowing for a concise view of PV dynamics across regime types, timings, and pathways. Figure 8 displays spatial composites of the different PV tendency terms, centred on the onset PVAs− during period II.
First, we find differences in the timing of maximum amplification rate of onset PVAs− depending on the regime type and the pathway. Retrograding PVAs− intensify most during the earlier window, whereas in the final 3 d before onset their amplification is weaker – or comparable, as seen in AR. By contrast, PVAs− following the upstream pathway show their strongest amplification in the latter period (Fig. 7).
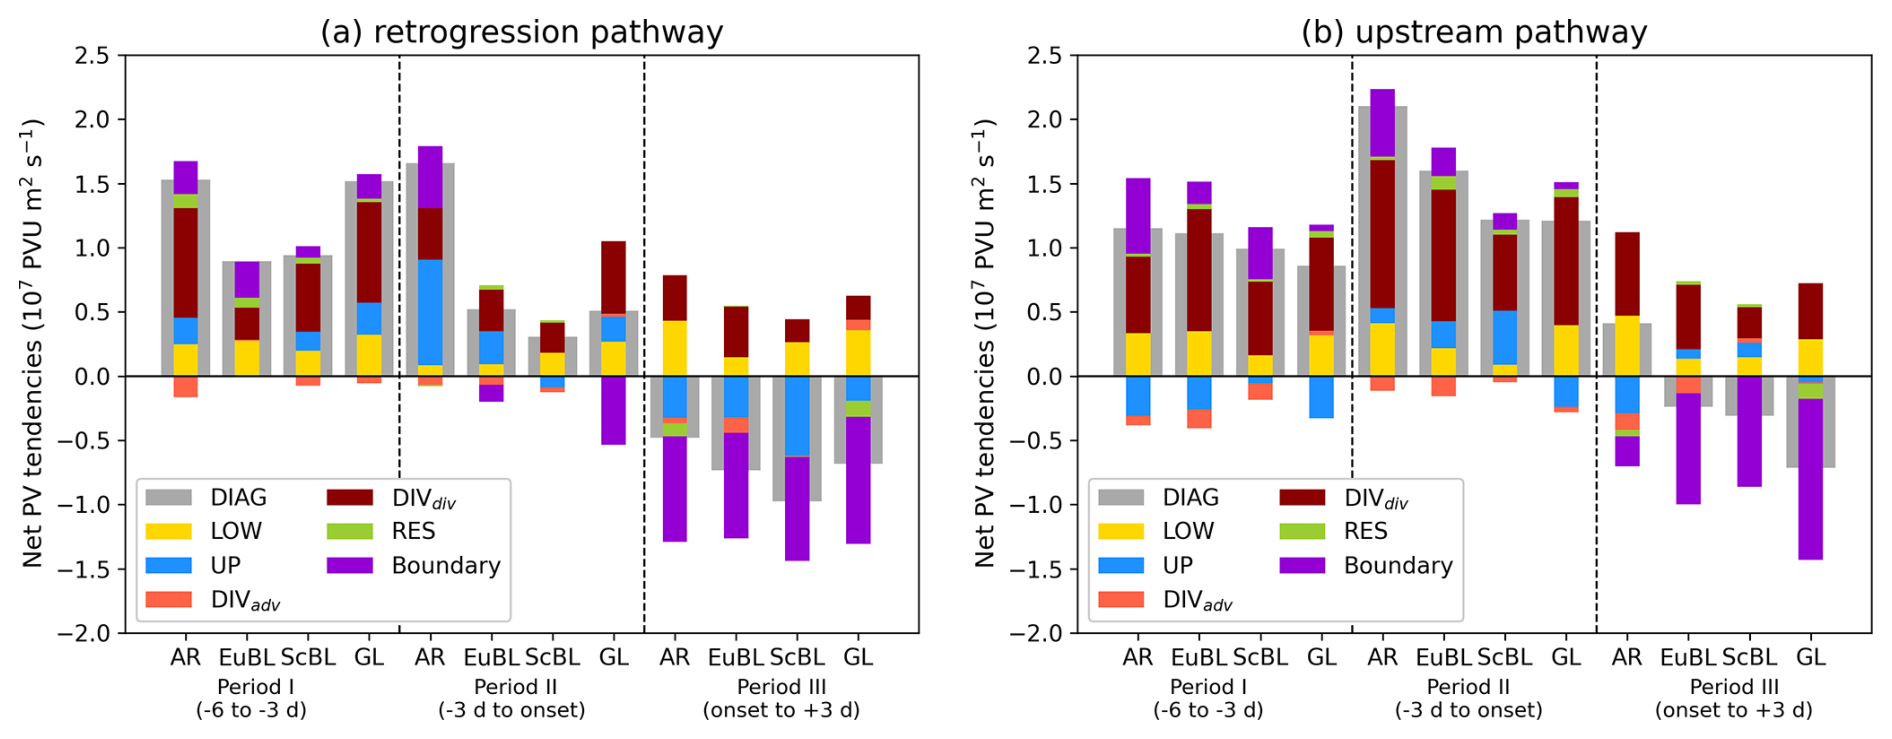
Figure 7Net effect of amplitude evolution (grey bar) and contributing processes (coloured bars, see legend) for three different time periods (I, II, and III; see x axis for exact time lag information) and the four blocked regimes, split up into the onset PVAs− following the (a) retrogression and (b) upstream pathway.
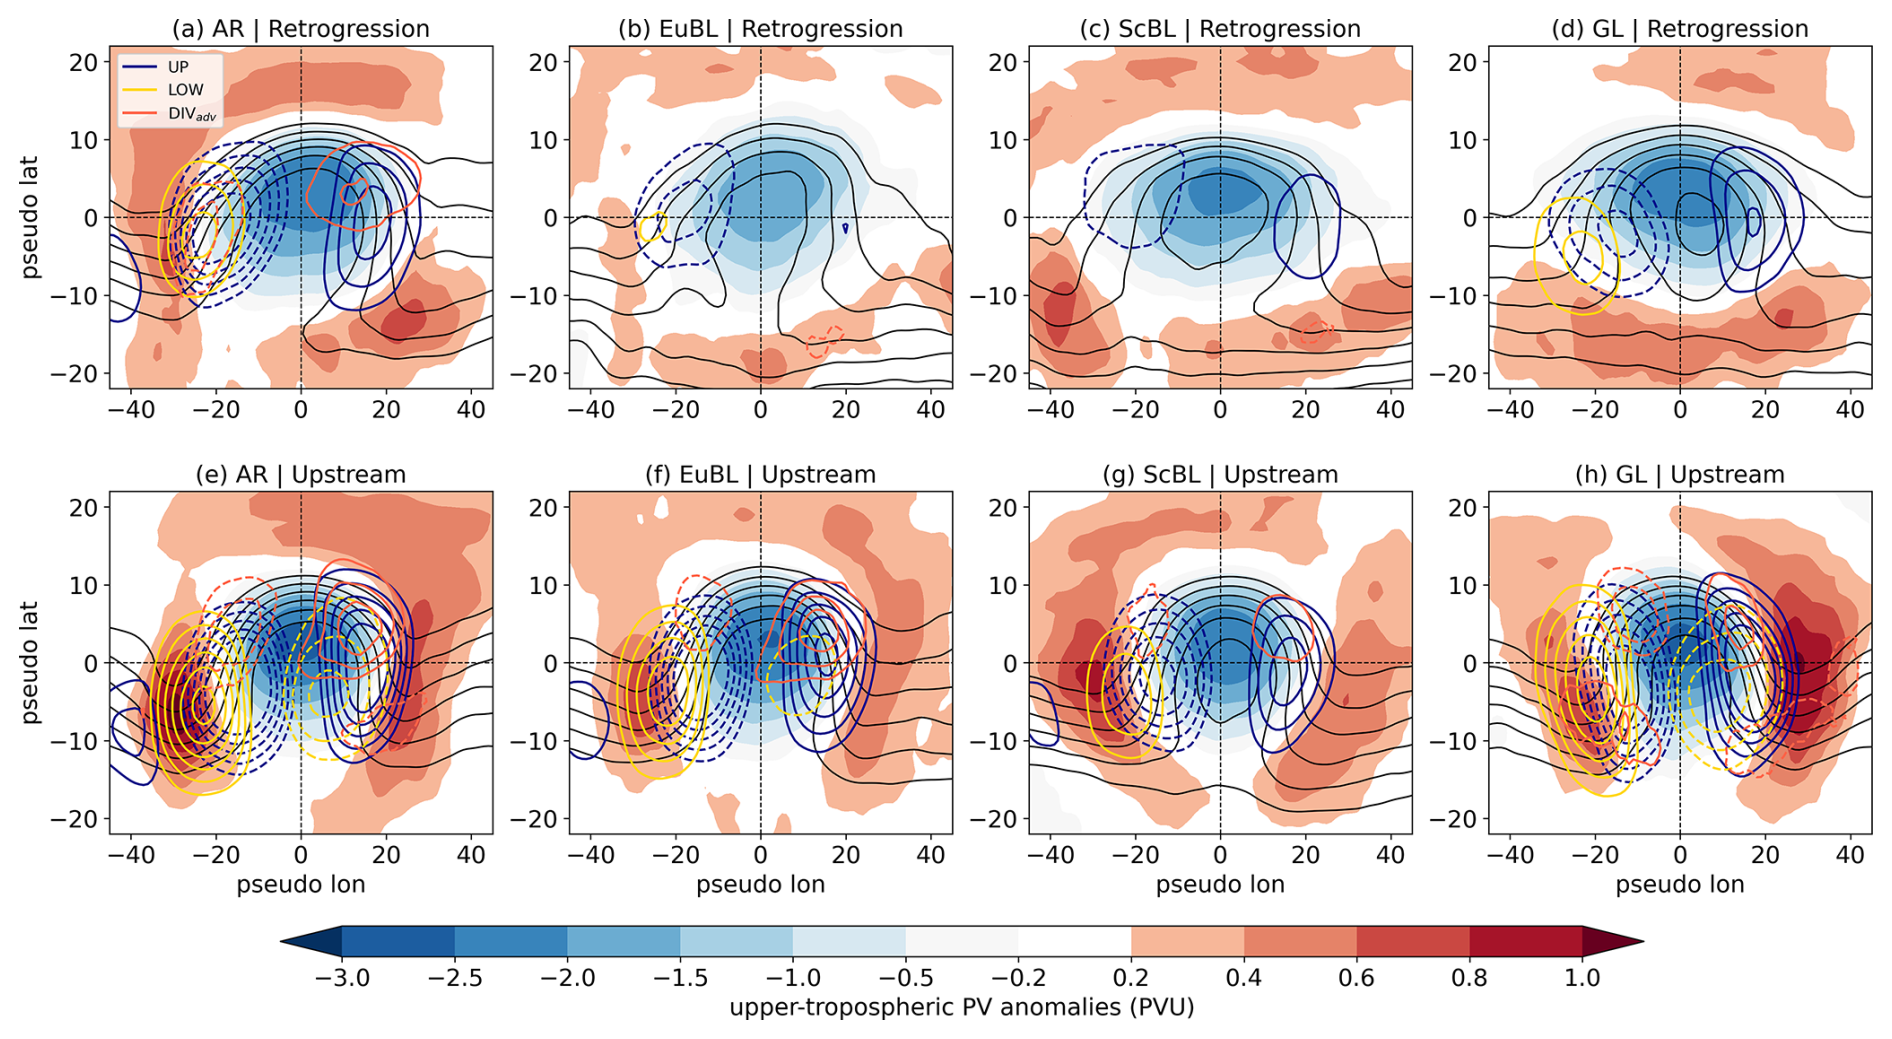
Figure 8Centred composites of onset PVAs− (centre of mass positions) from −3 d before onset to the onset time, shown for the four blocked regimes (columns) and two pathways (rows). Shading denotes upper-tropospheric PV anomalies (in PVU, note the varying colourbar scales) and black contours indicate upper-tropospheric PV (from 2.5 to 5 PVU in steps of 0.5 PVU). Colored contours show the specific PV tendencies (solid for positive, dashed for negative). Blue contour lines mark the contribution of UP ( PVU s−1), gold contour lines mark the contribution of LOW ( PVU s−1) and light red contour lines point to tendencies of DIVadv ( PVU s−1). Note that unlike the area-integrated perspective (e.g. Fig. 6a), negative (dashed) contours here represent PV reduction, enhancing the PVAs−, whereas positive (solid) contours represent PV increase, weakening the PVAs−.
Second, we find pathway-specific differences in the contributions of dry and moist processes to the onset PVA− amplification and weakening rates. DIVdiv is the major contribution to the amplification rate of onset PVAs− following the upstream pathway (Fig. 7b). Because of its dominant role in the amplification of onset PVAs−, we dedicate a chapter that provides more insights into the patterns and dynamics of DIVdiv (Sect. 3.4). The contribution of LOW is throughout positive, independent of pathway, time period relative to onset or blocked regime type. Thereby the magnitude of the net LOW contribution is highest for GL in both time periods before onset. For ScBL, the net effect of LOW is much lower compared to the other regimes and suggests less coupling with lower troposphere dynamics, probably linked to the location of the onset PVAs− in higher latitudes and over the continent. This agrees with the weaker tendencies of LOW in a spatial sense for onset PVAs− of ScBL (Fig. 8d and h). The sign of the net contribution of UP strongly depends on the pathway, blocked regime type and the timing. UP has an amplifying effect on onset PVAs− following the retrogression pathway in early times while those following the upstream pathway experience weakening via the UP term (Fig. 7). A better agreement exists between the pathways shortly before onset, with UP leading to a net contribution to amplification as the quasi-barotropic tendency pattern enhances the western flank more strongly than it suppresses the eastern flank (Fig. 8). The boundary term contributes mostly positively to the amplitude evolution before the onset, and strongly negative after onset (Fig. 7). However, for retrograding onset PVAs− of GL, the boundary term exhibits a negative contribution in the 3 d before onset, even while the PVAs− themselves are amplifying. This can be explained by the way the boundary term is defined. The boundary term measures PV flux across the feature's boundary, so if weaker “fringes” of the anomaly split off, the boundary term is negative, but the core PV can continue to intensify, resulting in overall amplitude growth. This explains how GL can show a negative boundary contribution yet still experience growth in the onset PVA−. The net effects of DIVadv and RES are of minor importance and are not further discussed here.
Third, onset PVAs− exhibit striking differences in their spatial characteristics depending on the pathway and the blocked regime type (Fig. 8). The onset PVAs− following the upstream pathway have pronounced troughs upstream and downstream, which indicates that these anomalies are embedded within a RWP (Fig. 8, lower row). This is not evident for retrograding onset PVAs− (Fig. 8, upper row). Rather, the meridional orientation of PV anomalies indicate wave breaking, which often occurs at the end of a RWP life cycle (Wirth et al., 2018). Previous studies show that peak frequencies of RWP initiation and decay are found at the beginning and the end of the North Atlantic storm track (Quinting and Vitart, 2019). PVAs− following the upstream pathway to ScBL onset are situated in regions where RWPs typically decay (Fig. 4c). This positioning often results in the upstream trough exhibiting greater amplitude, which in turn leads to a quasi-barotropic enhancement of the onset PVAs− along their western flank (Fig. 8h).
Taken together, these results show that onset PVAs− undergo substantial pre-onset amplification through a combination of moist divergence, baroclinic growth, and quasi-barotropic wave dynamics, with the relative contributions depending strongly on both regime type and pathway.
3.3.2 Anomaly-centred perspective
The onset-centred perspective revealed a systematic difference in the mean timing of maximum amplification of onset PVAs− between blocked regimes and pathways. However, differences in the timing within the individual pathways raise the question of whether the PVAs− involved in blocked regimes differ in their life cycles.
More than 80 % of all onset PVAs− attain their maximum amplitude before or at the time of onset, with the overall maximum occurring 2 d prior (Fig. 9a). No clear seasonal signal is apparent, indicating that the timing is year-round consistent (grey lines). However, distinct differences emerge when the pathways are considered separately: Most onset PVAs− following the retrogression pathway reach their maximum in amplitude very early or shortly after onset (orange line), whereas those following the upstream pathway show a pronounced maximum in the 2 d before onset (turquoise line). This corresponds well with the findings above that retrograding onset PVAs− experience the strongest amplification between −6 to −3 d, while upstream PVAs− are primarily amplified shortly before onset (Fig. 7).
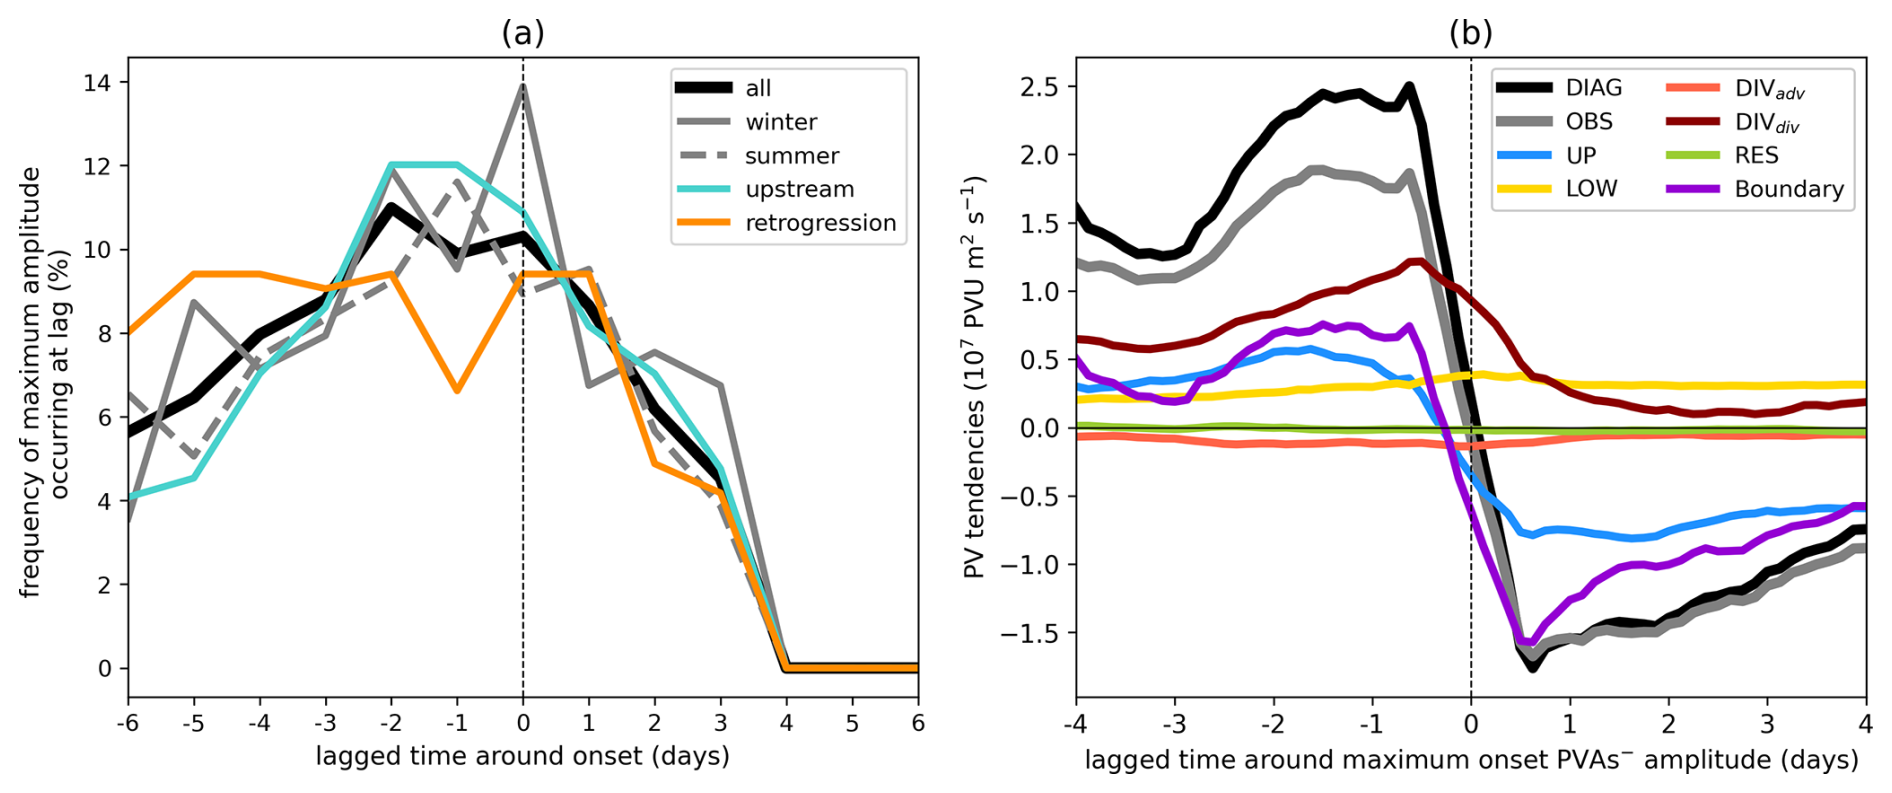
Figure 9(a) Timing of the maximum amplitude for onset PVAs− within ±6 d window around onset. Results are shown for all year-round regime life cycles (black), extended winter only (NDJFM, solid grey), extended summer only (MJJAS, dashed grey), the upstream pathway (turquoise), and the retrogression pathway (orange). (b) Mean integrated PV tendencies over the onset PVAs− centred on the timing of their maximum amplitude (see panel a) for all blocked regime life cycles. The curves have been smoothed using a centred 24 h running-mean.
A much clearer depiction of the amplification of onset PVAs− arises when examining the evolution of the amplitude change and the associated PV tendency terms from a perspective centred on the life cycle of each onset PVA−, rather than relative to blocked regime onset (Fig. 9b). By design, the amplitude increases and decreases before and after the maximum (lag 0), respectively. In agreement with the onset-centred perspective (Fig. 6a), the dominant contribution to onset PVA− amplification is governed by DIVdiv and it exhibits a peak in the day before the maximum amplitude is reached. The contribution strongly decreases within the 2 d around the maximum, pointing to a lack of moist processes that could further amplify the onset PVA−. LOW shows an increasing contribution to amplification during the life cycle of onset PVAs− compared to the evolution from the onset-centred perspective (Fig. 9b), which indicates a rather constant contribution. The boundary term follows qualitatively the full amplification rate and points to an increase in the size of the PVA− before and a decrease after the maximum. However, the most distinct change is visible in the evolution of UP when comparing the onset-centred and the amplitude-centred perspective (Fig. 6a vs. Fig. 9b).
To further explore these differences in UP between the two perspectives, Fig. 10 shows the mean evolution of UP for all blocked regimes and their corresponding two pathways, relative to regime onset and amplitude maximum of the onset PVA−. In agreement with the compact view on net PV tendencies (cf. Fig. 8), the contribution of UP relative to regime onset highly differs between the pathways and regimes (Fig. 10, light blue), with partly opposite behaviour, such as for the two pathways of ScBL and GL. Thereby, the mean evolution features multiple instances where the sign of UP changes. In contrast, a much clearer pattern emerges for UP in the anomaly-centred perspective (dark blue), with markedly smaller differences between pathways and regimes. The UP evolution across the different pathways and regimes largely follows the mean over all regimes and pathways (Fig. 9b), with a positive contribution to amplification before the maximum amplitude and a contribution to weakening after. This indicates that the amplitude-centred framework captures an essential role of UP in the growth and decay of onset PVAs−, while the onset-centred view highlights pathway-specific variability in the underlying dynamics.
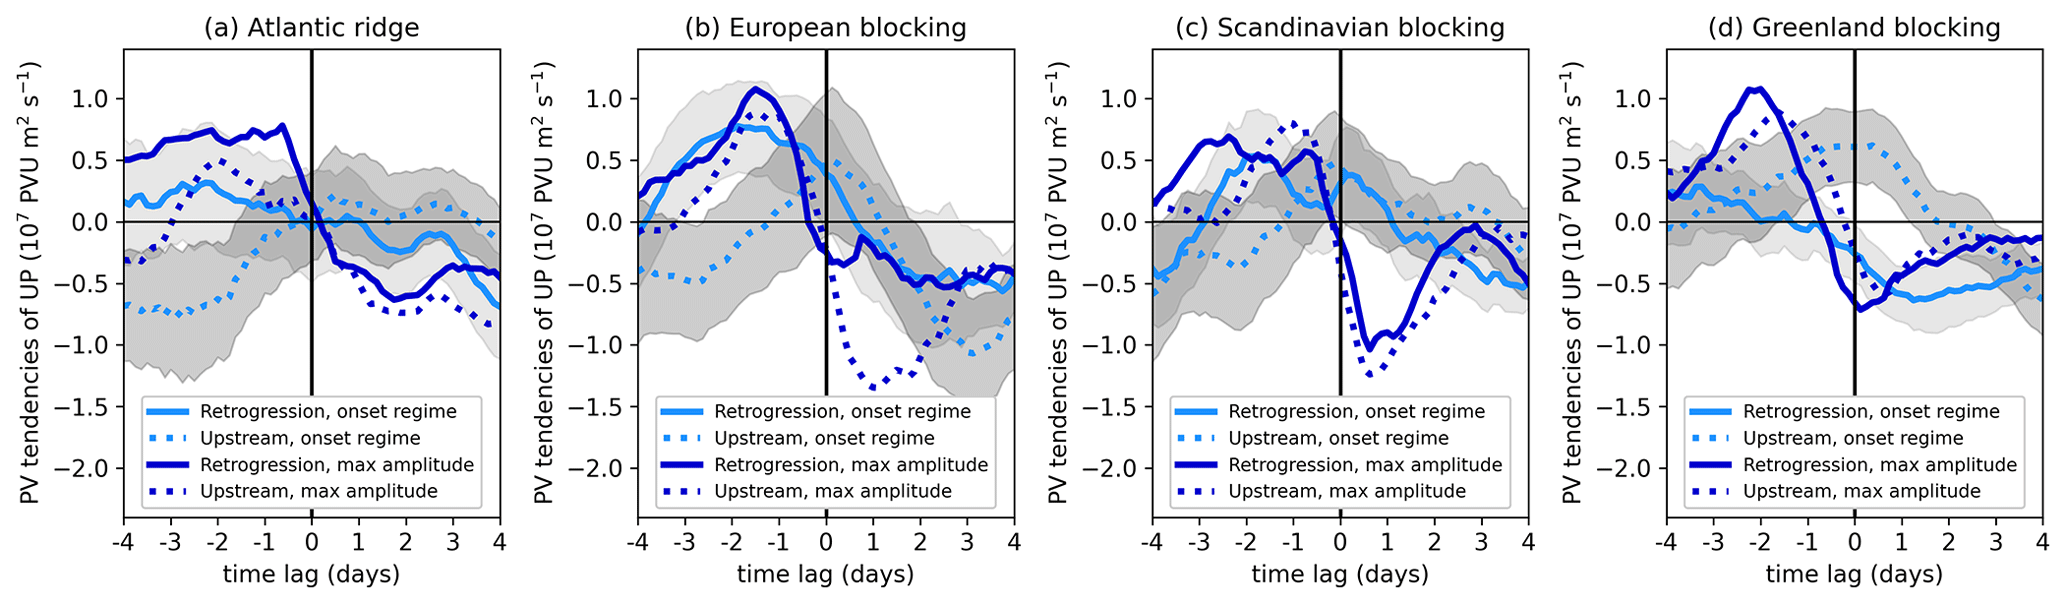
Figure 10Temporal evolution of the upper-tropospheric PV tendency contribution to the amplitude change of onset PVAs− relative to the regime onset (light blue) and relative to the maximum in PVA− amplitude (dark blue) for the retrogression pathway (solid) and the upstream pathway (dotted). The x axis shows the time lag around regime onset for the light blue lines and the time lag relative to the maximum amplitude of onset PVAs− for the dark blue lines. Grey shading displays ±1 standard deviations around the mean for the onset-centred perspective (light blue lines). The lines were smoothed using a 24 h moving window.
3.4 The importance of moist processes and the link to WCB activity
A major result of this study is the dominance of moist processes during the amplification phase of onset PVAs− prior to blocked regime onsets, as presented in Sect. 3.3. Here, we investigate the spatial distribution of amplifying DIVdiv tendencies and WCB activity within the onset PVAs−, and analyse whether the contribution of moist processes depends on the geographic position of the PVAs− relative to the storm track. Given the maximum in DIVdiv during the 2 d preceding blocked regime onsets (cf. Fig. 6a) and to be consistent with Fig. 8, we present onset PVA−-centred composites of WCB activity and DIVdiv tendencies for the period from −3 d to onset (corresponding to period II in Fig. 7), shown separately for the four blocked regimes and pathways.
Onset PVAs− of most regimes and pathways reveal amplifying DIVdiv tendencies to the northwest of the PVA− centre, with a distinct WCB structure before regime onset: WCB inflow in the southwestern, WCB ascent in the western, and WCB outflow in the northern part of the anomaly (Fig. 11). This composite structure of the full WCB corresponds well with many case study-based findings of WCB activity along the western edge of a ridge or block (e.g. Grams et al., 2011). There is a strong spatial overlap of WCB outflow, negative DIVdiv tendencies, and areas of pronounced upper-tropospheric divergence (wind vectors in Fig. 11), all located to the northwestern part of the anomaly. Consistent with this spatial linkage, we find a modest, significant positive correlation between the anomaly-integrated DIVdiv tendencies and WCB area size within the onset PVAs−, with r=0.32 for WCB ascent and r=0.34 for WCB outflow. Hauser et al. (2023) demonstrated this relationship for a single case, but here we show that the relationship holds systematically in a climatological sense, i.e. in the average over many cases. This result is consistent with the notion that tropopause modification by upper-tropospheric divergent flow is enhanced by latent heat release in WCBs and suggests a link between WCBs and the divergent PV tendencies that reinforce negative PV anomalies. Upper-level convergence, in contrast, occurs in the eastern part of the onset PVAs−, where it contributes to a local increase in PV. However, when considered in an integrated sense, the anomaly-amplifying tendencies of DIVdiv dominate, resulting in a net amplifying effect of DIVdiv (cf. Fig. 7).
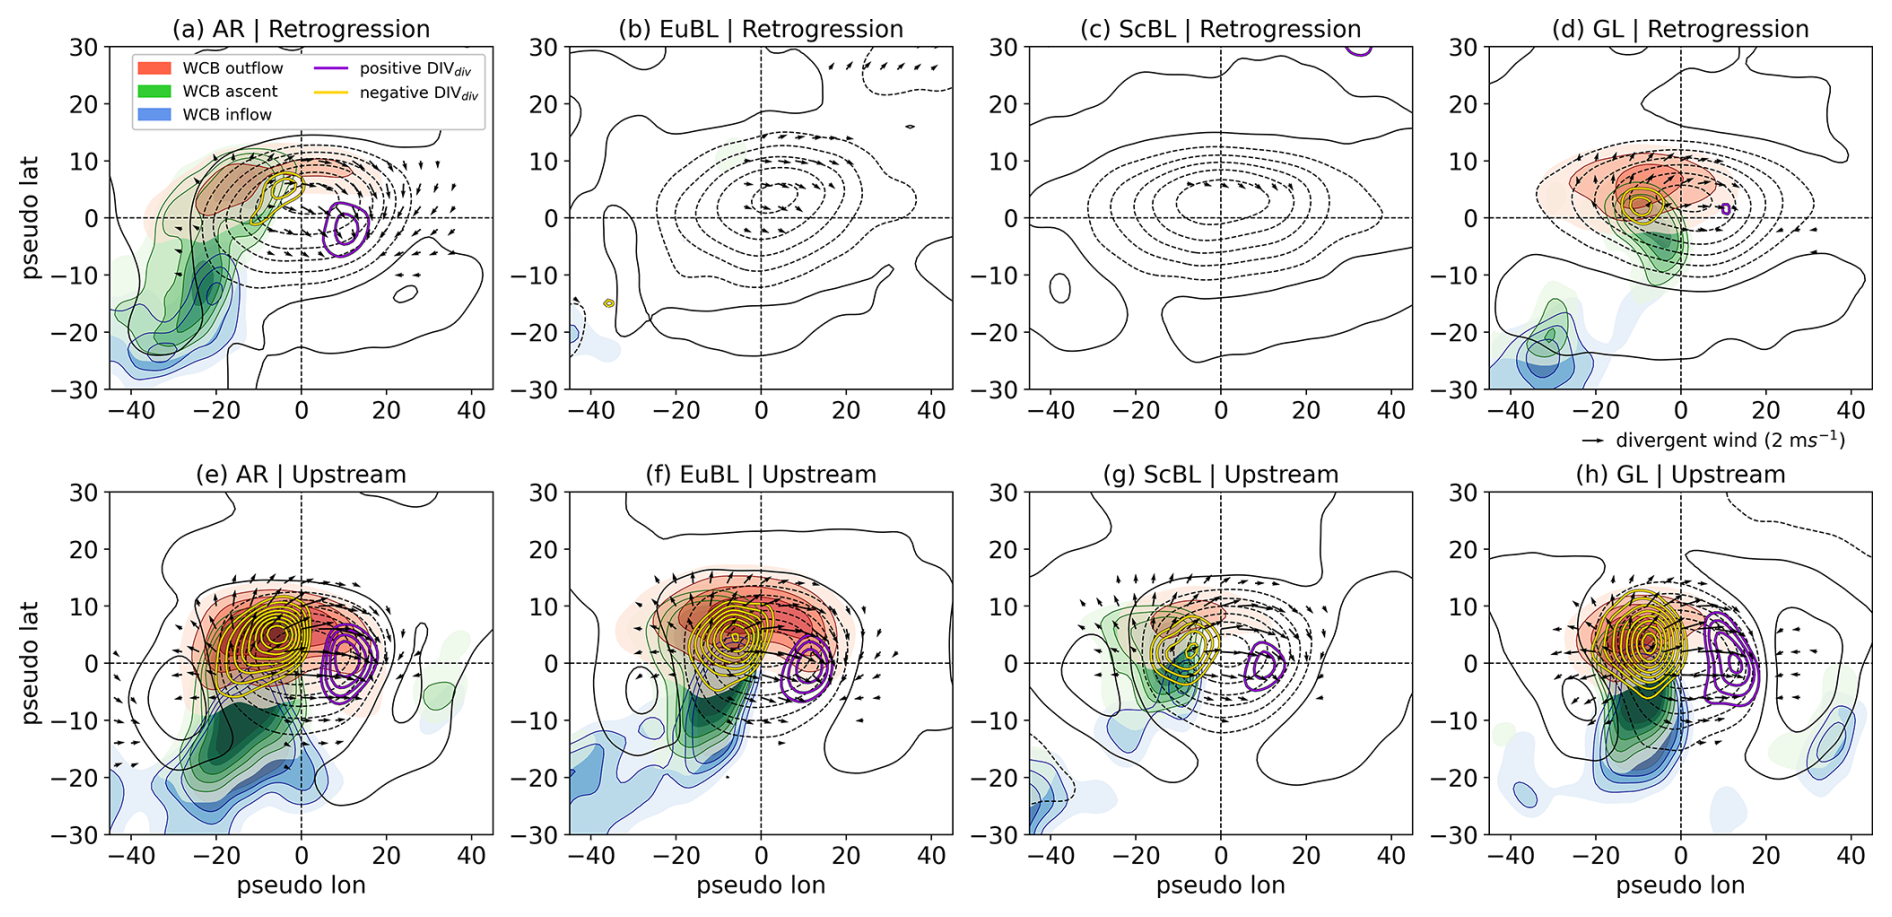
Figure 11Centred composites of onset PVAs− (centre of mass positions) for −3 d before onset to the onset time for the four blocked regimes (columns) and two pathways (rows). Solid and dashed black lines show positive and negative upper-tropospheric PV anomalies, respectively (±0.2, 0.6, 1.0, 1.4, 1.8, 2.2, 2.6 PVU). Shading in different colours point to WCB frequencies for WCB inflow (blue; 2 %, 2.5 %, 3 %, 3.5 %, 4 %), WCB ascent (green; 2 %, 2.5 %, 3 %, 3.5 %, 4 %, 4.5 %) and WCB outflow (red; 6 %, 8 %, 10 %, 12 %, 14 %, 16 %). Gold (dark violet) solid contours mark negative (positive) tendencies of DIVdiv ( PVU s−1). Wind vectors (in black) show the divergent wind speed and direction whenever the wind speed exceeds 0.7 m s−1. All field were smoothed by a Gaussian filter with σ=2.
High variations are found in the activity and co-occurrence of WCBs with onset PVAs− before onset, showing a strong dependency on the blocked regime type and, in particular, on the pathway (Fig. 11). WCB activity and associated DIVdiv tendencies are overall more pronounced for onset PVAs− following the upstream pathway compared to the retrogression pathway (Fig. 11, upper vs. lower panels). The strongest and most coherent WCB outflow is present for upstream pathway cases of AR, EuBL, and GL, and is characterized by widespread outflow covering the northern part of the onset PVAs− and contributing to anticyclonic anomaly amplification. In contrast, WCB activity is generally weaker and less spatially coherent for PVAs− following the retrogression pathway, particularly for EuBL and ScBL, where no robust composite WCB signal is evident. While DIVdiv makes a substantial net contribution to the PVA− amplification along the retrogression pathway (Fig. 7a), this signal is weak in the mean spatial composites (Fig. 11b and c). This is likely due to several factors, including changes in anomaly size and shape that smear the signal, as well as contributions from upper-tropospheric processes not directly related to WCB outflow, such as jet-related ageostrophic (dynamically forced dry) secondary circulations and balanced Rossby-wave dynamics.
As previously noted for GL (Hauser et al., 2024b), WCB-related diabatic outflow can contribute to ridge amplification and may in some cases support the westward extension of PVAs−. Generalized for all four blocked regimes considered here, the upstream WCB activity and DIVdiv-related amplification play distinct roles depending on the pathway. Along the upstream pathway, WCBs primarily act as an amplification mechanism, strengthening PVAs− and favouring downstream development and progressive evolution. Along the retrogression pathway, the weaker and less spatially coherent WCB activity may in some cases contribute to the deformation of PVAs− and thereby aid anomaly retrogression by locally extending PVAs− westward, which is consistent with reduced ridge propagation (e.g. Riemer et al., 2014). This suggests that while WCBs dominate anticyclonic amplification in PVAs− following the upstream pathway, their influence during retrogression is secondary and more heterogeneous, acting as an additional aid rather than a primary driver of the evolution, consistent with Hauser et al. (2024b).
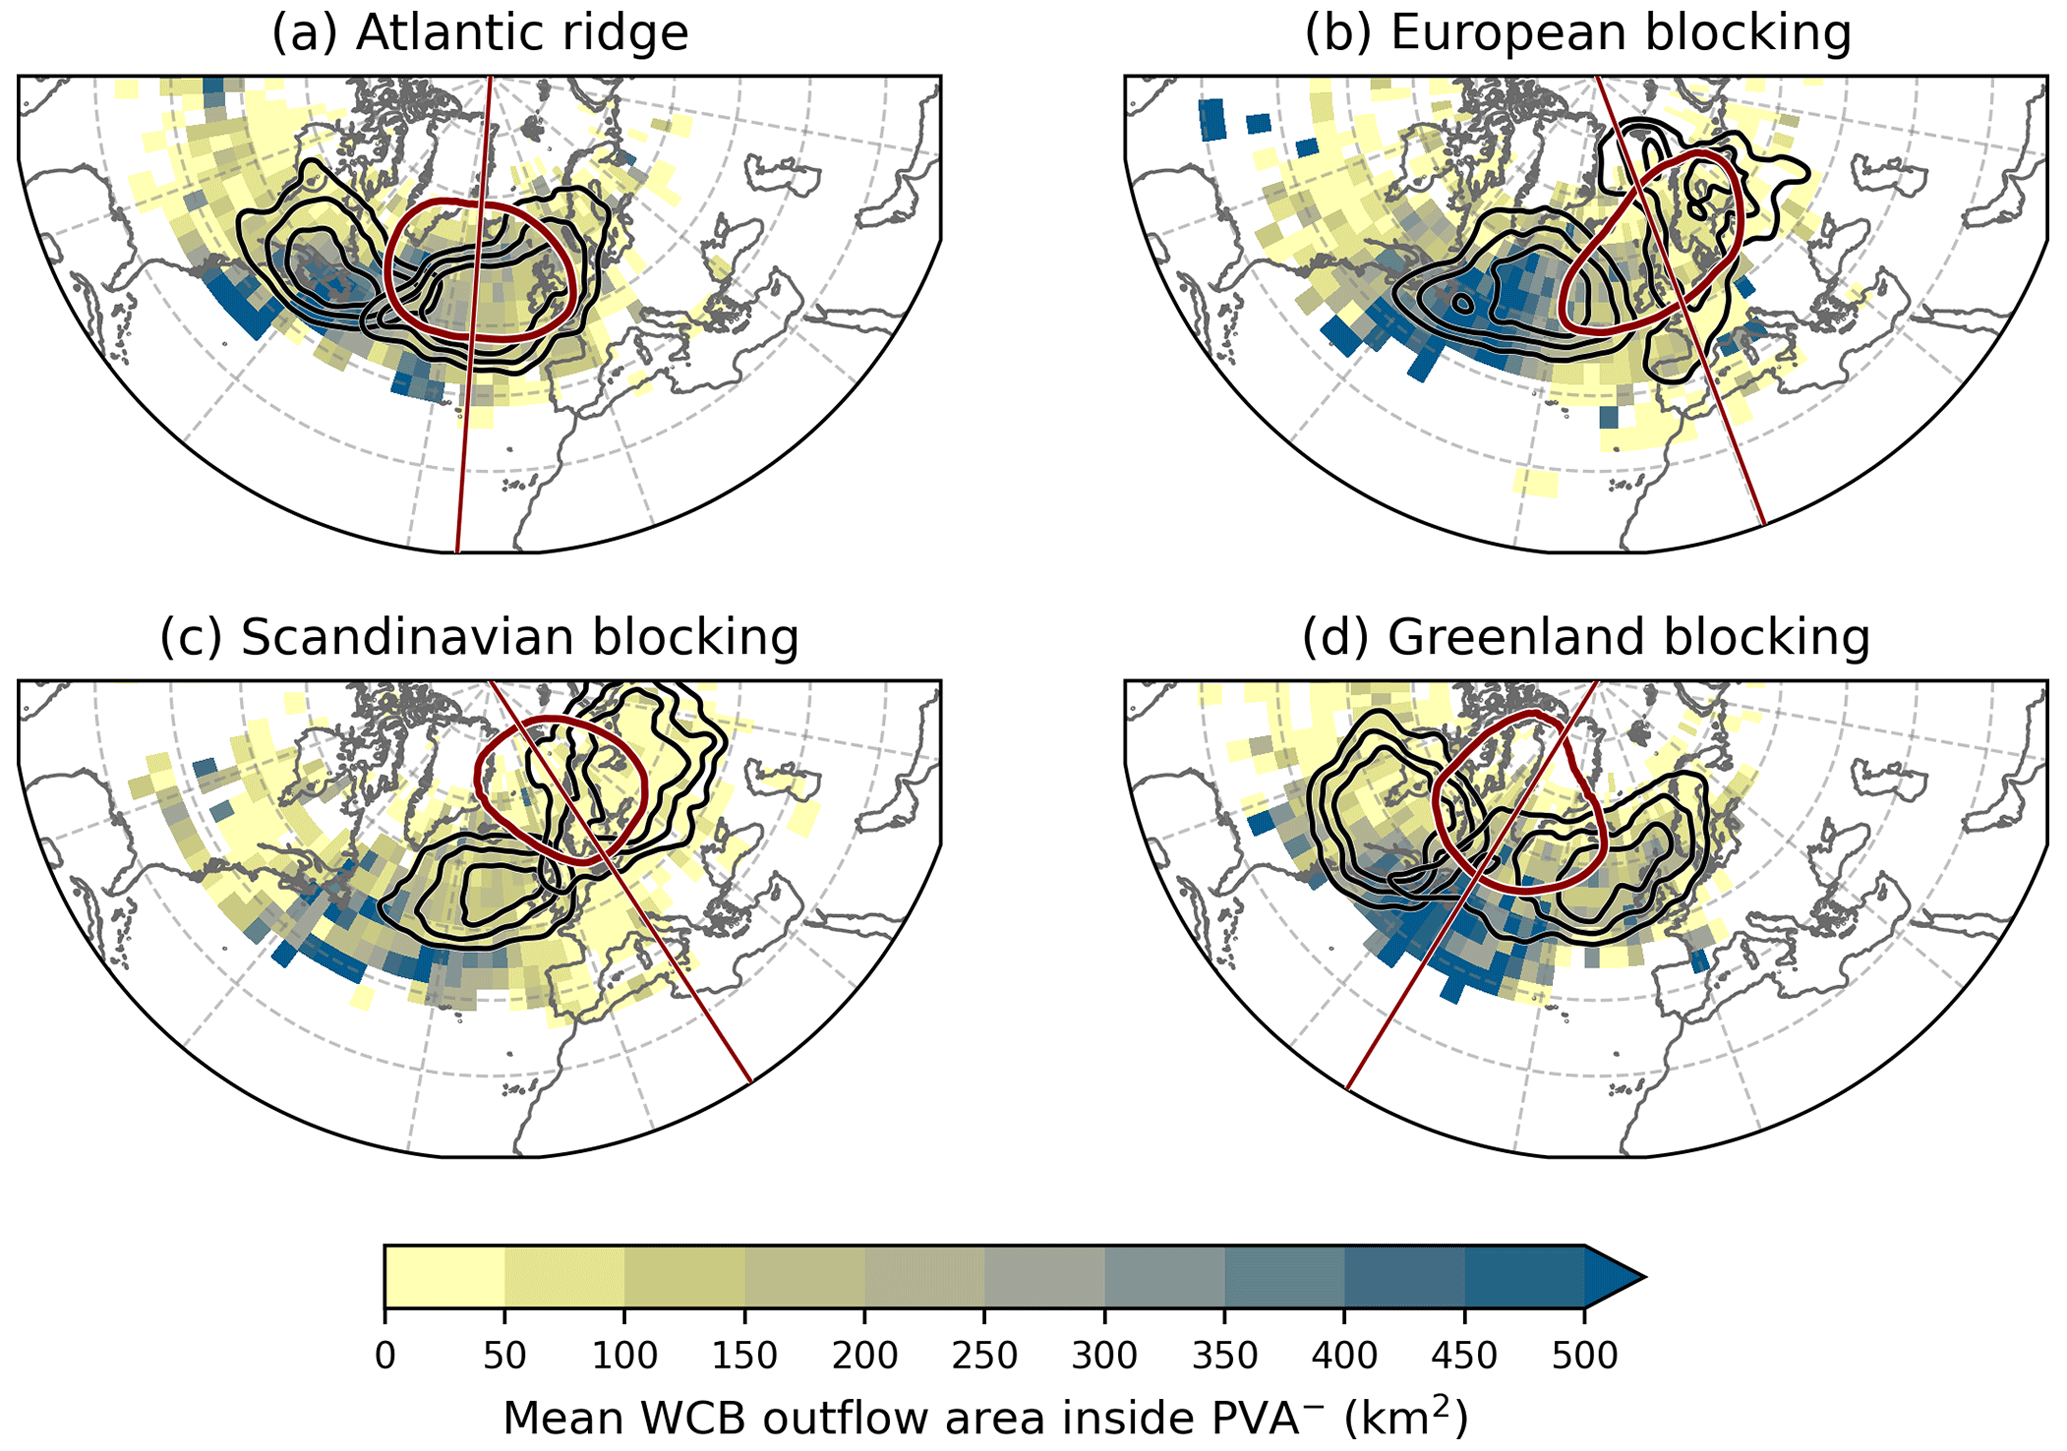
Figure 12Mean WCB outflow area (km2) within the onset PVA−, calculated over 3°×3° latitude–longitude grid boxes for all onset PVAs− from −6 d before onset to the onset time, shown separately for each blocked regime type: (a) Atlantic ridge, (b) European blocking, (c) Scandinavian blocking, and (d) Greenland blocking. Each onset PVA− is assigned to a 3°×3° grid box based on the location of its centre of mass, and grid-box means are shown only where more than four PVAs− are available. Black contour lines indicate the occurrence frequency of onset PVAs− (0.2, 0.25, 0.3) along the pathways at a time lag of −3 d before onset (see Fig. 4). The closed dark red contour denotes the regime mask (cf. Fig. 2), and the dark red line marks the longitude used to separate the pathways.
The partly large differences in WCB activity between the blocked regime types and pathways in the 3 d before blocked regime onset raise the question of whether the location and pathway of onset PVAs− determine the extent to which they are amplified by moist processes. To address this question, Fig. 12 presents the spatial distribution of the mean WCB outflow area within onset PVAs− in the 6 d prior to blocked regime onset. The results reveal a clear spatial dependence: the largest mean WCB outflow areas within PVAs− are found over the western North Atlantic across all regimes, while moderate outflow areas occur over the eastern North Atlantic and only small outflow areas are found for onset PVAs− located over North America, Europe, and over western parts of Asia. This pattern closely follows the climatological distribution of WCB activity (e.g. Heitmann et al., 2024), indicating that PVAs− located in storm-track regions are more strongly exposed to moist processes. When considering the blocked regime types separately and accounting for their respective pathway orientations, these spatial patterns also help explain the differences in diabatic contributions to PVAs− amplification, as indicated by DIVdiv (Fig. 7). For AR and EuBL, the upstream pathways intersect regions of frequent WCB activity (Fig. 12a and b), consistent with stronger moist amplification. For ScBL, the retrograding pathway remains largely outside these regions, showing comparatively weak WCB outflow within the corresponding onset PVAs−. Overall, Fig. 12 shows that the differences in PVA−-centred WCB activity and associated DIVdiv composites (Fig. 11) arise from the distinct geographical positioning of the PVAs− relative to the North Atlantic storm track (Fig. 12; black contours), and thus to regions where WCB frequency climatologically peaks.
To conclude, the close link between WCB activity and amplifying DIVdiv tendencies underscores the importance of moist processes along the pathways of onset PVAs−. Onset PVAs− crossing the North Atlantic storm-track region are more likely to be amplified by moist processes than those propagating through more continental areas, such as the retrogression pathways of EuBL and ScBL.
In this study, we examined the onset dynamics for four blocked weather regimes over the North Atlantic–European region, using ERA5 reanalysis data for 1979–2021. Building on the quasi-Lagrangian PV framework introduced by Hauser et al. (2023), we traced negative upper-tropospheric PV anomalies (onset PVAs−) associated with blocked regime onset and diagnosed the relative contributions of dry-dynamical and moist-dynamical processes to the amplitude evolution of onset PVAs−.
To place these results in context, the following subsections summarize the main findings of this study in response to the research questions raised in the introduction and situate them within the existing literature. We conclude by discussing the broader relevance and implications of our results and outlining key limitations and directions for future research.
4.1 The non-local development of onset PVAs−
Considering 729 blocked regime life cycles over the North Atlantic–European region, this study provides a quasi-Lagrangian view on the origin and propagation of onset PVAs−. These anomalies do not develop in-situ but rather propagate into the target region within the blocked regime pattern. Based on their location in the days before blocked regime onset, most onset PVAs− approach their blocked regime location from upstream, i.e. from the west of or within the North Atlantic–European sector, consistent with previous findings that identify the western North Atlantic as a typical genesis region for atmospheric blocks (Croci-Maspoli et al., 2007; Steinfeld and Pfahl, 2019). For EuBL, more than 75 % of onset PVAs− follow the upstream pathway, supporting earlier results linking blocking over Europe to Rossby wave trains from the subtropical western Atlantic (Michel and Rivière, 2011; Drouard et al., 2021).
Retrogression of blocks has received less attention, although early work (Sumner, 1954; Lejenäs and Økland, 1983) already highlighted this behaviour, particularly in spring. GL is the only blocked regime with a consistently more frequent retrogression pathway (58 %) than an upstream one. Previous studies have suggested that processes on the western flank of a block can lead to westward expansion or displacement (Steinfeld and Pfahl, 2019), and that divergent outflow may decelerate the eastward propagation of ridges or blocks (Riemer and Jones, 2014). In agreement with Hauser et al. (2024b), our results suggest that barotropic dynamics primarily contribute to the westward propagation of PVAs−, while moist-process-related divergent outflow may additionally support their westward extension by amplifying anomalies on the western flank prior to blocking onset. When viewed alongside Steinfeld et al. (2020) and Deshmukh et al. (2025), these results suggest that moisture can modulate block retrogression, as dry simulations typically exhibit a more zonal flow and less pronounced westward displacement.
Propagation of blocks has also been studied in the context of weather regime transitions (e.g. Vautard, 1990; Michel and Rivière, 2011; Ferranti et al., 2015). Vautard (1990) linked the propagation and dissipation of blocking highs to regime transitions over the North Atlantic–European region. We find that a single PVA− can contribute to multiple blocked regimes during such transitions, explained by overlapping pathways and formation regions between successive regimes. The AR–GL transition, characterized by northwestward-propagating PVAs− from the central North Atlantic, was already described by Vautard (1990). Using our quasi-Lagrangian PV perspective, we confirm that 92 % of AR–GL transitions involve retrogression of the PVA− from the eastern North Atlantic toward Greenland. Likewise, the upstream propagation of anticyclones associated with EuBL–AR transitions (Büeler et al., 2021) is confirmed in 76 % of cases where onset PVAs− of AR followed the retrogression pathway.
4.2 Role of dry and moist dynamics for onset PVAs−
Using the quasi-Lagrangian PV framework, we reveal that onset PVAs− strongly amplify in the days before the actual blocked regime onset, independent of pathway and blocked regime type. Thereby, the amplitude evolution shows greater similarity across all blocked regimes than between the two pathways: The timing of maximum amplification poses the major disparity with a later amplification of upstream PVAs− and a much earlier amplification of retrograding PVAs−. Anomaly-amplifying divergent PV tendencies (DIVdiv) contribute dominantly to this amplification and we confirm their link to latent heat release in WCBs. Previous climatological studies have highlighted the importance of moist contributions to blocking onset (e.g. Pfahl et al., 2015; Steinfeld and Pfahl, 2019), using a purely Lagrangian perspective based on air-parcel trajectory diagnostics. Baroclinic interaction (LOW) and the general growth in PVA− area are of secondary importance and further strengthen the PVA− amplitude. The role of quasi-barotropic wave dynamics (UP) depends on the pathway and can contribute either to the weakening or strengthening of a PVA−.
A closer look at the DIVdiv-WCB activity link revealed that the contribution of moist processes depends on the location of onset PVAs− relative to the storm-track region – consistent with Steinfeld and Pfahl (2019), who reported stronger latent-heating effects for Atlantic than for continental blocks. Overall, the moist contribution is stronger for the upstream pathway, as these onset PVAs− typically reside within or near the midlatitude storm track where WCB activity is frequent and promotes amplification of onset PVAs−. For the retrogression pathway, moist processes are weaker and more heterogeneous but can still provide an additional aid to the evolution of onset PVAs− when they intersect the storm-track region over the North Atlantic during their westward propagation. This occurs, for example, by contributing locally to their westward extension. Our results also align with Steinfeld and Pfahl (2019) regarding the timing of moist amplification. They showed that extending backward trajectories from 3 to 7 d substantially increases the share of heated trajectories, indicating that moist processes can act well before blocking onset. This timing dependence is consistent with our finding that moist amplification occurs earlier for retrogressing onset PVAs−, whereas upstream PVAs− intensify closer to the onset. Extending the analysis period therefore captures the moisture contribution of all PVAs−, including those that experienced earlier, weaker amplification phases.
Using an anomaly-centred perspective, a clearer picture emerged on the life cycle dynamics of onset PVAs− for different blocked regimes and pathways. DIVdiv still dominates the amplification, but the contribution of UP is more distinct and consistently acts to strengthen the PVA−, in comparison to the onset-centred perspective. This indicates that the relative importance of UP is highly sensitive to the choice of reference time, i.e. whether it is aligned with the onset of the blocked regime or with the maximum amplitude of PVAs−. Comparing the evolution of onset PVAs− to the amplitude evolution of negative PV anomalies linked to ridges as part of RWPs (Teubler and Riemer, 2016, 2021) suggests that the underlying tendency patterns are similar: Onset PVAs− grow by downstream development (UP), followed by enhanced LOW tendencies, and, in particular, DIVdiv. This sequence is consistent with what has been termed downstream moist-baroclinic development (Orlanski and Sheldon, 1995; Teubler and Riemer, 2021).
The fact that the maximum amplitude of onset PVAs− does not coincide with the blocked regime onset suggests that the transition into a blocked regime is less directly linked to the in-situ amplification of individual anomalies, and more consistent with a reorganization of pre-existing PVAs− into the large-scale blocked pattern. This interpretation is rooted in the definition of blocking used here within a weather-regime framework. While specific blocking indices often emphasize the intensity of a block (e.g. Schwierz et al., 2004; Pinheiro et al., 2019), the weather regime perspective primarily focuses on the similarity of the large-scale flow pattern, with a secondary emphasis on amplitude. This allows for more transience, such that the onset of a blocked regime does not necessarily coincide with a peak in PVA− intensity. Moreover, the PVAs− contributing to the onset of a blocked regime are not always identical to those dominating at the regime maximum (cf. Hauser et al., 2024b, their Fig. 9a), highlighting the role of transient eddy contribution in shaping the blocking structure (Suitters et al., 2023). Together, these results suggest that the transition to a blocked regime is associated with a structural reorganisation of the flow rather than sustained local growth of a single PV anomaly.
4.3 Comparison with Eulerian perspective on blocked regime dynamics
Teubler et al. (2023) analysed the same types of blocked regimes during the same time period as in the current study from an Eulerian PV perspective. In that study, very similar PV tendency terms were projected onto the regime patterns to assess the relative importance of different processes in building the regime pattern. In contrast to our focus on the negative PV anomaly, the results published in Teubler et al. (2023) pertain to the full regime pattern, including the area of the patterns' positive PV anomaly. When computing the projections only for the region of the positive and negative PV anomaly, respectively, the results look very similar on average, as documented for a single case in Hauser et al. (2023).
For all blocked regime life types, Teubler et al. (2023) found that linear quasi-barotropic dynamics and non-linear eddy flux convergence dominate regime development, while baroclinic and divergent PV tendencies contribute only marginally. That study also identified two clusters resembling the pathways found here. In comparison, our results suggest that divergent PV tendencies can appear more pronounced when diagnosed from the perspective of PV anomaly evolution, consistently across all pathways and blocked regime types.
Building on Hauser et al. (2023), who reconciled results from Eulerian, Lagrangian, and quasi-Lagrangian perspectives for a single case study, we here generalize these findings across the onset phases of multiple blocked-regime types in the North Atlantic–European region and reconcile conclusions from previous Eulerian- and Lagrangian-based studies on blocking dynamics. The Eulerian perspective emphasizes the reorganisation of anomalies within the regime mask, rather than their initial amplification, highlighting a key distinction from the quasi-Lagrangian approach. Onset PVAs− mostly amplify in the days before blocked regime onset, when they are located outside of the regime mask. Hence, their moist-dynamical contributions occurs remotely and the Eulerian perspective largely misses this formation and amplification stage. Instead, it captures the propagation of onset PVAs− into the regime mask as a form of anomaly reorganization within the dominant barotropic PV tendency term. Thus, the Eulerian signature of anomaly reorganisation is reconciled with the quasi-Lagrangian evidence of remote, moist-driven PVA− amplification.
4.4 Relevance, limitations and future work
In conclusion, our quasi-Lagrangian PV analysis revealed two distinct PVA− onset pathways to blocked regimes, showing that pathway-dependent dynamics exceed differences between regime types, and underscoring the importance of moist processes in their amplification. These results reconcile previous inconsistencies regarding the roles of dry and moist processes, showing that both are essential but act at different stages and locations. By linking remote moist amplification of PVAs− with local, dry barotropic pattern formation, we gain a more unified understanding of how different blocked regimes and pathways emerge. The analyses using the quasi-Lagrangian PV framework also highlight the importance of capturing dry and moist processes in models, especially the interactions across scales and the role of moist-baroclinic eddies, to improve the prediction and conceptual understanding of blocked regimes. Notably, these findings directly address multiple key challenges and knowledge gaps in understanding the physical processes linked to atmospheric blocking, which were recently identified in the perspective review by Wang et al. (2026).
While the quasi-Lagrangian PV approach provides novel insights into the evolution and amplification of PVAs− linked to blocked regime onsets, several limitations remain. The sample size of blocked regime life cycles becomes limited when separating blocked regime types and pathways, which may affect the robustness of detailed, pathway-specific conclusions and further stratification, e.g. to examine seasonal variability. Our diagnostic tracks only negative PV anomalies, whereas the Eulerian framework considers both positive and negative anomalies in a joint framework, making it difficult to compare in more detail the quasi-Lagrangian insights with the full-pattern Eulerian results. Finally, the study focuses on (pre-)onset dynamics and does not address the full blocked regime life cycle or the factors determining regime duration, which is important for understanding how initial anomaly development translates into the persistence and decay of blocked regimes.
Our findings highlight distinct contributions of moist- and dry-related processes, while also reflecting that their separation is not always clear for individual terms, for example for divergent PV tendencies, as discussed above. However, beyond the attribution of individual processes, a key open question remains regarding the transition into blocked regimes. In particular, why only some diabatically enhanced, slowly propagating PVAs−–whose amplification closely resembles ridge growth in RWPs and largely samples the climatological distribution of WCB activity – ultimately develop into blocked regimes is not yet understood. Recent work by Vishnupriya et al. (2025) finds little evidence that these PVAs− have systematically distinct moist characteristics, suggesting that the key question is not the moist processes themselves, but the conditions under which remotely amplified anomalies develop into a block. Thus, the central challenge for future research is to understand the coupling between remote moist-dynamical amplification and local dry anomaly rearrangement, and what factors determine whether this coupling leads to blocking.
The data are referenced in Sect. 2. ERA5 data are available from the Copernicus Climate Change Service (C3S) Climate Data Store at https://doi.org/10.24381/cds.143582cf (Hersbach et al., 2017). The dataset of tracked negative, upper-tropospheric PV anomalies for the time period 1979–2021 for the full Northern Hemisphere can be retrieved at https://doi.org/10.35097/nncxPGLAaaDgVKIW (see Hauser et al., 2024a). The warm conveyor belt footprints dataset based on ERA5 reanalysis fields by Quinting et al. (2022) are freely available at https://gitlab.kit.edu/julian.quinting/elias-2.0. (last access: 15 January 2026) The weather regime data are documented in Grams (2026) and available via Grams et al. (2025) at Zenodo at https://doi.org/10.5281/zenodo.17080146. The codes and data from this study can be provided by the authors upon request.
The analyses for this study were performed by SH, who also prepared the first draft of the manuscript. FT provided the piecewise PV tendencies, and CMG contributed the year-round North Atlantic–European weather regime data based on ERA5. All co-authors provided guidance throughout the project and offered feedback on the manuscript.
At least one of the (co-)authors is a member of the editorial board of Weather and Climate Dynamics. The peer-review process was guided by an independent editor, and the authors also have no other competing interests to declare.
Publisher's note: Copernicus Publications remains neutral with regard to jurisdictional claims made in the text, published maps, institutional affiliations, or any other geographical representation in this paper. The authors bear the ultimate responsibility for providing appropriate place names. Views expressed in the text are those of the authors and do not necessarily reflect the views of the publisher.
The research leading to these results has been done within the sub-project “Dynamics and predictability of blocked regimes in the Atlantic–European region (A8)” of the Transregional Collaborative Research Center SFB / TRR 165 “Waves to Weather” (http://www.wavestoweather.de, last access: 4 June 2026). The authors would like to thank the members of the “Large-Scale Dynamics and Predictability” research group at KIT for valuable discussions on this project. They also express their gratitude to the handling editor and the three anonymous referees for their time, guidance, and thoughtful suggestions that helped to improve the quality of the manuscript.
This research has been supported by the Deutsche Forschungsgemeinschaft (grant no. SFB/TRR 165 “Waves to Weather”) and the Schweizerischer Nationalfonds zur Förderung der Wissenschaftlichen Forschung (grant no. 228019). The contribution of Christian M. Grams is funded by the Helmholtz Association as part of the Young Investigator Group “Sub-seasonal Predictability: Understanding the Role of Diabatic Outflow” (SPREADOUT, grant VH-NG-1243).
The article processing charges for this open-access publication were covered by the Karlsruhe Institute of Technology (KIT).
This paper was edited by Juliane Schwendike and reviewed by three anonymous referees.
Austin, J. F.: The blocking of middle latitude westerly winds by planetary waves, Q. J. Roy. Meteor. Soc., 106, 327–350, https://doi.org/10.1002/qj.49710644807, 1980. a
Büeler, D., Ferranti, L., Magnusson, L., Quinting, J. F., and Grams, C. M.: Year-round sub-seasonal forecast skill for Atlantic–European weather regimes, Q. J. Roy. Meteor. Soc., 147, 4283–4309, https://doi.org/10.1002/qj.4178, 2021. a, b, c, d
Chagnon, J. M., Gray, S. L., and Methven, J.: Diabatic processes modifying potential vorticity in a North Atlantic cyclone, Q. J. Roy. Meteor. Soc., 139, 1270–1282, https://doi.org/10.1002/qj.2037, 2013. a
Croci-Maspoli, M., Schwierz, C., and Davies, H. C.: A multifaceted climatology of atmospheric blocking and its recent linear trend, J. Climate, 20, 633–649, https://doi.org/10.1175/JCLI4029.1, 2007. a
Davini, P. and D'Andrea, F.: Northern Hemisphere atmospheric blocking representation in global climate models: twenty years of improvements?, J. Climate, 29, 8823–8840, https://doi.org/10.1175/JCLI-D-16-0242.1, 2016. a, b
Davis, C. A.: Piecewise potential vorticity inversion, J. Atmos. Sci., 49, 1397–1411, https://doi.org/10.1175/1520-0469(1992)049<1397:PPVI>2.0.CO;2, 1992. a
Davis, C. A. and Emanuel, K. A.: Potential vorticity diagnostics of cyclogenesis, Mon. Weather Rev., 119, 1929–1953, https://doi.org/10.1175/1520-0493(1991)119<1929:PVDOC>2.0.CO;2, 1991. a
Dee, D. P., Uppala, S. M., Simmons, A. J., Berrisford, P., Poli, P., Kobayashi, S., Andrae, U., Balmaseda, M. A., Balsamo, G., Bauer, P., Bechtold, P., Beljaars, A. C. M., van de Berg, L., Bidlot, J., Bormann, N., Delsol, C., Dragani, R., Fuentes, M., Geer, A. J., Haimberger, L., Healy, S. B., Hersbach, H., Hólm, E. V., Isaksen, L., Kållberg, P., Köhler, M., Matricardi, M., McNally, A. P., Monge-Sanz, B. M., Morcrette, J.-J., Park, B.-K., Peubey, C., de Rosnay, P., Tavolato, C., Thépaut, J.-N., and Vitart, F.: The ERA-interim reanalysis: configuration and performance of the data assimilation system, Q. J. Roy. Meteor. Soc., 137, 553–597, https://doi.org/10.1002/qj.828, 2011. a
Deshmukh, V., Rivière, G., Fromang, S., and Saint-Lu, M.: How does a dry general circulation model represent atmospheric blocking?, J. Atmos. Sci., 82, 283–300, https://doi.org/10.1175/JAS-D-24-0048.1, 2025. a, b
Dolores-Tesillos, E., Martius, O., and Quinting, J.: On the role of moist and dry processes in atmospheric blocking biases in the Euro-Atlantic region in CMIP6, Weather Clim. Dynam., 6, 471–487, https://doi.org/10.5194/wcd-6-471-2025, 2025. a
Drouard, M. and Woollings, T.: Contrasting mechanisms of summer blocking over western Eurasia, Geophys. Res. Lett., 45, 12,040–12,048, https://doi.org/10.1029/2018GL079894, 2018. a
Drouard, M., Woollings, T., Sexton, D. M. H., and McSweeney, C. F.: Dynamical differences between short and long blocks in the Northern Hemisphere, J. Geophys. Res.-Atmos., 126, e2020JD034082, https://doi.org/10.1029/2020JD034082, 2021. a, b, c
Duchon, C. E.: Lanczos filtering in one and two dimensions, J. Appl. Meteorol., 18, 1016–1022, https://doi.org/10.1175/1520-0450(1979)018<1016:LFIOAT>2.0.CO;2, 1979. a
Ertel, H.: Ein neuer hydrodynamischer Erhaltungssatz, Naturwissenschaften, 30, 543–544, https://doi.org/10.1007/BF01475602, 1942. a
Faranda, D., Masato, G., Moloney, N., Sato, Y., Daviaud, F., Dubrulle, B., and Yiou, P.: The switching between zonal and blocked mid-latitude atmospheric circulation: a dynamical system perspective, Clim. Dynam., 47, 1587–1599, https://doi.org/10.1007/s00382-015-2921-6, 2016. a
Feldstein, S. B.: Fundamental mechanisms of the growth and decay of the PNA teleconnection pattern, Q. J. Roy. Meteor. Soc., 128, 775–796, https://doi.org/10.1256/0035900021643683, 2002. a
Ferranti, L., Corti, S., and Janousek, M.: Flow-dependent verification of the ECMWF ensemble over the Euro-Atlantic sector, Q. J. Roy. Meteor. Soc., 141, 916–924, https://doi.org/10.1002/qj.2411, 2015. a, b
Grams, C. M.: A life cycle definition of year-round weather regimes in the North Atlantic European region, EGUsphere [preprint], https://doi.org/10.5194/egusphere-2025-6385, 2026. a, b, c
Grams, C. M., Wernli, H., Böttcher, M., Čampa, J., Corsmeier, U., Jones, S. C., Keller, J. H., Lenz, C.-J., and Wiegand, L.: The key role of diabatic processes in modifying the upper-tropospheric wave guide: a North Atlantic case-study, Q. J. Roy. Meteor. Soc., 137, 2174–2193, https://doi.org/10.1002/qj.891, 2011. a
Grams, C. M., Beerli, R., Pfenninger, S., Staffell, I., and Wernli, H.: Balancing Europe's wind power output through spatial deployment informed by weather regimes, Nat. Clim. Change, 7, 557–562, https://doi.org/10.1038/nclimate3338, 2017. a, b, c, d, e, f
Grams, C. M., Hauser, S., and Büeler, D.: Year-round North Atlantic-European Weather Regimes in ERA5 reanalyses, Zenodo [code], https://doi.org/10.5281/zenodo.17080146, 2025. a
Grose, W. L. and Hoskins, B. J.: On the influence of orography on large-scale atmospheric flow, J. Atmos. Sci., 36, 223–234, https://doi.org/10.1175/1520-0469(1979)036<0223:OTIOOO>2.0.CO;2, 1979. a
Hauser, S., Teubler, F., Riemer, M., Knippertz, P., and Grams, C. M.: Towards a holistic understanding of blocked regime dynamics through a combination of complementary diagnostic perspectives, Weather Clim. Dynam., 4, 399–425, https://doi.org/10.5194/wcd-4-399-2023, 2023. a, b, c, d, e, f, g, h, i, j
Hauser, S., Teubler, F., Riemer, M., Knippertz, P., and Grams, C. M.: Tracks of negative upper-tropospheric PV anomalies (PVAs−) over the Northern Hemisphere in ERA5 reanalysis (1979-2021), KITopen [data set], https://doi.org/10.35097/nncxPGLAaaDgVKIW, 2024a. a, b
Hauser, S., Teubler, F., Riemer, M., Knippertz, P., and Grams, C. M.: Life cycle dynamics of Greenland blocking from a potential vorticity perspective, Weather Clim. Dynam., 5, 633–658, https://doi.org/10.5194/wcd-5-633-2024, 2024b. a, b, c, d, e, f, g, h, i, j, k, l, m, n, o, p, q, r, s
Heitmann, K., Sprenger, M., Binder, H., Wernli, H., and Joos, H.: Warm conveyor belt characteristics and impacts along the life cycle of extratropical cyclones: case studies and climatological analysis based on ERA5, Weather Clim. Dynam., 5, 537–557, https://doi.org/10.5194/wcd-5-537-2024, 2024. a
Henderson, S. A., Maloney, E. D., and Barnes, E. A.: The influence of the Madden-Julian oscillation on Northern Hemisphere winter blocking, J. Climate, 29, 4597–4616, https://doi.org/10.1175/JCLI-D-15-0502.1, 2016. a
Hersbach, H., Bell, B., Berrisford, P., Hirahara, S., Horányi, A., Muñoz‐Sabater, J., Nicolas, J., Peubey, C., Radu, R., Schepers, D., Simmons, A., Soci, C., Abdalla, S., Abellan, X., Balsamo, G., Bechtold, P., Biavati, G., Bidlot, J., Bonavita, M., De Chiara, G., Dahlgren, P., Dee, D., Diamantakis, M., Dragani, R., Flemming, J., Forbes, R., Fuentes, M., Geer, A., Haimberger, L., Healy, S., Hogan, R.J., Hólm, E., Janisková, M., Keeley, S., Laloyaux, P., Lopez, P., Lupu, C., Radnoti, G., de Rosnay, P., Rozum, I., Vamborg, F., Villaume, S., and Thépaut, J.-N.: Complete ERA5 from 1940: Fifth generation of ECMWF atmospheric reanalyses of the global climate, Copernicus Climate Change Service (C3S) Data Store (CDS) [data set], https://doi.org/10.24381/cds.143582cf, 2017. a
Hersbach, H., Bell, B., Berrisford, P., Hirahara, S., Horányi, A., Muñoz-Sabater, J., Nicolas, J., Peubey, C., Radu, R., Schepers, D., Simmons, A., Soci, C., Abdalla, S., Abellan, X., Balsamo, G., Bechtold, P., Biavati, G., Bidlot, J., Bonavita, M., De Chiara, G., Dahlgren, P., Dee, D., Diamantakis, M., Dragani, R., Flemming, J., Forbes, R., Fuentes, M., Geer, A., Haimberger, L., Healy, S., Hogan, R. J., Hólm, E., Janisková, M., Keeley, S., Laloyaux, P., Lopez, P., Lupu, C., Radnoti, G., de Rosnay, P., Rozum, I., Vamborg, F., Villaume, S., and Thépaut, J.-N.: The ERA5 global reanalysis, Q. J. Roy. Meteor. Soc., 146, 1999–2049, https://doi.org/10.1002/qj.3803, 2020. a
Hochman, A., Messori, G., Quinting, J. F., Pinto, J. G., and Grams, C. M.: Do Atlantic-European weather regimes physically exist?, Geophys. Res. Lett., 48, e2021GL095574, https://doi.org/10.1029/2021GL095574, 2021. a
Hoskins, B. J., McIntyre, M. E., and Robertson, A. W.: On the use and significance of isentropic potential vorticity maps, Q. J. Roy. Meteor. Soc., 111, 877–946, https://doi.org/10.1002/qj.49711147002, 1985. a, b
Kautz, L.-A., Martius, O., Pfahl, S., Pinto, J. G., Ramos, A. M., Sousa, P. M., and Woollings, T.: Atmospheric blocking and weather extremes over the Euro-Atlantic sector – a review, Weather Clim. Dynam., 3, 305–336, https://doi.org/10.5194/wcd-3-305-2022, 2022. a
Lejenäs, H. and Økland, H.: Characteristics of northern hemisphere blocking as determined from a long time series of observational data, Tellus A, 35, 350, https://doi.org/10.3402/tellusa.v35i5.11446, 1983. a
Liu, Z. and Wang, L.: Blocking diversity causes distinct roles of diabatic heating in the Northern Hemisphere, Nat. Commun., 16, 5613, https://doi.org/10.1038/s41467-025-60811-4, 2025. a
Lubis, S. W., Harrop, B. E., Lu, J., Leung, L. R., Chen, Z., Huang, C. S. Y., and Omrani, N.-E.: Cloud radiative effects significantly increase wintertime atmospheric blocking in the Euro-Atlantic sector, Nat. Commun., 16, 9763, https://doi.org/10.1038/s41467-025-64672-9, 2025. a
Luo, D., Cha, J., Zhong, L., and Dai, A.: A nonlinear multiscale interaction model for atmospheric blocking: the eddy-blocking matching mechanism, Q. J. Roy. Meteor. Soc., 140, 1785–1808, https://doi.org/10.1002/qj.2337, 2014. a
Maddison, J. W., Catto, J. L., Hanna, E., Luu, L. N., and Screen, J. A.: Missing increase in summer Greenland blocking in climate models, Geophys. Res. Lett., 51, e2024GL108505, https://doi.org/10.1029/2024GL108505, 2024. a
Madonna, E., Wernli, H., Joos, H., and Martius, O.: Warm conveyor belts in the ERA-interim dataset (1979–2010). Part I: Climatology and potential vorticity evolution, J. Climate, 27, 3–26, https://doi.org/10.1175/JCLI-D-12-00720.1, 2014. a, b, c, d
Martineau, P., Nakamura, H., Yamamoto, A., and Kosaka, Y.: Baroclinic blocking, Geophys. Res. Lett., 49, e2022GL097791, https://doi.org/10.1029/2022GL097791, 2022. a
Michel, C. and Rivière, G.: The link between rossby wave breakings and weather regime transitions, J. Atmos. Sci., 68, 1730–1748, https://doi.org/10.1175/2011JAS3635.1, 2011. a, b, c, d
Michelangeli, P.-A., Vautard, R., and Legras, B.: Weather regimes: recurrence and quasi stationarity, J. Atmos. Sci., 52, 1237–1256, https://doi.org/10.1175/1520-0469(1995)052<1237:WRRAQS>2.0.CO;2, 1995. a
Miller, D. E. and Wang, Z.: Northern Hemisphere winter blocking: differing onset mechanisms across regions, J. Atmos. Sci., 79, 1291–1309, https://doi.org/10.1175/JAS-D-21-0104.1, 2022. a
Moncrieff, M. W., Waliser, D. E., and Caughey, J.: Progress and direction in tropical convection research: YOTC International Science Symposium, B. Am. Meteorol. Soc., 93, ES65–ES69, https://doi.org/10.1175/BAMS-D-11-00253.1, 2012. a
Nakamura, H. and Wallace, J. M.: Observed changes in baroclinic wave activity during the life cycles of low-frequency circulation anomalies, J. Atmos. Sci., 47, 1100–1116, https://doi.org/10.1175/1520-0469(1990)047<1100:OCIBWA>2.0.CO;2, 1990. a
Nakamura, H. and Wallace, J. M.: Synoptic behavior of baroclinic eddies during the blocking onset, Mon. Weather Rev., 121, 1892–1903, https://doi.org/10.1175/1520-0493(1993)121<1892:SBOBED>2.0.CO;2, 1993. a
Nakamura, N. and Huang, C. S.: Atmospheric blocking as a traffic jam in the jet stream, Science, 361, 42–47, https://doi.org/10.1126/science.aat0721, 2018. a
Orlanski, I. and Sheldon, J. P.: Stages in the energetics of baroclinic systems, Tellus, 47, 605–628, https://doi.org/10.1034/j.1600-0870.1995.00108.x, 1995. a
Osman, M., Beerli, R., Büeler, D., and Grams, C. M.: Multi-model assessment of sub-seasonal predictive skill for year-round Atlantic–European weather regimes, Q. J. Roy. Meteor. Soc., 149, 2386–2408, https://doi.org/10.1002/qj.4512, 2023. a, b
Petoukhov, V., Rahmstorf, S., Petri, S., and Schellnhuber, H. J.: Quasiresonant amplification of planetary waves and recent Northern Hemisphere weather extremes, P. Natl. Acad. Sci. USA, 110, 5336–5341, https://doi.org/10.1073/pnas.1222000110, 2013. a
Pfahl, S., Schwierz, C., Croci-Maspoli, M., Grams, C. M., and Wernli, H.: Importance of latent heat release in ascending air streams for atmospheric blocking, Nat. Geosci., 8, 610–614, https://doi.org/10.1038/ngeo2487, 2015. a, b, c, d
Pinheiro, M. C., Ullrich, P. A., and Grotjahn, R.: Atmospheric blocking and intercomparison of objective detection methods: flow field characteristics, Clim. Dynam., 53, 4189–4216, https://doi.org/10.1007/s00382-019-04782-5, 2019. a
Polster, C. and Wirth, V.: The onset of a blocking event as a “traffic jam”: characterization with ensemble sensitivity analysis, J. Atmos. Sci., 80, 1681–1699, https://doi.org/10.1175/JAS-D-21-0312.1, 2023. a
Quinting, J. F. and Grams, C. M.: Toward a systematic evaluation of warm conveyor belts in numerical weather prediction and climate models. Part I: Predictor selection and logistic regression model, J. Atmos. Sci., 78, 1465–1485, https://doi.org/10.1175/JAS-D-20-0139.1, 2021. a
Quinting, J. F. and Grams, C. M.: EuLerian Identification of ascending AirStreams (ELIAS 2.0) in numerical weather prediction and climate models – Part 1: Development of deep learning model, Geosci. Model Dev., 15, 715–730, https://doi.org/10.5194/gmd-15-715-2022, 2022. a
Quinting, J. F. and Vitart, F.: Representation of synoptic-scale Rossby wave packets and blocking in the S2S prediction project database, Geophys. Res. Lett., 46, 1070–1078, https://doi.org/10.1029/2018GL081381, 2019. a, b
Quinting, J. F., Grams, C. M., Oertel, A., and Pickl, M.: EuLerian Identification of ascending AirStreams (ELIAS 2.0) in numerical weather prediction and climate models – Part 2: Model application to different datasets, Geosci. Model Dev., 15, 731–744, https://doi.org/10.5194/gmd-15-731-2022, 2022. a
Rex, D. F.: Blocking action in the middle troposphere and its effect upon regional climate, Tellus, 2, 196–211, https://doi.org/10.1111/j.2153-3490.1950.tb00331.x, 1950. a
Riemer, M. and Jones, S. C.: Interaction of a tropical cyclone with a high amplitude, midlatitude wave pattern: waviness analysis, trough deformation and track bifurcation, Q. J. Roy. Meteor. Soc., 140, 1362–1376, https://doi.org/10.1002/qj.2221, 2014. a
Riemer, M., Baumgart, M., and Eiermann, S.: Cyclogenesis downstream of extratropical transition analyzed by Q-vector partitioning based on flow geometry, J. Atmos. Sci., 71, 4204–4220, https://doi.org/10.1175/JAS-D-14-0023.1, 2014. a
Röthlisberger, M., Martius, O., and Wernli, H.: Northern Hemisphere Rossby wave initiation events on the extratropical jet–a climatological analysis, J. Climate, 31, 743–760, https://doi.org/10.1175/JCLI-D-17-0346.1, 2018. a
Schwierz, C., Croci-Maspoli, M., and Davies, H. C.: Perspicacious indicators of atmospheric blocking, Geophys. Res. Lett., 31, https://doi.org/10.1029/2003GL019341, 2004. a, b
Shutts, G. J.: The propagation of eddies in diffluent jetstreams: eddy vorticity forcing of `blocking' flow fields, Q. J. Roy. Meteor. Soc., 109, 737–761, https://doi.org/10.1002/qj.49710946204, 1983. a
Steinfeld, D. and Pfahl, S.: The role of latent heating in atmospheric blocking dynamics: a global climatology, Clim. Dynam., 53, 6159–6180, https://doi.org/10.1007/s00382-019-04919-6, 2019. a, b, c, d, e, f, g, h
Steinfeld, D., Boettcher, M., Forbes, R., and Pfahl, S.: The sensitivity of atmospheric blocking to upstream latent heating – numerical experiments, Weather Clim. Dynam., 1, 405–426, https://doi.org/10.5194/wcd-1-405-2020, 2020. a, b
Suitters, C. C., Martínez-Alvarado, O., Hodges, K. I., Schiemann, R. K. H., and Ackerley, D.: Transient anticyclonic eddies and their relationship to atmospheric block persistence, Weather Clim. Dynam., 4, 683–700, https://doi.org/10.5194/wcd-4-683-2023, 2023. a, b
Sumner, E. J.: A study of blocking in the Atlantic-European of the northern hemisphere, Q. J. Roy. Meteor. Soc., 80, 402–416, https://doi.org/10.1002/qj.49708034510, 1954. a
Teubler, F. and Riemer, M.: Dynamics of Rossby wave packets in a quantitative potential vorticity–potential temperature framework, J. Atmos. Sci., 73, 1063–1081, https://doi.org/10.1175/JAS-D-15-0162.1, 2016. a, b, c, d, e
Teubler, F. and Riemer, M.: Potential-vorticity dynamics of troughs and ridges within Rossby wave packets during a 40-year reanalysis period, Weather Clim. Dynam., 2, 535–559, https://doi.org/10.5194/wcd-2-535-2021, 2021. a, b, c, d, e, f, g
Teubler, F., Riemer, M., Polster, C., Grams, C. M., Hauser, S., and Wirth, V.: Similarity and variability of blocked weather-regime dynamics in the Atlantic–European region, Weather Clim. Dynam., 4, 265–285, https://doi.org/10.5194/wcd-4-265-2023, 2023. a, b, c, d, e, f, g, h, i, j
Vautard, R.: Multiple weather regimes over the North Atlantic: analysis of precursors and successors, Mon. Weather Rev., 118, 2056–2081, https://doi.org/10.1175/1520-0493(1990)118<2056:MWROTN>2.0.CO;2, 1990. a, b, c, d
Vishnupriya, S., Sprenger, M., Joos, H., and Wernli, H.: The interaction of warm conveyor belt outflows with the upper-level waveguide: a four-type climatological classification, Weather Clim. Dynam., 6, 1195–1219, https://doi.org/10.5194/wcd-6-1195-2025, 2025. a
Wandel, J., Büeler, D., Knippertz, P., Quinting, J. F., and Grams, C. M.: Why moist dynamic processes matter for the sub-seasonal prediction of atmospheric blocking over Europe, J. Geophys. Res.-Atmos., 129, e2023JD039791, https://doi.org/10.1029/2023JD039791, 2024. a, b
Wang, L., Lu, J., Breeden, M. L., Chen, G., Henderson, S. A., Narinesingh, V., Simpson, I. R., Woollings, T., Hu, Y., and Lubis, S. W.: Gaps and ways forward in atmospheric blocking and extreme weather research, Nat. Commun., 17, 2873, https://doi.org/10.1038/s41467-026-70487-z, 2026. a
Wernli, H.: A Lagrangian-based analysis of extratropical cyclones. II: A detailed case-study, Q. J. Roy. Meteor. Soc., 123, 1677–1706, https://doi.org/10.1002/qj.49712354211, 1997. a
Wirth, V., Riemer, M., Chang, E. K., and Martius, O.: Rossby wave packets on the midlatitude waveguide-a review, Mon. Weather Rev., 146, 1965–2001, https://doi.org/10.1175/MWR-D-16-0483.1, 2018. a
Woollings, T., Barriopedro, D., Methven, J., Son, S. W., Martius, O., Harvey, B., Sillmann, J., Lupo, A. R., and Seneviratne, S.: Blocking and its response to climate change, Current Climate Change Reports, 4, 287–300, https://doi.org/10.1007/s40641-018-0108-z, 2018. a
Yamazaki, A. and Itoh, H.: Selective absorption mechanism for the maintenance of blocking, Geophys. Res. Lett., 36, 4–7, https://doi.org/10.1029/2008GL036770, 2009. a