the Creative Commons Attribution 4.0 License.
the Creative Commons Attribution 4.0 License.
 | 29 Sep 2020
A Lagrangian analysis of the dynamical and thermodynamic drivers of large-scale Greenland melt events during 1979–2017
Mauro Hermann
Lukas Papritz
Heini Wernli
In this study, we systematically investigate the dynamical and thermodynamic processes that lead to 77 large-scale melt events affecting high-elevation regions of the Greenland Ice Sheet (GrIS) in June–August (JJA) 1979–2017. For that purpose, we compute 8 d kinematic backward trajectories from the lowermost ∼500 m above the GrIS during these events. The key synoptic feature accompanying the melt events is an upper-tropospheric ridge southeast of the GrIS associated with a surface high-pressure system. This circulation pattern is favorable to induce rapid poleward transport (up to 40∘ latitude) of warm (∼15 K warmer than climatological air masses arriving on the GrIS) and moist air masses from the lower troposphere to the western GrIS and subsequently to distribute them in the anticyclonic flow over north and east Greenland. During transport to the GrIS, the melt event air masses cool by ∼15 K due to ascent and radiation, which keeps them just above the critical threshold to induce melting. The thermodynamic analyses reveal that the final warm anomaly of the air masses is primarily owed to anomalous horizontal transport from a climatologically warm region of origin. However, before being transported to the GrIS, i.e., in their region of origin, these air masses were not anomalously warm. Latent heating from condensation of water vapor, occurring as the airstreams are forced to ascend orographically or dynamically, is of secondary importance. These characteristics were particularly pronounced during the most extensive melt event in early July 2012, where, importantly, the warm anomaly was not preserved from anomalously warm source regions such as North America experiencing a record heat wave. The mechanisms identified here are in contrast to melt events in the low-elevation high Arctic and to midlatitude heat waves, where adiabatic warming by large-scale subsidence is essential. Considering the impact of moisture on the surface energy balance, we find that radiative effects are closely linked to the air mass trajectories and enhance melt over the entire GrIS accumulation zone due to (i) enhanced downward longwave radiation related to poleward moisture transport and a shift in the cloud phase from ice to liquid primarily west of the ice divide and (ii) increased shortwave radiation in clear-sky regions east of the ice divide. Given the ongoing increase in the frequency and the melt extent of large-scale melt events, the understanding of upper-tropospheric ridges over the North Atlantic, i.e., also Greenland blocking, and its representation in climate models is crucial in determining future GrIS accumulation zone melt and thus global sea level rise.
Please read the corrigendum first before continuing.
-
Notice on corrigendum
The requested paper has a corresponding corrigendum published. Please read the corrigendum first before downloading the article.
-
Article
(16370 KB)
- Corrigendum
-
Supplement
(4548 KB)
-
The requested paper has a corresponding corrigendum published. Please read the corrigendum first before downloading the article.
- Article
(16370 KB) - Full-text XML
- Corrigendum
-
Supplement
(4548 KB) - BibTeX
- EndNote


The Greenland Ice Sheet (GrIS) is the world’s second largest ice body holding water equivalent to 6–7 m of global sea level rise (Ridley et al., 2005). Its mass loss due to surface melt and ice discharge has increased strongly over the past 120 years and equaled 286±20 Gt yr−1 in 2010–2018 (Kjeldsen et al., 2015; Mouginot et al., 2019). Not only the current magnitude, but also the speedup of mass loss from the GrIS, observed recently and predicted for the future, are primarily driven by a negative surface mass balance (Enderlin et al., 2014; van den Broeke et al., 2016). Surface melt has been increasing in the last decades and appears to be the major regulator of the surface mass balance (Box et al., 2004; Fettweis et al., 2013a; Andersen et al., 2015; van den Broeke et al., 2016). At the same time, snow accumulation has decreased since the early 2000s, due to a reduced frequency of cyclones and increased frequency of anticyclones in the close vicinity of Greenland (Chen et al., 2016). Consequently, both contributors to the surface mass balance have favored a stronger mass loss from the GrIS, with melt as the primary factor.
While GrIS melt is highly sensitive to the atmospheric forcing (Hanna et al., 2005), the oceanic forcing during summer melt events is often weak (e.g., Hanna et al., 2014), and the influence of high sea surface temperatures on the GrIS surface mass balance is generally limited due to the katabatic wind-blocking effect (Noël et al., 2014). Two largely anticorrelated indices based on geopotential height are often used to capture the dominant modes of variability of the large-scale circulation in the North Atlantic: the North Atlantic Oscillation (NAO) index (Hurrell et al., 2013) and the Greenland Blocking Index (GBI; Hanna et al., 2013). While the NAO captures the strength of the westerly flow over the North Atlantic, the GBI characterizes geopotential height anomalies over Greenland with a positive index representative of anticyclonic flow and at times atmospheric blocking. A series of warm summers (June–August, JJA) since the late 1990s were linked to a doubled anticyclone frequency over Greenland compared to the past 50 years (Fettweis et al., 2013b). Such anticyclonic conditions are typical for periods with a negative NAO index and positive GBI (NAO−/GBI+). They are characterized by a northward displaced jet stream over Greenland, which favors anomalous meridional transport. This leads to high temperatures in south and west Greenland but colder conditions and below-average ice loss in Svalbard (Fettweis et al., 2013b; Box et al., 2018).
Radiative heat fluxes are known to contribute substantially to melt over both the GrIS ablation and accumulation zone. While clouds block incident shortwave solar radiation (Hofer et al., 2017), they, together with higher water vapor content, tend to enhance downwelling longwave radiation (e.g., Ohmura, 2001; Van Tricht et al., 2016; Gallagher et al., 2018). The net cloud radiative effect caused by these opposed influences depends on the surface albedo and cloud properties – especially the thickness and cloud water phase (Hofer et al., 2019) – and thus varies in sign and magnitude over the GrIS (Wang et al., 2019; Izeboud et al., 2020). In the low-albedo-ablation zone, where the majority of surface melt occurs, optically thick clouds have a cooling effect and their reduction in the past 20 years coincided with enhanced surface mass loss (Hofer et al., 2017). In contrast, in the high-albedo-accumulation zone, clouds were found to have a warming effect due to downward longwave radiation, which was particularly pronounced in summer 2012 (Bennartz et al., 2013; Miller et al., 2015; Van Tricht et al., 2016). Furthermore, moist–warm conditions and liquid clouds are not only instantaneous drivers of melt, but their effect also accumulates over time to precondition surface melt, on daily (Solomon et al., 2017), seasonal (Park et al., 2015), and annual timescales (Tedesco et al., 2013).
The transport of anomalously warm and humid air masses is a key driver of large-scale melt events over the GrIS. Warm–moist air implies strong nonradiative energy fluxes into the ice, such as in July 2012 (Hanna et al., 2014; Fausto et al., 2016). During that period, the transport of warm air from a concurrent heat wave over North America (Hoerling et al., 2014) to the GrIS was suggested to be directly related to two melt events peaking at 98 % and 79 % melt extent (Neff et al., 2014). Additionally, the involved moisture transport from the western subtropical North Atlantic triggered cloud radiative effects favorable for surface melt in the accumulation zone (Neff et al., 2014; Bonne et al., 2015). Optically thin liquid clouds enhanced downward longwave radiation, still letting shortwave radiation penetrate, and enabled surface melt over the normally dry inland plateau (Bennartz et al., 2013). Additionally, air temperature near the surface directly affects the downwelling longwave radiative fluxes since the bulk of these are emitted in the lowermost kilometer of the atmosphere (Ohmura, 2001). As such large-scale melt events are expected to become more frequent, we will focus on air masses arriving during such periods near the GrIS surface.
Three processes can, in principle, contribute towards the formation of a warm anomaly of airstreams reaching the GrIS (Papritz, 2020), namely the transport of an already warm air mass from a climatologically warmer region towards the GrIS, adiabatic compression during subsidence, and heating by diabatic processes. The latter comprises radiation, latent heat release in clouds, and turbulent surface fluxes (e.g., Holton and Hakim, 2012). In particular, subsidence is known to be an essential contributor to midlatitude heat waves (Bieli et al., 2015; Zschenderlein et al., 2019) and warm anomalies in the high Arctic (Ding et al., 2017; Wernli and Papritz, 2018; Papritz, 2020). Furthermore, turbulent surface fluxes over the ocean are typically limited in summer due to the small surface–atmosphere temperature gradient.
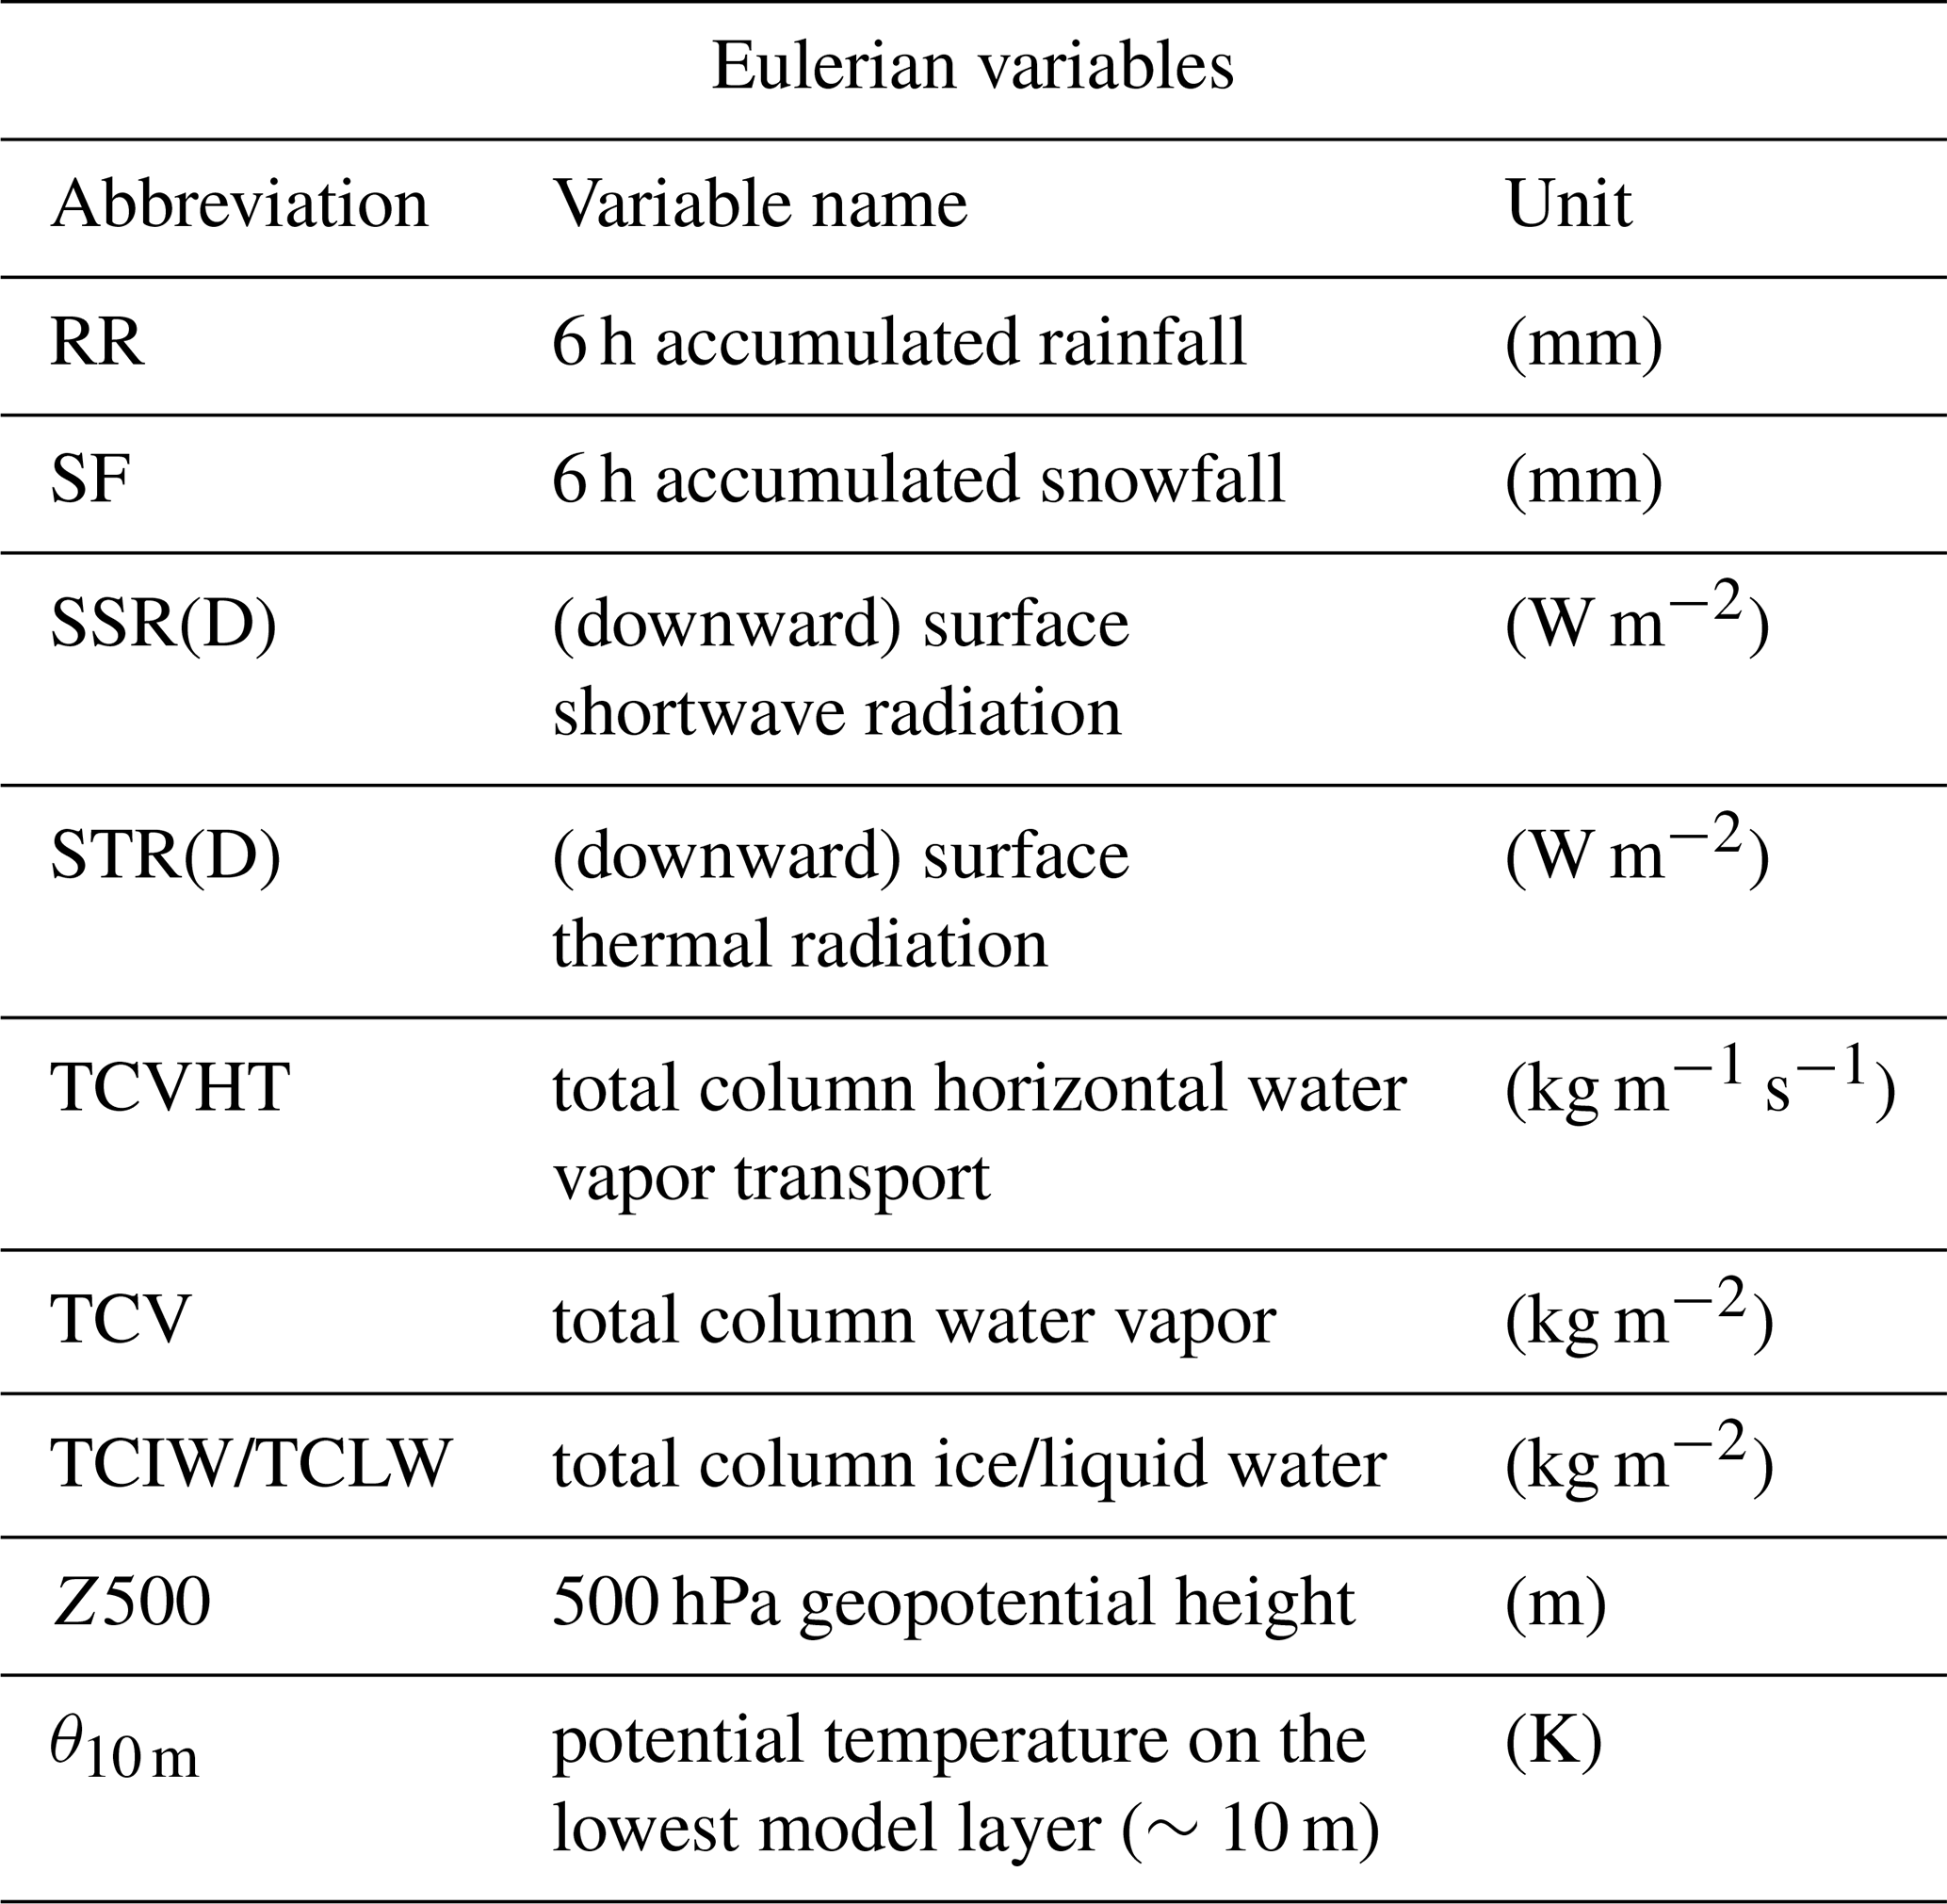
Table 1The ERA-Interim variables used for the evaluation of the synoptic situation over the GrIS (Eulerian variables).
Considering the relevance of the atmospheric circulation for the variability of Greenland’s near-surface climate, the goal of our study is to improve our understanding of the atmospheric dynamical processes leading to melt episodes that cover large parts of the GrIS accumulation zone. This knowledge is important given the strong impact of such exceptional melt events on the surface mass balance and the expected increase in the ice sheet's melt extent, mass loss, and contribution to global sea level rise. Furthermore, it might shed light on climate models struggling to simulate the observed circulation anomalies (e.g., Fettweis et al., 2013a, b). More precisely, this study has two main objectives: First, we want to go beyond case studies and investigate large-scale melt events systematically in the period of 1979–2017. Still, the well-studied and most extensive melt event of July 2012 will serve as an excellent example to illustrate our methods and findings. Second, we aim to investigate the history and thermodynamic evolution of air masses associated with large-scale melt events with the aid of Lagrangian backward trajectories. This approach will enable us to answer the following questions:
- Q1.
How often did large-scale melt events occur over the GrIS during 1979–2017?
- Q2.
What are the synoptic flow configuration and the air mass pathways during these melt events?
- Q3.
Which thermodynamic air mass modifications and radiative effects over the GrIS accumulation zone caused these melt events?
- Q4.
Does the answer to Q2 and Q3 differ for subregions of the GrIS accumulation zone?
2.1 ERA-Interim data
This study is based on ERA-Interim reanalysis data from the European Centre for Medium-Range Weather Forecasts (ECMWF; Dee et al., 2011). The data are available every 6 h from 1979 to 2017, on 60 vertical levels and interpolated to a grid with a horizontal grid spacing of 1∘. The reanalysis data serve as a best estimate of the past atmospheric state on the synoptic scale, which is why we implicitly refer to it as the actual state of the atmosphere. As climatologies of the variables used for Eulerian analyses (Table 1), we compute 10 d averages of the 6-hourly data centered on the respective calendar day over the entire period 1979–2017. Note that for radiation, we use fields with the same time of day only to account for the daily cycle. We use the ice outline after Zwally et al. (2012) to separate ice from land grid cells in Greenland. Only grid cells with a center inside the ice outline are classified as ice grid cells, which leads to a GrIS area of 1.73 million square kilometers, which is slightly larger (+0.7 %) than observed (Zwally et al., 2012).
2.2 Melt event definition
As previous studies focused on single large-scale melt events, such as in July 2012 (e.g., Nghiem et al., 2012; Bennartz et al., 2013; Tedesco et al., 2013; Neff et al., 2014; Bonne et al., 2015), there is no generally accepted definition yet of such melt events for climatological studies. We define them as follows. The occurrence of surface melt is approximated by a skin temperature (SKT) greater than or equal to −1 ∘C, as in earlier studies (e.g., Nghiem et al., 2012). A time step is interpreted as part of a melt event if at least 5 % of the total GrIS surface area is melting and located above 2000 m elevation (melt time step), to distinguish melt events from the typical summer melt in the GrIS ablation area. In order to avoid splitting of a – from a dynamical point of view – coherent melt event due to the pronounced diurnal temperature cycle, we include nonmelt time steps when identifying coherent melt events. This is done as follows: intermediate nonmelt and melt time steps are connected in time to yield melt events with the starting (end) date defined as the first (last) time step when melt was detected but not preceded (followed) by melt for more than 24 h. The thresholds of 5 % and 2000 m were chosen with hindsight, such that a reasonable maximum melt event duration of around 2 weeks and a sufficiently large sample size of 77 melt events results. Events shorter than 24 h are neglected. To summarize, we focus on melt events that cover a wide area of the GrIS accumulation zone and hereafter refer to them as “large-scale melt events” or “melt events” for simplicity.
Table 2Average, minimum, and maximum of melt event duration (Dur.), of maximum elevation experiencing surface melt (ME), and of maximum 2 m temperature (T2M) at this highest grid point as well as of minimum and maximum melt extent during the event. For T2M@ME, the elevation at which it was observed is indicated in brackets. The total number of melt events is N=77.

The 77 melt events in 1979–2017 (Tables S1–S3 in the Supplement) lasted between 1.25 and 16.25 d and on average 4.1±3.4 d (Table 2). Surface melt during short events typically covered around a third of the GrIS at maximum. On average, about half (44.6±10.7 %) of the GrIS was melting at the time of maximum extension of the event. The three melt events affecting the largest ice area were EV69 (94.8 %), EV35 (83.9 %), and EV70 (70.3 %) in early July 2012, June 2002, and end of July 2012, respectively. EV69 is the most closely investigated melt event in the literature, where surface melt occurred up to the highest ERA-Interim grid point at 3175 m. Considering all events, the maximum elevation with surface melt was 2692±193 m. The maximum 2 m temperature at the most elevated grid point experiencing melt averaged slightly below 0 ∘C.
2.3 Backward trajectories
We use the Lagrangian framework to investigate air mass modifications, the underlying physical processes, and general flow structures. The Lagrangian analysis tool LAGRANTO (Wernli and Davies, 1997; Sprenger and Wernli, 2015) basically solves the trajectory equation (Eq. 1) numerically.
where x is the position of an individual air parcel and u the 3D wind vector. We use 3D ERA-Interim wind fields to calculate kinematic backward trajectories from predefined starting locations and trace a set of variables along the trajectories (Table 3). In the domain defined by the 519 ice grid points (Sect. 2.2) trajectories are started equidistantly every 80 km in the horizontal, resulting in 267 starting points per height level. Most of the trajectory starting points are located over the GrIS accumulation zone, as 90 %, 76 %, and 56 % of the starting points' ground level lies above 1000, 1500, and 2000 m, respectively. In the vertical, trajectories start at three near-surface layers in the lowermost ∼500 m of the atmosphere (20, 40, and 60 hPa a.g.l. – above ground level), representing air masses that exert a strong surface forcing. During the evaluation, we consider trajectories from all three layers to get a more robust estimate of the properties of typical air masses near the GrIS. The trajectories are calculated 8 d backward in time and start every 6 h during a melt event. For smoother plotting, trajectory positions and all variables are written out every 3 h along the trajectories. One application of the trajectories is to perform so-called Lagrangian forward projections (LFP; Liniger and Davies, 2003; Sodemann et al., 2008); i.e., certain properties of the air mass, such as the total 8 d adiabatic warming, are projected onto the trajectory starting point above Greenland.
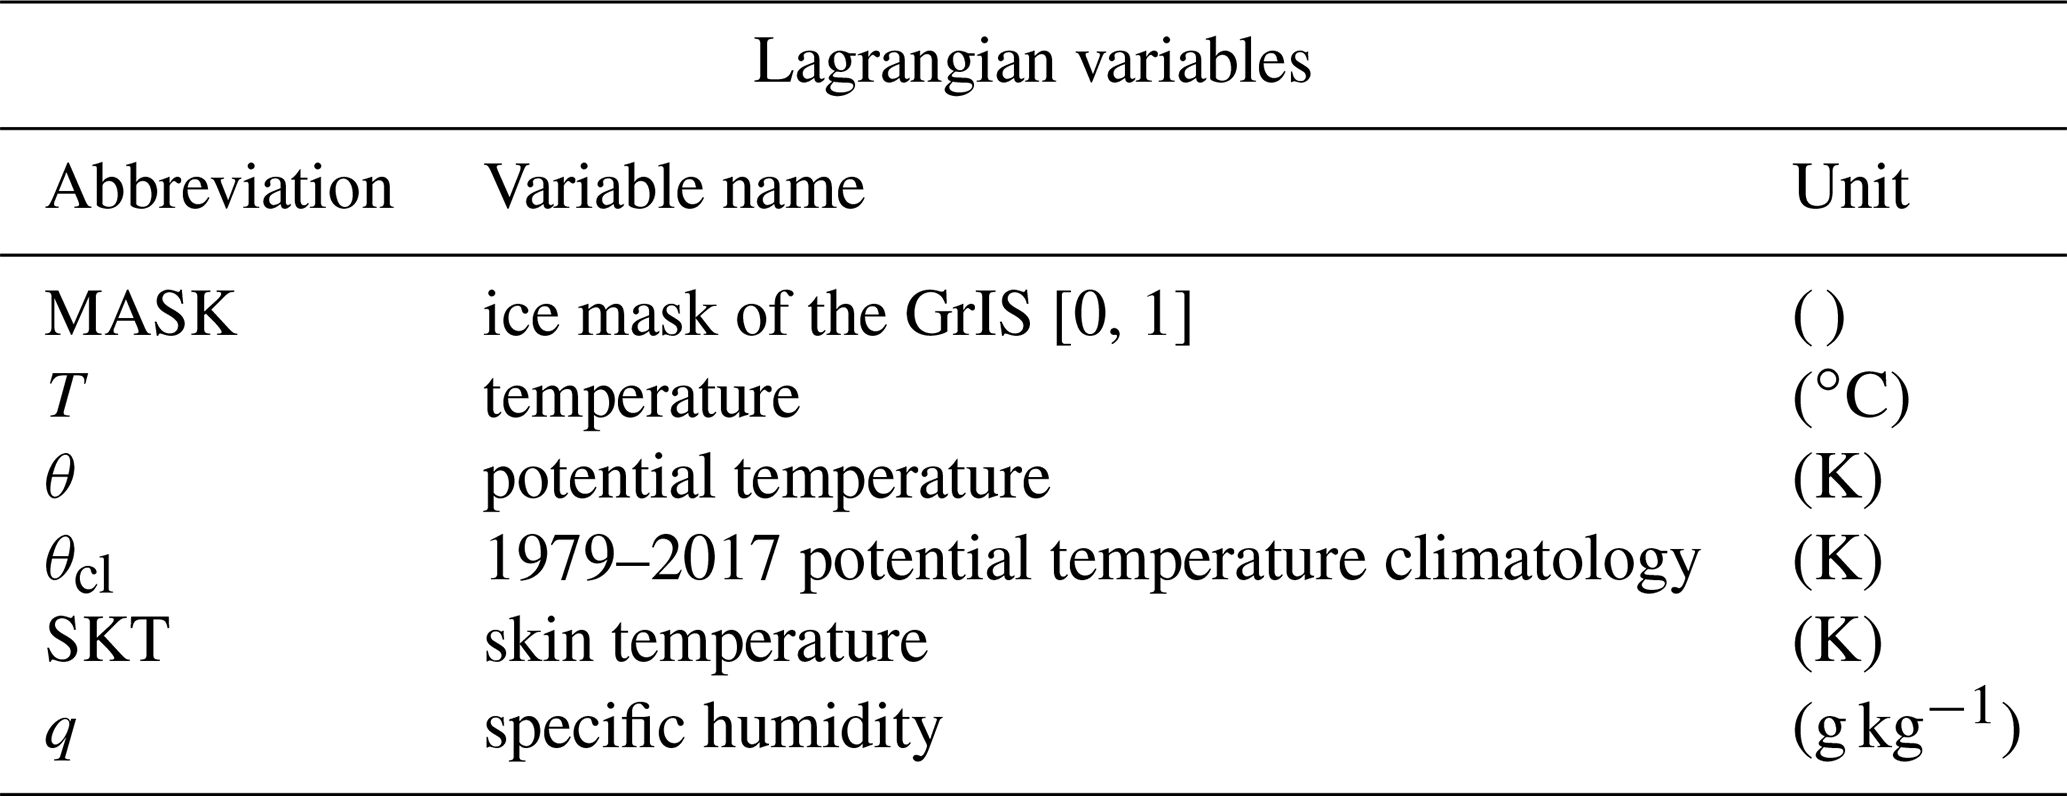
Table 3The ERA-Interim variables traced along the 8 d backward trajectories (Lagrangian variables).
2.4 Lagrangian evaluation of thermodynamic energy equation
We evaluate the thermodynamic energy equation in order to get insight into the warming mechanisms along trajectories.
According to Holton and Hakim (2012) and Bieli et al. (2015), the relationship between temperature, vertical motion, and diabatic processes (Eq. 2) follows from the thermodynamic energy equation and the material derivative of potential temperature (K), with reference pressure p0 and . The total diabatic heating rate is (K s−1), and the vertical velocity equals (Pa s−1).
We split the warming integrated along the 8 d trajectories, ΔT, into adiabatic (Eq. 2, first term on right-hand side) and diabatic (Eq. 2, second term on right-hand side) components (Eq. 3). The diabatic change in temperature along the trajectory is calculated from θ and p with the numerical approximation in Eq. (4). The adiabatic warming then follows as a residuum from this term and the total ΔT along the trajectory (Eq. 3).
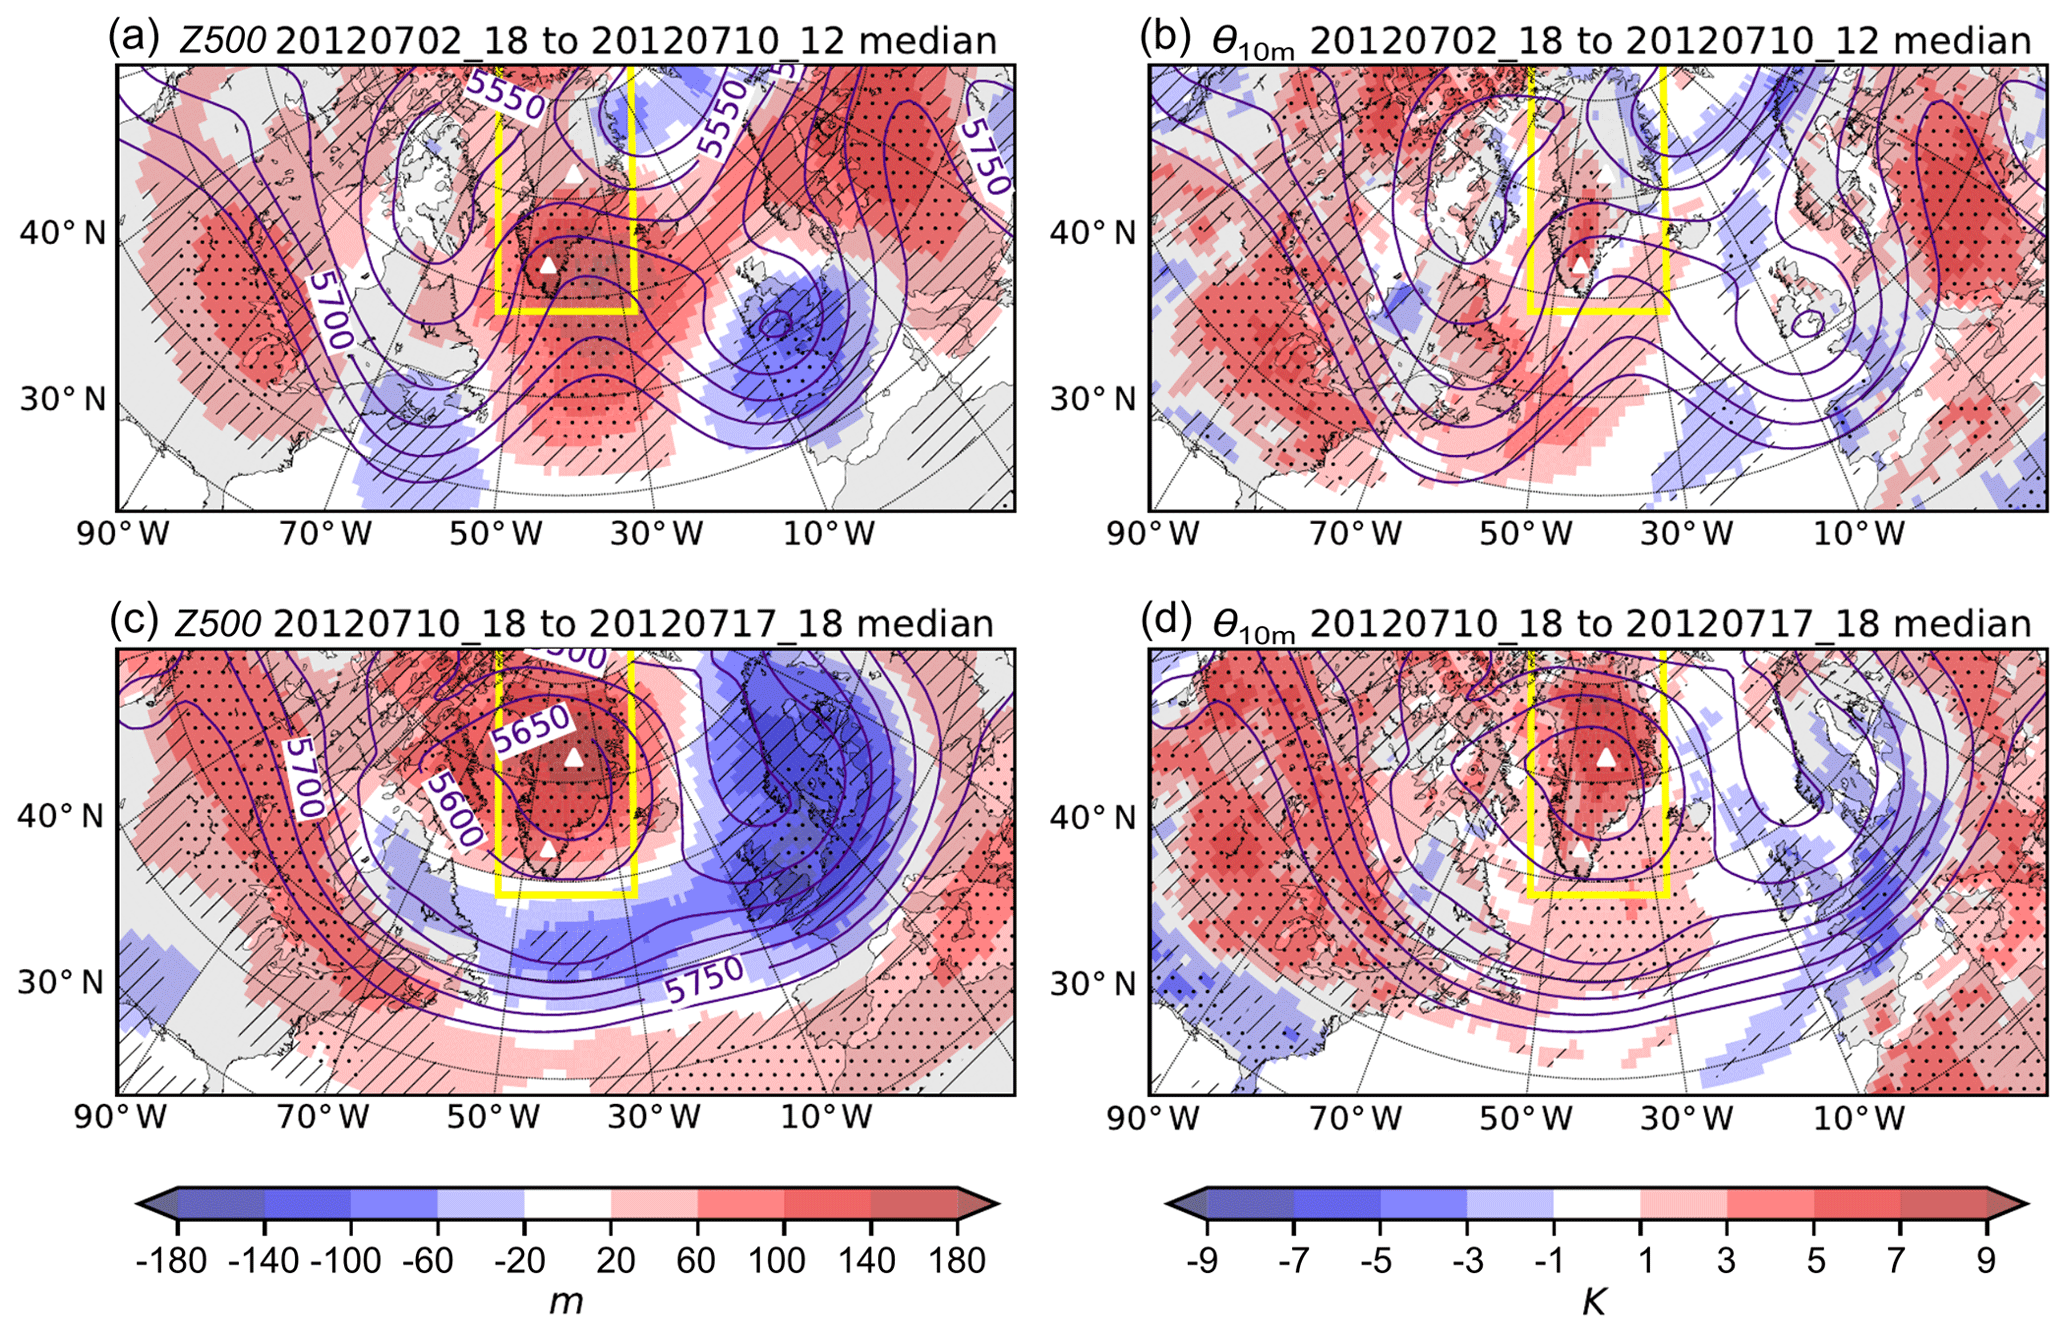
Figure 1The median fields of 500 hPa geopotential height (Z500; contours) for the two periods during EV69 from (a, b) 18:00 UTC on 2 July to 12:00 UTC on 10 July (8 d) and (c, d) 18:00 UTC on 10 July to 18:00 UTC on 17 July (7.25 d). Median anomalies of the synoptic fields in the respective periods are shown in colors: (a, c) Z500 and (b, d) near-surface potential temperature (θ10 m). Hatching (stippling) indicates an anomaly outside the 25–75 (10–90) percentile range of equally long periods in JJA 1979–2017. The yellow box indicates the location of the GrIS.
Adiabatic warming/cooling is a consequence of adiabatic compression/expansion due to vertical motion (ω). We expect diabatic heating (H) to be dominated by radiative clear-sky cooling at ∼1 K d−1 (Cavallo and Hakim, 2013; Papritz and Spengler, 2017) and latent heating/cooling by condensation of water vapor or evaporation/sublimation of hydrometeors in and below clouds. Oceanic surface sensible heat fluxes in the midlatitudes are typically reduced in summer compared to winter and can only affect the few airstreams traveling in the surface layer.
In order to illustrate our methodology and the processes at play, we start with a detailed case study of the EV69 melt event. It lasted from 18:00 UTC on 2 July to 18:00 UTC on 17 July 2012 and included the most extreme period of surface melt in terms of elevation (up to the highest grid cell at 3175 m) and maximum coverage (94.8 %) on 12 July.
3.1 Synoptic situation
The synoptic flow configuration during EV69 was characterized by an exceptionally strong 500 hPa geopotential height anomaly, Z500′, over and near Greenland (Fig. 1a and c) and can be divided in two distinct periods of about 1 week each. The first period was initiated by the deepening of a slowly propagating low-pressure system near Newfoundland (not shown) and an amplifying upper-level ridge over the central North Atlantic. During the subsequent 8 d, from 18:00 UTC on 2 July to 12:00 UTC on 10 July, the North Atlantic circulation pattern resembled a typical omega blocking (e.g., Woollings et al., 2018), as is evident from the shape of the Z500 contours (Fig. 1a). High values of Z500 located southeast of Greenland, with an anomaly vastly above the 90th percentile, were sustained and stabilized by an upstream trough over Newfoundland and a downstream trough over the UK. Another strong ridge was present further downstream over Russia (Fig. 1a). In the lower troposphere, the southerly flow between the upstream low and the Greenland ridge advected exceptionally warm air to southern and western Greenland, causing near-surface potential temperature anomalies, , of more than 5 K, as well as to neighboring regions such as Newfoundland, the Labrador Sea, and Baffin Bay (Fig. 1b). Another striking feature is the exceptional heat wave of similar anomaly magnitude over the Great Plains of North America (Hoerling et al., 2014; Neff et al., 2014).
By the end of the first period, the positive Z500′ migrated poleward. Thus, the circulation during the second half of EV69, the 7.25 d period from 18:00 UTC on 10 July to 18:00 UTC on 17 July, was characterized by a less meridional flow south of Greenland and a cutoff anticyclone centered over the GrIS, while a deep trough dominated over northern Europe (Fig. 1c). The median Z500′ over Greenland during this period was around +150 m (>90th percentile), except for the southern tip of the GrIS. It went along with an equally exceptional over the GrIS and the northeastern North Atlantic, peaking in northern Greenland with values of K (Fig. 1d).
The combination of the cyclone over Newfoundland and the anticyclone over the GrIS favored northward transport of low-level air masses from the subtropical North Atlantic towards the southern tip of Greenland and the Labrador Sea. Figure 2 shows air masses arriving over the GrIS during melt time steps – hereafter referred to as “melt air masses”. Several distinct streams of melt air masses can be identified: two airstreams originating close to the east coast of North America ascended over the southern tip of Greenland into the midtroposphere and descended anticyclonically onto the central and eastern GrIS (labels C and E). Another important contribution stemmed from the subtropical North Atlantic. These airstreams followed a northward trajectory also towards southern Greenland, where the higher air masses ascended slightly to reach South Dome in a straight trajectory (S), whereas those in the marine boundary layer moved into the Labrador Sea and from there – remaining at low altitudes – further northward to reach the northern GrIS in a final rapid ascent (N1). It is interesting to note that the bulk of N1 air parcels did not ascend along Greenland's west coast but instead remained at low levels until they approached northwest Greenland. An additional airstream reached the north at lower altitudes from neighboring regions and approached the GrIS from the northwest (N2), or descended cyclonically in the cyclone near Newfoundland. Hereafter, we refer by C, E, N, S, or W air masses to air masses arriving in the specific region, irrespective of whether they follow a similar trajectory as shown in the previously discussed example (Fig. 2).
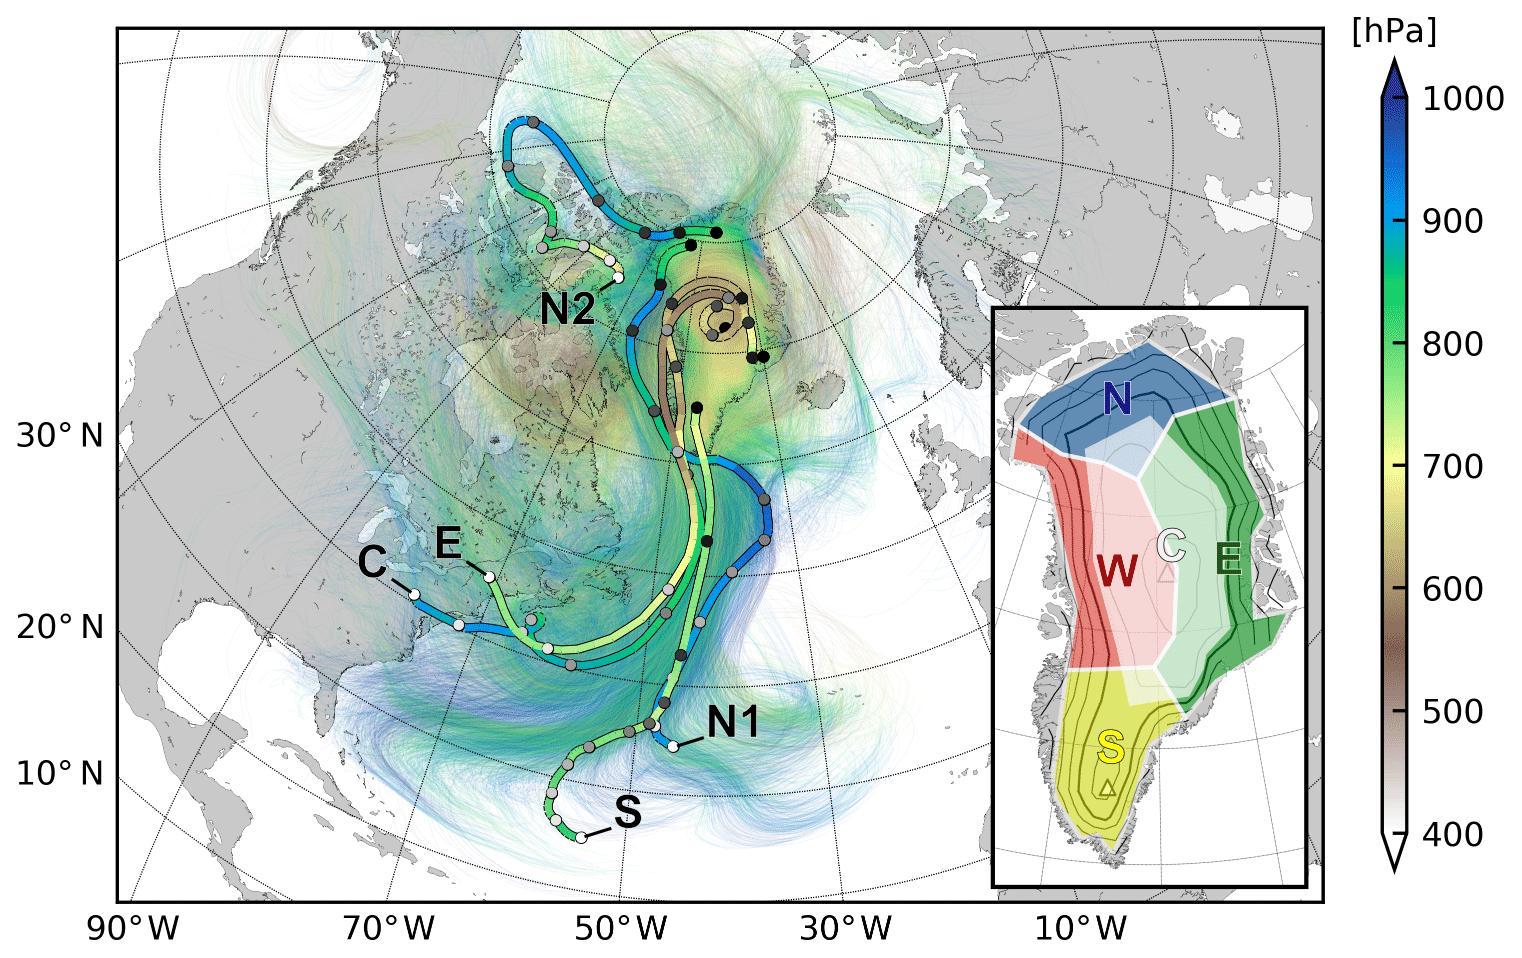
Figure 2All extended (10 d) melt trajectories of EV69 colored according to their pressure. Five example trajectories represent characteristic airstreams (S, C, E, N1, N2), shown in thicker lines with one circle per day colored from white ( h) to black (t=0 h). The subfigure map shows characteristic regions of the GrIS: south (S), west (W), north (N), east (E), and central plateau (C).
3.2 Lagrangian forward projection
The Lagrangian analysis is split in two parts in which we identify (i) sources of air masses (Sect. 3.2.1) and (ii) mechanisms (Sect. 3.2.2) that contributed to surface ice melt over the GrIS prior to or during EV69; specifically, we consider the characteristics of the air mass origin and the following transport focusing on thermodynamic temperature changes along the trajectories.
3.2.1 Air mass origin
By comparing with the climatological characteristics of air masses arriving over the GrIS, we pinpoint the anomalous nature of the EV69 melt trajectories in terms of latitude, altitude, and temperature anomaly. For each melt trajectory we define the relative minimum latitude and relative minimum pressure as the differences between the respective values of latitude and pressure at the destination over the GrIS and the minimum values along the trajectory, thus indicating the largest changes in latitude and pressure. To that end, we make use of 8 d backward trajectories from the lowermost 60 hPa above the GrIS (see Sect. 2.3) during melt time steps associated with EV69. Figure 3a and c show the relative minimum latitude and pressure projected onto the trajectory starting locations over the GrIS in a so-called Lagrangian forward projection. In addition, we show their anomalies with respect to the climatological reference defined as all air parcels that arrived over the GrIS during JJA 1979–2017, i.e., typical values for all summertime air masses that arrive over the GrIS (Fig. 3b and d).
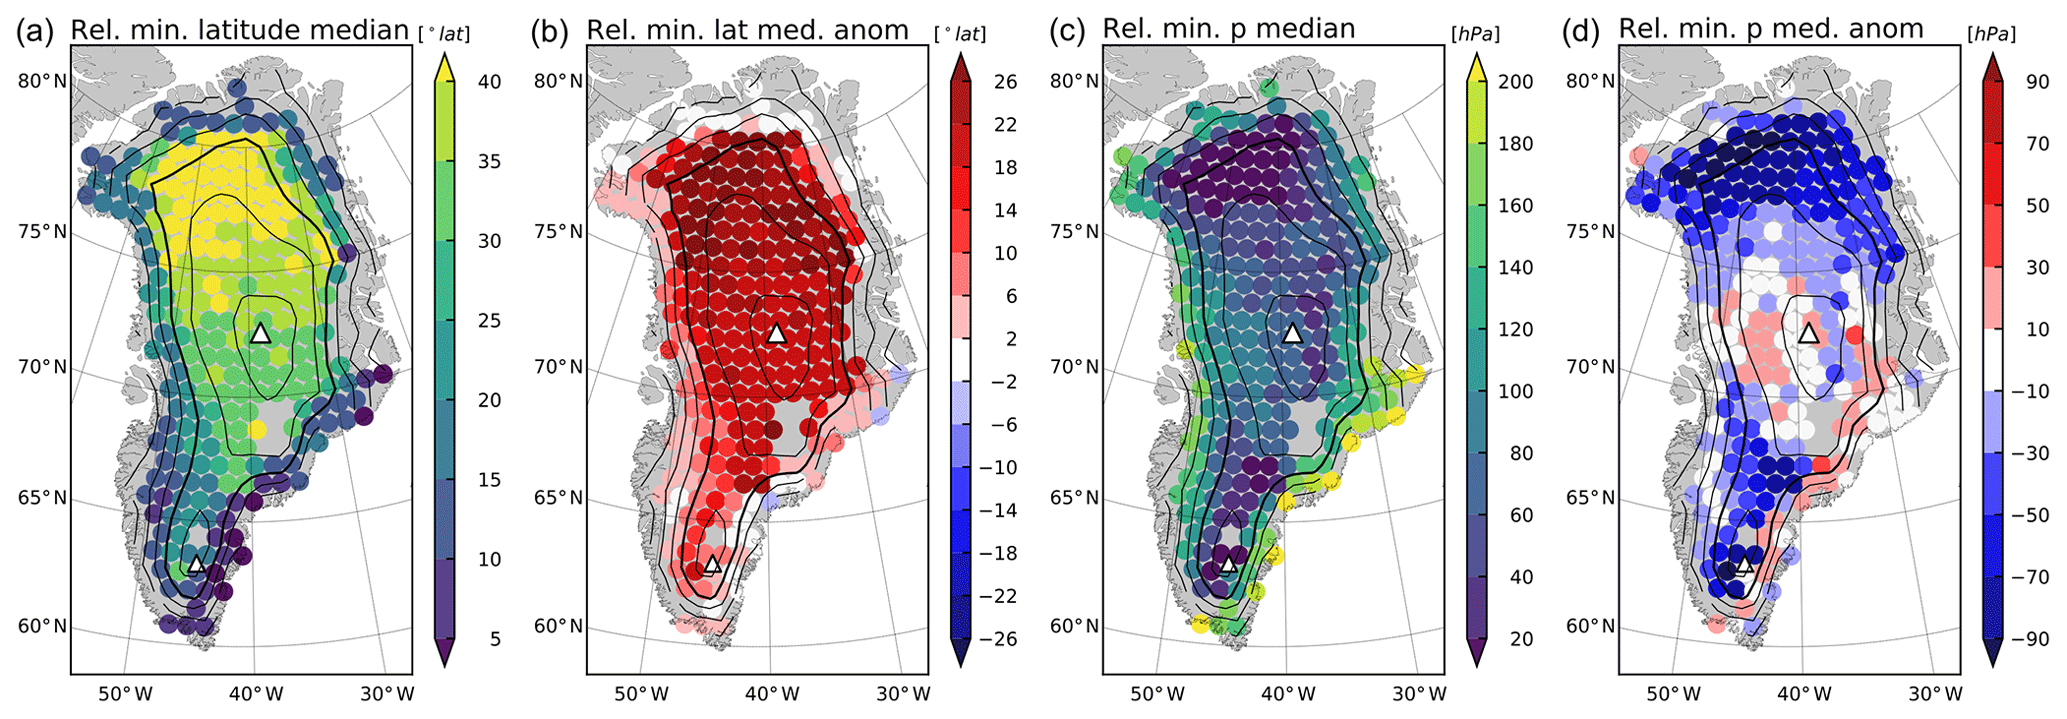
Figure 3Lagrangian forward projection (LFP) of the median (a) relative minimum latitude, (c) relative minimum pressure (where positive values mean from (a) lower latitudes and (c) above), and (b, d) the respective anomaly fields of 8 d melt trajectories of EV69 with respect to the climatological summertime air parcels. The contours indicate elevation in 500 m intervals with the 2000 m isoline in solid lines. Summit and South Dome are marked with triangles.
Generally speaking, the median melt air mass moved poleward by about 20∘ latitude in region S and up to 40∘ latitude in region N (Fig. 3a). Thus, it originated from a region in the atmosphere located around 20∘ latitude further south with respect to climatology (Fig. 3b). In addition, it descended by about 50 hPa less than the climatological air parcels, which applies, in particular, to South Dome and region N (Fig. 3d). In fact, many melt air masses arriving in these regions show a relative minimum pressure of less than 20 hPa, meaning that they had never reached far above their final elevation and hence ascended from the lowermost parts of the troposphere (Fig. 3c). Further, most air parcels show initially, at t=192 h, a small potential temperature anomaly with respect to the local climatology, θcl, of ∼0.5–2.5 K, which is highly unusual compared to the average air mass, which shows an approximately 0 K initial anomaly (Fig. S1c in the Supplement). The origin of these initial warm anomalies is related to the North American heat wave (Hoerling et al., 2014) and other anomalously warm source regions, predominantly in the Canadian Arctic. An interesting exception concerns melt air masses reaching region N, which did not come from regions with a positive temperature anomaly. They, however, show the largest relative minimum latitude, i.e., strongest meridional transport, of more than 40∘ latitude (Fig. 3a). Other exceptional melt air masses arrived over regions C and E, showing slightly increased descent compared to the climatological air masses (Fig. 3d).
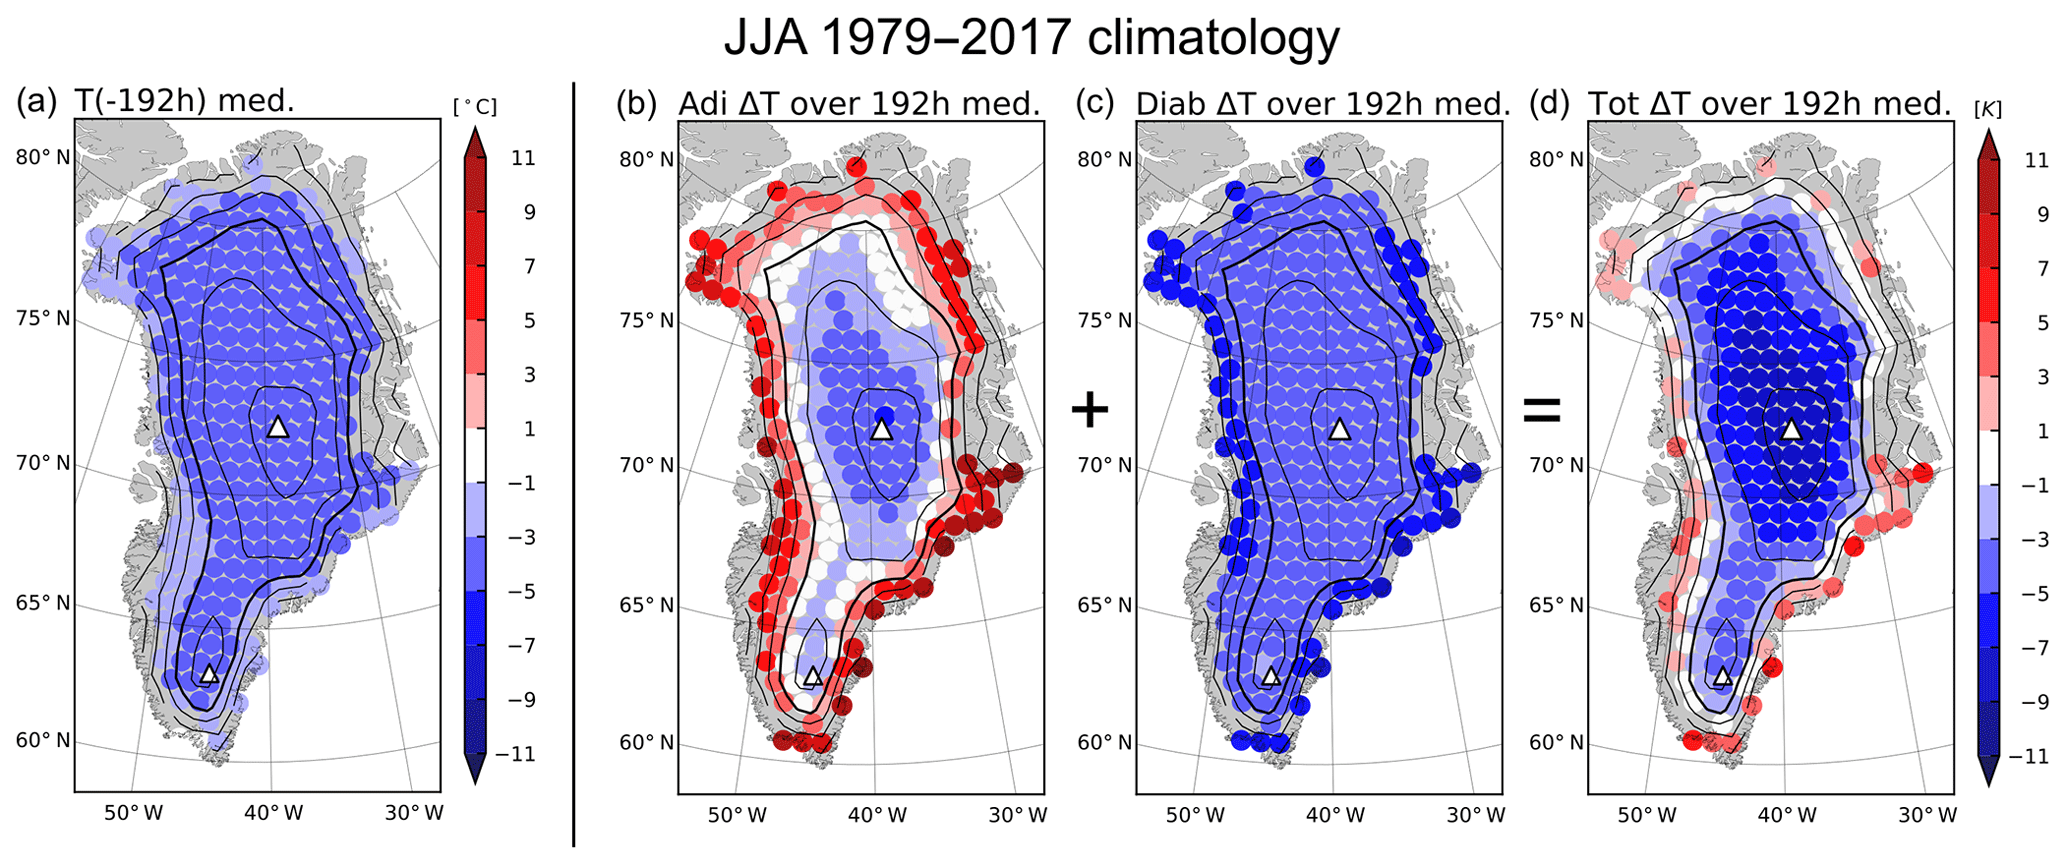
Figure 4LFP maps as in Fig. 3 of the (a) initial temperature at h, and (b) adiabatic, (c) diabatic, and (d) total temperature change over 8 d and of the JJA 1979–2017 climatological summertime air masses.
3.2.2 Air mass evolution
In order to assess the relative importance of adiabatic and diabatic temperature changes for the final temperature anomalies of EV69 melt air masses, we first consider the typical temperature evolution of all air parcels that arrive over the GrIS during JJA 1979–2017. The initial temperature is very uniform for all trajectories with a median of ∘C at h (Fig. 4a). While in the following all air parcels experience diabatic cooling of about 0.5–1 K d−1 (Fig. 4c), mostly due to longwave radiative fluxes, the adiabatic temperature changes exhibit a strong elevation dependence. Specifically, C air masses cool adiabatically, indicating ascent prior to arrival over the GrIS (Fig. 4b). Air masses arriving in or closer to the ablation zone, in contrast, experience overall adiabatic warming. This descent is likely the result of katabatic drainage flows prevalent over the GrIS (cf. Heinemann and Klein, 2002). Consequently, cooling dominates the temperature evolution of most air masses arriving over the elevated regions of the GrIS, whereas at lower elevations adiabatic warming compensates for much of the radiative cooling such that these air masses experience little to slightly positive overall temperature changes (Fig. 4d). Except for some of the latter, summertime air parcels arrive with negative temperatures within the lowermost 60 hPa (∼500 m) aloft the GrIS, because of T<0 ∘C at t=192 h (Fig. 4a) and cooling during the transport to Greenland (Fig. 4d).
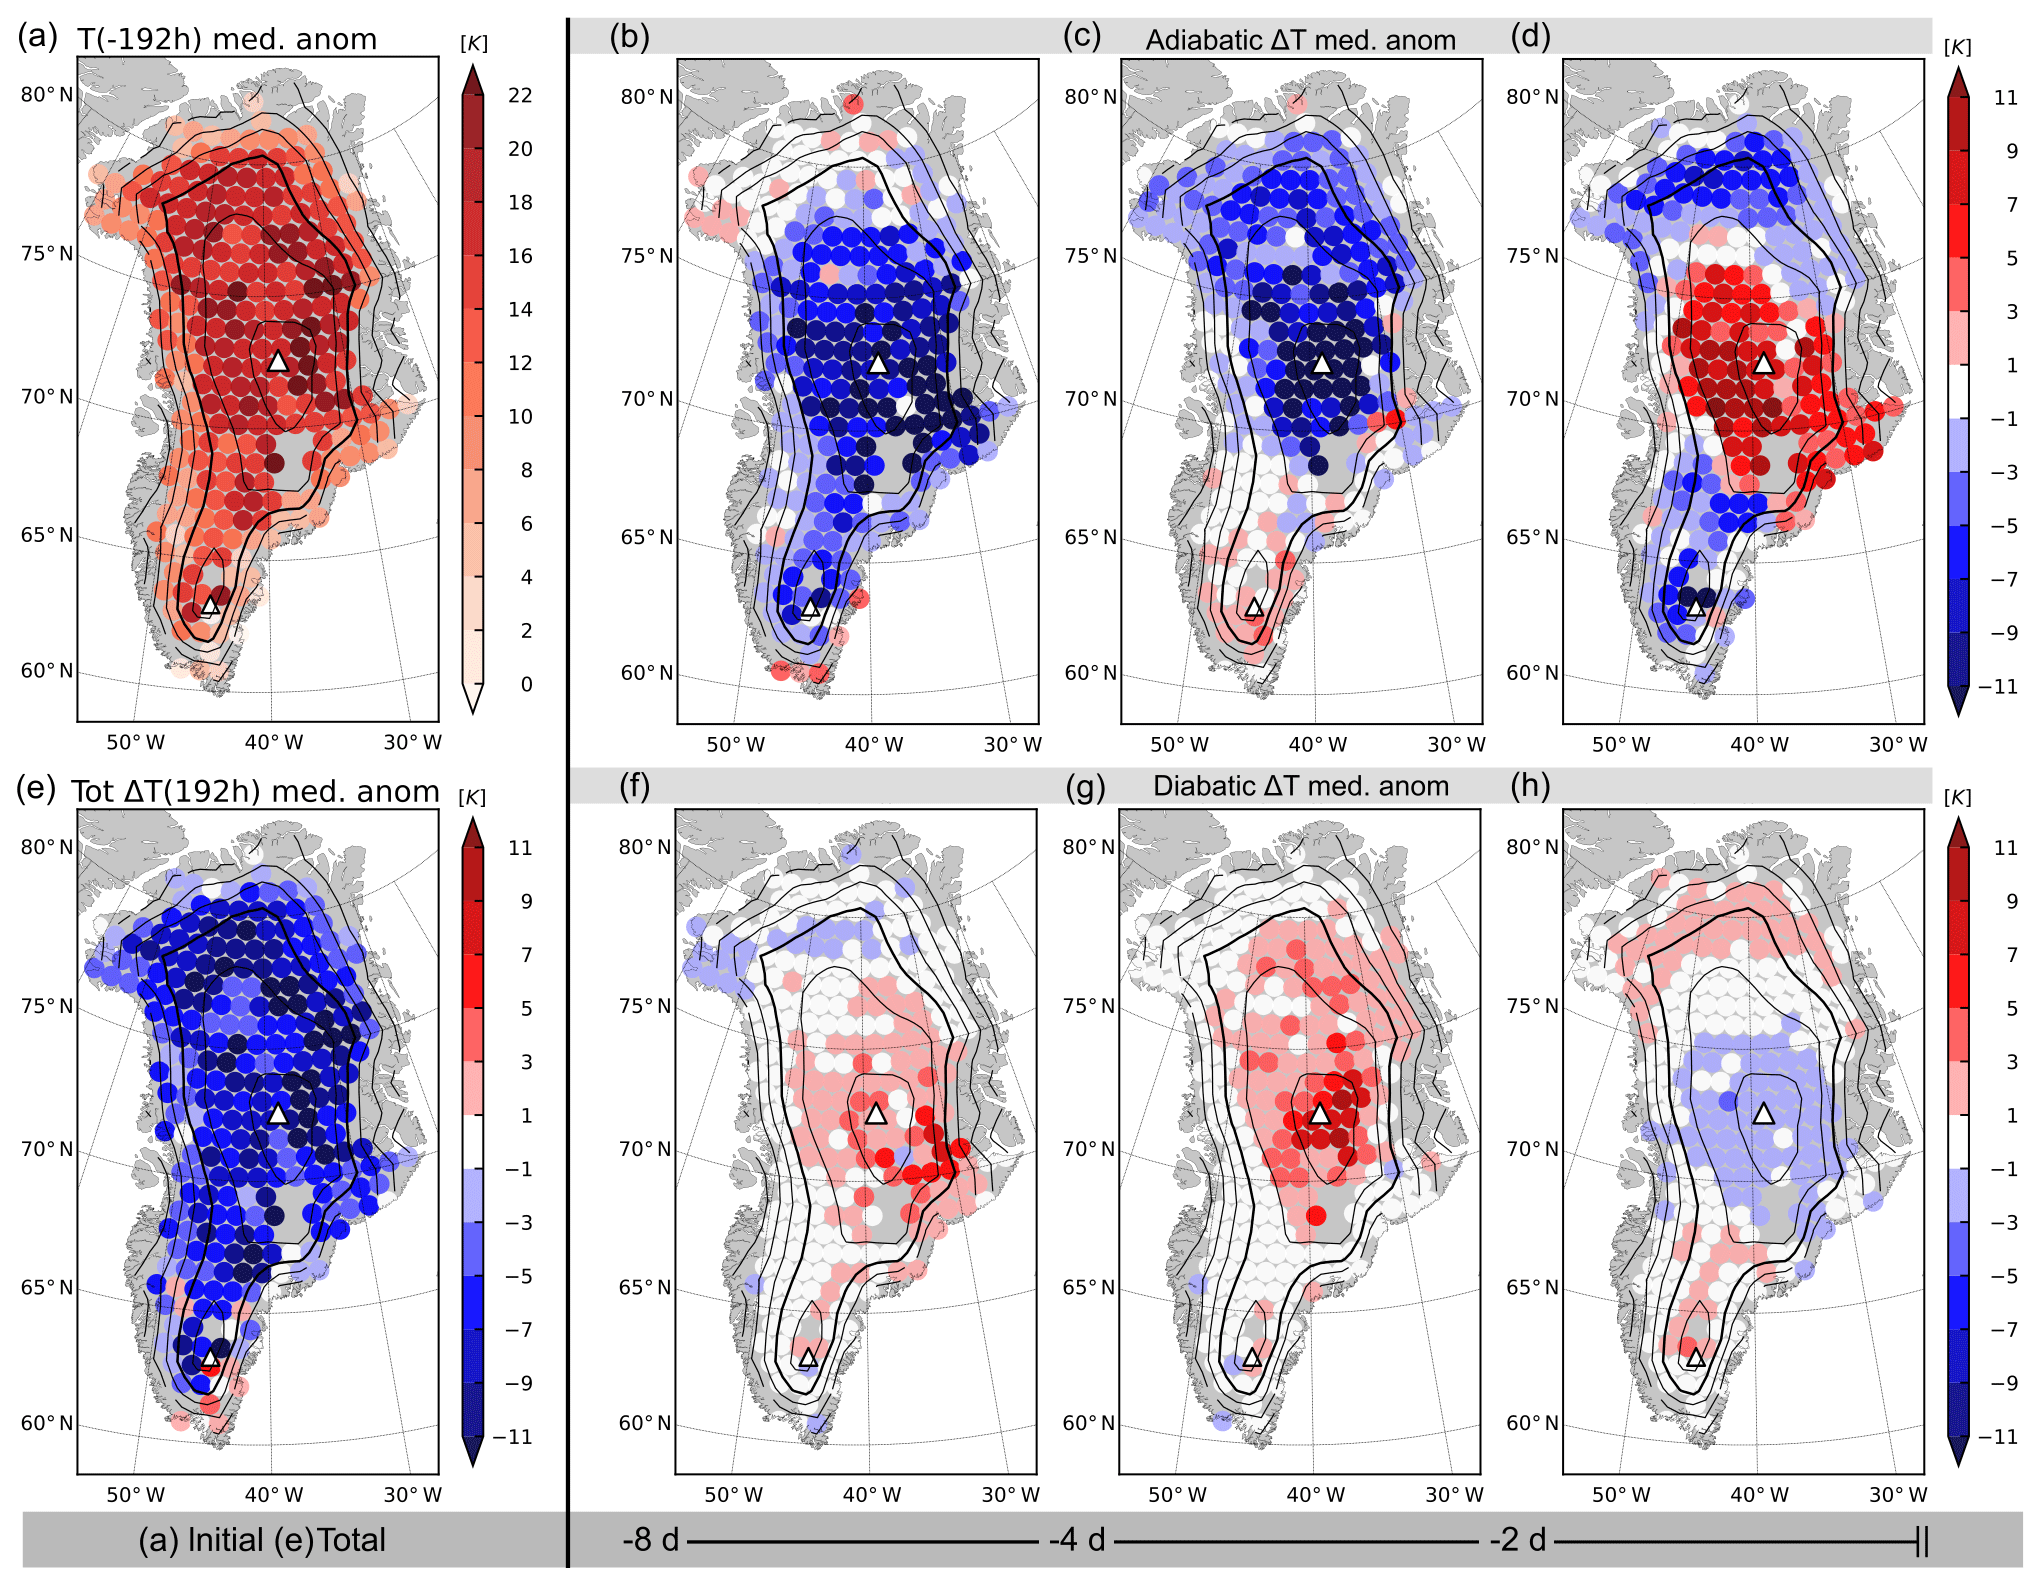
Figure 5LFP anomaly maps of the (a) initial temperature at h, and (b–d) adiabatic, (f–h) diabatic, and (e) total temperature change over 8 d with respect to the climatological summertime air masses shown in Fig. 4. The adiabatic and diabatic temperature change anomalies are split up in the periods (b, f) to h, (c, g) to h, and (d, h) to t=0 h.
The adiabatic and diabatic temperature modifications of EV69 melt air masses deviated from the typical summer air mass as shown in Fig. 4. At the start of their trajectory ( h), melt air masses were about 10–16 K warmer than climatological air masses (Fig. 5a). Melt air masses arriving at lower elevations or even the ablation zone of Greenland showed a smaller initial temperature anomaly ( K) than those arriving in region C ( K). From the evolution during the subsequent 8 d, we again refer to representative melt airstreams with different characteristics (see Fig. 2): a melt airstream arriving over (i) the central plateau and east Greenland (“C” and “E”), (ii) north Greenland (“N1” and “N2”), and (iii) south Greenland (including South Dome; “S”), respectively. Figure 5b–d and f–h show the adiabatic and diabatic temperature changes during days 0–4, 5–6, and the last 2 d of the transport to Greenland. N air masses exhibited a thermodynamic evolution in the beginning that was close to that of the climatological air masses (Fig. 5b and f) and an orographically induced final ascent reflected in enhanced adiabatic cooling (Fig. 5c and d). In close proximity to the GrIS, N air parcels ascended from the south (N1 in Fig. 2) or the west (N2 in Fig. 2) to the northern GrIS. Airstream S showed a similar pathway to N1 but with initially exceptional adiabatic cooling before reaching Greenland (Fig. 5b) and subsequently orographic ascent from the south (Fig. 5d). The associated adiabatic cooling and diabatic warming were less pronounced and occurred later in S compared to N (Fig. 5c, d, g and h).
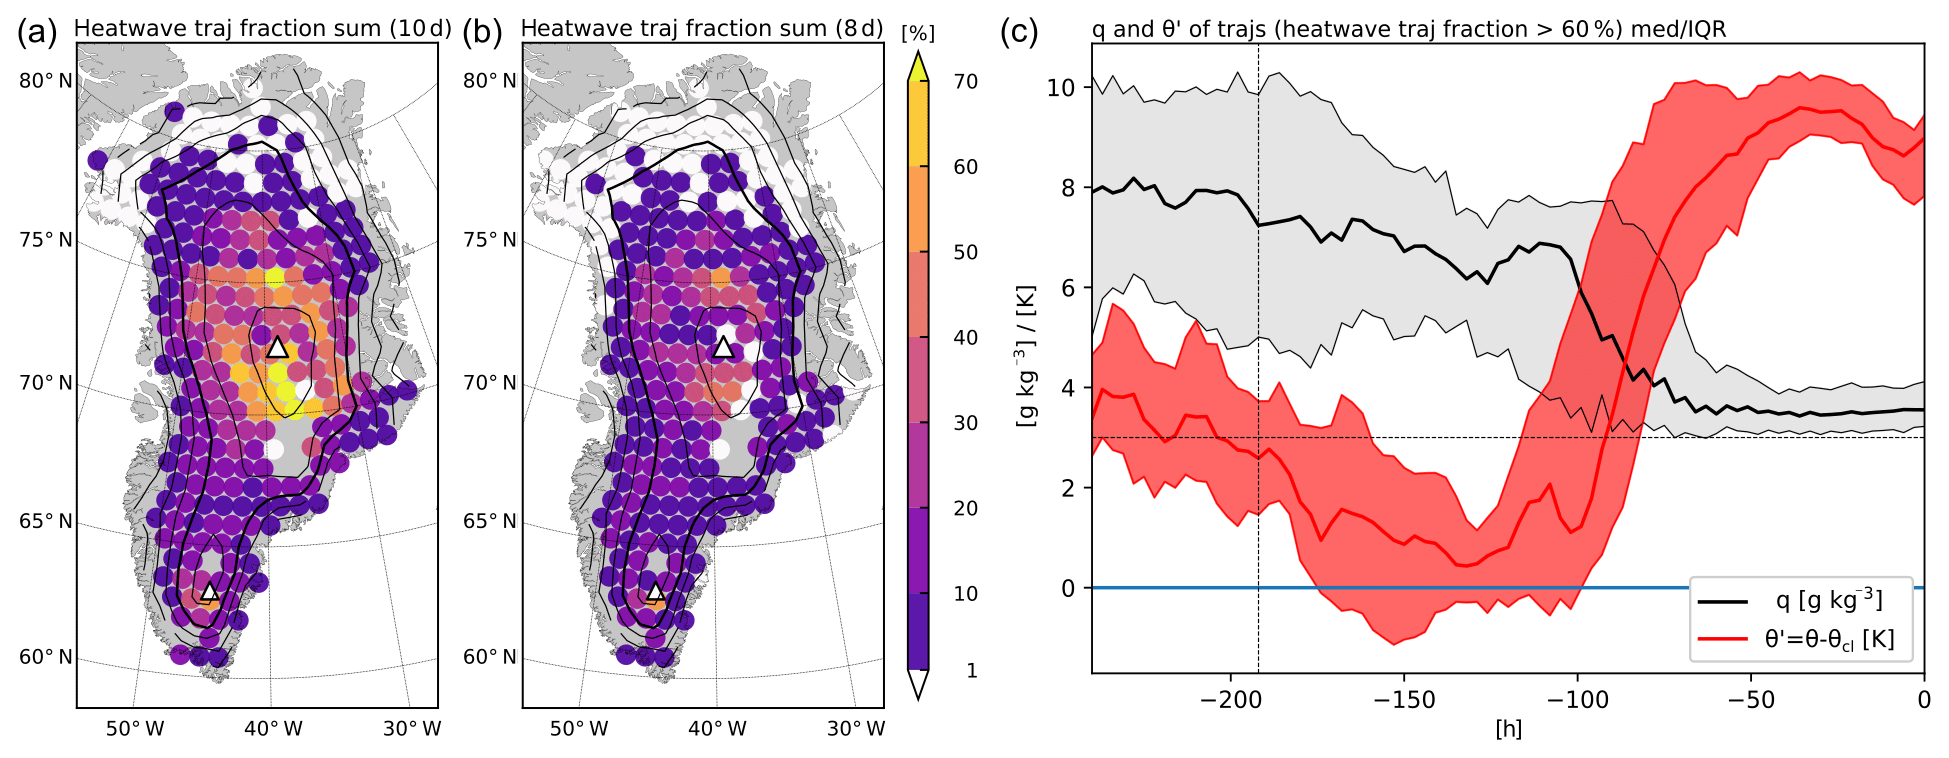
Figure 6LFP maps of the trajectory fraction being associated with the North American heat wave (see text for details) for (a) the extended 10 d or (b) 8 d trajectories; panel (c) shows the median (solid line) and interquartile range (shading) of specific humidity q (grey) and θ′ with respect to θcl (red) of heat wave trajectories ending at locations with a heat wave trajectory fraction > 60 %. Dashed lines in (c) indicate h and K.
Airstreams C and E experienced much stronger than usual adiabatic cooling during most of the 8 d period, especially between h and −48 h, which indicates enhanced ascent (Fig. 5b and c). This ascent either stemmed from dynamical lifting at the polar front, i.e., by the trough over Newfoundland (C in Fig. 2), and/or orographic lifting at the southern tip of Greenland (E in Fig. 2; cf. Stohl, 2006). Interestingly, during the final 48 h, these airstreams experienced strong adiabatic warming due to descent onto the GrIS. Over 8 d, the total adiabatic warming anomaly is typically below −10 K and diabatic heating in melt air masses is anomalous by +5 K – both signals especially distinct in airstreams C and E. The total temperature change was uniform over the GrIS, and its GrIS-wide median equaled −6.2 K (Fig. 5e), with the initially warmest air masses (Fig. 5a) cooling more than the rest. Nevertheless, 40 %–80 % of the initial warm temperature anomaly of the melt air masses with respect to the climatological air masses (Fig. 5a) was sustained and not compensated for by stronger cooling than along the climatological trajectories.
Previous studies (Neff et al., 2014; Bonne et al., 2015) have shown that anomalously warm and humid air masses associated with the heat wave over North America contributed to EV69. To quantify this contribution, we extend our set of backward trajectories to 10 d and define heat wave trajectories as those melt trajectories that (i) pass the North American Great Plains at some point and (ii) at the same time have a potential temperature anomaly with respect to θcl in excess of 3 K. The fraction of these trajectories among all melt trajectories is shown in Fig. 6a and b. The highest contributions of heat wave air masses are found in the upper accumulation zone of regions C and E (up to 70 % near Summit; C and E in Fig. 2). The heat wave trajectories ending at locations with more than 60 % US heat wave contribution were initially anomalously warm (also constrained by the selection criteria) and had a high specific humidity of ∼8 g kg−1 (Fig. 6c). During their way from the American continent to the western North Atlantic (until h), however, these air masses lost most of their warm anomaly. This is in contrast to the idea that they carried the original temperature anomaly from North America to Greenland. At the same time, they conserved their moisture to a large degree, with the driest ones picking up additional moisture once they reached the open ocean. It is only between and −48 h when the air masses rapidly moved poleward into a climatologically much colder region that their warm anomaly increased from around +1 K to almost +10 K. The concurrent reduction of specific humidity confirms the condensation of water vapor and aforementioned diabatic warming during that period (Fig. 5f and g), which was linked to ascent along the sloping isentropes as the air mass moved poleward. Indeed, air masses came from the US heat wave but the temperature anomaly near the origin of their trajectories was not directly responsible for the warm anomaly upon arrival in Greenland.
In summary, we conclude that exceptional poleward transport and ascent of relatively moist and climatologically warm air masses contributed substantially to EV69 by advection towards the climatologically much colder GrIS region. Nevertheless, air masses leading to this large-scale melt event were cooled more strongly than usual during their transport to the GrIS. In these warm, moist, and poleward ascending airstreams, latent heating from condensation of water vapor compensated for some of the adiabatic cooling and contributed to the warm anomaly over the GrIS.
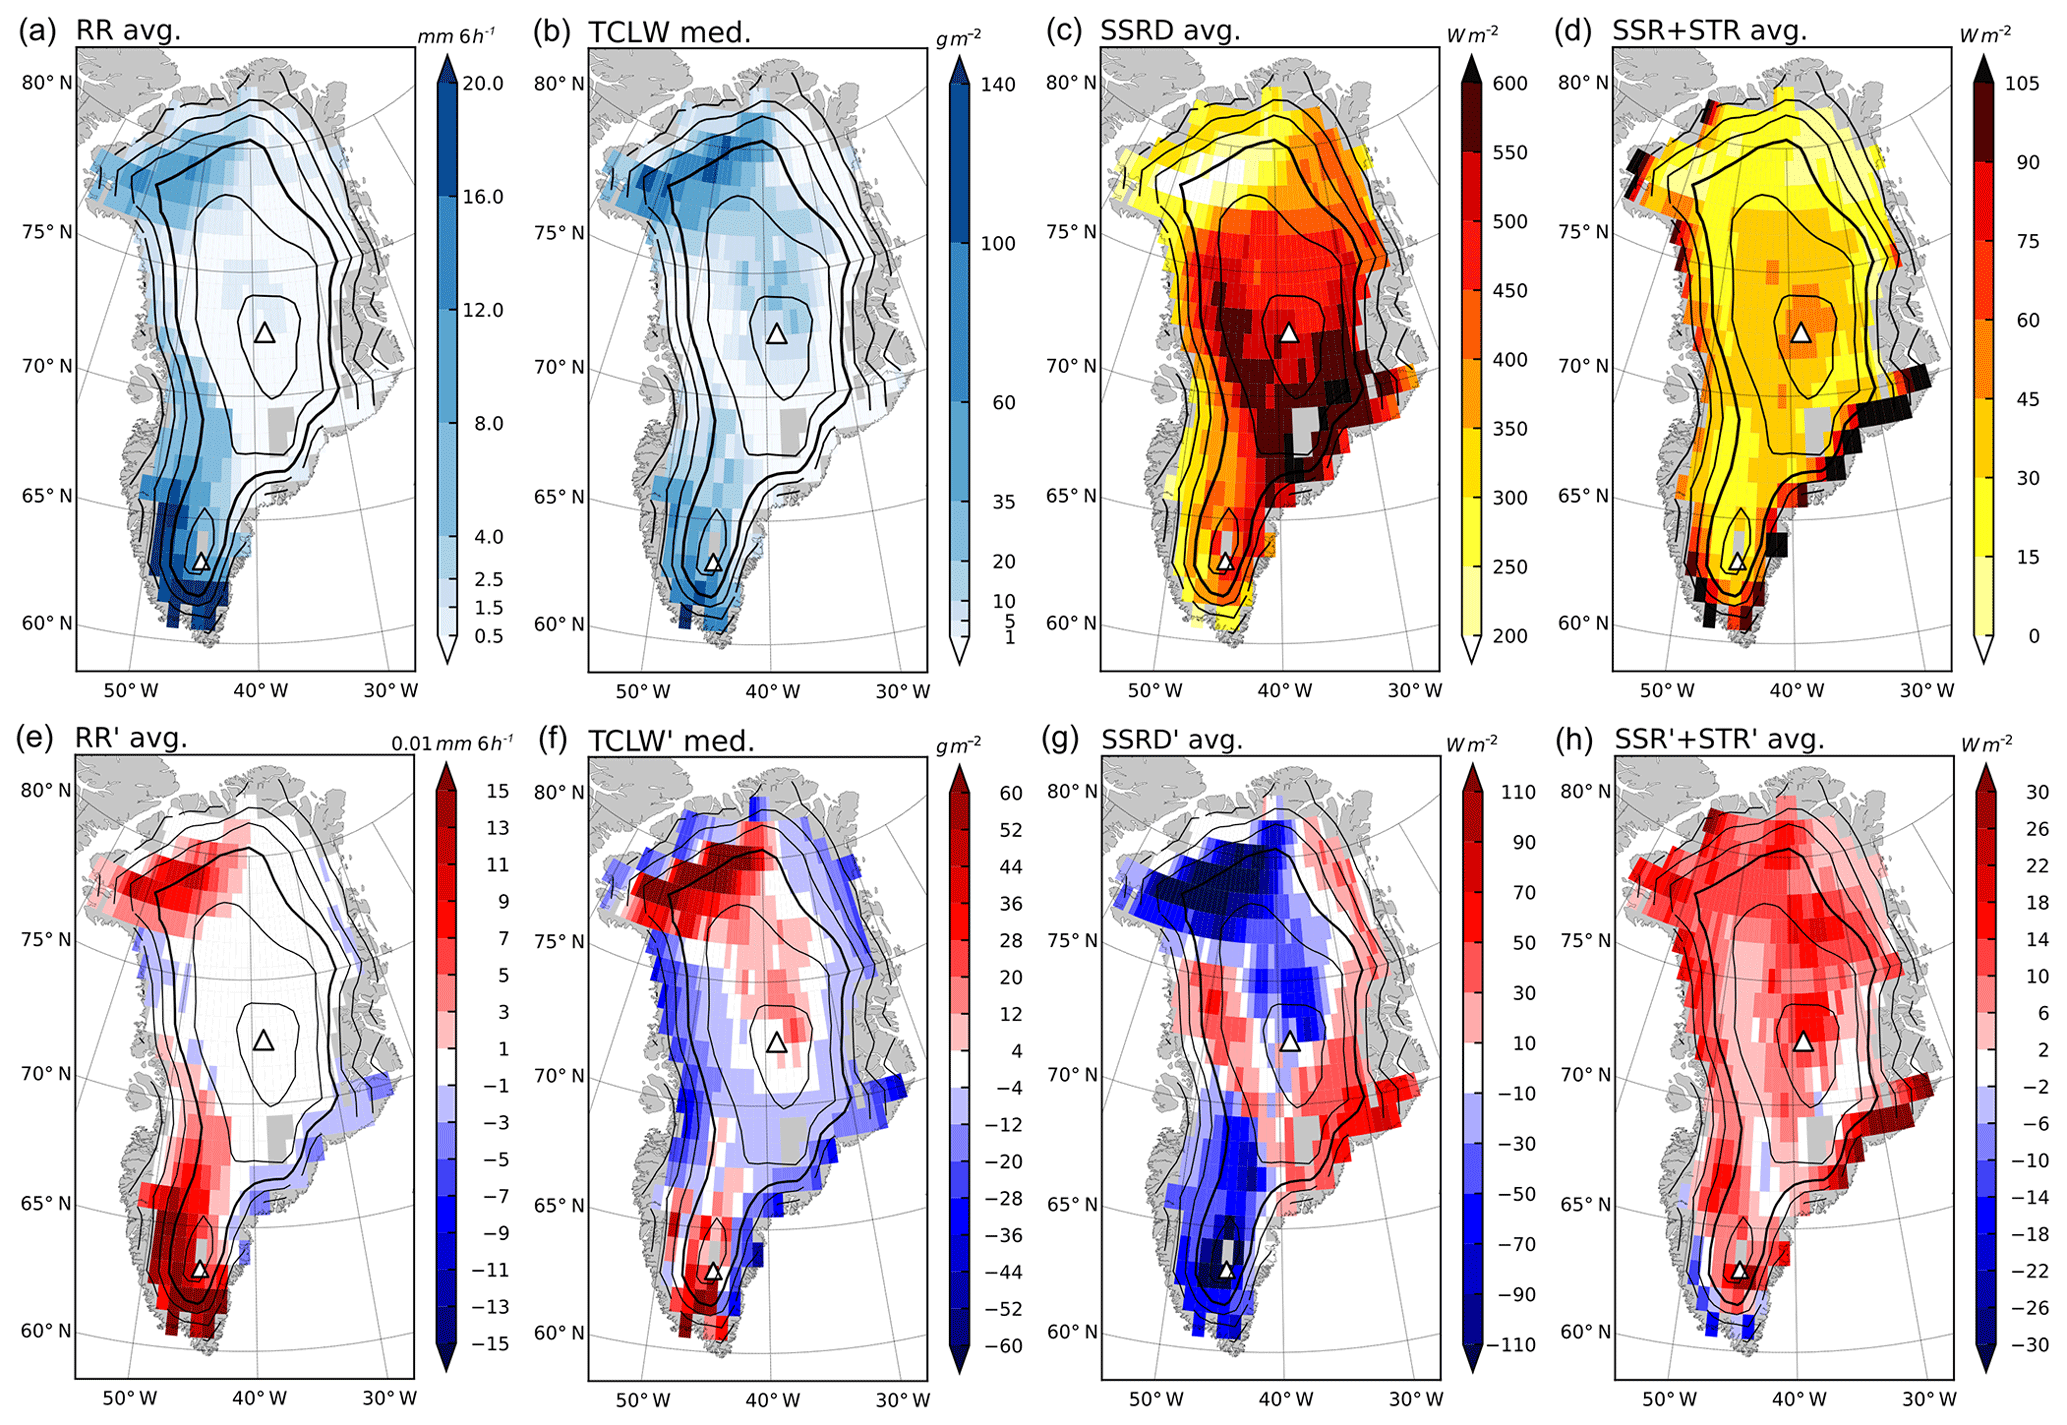
Figure 7Composites of (a) rainfall (RR), (b) total column liquid water (TCLW), (c) surface shortwave downward radiation (SSRD), (d) net surface long- and shortwave radiation (SSR + STR) during EV69 melt time steps, and (e–h) the respective anomalies with respect to climatology. Depending on the melt impact of the variable, the composite results from the average (RR, SSRD, SSR + STR) or the median (TCLW).
3.3 Linkage to clouds and radiative effects
The characteristic airstreams during EV69 (C, E, N1, N2, S; Fig. 2) likely played an important role in modulating the spatial distributions of rain and snowfall, cloud liquid water, and radiative fluxes over the GrIS, which in turn had a strong impact on the melt potential. To illustrate these interlinkages, we consider rain rate (RR), total column liquid water (TCLW), surface shortwave downward radiation (SSRD), and the sum of net surface short- and longwave (thermal) radiation (SSR + STR; Fig. 7a–d), as well as their anomalies with respect to the 1979–2017 summer climatology (Fig. 7e–h) for melt time steps at the respective grid points. We note that our results are based on the specific selection of large-scale melt events (Sect. 2.2) and ERA-Interim, whose resolution (∼100 km) is not resolving the narrow (20–100 km) ablation zone topography and surface processes correctly, i.e., mainly addresses characteristics of the accumulation zone. Still, the investigated variables and effects are relatively well represented in the Arctic in ERA-Interim (Wesslén et al., 2014; Wang et al., 2019).
Figure 7 indicates distinctive patterns over the GrIS that are related to the pathways of and processes within air masses arriving on the GrIS during EV69. The ascending airstreams S, N1, and N2 were associated with strong anomalies of TCLW and rainfall in southern and northwestern Greenland, respectively (Fig. 7a, b, e and f). In particular, airstream N1 carried moisture far northward and, as it ascended onto the GrIS north of Summit, the air parcels reached saturation. Consequently, TCLW and RR exceeded their climatologies in the entire region N. Similarly, region S also experienced strong TCLW and RR anomalies due to the ascending airstream S. Interestingly, in region W, TCLW and RR were below average. This is related to the fact that the humid air masses associated with airstream N1 remained in the boundary layer and did not ascend until they reached northwestern Greenland. Consequently, the air masses arriving in region W were transported at higher levels than airstream N1 and did not ascend or may even have experienced slight descent, thus leading to cloud-free conditions. Regions with precipitation experienced an additional heat flux into the ice from rain, while snowfall and total column ice water were widely reduced (Fig. S3b), as was previously highlighted by Doyle et al. (2015) and Fausto et al. (2016). In direct relation to increased TCLW, SSRD was strongly reduced, especially in region N (Fig. 7c and g). In contrast, in regions E and W, clear-sky conditions with hardly any precipitation prevailed (Fig. 7a), as is evident from extremely low TCLW (Fig. 7b), as well as substantially increased SSRD (Fig. 7g). Southeast of the plateau, this relates to the branch of the descending airstreams C and E that stretched anticyclonically from west to east across the central portion of the GrIS.

Figure 8Median composites of 500 hPa geopotential height (Z500) in contours and their anomalies with respect to climatology in colors for different lags relative to all melt event time steps: (a) h, (b) h, (c) lag=0 h, and (d) h. The yellow box indicates the location of the GrIS.
Despite the reduction in downwelling shortwave radiation in the regions with above average TCLW, the sum of net short- and longwave radiation was positive across the entire GrIS accumulation zone (Fig. 7d) and in excess of climatological values (Fig. 7h). This is in part explained by enhanced downwelling longwave radiation in the cloudy regions. There and also at and north of Summit, the shift in the cloud phase to the liquid regime was found to be decisive for the observed melt (Bennartz et al., 2013; Solomon et al., 2017). In addition, total column water vapor was also above the long-term summer climatology over all of the GrIS accumulation zone (area-weighted average anomaly of +3.3 kg m−2; Fig. S3f). The area-weighted GrIS-wide average anomaly of SSR + STR (Fig. 7h) amounted to +9.4 W m−2 and provided additional energy corresponding to a melting potential of 2.7 cm ice per day (resulting from the heat of fusion of water, 333.55 J g−1, and assuming ice at 0 ∘C with a density of 917 kg m−3).
In this section we generalize the results from the EV69 case study by considering all 77 large-scale melt events. We present the synoptic situation during large-scale melt events (Sect. 4.1); the air masses associated with these events and their temperature modifications (Sect. 4.2); and finally precipitation, moisture, and radiation patterns over the GrIS accumulation zone and its subregions (Sect. 4.3).
4.1 Synoptic situation
We illustrate the synoptic situation related to melt events in 1979–2017 by compositing Z500 and its anomaly field, Z500′, relative to climatology (Fig. 8). The composites are calculated 5 and 2 d prior to the melt time steps, at the melt time steps, and 5 d later. It is important to note that some of the time steps entering lagged composites were themselves part of the respective melt event if the melt criterion is satisfied also at the lagged time. As for EV69, melt events are characterized by a dipole pattern of Z500′ with a positive anomaly centered over southeastern Greenland and a pronounced negative anomaly over northern Europe. A positive Z500′ of +50–70 m is typically present already 120 h before melt occurs, accompanied by troughs both upstream and downstream. This initial pattern is, thus, akin to the geopotential height anomalies associated with cyclonic Rossby wave breaking and omega-type blocking (Fig. 8a; Liu and Barnes, 2015). Towards lag=0 h, the anomalies transition into the dipole pattern with a strong ridge or cutoff anticyclone over Greenland and a pronounced trough over the British Isles and Scandinavia (Fig. 8b and c). Z500′ near Greenland peaks at m around 24 h before melt occurs. Five days after a melt event, the positive Z500′ has shifted towards northwestern Greenland and the high Arctic (Fig. 8d). The dipole pattern is characteristic of the Greenland blocking regime (e.g., Grams et al., 2017), which projects negatively onto the NAO index and positively onto the GBI.
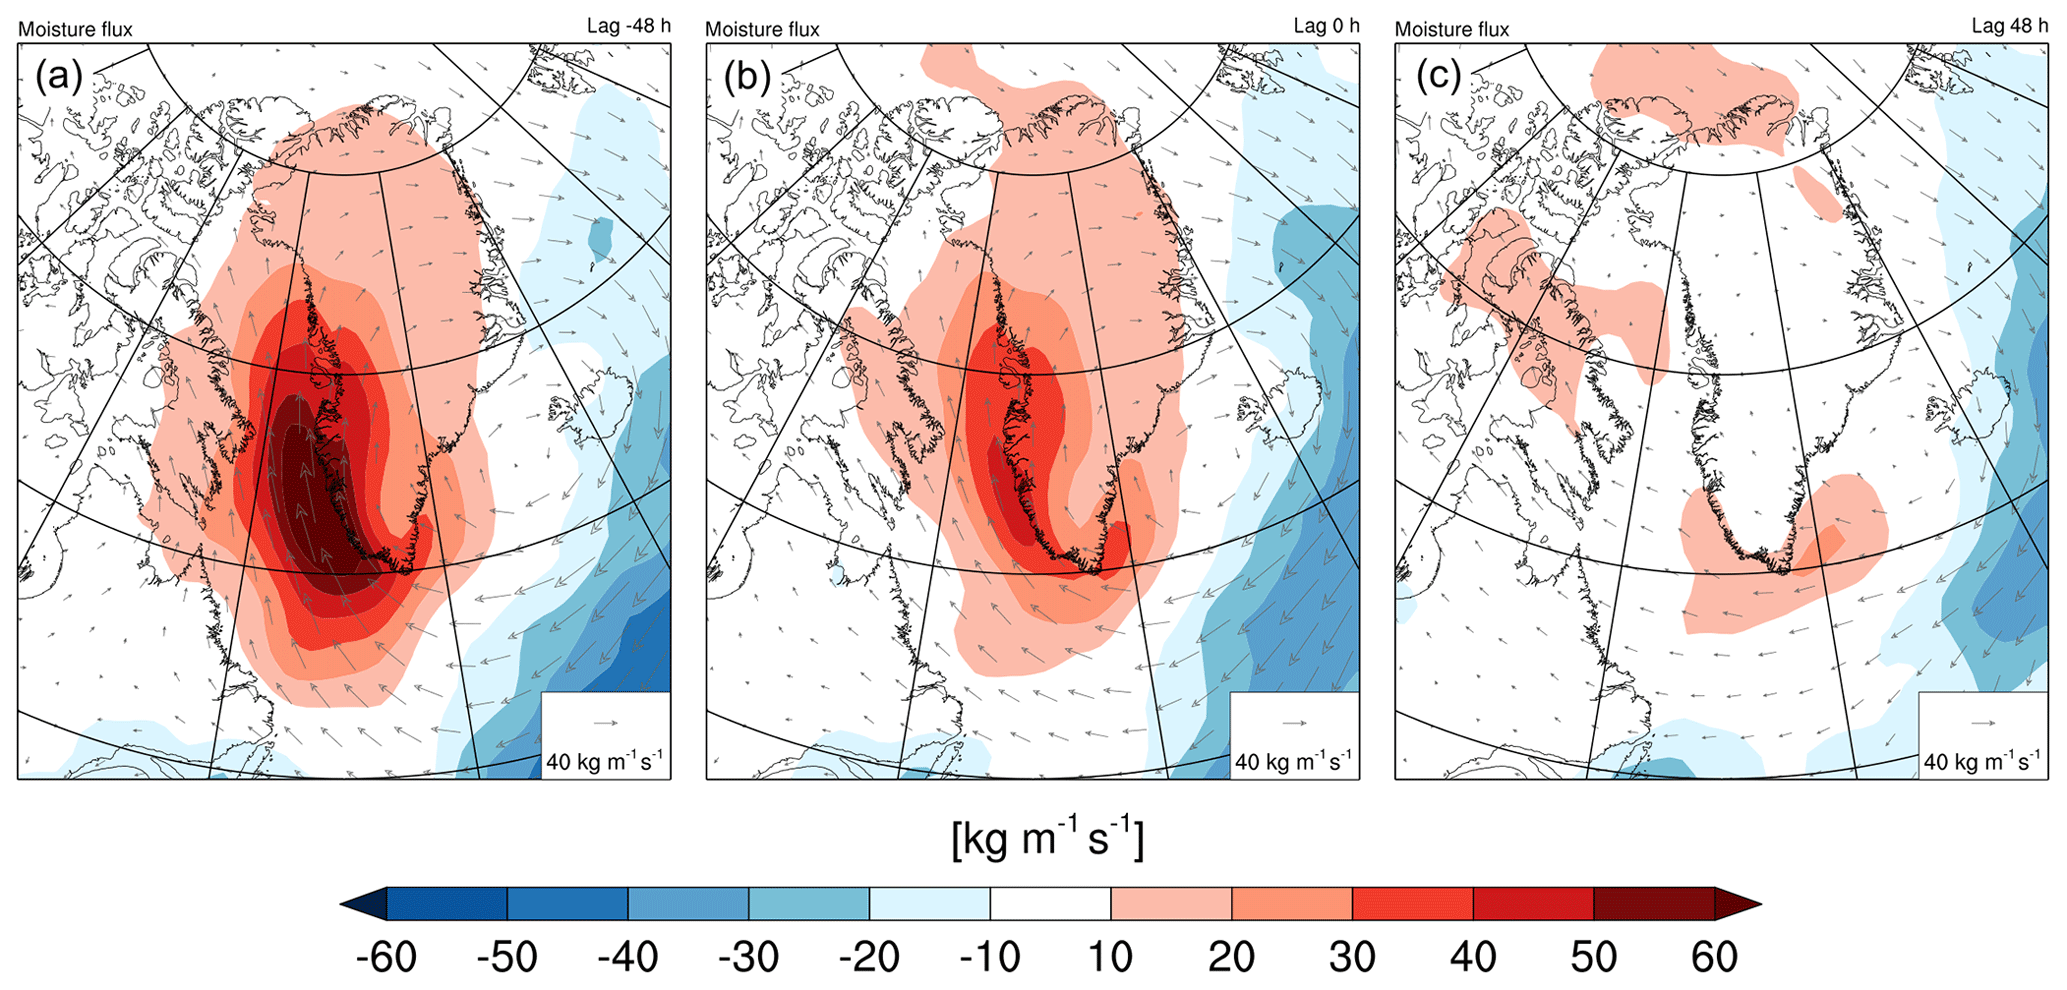
Figure 9Median composites of total column horizontal water vapor transport anomalies (TCVHT′) with respect to climatology for different lags relative to melt event time steps: (a) h, (b) lag=0 h, and (c) h.

This synoptic configuration provides favorable conditions for the poleward advection of warm and moist air masses from lower latitudes towards Greenland (Liu and Barnes, 2015), as reflected in the enhanced total column horizontal water vapor transport (TCVHT) especially along the southwestern GrIS (Fig. 9). The anomalous TCVHT starts over the Labrador Sea several days before the melt event (not shown), and the anomaly increases up to kg m−1 s−1 at h while at the same time reaching the northern and central GrIS (Fig. 9a). The anomaly then gradually fades and vanishes completely in line with the weakening Z500′ after melt events (Fig. 9b and c). The centering of the positive geopotential height anomaly between southeastern Greenland and Iceland instead of over Greenland is a particularly important ingredient for the transport of moist–warm air parcels towards western Greenland and in an arc-shaped anticyclonic flow pattern across northwestern and northern Greenland, as discussed already for EV69.
4.2 Lagrangian forward projection
The analyses presented in the following are analogous to those for EV69 (Sect. 3.2) but now for all 77 large-scale melt events in JJA 1979–2017. Note, however, that melt at the most elevated parts of the GrIS is very rare, which is why the results near Summit strongly resemble those in EV69.
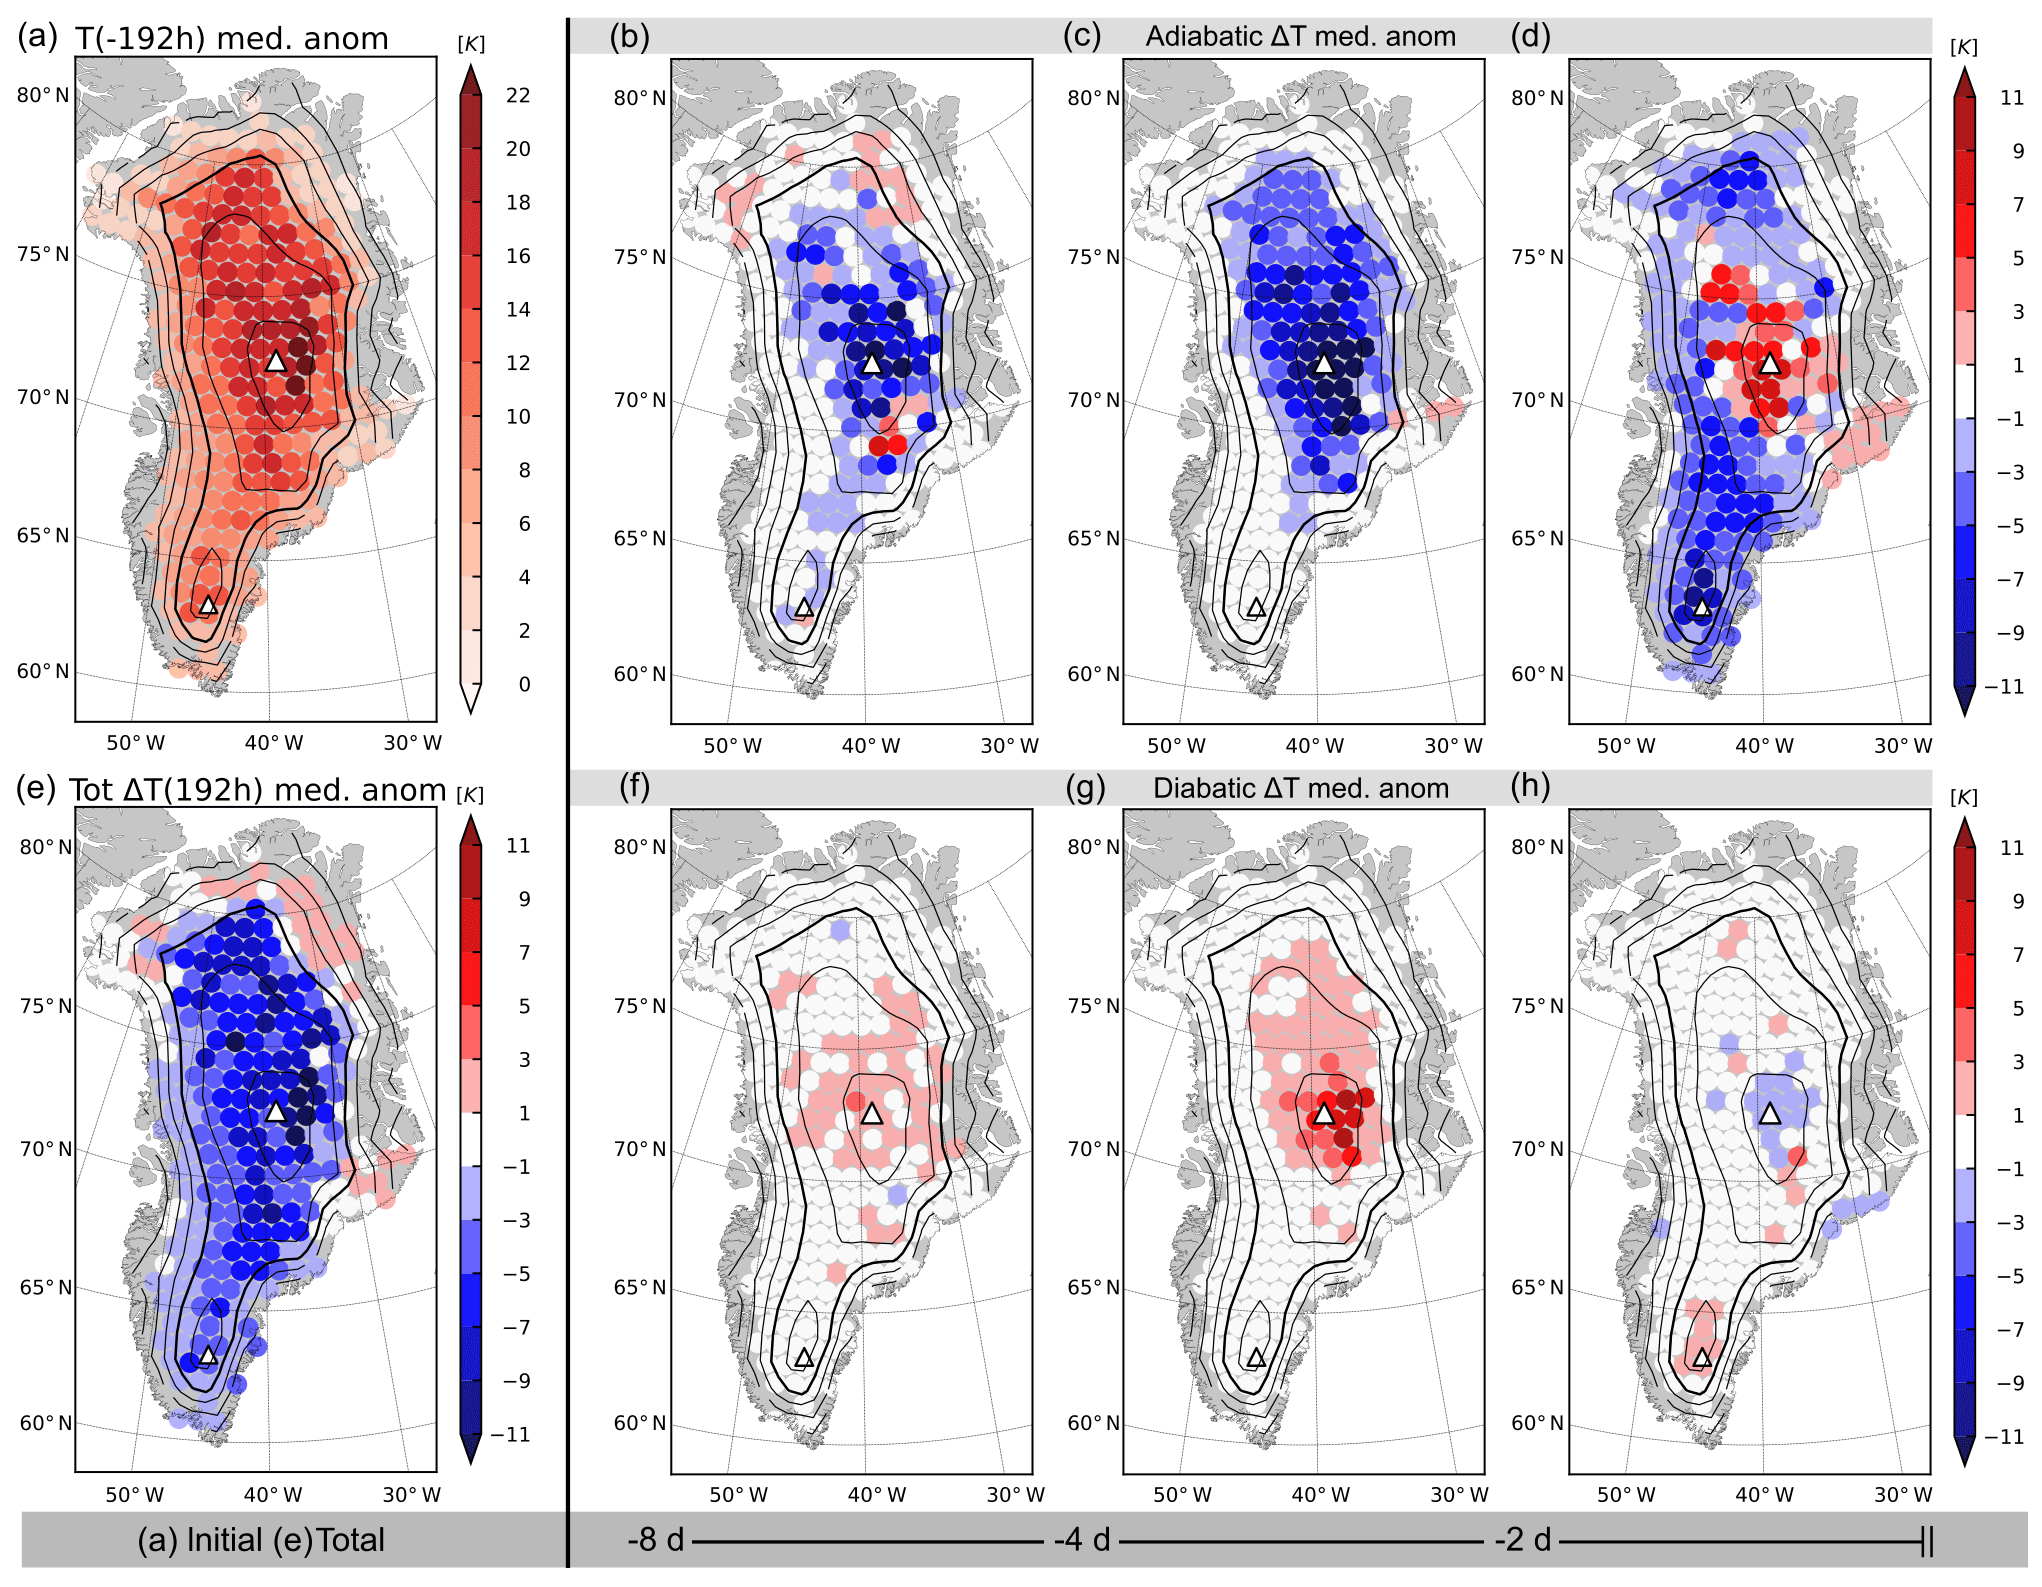
Figure 11As Fig. 5 but for melt trajectories during all large-scale melt events.
4.2.1 Air mass origin
Except for some arriving very high on the GrIS, at h melt air masses are not anomalously warm compared to the local climatology θcl (Fig. S1a). They are, however, located much further south than usual, i.e., in a climatologically warmer region – more so for air masses arriving in region C and N and near South Dome (Fig. 10b). Air masses reaching lower elevations previously move further poleward by 10∘ latitude and inland air masses by up to 26∘ latitude than normal summertime backward trajectories from these locations (Fig. 10a). The primary origin of melt air masses lies southwest of the GrIS, predominantly the Canadian Arctic, but also over the subtropical North Atlantic (Fig. S2). A smaller number of melt air masses approach Greenland from the east, including northern Europe – a rather exceptional transport pattern that reoccurred in summer 2019 with extreme mass loss (Tedesco and Fettweis, 2020). At the same time, the melt trajectories reach lower levels prior to arriving on the GrIS and, therefore, experience less subsidence than climatological air masses (Fig. 10d). Comparing spatial patterns in Fig. 10, we find that air masses ending in regions C, E, N, and S (subfigure in Fig. 2) share very similar transport characteristics as during EV69 (Sect. 3.2). N and S air masses reach the maximum elevation of their entire 8 d trajectory once they reach the GrIS (Fig. 10c). The only melt air masses influenced by anomalously strong descent arrive in region E after – embedded in the anticyclonic flow – crossing the GrIS in an arc-like fashion (Fig. 10d).
4.2.2 Air mass evolution
Due to a climatologically warmer origin (lower elevation and/or lower latitude), melt air masses are at h warmer with respect to the climatological summertime air mass arriving at the same location (Fig. 11a). There are no substantial local temperature anomalies at h (Fig. S1a). Thus, the positive anomalies of 10–20 K in Fig. 11a can be attributed to the unusual origin of air masses. The time series of adiabatic (Fig. 11b–d) and diabatic temperature change anomalies (Fig. 11f–h) along the trajectories during all large-scale melt events look very much like the ones for EV69 (Sect. 3.2). C air masses ascend and cool adiabatically by a larger amount than the climatological air masses between and −48 h (Fig. 11b and c), while at the same time experiencing more diabatic heating (Fig. 11f and g). Furthermore, C and E air masses both show a stronger final descent reflected in enhanced adiabatic warming in the last 2 d (Fig. 11d). Finally, air masses ending in regions N and S ascend more with respect to the climatological summertime air masses within the last 2 d due to their advection towards sloping orography, i.e., south- to northwesterly advection towards region N or southerly advection towards region S (Fig. 11d).
Overall, the anomalies are slightly weaker than for EV69 and show a stronger elevation dependency. Air masses at lower elevation have a thermodynamic history close to that of climatological air masses with slightly enhanced cooling for S and enhanced warming for E and N air masses, respectively (Fig. 11e). In contrast, air masses ending in region C and near South Dome are more strongly cooled adiabatically, which is in part compensated for by enhanced diabatic heating during the above-normal ascent. In total, however, most melt air masses experience stronger anomalous cooling during the 8 d period prior to arrival over the GrIS. As a consequence, only about 50 %–90 % of the higher initial temperature as seen in Fig. 11a remains when the air masses arrive on the GrIS.
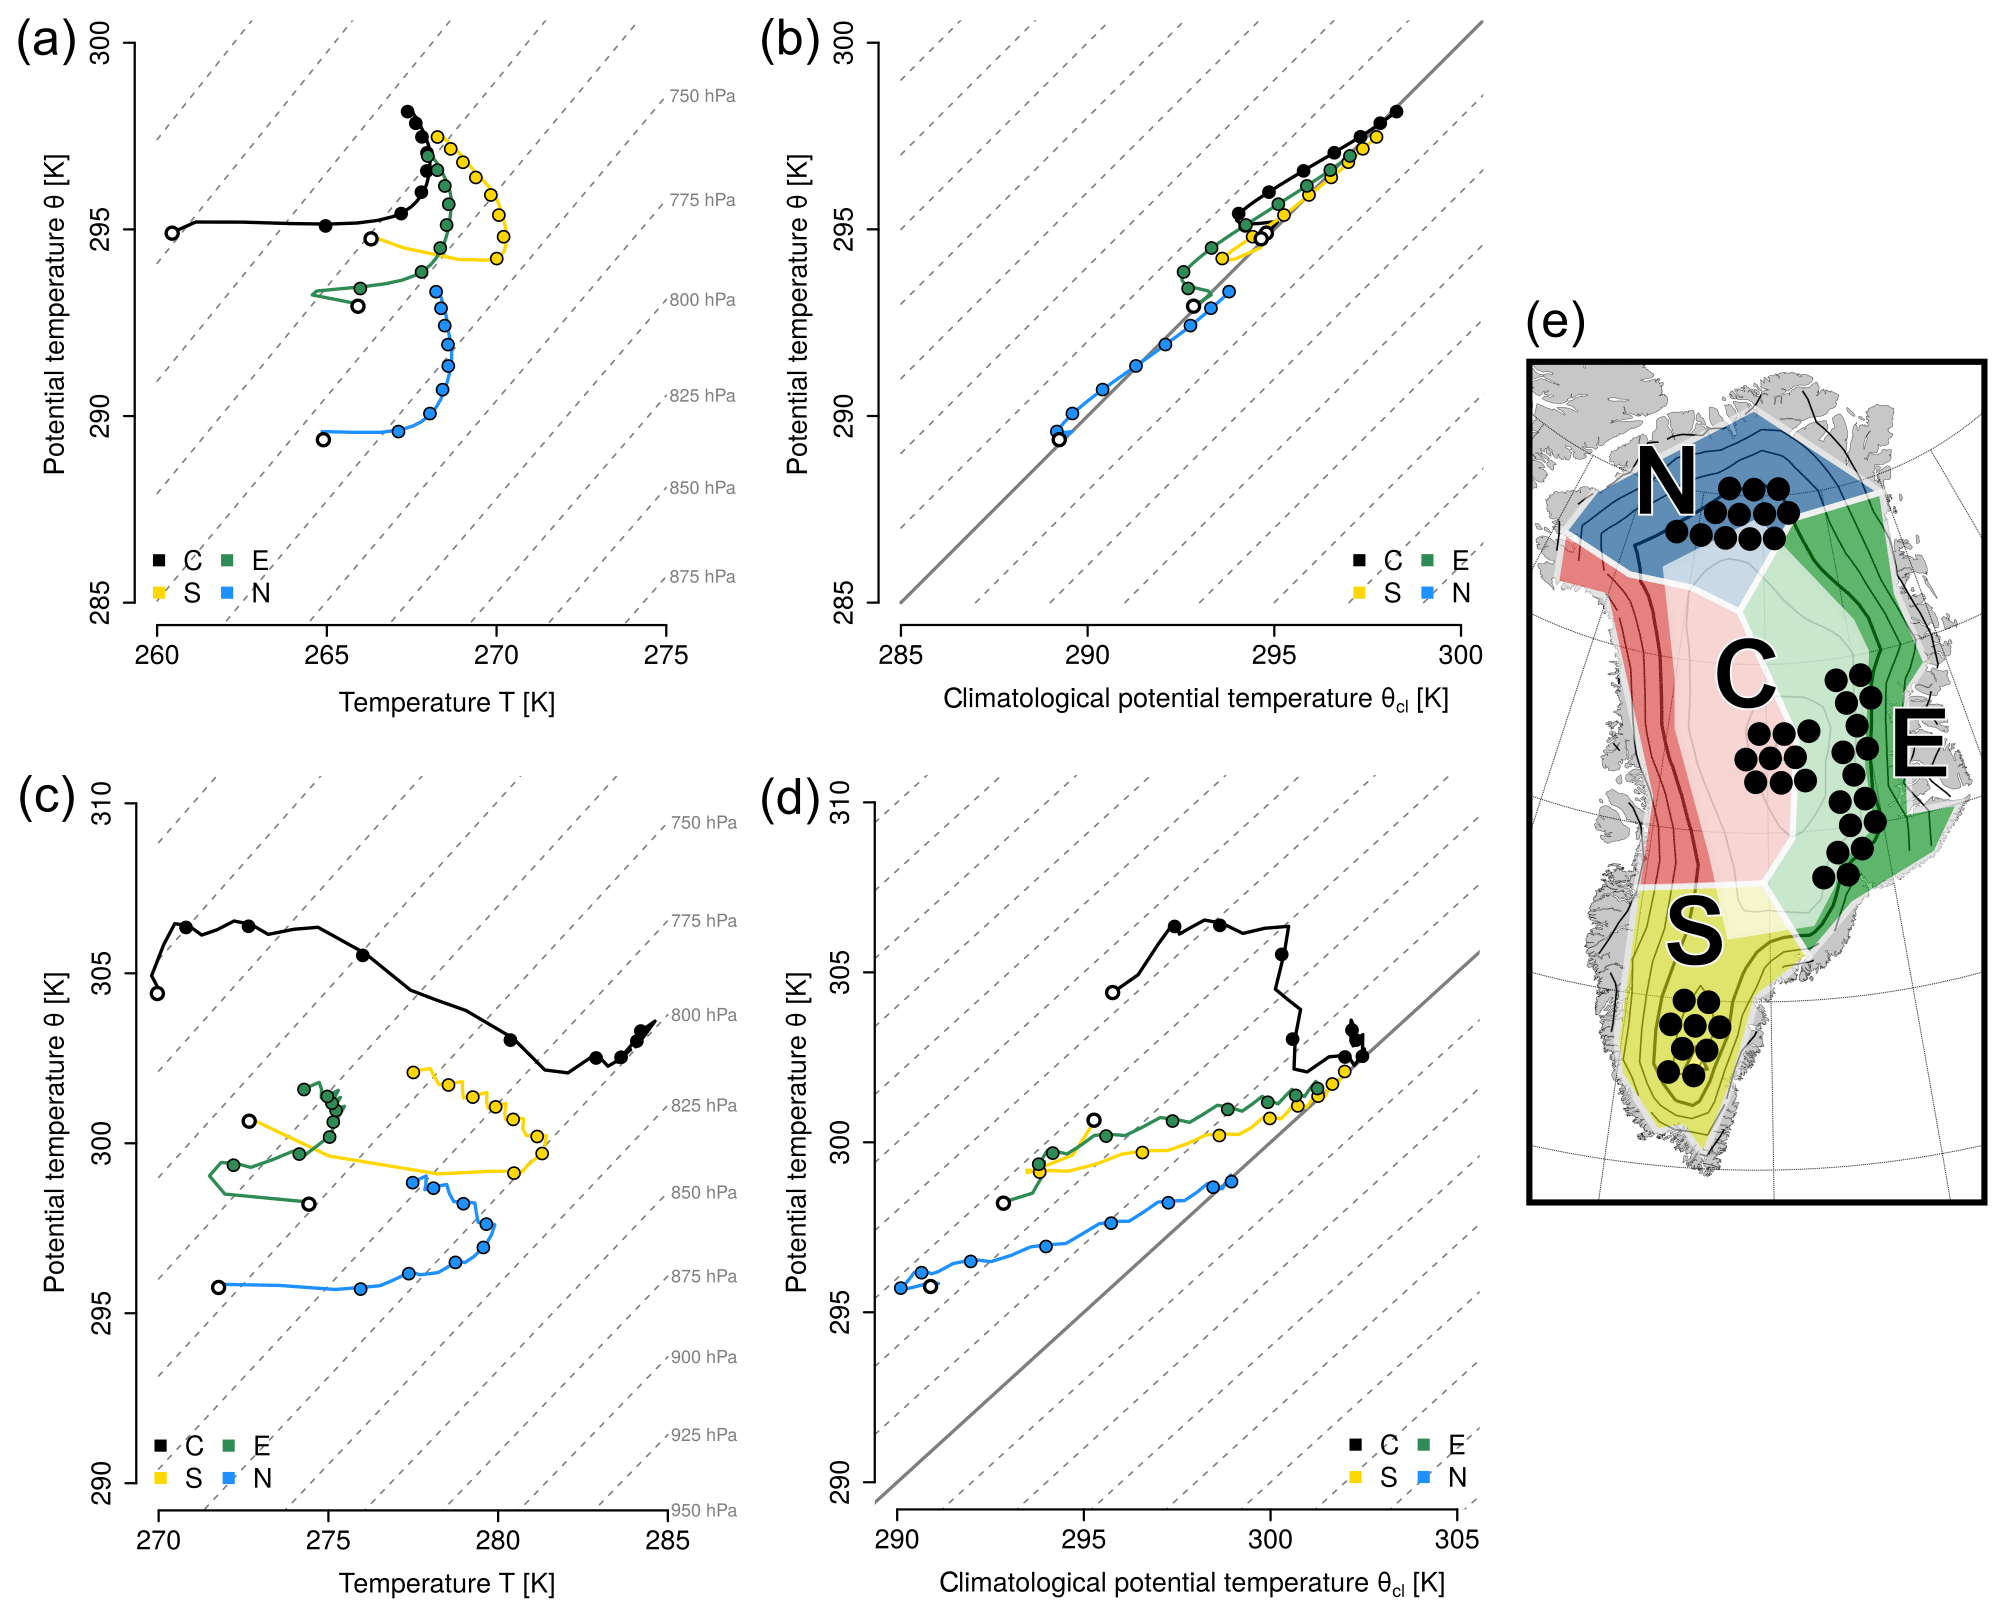
Figure 12Thermodynamic evolution of backward trajectories from selected starting points (see e) representative of regions C, E, S, and N. Shown are medians for each trajectory category, summarized as one air parcel, in (a, c) θ−T and (b, d) θ−θcl space. Grey dashed lines indicate isobars in intervals of 25 hPa (a, c) and isolines of constant potential temperature anomaly in intervals of 2 K (b, d). Panels (a) and (b) represent all climatological summertime air masses, and panels (c) and (d) represent melt air masses only. Circles along the lines indicate time in 24 h intervals, with an empty circle at the trajectory end point at t=0 h. Note that the axis limits of (a)–(d) are not identical.
In line with the characteristic regions shown in Fig. 2 and the spatial patterns identified in Figs. 10 and 11, we select several trajectory starting points between 2000 and 2500 m altitude representative of air masses ending in regions E, S, and N (see Fig. 12e). Furthermore, for region C, we consider melt trajectories arriving above 2500 m altitude. In the following we will consider the evolution of T, θ, and θcl for trajectories arriving in each region. The air masses' evolution in θ−T space (Fig. 12a and c) gives insight into the contributions of adiabatic temperature changes associated with vertical motion (changes along horizontal axis) and diabatic processes (changes along vertical axis). Furthermore, the evolution in θ−θcl space (Fig. 12b and d) indicates when the final potential temperature anomalies emerge, and it reveals the relative importance of transport from climatologically warmer regions towards Greenland (changes along horizontal axis) and diabatic processes (changes along vertical axis). For a more detailed discussion of this type of diagram we refer to Papritz (2020).
The commonalities of all climatological air masses arriving over the GrIS include diabatic (radiative) cooling as well as weak subsidence on the order of 25–50 hPa with associated adiabatic warming during the 8–2 d prior to arrival on the GrIS. This leads to a nearly isothermal temperature evolution in this period (Fig. 12a). Subsidence and poleward motion are both associated with transport from potentially warmer to colder regions. Since this transport occurs at a rate exceeding that of diabatic cooling, the trajectories acquire a weak potential temperature anomaly of +1–2 K until 2 d before arrival on the GrIS (Fig. 12b). Within the last 1 to 2 d, air masses ascend nearly adiabatically to the GrIS, and those arriving in region E additionally descend during the final 12 h (Fig. 12a). During this final period, the potential temperature anomaly fades away, and the climatological air mass arrives on the diagonal in the θ−θcl space (Fig. 12b).
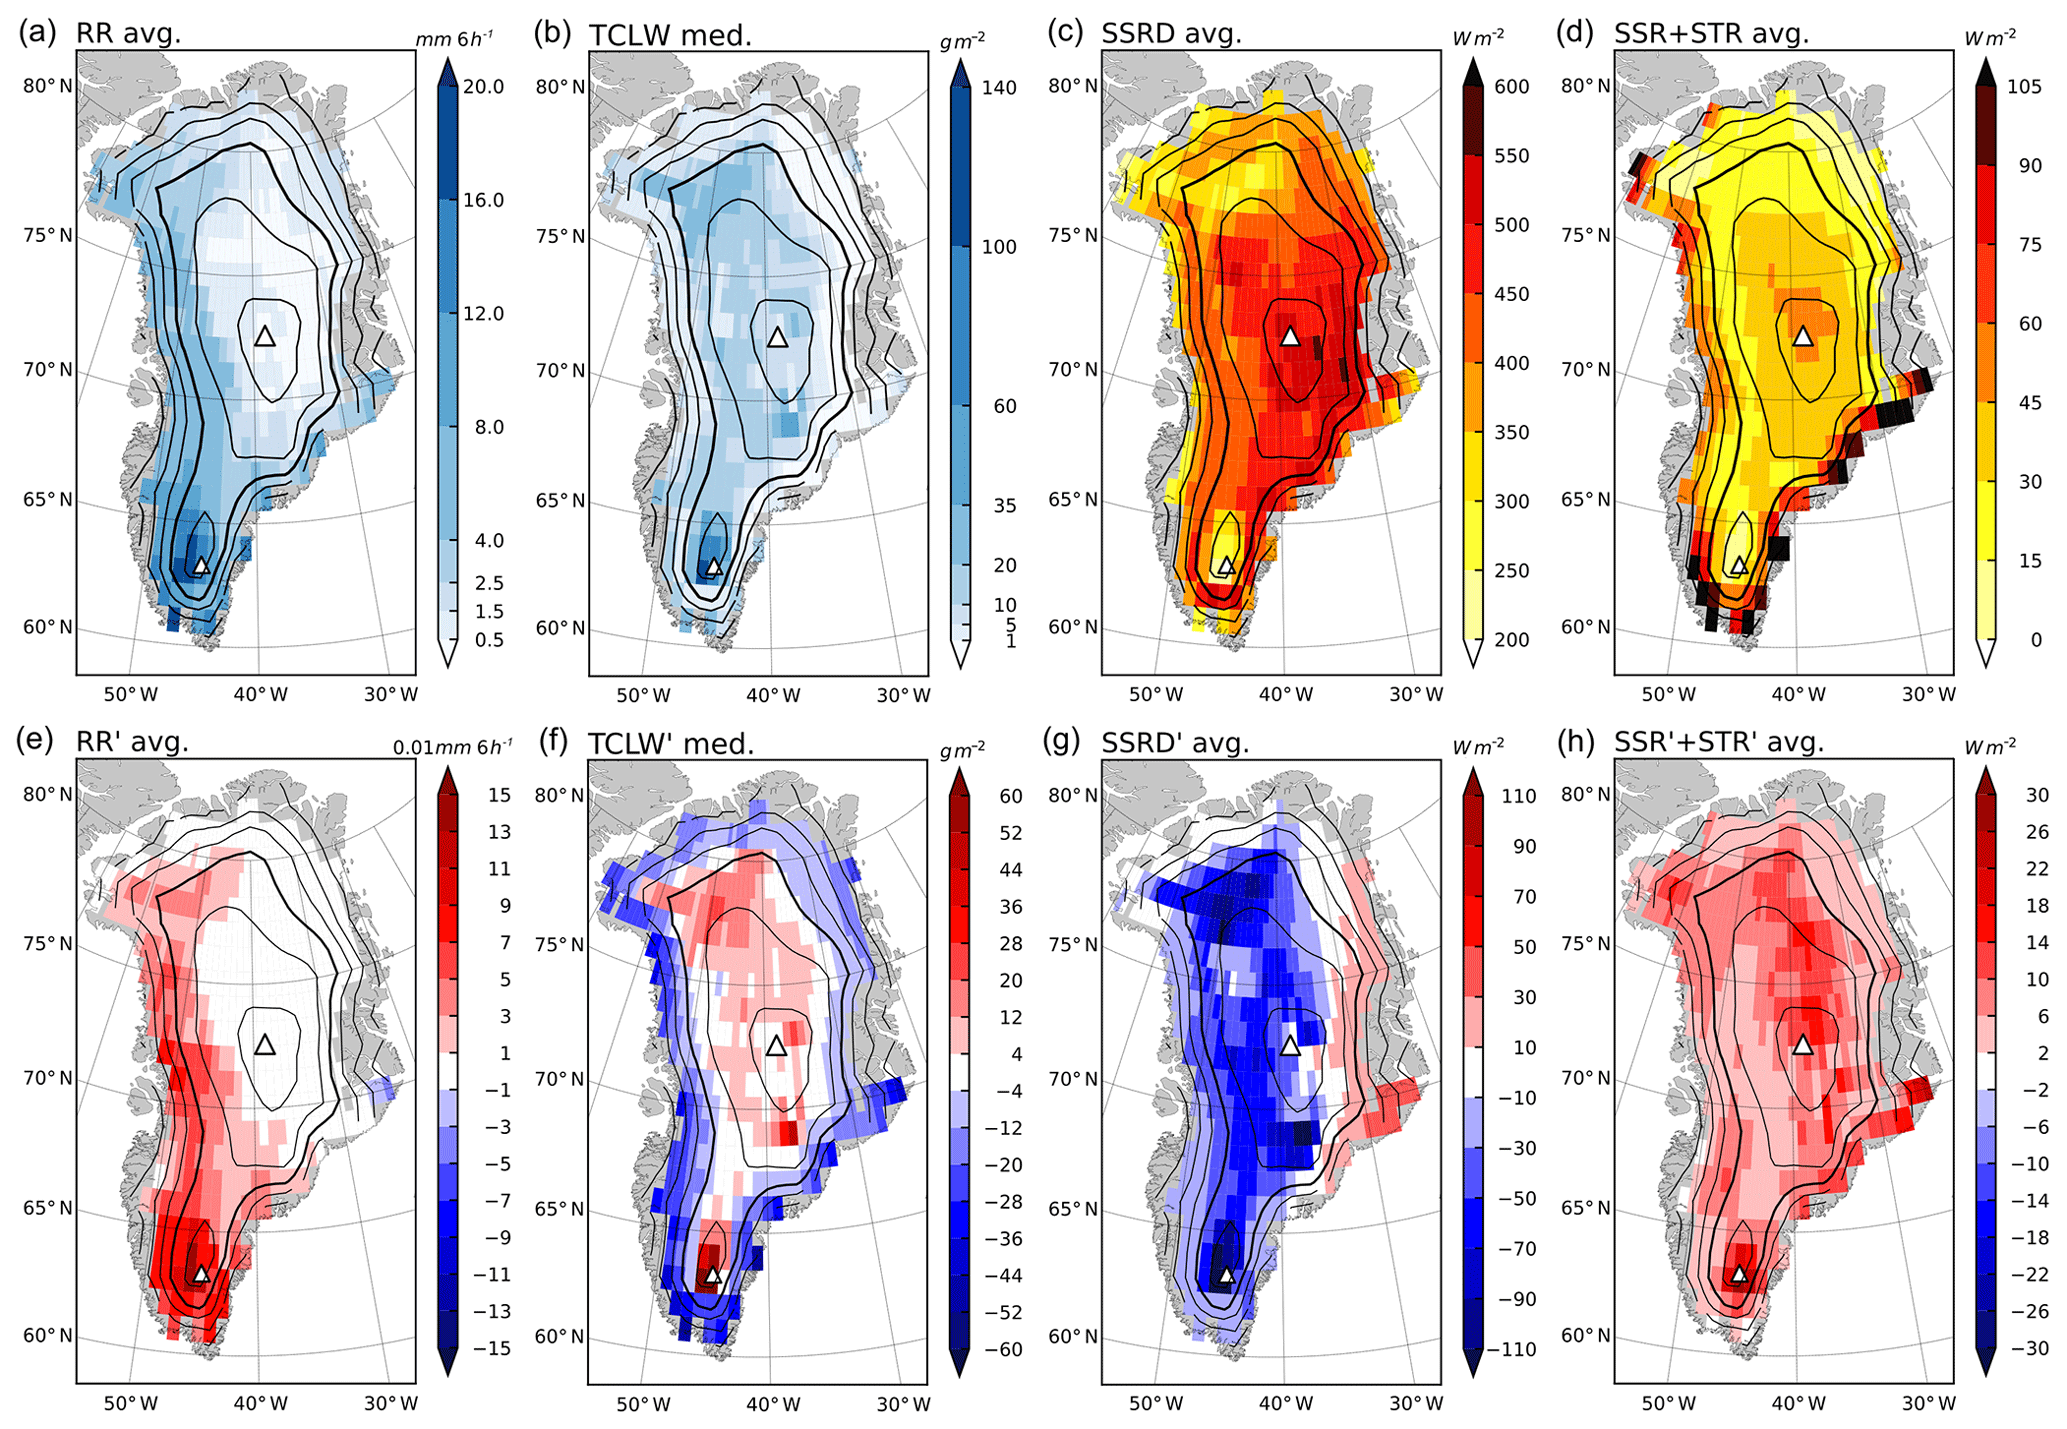
Figure 13As Fig. 7 but for melt trajectories during all large-scale melt events.
Now considering melt air masses, we see that they are initially around 5 K (E) to 18 K (C) warmer and evolve in a distinct way from the climatological summertime air masses (compare Fig. 12a and c). The differences are most striking for C air masses. During the first 4 d, these air masses remain at around 800 hPa (Fig. 12c) with no substantial local potential temperature anomaly (Fig. 12d). Then, within 2 to 3 d, they experience diabatic heating of around 6 K while ascending by nearly 250 hPa (Fig. 12c), and a potential temperature anomaly of more than 7 K forms (Fig. 12d). Note that the formation of the potential temperature anomaly is about equally due to diabatic heating and transport into a climatologically colder region at the beginning and end of the backward trajectories. Overall, C melt air masses experience a strong cooling of 15 K in 8 d, while their potential temperature slightly increases.
In contrast, E, N, and S air masses have an evolution in θ−T space that is more similar to climatological air masses (Fig. 12c). Notable differences include reduced diabatic cooling and larger ascent and an associated decrease in temperature during the final 2 to 3 d, which is consistent with an origin at lower altitudes. Furthermore, the descent of air masses arriving in region E is more pronounced. The decisive difference between melt event air masses and their climatological reference is, therefore, the much higher T and θ values at h. E, N, and S air masses show a similar evolution in θ−θcl space as climatological air parcels, but with a stronger effect of transport that results in final potential temperature anomalies of about +3–5 K (Fig. 12d). The gradual increase in the potential temperature anomalies along with the similar temporal evolution as climatological air masses highlights the importance of the anomalous origin and the enhanced poleward transport for the anomalous nature of melt event air masses.
In summary, we note that air masses associated with melt over the GrIS accumulation zone have no initial potential temperature anomaly, but they originate from climatologically warmer regions further to the south. The atmospheric circulation, characterized by a large positive geopotential anomaly over southeast Greenland, then induces strong poleward transport towards the western GrIS, ascent, and latent heat release. Combined with the warmer origin of air masses, these diabatic temperature modifications are altogether responsible for the anomalously warm nature of the air masses when arriving over the GrIS. The importance of diabatic temperature modifications depends strongly on the altitude of the trajectory arrival position, and the modifications are most important for air masses arriving near Summit.
4.3 Linkage to clouds and radiative effects
As in Sect. 3.3 for EV69, we analyze here the distribution of rainfall, total cloud liquid water, and surface radiation from ERA-Interim at 1∘ horizontal resolution, i.e., being most meaningful over the GrIS accumulation zone (Fig. 13). As for EV69, there is a clear distinction between the regions west of the ice divide (including large parts of regions C, N, and S), which are exposed to the moist–warm anticyclonic inflow, and the eastern GrIS, which is located on the lee side of the of the ice divide and thus is affected to a much smaller degree by the increased total column horizontal water vapor transport (Fig. 9).
On average, more rain falls in regions NW, S, and W (Figs. 13a and e), especially around South Dome, where a strong shift in precipitation from snow to rain occurs (not shown). Everywhere except region E, there is less incoming solar radiation during melt events compared to climatology (Fig. 13g). In fact, in regions above 2000 m this roots in a shift towards higher TCLW, i.e., a phase shift to the liquid regime and potentially also more cloud cover (Fig. 13f). Even though TCLW is reduced at elevations below 2000 m along region W, there is sufficient cloud cover to reduce the incoming shortwave radiation. In contrast, in region E, related to descending air masses, little rain and reduced TCLW are a sign of clear-sky conditions, enabling SSRD to be very close to its maximum for this latitude and time of the year (Fig. 13a, f and g). Furthermore, the median total column water vapor anomaly is positive over the entire GrIS with an area-weighted average of +2.8 kg m−2 (Fig. S4f). Despite the reduction of shortwave radiation west of the divide of the GrIS, the sum of net surface short- and longwave radiation is increased everywhere on the GrIS with an area-weighted average of +7.3 W m−2 (+2.1 cm d−1 melting potential calculated as in Sect. 3.3; Fig. 13h).
To summarize, we find an increase in net surface radiation during large-scale melt events, even though long- and shortwave contributions vary regionally. The ERA-Interim-derived results are, however, representative of the bright GrIS accumulation zone only. The warm–moist anticyclonic flow conditions relate to an increase in downward longwave radiation by on average +35.6 W m−2. In the upper accumulation zone, where the cloud water phase is shifted with respect to climatology, this anomaly peaks at +99.6 W m−2 near South Dome (Fig. S4h). Our findings underline the importance of longwave radiative forcing – initially induced by meridional moisture transport – for melt events affecting large parts of the GrIS accumulation zone (Fig. 9), as previously highlighted by Mattingly et al. (2016), Van Tricht et al. (2016), Wang et al. (2019), Hofer et al. (2019), and Izeboud et al. (2020).
5.1 Large-scale Greenland melt events
We found 77 large-scale Greenland melt events during JJA 1979–2017 of more than 1 d duration (question Q1, Sect. 1) by identifying melt of the Greenland Ice Sheet (GrIS) with a skin temperature ∘C from ERA-Interim data together with an elevation- and extent-based selection criterion (Sect. 2.2). These events became 60 % more frequent and on average about 2 d longer between the reference periods “recent past” (1986–2005) and “present day” (2005–2015) of the IPCC Special Report on the Ocean and Cryosphere in a Changing Climate (SROCC; Mintenbeck et al., 2020). Melt events longer than 10 d, unprecedented in the recent past, accounted for 18 % of the present day melt events. Obviously, these trends follow from global warming (Johannessen et al., 2004), characterized by a pronounced warming in the Arctic (e.g., Serreze and Barry, 2011), and large-scale melt events are expected to cover the entire ice sheet in the near future (Box et al., 2012). However, it is interesting to briefly discuss the importance of climate warming as compared to circulation-induced warming for the occurrence and spatial extent of melt events.
The JJA near-surface potential temperature (θ10 m) correlates well (r=0.66) with the cumulative melt extent (CME) obtained from accumulating melt extent over all melt event time steps (see Sect. 2.2) in a given summer (Fig. 14a). This is especially noteworthy considering the asymmetry of the CME time series, which only varies in the presence of melt events but not when they are absent (i.e., CME ≥ 0). Despite the higher correlation of CME with climate warming (r=0.57; Fig. 14b), there is a clear relationship between the seasonal circulation-induced θ10 m anomaly and CME (r=0.41; Fig. 14c). Circulation can amplify warming by a factor of 2, e.g., in summers 2010 and 2012, which belonged to the series of summers with persistent NAO−/GBI+ summer circulation anomalies (Fettweis et al., 2013b; Hanna et al., 2018). Likewise, circulation can also offset climate warming such as in summers 2009 and 2015. The exceptional melt event EV69, discussed here as a case study, was part of – and contributing to – the warmest summer on record (2012; K). EV69 is a textbook example of a large-scale melt event as most of the general dynamical and thermodynamic characteristics of melt events were strongly pronounced.
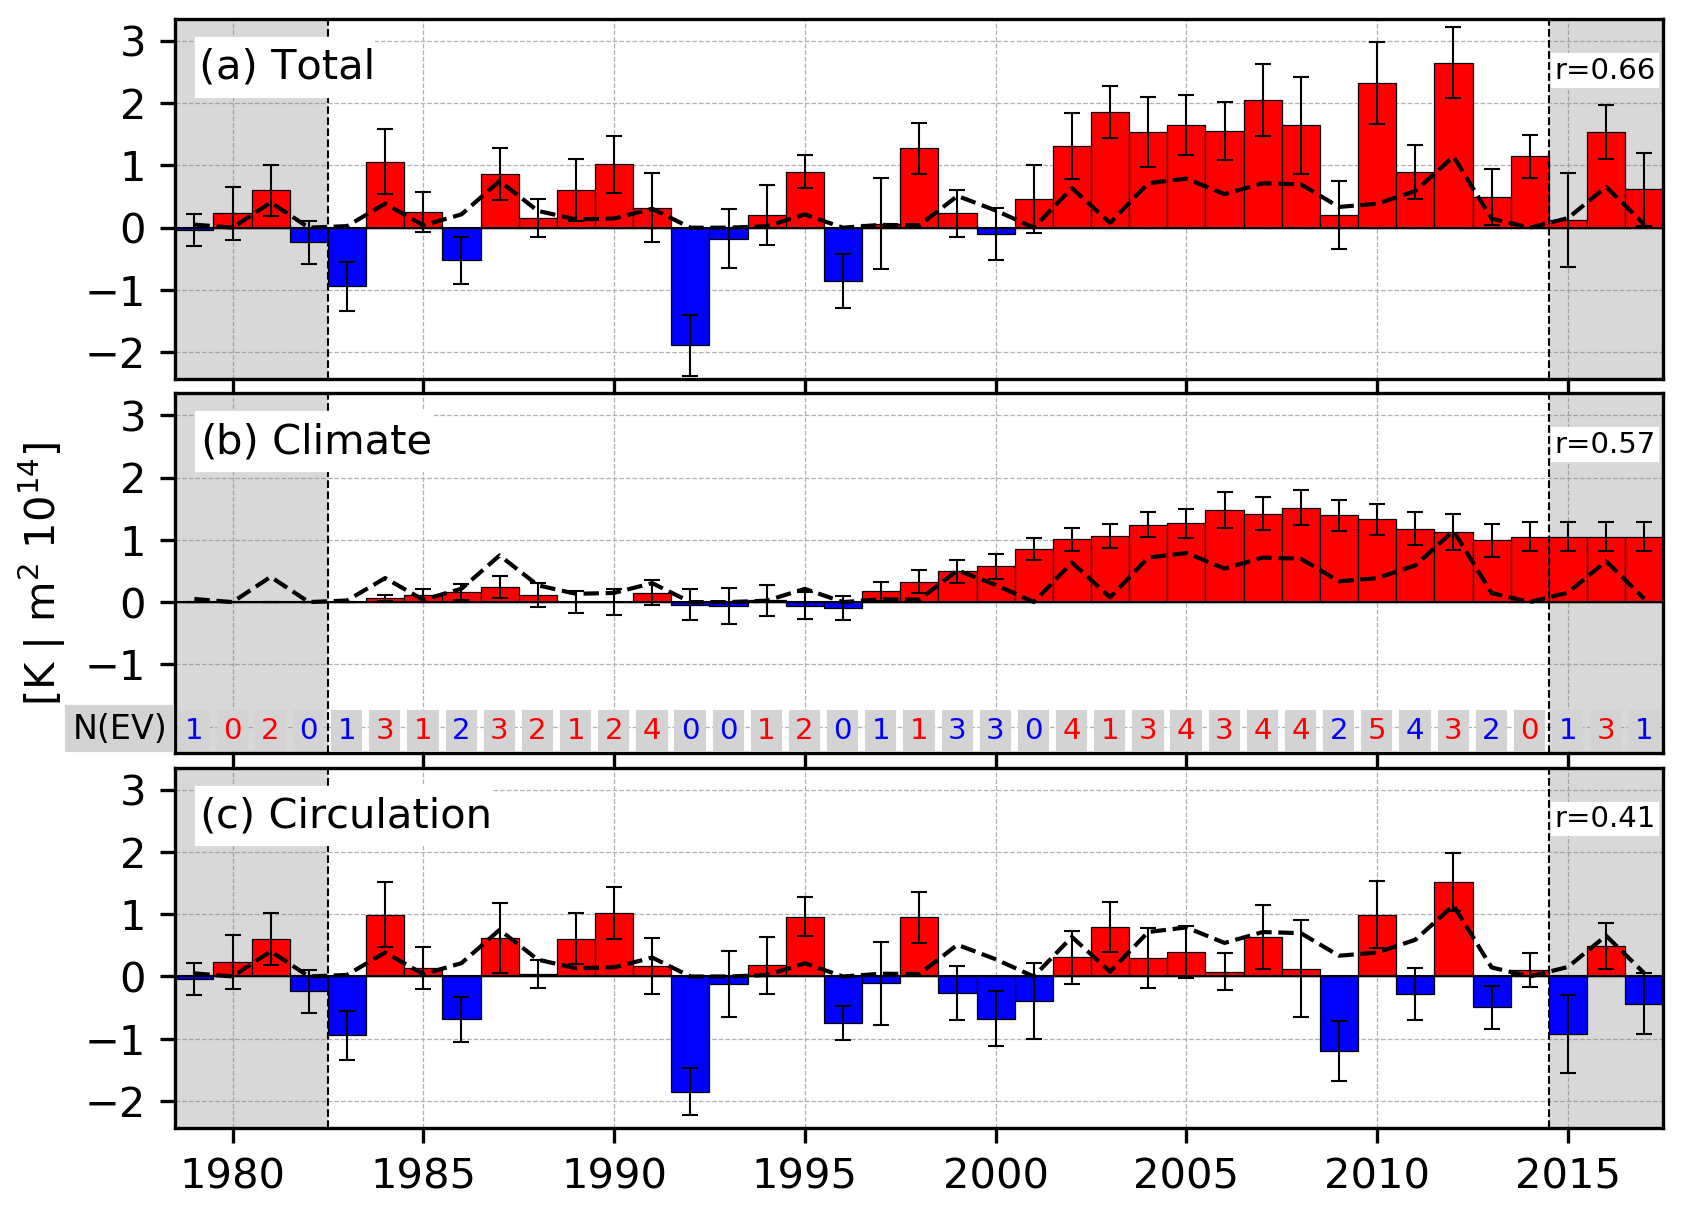
Figure 14A time series of the (a) total, (b) climatological (9-year centered running mean), and (c) circulation-induced (i.e., total minus climatological) near-surface potential temperature anomaly, , temporally averaged over JJA and spatially (standard deviation shown by whiskers) over the GrIS. The time series are shown with respect to the climatology at the beginning of the time series (1979/1983), and their correlation with the cumulative melt extent during melt events (dashed line) is given in the upper right of each panel. Numbers in panel (b) indicate the number of large-scale melt events in this summer, colored according to (c). Due to the running mean used in (b), the decomposition of the temperature anomaly shown in (b) and (c) is only meaningful in the period 1983–2014.
5.2 Large-scale air mass transport and transformations contributing to melt events
The most prominent synoptic characteristic of large-scale melt events is an upper-level ridge or tropospheric cutoff with its center located southeast of Greenland (Q2, Sect. 1). Despite the anomalously strong final descent of air masses arriving in central and eastern Greenland during these events, large-scale subsidence and adiabatic warming within the anticyclonic flow anomaly are of very little importance for the identified melt events. This is opposed to lower-tropospheric warm extremes in the central Arctic (Binder et al., 2017; Papritz, 2020) and in midlatitude heat waves (Bieli et al., 2015; Zschenderlein et al., 2019). The location of the geopotential height anomaly southeast of Greenland is favorable for inducing a southerly flow and enhanced total column horizontal water vapor transport to the west and towards the southern tip of Greenland. As these air masses impinge on Greenland's orography, they are forced to ascend, accompanied by cloud formation and precipitation, subsequently followed by anticyclonic transport across the GrIS and eventually descent along the eastern slope of the ice sheet.
The two most important processes contributing to the warm anomaly of air masses of large-scale melt events are the following (Q3, Sect. 1).
-
Transport. Melt event air masses originate from a region that is 15 K warmer than climatological air masses. However, at their origin 8 d prior to arrival in Greenland, melt event air masses are not generally anomalously warm. Hence, it is their origin at lower latitude and/or lower altitude and the subsequent rapid meridional transport of up to 40∘ latitude that are decisive for their final temperature anomaly. During transport to the GrIS accumulation zone, the melt air masses cool more than usual, i.e., by ∼15 K, which keeps those arriving closest to the surface just above the critical threshold to induce melt. As we found, the warm anomaly associated with air masses that arrived near Summit during EV69 arose due to strong meridional transport to Greenland and did not result from a preexisting warm anomaly such as that associated with a heat wave in the Great Plains of North America (Hoerling et al., 2014; Neff et al., 2014; Bonne et al., 2015).
-
Latent heat release. As the GrIS has an average elevation of more than 2000 m, airstreams ascend either dynamically or orographically along their 8 d trajectory. This ascent occurs at the poleward edge of a band of prominent horizontal moisture transport. Latent heat release during ascent and, consequently, cloud formation is contributing substantially to the final warm anomaly of air masses arriving over the accumulation zone. Both processes, meridional transport and latent heating, are most pronounced for the upper accumulation zone, i.e., the central GrIS. The higher in the GrIS accumulation zone air masses arrive, the warmer and more southerly is their region of origin, and the more the experienced diabatic warming and adiabatic cooling deviates from the climatological summertime air parcel (Q4, Sect. 1). Melt air masses of the northern and southern GrIS undergo ascent later along their 8 d trajectory and have an origin at lower levels than air masses of the central GrIS.
5.3 Air mass impact on the GrIS
We specifically investigated the air mass history and the related near-surface conditions during large-scale melt events, which affect large parts of the GrIS accumulation zone (Sect. 2.2). During such events, total column water vapor is increased, associated with an enhanced poleward moisture transport and with a phase change of cloud water and precipitation from ice to liquid. The latter forms where airstreams ascend over the southern tip of Greenland, along the west coast, as well as in the north of the GrIS (Q3, Sect. 1). Therefore, the incident shortwave radiation is reduced over the western and central GrIS, while the opposite applies for the clear-sky regions east of the ice divide. The net surface radiation anomaly is positively contributing to surface melt over the entire GrIS accumulation zone and is only in the very east dominated by shortwave radiation. In contrast, the enhanced liquid water content in the south, west, and north of the GrIS accumulation zone causes an anomalously strong longwave radiative forcing, relating to the net cloud warming observed in these regions (Wang et al., 2019). This is a key process for surface melt in the GrIS accumulation zone and the remaining Arctic (Mortin et al., 2016; Lee et al., 2017), and enhanced poleward moisture transport improves the simulation of Arctic clouds and near-surface temperature (Baek et al., 2020). The dynamical and thermodynamic characteristics of melt event air masses found here confirm the importance of poleward moisture transport as a result of the long-range transport of air masses from the south towards Greenland for (i) inducing latent heating along the trajectory and (ii) causing a positive cloud radiative effect over the GrIS accumulation zone.
Over the low-albedo-ablation zone, where the majority of GrIS surface mass loss occurs, the cloud radiative effect is typically cooling as shortwave radiation drives surface melt via the more efficient albedo–melt feedback (Hofer et al., 2017; Izeboud et al., 2020). While ERA-Interim is able to reproduce the warming cloud radiative effect over the accumulation zone during summer (Wang et al., 2019), the ablation zone is insufficiently represented in our data set and, therefore, precluded from the analysis. First and foremost, an accurate representation of the low ablation area albedo in summer (0.3–0.5) would be crucial to determine the surface melt resulting from the synoptic forcing during melt events (Izeboud et al., 2020). Also, the steep topography of the 20–100 km wide ablation zone is not resolved in ERA-Interim (∼100 km grid spacing). There, the impact of the presented melt air masses could in future work be studied with regional climate models such as MAR (Fettweis et al., 2017) or RACMO (Noël et al., 2016), which are run on the kilometer-scale including more sophisticated surface schemes. Also, the latest generation of reanalysis data, ERA5, with 0.5∘ horizontal resolution improves the simulated near-surface climate over Greenland to some degree (Delhasse et al., 2020).
5.4 Importance of upper-tropospheric ridges
As the atmospheric dynamics is found to be the key driver of large-scale melt events, the understanding of upper-tropospheric ridges and blocks and their development and lifespan is highly relevant to Greenland's climate, GrIS mass loss (Hanna et al., 2014; Van den Broeke et al., 2017), and global sea level rise (van den Broeke et al., 2016; Box et al., 2018). The dynamical understanding of blocks (Pfahl et al., 2015; Steinfeld and Pfahl, 2019) and heat-extreme-related upper-tropospheric ridges (Zschenderlein et al., 2020) now includes the important role of upstream latent heating for establishing and maintaining the negative potential vorticity anomalies in the upper troposphere. The representation of those processes in climate models is still uncertain. More generally, global climate models are not yet able to capture the strong and persistent NAO-circulation anomalies of recent years (Fettweis et al., 2013a, b). If these changes are the result of natural variability, long-term trends predicted by the models could still be trustworthy, as the model performance may mainly be limited by the internal variability of the climate system (Fischer et al., 2013; Knutti and Sedláček, 2013). In the long run, Greenland blocking is not predicted to change significantly towards the end of this century (e.g., Gillett and Fyfe, 2013). If, however, the current decrease in summer NAO is a manifestation of systematic circulation changes associated with global warming, the ability of today's climate models to simulate future trends in the North Atlantic circulation is questionable, and GrIS mass loss at the end of this century could be underestimated by a factor of 2 (Delhasse et al., 2018). Given the importance of upper-tropospheric ridges and blocks, and associated transport of moist–warm air for large-scale melt events, future work should, therefore, focus on their representation, life cycle, and trends in climate models.
All results are based on ERA-Interim data, which can be downloaded from ECMWF (https://apps.ecmwf.int/datasets/data/interim-full-daily/levtype=sfc/, last access: 24 September 2020) (European Centre for Medium Range Weather Forecasts, 2020) and analyzed with two additional tools: LAGRANTO (Wernli and Davies, 1997; Sprenger and Wernli, 2015) and clim-ei (Sprenger et al., 2017). Scripts used for the analyses and plotting, mostly written in Python 3.7, are available on request from the authors.
The supplement related to this article is available online at: https://doi.org/10.5194/wcd-1-497-2020-supplement.
The authors declare that they have no conflict of interest.
We thank the reviewers Xavier Fettweis and Stefan Hofer for their constructive feedback on the first version of the manuscript. We acknowledge the ECMWF for providing access to ERA-Interim data and Michael Sprenger (ETH Zurich) for technical support with the LAGRANTO and clim-ei tool.
This research has been partially supported by the European Research Council (grant no. 787652).
This paper was edited by Helen Dacre and reviewed by Stefan Hofer and Xavier Fettweis.
Andersen, M. L., Stenseng, L., Skourup, H., Colgan, W., Khan, S. A., Kristensen, S. S., Andersen, S. B., Box, J. E., Ahlstrøm, A. P., Fettweis, X., and Forsberg, R.: Basin-scale partitioning of Greenland ice sheet mass balance components (2007–2011), Earth Planet. Sc. Lett., 409, 89–95, https://doi.org/10.1016/j.epsl.2014.10.015, 2015. a
Baek, E.-H., Kim, J.-H., Park, S., Kim, B.-M., and Jeong, J.-H.: Impact of poleward heat and moisture transports on Arctic clouds and climate simulation, Atmos. Chem. Phys., 20, 2953–2966, https://doi.org/10.5194/acp-20-2953-2020, 2020. a
Bennartz, R., Shupe, M. D., Turner, D. D., Walden, V. P., Steffen, K., Cox, C. J., Kulie, M. S., Miller, N., and Pettersen, C.: July 2012 Greenland melt extent enhanced by low-level liquid clouds, Nature, 496, 83–86, https://doi.org/10.1038/nature12002, 2013. a, b, c, d
Bieli, M., Pfahl, S., and Wernli, H.: A Lagrangian investigation of hot and cold temperature extremes in Europe, Q. J. Roy. Meteorol. Soc., 141, 98–108, https://doi.org/10.1002/qj.2339, 2015. a, b, c
Binder, H., Boettcher, M., Grams, C. M., Joos, H., Pfahl, S., and Wernli, H.: Exceptional air mass transport and dynamical drivers of an extreme wintertime Arctic warm event, Geophys. Res. Lett., 44, 12028–12036, https://doi.org/10.1002/2017GL075841, 2017. a
Bonne, J.-L., Steen-Larsen, H. C., Risi, C., Werner, M., Sodemann, H., Lacour, J.-L., Fettweis, X., Cesana, G., Delmotte, M., Cattani, O., Vallelonga, P., Kjær, H. A., Clerbaux, C., Sveinbjörnsdóttir, A. E., and Masson‐Delmotte, V.: The summer 2012 Greenland heat wave: In situ and remote sensing observations of water vapor isotopic composition during an atmospheric river event, J. Geophys. Res.-Atmos., 120, 2970–2989, https://doi.org/10.1002/2014JD022602, 2015. a, b, c, d
Box, J. E., Bromwich, D. H., and Bai, L. S.: Greenland ice sheet surface mass balance 1991–2000: Application of Polar MM5 mesoscale model and in situ data, J. Geophys. Res.-Atmos., 109, D16105, https://doi.org/10.1029/2003JD004451, 2004. a
Box, J. E., Fettweis, X., Stroeve, J. C., Tedesco, M., Hall, D. K., and Steffen, K.: Greenland ice sheet albedo feedback: thermodynamics and atmospheric drivers, The Cryosphere, 6, 821–839, https://doi.org/10.5194/tc-6-821-2012, 2012. a
Box, J. E., Colgan, W. T., Wouters, B., Burgess, D. O., O'Neel, S., Thomson, L. I., and Mernild, S. H.: Global sea-level contribution from Arctic land ice: 1971–2017, Environ. Res. Lett., 13, 125012, https://doi.org/10.1088/1748-9326/aaf2ed, 2018. a, b
Cavallo, S. M. and Hakim, G. J.: Physical mechanisms of tropopause polar vortex intensity change, J. Atmos. Sci., 70, 3359–3373, https://doi.org/10.1175/JAS-D-13-088.1, 2013. a
Chen, L., Fettweis, X., Knudsen, E. M., and Johannessen, O. M.: Impact of cyclonic and anticyclonic activity on Greenland ice sheet surface mass balance variation during 1980–2013, Int. J. Climatol., 36, 3423–3433, https://doi.org/10.1002/joc.4565, 2016. a
Dee, D. P., Uppala, S. M., Simmons, A. J., Berrisford, P., Poli, P., Kobayashi, S., Andrae, U., Balmaseda, M. A., Balsamo, G., Bauer, P., Bechtold, P., Beljaars, A. C. M., van de Berg, L., Bidlot, J., Bormann, N., Delsol, C., Dragani, R., Fuentes, M., Geer, A. J. L. H., Healy, S. B., Hersbach, H., Hólm, E. V., Isaksen, L., Kållberg, P., Köhler, M., Matricardi, M., McNally, A. P., Monge‐Sanz, B. M., Morcrette, J.-J., Park, B.-K., Peubey, C., de Rosnay, P., Tavolato, C., Thépaut, J.-N., and Vitart, F.: The ERA-Interim reanalysis: Configuration and performance of the data assimilation system, Q. J. Roy. Meteorol. Soc., 137, 553–597, https://doi.org/10.1002/qj.828, 2011. a
Delhasse, A., Fettweis, X., Kittel, C., Amory, C., and Agosta, C.: Brief communication: Impact of the recent atmospheric circulation change in summer on the future surface mass balance of the Greenland Ice Sheet, The Cryosphere, 12, 3409–3418, https://doi.org/10.5194/tc-12-3409-2018, 2018. a
Delhasse, A., Kittel, C., Amory, C., Hofer, S., van As, D., S. Fausto, R., and Fettweis, X.: Brief communication: Evaluation of the near-surface climate in ERA5 over the Greenland Ice Sheet, The Cryosphere, 14, 957–965, https://doi.org/10.5194/tc-14-957-2020, 2020. a
Ding, Q., Schweiger, A., L'Heureux, M., Battisti, D. S., Po-Chedley, S., Johnson, N. C., Blanchard-Wrigglesworth, E., Harnos, K., Zhang, Q., Eastman, R., and Steig, E. J.: Influence of high-latitude atmospheric circulation changes on summertime Arctic sea ice, Nat. Clim. Change, 7, 289–295, https://doi.org/10.1038/nclimate3241, 2017. a
Doyle, S. H., Hubbard, A., van de Wal, R. S. W., Box, J. E., van As, D., Scharrer, K., Meierbachtol, T. W., Smeets, P. C. J. P., Harper, J. T., Johansson, E., Mottram, R. H., Mikkelsen, A. B., Wilhelms, F., Patton, H., Christoffersen, P., and Hubbard, B.: Amplified melt and flow of the Greenland ice sheet driven by late-summer cyclonic rainfall, Nat. Geosci., 8, 647–653, https://doi.org/10.1038/ngeo2482, 2015. a
Enderlin, E. M., Howat, I. M., Jeong, S., Noh, M. J., Van Angelen, J. H., and Van Den Broeke, M. R.: An improved mass budget for the Greenland ice sheet, Geophys. Res. Lett., 41, 866–872, https://doi.org/10.1002/2013GL059010, 2014. a
European Centre for Medium Range Weather Forecasts: ERA-Interim, available at: https://apps.ecmwf.int/datasets/data/interim-full-daily/levtype=sfc/, last access: 24 September 2020. a
Fausto, R. S., van As, D., Box, J. E., Colgan, W., Langen, P. L., and Mottram, R. H.: The implication of nonradiative energy fluxes dominating Greenland ice sheet exceptional ablation area surface melt in 2012, Geophys. Res. Lett., 43, 2649–2658, https://doi.org/10.1002/2016GL067720, 2016. a, b
Fettweis, X., Franco, B., Tedesco, M., van Angelen, J. H., Lenaerts, J. T. M., van den Broeke, M. R., and Gallée, H.: Estimating the Greenland ice sheet surface mass balance contribution to future sea level rise using the regional atmospheric climate model MAR, The Cryosphere, 7, 469–489, https://doi.org/10.5194/tc-7-469-2013, 2013a. a, b, c
Fettweis, X., Hanna, E., Lang, C., Belleflamme, A., Erpicum, M., and Gallée, H.: Brief communication “Important role of the mid-tropospheric atmospheric circulation in the recent surface melt increase over the Greenland ice sheet”, The Cryosphere, 7, 241–248, https://doi.org/10.5194/tc-7-241-2013, 2013b. a, b, c, d, e
Fettweis, X., Box, J. E., Agosta, C., Amory, C., Kittel, C., Lang, C., van As, D., Machguth, H., and Gallée, H.: Reconstructions of the 1900–2015 Greenland ice sheet surface mass balance using the regional climate MAR model, The Cryosphere, 11, 1015–1033, https://doi.org/10.5194/tc-11-1015-2017, 2017. a
Fischer, E. M., Beyerle, U., and Knutti, R.: Robust spatially aggregated projections of climate extremes, Nat. Clim. Change, 3, 1033–1038, https://doi.org/10.1038/nclimate2051, 2013. a
Gallagher, M. R., Shupe, M. D., and Miller, N. B.: Impact of atmospheric circulation on temperature, clouds, and radiation at Summit Station, Greenland, with self-organizing maps, J. Climate, 31, 8895–8915, https://doi.org/10.1175/JCLI-D-17-0893.1, 2018. a
Gillett, N. P. and Fyfe, J. C.: Annular mode changes in the CMIP5 simulations, Geophys. Res. Lett., 40, 1189–1193, https://doi.org/10.1002/grl.50249, 2013. a
Grams, C. M., Beerli, R., Pfenninger, S., Staffell, I., and Wernli, H.: Balancing Europe's wind-power output through spatial deployment informed by weather regimes, Nat. Clim. Change, 7, 557––562, https://doi.org/10.1038/nclimate3338, 2017. a
Hanna, E., Huybrechts, P., Janssens, I., Cappelen, J., Steffen, K., and Stephens, A.: Runoff and mass balance of the Greenland ice sheet: 1958–2003, J. Geophys. Res.-Atmos., 110, D13108, https://doi.org/10.1029/2004JD005641, 2005. a
Hanna, E., Jones, J. M., Cappelen, J., Mernild, S. H., Wood, L., Steffen, K., and Huybrechts, P.: The influence of North Atlantic atmospheric and oceanic forcing effects on 1900–2010 Greenland summer climate and ice melt/runoff, Int. J. Climatol., 33, 862–880, https://doi.org/10.1002/joc.3475, 2013. a
Hanna, E., Fettweis, X., Mernild, S. H., Cappelen, J., Ribergaard, M. H., Shuman, C. A., Steffen, K., Wood, L., and Mote, T. L.: Atmospheric and oceanic climate forcing of the exceptional Greenland ice sheet surface melt in summer 2012, Int. J. Climatol., 34, 1022–1037, https://doi.org/10.1002/joc.3743, 2014. a, b, c
Hanna, E., Hall, R. J., Cropper, T. E., Ballinger, T. J., Wake, L., Mote, T., and Cappelen, J.: Greenland blocking index daily series 1851–2015: analysis of changes in extremes and links with North Atlantic and UK climate variability and change, Int. J. Climatol., 38, 3546–3564, https://doi.org/10.1002/joc.5516, 2018. a
Heinemann, G. and Klein, T.: Modelling and observations of the katabatic flow dynamics over Greenland, Tellus A, 54, 542–554, https://doi.org/10.3402/tellusa.v54i5.12167, 2002. a
Hermann, M.: A Lagrangian analysis of the dynamical and thermodynamic drivers of Greenland warm events during 1979–2017, MSc thesis, ETH Zurich, Zurich, Switzerland, 2019. a
Hoerling, M., Eischeid, J., Kumar, A., Leung, R., Mariotti, A., Mo, K., Schubert, S., and Seager, R.: Causes and predictability of the 2012 Great Plains drought, B. Am. Meteorol. Soc., 95, 269–282, https://doi.org/10.1175/BAMS-D-13-00055.1, 2014. a, b, c, d
Hofer, S., Tedstone, A. J., Fettweis, X., and Bamber, J. L.: Decreasing cloud cover drives the recent mass loss on the Greenland ice sheet, Sci. Adv., 3, e1700584, https://doi.org/10.1126/sciadv.1700584, 2017. a, b, c
Hofer, S., Tedstone, A. J., Fettweis, X., and Bamber, J. L.: Cloud microphysics and circulation anomalies control differences in future Greenland melt, Nat. Clim. Change, 9, 523–528, https://doi.org/10.1038/s41558-019-0507-8, 2019. a, b
Holton, J. R. and Hakim, G. J.: An introduction to dynamic meteorology, 5th Edn., Academic Press, 552 pp., ISBN 978-0-12-384866-6, 2012. a, b
Hurrell, J. W., Kushnir, Y., Visbeck, M., and Ottersen, G. (Eds.): Anoverview of the North Atlantic Oscillation, in: The North Atlantic Oscillation: Climate Significance and Environmental Impact, Geophys. Monogr. Ser., 134, 1–35, https://doi.org/10.1029/GM134, 2003. a
Izeboud, M., Lhermitte, S., Van Tricht, K., Lenaerts, J. T. M., Van Lipzig, N. P. M., and Wever, N.: The Spatiotemporal Variability of Cloud Radiative Effects on the Greenland Ice Sheet Surface Mass Balance, Geophys. Res. Lett., 47, e2020GL087315, https://doi.org/10.1029/2020GL087315, 2020. a, b, c, d
Johannessen, O. M., Bengtsson, L., Miles, M. W., Kuzmina, S. I., Semenov, V. A., Alekseev, G. V., Nagurnyi, A. P., Zakharov, V. F., Bobylev, L. P., Pettersson, L. H., Hasselmann, K., and Cattle, H. P.: Arctic climate change: observed and modelled temperature and sea-ice variability, Tellus A, 56, 328–341, https://doi.org/10.3402/tellusa.v56i4.14418, 2004. a
Kjeldsen, K. K., Korsgaard, N. J., Bjørk, A. A., Khan, S. A., Box, J. E., Funder, S., Larsen, N. K., Bamber, J. L., Colgan, W., Van Den Broeke, M., Siggaard-Andersen, M.-L., Nuth, C., Schomacker, A., Andresen, C. S., Willerslev, E., and Kjær, K. H.: Spatial and temporal distribution of mass loss from the Greenland ice sheet since AD 1900, Nature, 528, 396–400, https://doi.org/10.1038/nature16183, 2015. a
Knutti, R. and Sedláček, J.: Robustness and uncertainties in the new CMIP5 climate model projections, Nat. Clim. Change, 3, 369–373, https://doi.org/10.1038/nclimate1716, 2013. a
Lee, S., Gong, T., Feldstein, S. B., Screen, J. A., and Simmonds, I.: Revisiting the Cause of the 1989–2009 Arctic Surface Warming Using the Surface Energy Budget: Downward Infrared Radiation Dominates the Surface Fluxes, Geophys. Res. Lett., 44, 10654–10661, https://doi.org/10.1002/2017GL075375, 2017. a
Liniger, M. A. and Davies, H. C.: Substructure of a MAP streamer, Q. J. Roy. Meteorol. Soc., 129, 633–651, 2003. a
Liu, C. and Barnes, E. A.: Extreme moisture transport into the Arctic linked to Rossby wave breaking, J. Geophys. Res.-Atmos., 120, 3774–3788, https://doi.org/10.1002/2014JD022796, 2015. a, b
Mattingly, K. S., Ramseyer, C. A., Rosen, J. J., Mote, T. L., and Muthyala, R.: Increasing water vapor transport to the Greenland ice sheet revealed using self-organizing maps, Geophys. Res. Lett., 43, 9250–9258, https://doi.org/10.1002/2016GL070424, 2016. a
Miller, N. B., Shupe, M. D., Cox, C. J., Walden, V. P., Turner, D. D., and Steffen, K.: Cloud radiative forcing at Summit, Greenland, J. Climate, 28, 6267–6280, https://doi.org/10.1175/JCLI-D-15-0076.1, 2015. a
Mintenbeck, K., Collins, M., Bindoff, N. L., and Poloczanska, E.: The IPCC special report on ocean and cryosphere in a changing climate – challenges, opportunities and future scenarios, in: Ocean Sciences Meeting 2020, AGU, 19 February 2020, San Diego, US, TH35F, 2020. a
Mortin, J., Svensson, G., Graversen, R. G., Kapsch, M.-L., Stroeve, J. C., and Boisvert, L. N.: Melt onset over Arctic sea ice controlled by atmospheric moisture transport, Geophys. Res. Lett., 43, 6636–6642, https://doi.org/10.1002/2016GL069330, 2016. a
Mouginot, J., Rignot, E., Bjørk, A. A., van den Broeke, M., Millan, R., Morlighem, M., Noël, B., Scheuchl, B., and Wood, M.: Forty-six years of Greenland ice sheet mass balance from 1972 to 2018, P. Natl. Acad. Sci. USA, 116, 9239–9244, https://doi.org/10.1073/pnas.1904242116, 2019. a
Neff, W., Compo, G. P., Ralph, F. M., and Shupe, M. D.: Continental heat anomalies and the extreme melting of the Greenland ice surface in 2012 and 1889, J. Geophys. Res.-Atmos., 119, 6520–6536, https://doi.org/10.1002/2014JD021470, 2014. a, b, c, d, e, f
Nghiem, S. V., Hall, D. K., Mote, T. L., Tedesco, M., Albert, M. R., Keegan, K., Shuman, C., DiGirolamo, N. E., and Neumann, G.: The extreme melt across the Greenland ice sheet in 2012, Geophys. Res. Lett., 39, L20502, https://doi.org/10.1029/2012GL053611, 2012. a, b
Noël, B., Fettweis, X., van de Berg, W. J., van den Broeke, M. R., and Erpicum, M.: Sensitivity of Greenland Ice Sheet surface mass balance to perturbations in sea surface temperature and sea ice cover: a study with the regional climate model MAR, The Cryosphere, 8, 1871–1883, https://doi.org/10.5194/tc-8-1871-2014, 2014. a
Noël, B., van de Berg, W. J., Machguth, H., Lhermitte, S., Howat, I., Fettweis, X., and van den Broeke, M. R.: A daily, 1 km resolution data set of downscaled Greenland ice sheet surface mass balance (1958–2015), The Cryosphere, 10, 2361–2377, https://doi.org/10.5194/tc-10-2361-2016, 2016. a
Ohmura, A.: Physical basis for the temperature-based melt-index method, J. Appl. Meteorol. Clim., 40, 753–761, https://doi.org/10.1175/1520-0450(2001)040, 2001. a, b
Papritz, L.: Arctic lower tropospheric warm and cold extremes: horizontal and vertical transport, diabatic processes, and linkage to synoptic circulation features, J. Climate, 33, 993–1016, https://doi.org/10.1175/JCLI-D-19-0638.1, 2020. a, b, c, d
Papritz, L. and Spengler, T.: A Lagrangian climatology of wintertime cold air outbreaks in the Irminger and Nordic Seas and their role in shaping air–sea heat fluxes, J. Climate, 30, 2717–2737, https://doi.org/10.1175/JCLI-D-16-0605.1, 2017. a
Park, H.-S., Lee, S., Kosaka, Y., Son, S.-W., and Kim, S.-W.: The impact of Arctic winter infrared radiation on early summer sea ice, J. Climate, 28, 6281–6296, https://doi.org/10.1175/JCLI-D-14-00773.1, 2015. a
Pfahl, S., Schwierz, C., Croci-Maspoli, M., Grams, C. M., and Wernli, H.: Importance of latent heat release in ascending air streams for atmospheric blocking, Nat. Geosci., 8, 610–614, https://doi.org/10.1038/ngeo2487, 2015. a
Ridley, J. K., Huybrechts, P., Gregory, J. U., and Lowe, J.: Elimination of the Greenland ice sheet in a high CO2 climate, J. Climate, 18, 3409–3427, https://doi.org/10.1175/JCLI3482.1, 2005. a
Serreze, M. C. and Barry, R. G.: Processes and impacts of Arctic amplification: A research synthesis, Global Planet. Change, 77, 85–96, https://doi.org/10.1016/j.gloplacha.2011.03.004, 2011. a
Sodemann, H., Schwierz, C., and Wernli, H.: Interannual variability of Greenland winter precipitation sources: Lagrangian moisture diagnostic and North Atlantic oscillation influence, J. Geophys. Res.-Atmos., 113, D03107, https://doi.org/10.1029/2007JD008503, 2008. a
Solomon, A., Shupe, M. D., and Miller, N. B.: Cloud–atmospheric boundary layer–surface interactions on the Greenland ice sheet during the July 2012 extreme melt event, J. Climate, 30, 3237–3252, https://doi.org/10.1175/JCLI-D-16-0071.1, 2017. a, b
Sprenger, M. and Wernli, H.: The LAGRANTO Lagrangian analysis tool – version 2.0, Geosci. Model Dev., 8, 2569–2586, https://doi.org/10.5194/gmd-8-2569-2015, 2015. a, b
Sprenger, M., Fragkoulidis, G., Binder, H., Croci-Maspoli, M., Graf, P., Grams, C. M., Knippertz, P., Madonna, E., Schemm, S., Škerlak, B., and Wernli, H.: Global climatologies of Eulerian and Lagrangian flow features based on ERA-Interim, B. Am. Meteorol. Soc., 98, 1739–1748, https://doi.org/10.1175/BAMS-D-15-00299.1, 2017. a
Steinfeld, D. and Pfahl, S.: The role of latent heating in atmospheric blocking dynamics: a global climatology, Clim. Dynam., 53, 6159–6180, https://doi.org/10.1007/s00382-019-04919-6, 2019. a
Stohl, A.: Characteristics of atmospheric transport into the Arctic troposphere, J. Geophys. Res.-Atmos., 111, D11306, https://doi.org/10.1029/2005JD006888, 2006. a
Tedesco, M. and Fettweis, X.: Unprecedented atmospheric conditions (1948–2019) drive the 2019 exceptional melting season over the Greenland ice sheet, The Cryosphere, 14, 1209–1223, https://doi.org/10.5194/tc-14-1209-2020, 2020. a
Tedesco, M., Fettweis, X., Mote, T., Wahr, J., Alexander, P., Box, J. E., and Wouters, B.: Evidence and analysis of 2012 Greenland records from spaceborne observations, a regional climate model and reanalysis data, The Cryosphere, 7, 615–630, https://doi.org/10.5194/tc-7-615-2013, 2013. a, b
Van den Broeke, M., Box, J., Fettweis, X., Hanna, E., Noël, B., Tedesco, M., van As, D., van de Berg, W. J., and van Kampenhout, L.: Greenland ice sheet surface mass loss: Recent developments in observation and modeling, Curr. Clim. Change Rep., 3, 345–356, https://doi.org/10.1007/s40641-017-0084-8, 2017. a
van den Broeke, M. R., Enderlin, E. M., Howat, I. M., Kuipers Munneke, P., Noël, B. P. Y., van de Berg, W. J., van Meijgaard, E., and Wouters, B.: On the recent contribution of the Greenland ice sheet to sea level change, The Cryosphere, 10, 1933–1946, https://doi.org/10.5194/tc-10-1933-2016, 2016. a, b, c
Van Tricht, K., Lhermitte, S., Lenaerts, J. T. M., Gorodetskaya, I. V., L'Ecuyer, T. S., Noël, B., van den Broeke, M. R., Turner, D. D., and van Lipzig, N. P. M.: Clouds enhance Greenland ice sheet meltwater runoff, Nat. Commun., 7, 10266, https://doi.org/10.1038/ncomms10266, 2016. a, b, c
Wang, W., Zender, C. S., van As, D., and Miller, N. B.: Spatial distribution of melt season cloud radiative effects over Greenland: evaluating satellite observations, reanalyses, and model simulations against in situ measurements, J. Geophys. Res.-Atmos., 124, 57–71, https://doi.org/10.1029/2018JD028919, 2019. a, b, c, d, e
Wernli, H. and Davies, H. C.: A Lagrangian-based analysis of extratropical cyclones. I: the method and some applications, Q. J. Roy. Meteorol. Soc., 123, 467–489, https://doi.org/10.1002/qj.49712353811, 1997. a, b
Wernli, H. and Papritz, L.: Role of polar anticyclones and mid-latitude cyclones for Arctic summertime sea-ice melting, Nat. Geosci., 11, 108–113, https://doi.org/10.1038/s41561-017-0041-0, 2018. a
Wesslén, C., Tjernström, M., Bromwich, D. H., de Boer, G., Ekman, A. M. L., Bai, L.-S., and Wang, S.-H.: The Arctic summer atmosphere: an evaluation of reanalyses using ASCOS data, Atmos. Chem. Phys., 14, 2605–2624, https://doi.org/10.5194/acp-14-2605-2014, 2014. a
Woollings, T., Barriopedro, D., Methven, J., Son, S.-W., Martius, O., Harvey, B., Sillmann, J., Lupo, A. R., and Seneviratne, S.: Blocking and its response to climate change, Curr. Clim. Change Rep., 4, 287–300, https://doi.org/10.1007/s40641-018-0108-z, 2018. a
Zschenderlein, P., Fink, A. H., Pfahl, S., and Wernli, H.: Processes determining heat waves across different European climates, Q. J. Roy. Meteorol. Soc., 145, 2973–2989, https://doi.org/10.1002/qj.3599, 2019. a, b
Zschenderlein, P., Pfahl, S., Wernli, H., and Fink, A. H.: A Lagrangian analysis of upper-tropospheric anticyclones associated with heat waves in Europe, Weather Clim. Dynam., 1, 191–206, https://doi.org/10.5194/wcd-1-191-2020, 2020. a
Zwally, H. J., Giovinetto, M. B., Beckley, M. A., and Saba, J. L.: Antarctic and Greenland drainage systems, GSFC cryospheric sciences laboratory, available at: https://icesat4.gsfc.nasa.gov/cryo_data/ant_grn_drainage_systems.php (last access: 24 September 2020), 2012. a, b
The requested paper has a corresponding corrigendum published. Please read the corrigendum first before downloading the article.
- Article
(16370 KB) - Full-text XML
- Corrigendum
-
Supplement
(4548 KB) - BibTeX
- EndNote