the Creative Commons Attribution 4.0 License.
the Creative Commons Attribution 4.0 License.
 | 30 Nov 2020
Impacts of the North Atlantic Oscillation on winter precipitations and storm track variability in southeast Canada and the northeast United States
Julien Chartrand
Francesco S. R. Pausata
The North Atlantic Oscillation (NAO) affects atmospheric variability from eastern North America to Europe. Although the link between the NAO and winter precipitations in eastern North America has been the focus of previous work, only few studies have considered extreme precipitation and hitherto provided clear physical explanations on these relationships. In this study we revisit and extend the analysis of the effect of the NAO on mean and heavy winter precipitations over a large domain covering southeast Canada and the northeastern United States. Furthermore, we use the recent ERA5 reanalysis dataset (1979–2018), which currently has the highest available horizontal resolution for a global reanalysis (0.25∘), to track extratropical cyclones to delve into the physical processes behind the relationship between NAO and precipitation, snowfall, snowfall-to-precipitation ratio (S∕P), and snow cover depth anomalies in the region. In particular, our results show that positive NAO phases are associated with less snowfall over a wide region covering Nova Scotia, New England and the Mid-Atlantic of the United States relative to negative NAO phases. Over the same area, the analysis of heavy snowfall revealed that there are up to twice as many heavy snowfall events during negative phases compared to positive phases. Therefore, a significant negative correlation is also seen between S∕P and the NAO over this region. This is due to a decrease (increase) in cyclogenesis of coastal storms near the United States east coast during positive (negative) NAO phases, as well as a northward (southward) displacement of the mean storm track over North America.
- Article
(10319 KB) - Full-text XML
- BibTeX
- EndNote


The North Atlantic Oscillation (NAO) is the dominant mode of atmospheric variability in the North Atlantic (Hurrell, 1995). The NAO refers to swings in the atmospheric pressure difference between the Icelandic low and Azores high and is a key factor in the cool-season climate variability from the eastern coast of the United States to Siberia and from the Arctic to the subtropical Atlantic. A common measure of the NAO phase is the so-called NAO index (NAOI) that is commonly defined as the difference in the normalized sea level pressure (SLP) anomalies between Stykkishólmur/Reykjavik, Iceland, and either Lisbon, Portugal, or Ponta Delgada, Azores (Hurrell, 1995). Positive NAO phases are associated with a deepening of the Icelandic low and a strengthening of the Azores high. The increased SLP gradient consequently leads to an enhanced westerly flow and a northward shift of the midlatitude storm track (Rogers, 1990; Hurrell and Van Loon, 1997). The negative phase of the NAO is associated with weaker westerlies, an increase in meandering of the jet stream and higher-than-average pressure over Greenland and Iceland, which often form blocking patterns over the North Atlantic (Shabbar et al., 2001).
While the link between the NAO and winter precipitations in northern Europe and in the Mediterranean region is moderately strong (Hurrell, 1995), the effects of the NAO phase on precipitation and snowfall amounts in eastern North America are known to be weaker (e.g., Bradbury et al., 2003). Various studies have shown that a slight negative correlation exists between the winter NAO phase and total winter precipitation in New England (Bradbury et al., 2002a; Ning and Bradley, 2015). A significant negative correlation between NAO and seasonal snowfall in New England (Hartley and Keables, 1998) and in other parts of northeastern US has also been reported (Kocin and Uccellini, 2004; Notaro et al., 2006; Morin et al., 2008). Moreover, Huntington et al. (2004) found a significant negative correlation between the NAO and the snowfall-to-precipitation ratio (S∕P) in the northeastern US. Kocin and Uccellini (2004) have studied the snowfall climatology of the northeast urban corridor in depth and have noticed that winters with a low NAO almost always coincide with the high-snowfall years. While the low-frequency variations in the NAO proved to be quite well correlated with seasonal snowfall in that region, their study also demonstrated that the occurrence of high-impact winter storms is strongly linked to the daily NAO value. However, Archambault et al. (2008) and Notaro et al. (2006) have found that precipitation event frequency in the northeastern US is slightly higher in positive NAO conditions. Several studies (Stone et al., 2000; Bonsal and Shabbar, 2008; Whan and Zwiers, 2017) have investigated the relationship between precipitation and teleconnection patterns in Canada but have found that winter precipitation is generally poorly correlated with the NAO in eastern Canada.
As extratropical cyclones account for almost all of the winter precipitation in eastern North America (Pfahl and Wernli, 2012), the variability in winter precipitation and snowfall can be explained by the shift in the storm track over North America and the North Atlantic. Several studies have focused specifically on the storm track variability in the North Atlantic and showed that the positive (negative) phase of the NAO favors a more northern (southern) storm track over the North Atlantic (Rogers, 1990; Serreze et al., 1997; Riviere and Orlanski, 2007; Pinto et al., 2009), as well as an eastward displacement of the mean trough axis over North America (Bradbury et al., 2002b). In a broader region, Wang et al. (2006) have found that a strong positive NAO is always associated simultaneously with more frequent cyclone activity in the high Canadian Arctic and less frequent activity on the east coast.
In this study we investigate the effect of the NAO on precipitation and snowfall over a wide domain covering southeastern Canada as well as the northeastern US. Although previous studies have delved into the link between the NAO and winter precipitation in eastern North America, they have not considered extreme precipitation and snowfall. Knowing that extreme winter storms are some of the most damaging meteorological phenomena that occur in these regions, it is highly relevant to look at the changes in heavy precipitation event occurrence as well. Furthermore, we use the recent high-resolution ERA5 reanalysis dataset (1979–2018) to track extratropical cyclones and to calculate the blocking frequency over the North Atlantic Basin. In doing so, we aim at providing a physical explanation for the precipitation and snowfall variability based on the storm track variability associated with the phases of the NAO.
The paper is organized as follows. Data and methodology are described and discussed in Sect. 2. Section 3 presents the results obtained from statistical analysis of the winter climate and storm track variability with the NAO. Section 4 presents a discussion of the results. Finally, the main findings are presented in Sect. 5, along with the conclusion.
2.1 Datasets
The NAOI used in this analysis is the monthly station-based index (Hurrell, 1995) based on the difference of normalized SLP between Lisbon, Portugal, and Stykkishólmur/Reykjavik in Iceland (taken from the National Center for Atmospheric Research (NCAR) website: https://climatedataguide.ucar.edu/climate-data/hurrell-north-atlantic-oscillation-nao-index-station-based, last access: 24 November 2020; Hurrell and National Center for Atmospheric Research Staff, 2020). Positive values of the NAOI are given by higher-than-average SLP over Portugal and lower-than-average SLP over Iceland. As in previous studies (Ning and Bradley, 2015; Bradbury et al., 2002a; Huntington et al., 2004), we consider the December to March period (DJFM), because consistent snowfall and winter conditions usually occur during these 4 months over most of the study area. The monthly NAOI has been used to calculate the link between winter precipitations and the NAO.
The daily snowfall, total precipitation and snowpack depth in snow water equivalent (SWE) data come from the European Centre for Medium-Range Weather Forecasts (ECMWF) ERA5 high-resolution (0.25∘) reanalysis dataset for the period 1979–2018 (Hersbach et al., 2020). The precipitation and snowfall totals used for calculating correlations are the summed total precipitation and snowfall for each month at every grid point of the domain of interest. The change in heavy precipitation and snowfall events has been analyzed by using various extreme climate indices (R95N, R10mm, Rx1day, Rx5days, R20mm). However, the results are very similar among these indices within our domain. Therefore, for clarity in this paper we only show the results for the relationship between the NAO and the number of days with precipitation (and snowfall) above the 95th percentile of climatological daily precipitation (snowfall) during the cold season.
The S∕P was calculated by dividing snowfall by total precipitation, as in Huntington et al. (2004). To analyze how the annual maximum of snowpack depth varies depending on the winter (DJFM) NAO phase, the seasonal maximum of SWE was taken over the course of the snow year (1 August to 31 July), as the maximum of snow depth is sometimes achieved later than March in some parts of the domain. The winter climatology of total precipitation, snowfall, S∕P and maximum seasonal SWE using the ERA5 dataset are shown in Fig. 1, as well as the 95th percentile of daily precipitation and snowfall.
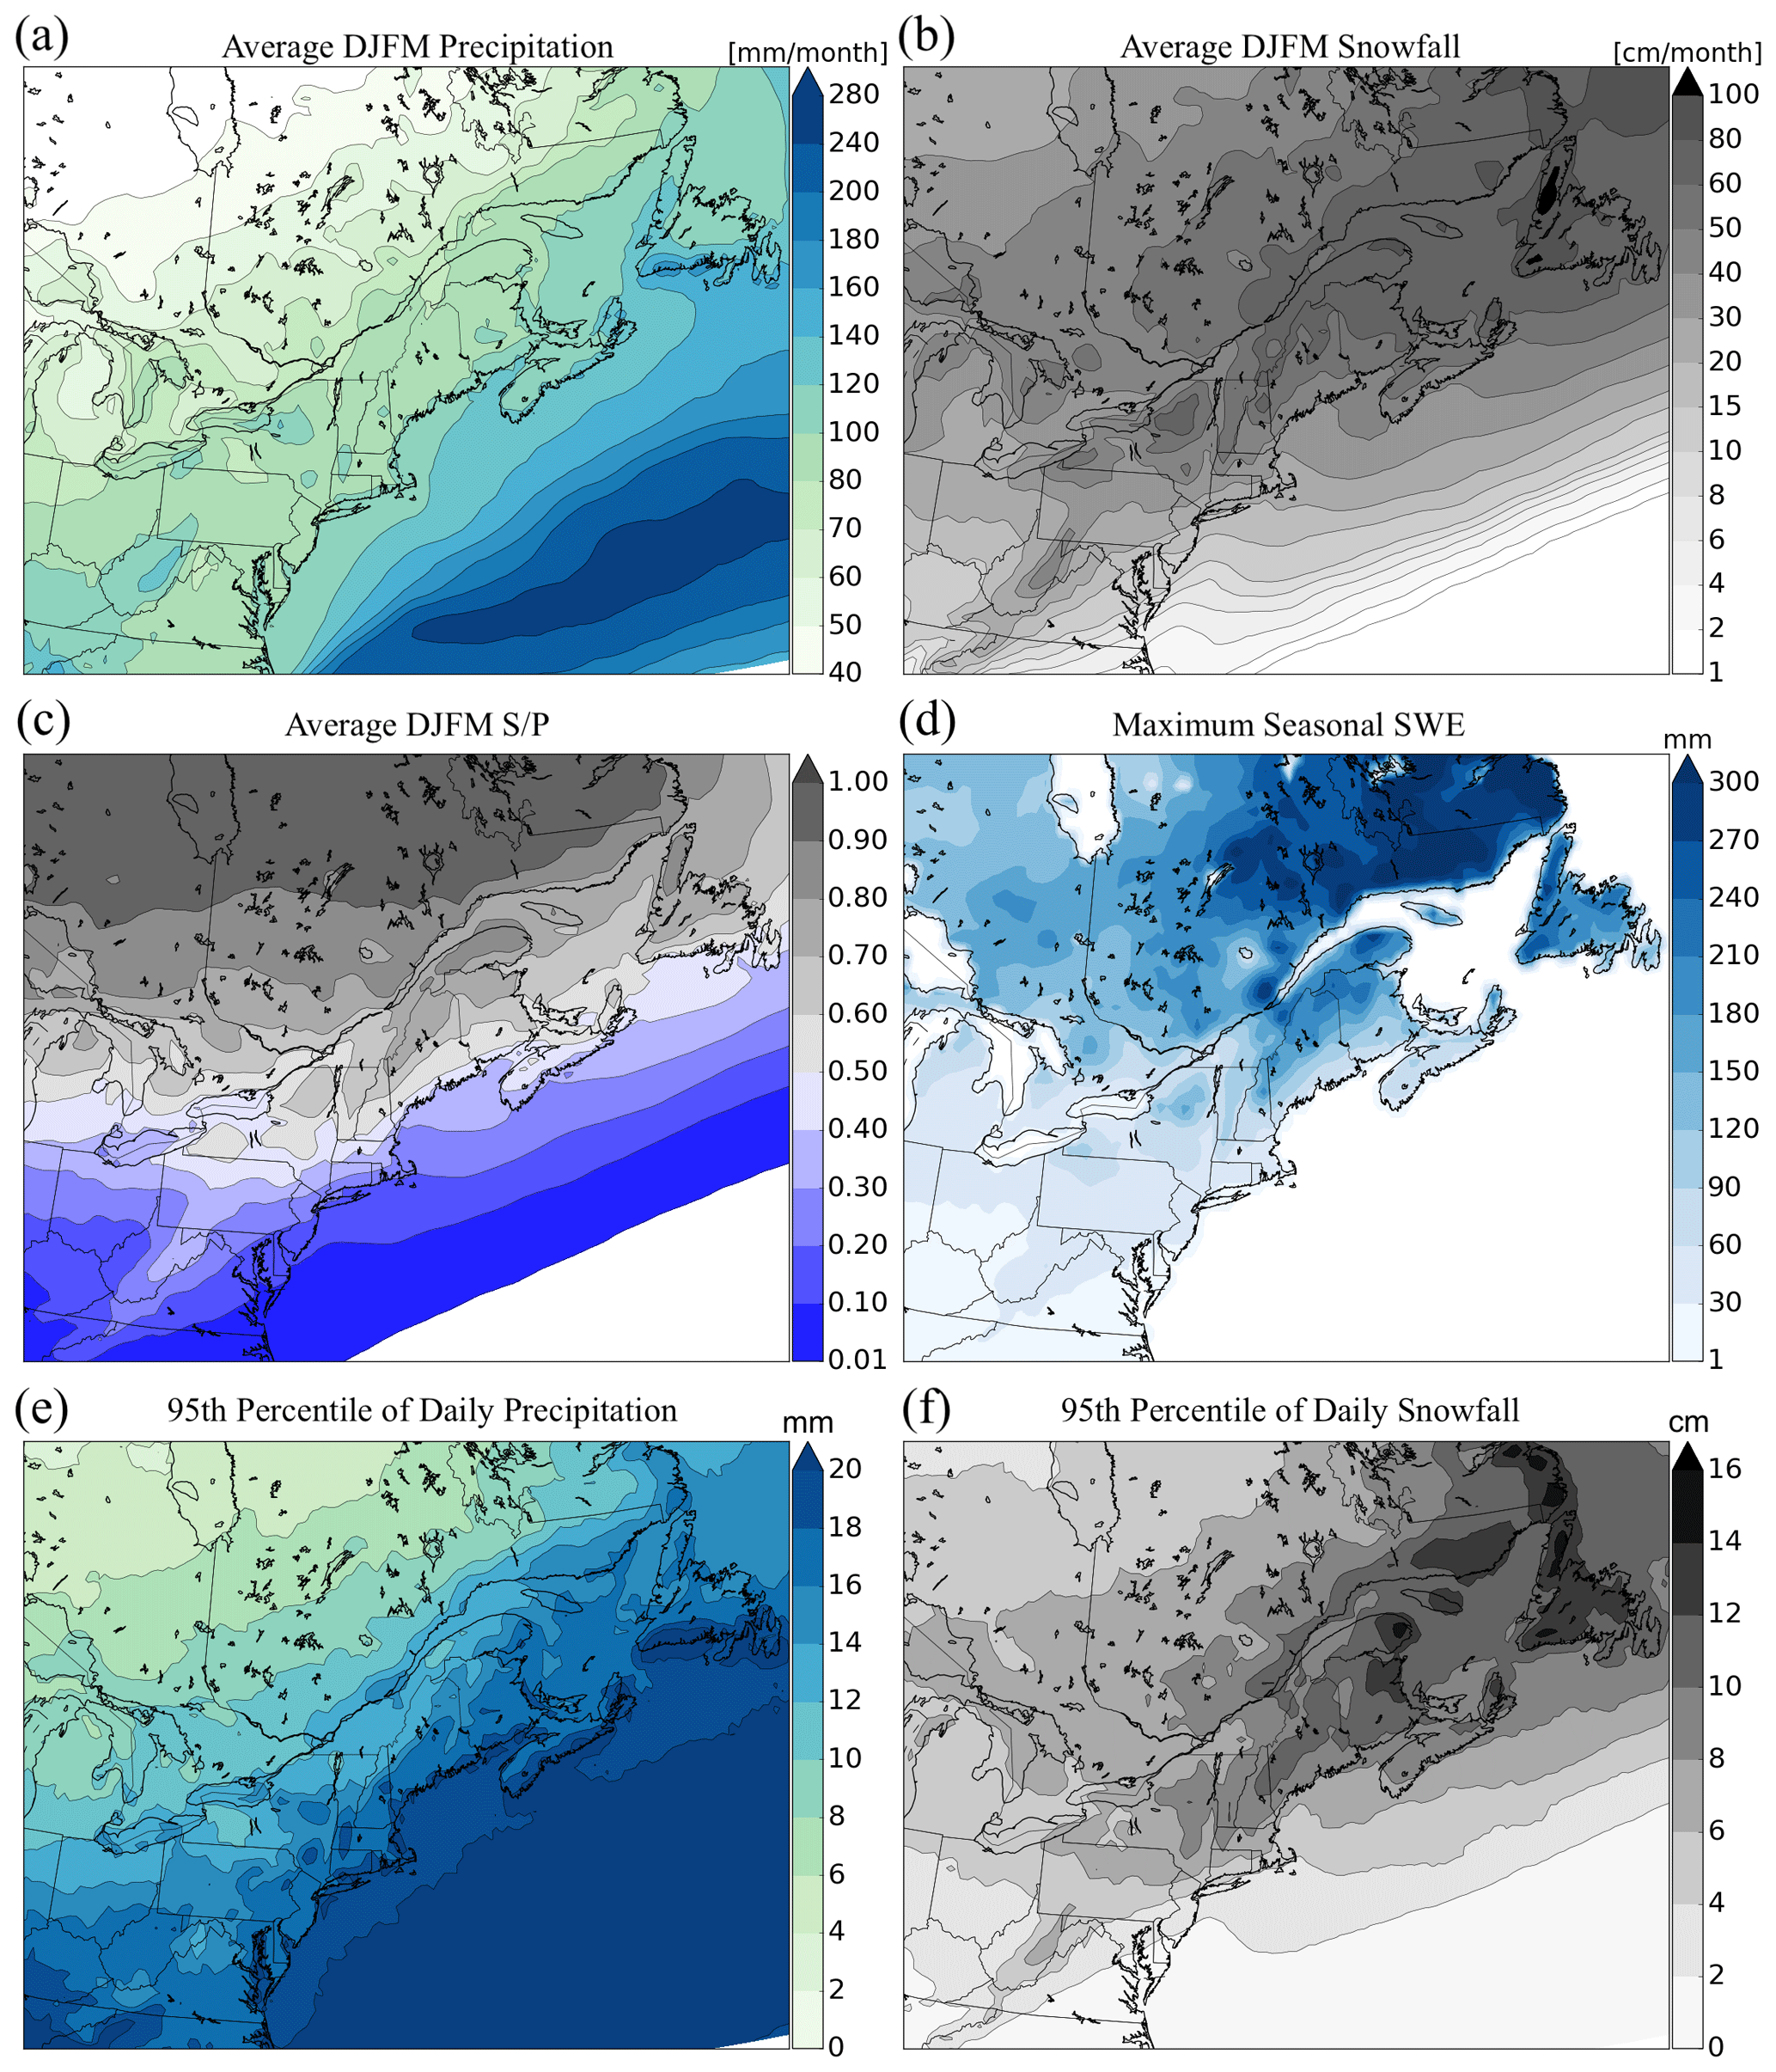
Figure 1ERA5 1979–2018 climatological values of winter (December to March, DJFM) (a) total precipitation, (b) snowfall and (c) snowfall-to-precipitation ratio. (d) Average maximum SWE of the snowpack over the course of a snow year (1 August–31 July). The 95th percentile of winter climatological (e) daily precipitation and (f) snowfall.
Linear correlation coefficients with the monthly NAOI were first calculated for mean and extreme precipitation, snowfall, and S∕P. For the snowpack SWE, correlation coefficients were calculated between maximum SWE and seasonal (DJFM) NAO. Correlations were calculated using the Pearson R-value method at every grid point. The statistical significance of these correlations using the p value was determined at the 0.05 level. For statistical comparison between high-NAO and low-NAO months, the variables were averaged for the 40 months with the highest NAO (first quartile) and for the 40 months with the lowest NAO (fourth quartile). For the snowpack maximum SWE analysis, the 10 winters with the highest NAOI were compared to the 10 years with the lowest NAOI. To measure the statistical significance of these comparisons, the Student t test was used with a significance level of 0.05.

Figure 2(a) Map of the domain of interest with elevation included. The elevation data shown are ETOPO1 1 Arc-Minute Global Relief (retrieved from https://www.ngdc.noaa.gov/mgg/global/, last access: 24 November 2020; Amante and Eakins, 2009). Red dots represent the locations of the weather stations used in the study as data validation. (b) Map of the domain of interest separated by main geographical regions, with the abbreviations of Canadian provinces and US states included.
Daily precipitation and snowfall data from the Global Historical Climatology Network (GHCN-Daily) served as validation data for the same period as the ERA5 dataset (1979–2018). The data from 29 stations well distributed in the domain have been analyzed. Of these stations, 14 are located in eastern Canada, 6 are located in New England and 9 are located in the Mid-Atlantic region of the United States (Fig. 2). These stations were chosen based on the availability of data in the 1979–2018 period. Each station has near-complete precipitation data in this time period, which is essential for the comparison between results. Many stations that had data covering the whole time period of interest were rejected because of the high percentage of missing data during some years. Station inclusion criteria were intended to prevent stations with short, nonrepresentative data records from biasing the analysis. The same calculations on monthly precipitation, snowfall and S∕P that have been done on ERA5 gridded data have been performed using the station-based data. Comparison between station-based and reanalysis data also helped in validating the ERA5 data on a regional scale.
2.2 Storm tracking algorithm
In order to track individual cyclone trajectories on the ERA5 dataset, we adapted the existing storm tracking algorithms by Murray and Simmonds (1991) and Hanley and Caballero (2012). We modified these methods rather than directly use one of them to improve the algorithm performance in tracking the extratropical cyclones over our domain of interest (including over mountains), when using the high-resolution and 3-hourly output of the ERA5 reanalysis. The main features of the algorithm are described here below.
Because of the high resolution of ERA5, we first use a Cressman smoother (400 km influence radius) to filter out small-scale stationary local minima in the SLP field in the intermountain regions and retain only synoptic-scale low-pressure systems. Local minima in the SLP field (SLP value is smaller than the eight neighboring grid points) are then taken as low-pressure centers for the tracking process.
Cyclone trajectories are created through linear projection: to forecast the second position in a cyclone trajectory, the 500 hPa wind field is used; afterward, the locations of future low-pressure centers are extrapolated (linearly projected) by using the difference between the previous and current center's locations. Matches between low-pressure centers at each time step are attempted by looking for low-pressure centers within a 350 km search radius from the predicted trajectories. If several matches are possible for a single trajectory, absolute departure from predicted position and pressure with predicted value is used for matching low-pressure centers. If no low-pressure centers are found within 350 km of a predicted cyclone position, this cyclone trajectory is completed. A low-pressure center that is not matched to any previous storm track is used as a first center for a new storm trajectory.
After each complete storm trajectory, two elimination criteria are applied in order to remove the stationary orographic features and short-lived features from the list of tracks found; a minimum total displacement of more than 10∘ and a minimum lifetime of 48 h.
The cyclone tracking has been performed in a limited area of the ERA5 grid (180∘ W–0∘ E, 10–80∘ N) to make calculations faster. As our study area is much smaller and far enough from the borders of the tracking area, this did not bias the analysis of storm tracks within our domain of interest. An average of 381 cyclone trajectories per winter were found (a total of 15 248 for the 1979–2018 period).

Figure 3ERA5 average cool-season (December to March) (a) cyclogenesis density and (b) storm track density over the 1979–2018 period. The units are number of cyclones per month per area of 1000 km2.
The track density is defined in this study as the number of cyclone trajectories per area of 1000 km2. Each cyclone trajectory is only counted once for each grid point near the trajectory. For the purpose of the study, we equate changes in the cyclone track density to changes in storm tracks. Cyclogenesis density is defined as the number of cyclogenesis events (first points in trajectories) per area of 1000 km2. The spatial distribution of both track density and cyclogenesis density climatology (Fig. 3) are well in agreement with previous work that used different tracking methods (e.g., Neu et al., 2013). In particular, the main region of lee cyclogenesis east of the Canadian and Colorado Rockies is very well represented, as well as the areas of maximum coastal cyclogenesis due to the land–sea temperature contrast just offshore of Cape Hatteras in North Carolina (Fig. 3a).
2.3 Blocking frequency
Blocks near Greenland (i.e., Greenland block) are known to be responsible for deeper troughs over eastern North America (e.g., Resio and Hayden, 1975), which consequently have an influence on cyclogenesis and cyclone trajectories. For that reason, we investigated the changes in blocking frequency during positive and negative NAO months over the North Atlantic Basin (30–70∘ N, 85∘ W–0∘ E). The analysis of the blocking frequency using the ERA5 dataset was performed using a bidimensional index that identifies reversals in the meridional gradient of the 500 hPa geopotential height (Pausata et al., 2015; Anstey et al., 2013 ; Tibaldi and Molteni, 1990). At each grid point of latitude ϕ and longitude λ, the northward and southward meridional gradients of geopotential heights are respectively estimated following Eqs. (1) and (2):
A blocking event at a grid point is diagnosed when two conditions are verified: (1) ΔN(ϕ, λ)>0, indicating a reversal of the climatological conditions with easterlies equatorward of the grid point, and (2) ΔS(ϕ, m ∘−1, indicating westerlies poleward of the grid point. The blocking frequency (%) is then obtained by the number of time steps that a grid point is defined as “blocked” divided by the total number of time steps.
In this section we first present the relationship between the NAO and total precipitation, snowfall and S∕P (Sect. 3.1): for each variable, the spatial pattern of correlations with the NAO index is discussed as well as the difference in monthly averages between high-NAO and low-NAO months. In Sect. 3.2, heavy precipitation and snowfall events are considered, as well as the link between seasonal NAO and maximum snowpack depth. Finally, in Sect. 3.3 we present the effect of the NAO on storm tracks and cyclogenesis in North America.
3.1 Changes in total precipitation, snowfall and snowfall-to-total-precipitation ratio
For total precipitation, the results show that only a weak relationship with the NAO exists over most of the domain of interest. Nonetheless, the coastal regions of New England and the Mid-Atlantic show slightly negative correlations between −0.10 and −0.20, with limited areas showing significant values (Fig. 4b). In relative terms, these coastal areas received up to 15 %–20 % less precipitation during positive NAO compared to negative NAO months (Fig. 4a). When moving northward or westward from the northeastern US coast, the results show a gradual reversal of the correlation coefficient, which becomes slightly positive in southern Newfoundland and around the Great Lakes. In Atlantic Canada, the correlation coefficient is as high as 0.3 on the southern coast of Newfoundland. The correlation is instead moderately negative over Labrador, being the only area that shows a clear relationship between the NAO and mean precipitation (Fig. 4b).
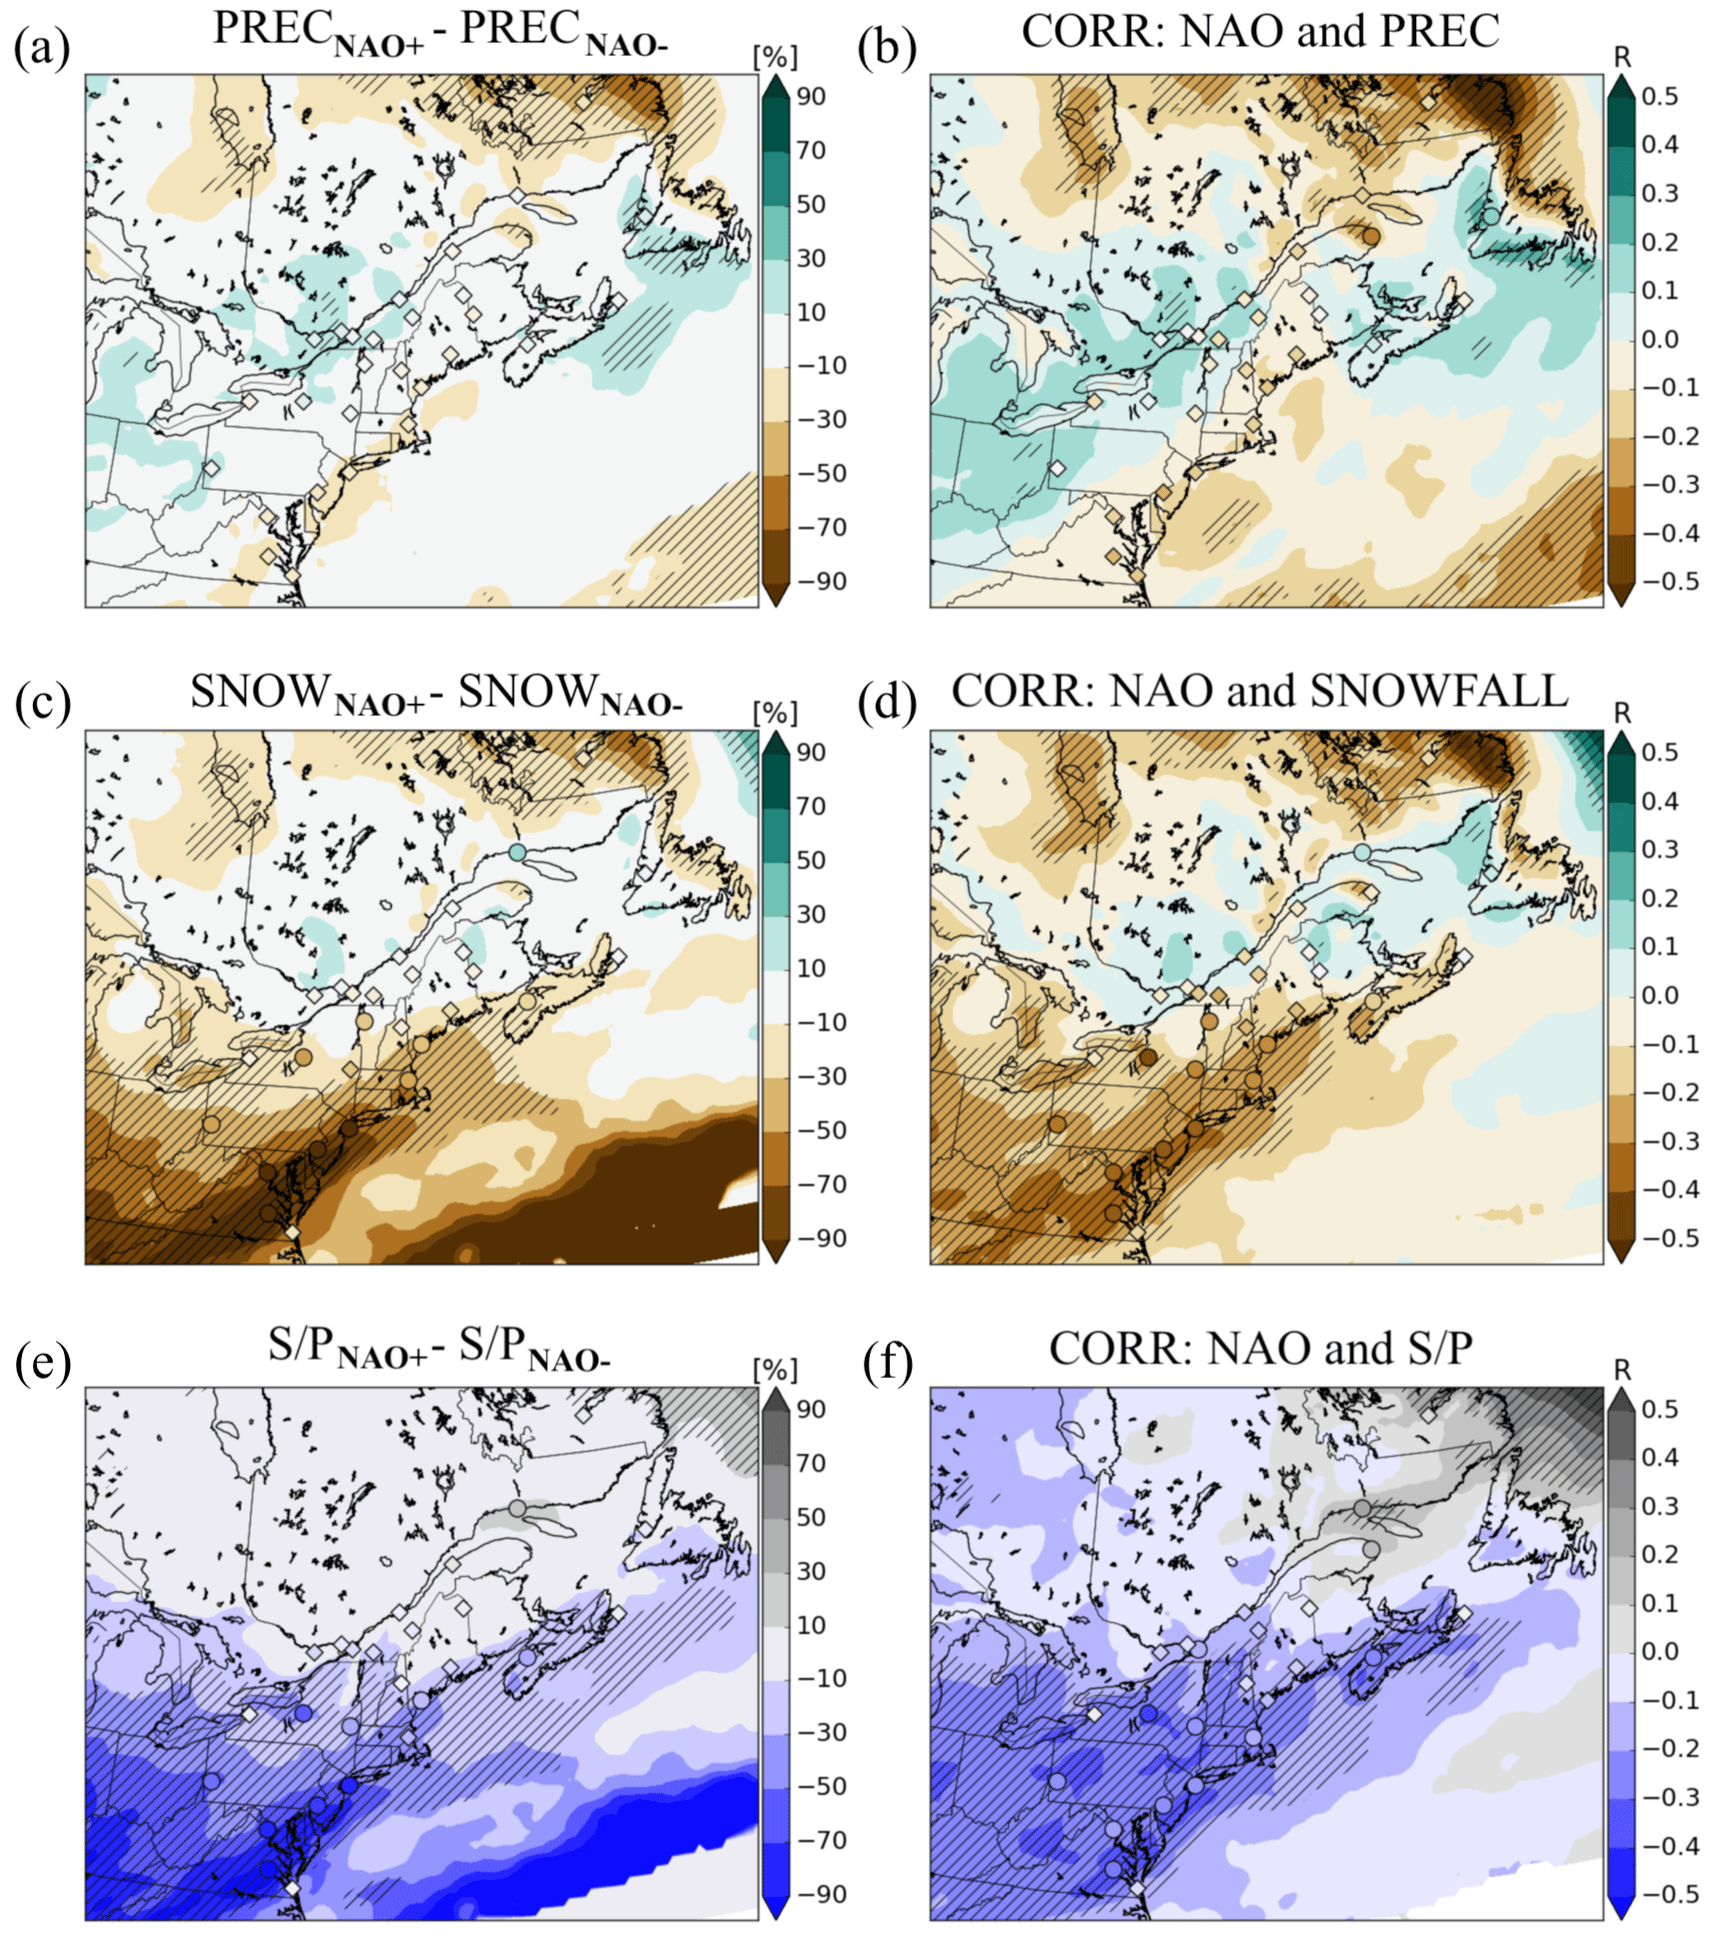
Figure 4(a) Relative difference between average precipitation during positive NAO and negative NAO months (40-month composites, first and fourth quartiles) in winter (DJFM); positive values mean more precipitation during high NAO. (b) Correlation coefficients between monthly precipitation and monthly NAOI. Hatched areas represent statistically significant values at the 0.05 level. Shaded circles represent station-based correlation coefficients that are statistically significant at the 0.05 level, and diamonds represent values that are not statistically significant. (c, d) As in panels (a) and (b) but for the relationship between monthly NAO and snowfall. (e, f) As in panels (a) and (b) but for the relationship between monthly NAO and S∕P.
When looking at snowfall (Fig. 4c and d), the relationship between snowfall and the NAO is much stronger than for total precipitation, especially for the northeastern US (Fig. 4c and d). In a wide corridor from southern Nova Scotia to the southeast US, a significant negative correlation is shown together with notable decrease in snowfall during positive NAO. In the Mid-Atlantic region, the snowfall that is received during months with positive NAO is on average half the snowfall during negative NAO months. The negative correlation between snowfall and the NAO is statistically significant all over the northeastern US except at the northernmost parts of the region, which implies that high snowfall is associated with the negative phase of the NAO. Moving northward into southeastern Canada, the ERA5 results show correlations fading toward zero and becoming weakly positive in most of the region between 45 and 50∘ N. In Newfoundland and Labrador, the snowfall relationship pattern with the NAO is similar to that between precipitation and NAO, which is not surprising as almost all precipitation falls as snow during the cold season in this region (Fig. 1c).
The relationship between winter snowfall-to-precipitation ratio and the NAO (Fig. 4e and f) shows a very similar pattern in the northeastern US as the link between snowfall and NAO (Fig. 4c and d). As for snowfall, southern New England and the Mid-Atlantic are the areas with the strongest correlation between NAO and S∕P. Everywhere within the northeastern US, positive NAO tends to bring a lower S∕P ratio, the only exception being northern Maine. Southern parts of eastern Canada also shows a decrease in S∕P during positive NAO months. In southern Nova Scotia, this decrease is as high as 0.05 (i.e., from 45 % to 40 % of S∕P), and the negative correlation is significant. In Newfoundland and northeastern Quebec, the S∕P ratio is instead higher during positive NAO.
All over the domain of interest, the ERA5 and station-based results are consistent with each other. Only small differences exist between the results. Notably, for the correlation between snowfall and the NAO over southern Quebec, a slight negative correlation also exists with station results, although not with ERA5 results. Overall, these results indicate that the NAO has a much larger impact on the variability of winter precipitation and snowfall in the northeastern US compared to southeastern Canada.
3.2 Changes in heavy precipitation, snowfall and maximum snow depth
The relationship between the monthly NAO and heavy precipitation is fairly similar to the relationship between the NAO and total precipitation. However, the results for heavy precipitation are noisier, and there are more inconsistencies between reanalysis-based and station-based results, which is explained by the much larger variability in the amount of days per months with heavy precipitation compared to the variability of the mean precipitation. In the coastal regions of the northeastern US, there is a slight negative correlation that reaches statistical significance in some areas. There are on average 20 % to 30 % less heavy precipitation days during positive NAO months compared to negative NAO months in that region. The inverse results are seen over the southern half of Atlantic Canada and over the Great Lakes region, where positive NAO months see on average slightly more heavy precipitation days than negative NAO months.
The relationship is again much stronger when we look at heavy snowfall (days with snowfall above 95th percentile) rather than heavy precipitation (Fig. 5c and d). A significant negative correlation exists in a large area covering the entire Mid-Atlantic region, southern New England and southern Nova Scotia. The densely populated regions between Boston, MA, and Washington, DC, are found to be affected up to twice as much by heavy snowfall days during negative NAO months compared to positive months (Fig. 5c). Heavy snowfall events over eastern Canada are less affected by the NAO phase, with very limited areas that show significant correlations, except over eastern Labrador, where a negative correlation is seen between the two variables.
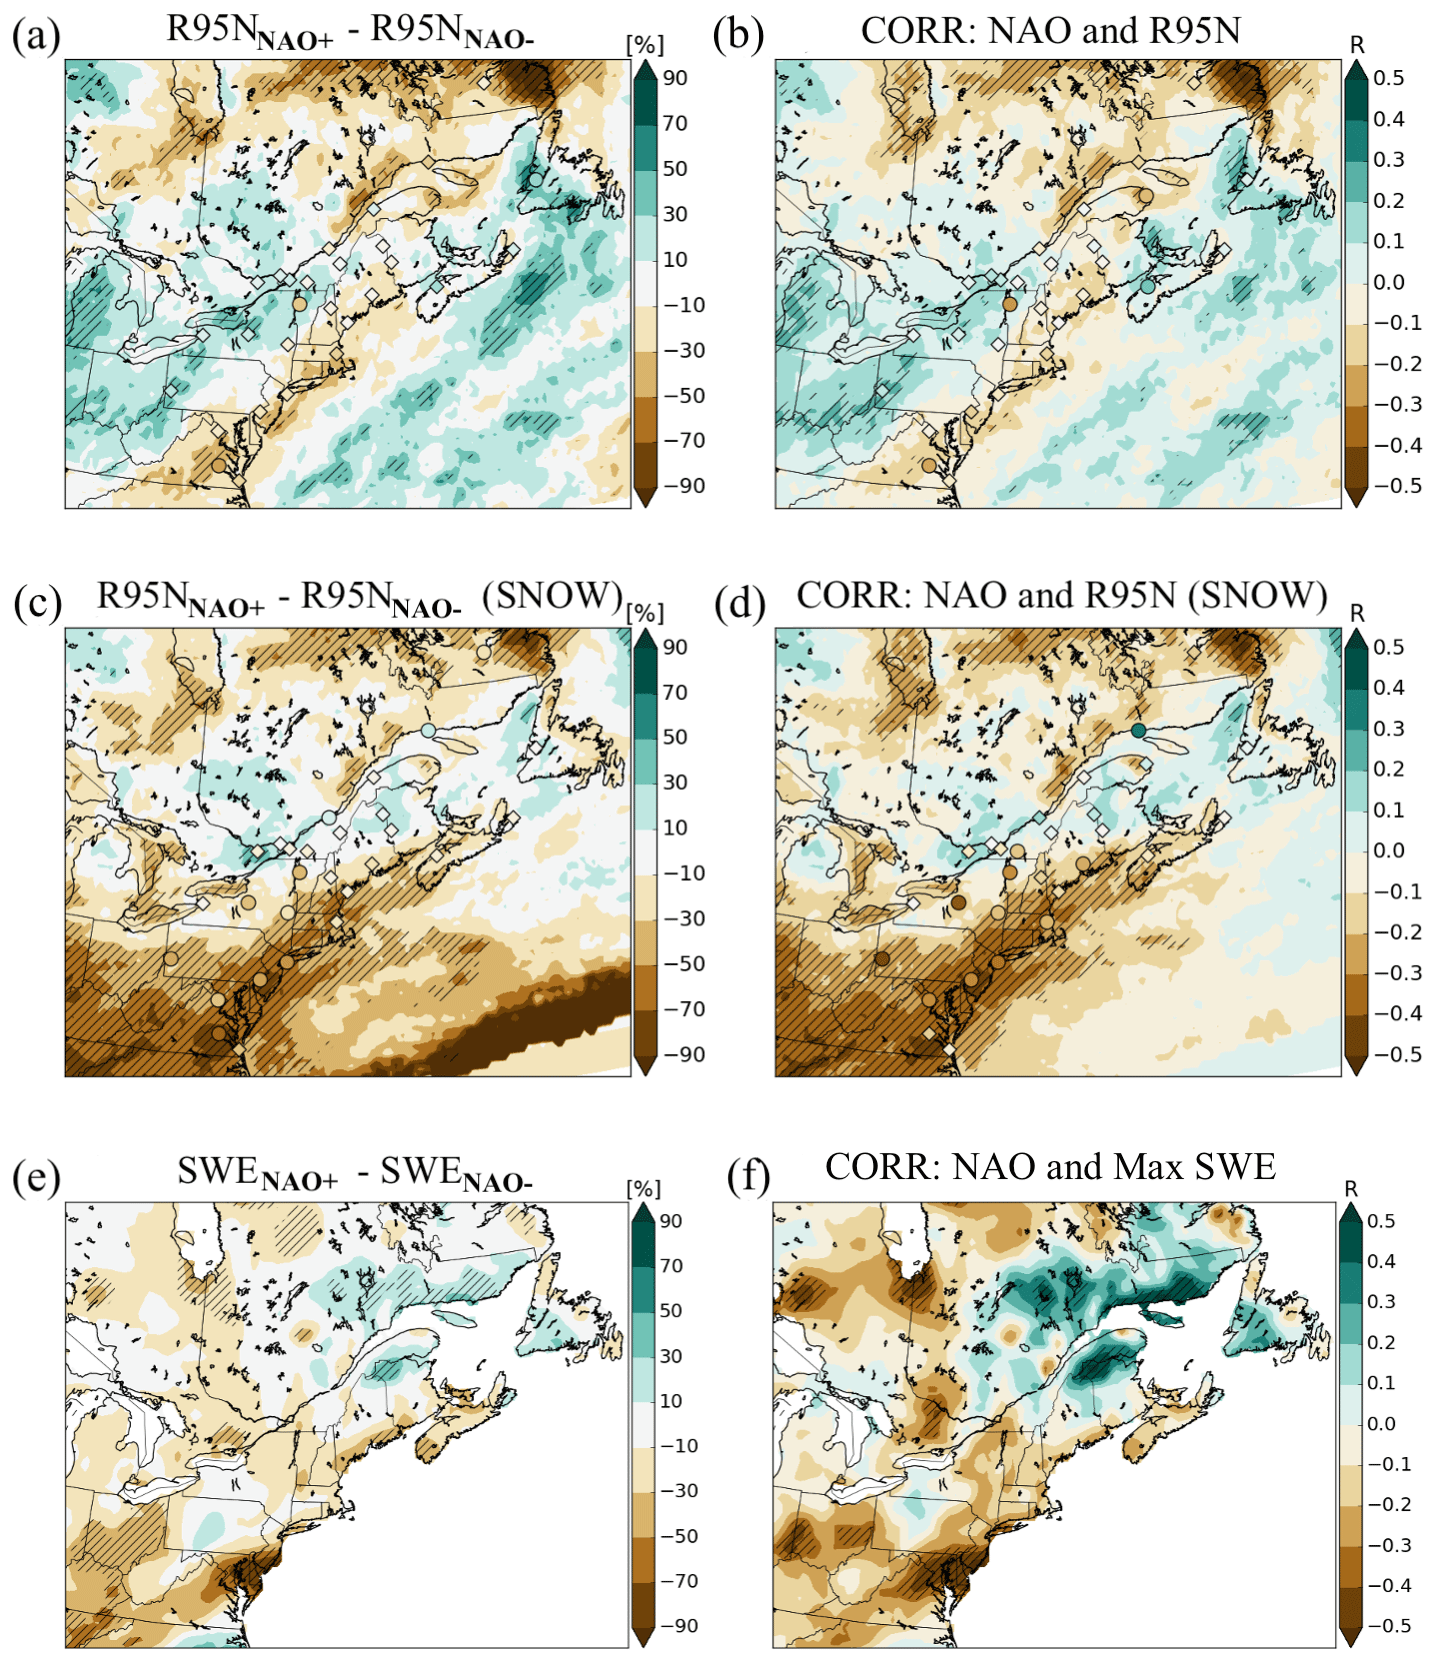
Figure 5(a) Relative difference between the number of heavy precipitation days (above 95th percentile of daily precipitation, R95N) during positive NAO and negative NAO months (40-month composites, first and fourth quartiles) in winter (DJFM). (b) Correlation coefficients between number of heavy precipitation days and monthly NAOI. Hatched areas represent statistically significant values at the 0.05 level. Shaded circles represent station-based correlation coefficients that are statistically significant at the 0.05 level, and diamonds represent values that are not statistically significant. (c, d) As in panels (a) and (b) but for the relationship between monthly NAO and the number of heavy snowfall days (above 95th percentile of daily snowfall). (e, f) As in panels (a) and (b) but for the relationship between cold season averaged NAO and annual maximum snowpack depth.
While the spatial distribution of the correlation coefficient between the NAO and SWE (Fig. 5e and f) is less homogeneous, it is coherent with the results for mean and heavy snowfall. This is not surprising as high snowfall is well correlated with maximum SWE in winter. Significant negative correlation is again shown in the Mid-Atlantic coastal region. As south of 40∘ N snow that falls during storms usually stays on the ground only for few days, this also suggests that there is an increase in heavy snowstorms affecting the Mid-Atlantic during negative NAO winters. Although not statistically significant, negative NAO winters tend to be linked to a 15 %–30 % increase in snow cover depth in New England compared to positive NAO. In eastern Quebec, there is a significant positive correlation between SWE and NAO, which is also consistent with the positive correlation with snowfall and S∕P.
As the snowpack is strongly affected by temperature, negative correlations and increase in maximum SWE in the northeastern US during negative NAO could also be partly explained by the colder conditions prevailing in that region during the negative phase (Fig. 6), which was also pointed out in previous studies (Notaro et al., 2006; Ning and Bradley, 2015). In a similar manner, colder temperature witnessed during a positive NAO phase in eastern Quebec (Fig. 6; also in Wettstein and Mearns, 2002) can explain the positive correlation between SWE and the NAO found in that region.
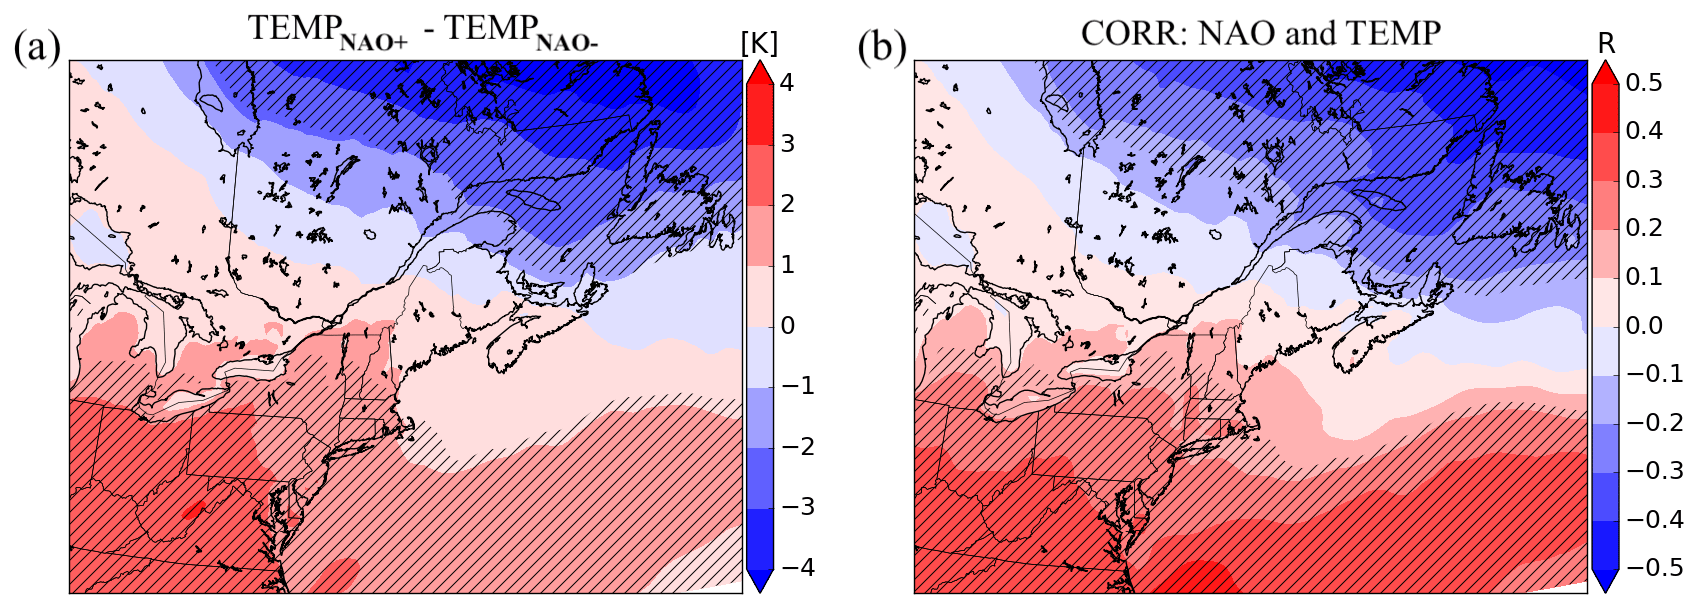
Figure 6(a) Difference between average temperature during positive NAO and negative NAO months (40-month composites, first and fourth quartiles) in winter (DJFM); positive values mean warmer temperatures during high NAO. (b) Correlation coefficients between monthly temperature and monthly NAOI. Hatched areas represent statistically significant values at the 0.05 level.
3.3 Changes in storm tracks
In order to better understand the causes of the precipitation and snowfall anomalies discussed in the previous sections, we analyze the changes in track density and cyclogenesis across North America associated with the two phases of the NAO (Fig. 7).
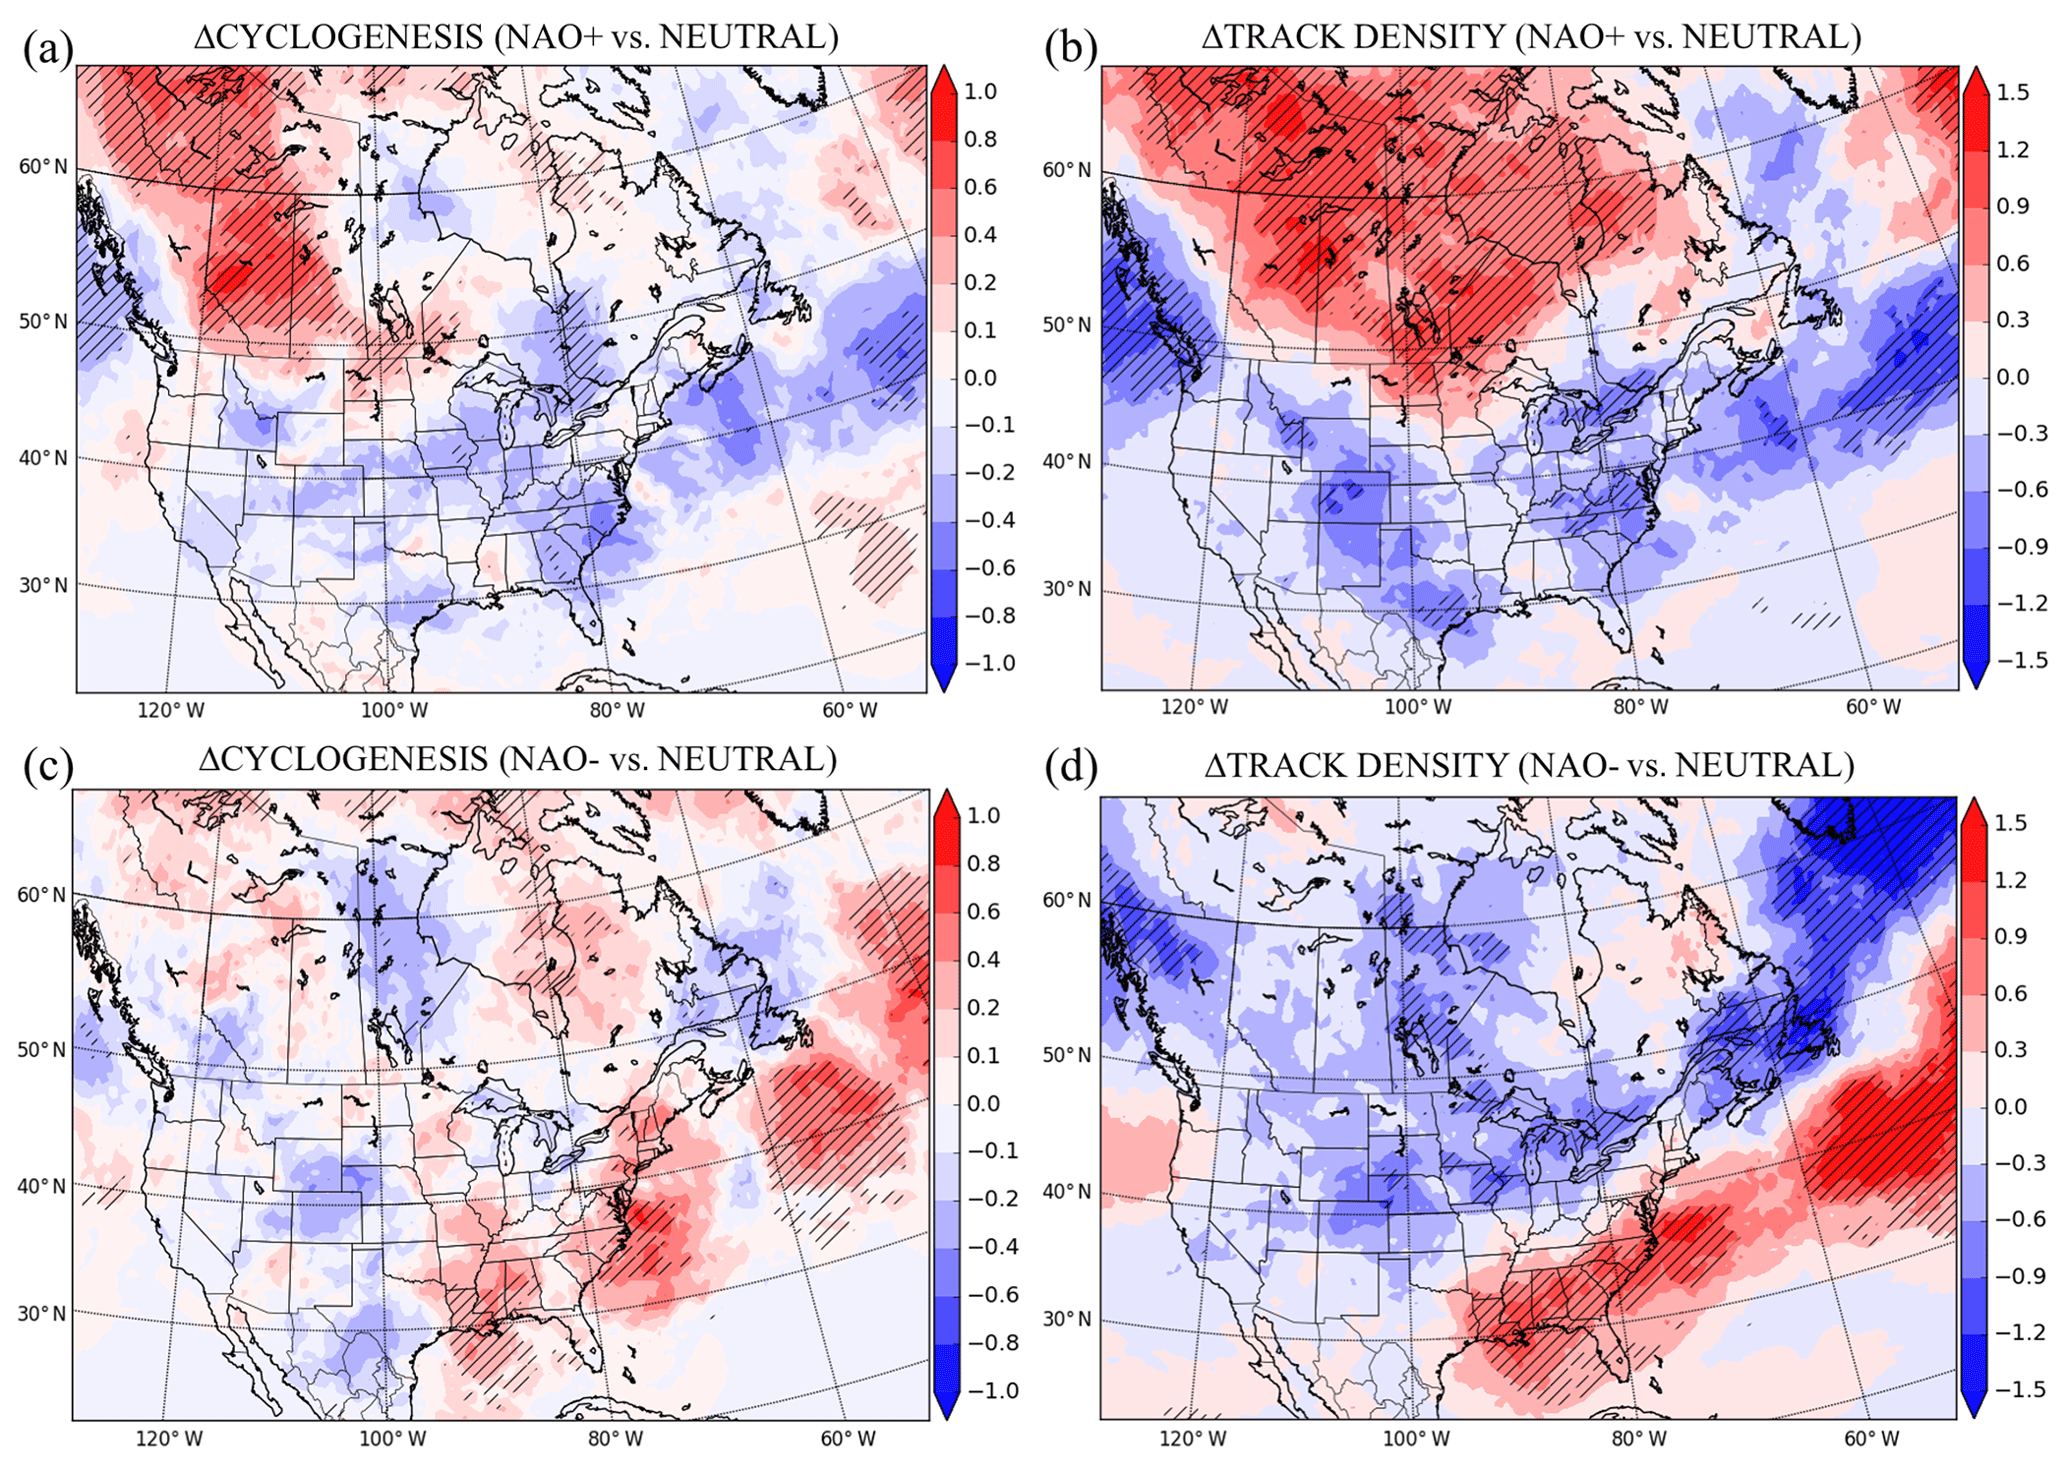
Figure 7Anomalies of (a, c) cyclogenesis and (b, d) track density (cyclone/month per area of 1000 km2) over the course of (a, b) positive NAO and (c, d) negative NAO months (40-month composites, first and fourth quartiles) in winter (DJFM); positive values mean higher cyclone occurrence. Anomalies are calculated in relation to an average neutral NAO month. Hatched areas represent statistically significant values at the 0.05 level.
During positive NAO conditions, the results show a considerable positive anomaly on lee cyclogenesis in Western Canada compared to neutral conditions (Fig. 7a), giving way to an increase in cyclonic activity in Canada and the Arctic during a positive NAO phase (Fig. 7b). However, over the US, there is no significant change in storm tracks, except for a slight decrease in lee cyclogenesis over Colorado (Colorado lows) and Montana.
The most notable result is the increase in cyclone occurrence in the western North Atlantic just offshore of the northeastern US coast during a negative phase of the NAO (Fig. 7d). While a decrease in cyclone occurrence is seen in that region during a positive phase (Fig. 7b), the anomaly is not as strong as during a negative phase. This implies that negative NAO conditions particularly favor an increase in frequency of nor'easters (coastal storms). Near both Cape Hatteras and Cape Cod, which are two typical regions of coastal storm cyclogenesis on the US east coast (Davis et al., 1993), cyclogenesis is favored during negative NAO (Fig. 7c). Another important aspect of the changes in the storm track is the southwest–northeast-oriented dipole in the cyclone occurrence anomaly over the eastern half of the continent during negative NAO months (Fig. 7d). This dipole suggests a southward shift in the storm track as the storm track density decreases over southeast Canada and the northeast US but increases over the southeast US.
The spatial patterns of correlation between the NAO and track density (Fig. 8) are consistent with the anomalies of cyclone occurrence for both positive and negative NAO. Large areas of significant negative correlation are obtained over the southeast US and in the western North Atlantic between 35 and 45∘ N, as well as over Labrador. Over Canada's Western and Arctic regions, the correlation is instead positive, with statistical significance that is reached over a large area. The results also show that more cyclones tend to follow the typical North Atlantic storm track during positive phases, with more cyclones passing directly over Newfoundland and over the North Atlantic, south and east of Greenland during positive NAO phases.

Figure 8Track density correlation with the monthly NAOI in winter (DJFM). Hatched areas represent statistically significant values at the 0.05 level.
Cyclogenesis and the storms displacement are directly related to the upper-air circulation. For that reason, we have also investigated the relationship between NAO and the mean 500 hPa geopotential height. The link between these two variables is more evident over the North Atlantic (Fig. 9), as it is closely related to the definition of the NAO. A dipole pattern of strong positive correlation in the subtropical and midlatitude North Atlantic and a negative correlation in the subpolar North Atlantic are clearly shown. This pattern extends over eastern North America. Over southeastern Canada and the northeastern US, a positive correlation is seen, indicating higher 500 hPa geopotential heights during positive NAO conditions. The difference in the average position of the 5400 m isohypse between positive and negative phases could indicate that troughs are more likely to be present over the eastern part of the continent during negative NAO.
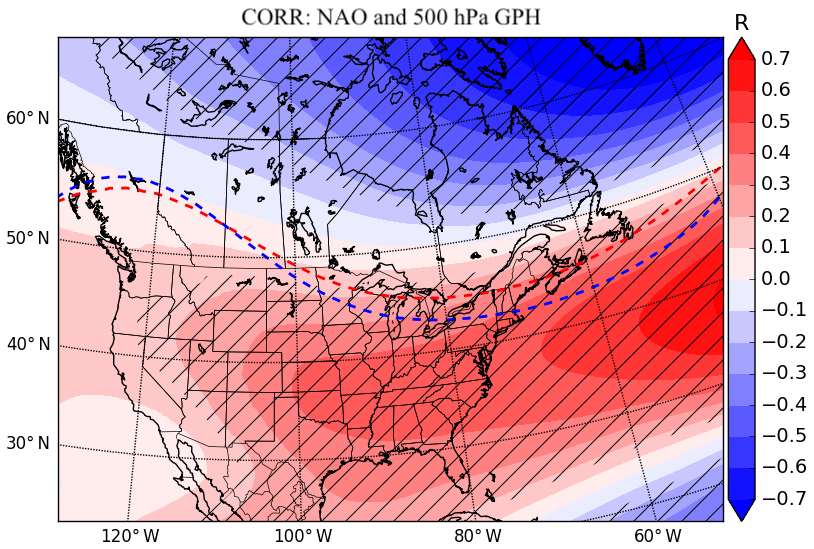
Figure 9Correlation coefficients between monthly 500 hPa geopotential heights and monthly NAOI in winter (DJFM). Hatched areas represent statistically significant values at the 0.05 level. Dashed lines represent the average position of the 5400 m geopotential height isohypse during average low-NAO months (blue) and average high-NAO months (red).
The results presented in the previous section provide insight on the mechanism of winter climate variability in relationship with the NAO. Changes in mean circulation patterns associated to the NAO over North America and the North Atlantic produce significant shifts in cyclogenesis and associated storm tracks, directly impacting regional precipitation and snowfall in the region.
The increase in coastal cyclogenesis near the US east coast during negative phases (Sect. 3.3) is likely caused by more frequent or deeper troughs over eastern North America, as seen in the difference in the average position of the 5400 m isohypse between positive and negative phases (Fig. 9). A region of divergence aloft and positive vorticity advection then more often overlaps the high temperature contrast region near the northern edge of the Gulf Stream offshore of the US east coast, leading to stronger surface cyclogenesis. While their cyclogenesis is favored during a negative NAO phase, the spatial pattern of anomalies shows that cyclones tend to take a more zonal and southern path in the Atlantic (Fig. 7d). Rogers (1990), Serreze et al. (1997) and Pinto et al. (2009) also observed that during negative NAO phases coastal storms often diverge from the continent near the 45th parallel and follow a track almost directly east, as opposed to continuing on a more typical northeastward trajectory following the coastline. This result suggests that they tend to affect the region in the vicinity of their formation area, with strong onshore flow and heaviest snowfall north of their path. But as they rapidly move offshore, their effects are not felt as much in areas further up the east coast. This could explain why the Mid-Atlantic region and New England have slight negative correlations between NAO and precipitation (mean and heavy) but not Atlantic Canada (Figs. 4b and 5b). The more zonal storm track of coastal storms during negative phases is likely caused by the much higher frequency of blockings near Iceland and Greenland, as presented in Fig. 10 (also in Shabbar et al., 2001; Woollings et al., 2008). The presence of a blocking high over Greenland forces the storms to move south of it, which is visible in the significant decrease in number of storms over Newfoundland and south of Greenland (Fig. 7d).
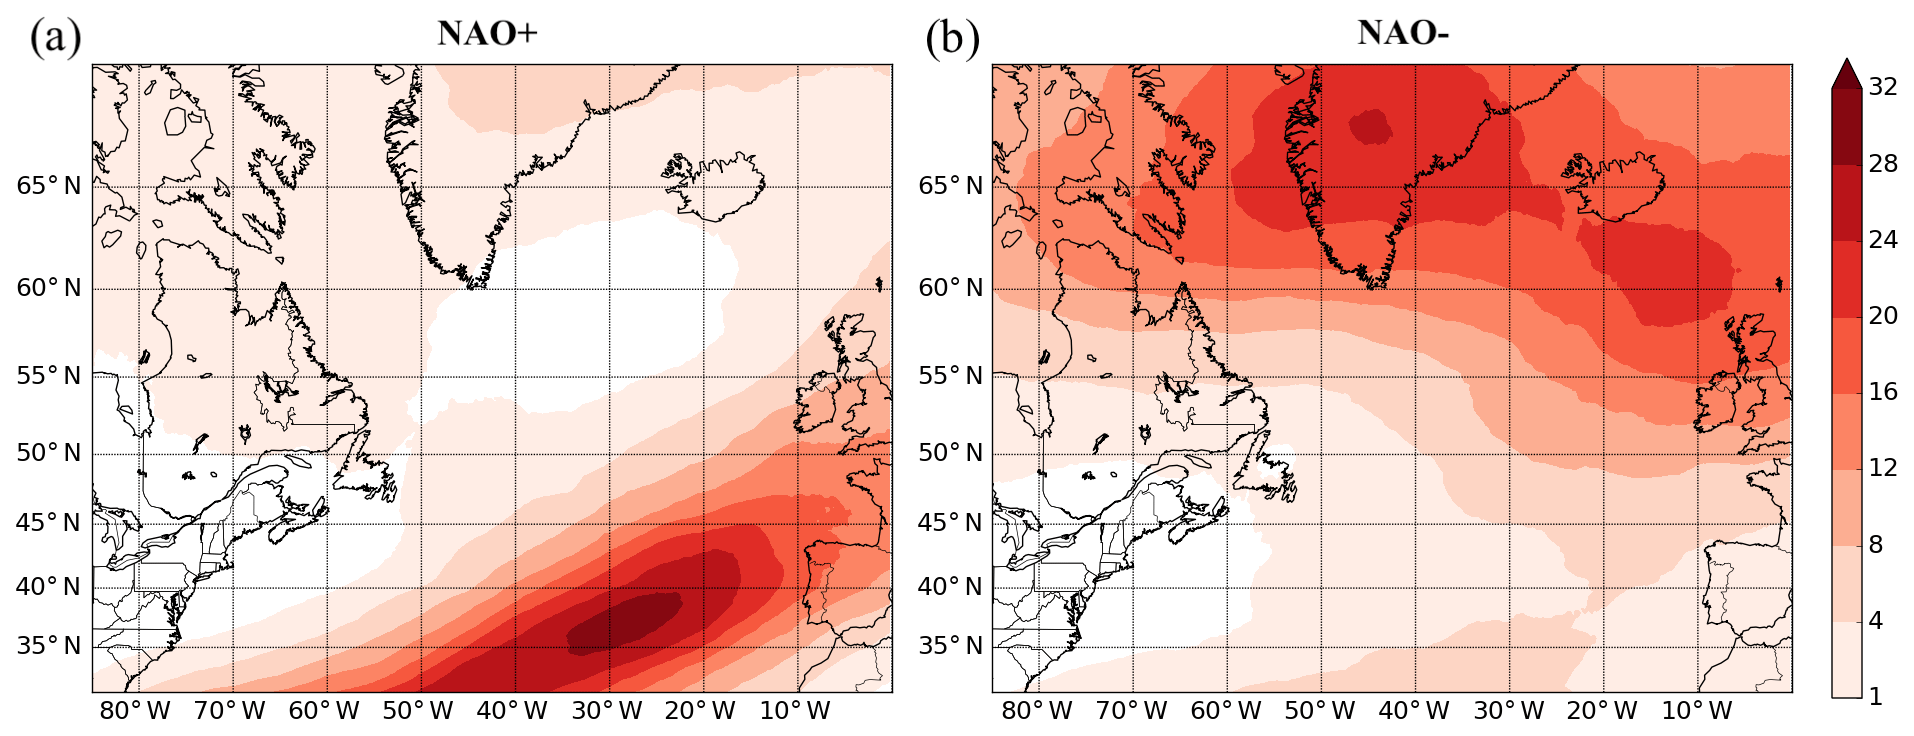
Figure 10Blocking frequency averaged over (a) positive NAO months and (b) negative NAO months (40-month composites, first and fourth quartiles in winter (DJFM).
As the position of the rain/snow boundary during winter storms is strongly linked to the location relative to the storm center (e.g., Donaldson and Stewart, 1989), the southward shift in the storm track over the eastern half of the US explains the more frequent heavy snowfall event, higher snowfall and S∕P witnessed all over the northeastern US and Nova Scotia during negative NAO months. This relationship found between snowfall, S∕P and the NAO is consistent with previous studies that found that major snowstorms that affected the northeastern US are often associated with a negative NAO (Kocin and Uccellini, 2004; Hartley and Keables, 1998).
Over Labrador, a lower (higher) cyclone occurrence during positive (negative) NAO relative to neutral (Fig. 7d) is consistent with the negative correlations found between precipitation and the NAO and between snowfall and the NAO. The higher occurrence of cyclones over Labrador and the western Labrador Sea during negative NAO may be also caused by the more frequent development of a Greenland blocking high during these NAO phases (Fig. 10). While most of the coastal storms will take a zonal path well south of the blocking high, some coastal storms, along with systems coming from the west, will be steered north, west of Greenland because of the anticyclonic circulation associated with the blocking high. Therefore, the results show a higher occurrence of cyclones in the western part of the Labrador Sea, bringing higher-than-normal precipitation to Labrador and southwestern Greenland (Fig. 4a), which was also pointed out in Auger et al. (2017). As they take a more northern track, these low-pressure systems advect warm air in the region, lowering the S∕P.
In western Canada, a positive anomaly on lee cyclogenesis during positive phases (Fig. 8a) gives way to an increase in Alberta clippers forming over the plains and traveling eastward. Alberta clippers (or Canadian clippers) are cyclones that form frequently east (leeward) of the Canadian Rockies, over Alberta or the Canadian territories during the cold season. They are called clippers as they typically travel very rapidly over the continent (clippers were some of the fastest moving ships of the 19th century). Although they are not usually associated with very heavy precipitation, there is an increase in their occurrence during positive NAO over Canada and the northern US (Fig. 7a). This response could have a significant impact on the occurrence of storms in the Prairies region of Canada, such as an increase in prairie blizzard frequency. Furthermore, it explains the slight positive correlation between heavy precipitation and the NAO over the Great Lakes region (Fig. 5b), as these storms tend to move eastward and pass over the Great Lakes. However, these events are mostly in the form of rain as no correlation between heavy snowfall and the NAO is present in that region.
In this study we examined the variability of the winter climate in relation with the NAO during the winter season over North America, with a particular focus on heavy precipitation and snowfall in the northeastern US and southeastern Canada. In order to better understand these changes in precipitation and snowfall, we also investigated the storm track and cyclogenesis variability associated with the NAO phases, as well as the changes in blocking frequency across the North Atlantic Basin.
First, we show that while there is only a slight negative correlation between precipitation and the NAO in the northeastern US, average and heavy snowfall are instead significantly affected by the NAO phase in that region. Both reanalysis and station-based results show that positive NAO phases tend to bring considerably less snowfall compared to negative NAO phases months over a wide region covering Nova Scotia, New England and the Mid-Atlantic of the United States. Henceforth, a significant negative correlation is also seen between the snowfall-to-precipitation ratio and the NAO in the same region. These results are explained by the increase in cyclogenesis of coastal storms near the US east coast during negative NAO phases, as well as a southward shift in the mean storm track over the United States. This increase in cyclogenesis is likely caused by more frequent or deeper troughs over the eastern US. During negative NAO phases, the more frequent blocking over Greenland also forces cyclones to follow a more southerly and zonal storm track in the North Atlantic, leading to fewer cyclones tracking directly over New England and Atlantic Canada. As a result, negative correlations between the NAO and precipitation, snowfall, and S∕P in the coastal northeastern US slowly fade when moving northward 45∘ N. Moreover, positive NAO phases are linked to a considerable increase in lee cyclogenesis east of the Canadian Rockies compared to neutral NAO conditions. As cyclones that form due to lee cyclogenesis usually travel eastward across the continent to affect southeastern Canada, a slight positive correlation is found between cyclone occurrence and the NAO over most of eastern Canada. This causes more frequent heavy precipitation events to occur over the Great Lakes region during positive NAO months. Even with the increase (decrease) of cyclone occurrence during positive (negative) NAO over southeastern Canada, the only regions where total precipitation is significantly positively correlated to the NAO phase are southern Ontario and limited parts of eastern Quebec and southern Newfoundland.
To conclude, using a combination of station-based and high-resolution ERA5 reanalysis data over a longer and more recent period (1979–2018) compared to previous studies, our study provides additional results on the mechanisms responsible for winter precipitations and storm track variability in the northeastern US and southeastern Canada. In particular, very few studies have hitherto investigated in detail the NAO impacts in Canada, and in particular on heavy precipitation and snowfall in this region. Given that global forecast models can predict reasonably well large-scale regimes such as the NAO at a lead time of several weeks (e.g., Johansson, 2007; Scaife et al., 2014; Black et al., 2017), the results presented in this study could prove valuable for improving the subseasonal forecasting of the probability of the occurrence of precipitation events, in particular heavy snowfall events.
ERA5 reanalysis data are provided by the European Centre for Medium-Range Forecasts (https://www.ecmwf.int/en/forecasts/datasets/reanalysis-datasets/era5, last access: 24 November 2020; Hersbach et al., 2020). The NAO index data are provided by the National Center for Atmospheric Research (https://climatedataguide.ucar.edu/climate-data/hurrell-north-atlantic-oscillation-nao-index-station-based, last access: 24 November 2020; Hurrell and National Center for Atmospheric Research Staff, 2020). The cyclone tracking algorithm is made available upon request.
JC performed the analysis and wrote the manuscript. FSRP contributed to the analysis design, interpretation of the results and writing of the manuscript.
The authors declare that they have no competing interests.
We acknowledge the European Centre for Medium-Range Weather Forecasts (ECMWF) for providing access to ERA-5 reanalysis data. Additionally, we thank Katja Winger for helping in the design of the storm tracking algorithm and Gabriele Messori for helpful comments on the manuscript.
This research has been supported by the Natural Sciences and Engineering Research Council of Canada (grant no. RGPIN-2018-04981) and the Fonds de Recherche du Quebec – Nature et Technologies (grant no. 2020-NC-268559).
This paper was edited by Lukas Papritz and reviewed by two anonymous referees.
Amante, C. and Eakins, B. W.: ETOPO1 1 Arc-Minute Global Relief Model: Procedures, Data Sources and Analysis, NOAA Technical Memorandum NESDIS NGDC-24, National Geophysical Data Center, NOAA, Boulder, Colorado, https://doi.org/10.7289/V5C8276M, 2009.
Anstey, J. A., Davini, P., Gray, L. J., Woollings, T. J., Butchart, N., Cagnazzo, C., Christiansen, B., Hardiman, S. C., Osprey, S. M., and Yang, S.: Multi-model analysis of Northern Hemisphere winter blocking: Model biases and the role of resolution, J. Geophys. Res.-Atmos., 118, 3956–3971, https://doi.org/10.1002/jgrd.50231, 2013.
Archambault, H. M., Bosart, L. F., Keyser, D., and Aiyyer, A. R.: Influence of large-scale flow regimes on cool-season precipitation in the northeastern United States, Mon.Weather Rev., 136, 2945–2963, https://doi.org/10.1175/2007MWR2308.1, 2008.
Auger, J. D., Birkel, S. D., Maasch, K. A., Mayewski, P. A., and Schuenemann, K. C.: Examination of precipitation variability in Southern Greenland, J. Geophys. Res.-Atmos., 122, 6202–6216, https://doi.org/10.1002/2016JD026377, 2017.
Black, J., Johnson, N. C., Baxter, S., Feldstein, S. B., Harnos, D. S., and L'Heureux, M. L.: The predictors and forecast skill of Northern Hemisphere teleconnection patterns for lead times of 3–4 weeks, Mon. Weather Rev., 145, 2855–2877, https://doi.org/10.1175/MWR-D-16-0394.1, 2017.
Bonsal, B. and Shabbar, A.: Impacts of large-scale circulation variability on low streamflows over Canada: a review, Can. Water Resour. J., 33, 137–154, https://doi.org/10.4296/cwrj3302137, 2008.
Bradbury, J. A., Dingman, S. L., and Keim, B. D.: New England drought and relations with large scale atmospheric circulation patterns 1, J. Am. Water Resour. Assoc., 38, 1287–1299, https://doi.org/10.1111/j.1752-1688.2002.tb04348.x, 2002a.
Bradbury, J. A., Keim, B. D., and Wake, C. P.: US East Coast trough indices at 500 hpa and New England winter climate variability, J. Climate, 15, 3509–3517, https://doi.org/10.1175/1520-0442(2002)015<3509:usecti>2.0.co;2, 2002b.
Bradbury, J. A., Keim, B. D., and Wake, C. P.: The influence of regional storm tracking and teleconnections on winter precipitation in the Northeastern United States, Ann. Assoc. Am. Geogr., 93, 544–556, https://doi.org/10.1111/1467-8306.9303002, 2003.
Davis, R. E., Demme, G., and Dolan, R.: Synoptic climatology of Atlantic Coast north-easters, Int. J. Climatol., 13, 171–189, https://doi.org/10.1002/joc.3370130204, 1993.
Donaldson, N. and Stewart, R.: On the precipitation regions within two storms affecting Atlantic Canada, Atmos.-Ocean, 27, 108–129, https://doi.org/10.1080/07055900.1989.9649330, 1989.
Hanley, J. and Caballero, R.: Objective identification and tracking of multicentre cyclones in the era-interim reanalysis dataset, Q. J. Roy. Meteorol. Soc., 138, 612–625, https://doi.org/10.1002/qj.948, 2012.
Hartley, S. and Keables, M. J.: Synoptic associations of winter climate and snowfall variability in New England, usa, 1950–1992, Int. J. Climatol., 18, 281–298, https://doi.org/10.1002/(sici)1097-0088(19980315)18:3<281::aid-joc245>3.0.co;2-f, 1998.
Hersbach, H., Bell, B., Berrisford, P., Hirahara, S., Horanyi, A., Munoz-Sabater, J., Nicolas, J., Peubey, C., Radu, R., Schepers, D., Simmons, A., Soci, C., Abdalla, S., Abellan, X., Balsamo, G., Bechtold, P., Biavati, G., Bidlot, J., Bonavita, M., De Chiara, G., Dahlgren, P., Dee, D., Diamantakis, M., Dragani, R., Flemming, J., Forbes, R., Fuentes, M., Geer, A., Haimberger, L., Healy, S., Hogan, R. J., Holm, E., Janiskova, M., Keeley, S., Laloyaux, P., Lopez, P., Radnoti, G., de Rosnay, P., Rozum, I., Vamborg, F., Villaume, S., and Thepaut, J.-N.: The ERA5 global reanalysis, Q. J. Roy. Meteorol. Soc., 146, 1999–2049, https://doi.org/10.1002/qj.3803, 2020.
Huntington, T. G., Hodgkins, G. A., Keim, B. D., and Dudley, R. W.: Changes in the proportion of precipitation occurring as snow in New England (1949–2000), J. Climate, 17, 2626–2636, https://doi.org/10.1175/1520-0442(2004)017<2626:citpop>2.0.co;2, 2004.
Hurrell, J. W.: Decadal trends in the North Atlantic Oscillation: regional temperatures and precipitation, Science, 269, 676–679, https://doi.org/10.1126/science.269.5224.676, 1995.
Hurrell, J. W. and Van Loon, H.: Decadal variations in climate associated with the North Atlantic Oscillation, in: Climatic change at high elevation sites, Springer, Dordrecht, the Netherlands, 69–94, https://doi.org/10.1007/978-94-015-8905-5_4, 1997.
Hurrell, J. W. and National Center for Atmospheric Research Staff (Eds.): The Climate Data Guide: Hurrell North Atlantic Oscillation (NAO) Index (station-based), available at: https://climatedataguide.ucar.edu/climate-data/hurrell-north-atlantic-oscillation-nao-index-station-based, last access: 12 March 2020.
Johansson, Å.: Prediction skill of the NAO and PNA from daily to seasonal time scales, J. Climate, 20, 1957–1975, https://doi.org/10.1175/jcli4072.1, 2007.
Kocin, P. J. and Uccellini, L. W.: Northeast snowstorms (volume 1: Overview, volume 2: The cases), American Meteorological Society, Massachusetts, USA, 2004.
Morin, J., Block, P., Rajagopalan, B., and Clark, M.: Identification of large scale climate patterns affecting snow variability in the Eastern United States, Int. J. Climatol., 28, 315–328, https://doi.org/10.1002/joc.1534, 2008.
Murray, R. J. and Simmonds, I.: A numerical scheme for tracking cyclone centres from digital data. part ii: Application to January and July general circulation model simulations, Aust. Meteorol. Mag., 39, 167–180, 1991.
Neu, U., Akperov, M. G., Bellenbaum, N., Benestad, R., Blender, R., Caballero, R., Cocozza, A., Dacre, H. F., Feng, Y., Fraedrich, K., Grieger, J., Gulev, S., Hanley, J., Hewson, T., Inatsu, M., Keay, K., Kew, S. F., Kindem, I., Leckebusch, G. C., Liberato, M. L. R., Lionello, P., Mokhov, I. I., Pinto, J. G., Raible, C. C., Reale, M., Rudeva, I., Schuster, M., Simmonds, I., Sinclair, M., Sprenger, M., Tilinina, N. D., Trigo, I. F., Ulbrich, S., Ulbrich, U., Wang, X. L., and Wernli, H.: IMILAST: A community effort to intercompare extratropical cyclone detection and tracking algorithms, B. Am. Meteorol. Soc., 94, 529–547, https://doi.org/10.1175/bams-d-11-00154.1, 2013.
Ning, L. and Bradley, R. S.: Winter climate extremes over the Northeastern United States and Southeastern Canada and teleconnections with large-scale modes of climate variability, J. Climate, 28, 2475–2493, https://doi.org/10.1175/jcli-d-13-00750.1, 2015.
Notaro, M., Wang, W., and Gong, W.: Model and observational analysis of the Northeast US regional climate and its relationship to the pna and nao patterns during early winter, Mon. Weather Rev., 134, 3479–3505, https://doi.org/10.1175/mwr3234.1, 2006.
Pausata, F. S. R., Gaetani, M., Messori, G., Kloster, S., and Dentener, F. J.: The role of aerosol in altering North Atlantic atmospheric circulation in winter and its impact on air quality, Atmos. Chem. Phys., 15, 1725–1743, https://doi.org/10.5194/acp-15-1725-2015, 2015.
Pfahl, S. and Wernli, H.: Quantifying the relevance of cyclones for precipitation extremes, J. Climate, 25, 6770–6780, https://doi.org/10.1175/jcli-d-11-00705.1, 2012.
Pinto, J. G., Zacharias, S., Fink, A. H., Leckebusch, G. C., and Ulbrich, U.: Factors contributing to the development of extreme North Atlantic cyclones and their relationship with the NAO, Clim. Dynam., 32, 711–737, https://doi.org/10.1007/s00382-008-0396-4, 2009.
Resio, D. T. and Hayden, B. P.: Recent secular variations in mid-Atlantic winter extratropical storm climate, J. Appl. Meteorol., 14, 1223–1234, https://doi.org/10.1175/1520-0450(1975)014<1223:rsvima>2.0.co;2, 1975.
Riviere, G. and Orlanski, I.: Characteristics of the atlantic storm-track eddy activity and its relation with the North Atlantic Oscillation, J. Atmos. Sci., 64, 241–266, https://doi.org/10.1175/jas3850.1, 2007.
Rogers, J. C.: Patterns of low-frequency monthly sea level pressure variability (1899–1986) and associated wave cyclone frequencies, J. Climate, 3, 1364–1379, https://doi.org/10.1175/1520-0442(1990)003<1364:polfms>2.0.co;2, 1990.
Scaife, A. A., Arribas, A., Blockley, E., Brookshaw, A., Clark, R. T., Dunstone, N., Eade, R., Fereday, D., Folland, C. K., Gordon, M., Hermanson, L., Knight, J. R., Lea, D. J., MacLachlan, C., Maidens, A., Martin, M., Peterson, A. K., Smith, D., Vellinga, M., Wallace, E., Waters, J., and Williams, A.: Skillful long-range prediction of European and North American winters, Geophys. Res. Lett., 41, 2514–2519, https://doi.org/10.1002/2014gl059637, 2014.
Serreze, M. C., Carse, F., Barry, R. G., and Rogers, J. C.: Icelandic low cyclone activity: Climatological features, linkages with the NAO, and relationships with recent changes in the northern hemisphere circulation, J. Climate, 10, 453–464, https://doi.org/10.1175/1520-0442(1997)010<0453:ilcacf>2.0.co;2, 1997.
Shabbar, A., Huang, J., and Higuchi, K.: The relationship between the wintertime north Atlantic Oscillation and blocking episodes in the North Atlantic, Int. J. Climatol., 21, 355–369, https://doi.org/10.1002/joc.612, 2001.
Stone, D. A., Weaver, A. J., and Zwiers, F. W.: Trends in Canadian precipitation intensity, Atmos.-Ocean, 38, 321–347, https://doi.org/10.1080/07055900.2000.9649651, 2000.
Tibaldi, S. and Molteni, F.: On the operational predictability of blocking, Tellus A, 42, 343–365, https://doi.org/10.1034/j.1600-0870.1990.t01-2-00003.x, 1990.
Wang, X. L., Wan, H., and Swail, V. R.: Observed changes in cyclone activity in Canada and their relationships to major circulation regimes, J. Climate, 19, 896–915, https://doi.org/10.1175/jcli3664.1, 2006.
Wettstein, J. J. and Mearns, L. O.: The influence of the North Atlantic–Arctic Oscillation on mean, variance, and extremes of temperature in the Northeastern United States and Canada, J. Climate, 15, 3586–3600, https://doi.org/10.1175/1520-0442(2002)015<3586:tiotna>2.0.co;2, 2002.
Whan, K. and Zwiers, F.: The impact of ENSO and the NAO on extreme winter precipitation in North America in observations and regional climate models, Clim. Dynam., 48, 1401–1411, https://doi.org/10.1007/s00382-016-3148-x, 2017.
Woollings, T., Hoskins, B., Blackburn, M., and Berrisford, P.: A new Rossby wave–breaking interpretation of the North Atlantic Oscillation, J. Atmos. Sci., 65, 609–626, https://doi.org/10.1175/2007jas2347.1, 2008.