the Creative Commons Attribution 4.0 License.
the Creative Commons Attribution 4.0 License.
 | 09 Nov 2021
Systematic assessment of the diabatic processes that modify low-level potential vorticity in extratropical cyclones
Roman Attinger
Elisa Spreitzer
Maxi Boettcher
Heini Wernli
Hanna Joos
Diabatic processes significantly affect the development and structure of extratropical cyclones. Previous studies quantified the dynamical relevance of selected diabatic processes by studying their influence on potential vorticity (PV) in individual cyclones. However, a more general assessment of the relevance of all PV-modifying processes in a larger ensemble of cyclones is currently missing. Based on a series of twelve 35 d model simulations using the Integrated Forecasting System of the European Centre for Medium-Range Weather Forecasts, this study systematically quantifies the diabatic modification of positive and negative low-level PV anomalies along the cold front, warm front, and in the center of 288 rapidly intensifying extratropical cyclones. Diabatic PV modification is assessed by accumulating PV tendencies associated with each parametrized process along 15 h backward trajectories.
The primary processes that modify PV typically remain temporally consistent during cyclone intensification. However, a pronounced case-to-case variability is found when comparing the most important processes across individual cyclones. Along the cold front, PV is primarily generated by condensation in half of the investigated cyclones in the cold season (October to March). For most of the remaining cyclones, convection or long-wave radiative cooling is the most important process. Similar results are found in the warm season (April to September); however, the fraction of cyclones with PV generation by convection as the most important process is reduced. Negative PV west of the cold front is primarily produced by turbulent mixing of momentum, long-wave radiative heating, or turbulent mixing of temperature. The positive PV anomaly at the warm front is most often primarily generated by condensation in the cold season and by turbulent mixing of momentum in the warm season. Convection is the most important process only in a few cyclones. Negative PV along the warm front is primarily produced by long-wave radiative heating, turbulent mixing of temperature, or melting of snow in the cold season. Turbulent mixing of temperature becomes the primary process in the warm season, followed by melting of snow and turbulent mixing of momentum. The positive PV anomaly in the cyclone center is primarily produced by condensation in most cyclones, with only few cases primarily associated with turbulent mixing or convection.
A composite analysis further reveals that cyclones primarily associated with PV generation by convection exhibit a negative air–surface temperature difference in the warm sector, which promotes a heat flux directed into the atmosphere. These cyclones generally occur over warm ocean currents in the cold season. On the other hand, cyclones that occur in a significantly colder environment are often associated with a positive air–surface temperature difference in the warm sector, leading to PV generation by long-wave radiative cooling. Finally, long-wave radiative heating due to a negative air–surface temperature difference in the cold sector produces negative PV along the cold and warm front, in particular in the cold season.
- Article
(8715 KB) - Full-text XML
- BibTeX
- EndNote


Subgrid-scale physical processes such as cloud microphysics, radiation, and turbulence can substantially influence the life cycle of extratropical cyclones (e.g., Kuo et al., 1991). Previous studies highlight a considerable contribution of condensational heating to the cyclonic circulation of extratropical cyclones (e.g., Davis and Emanuel, 1991; Stoelinga, 1996), thereby aiding in the intensification of these weather systems. Other microphysical processes including evaporation, melting, or sublimation of hydrometeors also have the potential to influence the frontal circulation (Huang and Emanuel, 1991; Szeto and Stewart, 1997; Igel and v. d. Heever, 2014) and the development of extratropical cyclones (Joos and Wernli, 2012; Dearden et al., 2016; Hardy et al., 2017). Furthermore, turbulence (Tory and Reeder, 2005; Adamson et al., 2006) and air–surface interactions (Muir and Reeder, 2010) can also modify the structure and evolution of cyclones and their accompanying fronts.
Studies on the role of diabatic processes for the development of extratropical cyclones frequently adopt the potential vorticity (PV) framework (Hoskins et al., 1985). PV combines information on the static stability and circulation of the atmosphere and is conserved following an air parcel in a frictionless and adiabatic flow (Rossby, 1939; Ertel, 1942). The distribution of PV is essential for the evolution of Rossby waves and surface cyclones. Since material changes in PV are directly linked to latent heating and frictional acceleration, this characteristic can be exploited to identify the physical processes that modify PV.
Applying the PV framework to observed extratropical cyclones revealed that intense mid-level latent heating produces a low-level PV maximum, which enhances the coupling of the lower- and upper-level waves (Manabe, 1956; Davis, 1992; Stoelinga, 1996). In many extratropical cyclones this intense low-level PV production occurs in the so-called warm conveyor belt (Wernli and Davies, 1997; Joos and Wernli, 2012), which is a coherently ascending airstream associated with intense precipitation in extratropical cyclones (Browning, 1990). If PV generation in the warm conveyor belt occurs along the cold front, it can enhance the poleward flow in the warm sector (Lackmann, 2002), whereas if PV generation occurs close to the cyclone center, it can contribute to the cyclone intensification (Binder et al., 2016). However, diabatic PV modification in extratropical cyclones is not confined to condensational heating in the warm conveyor belt. Chagnon et al. (2013) found that evaporative cooling towards the cold air reduces PV behind the front. Additionally, snow sublimation was found to decrease PV north of the warm front in both an idealized baroclinic wave simulation (Crezee et al., 2017) and in a real-case simulation of a North Pacific cyclone (Attinger et al., 2019).
Frictional processes also substantially modify the low-level PV distribution in extratropical cyclones. In general, friction reduces the growth rate of baroclinic disturbances (Valdes and Hoskins, 1988) by reducing the coupling between the upper and lower levels (Adamson et al., 2006), forcing for ascent, and convergence through Ekman pumping (Beare, 2007; Boutle et al., 2015). Conversely, a few studies described the frictional generation of PV along the warm front, which might contribute to an intensification of extratropical cyclones (Stoelinga, 1996; Adamson et al., 2006; Plant and Belcher, 2007; Attinger et al., 2019). Moreover, the interaction of orographically generated low-level PV bands with an upper-level trough can lead to lee cyclogenesis (Aebischer and Schär, 1998).
Finally, diabatic cooling of the warm sector by latent and sensible heat fluxes directed into the ocean was found to increase the stratification of the marine boundary layer, thereby enhancing low-level PV along the cold front in a North Atlantic (Neiman et al., 1990) and North Pacific (Attinger et al., 2019) cyclone. On the other hand, low-level PV is generally reduced in the cold sector of extratropical cyclones, where the comparatively warm ocean destabilizes the boundary layer through surface sensible heat fluxes directed into the atmosphere (Chagnon et al., 2013; Vannière et al., 2016).
Despite great efforts in improving the understanding of diabatic processes (e.g., Vaughan et al., 2015), their correct representation in numerical weather prediction (NWP) and climate models remains a formidable challenge (e.g., Rodwell et al., 2013; Willison et al., 2013). In particular, the intensification of extratropical cyclones was found to be highly sensitive to the adequate representation of diabatic processes (Kuo et al., 1991; Fink et al., 2012). The present study aims at quantifying the relative importance of individual diabatic processes for the generation of positive and negative low-level PV anomalies during the intensification period of extratropical cyclones.
In order to go beyond single case studies, a relatively large set of 288 extratropical cyclones from a series of twelve 35 d model simulations is investigated in this paper. The relevance of diabatic processes is assessed by tracing PV tendencies along backward trajectories following the approach introduced by Crezee et al. (2017) and refined by Spreitzer et al. (2019). This enables the assessment of the relative contribution of different diabatic processes to the modification of PV in a large set of extratropical cyclones and the investigation of the variability of relevant processes across different cases.
The model simulations together with the physical tendencies considered in this study are described in Sect. 2.1. Based on temperature and momentum tendencies of each parametrized process, hourly PV tendencies are computed and accumulated along backward trajectories (Sect. 2.2). Finally, Sect. 2.3 introduces the cyclone and front tracking used to identify low-level PV anomalies within frontal regions. Following this approach, the contribution of different diabatic processes to PV anomalies along the frontal features of extratropical cyclones can be quantified.
2.1 Model simulations
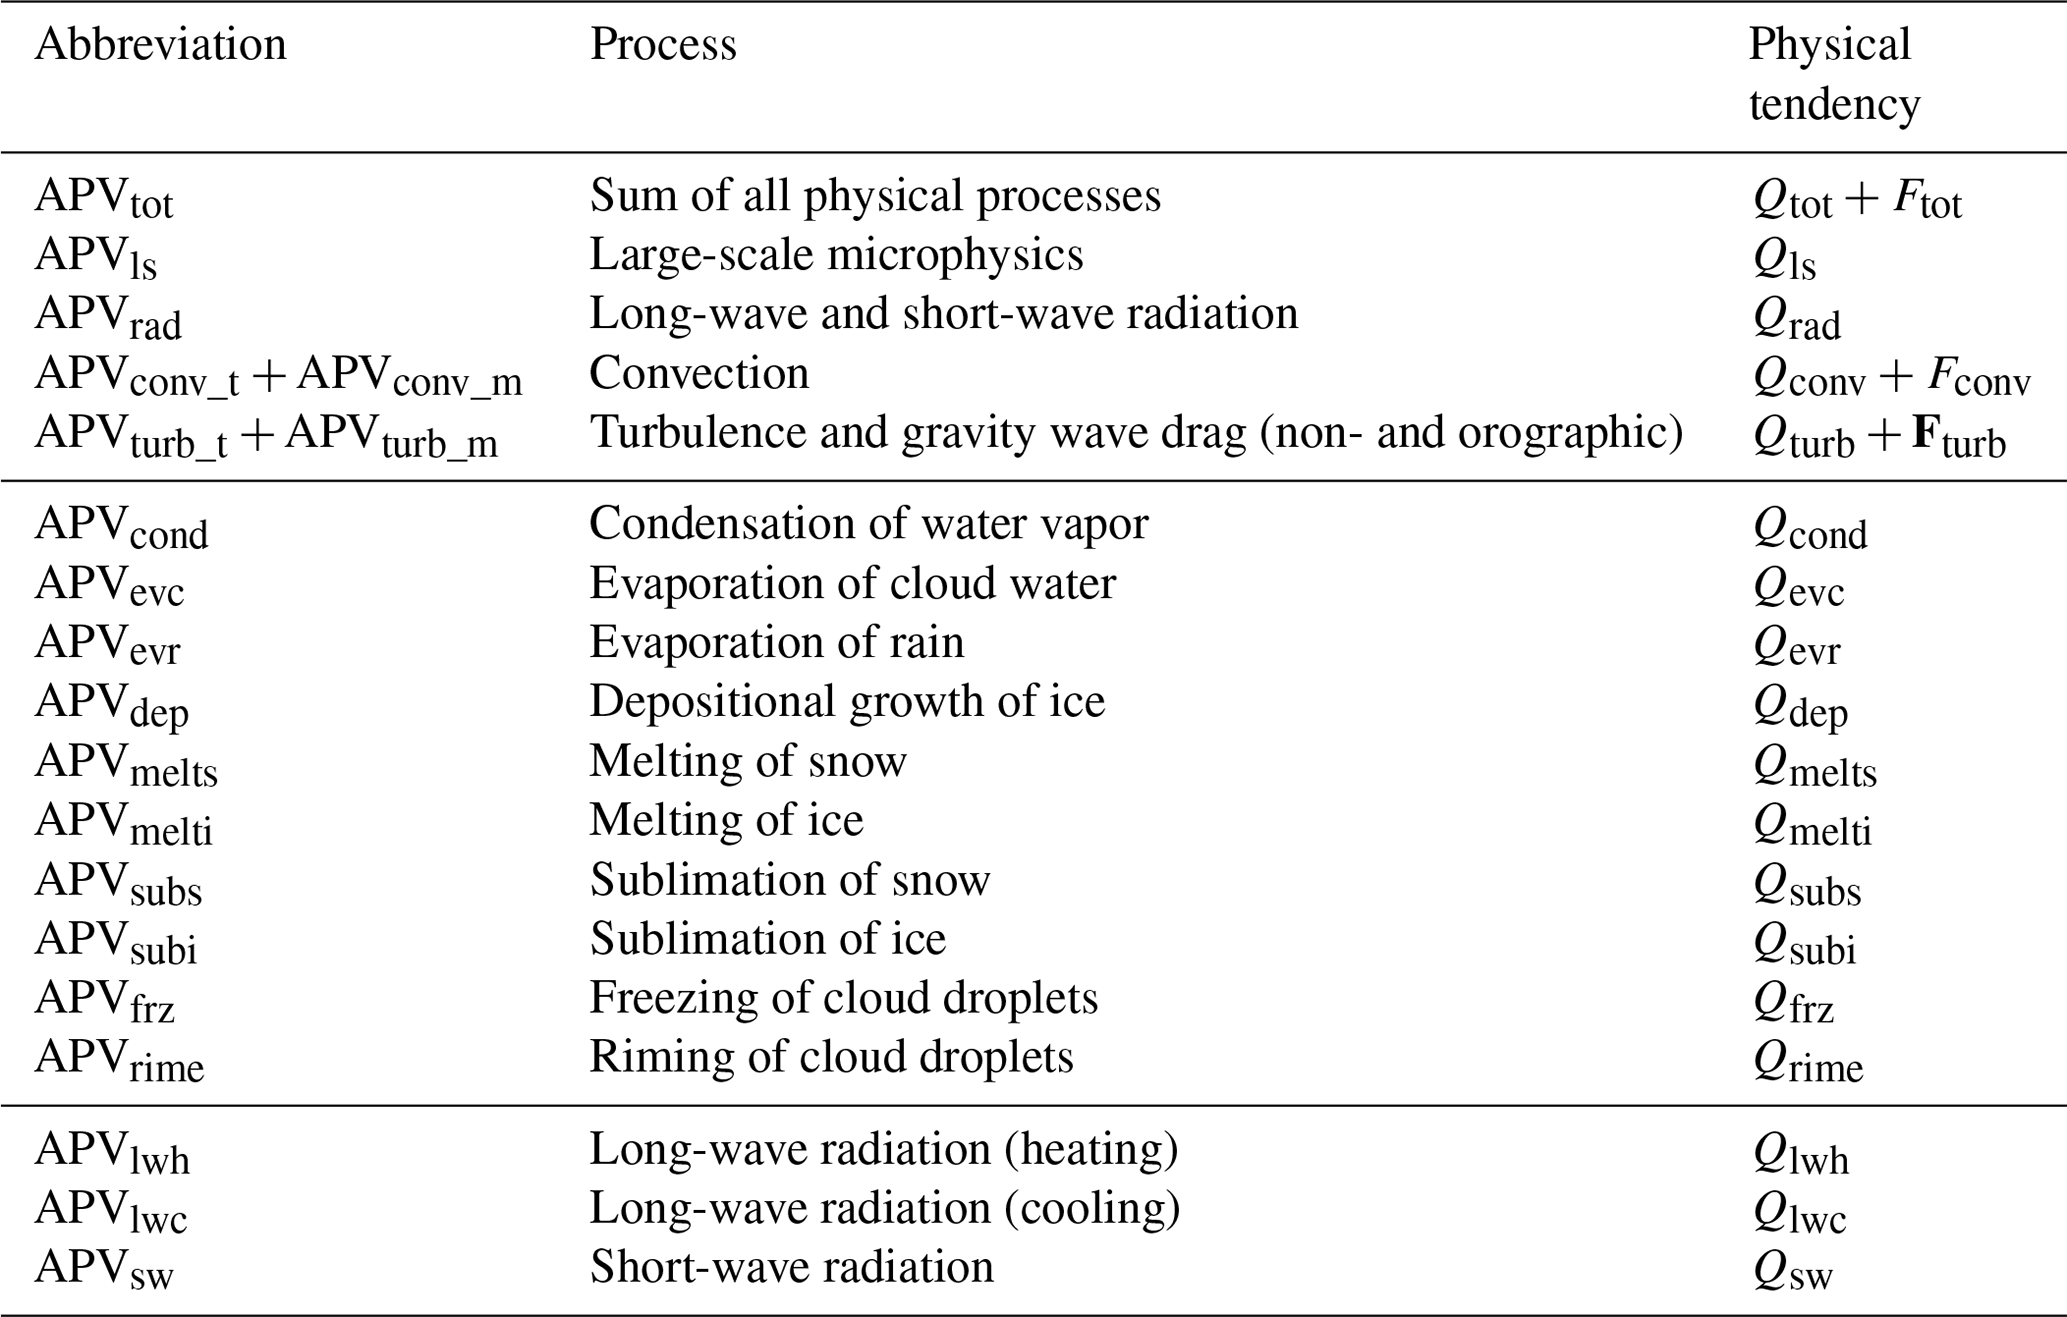
This investigation is based on simulations with the Integrated Forecasting System (IFS) model of the European Centre for Medium-Range Weather Forecasts (ECMWF). The IFS version 43R1, which was operational at ECMWF between November 2016 and July 2017, is run at a cubic-octahedral spectral truncation of TCo639 and with 137 vertical layers. The horizontal resolution corresponds to roughly 16 km, and fields are interpolated to a regular grid of 0.4∘ (approximately 30 km at 45∘). Besides standard meteorological fields, the temperature and momentum tendencies associated with each subgrid-scale physical process implemented in the model are additionally archived as described by Spreitzer et al. (2019) and Attinger et al. (2019). We refer to these studies for additional information about the parametrization schemes used in the IFS model. An overview of the physical processes considered in this study is given in Table 1. Note that temperature tendencies of each process represented by the cloud microphysics parametrization are available, whereas for the convection scheme, only the sum of all phase changing processes described therein is retrieved.
Table 1Abbreviations and description of the diabatic processes considered in this study.
For the purpose of assessing the dynamical influence of diabatic processes in a large number of extratropical cyclones, a series of free simulations has been performed. ECMWF analysis fields from the first day of each month from December 2017 until November 2018 are used as initial conditions for twelve 35 d simulations. We do not refer to these simulations as forecasts, as they of course strongly deviate from reality after a few days. However, the simulated cyclones can be considered physically consistent and in this sense realistic, even if they do not correspond to the observed weather in this 1-year period.
2.2 Linking diabatic processes to PV modification
The PV framework is adopted to assess the relevance of diabatic processes. Following Ertel (1942), the modification of PV along the flow by tendencies of potential temperature (Qi) and momentum (Fi) can be written as
where PVR describes the material rate of change in PV, ρ the air density, η the absolute vorticity vector, θ the potential temperature, and subscript i the considered process. Using hourly 3D temperature and momentum tendencies from the IFS simulations, Eq. (1) can be used to diagnose the modification of PV due to each physical process shown in Table 1. Note that the IFS only imposes horizontal momentum tendencies. Therefore, the second term on the right-hand side of Eq. (1) can be decomposed into a PV generation term associated with the horizontal gradient of potential temperature and another associated with the vertical gradient of potential temperature:
Instantaneous diabatic PV rates can be noisy, can be subject to large cancellation, and might not be directly insightful to understand the formation of large-amplitude PV anomalies. Therefore, it is necessary to consider the temporal evolution of PV along air parcel trajectories (Crezee et al., 2017). Similar to Spreitzer et al. (2019), the change in PV at the location x(t0) due to process i can be described by integrating PVRi over the backward trajectory x(t) from time t to t0:
where APV is the accumulated PV tendency and t0 is the start time of the backward trajectory. Since only hourly values of PVRi are available from the model, Eq. (3) is approximated by summing the hourly PVR fields along the trajectory according to
where n (in hours) is the relevant timescale of PV modification. Based on the results from cyclones in one winter and one summer month, we found that low-level diabatic PV modification generally occurs on timescales of less than 15 h (see Attinger, 2020). Therefore, in this study we adopt a trajectory integration period of 15 h, which is slightly shorter compared to previous studies that used an integration period of 24 h (e.g., Crezee et al., 2017; Attinger et al., 2019). Note that the final time step (tn) of the backward trajectory is not included in the summation since the hourly PVR tendencies are representative for the previous hour. Finally, the total change of PV along the flow can be described by the sum of individual APV terms from the large-scale microphysics, radiation, convection, and turbulence schemes:
where RES is the residual. A number of factors can contribute to the residual, including the non-conservation of PV by the dynamical core (Saffin et al., 2016), the high temporal variability of the considered processes (Neiman and Shapiro, 1993) that is not fully captured by our hourly output fields, interpolation errors during the trajectory and PV computation, or missing PV source terms (Lackmann and Yablonsky, 2004). We refer to Spreitzer et al. (2019) and Attinger et al. (2019) for an in-depth discussion of the potential causes leading to the residual.
Backward trajectories are integrated for 15 h using the Lagrangian analysis tool LAGRANTO (Wernli and Davies, 1997; Sprenger and Wernli, 2015). Trajectories are started hourly from each grid point in the Northern Hemisphere and on each model level. PVR values due to individual processes are then interpolated to and accumulated along the trajectories following Eq. (4).
2.3 Identification of cyclones and fronts
Extratropical cyclones and their accompanying fronts are automatically identified using a customized cyclone and front tracking framework. Cyclones are identified by searching for local minima in the sea level pressure (SLP) field (<1000 hPa) or local maxima in the relative vorticity field on 850 hPa ( s−1). The extent of cyclones is defined by the largest enclosing SLP contour that contains no secondary SLP minimum. The selection of the outermost closed contour is limited by three criteria: (i) its SLP value must be below 1015 hPa, (ii) its SLP value must not exceed the cyclone's core value by more than 40 hPa, and (iii) the enclosed area must be smaller than 44 000 km multiplied by the latitude of the cyclone center. Areas of low SLP in mountainous areas are removed to avoid spurious signals. Cyclones are then tracked in time and only retained if they reach a lifetime of more than 24 h.
This approach identifies approximately 100 extratropical cyclones in the Northern Hemisphere during each 35 d simulation period. As diabatic processes play an important role for the intensification of extratropical cyclones (e.g., Ahmadi-Givi, 2002), only the most rapidly intensifying cyclones are considered in this study. As a measure for their intensification, the normalized central pressure deepening rate (NDR) according to Sanders and Gyakum (1980) is computed for each cyclone:
where ΔSLP is the central pressure difference along the track evaluated over 24 h and ϕ the mean latitude of the cyclone during this period. Extratropical cyclones that reach a value of NDR≥1 bergeron are defined as explosive cyclones (Sanders and Gyakum, 1980), where 1 bergeron corresponds to a SLP decrease of 1 hPa h−1 during 24 h. Only the most strongly deepening systems are retained for our analysis (see Sect. 3.1).
Expanding upon the work from Parfitt et al. (2017), fronts are identified based on a combination of criteria that rely on relative vorticity (ζ), equivalent potential temperature (θe), and the horizontal wind (v) averaged between 950 and 850 hPa. Three frontal measures are used to identify frontal zones:
- M1
-
the horizontal gradient of equivalent potential temperature (∇hθe) evaluated over five grid points (corresponding to approximately 220 km at 45∘ N);
- M2
-
the horizontal advection of equivalent potential temperature (v∇hθe);
- M3
-
the average relative vorticity (ζ) evaluated over nine neighboring grid points.
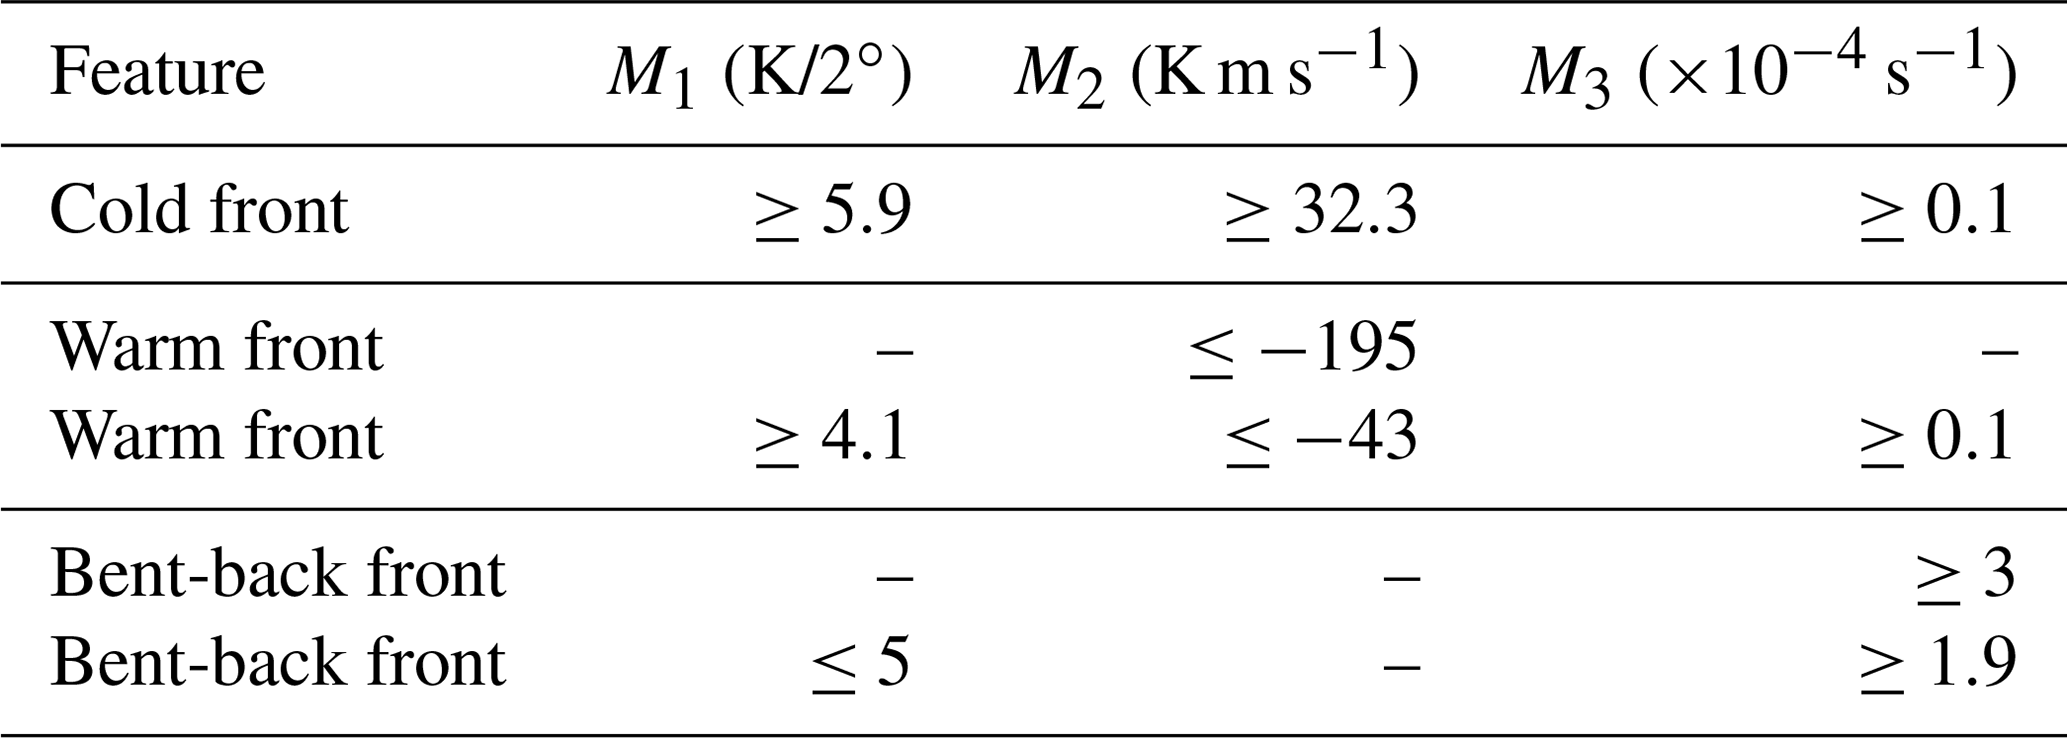
The thresholds given in Table 2 correspond to the combination that best identified manually diagnosed fronts of the most rapidly intensifying cyclones from the January simulation.
Table 2Thresholds used to identify the cold, warm, and bent-back fronts.
Finally, a circular region with a radius of five grid points (i.e., 2∘) defines the cyclone center. Attinger (2020) discusses in more detail the mathematical derivation of the frontal measures as well as the automatic approach used to select the thresholds.
We focus on regions of anomalously high (≥1 PVU) and low ( PVU) PV, subsequently referred to as positive and negative PV anomalies, which occur along the cold and warm fronts. As the bent-back front is generally located close to the cyclone center and since this region is primarily associated with high PV, we combine these two features to form another region of interest. This approach defines five mutually exclusive categories of PV anomalies in each cyclone: positive and negative PV anomalies along the warm and cold fronts, respectively, and positive PV anomalies in the cyclone center, including the bent-back front (see contours in Fig. 2b).
3.1 Selection of cyclones
A variety of different extratropical cyclones occur in each 35 d IFS simulation. The total number of extratropical cyclones identified in the Northern Hemisphere and the number of explosively deepening cyclones in each month are provided in the upper part of Table 3. A larger number of extratropical cyclones, which are also more often rapidly intensifying, are identified during winter than in summer. Taking the variability in cyclone intensification into account, an extended warm season and cold season are defined. Months with (in total) more than nine explosively deepening cyclones are assigned to the cold season (October to March), whereas the other months are assigned to the warm season (April to September).
Table 3Number and intensity of extratropical cyclones in the Northern Hemisphere identified in each simulation period (DEC refers to the 35 d simulation initialized on 1 December 2017). The upper part shows the total number of identified extratropical cyclones and how many thereof are explosively deepening. The lower part shows how many of the 24 selected extratropical cyclones are explosively deepening and their average normalized central pressure deepening rate in bergeron.
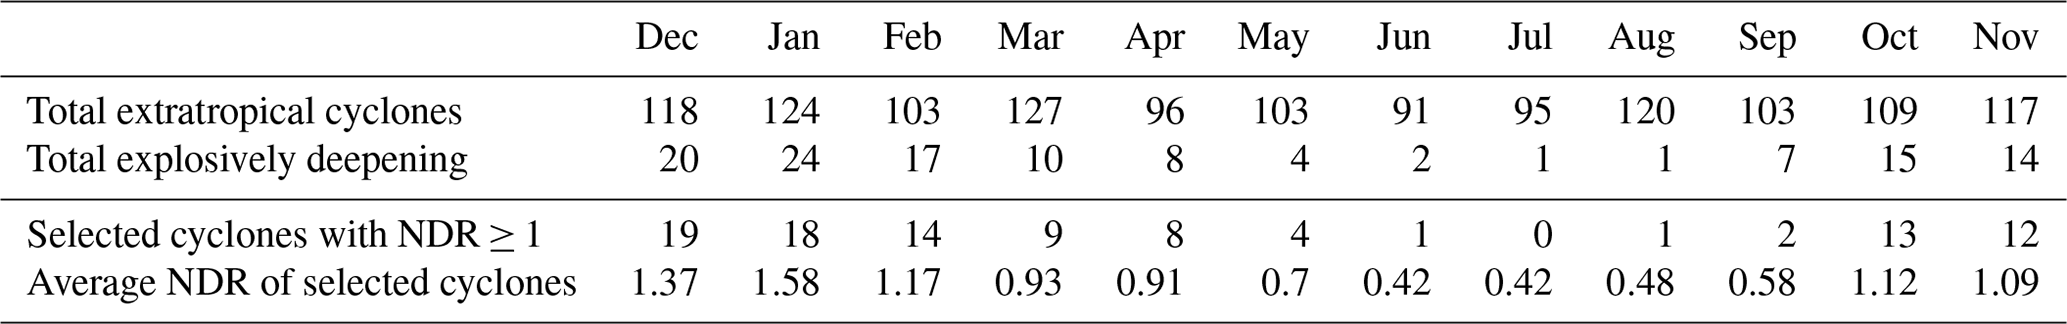
Table 4Average intensity, area, and altitude of investigated PV anomalies.
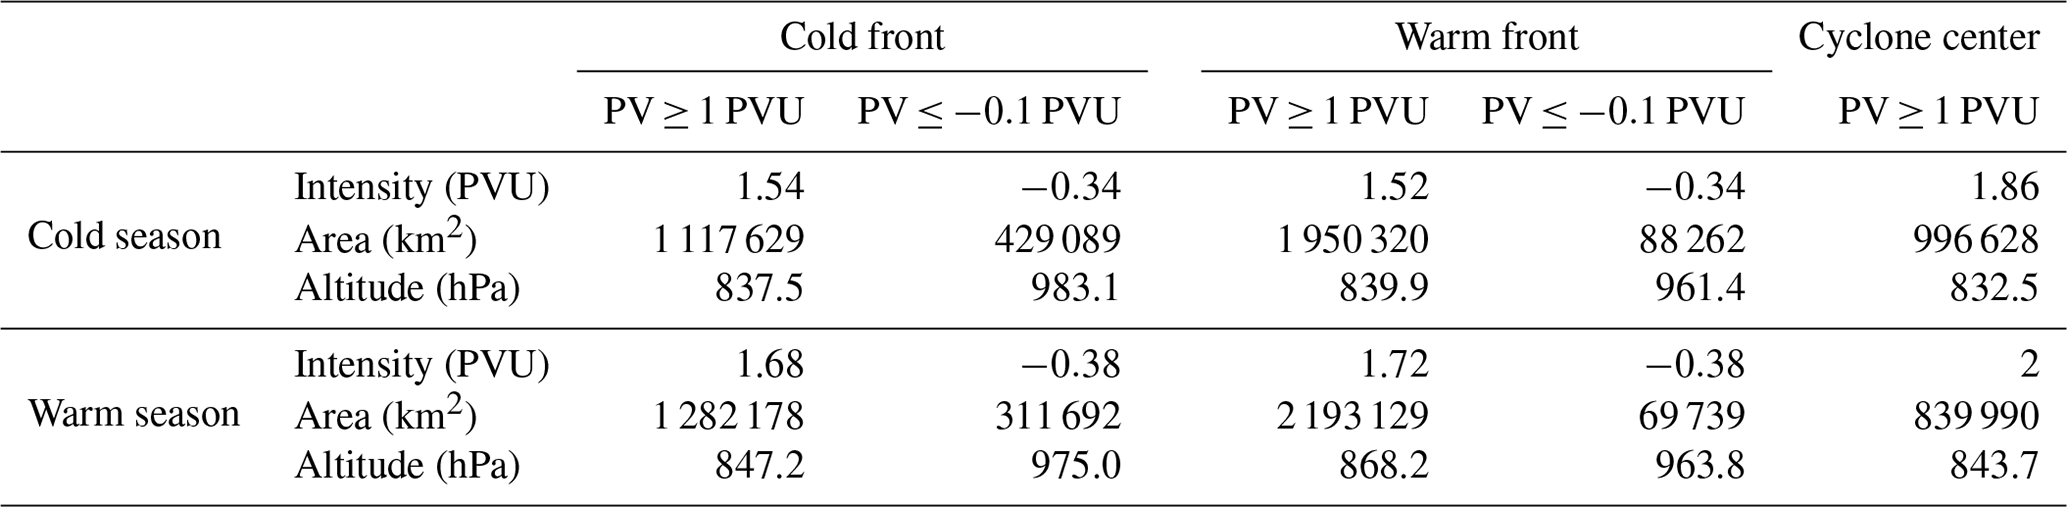

Figure 1Geographical distribution of extratropical cyclones considered in this study for (a) the cold season and (b) the warm season. Percentages depict the fraction of time steps with a cyclone present; i.e., 10 % corresponds to roughly 21 d.
In order to ensure a consistent data set for the subsequent analysis, manual removal of a number of cyclones is required. Specifically, we remove extratropical transition events of tropical cyclones, extratropical cyclones that lack a pronounced low-level PV signature, cyclones accompanied by intense secondary systems along their cold front (as this makes the automatic front affiliation difficult), and cyclones whose fronts cannot be identified with sufficient accuracy. Based on this homogenized data set, 24 cyclones are selected from each simulation, resulting in 144 systems per season. Note that we choose 24 as the number of investigated systems in each month, as this is the largest number of explosively deepening cyclones observed in a single month. However, we do not require the selected cyclones to exceed 1 bergeron because only a few systems would satisfy this criterion. Instead we pick the 24 most rapidly intensifying cyclones after removal of unsuitable candidates as described above. Thereby, we sample an equal number of intense cyclones in each month, which allows us to compare results from different seasons. The number of rapidly intensifying cyclones and the average NDR of the 24 selected cyclones in each month are shown in the lower part of Table 3.
Figure 1 shows the geographical distribution of the selected cyclones. During the cold season, the selected cyclones are almost exclusively oceanic and located in the North Atlantic and North Pacific storm tracks (Fig. 1a). One Mediterranean, two subtropical, and one continental cyclone are also included in the evaluation. In the warm season, fewer of the selected systems occur along the storm tracks, especially over the North Pacific, and more continental cyclones are considered (Fig. 1b). Good qualitative agreement is found with the cyclone climatology based on ERA-40 reanalysis (Wernli and Schwierz, 2006), although absolute frequencies are lower due to the constrained sample size in this study.
Considering the identified fronts, more cyclones are accompanied by a bent-back front in the cold season (77) compared to the warm season (60). The number of cyclones with a cold front is similar in the cold and warm season (119 and 117, respectively), and all 144 cyclones have a warm front in both seasons. Recall that cyclones that do not feature clearly identifiable fronts were manually removed.
3.2 Investigated PV anomalies
Table 4 provides an overview of the average intensity (PVU), size (km2), and altitude (hPa) of the five categories of low-level PV anomalies investigated. Values are obtained from the 144 selected extratropical cyclones in each season and averaged over the 24 h period of maximum cyclone intensification. In both seasons, positive PV anomalies are generally at a higher altitude and have a larger extent than their negative counterparts. In the warm season, both negative and positive PV anomalies are more intense than during the cold season. The warm front is characteristic of the largest positive and the smallest negative PV anomalies.
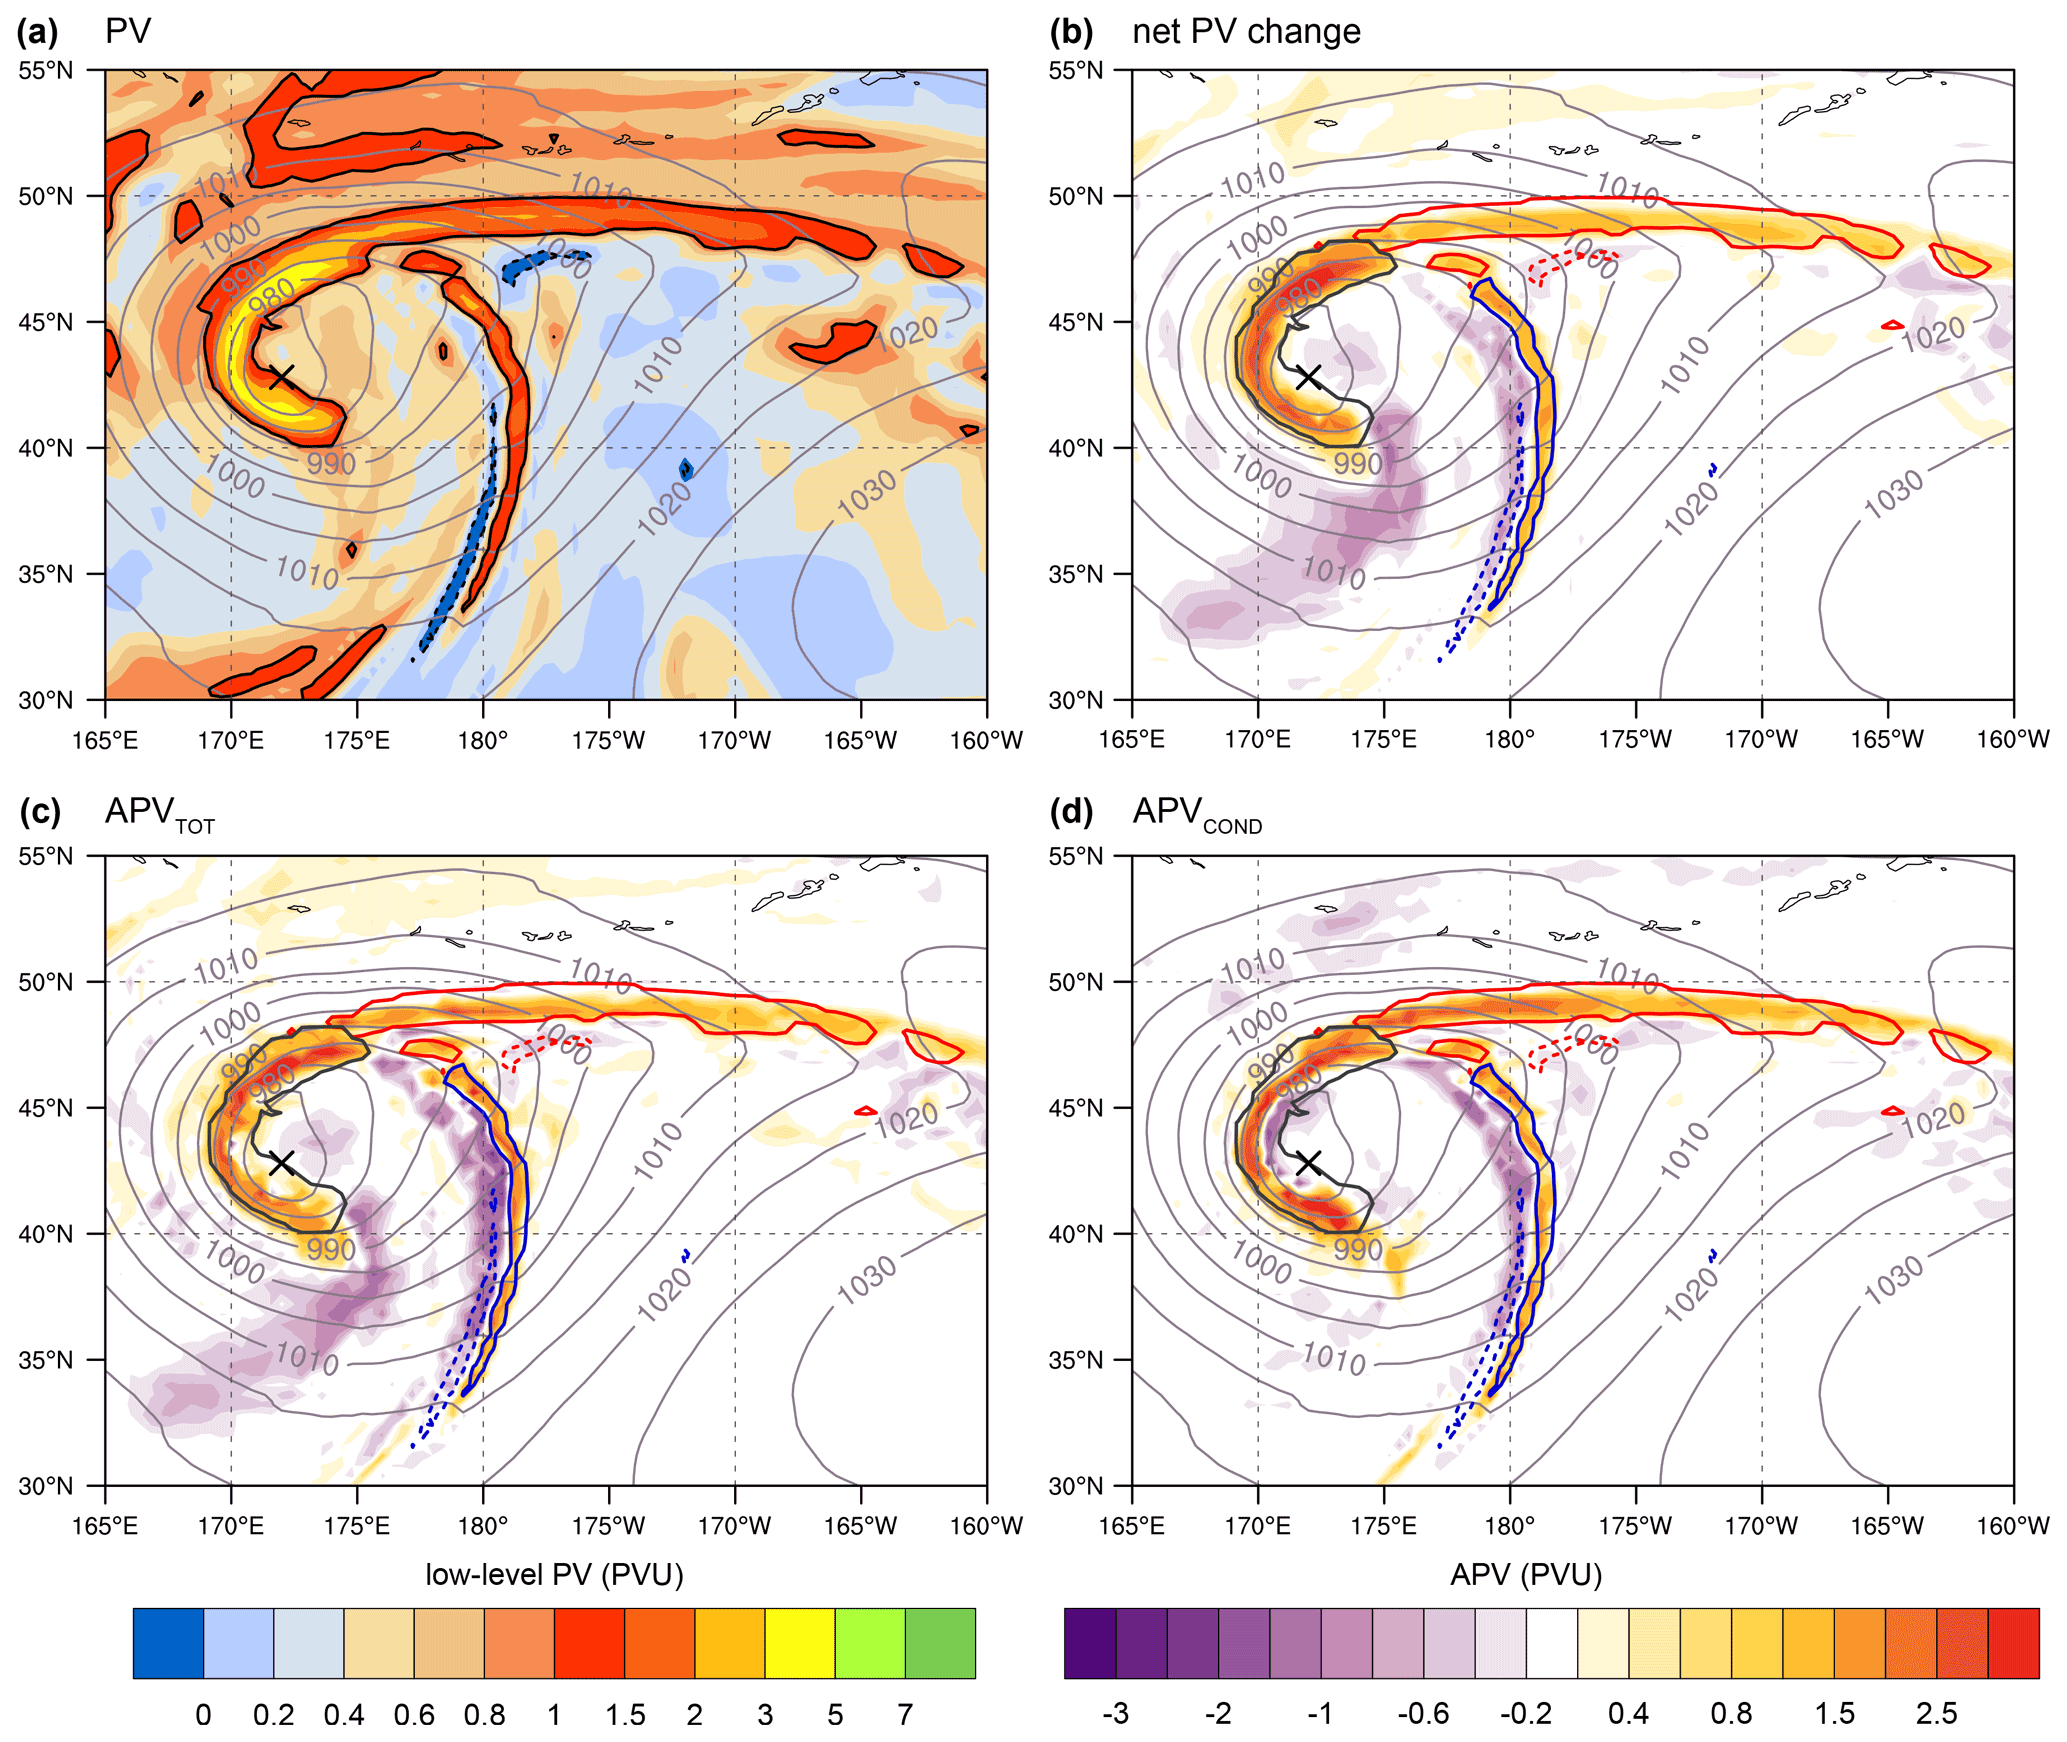
Figure 2An extratropical cyclone over the North Pacific at the time of maximum intensification. (a) Vertically averaged PV between 840 and 780 hPa. Regions with PV ≥ 1 PVU and PV ≤ −0.1 PVU are highlighted by solid and dashed black lines, respectively. (b) Net PV change, (c) total diagnosed PV modification, and (d) effect of condensation on PV along 15 h backward trajectories. The positive and negative PV anomalies along the cold front (blue solid and dashed lines), the positive and negative PV anomalies along the warm front (red solid and dashed lines), and the positive PV anomaly in the cyclone center (dark gray solid line) are highlighted. SLP (gray contours) is overlaid at an interval of 5 hPa, and the SLP minimum is marked by the cross.
The different low-level PV anomalies vertically averaged between 840 and 740 hPa are exemplarily shown in Fig. 2a for a single cyclone. Positive PV anomalies (solid contours) occur along the fronts and in the cyclone center, whereas negative PV anomalies (dashed contours) are found to the west of the cold front and north of the warm front. Note that negative PV anomalies along the warm front generally occur at a lower altitude (Table 4) and thus are not depicted in Fig. 2. The net PV change along 15 h backward trajectories (Fig. 2b) is similar to the full PV (Fig. 2a), indicating that a substantial part of the highlighted PV anomalies is produced within the last 15 h. Regions of increased PV (orange shading) are observed along the fronts and in the cyclone center, whereas decreased PV (purple shading) is found to the west of the cold front. The area of negative net PV change south of the cyclone center is not further considered as it does not fulfill our criterion of a PV anomaly. Additionally, an area of high PV occurs north of the warm front (Fig. 2a), which does not coincide with a region of strong PV increase (Fig. 2b). In this region, high-PV air masses are thus primarily advected.
For the assessment of the physical processes that modify PV, positive and negative PV anomalies are identified at the fronts and in the center of the cyclone. The identified anomalies along the cold front, warm front, and central region are highlighted by blue, red, and dark gray contours, respectively (Fig. 2b–d). Total APV (i.e., Eq. 4 evaluated for all processes) is shown in Fig. 2c. Ideally, this should correspond to the net PV change along the trajectories (Fig. 2b), assuming complete information on the temperature and momentum tendencies from each parametrized process, perfect trajectories, and full PV conservation by the model's advection scheme. Generally, good agreement between total APV and the net PV change is found. The contribution of condensation to the modification of PV along trajectories is shown in Fig. 2d. As expected, condensation is responsible for a large fraction of the PV increase along the fronts and in the cyclone center. Additionally, negative APV due to condensation occurs west of the cold front and east of the bent-back front.

Figure 3Physical processes that contribute to the positive PV anomaly (PV ≥ 1 PVU) in the cyclone center between the surface and 550 hPa during the 24 h period of most rapid cyclone intensification. (a) Time series of APV averaged over the 144 cyclones of the cold season and (b) distribution of APV tendencies in individual cyclones averaged over the 24 h intensification period. The interquartile range is shown by the boxes, the whiskers extend 1.5 times the interquartile range, the median is shown by the bold horizontal line and the mean by the star, and outliers are shown as open circles.
3.3 Systematic assessment of diabatic PV modification in extratropical cyclones
Focusing on the five areas of anomalous PV introduced above, we systematically assess the physical processes that modify PV in the selected rapidly intensifying extratropical cyclones. Positive PV anomalies between the surface and 550 hPa and negative PV anomalies between the surface and 850 hPa are considered. These levels have been selected to take into account the majority of grid points that exceed the PV anomaly threshold used. Beginning with the cold season, the 24 h period of strongest cyclone deepening is identified, and the area-averaged APV of each process is calculated at every hour for each PV anomaly. When averaging hourly contributions over all 144 cyclones, the mean temporal evolution of the processes that contribute to any PV anomaly can be calculated.
Figure 3a shows the contribution of different processes to the positive PV anomaly in the cyclone center averaged over all cyclones from the cold season. Each line represents the average PV tendency of a different process accumulated over 15 h backward trajectories that start between the surface and 550 hPa. On average, this region is associated with roughly 250 000 trajectories (about 1700 per cyclone) at each time step (dotted line). The number of trajectories increases steadily during cyclone intensification, whereas the mean absolute PV (bold blue) remains mostly constant. Thus, the region with a positive PV anomaly grows during cyclone deepening, which is indicative of an increase in the cyclonic circulation and intensity of the cyclones. Total APV (bold black) is primarily comprised of condensation (red), the turbulent momentum tendency (green dashed), and convection (solid orange). Additionally, minor positive APV from snow melting is observed towards the end of the intensification period (cyan).
Positive contributions are partially offset by negative APV due to turbulent temperature tendencies (solid green). Since turbulence counteracts heating or cooling tendencies, this process is generally expected to produce APV tendencies of opposite sign to the leading APV tendency. The intensity of negative APV generated by the turbulent temperature tendency increases during the deepening of the cyclones, in line with the slight increase in positive contributions from condensation, turbulent momentum tendencies, and convection. Finally, weak negative APV tendencies by long-wave radiative heating (yellow dashed), evaporation of cloud (dark gray), and convective momentum tendencies (orange dashed) occur.
Figure 3a reveals that contributions from different processes to the positive PV anomaly in the cyclone center are temporally largely consistent when averaged over 144 cyclones. Similarly consistent results are found for the positive and negative PV anomalies along the warm and cold fronts (not shown). However, when considering individual cyclones separately, a large variability in the contribution of the most relevant processes (condensation, turbulent mixing of momentum, and convection) is found (Fig. 3b). In a few cyclones, condensation only generates insignificant APV, while larger APV tendencies from other processes such as convection, turbulence, or melting of snow are observed.
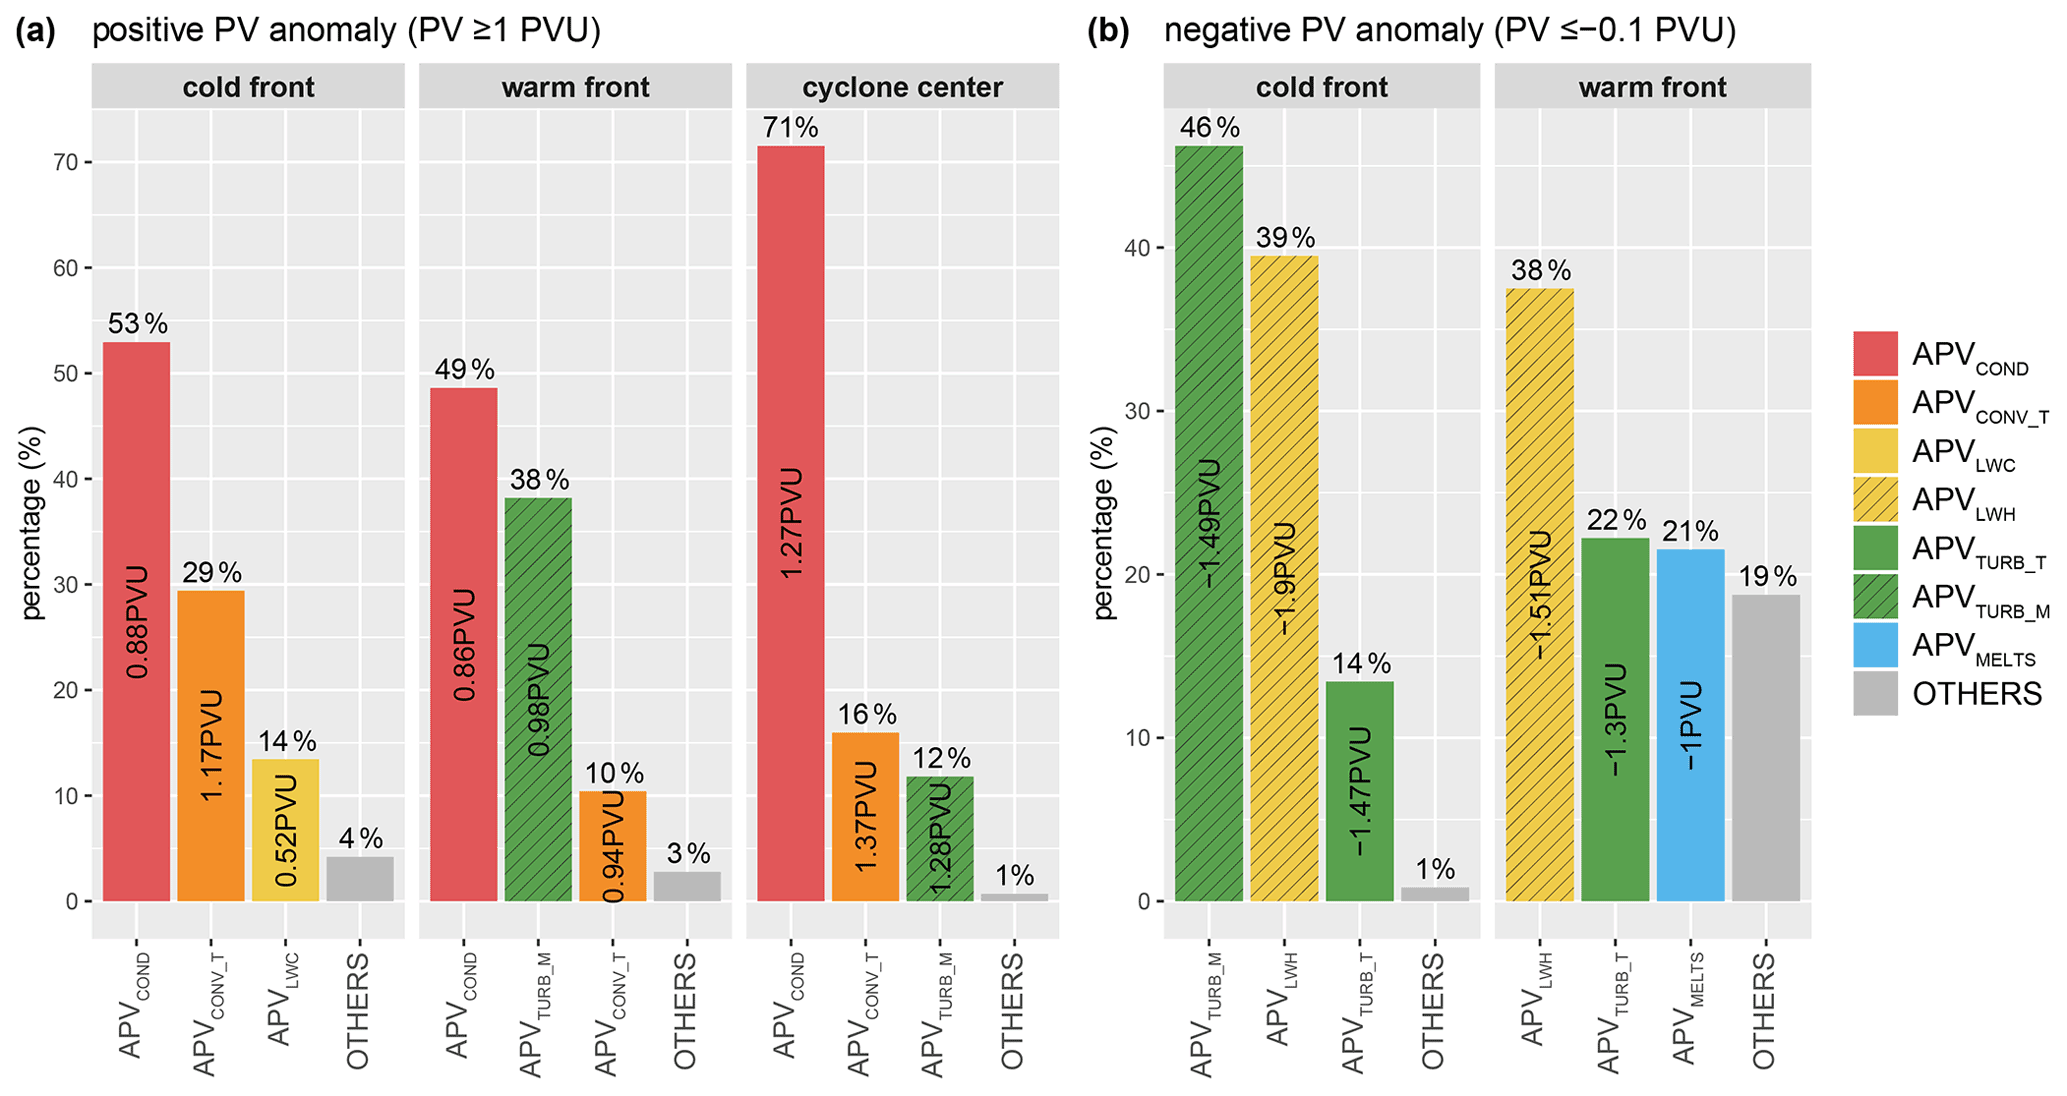
Figure 4Prevalence of the most important processes for the generation of (a) the positive PV anomaly (PV ≥ 1 PVU) between the surface and 550 hPa and (b) the negative PV anomaly (PV ≤ −0.1 PVU) between the surface and 850 hPa during the cold season. Ranks are computed from the area-weighted mean APV of each process averaged over the entire 24 h period of most rapid cyclone intensification. Percentages indicate the fraction of cyclones with a specific process as the most important one. Numbers show the area-weighted mean APV averaged over all cyclones from the respective subset.
To take this large case-to-case variability into account, we rank the area-weighted mean contribution from different processes to individual PV anomalies. This yields information on the fraction of cyclones with a specific process as the most important one for the generation of the considered PV anomaly. Similarly, we can identify the most relevant opposing process, i.e., the process that produces PV with the opposite sign of the anomaly. Since little temporal variability during the 24 h period of most rapid cyclone intensification was found (Fig. 3a), ranked contributions are averaged over this entire period. For this assessment, trajectories are only used if (i) they have a residuum smaller than 50 % of the total diagnosed PV modification and (ii) the diagnosed PV change has the same sign as the actual change in PV. This ensures that only trajectories for which our approach is robust are considered. While this excludes approximately half of the trajectories from the assessment, a sensitivity analysis with more relaxed conditions revealed hardly any differences in the primary processes modifying PV (not shown).
For the positive PV anomaly along the cold front (Fig. 4a, first panel), condensation is the most important process in 53 % of all cyclones with an area-weighted mean APV of 0.88 PVU averaged over all cyclones in this category. Convection is the most important process in 29 % of all cyclones, producing 1.17 PVU on average. A total of 14 % of all cyclones occur in an environment promoting intense long-wave radiative cooling, producing 0.52 PVU in this subset. Additionally, in 4 %, other processes are most important for the generation of PV along the cold front. Turbulent mixing of temperature is the primary opposing process in 82 % of all cyclones, reducing PV on average by −0.46 PVU (not shown).
Condensation is again found most frequently as the primary process generating on average 0.86 PVU in every second cyclone along the warm front (Fig. 4a, second panel). The turbulent momentum tendency is the primary process in 38 % of all cases, producing 0.98 PVU on average. Comparatively few cyclones (10 %) are found where convection is the most relevant process, increasing PV on average by 0.94 PVU. Note that this does not preclude convection from contributing slightly to the positive PV anomaly along the warm front in the other categories. Again, the primary opposing process is turbulent mixing of temperature, producing negative APV of −0.38 PVU in 60 % of all cyclones (not shown). Additionally, about every third cyclone is characterized by −0.45 PVU due to long-wave radiative heating.
In the cyclone center and along the bent-back front (Fig. 4a, third panel), PV is primarily produced by condensation (1.27 PVU in 71 %), convection (1.37 PVU in 16 %), or turbulent momentum tendencies (1.28 PVU in 12 %), consistent with Fig. 3a. Turbulent temperature tendencies strongly offset the PV budget (−0.91 PVU) in almost all cases (not shown).
The negative PV anomaly along the cold front is mainly influenced by boundary layer processes (Fig. 4b, first panel). The turbulent momentum tendency and long-wave radiative heating are the primary processes in 46 % and 39 % of all cyclones, reducing PV by −1.49 and −1.9 PVU, respectively. In addition, turbulent temperature tendencies reduce PV on average by −1.47 PVU in 14 % of all cyclones. Considering the most relevant opposing processes, long-wave radiative cooling and turbulent temperature tendencies produce about 1.14 and 1.47 PVU in 46 % and 34 % of all cyclones, respectively (not shown).
Compared to the cold front, decidedly different processes reduce PV along the warm front (Fig. 4b, second panel). In 38 % of all cases, long-wave radiative heating is the primary process and reduces PV by −1.51 PVU. In 22 % and 21 %, turbulent temperature tendencies and melting of snow generate −1.3 and −1 PVU, respectively. Additionally, other processes are most important for the negative PV anomaly in every fifth cyclone, indicating the large variability in relevant processes. Negative PV tendencies at the warm front are offset by turbulent temperature tendencies (1.16 PVU in 47 %) and long-wave radiative cooling (0.57 PVU in 24 %, not shown).
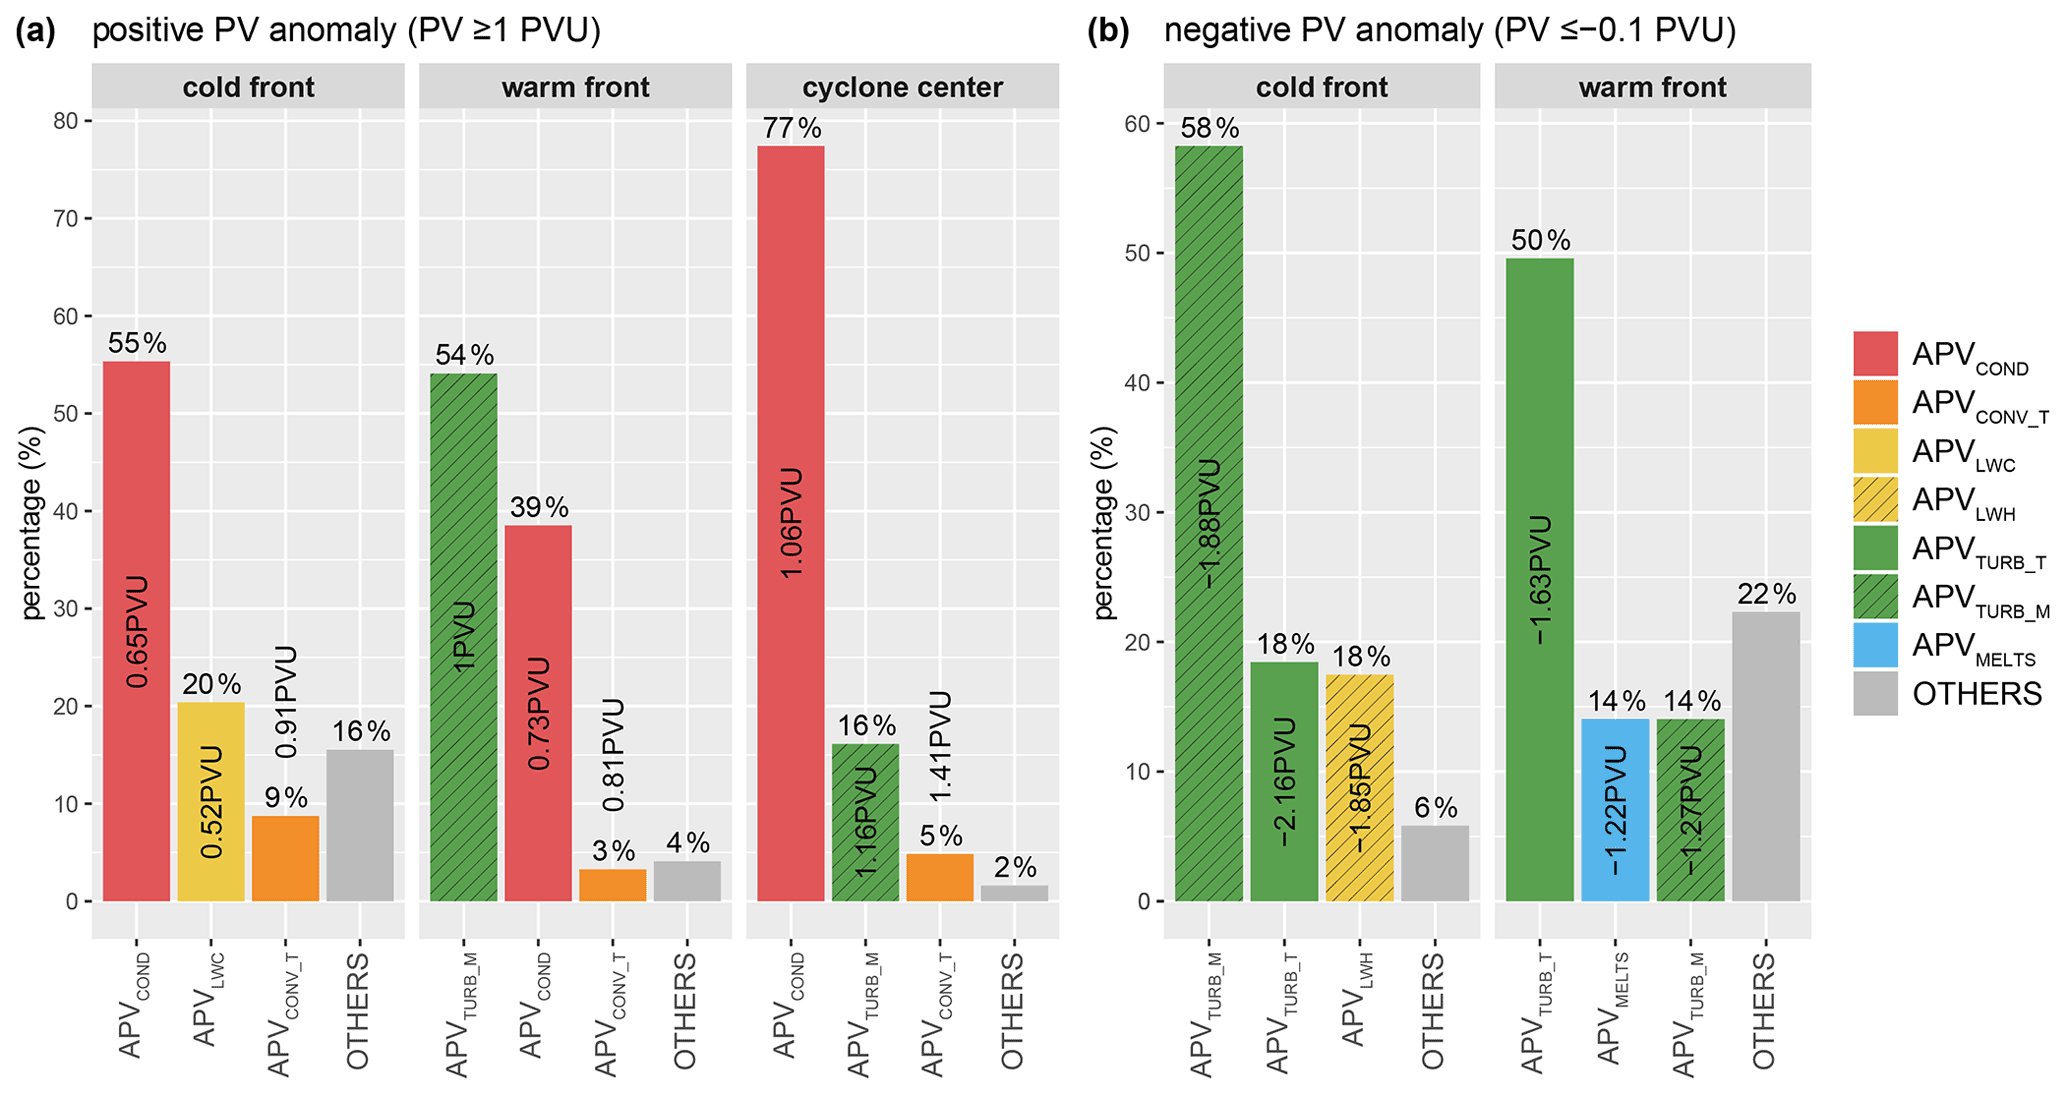
The same processes as described for the cold season are responsible for the generation of positive PV anomalies during the warm season (Fig. 5a). However, the fraction of cyclones with convection as the most relevant process strongly decreases. Specifically, long-wave radiative cooling is more prevalent (20 %) than convection (9 %) in generating positive PV anomalies at the cold front, while condensation is still most often the primary PV producer (55 %). Surprisingly, the turbulent momentum tendency is more often observed as the primary process increasing PV along the warm front (54 %) than condensation (39 %) and convection (3 %). Finally, fewer cyclones primarily gain PV due to convection (5 %) than due to turbulent momentum tendencies (16 %) in the center, while condensation is the primary process in 77 % of all cyclones.
The processes that generate negative PV anomalies in extratropical cyclones during the warm season are shown in Fig. 5b. Along the cold front, negative PV is primarily generated by the turbulent momentum tendency (58 %), followed by the turbulent temperature tendency (18 %), and long-wave radiative heating (18 %). Along the warm front, the relevance of long-wave radiative heating highlighted in the cold season (Fig. 4b, second panel) diminishes during the warm season with negative PV primarily produced by turbulent temperature tendencies (50 %), melting of snow (14 %), or turbulent momentum tendencies (14 %).
When comparing the processes that generate positive PV anomalies across the three studied regions in the cold season, we find that the same primary process along the warm front and in the cyclone center in approximately 28 % of all cyclones (not shown). Moreover, the same process is most important in all three regions in 25 % of all cases, whereas in roughly one-third of all cyclones, a different process is responsible for the PV generation in each feature. Cyclones with the same primary process at the cold front and center but a different one along the warm front only account for 16 % of all cyclones. Finally, a mere 4 % of all cyclones are characterized by the same primary process along the warm and cold front but a different one in the cyclone center. Finally, a different process generates the negative PV anomaly along the warm and cold front in 80 % of all cyclones.
This section established the primary physical processes that generate pronounced PV anomalies in extratropical cyclones. We generally find that individual processes can produce a substantial part of the total PV budget and a primary physical process can be identified for most PV anomalies. Expectedly, condensation is frequently the primary driver of increased PV along the fronts. In a significant number of cyclones, however, turbulent mixing of momentum along the warm front and long-wave radiative cooling at the cold front were found to be more relevant. On the other hand, no distinct physical process was found to be responsible for the generation of negative PV in general. Turbulent mixing of momentum and temperature, long-wave radiative heating, and melting of snow all significantly contribute to negative PV in a large number of systems.
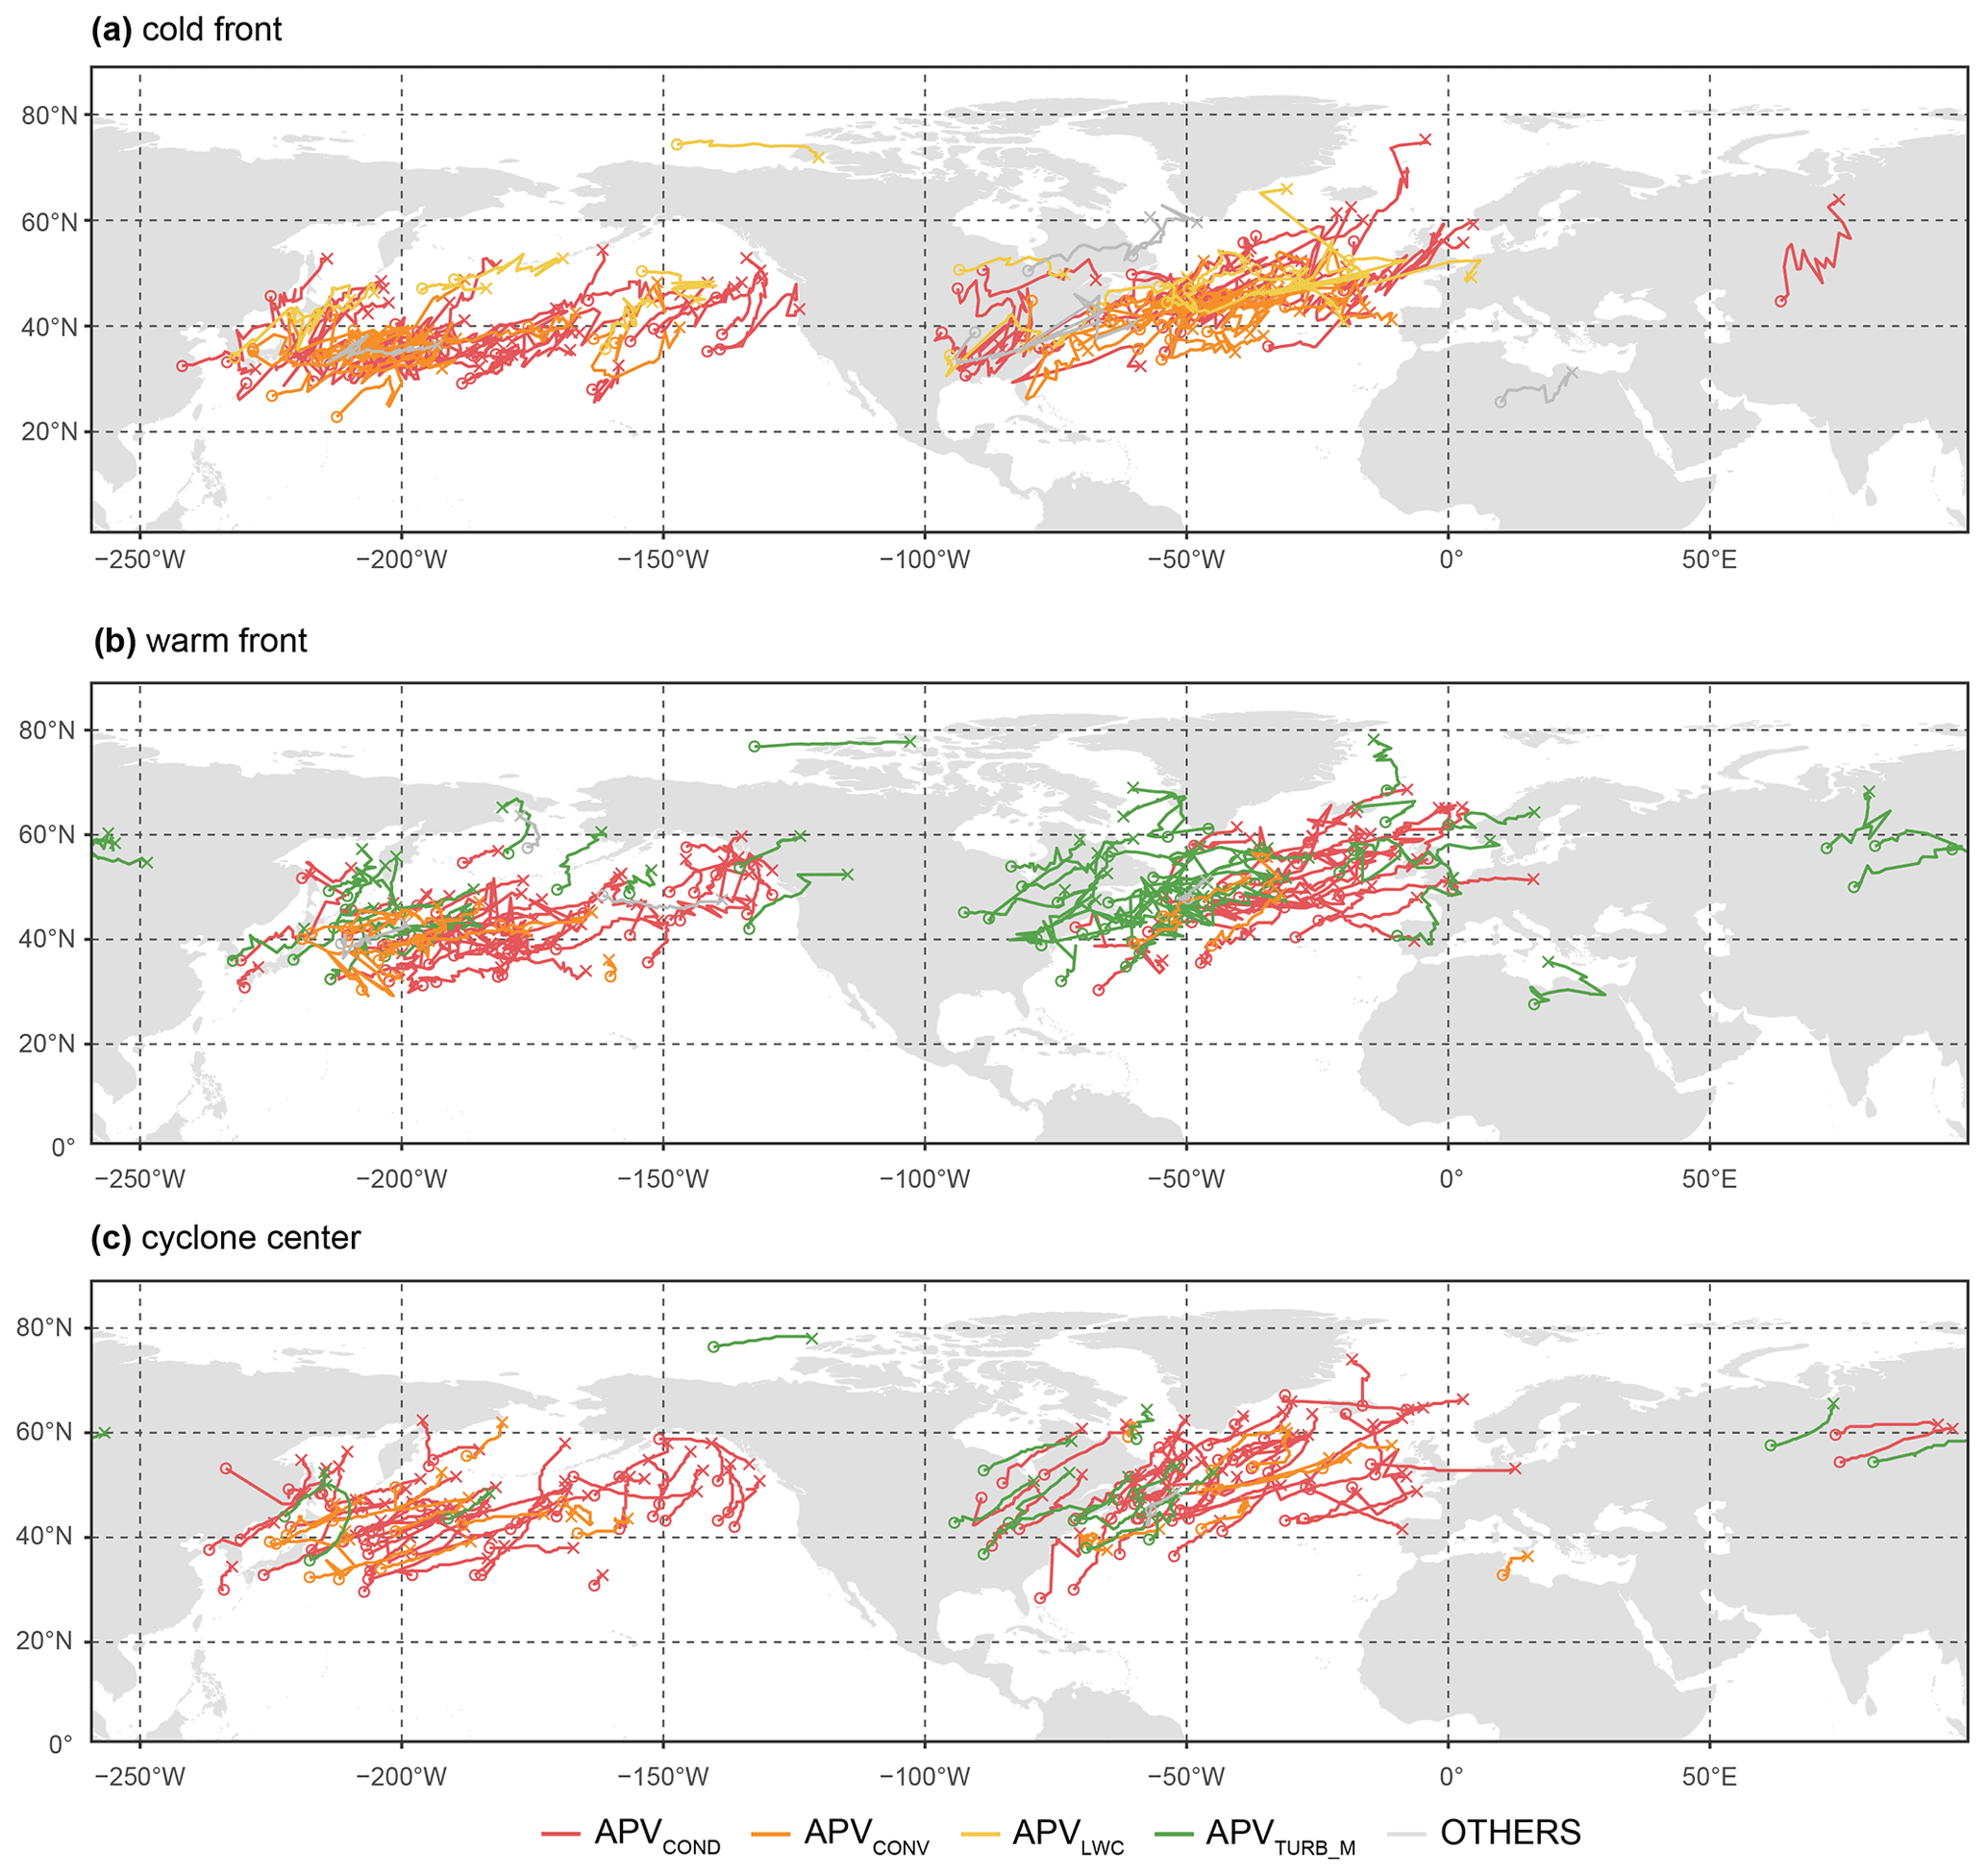
Figure 6Geographical occurrence of (a) cold fronts, (b) warm fronts, and (c) cyclone centers for all cyclones from the cold season. Colors indicate the primary physical process responsible for the generation of positive PV anomalies along the respective feature. Open circles indicate the beginning and crosses the end of the 24 h period of most rapid cyclone intensification.
3.4 The influence of the environment on the generation of positive PV anomalies
To understand the underlying mechanism driving the variability in the processes that modify PV, we examine the environment of cyclones that differ in terms of the primary process generating PV anomalies. Specifically, we focus on the processes producing positive PV anomalies in the cold season. To this end, composites of various meteorological fields are calculated along the cold front, warm front, and cyclone center for the three main categories observed (Fig. 4a).
For the cold and warm front composites, the frontal objects need to be rotated such that they align south–north and east–west, respectively. The frontal orientation is obtained by fitting a linear regression model to the coordinates of the front. Additionally, we require higher equivalent potential temperature to the east (south) than to the west (north) of the cold (warm) front to ensure correct rotation. Frontal composites are centered on the mean frontal coordinates. Composites of the cyclone center are not rotated and simply centered on the minimum SLP.
3.4.1 The cold front
The positive PV anomaly along the cold front is primarily produced by condensation, convection, or long-wave radiative cooling during the cold season (Fig. 4a, first panel). Cold fronts whose positive PV anomaly is primarily generated by convection mainly occur over warm ocean currents, whereas those associated with long-wave radiative cooling are predominantly observed in the northern parts of ocean basins (Fig. 6a).
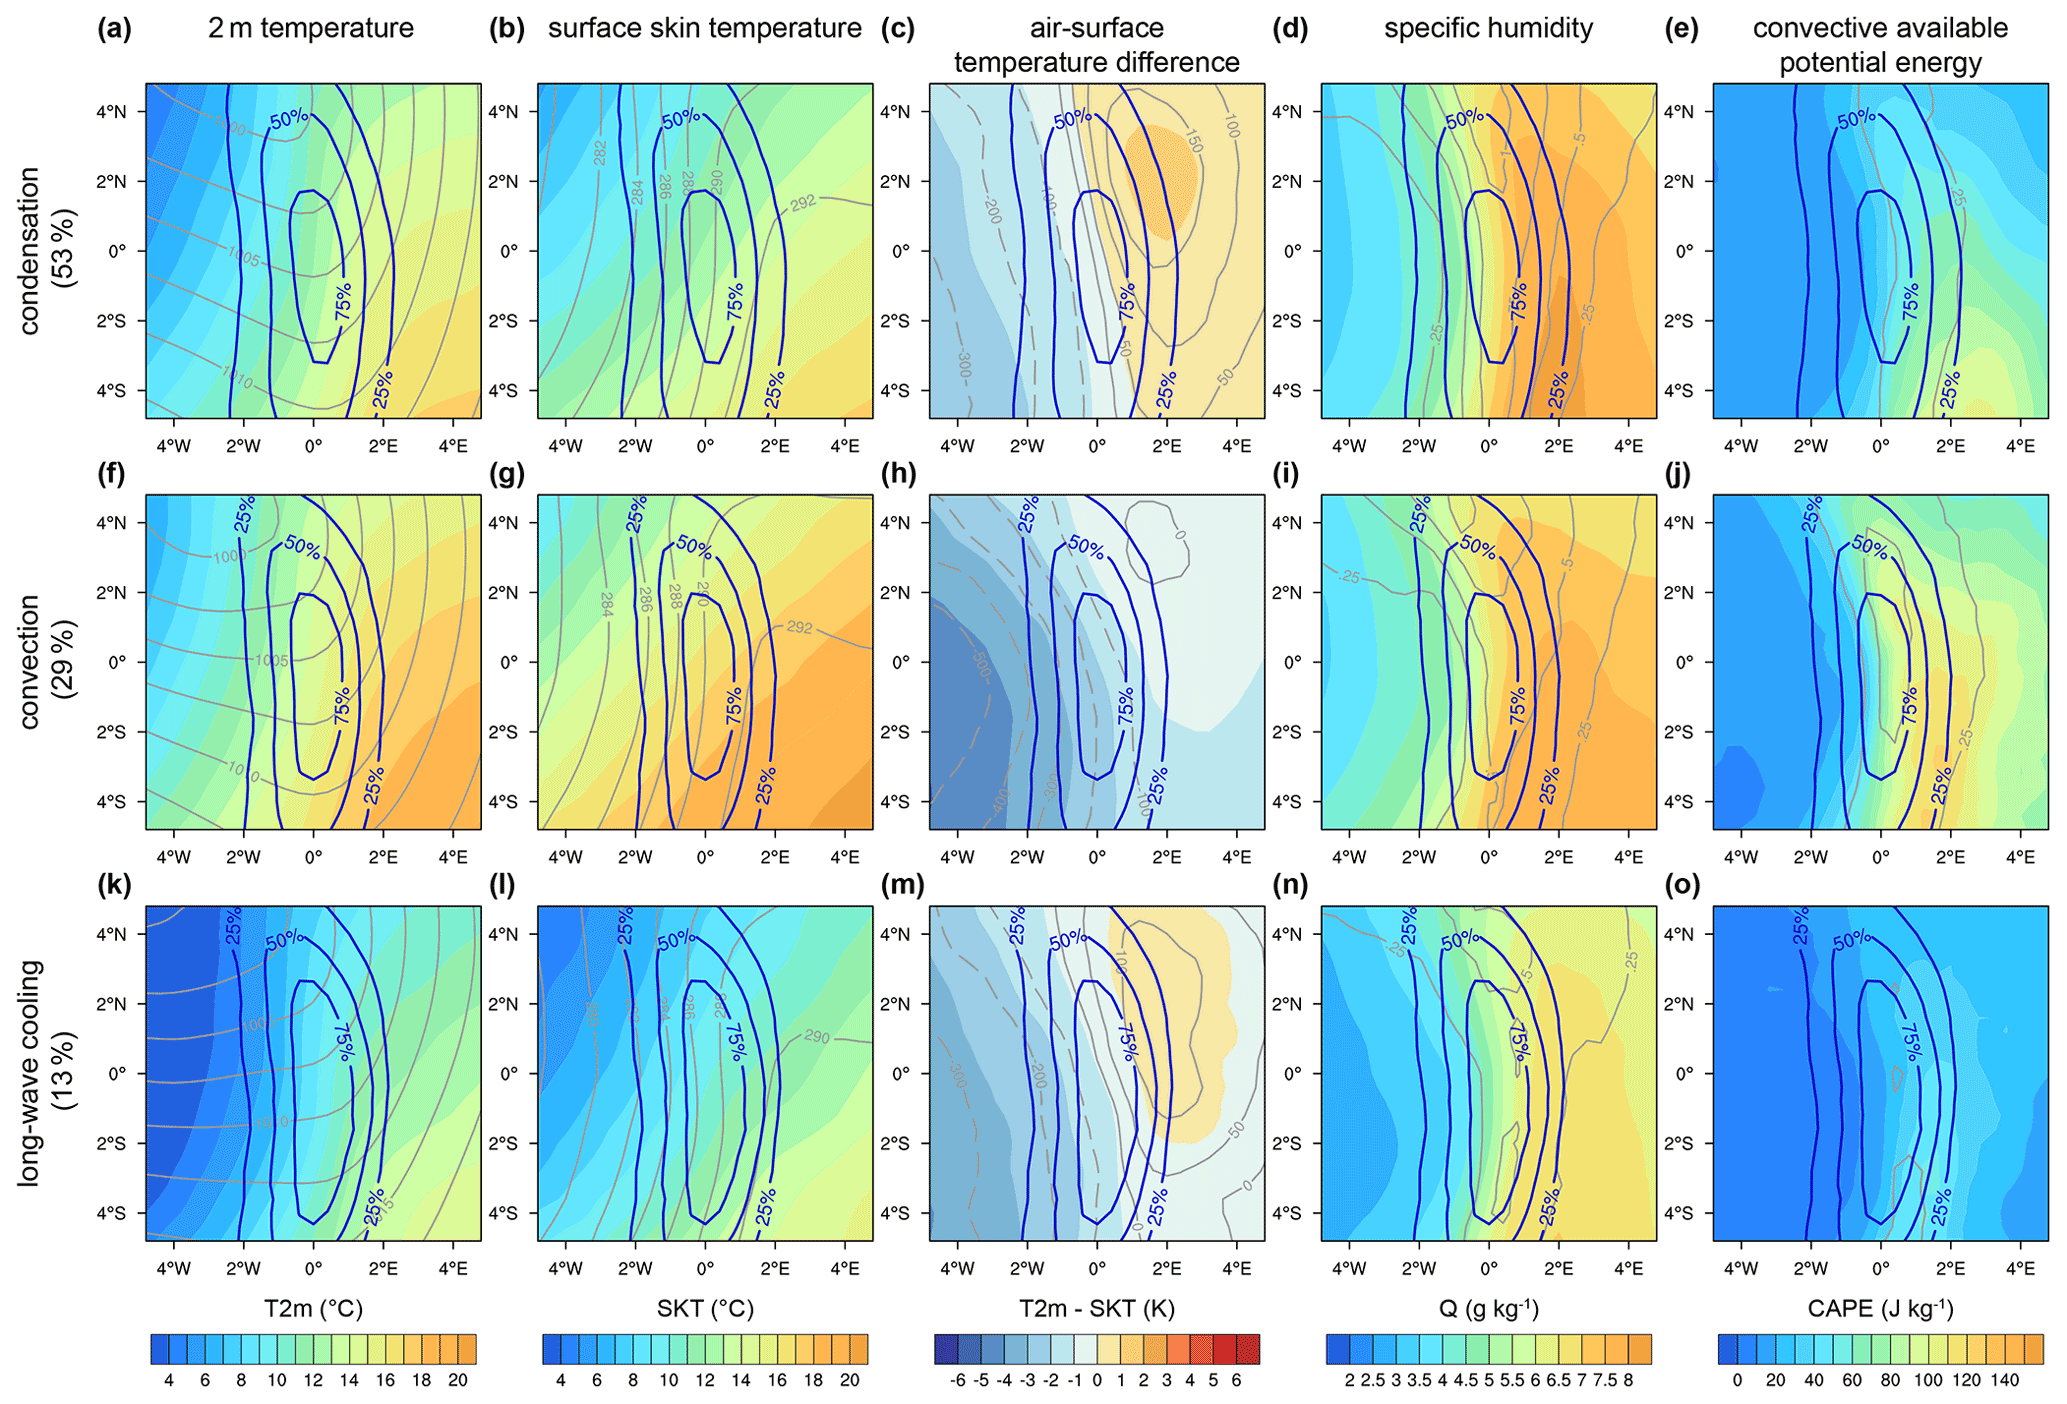
Figure 7Composites of the environmental condition along the cold front averaged over the 24 h period of most rapid cyclone intensification for subsets of the 144 extratropical cyclones of the cold season. Rows represent different cyclone categories based on the primary process that produces the positive PV anomaly along the cold front (Fig. 4a). Depicted are surface fields, except for specific humidity which is shown at 900 hPa. Blue contours indicate average cold front frequency while gray contours show sea level pressure (a, f, k), θ at 900 hPa (b, g, l), surface sensible heat flux (c, h, m), large-scale precipitation (d, i, n), and convective precipitation (e, j, o).
The environmental conditions of cold fronts whose positive PV anomaly is mainly generated by condensation are shown in the first row of Fig. 7. These fronts occur in areas of high specific humidity (Fig. 7d) and produce the most intense large-scale precipitation compared to the other categories (Fig. 7, fourth column), highlighting the relevance of cloud formation for the generation of the positive PV anomaly. Also, these cold fronts are associated with a large positive air–surface temperature difference in the warm sector (Fig. 7c). Because the surface sensible heat flux (SSHF) is proportional to the air–surface temperature difference, strong positive SSHF, i.e., a heat flux directed into the surface, occurs just east of the cold front (Fig. 7c). This increases the stability of the boundary layer, which is in line with the low values of convective available potential energy (CAPE) and little convective precipitation found in the vicinity of the cold front of these cyclones (Fig. 7e).
When comparing cold fronts that primarily experience PV generation by convection (Fig. 7, second row) with the former category, we find that these fronts are generally located above significantly warmer surface skin temperatures (SKT, Fig. 7g). This results in a negative air–surface temperature difference covering the entire warm sector (Fig. 7h), leading to negative SSHF east of the cold front, i.e., a heat flux directed into the atmosphere. This is likely linked to destabilization of the boundary layer and might explain why these systems are primarily associated with convection. Additionally, we find strong negative surface latent heat flux (SLHF) throughout the entire composite (not shown), indicating strong surface evaporation. Note that negative SLHF is observed in all three categories. Intense convective precipitation and high CAPE (Fig. 7j) further emphasize the convective nature of these cyclones.
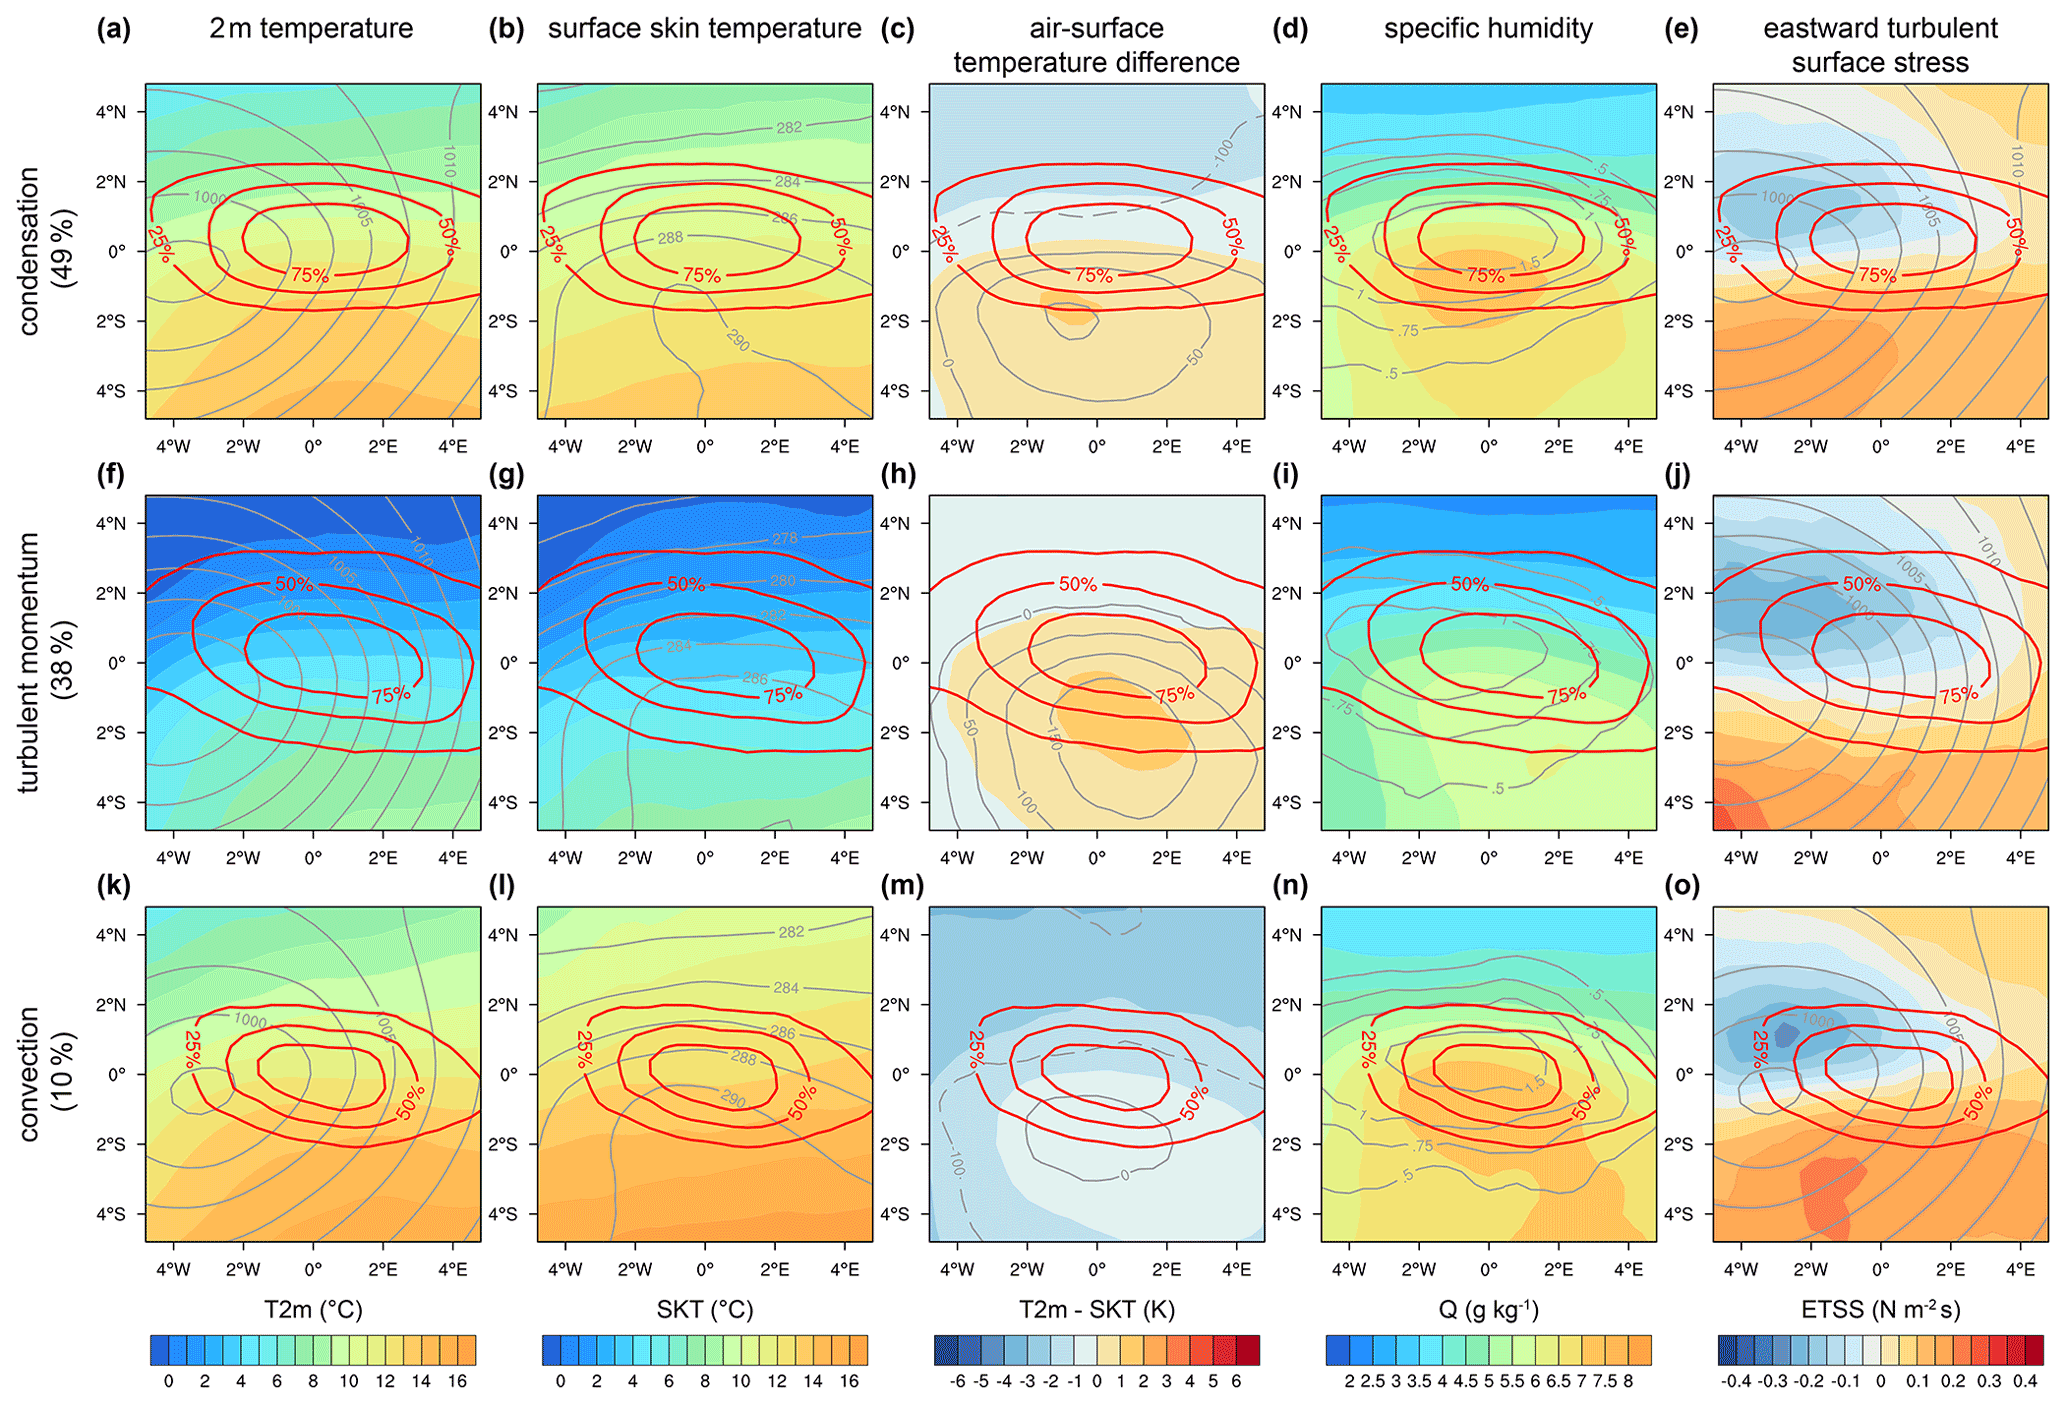
Figure 8Similar to Fig. 7 but for the positive PV anomaly along the warm front in the cold season. Gray contours show sea level pressure (a, f, k, e, j, o), θ at 900 hPa (b, g, l), surface sensible heat flux (c, h, m), and total precipitation (d, i, n).
The bottom row in Fig. 7 shows the environment of cold fronts whose positive PV anomaly is mainly generated by long-wave radiative cooling. These cold fronts occur in a markedly colder environment both in terms of 2 m (Fig. 7k) and surface skin temperatures (Fig. 7l), in line with the northern occurrence of these cyclones (Fig. 6a). While the absolute values are much lower compared to the first category, the relative air–surface temperature difference is almost equally pronounced (Fig. 7m). This leads to long-wave radiative cooling of the warm sector boundary layer, which is associated with intense PV production along the front where relative vorticity is enhanced. Furthermore, because of the reduced water vapor content in colder air (Fig. 7n), less precipitation and thus condensation occurs in these cyclones. The lack of condensation together with the positive SSHF in the vicinity of the front explains why the positive PV anomaly along the cold front of these cyclones is primarily produced by long-wave radiative cooling.
3.4.2 The warm front
Previously, we showed that the positive PV anomaly along the warm front during the cold season is either primarily produced by condensation, the turbulent momentum tendency, or convection (Fig. 4a, second panel). When looking at the geographical distribution of the different warm front categories, we find that fronts primarily associated with PV generation by convection cluster in the western part of ocean basins. Conversely, warm fronts primarily modified by the turbulent momentum tendency are often observed over land (Fig. 6b).
Composites of warm fronts primarily influenced by condensation are shown in the first row of Fig. 8. Similar to the cold fronts belonging in this category, we find a positive air–surface temperature difference in the warm sector (Fig. 8c). Out of the three categories, these warm fronts are associated with the highest amounts of precipitation (contours in Fig. 8d).
The second category of warm fronts is dominated by the production of PV by turbulent momentum tendencies (Fig. 8, second row). These warm fronts occur at approximately 8 K colder 2 m temperatures (Fig. 8f), which leads to reduced specific humidity and precipitation (Fig. 8i). When considering the eastward turbulent surface stress (ETSS, describing the accumulated stress on the Earth's surface by turbulence), a distinct region with negative values is found north of the warm front where the prevailing winds are easterly (Fig. 8j). Therefore, turbulence leads to an eastward acceleration at the surface, which diminishes with height (i.e., , contours in Fig. 8g). This occurs in a region with a strong negative meridional θ gradient (). Because these terms dominate the momentum tendency equation (second term in Eq. 2), turbulent PV generation occurs north of the warm front.

Figure 9Similar to Fig. 7 but for the positive PV anomaly in the cyclone center in the cold season. Gray contours show sea level pressure (a, f, k, e, j, o), θ at 900 hPa (b, g, l), surface sensible heat flux (c, h, m), and total precipitation (d, i, n).
Finally, warm fronts primarily affected by convection (Fig. 8, bottom row) are again characterized by a negative air–surface temperature difference in the warm sector (Fig. 8m). This leads to mainly negative SSHF in the warm sector (contours in Fig. 8m), which likely destabilizes the boundary layer and thus promotes convection. While enhanced specific humidity is found (Fig. 8n), CAPE is not significantly increased compared to the first category of warm fronts (not shown).
3.4.3 The cyclone center
The positive PV anomaly in the cyclone center is primarily generated by condensation, convection, or turbulent momentum tendencies (Fig. 4a, third panel). All three categories of cyclones are approximately equally intense (contours in Fig. 9a, f, and k). Cyclones associated with PV generation by convection cluster in the western ocean basins, whereas those associated with turbulent momentum tendencies frequently occur over land (Fig. 6c).
The first row of Fig. 9 shows the environment of cyclones that primarily experience PV generation by condensation. In line with our previous findings, these cyclones are characterized by high specific humidity and intense large-scale precipitation (not shown). Further, we find that 2 m temperatures in the cold sector are colder than the surface, whereas the warm sector air is warmer than the surface (Fig. 9c). This leads to heating of the boundary layer in the cold sector and cooling in the warm sector, associated with long-wave radiative heating and cooling as well as negative and positive PV generation, respectively (not shown). Finally, the strongest region of 10 m winds is observed just behind the cold front (Fig. 9e).
Cyclones that primarily experience PV generation by convection occur over warmer surface temperatures (Fig. 9g). This leads to a negative air–surface temperature difference throughout the entire warm sector (Fig. 9h), which is associated with SSHF directed into the atmosphere. This likely leads to the destabilization of the boundary layer inducing convection. In contrast to convection-dominated cold fronts, which are associated with enhanced CAPE (Fig. 7j), no significant increase in CAPE was found for the cyclone center (not shown). However, higher wind velocities are observed for this type of cyclones (Fig. 9j), in line with the more intense PV anomaly generated by convection compared to the other processes (Fig. 4a, third panel). Finally, these cyclones produce a much more intense and focused area of precipitation (contours in Fig. 9j).
The final row of Fig. 9 shows composites of cyclones whose central positive PV anomaly is primarily generated by turbulent momentum tendencies. Generally, the environment of these cyclones is similar to the warm fronts that belong in this category (Fig. 8, second row). They occur at markedly lower 2 m and surface temperatures (Fig. 9k and l) and are characterized by a positive air–surface temperature difference in the warm sector (Fig. 9m) linked to positive SSHF. Strong negative ETSS occurs along the warm front in a region with a strong negative meridional θ gradient (Fig. 9n). As described for the warm front, this leads to turbulent PV generation. Finally, this type of cyclone is associated with only weak 10 m wind gusts and comparatively little precipitation (Fig. 9o).
In summary, we showed that environmental conditions can have a substantial influence on the physical processes that contribute to low-level PV anomalies in extratropical cyclones. While this section focused on cold-season cyclones only, composites of the different cyclone categories from the warm season provide similar insight.
This paper provides an overview of the relevance of different diabatic processes for the generation of low-level PV anomalies in 288 rapidly intensifying extratropical cyclones. Results are based on a series of twelve 35 d model simulations initialized from ECMWF analyses on the first day of the month from December 2017 until November 2018. Simulations are performed using a modified version of the IFS cycle 43R1 from the ECMWF, similar to Spreitzer et al. (2019) and Attinger et al. (2019). The 24 most rapidly intensifying extratropical cyclones from each month are selected, and results are split into an extended cold (from October to March) and warm season (from April to September).
Hourly PV tendencies of each parametrized process are calculated from individual heating and momentum tendencies obtained from the model following Eq. (1). As instantaneous PV tendencies are often susceptible to large cancellation and are quickly advected by the flow, this investigation considers their integrated effect along air parcel trajectories following the approach introduced by Joos and Forbes (2016) and refined by Crezee et al. (2017). Thereby, the influence of individual diabatic processes for the generation of PV anomalies can be computed by accumulating PV tendencies along backward trajectories. This study focuses on positive PV anomalies (PV ≥ 1 PVU) along the cold front, warm front, and in the cyclone center as well as negative PV anomalies (PV ≤ −0.1 PVU) along the cold and warm front.
Generally, we found that using accumulated hourly PV tendencies along backward trajectories based on temperature and momentum tendencies from the model parametrization successfully quantifies the processes that modify PV along the frontal features of extratropical cyclones. The selection of 15 h instead of the longer 24 h backward trajectories used in previous studies (Crezee et al., 2017; Spreitzer et al., 2019; Attinger et al., 2019) slightly improved the residual while still retaining all relevant information on the processes that dominate the PV budget.
During the cold season, the selected extratropical cyclones primarily occur in the storm track (Fig. 1a). Conversely, a larger fraction of continental cyclones are considered during the warm season (Fig. 1b). On average, both positive (1.8 PVU vs. 1.64 PVU) and negative (−0.38 PVU vs. −0.34 PVU) PV anomalies are more intense in the warm season compared to the cold season (Table 4). While positive PV anomalies are also larger in the warm season (1.4×10⁵ km2 vs. 1.3×10⁵ km2), negative PV anomalies are larger in the cold season (1.9×10⁵ km2 vs. 2.6×10⁵ km2). Positive PV anomalies are located on average higher (844.8 hPa) than negative PV anomalies (970.8 hPa), with a slight tendency for lower elevations in the warm season.
Contributions of different processes to PV anomalies remain temporally largely consistent when averaging them over all cyclones of one season (Fig. 3a). However, a large case-to-case variability is found when comparing contributions across individual cyclones (Fig. 3b). To account for this variability, processes are ranked according to their area-weighted mean contribution to the different PV anomalies. This enables the computation of the fraction of cyclones with a specific process as the most important one for the generation of a given PV anomaly.
The positive PV anomaly at the cold front is primarily generated by condensation (53 % of cyclones), convection (29 %), or long-wave radiative cooling (14 %) in the cold season (Fig. 4a). Condensation is again found to be the primary process in 55% of warm-season cyclones, whereas long-wave radiative cooling (20 %) is more often the primary process than convection (9 %, Fig. 5a). Environmental composites of the cold fronts associated with convection as the most important process during the cold season reveal a negative air–surface temperature difference in the warm sector (Fig. 7h). This is associated with negative SSHF (i.e., heating of the atmosphere) which destabilizes the boundary layer. During the warm season, few cases are dominated by convection (Fig. 5a) because negative air–surface temperature differences are rarely achieved (not shown). Cyclones with PV generation primarily by long-wave radiative cooling at the cold front primarily occur at higher latitudes and in a colder environment than the other two categories (Fig. 6a). Long-wave radiative cooling at the surface stabilizes the boundary layer and thereby increases PV in the vicinity of the cold front where relative vorticity is enhanced, corroborating the findings of Neiman et al. (1990) and Haualand and Spengler (2020). Additionally, the reduced moisture capacity of colder air (Fig. 7n) reduces the importance of condensation for the generation of PV in these cyclones.
Negative PV anomalies west of the cold front are primarily generated by turbulent momentum tendencies (46 %), long-wave radiative heating (39 %), or turbulent temperature tendencies (14 %) during the cold season (Fig. 4b). The turbulent momentum tendency (58 %) is also the primary process decreasing PV along the cold front in the warm season (Fig. 5b), whereas an increased fraction of cyclones is dominated by turbulent temperature tendencies (18 %) and a reduced fraction by long-wave radiative heating (18 %). The latter is likely due to the higher 2 m temperatures in the warm season. The generation of negative PV in the cold sector by the destabilization of the boundary layer due to surface fluxes was previously described by Chagnon et al. (2013) for a single case study and Vannière et al. (2016) using ERA-Interim reanalysis data, respectively.
Condensation is the primary process increasing PV along the warm front in 49 % of all cyclones during the cold season, together with the turbulent momentum tendency (38 %) and convection (10 %). Conversely, turbulent mixing of momentum is the primary process in 54 % of all cyclones during the warm season, with condensation and convection reduced to 39 % and 3 %, respectively. Cyclones with PV primarily generated by the turbulent momentum tendency at the warm front frequently occur over land (Fig. 6b). Hence, their prevalence increases in the warm season when more continental cyclones occur. More specifically, a region of eastward acceleration of the prevailing easterly flow north of the warm front was found to be responsible for the generation of PV in a highly baroclinic environment (Fig. 8j). The importance of turbulence for the generation of PV along the warm front is in line with the findings of previous research (Adamson et al., 2006; Plant and Belcher, 2007; Vannière et al., 2016).
Negative PV anomalies along the warm front are primarily produced by long-wave radiative heating (38 %), the turbulent momentum tendency (22 %), or melting of snow (21 %) in the cold season (Fig. 4b). The reduction of PV by snow sublimation north of the warm front supports previous studies that investigated the diabatic PV modification in an idealized simulation (Crezee et al., 2017) and in a Pacific cyclone (Attinger et al., 2019). Long-wave radiative heating no longer appears as one of the three most important processes to produce negative PV anomalies at the warm front in the warm season (Fig. 5b), with turbulent temperature tendencies (50 %), melting of snow (14 %), or turbulent momentum tendencies (14 %) becoming the primary processes. The shift towards stronger importance of turbulence in the PV budget is likely due to the larger number of continental cyclones in the warm season compared to the cold season (Fig. 1).
The generation of PV in the cyclone center and along the bent-back front is dominated by condensation accounting for 71 % and 77 % of all cyclones during the cold and warm season, respectively. Convection is the primary process in a larger fraction of cyclones during the cold season (16 %) than in the warm season (5 %) due to the required negative air–surface temperature difference (Fig. 9h). Finally, the turbulent momentum tendency primarily generates the positive PV anomaly in the cyclone center in 12 % (16 %) of all cyclones during the cold (warm) season.
While condensation and convection are often described as the main processes responsible for the generation of positive PV anomalies in extratropical cyclones (e.g., Ahmadi-Givi, 2002), we show that other processes such as the turbulent momentum tendency or long-wave radiative cooling can be equally as important as or even more important than condensation in selected cases. Moreover, turbulent temperature tendencies partially offset the generation of PV whenever the PV budget is strongly affected by processes related to diabatic heating or cooling. For the generation of negative PV anomalies, we highlight the relevance of long-wave radiative heating, turbulence, and melting of snow. These results are qualitatively similar to the PV budget analysis by Flaounas et al. (2021), who simulated 100 intense cold-season Mediterranean cyclones with a limited area model. They found that latent heating from the microphysics and convection schemes is the main source of low-level PV in the cyclone center during the mature stage but also that the turbulent momentum tendency plays an important role for generating low-level PV in certain cases. The results presented here also corroborate recent research highlighting the sensitivity of NWP models to the correct representation of microphysical processes (Forbes and Clark, 2003; Martínez-Alvarado and Plant, 2014; Dearden et al., 2016).
Although this study provides a first overview of the different diabatic processes that modify PV in a large number of rapidly intensifying extratropical cyclones, additional work is required to further generalize the findings presented here with respect to other NWP models, different parametrization schemes, and a larger range of different cyclone types and intensities. Moreover, it will be relevant to assess the direct and indirect dynamical impact of the different PV anomalies, similar to the recent study of Oertel and Schemm (2021). Finally, it would be insightful to investigate whether cyclones primarily associated with a specific physical processes can be linked to higher or lower forecast uncertainty.
This study is based on the IFS model version 43R1. The operational IFS model is developed by the European Centre for Medium-Range Weather Forecasts (ECMWF), and the model code is not openly available. The data analysis was performed using the free software R, and all scripts are available from the authors upon request.
The IFS simulations performed for this study can be provided by the authors upon request.
RA developed the evaluation framework, assessed the data, and wrote the paper with contributions from HJ, HW, and MB. ES ran the model simulations and supported the evaluation of the data. HJ and HW wrote the project proposal leading to the funding of this study. All co-authors commented on and helped to improve the manuscript.
Some authors are members of the editorial board of Weather and Climate Dynamics. The peer-review process was guided by an independent editor, and the authors have also no other competing interests to declare.
Publisher's note: Copernicus Publications remains neutral with regard to jurisdictional claims in published maps and institutional affiliations.
This work is part of the ECMWF special project “Diabatic effects in mid-latitude weather systems”. We acknowledge MeteoSwiss and ECMWF for access to the ECMWF computing facilities. We thank Carsten Maass and Richard Forbes for their support with running the IFS simulations and Michael Sprenger for this help with LAGRANTO. We would like to thank the two anonymous reviewers for their valuable comments that helped to improve the quality of this article.
Roman Attinger and Maxi Boettcher received funding from the Swiss National Science Foundation (project 165941), and Maxi Boettcher received additional funding from the European Research Council H2020 research and innovation program (INTEXseas, grant no. 787652).
This paper was edited by Michael Riemer and reviewed by two anonymous referees.
Adamson, D., Belcher, S. E., Hoskins, B. J., and Plant, R. S.: Boundary-layer friction in midlatitude cyclones, Q. J. Roy. Meteorol. Soc., 132, 101–124, https://doi.org/10.1256/qj.04.145, 2006. a, b, c, d
Aebischer, U. and Schär, C.: Low-level potential vorticity and cyclogenesis to the lee of the Alps, J. Atmos. Sci., 55, 186–207, https://doi.org/10.1175/1520-0469(1998)055<0186:LLPVAC>2.0.CO;2, 1998. a
Ahmadi-Givi, F.: A review of the role of latent heat release in extratropical cyclones within potential vorticity framework, J. Earth Space Phys., 28, 7–20, 2002. a, b
Attinger, R.: Quantifying the diabatic modification of potential vorticity in extratropical cyclones, PhD thesis, ETH Zurich, Zurich, https://doi.org/10.3929/ethz-b-000432253, 2020. a, b
Attinger, R., Spreitzer, E., Boettcher, M., Forbes, R., Wernli, H., and Joos, H.: Quantifying the role of individual diabatic processes for the formation of PV anomalies in a North Pacific cyclone, Q. J. Roy. Meteorol. Soc., 145, 2454–2476, https://doi.org/10.1002/qj.3573, 2019. a, b, c, d, e, f, g, h, i
Beare, R. J.: Boundary layer mechanisms in extratropical cyclones, Q. J. Roy. Meteorol. Soc., 133, 503–515, https://doi.org/10.1002/qj.30, 2007. a
Binder, H., Boettcher, M., Joos, H., and Wernli, H.: The role of warm conveyor belts for the intensification of extratropical cyclones in Northern Hemisphere winter, J. Atmos. Sci., 73, 3997–4020, https://doi.org/10.1175/JAS-D-15-0302.1, 2016. a
Boutle, I., Belcher, S. E., and Plant, R.: Friction in mid-latitude cyclones: an Ekman-PV mechanism, Atmos. Sci. Lett., 16, 103–109, https://doi.org/10.1002/asl2.526, 2015. a
Browning, K. A.: Organization of Clouds and Precipitation in Extratropical Cyclones, in: Extratropical Cyclones: The Erik Palmén Memorial Volume, edited by: Newton, C. and Holopainen, E., Amer. Meteor. Soc., Boston, MA, 129–153, https://doi.org/10.1007/978-1-944970-33-8_8, 1990. a
Chagnon, J., Gray, S., and Methven, J.: Diabatic processes modifying potential vorticity in a North Atlantic cyclone, Q. J. Roy. Meteorol. Soc., 139, 1270–1282, https://doi.org/10.1002/qj.2037, 2013. a, b, c
Crezee, B., Joos, H., and Wernli, H.: The microphysical building blocks of low-level potential vorticity anomalies in an idealized extratropical cyclone, J. Atmos. Sci., 74, 1403–1416, https://doi.org/10.1175/JAS-D-16-0260.1, 2017. a, b, c, d, e, f, g
Davis, C. A.: A potential-vorticity diagnosis of the importance of initial structure and condensational heating in observed extratropical cyclogenesis, Mon. Weather Rev., 120, 2409–2428, https://doi.org/10.1175/1520-0493(1992)120<2409:APVDOT>2.0.CO;2, 1992. a
Davis, C. A. and Emanuel, K. A.: Potential vorticity diagnostics of cyclogenesis, Mon. Weather Rev., 119, 1929–1953, https://doi.org/10.1175/1520-0493(1991)119<1929:PVDOC>2.0.CO;2, 1991. a
Dearden, C., Vaughan, G., Tsai, T., and Chen, J.-P.: Exploring the diabatic role of ice microphysical processes in two North Atlantic summer cyclones, Mon. Weather Rev., 144, 1249–1272, https://doi.org/10.1175/MWR-D-15-0253.1, 2016. a, b
Ertel, H.: Ein neuer hydrodynamischer Wirbelsatz, Meteorol. Z., 9, 271–281, 1942. a, b
Fink, A. H., Pohle, S., Pinto, J. G., and Knippertz, P.: Diagnosing the influence of diabatic processes on the explosive deepening of extratropical cyclones, Geophys. Res. Lett., 39, L07803, https://doi.org/10.1029/2012GL051025, 2012. a
Flaounas, E., Gray, S. L., and Teubler, F.: A process-based anatomy of Mediterranean cyclones: from baroclinic lows to tropical-like systems, Weather Clim. Dynam., 2, 255–279, https://doi.org/10.5194/wcd-2-255-2021, 2021. a
Forbes, R. M. and Clark, P. A.: Sensitivity of extratropical cyclone mesoscale structure to the parametrization of ice microphysical processes, Q. J. Roy. Meteorol. Soc., 129, 1123–1148, https://doi.org/10.1256/qj.01.171, 2003. a
Hardy, S., Schultz, D. M., and Vaughan, G.: Early evolution of the 23–26 September 2012 UK floods: Tropical Storm Nadine and diabatic heating due to cloud microphysics, Mon. Weather Rev., 145, 543–563, https://doi.org/10.1175/MWR-D-16-0200.1, 2017. a
Haualand, K. F. and Spengler, T.: Direct and Indirect Effects of Surface Fluxes on Moist Baroclinic Development in an Idealized Framework, J. Atmos. Sci., 77, 3211–3225, https://doi.org/10.1175/JAS-D-19-0328.1, 2020. a
Hoskins, B. J., McIntyre, M., and Robertson, A. W.: On the use and significance of isentropic potential vorticity maps, Q. J. Roy. Meteorol. Soc., 111, 877–946, https://doi.org/10.1002/qj.49711147002, 1985. a
Huang, H.-C. and Emanuel, K. A.: The effects of evaporation on frontal circulations, J. Atmos. Sci., 48, 619–628, https://doi.org/10.1175/1520-0469(1991)048<0619:TEOEOF>2.0.CO;2, 1991. a
Igel, A. L. and v. d. Heever, S. C.: The role of latent heating in warm frontogenesis, Q. J. Roy. Meteorol. Soc., 140, 139–150, https://doi.org/10.1002/qj.2118, 2014. a
Joos, H. and Forbes, R.: Impact of different IFS microphysics on a warm conveyor belt and the downstream flow evolution, Q. J. Roy. Meteorol. Soc., 142, 2727–2739, https://doi.org/10.1002/qj.2863, 2016. a
Joos, H. and Wernli, H.: Influence of microphysical processes on the potential vorticity development in a warm conveyor belt: A case-study with the limited-area model COSMO, Q. J. Roy. Meteorol. Soc., 138, 407–418, 2012. a, b
Kuo, Y. H., Shapiro, M., and Donall, E. G.: The interaction between baroclinic and diabatic processes in a numerical simulation of a rapidly intensifying extratropical marine cyclone, Mon. Weather Rev., 119, 368–384, https://doi.org/10.1175/1520-0493(1991)119<0368:TIBBAD>2.0.CO;2, 1991. a, b
Lackmann, G. M.: Cold-frontal potential vorticity maxima, the low-level jet, and moisture transport in extratropical cyclones, Mon. Weather Rev., 130, 59–74, https://doi.org/10.1175/1520-0493(2002)130<0059:CFPVMT>2.0.CO;2, 2002. a
Lackmann, G. M. and Yablonsky, R. M.: The importance of the precipitation mass sink in tropical cyclones and other heavily precipitating systems, J. Atmos. Sci., 61, 1674–1692, https://doi.org/10.1175/1520-0469(2004)061<1674:TIOTPM>2.0.CO;2, 2004. a
Manabe, S.: On the contribution of heat released by condensation to the change in pressure pattern, J. Meteorol. Soc. Jpn., 34, 308–320, https://doi.org/10.2151/jmsj1923.34.6_308, 1956. a
Martínez-Alvarado, O. and Plant, R.: Parametrized diabatic processes in numerical simulations of an extratropical cyclone, Q. J. Roy. Meteorol. Soc., 140, 1742–1755, https://doi.org/10.1002/qj.2254, 2014. a
Muir, L. C. and Reeder, M. J.: Idealized modelling of landfalling cold fronts, Q. J. Roy. Meteorol. Soc., 136, 2147–2161, https://doi.org/10.1002/qj.692, 2010. a
Neiman, P. J. and Shapiro, M.: The life cycle of an extratropical marine cyclone. Part I: Frontal-cyclone evolution and thermodynamic air-sea interaction, Mon. Weather Rev., 121, 2153–2176, https://doi.org/10.1175/1520-0493(1993)121<2153:TLCOAE>2.0.CO;2, 1993. a
Neiman, P. J., Shapiro, M., Donall, E. G., and Kreitzberg, C. W.: Diabatic modification of an extratropical marine cyclone warm sector by cold underlying water, Mon. Weather Rev., 118, 1576–1590, https://doi.org/10.1175/1520-0493(1990)118<1576:DMOAEM>2.0.CO;2, 1990. a, b
Oertel, A. and Schemm, S.: Quantifying the circulation induced by convective clouds in kilometer-scale simulations, Q. J. Roy. Meteorol. Soc., 147, 1752–1766, https://doi.org/10.1002/qj.3992, 2021. a
Parfitt, R., Czaja, A., and Seo, H.: A simple diagnostic for the detection of atmospheric fronts, Geophys. Res. Lett., 44, 4351–4358, https://doi.org/10.1002/2017GL073662, 2017. a
Plant, R. and Belcher, S.: Numerical simulation of baroclinic waves with a parameterized boundary layer, J. Atmos. Sci., 64, 4383–4399, https://doi.org/10.1175/2007JAS2269.1, 2007. a, b
Rodwell, M. J., Magnusson, L., Bauer, P., Bechtold, P., Bonavita, M., Cardinali, C., Diamantakis, M., Earnshaw, P., Garcia-Mendez, A., Isaksen, L., Källén, E., Klocke, D., Lopez, P., McNally, T., Persson, A., Prates, F., and Wedi, N.: Characteristics of occasional poor medium-range weather forecasts for Europe, B. Am. Meteorol. Soc., 94, 1393–1405, https://doi.org/10.1175/BAMS-D-12-00099.1, 2013. a
Rossby, C.: Relation between variations in the intensity of the zonal circulation of the atmosphere and the displacements of the semi-permanent centers of action, J. Mar. Res., 2, 38–55, https://doi.org/10.1357/002224039806649023, 1939. a
Saffin, L., Methven, J., and Gray, S.: The non-conservation of potential vorticity by a dynamical core compared with the effects of parametrized physical processes, Q. J. Roy. Meteorol. Soc., 142, 1265–1275, https://doi.org/10.1002/qj.2729, 2016. a
Sanders, F. and Gyakum, J. R.: Synoptic-dynamic climatology of the “bomb”, Mon. Weather Rev., 108, 1589–1606, https://doi.org/10.1175/1520-0493(1980)108<1589:SDCOT>2.0.CO;2, 1980. a, b
Spreitzer, E., Attinger, R., Boettcher, M., Forbes, R., Wernli, H., and Joos, H.: Modification of potential vorticity near the tropopause by nonconservative processes in the ECMWF model, J. Atmos. Sci., 76, 1709–1726, https://doi.org/10.1175/JAS-D-18-0295.1, 2019. a, b, c, d, e, f
Sprenger, M. and Wernli, H.: The LAGRANTO Lagrangian analysis tool – version 2.0, Geosci. Model Dev., 8, 2569–2586, https://doi.org/10.5194/gmd-8-2569-2015, 2015. a
Stoelinga, M. T.: A potential vorticity-based study of the role of diabatic heating and friction in a numerically simulated baroclinic cyclone, Mon. Weather Rev., 124, 849–874, https://doi.org/10.1175/1520-0493(1996)124<0849:APVBSO>2.0.CO;2, 1996. a, b, c
Szeto, K. and Stewart, R.: Effects of melting on frontogenesis, J. Atmos. Sci., 54, 689–702, https://doi.org/10.1175/1520-0469(1997)054<0689:EOMOF>2.0.CO;2, 1997. a
Tory, K. J. and Reeder, M. J.: The effect of the continental boundary layer on the dynamics of fronts in a 2D model of baroclinic instability. I: An insulated lower surface, Q. J. Roy. Meteorol. Soc., 131, 2389–2408, https://doi.org/10.1256/qj.04.26, 2005. a
Valdes, P. J. and Hoskins, B. J.: Baroclinic instability of the zonally averaged flow with boundary layer damping, J. Atmos. Sci., 45, 1584–1593, https://doi.org/10.1175/1520-0469(1988)045<1584:BIOTZA>2.0.CO;2, 1988. a
Vannière, B., Czaja, A., Dacre, H., Woollings, T., and Parfitt, R.: A potential vorticity signature for the cold sector of winter extratropical cyclones, Q. J. Roy. Meteorol. Soc., 142, 432–442, https://doi.org/10.1002/qj.2662, 2016. a, b, c
Vaughan, G., Methven, J., Anderson, D., Antonescu, B., Baker, L., Baker, T. P., Ballard, S. P., Bower, K. N., Brown, P. R. A., Chagnon, J., Choularton, T. W., Chylik, J., Connolly, P. J., Cook, P. A., Cotton, R. J., Crosier, J., Dearden, C., Dorsey, J. R., Frame, T. H. A., Gallagher, M. W., Goodliff, M., Gray, S. L., Harvey, B. J., Knippertz, P., Lean, H. W., Li, D., Lloyd, G., Martínez-Alvarado, O., Nicol, J., Norris, J., Öström, E., Owen, J., Parker, D. J., Plant, R. S., Renfrew, I. A., Roberts, N. M., Rosenberg, P., Rudd, A. C., Schultz, D. M., Taylor, J. P., Trzeciak, T., Tubbs, R., Vance, A. K., van Leeuwen, P. J., Wellpott, A., and Woolley, A.: Cloud banding and winds in intense European cyclones: Results from the DIAMET project, B. Am. Meteorol. Soc., 96, 249–265, https://doi.org/10.1175/BAMS-D-13-00238.1, 2015. a
Wernli, H. and Davies, H. C.: A Lagrangian-based analysis of extratropical cyclones. I: The method and some applications, Q. J. Roy. Meteorol. Soc., 123, 467–489, https://doi.org/10.1002/qj.49712353811, 1997. a, b
Wernli, H. and Schwierz, C.: Surface cyclones in the ERA-40 dataset (1958–2001). Part I: Novel identification method and global climatology, J. Atmos. Sci., 63, 2486–2507, https://doi.org/10.1175/JAS3766.1, 2006. a
Willison, J., Robinson, W. A., and Lackmann, G. M.: The importance of resolving mesoscale latent heating in the North Atlantic storm track, J. Atmos. Sci., 70, 2234–2250, https://doi.org/10.1175/JAS-D-12-0226.1, 2013. a