the Creative Commons Attribution 4.0 License.
the Creative Commons Attribution 4.0 License.
 | 08 Jul 2021
The impact of GPS and high-resolution radiosonde nudging on the simulation of heavy precipitation during HyMeX IOP6
Alberto Caldas-Alvarez
Samiro Khodayar
Peter Knippertz
Heavy precipitation is one of the most devastating weather extremes in the western Mediterranean region. Our capacity to prevent negative impacts from such extreme events requires advancements in numerical weather prediction, data assimilation, and new observation techniques. In this paper we investigate the impact of two state-of-the-art data sets with very high resolution, Global Positioning System (GPS)-derived zenith total delays (GPS-ZTD) with a 10 min temporal resolution and radiosondes with ∼ 700 levels, on the representation of convective precipitation in nudging experiments. Specifically, we investigate whether the high temporal resolution, quality, and coverage of GPS-ZTDs can outweigh their lack of vertical information or if radiosonde profiles are more valuable despite their scarce coverage and low temporal resolution (24 to 6 h). The study focuses on the Intensive Observation Period 6 (IOP6) of the Hydrological cycle in the Mediterranean eXperiment (HyMeX; 24 September 2012). This event is selected due to its severity (100 mm/12 h), the availability of observations for nudging and validation, and the large observation impact found in preliminary sensitivity experiments. We systematically compare simulations performed with the Consortium for Small-scale Modeling (COSMO) model assimilating GPS, high- and low-vertical-resolution radiosoundings in model resolutions of 7 km, 2.8 km, and 500 m. The results show that the additional GPS and radiosonde observations cannot compensate for errors in the model dynamics and physics. In this regard the reference COSMO runs have an atmospheric moisture wet bias prior to precipitation onset but a negative bias in rainfall, indicative of deficiencies in the numerics and physics, unable to convert the moisture excess into sufficient precipitation. Nudging GPS and high-resolution soundings corrects atmospheric humidity but even further reduces total precipitation. This case study also demonstrates the potential impact of individual observations in highly unstable environments. We show that assimilating a low-resolution sounding from Nîmes (southern France) while precipitation is taking place induces a 40 % increase in precipitation during the subsequent 3 h. This precipitation increase is brought about by the moistening of the 700 hPa level (7.5 g kg−1) upstream of the main precipitating systems, reducing the entrainment of dry air above the boundary layer. The moist layer was missed by GPS observations and high-resolution soundings alike, pointing to the importance of profile information and timing. However, assimilating GPS was beneficial for simulating the temporal evolution of precipitation. Finally, regarding the scale dependency, no resolution is particularly sensitive to a specific observation type; however, the 2.8 km run has overall better scores, possibly as this is the optimally tuned operational version of COSMO. Future work will aim at a generalization of these conclusions, investigating further cases of the autumn 2012, and the Icosahedral Nonhydrostatic Model (ICON) will be investigated for this case study to assert whether its updates are able to improve the quality of the simulations.
- Article
(11802 KB) - Full-text XML
-
Supplement
(1276 KB) - BibTeX
- EndNote


In the western Mediterranean heavy precipitation events (HPEs) cause fatalities and large economic losses every year (Petrucci et al., 2018). Many of these events occurs during autumn, since this is the time when large-scale systems (northerly troughs, extratropical cyclones) coincide with large mesoscale moisture transports, advected with the southerly flow (Toreti et al., 2010; Pinto et al., 2013; Dayan et al., 2015; Gilabert and Llasat, 2017). This creates the propitious humidity and instability conditions for convective systems that get triggered due to orography, wind convergence, or thermodynamic processes (Ricard et al., 2012; Khodayar et al., 2016). The representation of such events is still a challenge for current numerical weather prediction (NWP) models. The relatively short temporal and spatial scales of convective phenomena, from minutes to less than a day and from 100 to 102 km (Markowski and Richardson, 2010), make it challenging to forecast accurately where and when an HPE will develop. One of the identified sources of error is the misrepresentation of the spatial distribution of atmospheric moisture. Current models have shown a large sensitivity of convective precipitation to small differences in moisture distribution (Lintner et al., 2017; Virman et al., 2018). Hence, it is hoped that using sub-kilometre resolution and sub-hourly frequencies in atmospheric models and data assimilation (DA) systems can lead to substantial improvements for HPE prediction.
DA is a key ingredient to the initial value problem of NWP (Bauer et al., 2015), as the frequent assimilation of high-quality observations helps adjust the NWP model towards the true atmospheric state. Recent advancements in observation systems and high-performance computing have brought progress for DA of new observations (Carlin et al., 2017; Kwon et al., 2018; Borderies et al., 2019; Federico et al., 2017; Mazzarella et al., 2017). GPS measurements of ZTDs are an especially interesting observation type, since they can sample the integrated water vapour (IWV) amount at minute temporal resolution (Bock et al., 2016). Past publications have shown improvements of GPS data for screen-level temperature and humidity (Mile et al., 2019; Mascitelli et al., 2019), lower to middle tropospheric moisture (Singh et al., 2019; Bastin et al., 2019; Caldas-Alvarez and Khodayar, 2020), and 24 h precipitation (Hdidou et al., 2020; Fourrié et al., 2021). The advantages of this product are that it has high temporal resolution, that it is all-weather (provides IWV estimates in cloudy as well as clear-sky situations), that is has large accuracy (Bock et al., 2016, 2019; Jones et al., 2019), and that it has a dense coverage over European countries. However, being an integrated quantity, GPS measurements bear no information of the vertical distribution of humidity (Guerova et al., 2016). This deficit can be decisive in some situations since sufficient moisture even in shallow atmospheric layers can make the difference between convective triggering or suppression. For example, Davolio et al. (2017) find a good impact on precipitation forecasts from assimilating constructed humidity profiles reaching the upper free troposphere. Federico et al. (2019) show that assimilating derived humidity profiles from radar reflectivity and lighting data induces a moist bias possibly due to the inability of the system to correctly redistribute the humidity into shallower vertical layers. This is one of the reasons why, to date, radiosondes have remained the backbone of DA systems (Kwon et al., 2018). Radiosondes can supplement the lack of vertical information of GPS observations but at the expense of a coarser temporal resolution (in best cases, every 6 h) and lower spatial coverage (∼ 30 stations in western Europe). To bring the best value from radiosonde assimilation, targeted observations can help sample atmospheric conditions at the right place and time, e.g. in regions upstream of areas prone to heavy precipitation (Campins et al., 2013). In this regard, a higher number of levels per sounding can bring potential improvement, already assessed for validation purposes (Benjamin et al., 2010).
Past modelling and observational studies demonstrated that a good account of the spatial distribution of atmospheric moisture is crucial for the representation of convective intensities (Keil et al., 2008; Lintner et al., 2011; Honda et al., 2015; Schumacher et al., 2015; Schlemmer and Hohenegger, 2015; Lintner et al., 2017; Virman et al., 2018). Consensus exists that a moist planetary boundary layer (PBL) is needed for convective triggering and maintenance (Lee et al., 2018). However, the dependency on moisture at the lower free troposphere (LFT) is less established. Dry mid-levels can lead to a faster organization of mesoscale clusters through stronger cold pools (Zuidema et al., 2017) but also reduce the strength of connective updraughts through entrainment of drier air. Several authors have highlighted the important role of mid-level moisture in aiding the transition from shallow to deep moist convection (Lintner et al., 2011; Neelin et al., 2009; Bernstein et al., 2016; Zhuang et al., 2018; Khodayar et al., 2018), as a sufficiently moist LFT prevents excessive entrainment (Honda et al., 2015), helps convection penetrate possible intrusions, and maintains the buoyancy of the rising parcels.
In addition to DA, convection-permitting model resolution has brought important advancements in the simulation of heavy precipitation (Chan et al., 2012; Prein et al., 2015; Coppola et al., 2018; Meredith et al., 2020). However, the question regarding how fine model resolutions should be, beyond the kilometre scale, in the so-called grey zone (Barthlott and Hoose; 2015) is still open. Several papers have found improvements from using model resolutions of 1.5 km or higher (Kendon et al., 2012; Martinet et al., 2017; Bonekamp et al., 2018 and Lovat et al., 2019), whereas others found no significant gain (Chan et al., 2012; Panosetti et al., 2016; Lee et al., 2019). A possible reason is the fact that the appropriate settings for running current models at such high resolutions are not yet ready. In this context it is interesting to assess the sensitivity of the impact of new observations such as GPS and high-resolution soundings to model resolution.
Assessing the capabilities of current NWP systems for heavy precipitation is one of the aims of HyMeX, an international project aiming at a better understanding of the hydrological cycle in the Mediterranean (Ducrocq et al., 2014). The Special Observation Period 1 (SOP1) between 1 September and 5 November 2012 provides an unprecedented collection of data that are used in this study for assimilation, validation, and process understanding. The event we focus on occurred on 24 September 2012, during Intensive Observation Period 6 (IOP6), and brought precipitation amounts of over 100 mm in 12 h to southern France, the Alps, the Gulf of Genoa, and north-eastern Italy (Hally et al., 2014; Ribaud et al., 2016). This HPE showed a negative impact of GPS DA in preliminary assimilation tests, related to an overall reduction of atmospheric moisture and precipitation amount (between −40 % and −10 % depending on model resolution). Given this unexpected result, we will investigate here in more detail which characteristics of the GPS DA were detrimental for the representation of precipitation. To do so, we will systematically assess the impact of nudging GPS, operational soundings, and high-resolution soundings using Consortium for Small-scale Modeling (COSMO) simulations with – for this case unprecedentedly fine – grid spacings of 7 km, 2.8 km, and 500 m. The employed nudging scheme (Schraff and Hess, 2012) is well suited for such studies (Federico et al., 2019; Bastin et al., 2019) and compares well against other DA schemes (Schraff et al., 2016). The employed methods will be outlined in Sect. 2. Section 3 discusses the meteorological situation during IOP6 and the model runs used as reference. Section 4 presents the results of the data impact studies. Conclusions are given in Sect. 5.
2.1 Observations
2.1.1 GPS-derived zenith total delays (ZTD) and integrated water vapour (IWV)
The GPS data set used for the nudging was specifically produced for the HyMeX project, merging measurements from 25 European national and regional networks commonly post-processed for the first time to cover the period September 2012 to March 2013 (Bock et al., 2016). GPS measurements provide information of the total delay endured by the microwave signals emitted by GPS satellites in the zenith direction (zenith total delay; ZTD). These are expressed in units of millimetres, accounting for the excess length of the optic path introduced by the refractivity of the Earth's atmosphere (Businger et al., 1996). The contribution to the delay due to the interaction with water vapour molecules is called the “wet” delay and can be obtained from the ZTD. This is the assimilated variable in the nudging experiments, which is proportional to the IWV. The data set used in this paper has a temporal resolution of 10 min, has an outstanding spatial coverage over all south-western European countries (see Fig. 1b), and was produced using the GIPSY/OASIS II v6.2 software (Bock et al., 2016). It enjoys a very high quality due to its data-screening procedure, including range and outlier checks for mean ZTD and its standard deviation, as well as ambiguity and daily number checks. Compared against the product from the Network of European Meteorological Services (EUMETNET) Global Navigation Satellite System (GNSS) Water Vapour Programme (E-GVAP), the HyMeX data set shows no significant biases (Bock et al., 2016).
HyMeX, also provides an IWV data set with 1 h resolution, derived from the ZTD estimations (Fig. 1b). We employ this IWV data set for comparison against our simulations. The mean temperature and surface pressure values at the GPS station locations, which are needed for the IWV derivation, were obtained from a product provided by the Technical University of Vienna and Application of Research to Operations at Mesoscale – western Mediterranean (AROME-WMED) operational analysis, respectively. A validation of the IWV product against operational radiosondes showed a good performance, with biases of less than 1.5 mm for the whole HyMeX period (Bock et al., 2016).
2.1.2 The operational and the HyMeX high-resolution soundings
Operational atmospheric sounding data are provided by Météo-France and the HyMeX database teams through the HyMeX-MISTRALS web repository (https://mistrals.sedoo.fr/HyMeX/, last access: 23 June 2021). The data set consists of atmospheric soundings during the period 1995–2017, covering the western Mediterranean countries (blue triangles in Fig. 1b), operated by national and regional European atmospheric weather institutions and distributed through the Global Telecommunication System (GTS). The soundings have 30 vertical levels on average and have been validated against GPS measurements with good agreement. Deviations of only ±3 % in IWV were found by Bock et al. (2016) for the soundings.
In addition, we employed the unique high-resolution soundings of the HyMeX SOP1 in the nudging experiments. These were conducted at locations upstream of areas prone to heavy precipitation (red markers in Fig. 1b). They have a much finer vertical resolution with over 700 levels up to 300 hPa. We employed soundings from 12 stations over France (continental and Corsica) and Spain. Modem M10 sondes were launched at Ajaccio (Corsica), Nîmes, and Barcelona; Graw sondes, operated by the Karlsruhe Institute of Technology, were launched at Corte (Corsica); and Vaisala sondes were launched in southern France and Spain.
2.1.3 Meteosat Second Generation (MSG) brightness temperature
Brightness temperature is an estimation of the radiation emitted by a surface, converted to temperature through Planck's law, assuming a black body. It provides a clue of the height of cloud tops and is especially useful for deep penetrating convective clouds. In this paper we use the All-Sky Radiances product, obtained by the Spinning Enhanced Visible and InfraRed Imager (SEVIRI) instrument aboard the Meteosat Second Generation satellite constellation. In particular, the infrared (IR) channel IR10.8 is used for detection of organized convective systems. The data are accessible upon registration at https://www.eumetsat.int/website/home/Data/DataDelivery/index.html (last access: 23 June 2021).
2.1.4 Rain gauges (RG) and Multi-Source Weighted-Ensemble Precipitation (MSWEP)
The RG data set used for validation in this paper is available for accumulation periods of 1, 6, or 24 h; has a dense coverage of Spain, France, Italy, and Croatia; and has on average over 4000 stations active per sampled hour. The data set is made available by Météo-France by means of the MISTRALS/HyMeX repositories. The version used for this study is V4, which includes high-resolution measurements from Italy and Croatia as compared to older versions. Several quality checks are included in this version, such as consistency validations among the different accumulation periods, removal of duplicates, and dismissal of blacklisted stations.
The MSWEP product is used for validation of our model results. We use version V2.1 with a temporal resolution of 3 h and a spatial resolution of 0.1∘ during 1979–2015. We examine the period 22–25 September 2012. A full description of the data set can be found in Beck et al. (2017). MSWEP is a gridded precipitation data set merging satellite, reanalysis, and gauge-based estimates, utilizing, among others, the Climate Prediction Center morphing technique (CMORPH), Precipitation Estimation from Remotely Sensed Information using Artificial Neural Networks (PERSIANN), Tropical Rainfall Measuring Mission (TRMM), ERA-Interim (reanalysis), and Climate Prediction Center (CPC) and Global Precipitation Climatology Centre (GPCC; gauge) observations. The MSWEP product shows a good correlation with the independent FLUXNET gauge network with median values of 0.65 for the Pearson correlation coefficient. Root-mean-square error (RMSE) median values were of 4.5 mm d−1, showing better results than the TRMM TMPA 3B42 or WFDEI-CRU data sets (Beck et al. 2017). We selected this precipitation data set for model validation given it profits from the combined value of satellite precipitation products as well as RG.
2.2 The COSMO model
COSMO uses the non-hydrostatic, thermo-hydrodynamical equations in a limited area approach (Schättler et al., 2016), considering the wind components, temperature, pressure perturbation, the cloud water content, and the specific humidity as prognostic variables. Optionally, also cloud ice, snow, and graupel can be considered (Schättler et al., 2016). The model levels are based on a height coordinate that follows the terrain. The rotated grid is an Arakawa C type with Lorenz vertical grid staggering. The dynamical solver is a second-order leapfrog time-split scheme following Skamarock and Klemp (1992). COSMO includes physical parameterizations for the processes that are not explicitly represented. The grid-scale cloud and precipitation parameterization uses a bulk scheme continuity model including water vapour, cloud water, cloud ice, rain, snow, and graupel as water species. Convection is parameterized using the Tiedtke scheme (1989), a bulk-mass-flux formulation dependent on mass, heat, moisture, and momentum fluxes, including a cloud model, simulating processes such as condensation/deposition, evaporation within the updraught, and evaporation below cloud base. The radiation scheme follows the Ritter and Geleyn description (1992) and is applied with a lower temporal frequency and lower resolution than that of the rest of the model to reduce computational costs. The soil model is the Terra Multi-Layer (ML) model that is based upon the two-layer scheme by Jacobsen and Heise (1982). Finally, the surface data use the GLOBE data set (Hastings et al., 2000) with a 1 km resolution adequately interpolated (extrapolated) to the scale of the different resolutions used (7 km, 2.8 km, and 500 m).
One of the main assets of COSMO is its flexibility to be used with different horizontal resolutions, each of which requires specific configuration settings. For finer spatio-temporal scales, more processes are explicitly resolved at the expense of higher computational costs. In this work we employ horizontal grid spacings of 7 km, 2.8 km, and 500 m. The most relevant differences between the 7 and the 2.8 km set-ups are (a) the increase in levels from 40 to 50, (b) the reduction of time step from 60 to 20 s, and (c) the use of only a shallow convection parameterization scheme in 2.8 km. The formulation of the latter is analogous to the deep scheme, except for the reduced vertical extent of clouds (limited to Δp=250 hPa; Baldauf et al., 2011) and the neglection of dynamic entrainment (Doms et al., 2011). This scheme is inactive in sub-kilometre simulations, i.e. in our 500 m simulation. Other changes are (a) a further increase in vertical levels to 80, (b) a time step of 2s, and (c) the use of a 3D turbulent kinetic energy (TKE) diagnostic closure for the turbulence parameterization. In the 7 and 2.8 km configurations, the closure of the turbulence parameterization scheme is 1D in that it neglects all horizontal fluxes in the so-called boundary-layer approximation (Doms et al., 2011). In the 3D TKE closure case, the vertical shear production term can come from local sources as well as from advection, and the pressure correlation term is explicitly calculated, which is especially useful over complex terrain (Goger et al., 2018).
2.2.1 The COSMO nudging scheme
The DA method used in this work is the nudging scheme (Schraff and Hess, 2012). Nudging is an empirical DA method consisting of relaxing the model's prognostic variables towards the observations. This is done by adding a term to the modelled numerics and physics () for a given prognostic variable (φ) at a location (x) and time (t) that depends on the difference between the observation (k) and the model (); the temporal, spatial, and quality weighting factors (), depending in turn on a relative weight for each observation type (wj); and a coefficient with units of frequency (Gφ) – see Eq. (1). The nudging is performed at each model time step when observations are available.
In this work, we nudge atmospheric specific humidity (GPS and radiosondes), temperature (radiosondes), and wind (radiosondes). These are the quantities assimilated operationally at forecasting centres from GPS and radiosonde measurements (Kwon et al., 2018). The nudging scheme is especially suited for these experiments, since it corrects the atmospheric fields during run time, with the same frequency as the sampling of observations. Additionally, it has shown good results in analysing humidity fields, especially at upper levels (Schraff et al., 2016; Bastin et al., 2019), and is computationally less expensive than other schemes (variational schemes or hybrid schemes) given its simplicity (Guerova et al., 2016).
Nudging of GPS and radiosondes
The COSMO nudging scheme only allows the assimilation of prognostic variables. In the case of the radiosondes, COSMO reads profiles of temperature, wind, and humidity, assigning all observations to a grid point in model space. Given that the grid points cannot correctly represent wavelengths of 2Δx or less, the assignment is performed with no interpolation in the horizontal direction (Schraff and Hess, 2012). The observations are averaged over each model layer for temperature and wind and interpolated to the representative height of each model level for humidity. Therefore, the higher the number of vertical model levels, the more the assimilation will profit from higher vertical resolution in the radiosondes. The impact of the analysis increments on the neighbouring grid points is controlled through lateral (wxy), vertical (wz), and temporal weights (wt) through the equation , where εk accounts for the quality and representativeness of the observation. At the exact time–space location of the observation wxy, wz and wt are set to 1.
The temporal spreading is controlled by the nudging coefficient, which is set to 6.10−4 s−1; this corresponds to an e-folding decay of 30 min. For radiosondes the assimilation time window is set between −3 and +1 h. The vertical spreading weight follows a Gaussian in height differences, accounting for the hydrostatic relation and the ideal gas law (Eq. 2). Where g is the gravitational acceleration, R is the gas constant, Tv is the virtual temperature of the observations, Δz is the height difference between model and observations, and ln pc is the correlation scale, equal to . More details can be found on the models documentation (Schraff and Hess, 2012).
Horizontally, the spreading is performed using a second-order autoregressive function of the distance between the observation location and the target point (Δr) divided by correlation scale (s); see Eq. (3). The values of s range between 58 and 100 km, depending on the model level for radiosondes, and are reduced by 45 % for GPS data to avoid conflicting neighbouring observations, given its larger surface coverage (Schraff and Hess, 2012), The correlation scale is invariant under resolution changes as in its operational set-up. The impact of adapting s to different model resolutions is not investigated here, as this would be out of the scope of the paper. However, further testing of different values of the correlation scale for higher resolutions is advised to address any potential conflicts of assimilated observations with for example an increased resolution of the model's orography.
To assimilate GPS data, COSMO converts the ZTD information into IWV (see Sect. 2.1.1) utilizing simulated surface pressure at the station (ps) and mean temperature (Tm) at run time from the assigned grid point. Given IWV is not a prognostic variable, a specific humidity profile needs to be constructed (). This is done by means of an iterative process that scales the IWV simulated at that location and time (IWVmod) with that of the observation (IWVobs). The profile is constructed at the different model levels according to
The process continues until the IWV error is lower than 0.1 % or after 20 iterations (Schraff and Hess, 2012). In the remainder of the process the constructed profile is treated in the same way as the one derived from radiosondes with the exceptions that (a) no vertical weights are needed, since the profile is constructed over model levels directly, and (b) temporally, GPS data are interpolated linearly given their minute temporal resolution. Both for radiosonde and GPS observations, the nudging scheme sequentially carries out quality checks for new input observations. These checks consist of dismissal of observations with large biases; bias corrections, e.g. humidity biases in Vaisala soundings; and gross error checks to truncate the range of the observations within realistic limits.
2.3 Experimental set-up
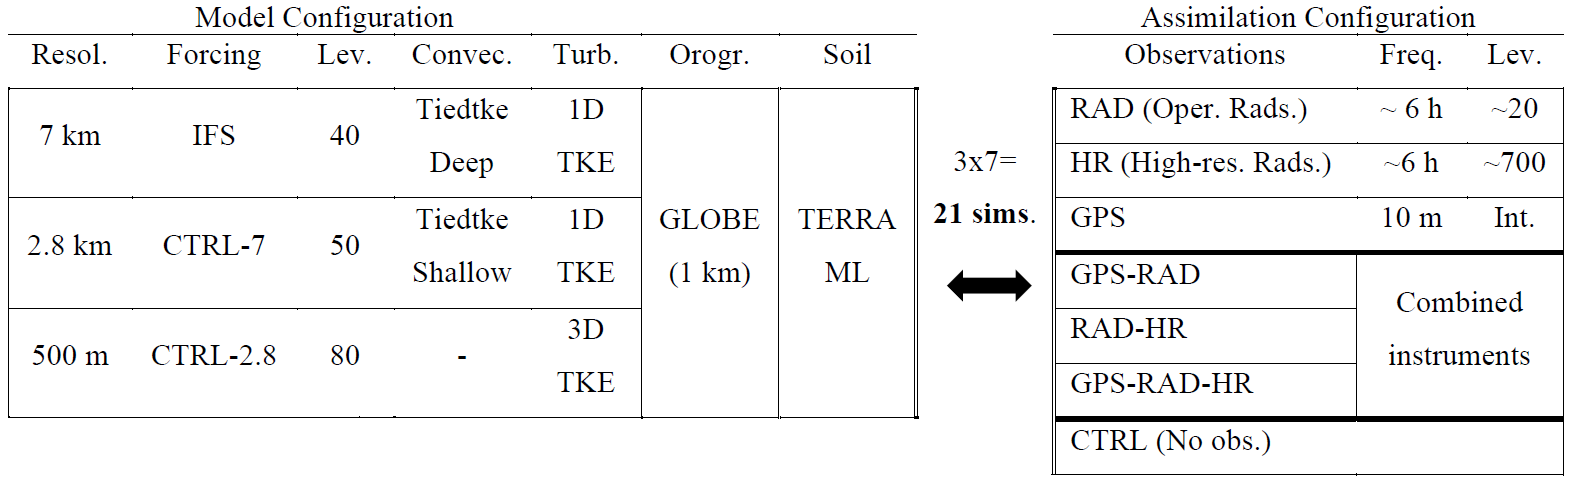
We run 3 d simulations between 22 September 2012 00:00 UTC and 25 September 2012 00:00 UTC. We simulate this period with COSMO, using three horizontal resolutions of 7 km, 2.8 km, and 500 m in a one-way nesting strategy (Fig. 1a). Integrated Forecasting System (IFS) simulations from the European Centre for Medium-Range Weather Forecasts (ECMWF) with a resolution of 25 km force the 7 km runs, which in turn force the 2.8 km ones, and finally these force the 500 m simulations. The following rationale guides the nudging experiments. The study period is run in all three resolutions as pure forecast runs (named CTRL-7, CTRL-2.8, CTRL-500), which are used as references to compare against simulations nudging GPS, operational radiosondes (RAD, ∼ 20 levels) and high-resolution radiosondes (HR, ∼ 700 levels), and all possible combinations between them (see Table 1), in all three resolutions. The nudging is performed continuously processing new observations as soon as they are available for the time step under integration. This implies that the average frequency for nudging of GPS is 10 min and between 6 and 12 h for radiosondes. We use almost 1000 GPS stations, 32 RAD sounding stations and 12 HR stations (Fig. 1b). All simulations of the same resolution are forced with the same boundary conditions. For instance, all 500 m simulations are forced by CTRL-2.8. This is done to ensure that the different impacts observed in the simulations are due to the use of different observations and not from different forcing data. A total of 21 simulations were performed (see Table 1). The study focuses on two investigation areas, the Cévennes alpine area in southern France (FR) and the north-western Mediterranean basin (RhoAlps); see Fig.1b. The extension of FR has been selected for study of local instability, moisture, and wind conditions influencing convective activity over the area. RhoAlps covers the extension of the four main heavy precipitation foci (see Fig. 2b).
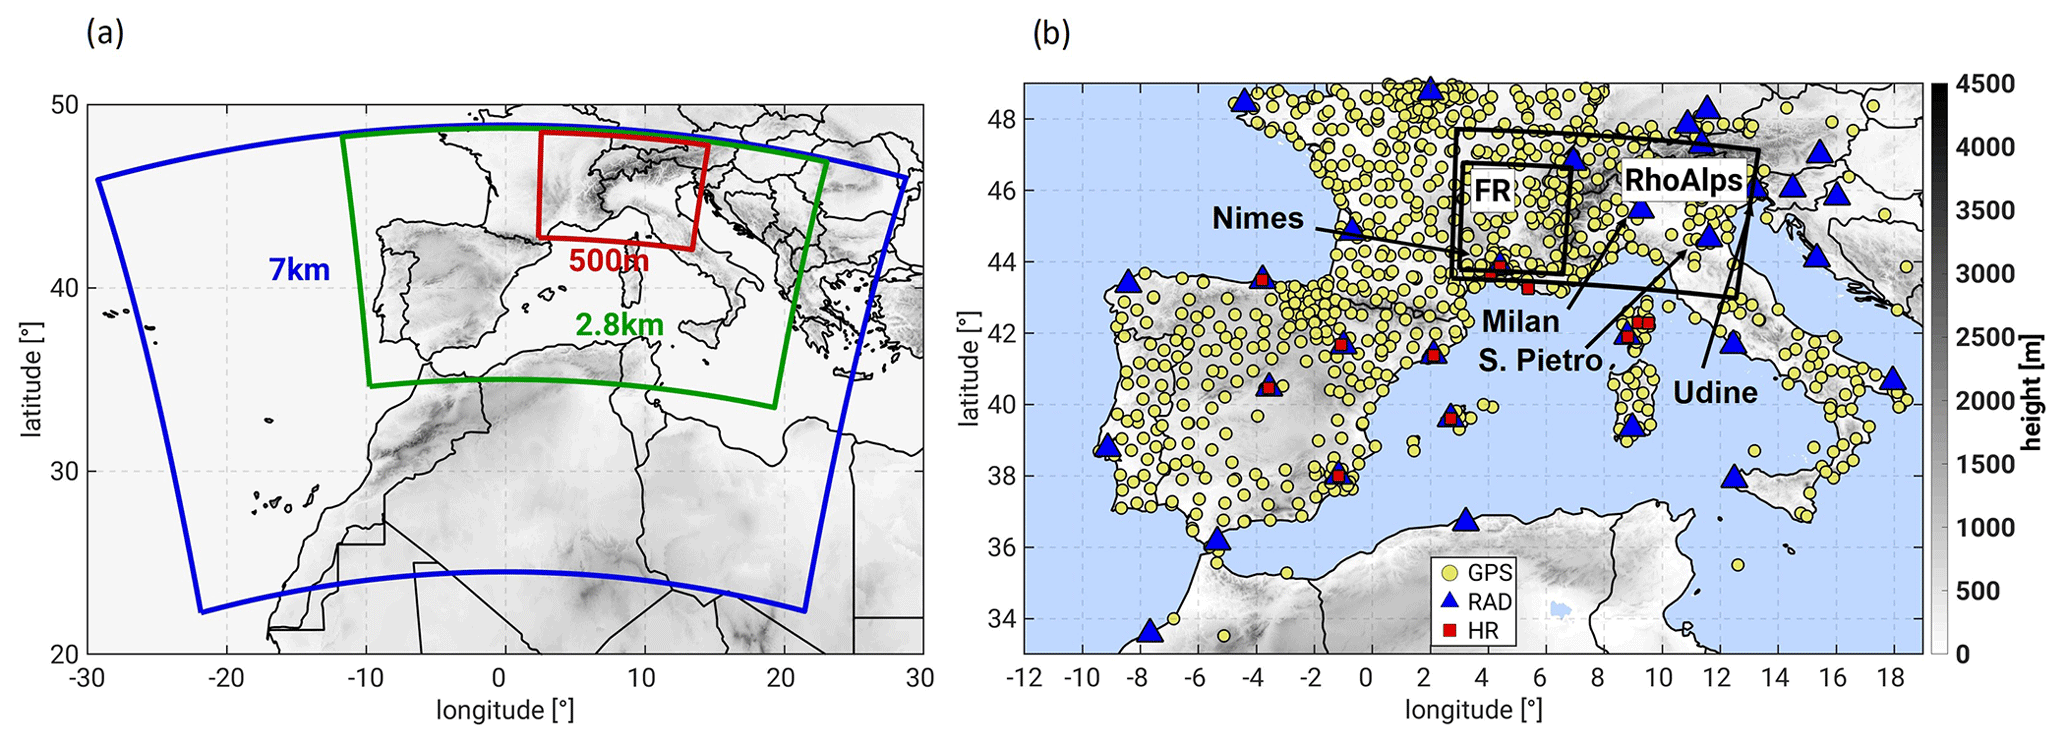
Figure 1(a) Nested simulation domains for the different resolutions. (b) Spatial distribution of nudged measurements, GPS, operational radiosondes (RAD) and high-resolution soundings (HR), and investigation domains FR and RhoAlps (boxes).
Table 1Summary of simulations nudging radiosondes and GPS observations. In total 18 simulations with nudging plus three control runs were performed. The simulations with combined nudging of observations maintain the same assimilation frequency and number of levels for the different observations. The resolution of the GLOBE orography data set is 1 km. The TERRA-ML model is used for the soil–atmosphere interactions parameterizations.
2.4 Verification metrics
2.4.1 99th percentile of 3-hourly precipitation aggregates
We validate extreme precipitation intensity simulated by COSMO against MSWEP. To this end we upscale COSMO's grid to the MSWEP spatial resolution (0.1∘). Then we obtain 3-hourly precipitation aggregates for the grid points within the investigation area. The 99th percentile is obtained from the sample of all 3-hourly precipitation intensities at each grid point during the day of precipitation, i.e. for eight time steps during 24 September 2012.
2.4.2 Temporal correlation
In Sect. 4.1, we validate the precipitation temporal correlation of the different simulations against observations (MSWEP). To this end, we calculate the Pearson correlation coefficient between the model's spatially averaged precipitation (mod) and that of the observations (obs) as in Jolliffe and Stephenson (2011) for 3-hourly aggregates during the day of precipitation (24 September 2012).
where the sums run for all eight time steps (i) of the 3-hourly aggregates during 24 September 2012. The spatial averaging is performed over the investigation area RhoAlps, where only land points are considered due to the lack of data of MSWEP over the sea; all simulations are coarse-grained to the MSWEP resolution.
For its interpretation it should be noted that the forecasting efficiency of Pearson's correlation coefficient is non-linear, i.e. small improvements of rmod,obs for values closer to 1 imply larger forecasting efficiency than improvements of the same extent for values closer to 0 (Jacques et al., 2018).
2.4.3 Fractions skill score (FSS)
The FSS provides an estimate of the agreement in the fraction of surface affected by precipitation between observations and simulations. After coarse-graining the simulations to the resolution of the observations (MSWEP, 0.1∘), each grid point within the investigation area (both for observations and simulations) is given a value of 1 if precipitation is larger than 20 mm d−1 and 0 to the remainder grid points. We selected this precipitation threshold to be able to have defined precipitation structures within the investigation area (Roberts and Lean, 2008; Skok and Roberts, 2016). We obtain the fractions of area, affected by precipitation in the model (fmod) and the observations (fobs) for moving sub-boxes. The fractions are computed as the ratio of the number of grid points with value 1 (nprecip) divided by the total number of grid points (ntot), of the moving sub-boxes (). The size of the sub-boxes is defined by the Neighbour Length (N). We choose the maximum possible N to guarantee the largest skill of the forecast. The maximum N is defined by the number of grid points in the shortest dimension of the investigation area. In our case this is the latitude dimension (nlat=42). N has to fulfil the condition , hence the neighbour length (N) of the moving boxes is 20. The FSS is computed as shown in Eq. (6).
where M is the number of moving sub-boxes. Equation (6) corresponds to what is defined in Roberts and Lean (2008) as asymptotic fractions skill score (AFSS). This asymptotic value is reached when the number of neighbours is the largest. It provides the largest skill of the verification and if there is no bias between the model and the observations AFSS equals one. On the other hand the lower limit of the model's skill is defined by the target FSS defined as and is denoted by a dashed line in Fig. 5c. Below this threshold the forecast has no skill.
2.4.4 Root-mean-square error (RMSE) and mean bias (MB)
The validation of IWV and specific humidity simulated with COSMO is quantified through the RMSE and MB (Eqs. 7 and 8) in Sect. 4.2, where i is the running index for all available observations (N):
In the night of 24 September 2012 several mesoscale convective systems (MCSs) were active over southern France, the Alps, and the Italian gulfs of Genoa and Venice (Hally et al., 2014; Ferretti et al., 2014). Over the course of 12 h, RG recorded totals as large as 100 mm over Montélimar, the Swiss Alps, and at the Austrian–Italian border (Fig. 2b). In total four regions can be characterized by heavy precipitation: the Rhône valley (France), Lugano (Switzerland), La Spezia (Italy), and Udine (Italy). The synoptic situation was dominated by an upper-level trough situated over western Europe and a surface low to the north-west of Ireland during the night of 23 September 2012 (Hally et al., 2014; Taufour et al., 2018). The associated cold front moved over southern France, the Alps, and north-eastern Italy in the course of 18 h, as the surface low moved from Ireland to the Baltic Sea. A squall line developed over southern France at 00:00 UTC on 24 September 2012 (Fig. 2a), reaching its mature phase at 03:00 UTC and splitting into two smaller MCSs at 05:00 UTC (Ribaud et al., 2016). The MCSs moved from north-western to north-eastern Italy after midday (Pichelli et al., 2017; Fig. 2a). The cyclonic circulation swept in air from the Mediterranean over the Gulf of Lion, the Gulf of Genoa, and up to Venice through the Adriatic Sea (Hally et al., 2014). The additional low-level moisture supported the unstable conditions needed for convective development and fed the active systems until their decay after 20:00 UTC on 24 September 2012.
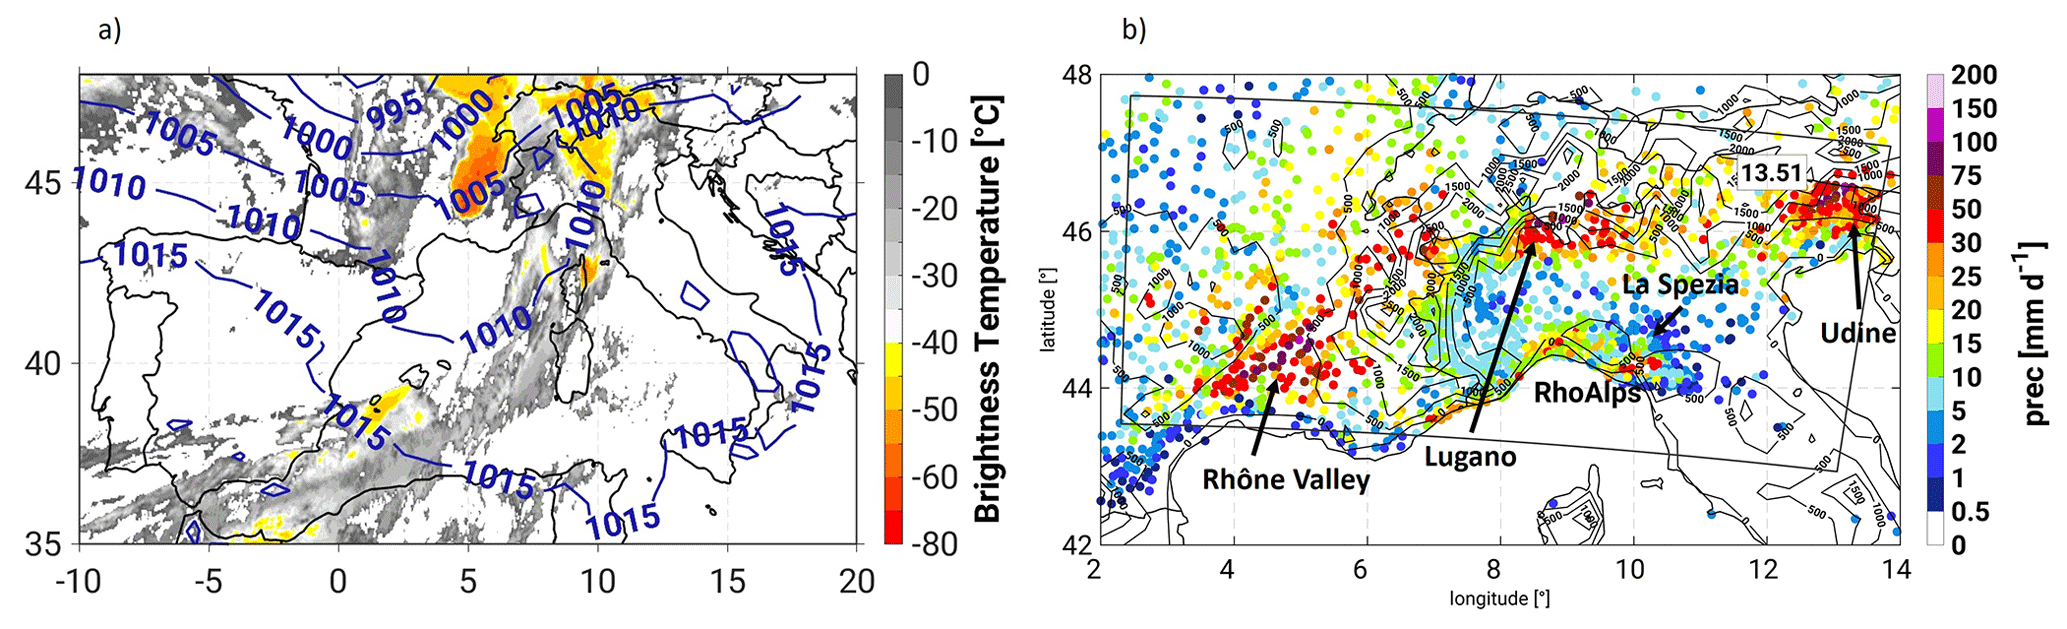
Figure 2Synoptic overview of IOP6. (a) Brightness temperature of the MSG-SEVIRI instrument (MSG-0 degree, all-sky radiances, https://www.eumetsat.int/, last access: 23 June 2021) and isolines of mean sea level pressure simulated by COSMO (7 km) on 24 September 2012 at 06:00 UTC. (b) 24-hourly accumulated precipitation from the HyMeX RG data set. The dark boxes FR and RhoAlps denote the investigation areas.
COSMO is able to represent the event, capturing the four main precipitation spots and the main features such as the squall line addressed by Hally et al. (2014). To demonstrate this, Fig. 3 represents the spatial distribution of 24-hourly aggregated rainfall simulated by COSMO (Fig. 3b–d) and observed by MSWEP (Fig. 3a). Overall, the MSWEP precipitation product represents well the event over the area, albeit with an underestimation over Liguria and an overestimation north of the Rhône valley and over the Alps, compared to RG. Regarding COSMO, the precipitation intensities stay within the observed range despite a tendency for underestimating the 24-hourly aggregations (Figs. 2b and 3). Irrespective of resolution, COSMO struggles to represent the observed amounts as large as 100 mm. Differences also occur in the precipitation structure and location with some dependency on the model resolution. CTRL-7 (Fig. 3b) shows the location of the convective line over FR shifted towards the Alps and a too narrow and intense precipitation structure over the Udine maximum. CTRL-2.8 (Fig. 3c) shifts the precipitation maxima over FR northward and splits the Udine maximum into two: one over Udine and the other one over the Gulf of Venice. Finally CTRL-500 (Fig. 3d) represents a narrower convective line over FR with a better agreement with observations and, as CTRL-2.8, a split maximum over north-eastern Italy.
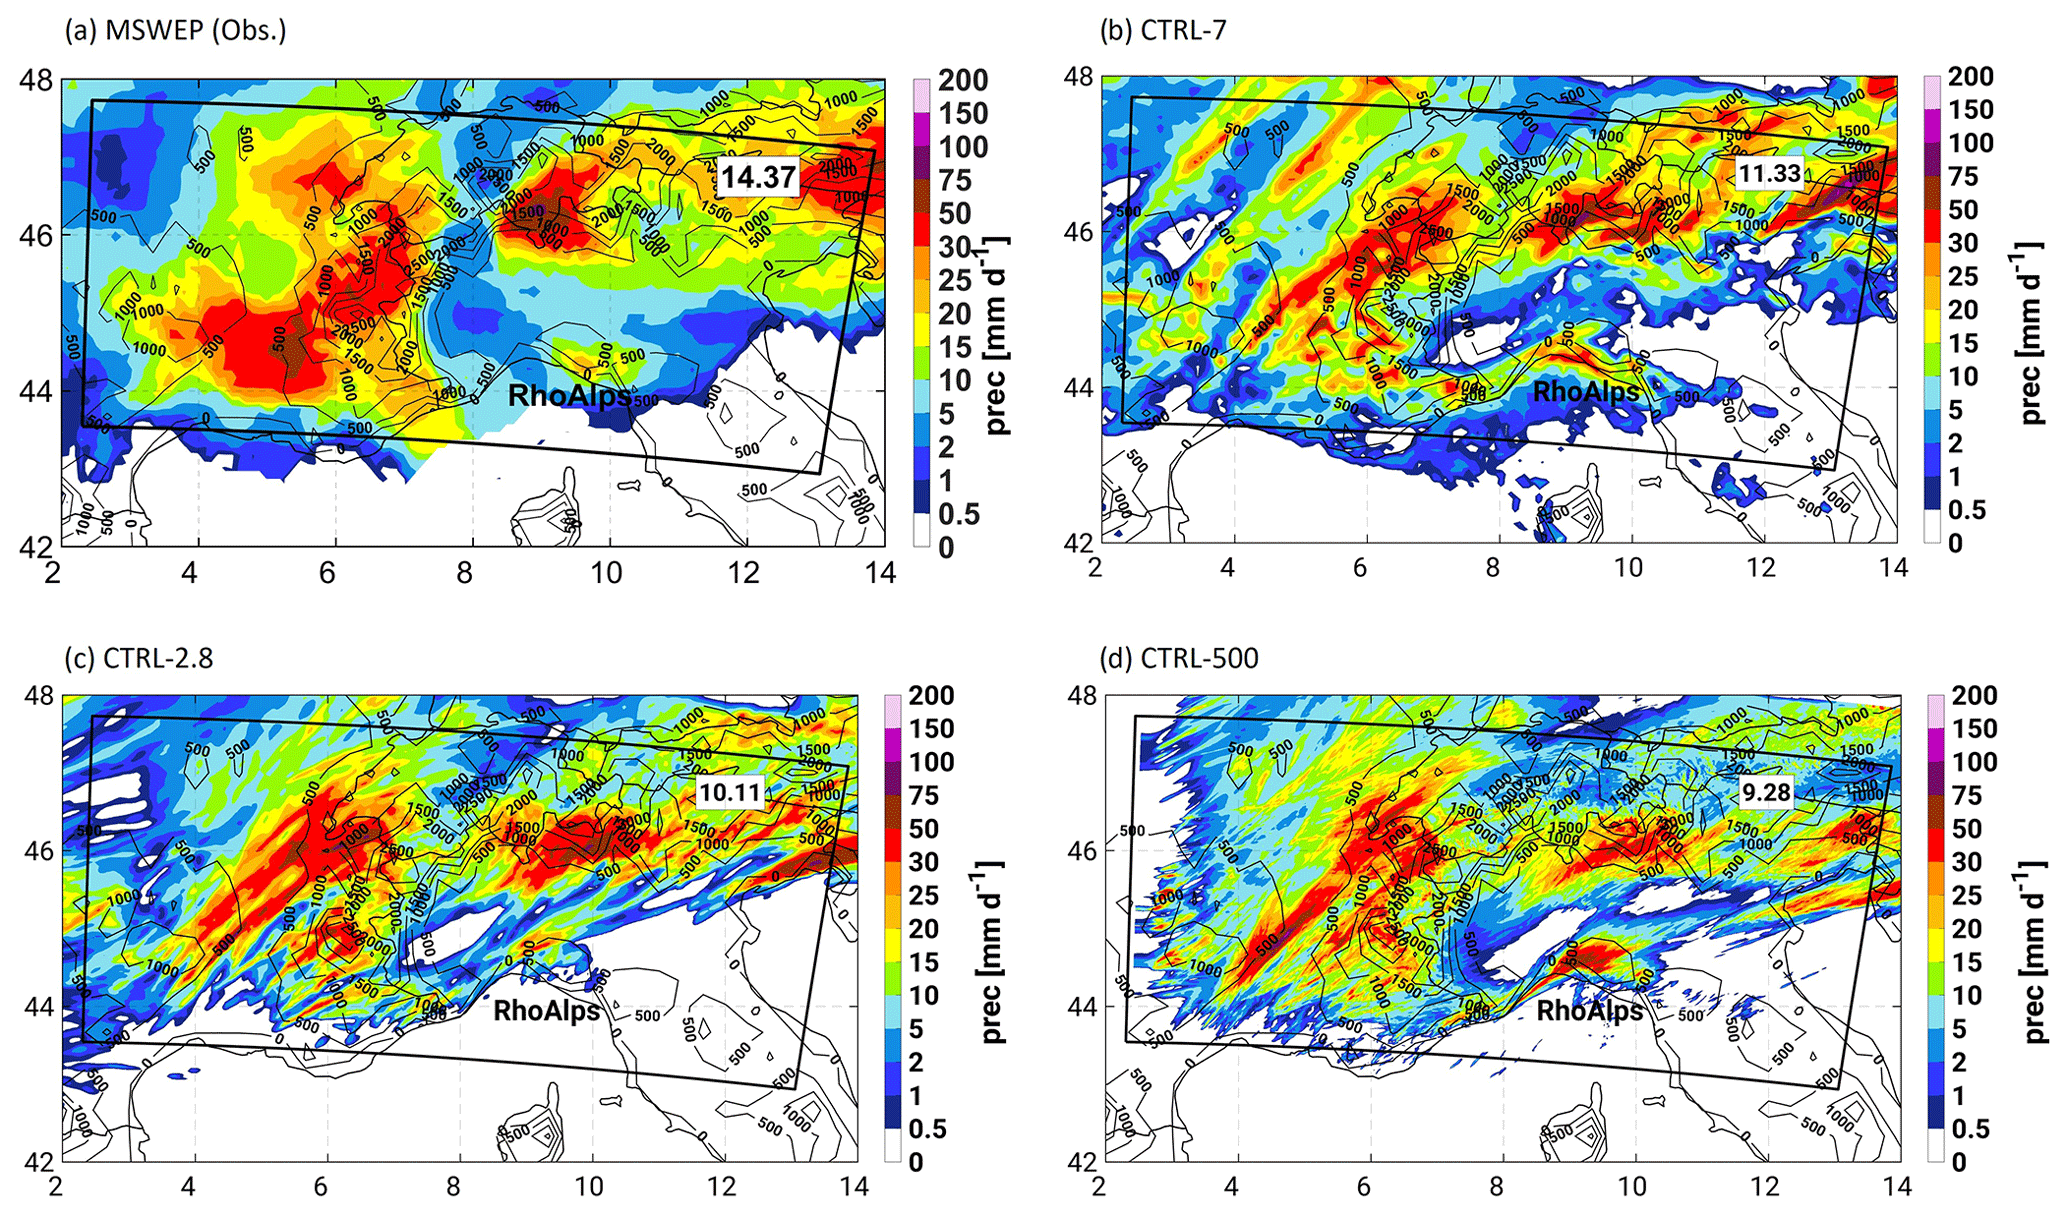
Figure 3Spatial distribution of daily precipitation during 24 September 2012 00:00 UTC to 25 September 00:00, estimated by the MSWEP v2.1, 3-hourly, 0.1∘ (a) and simulated by CTRL-7 (b), CTRL-2.8 (c), and CTRL-500 (d). The labels within the RhoAlps box show the values of the spatial averages used in Fig. 5a for validation of the precipitation totals.
4.1 Precipitation
The different observation types impact precipitation independently of the model resolution. Figure 4, analogously to Fig. 3, shows the spatial distribution of 24-hourly aggregated rainfall. In this case only the 500 m resolution is shown given the similarities with the results from the coarser resolutions (7 and 2.8 km) that are provided in the Supplement.
Nudging GPS data induces a reduction of precipitation, most strongly over the western slope of the Alps and Lugano, decreasing precipitation from 50 to 15 mm, and over the Udine region, with a reduction of from 50 to 10 mm (Fig. 4a). No shifting of the location of maxima occurs as no dynamic impacts like changes in the wind direction and intensity seem to be introduced by the GPS nudging (not shown). This agrees with previous studies showing a weak impact of assimilating thermodynamic profiles through latent heat nudging on horizontal wind (Jacques et al., 2018). Nudging RAD observations brings an increase in precipitation, both in intensity and extension (Fig. 4b). The areas most affected are located to the east of the Rhône valley, over Lugano, and Udine with up to 150 mm, well above the 50 mm simulated in CTRL-500.. Nudging HR soundings brought, overall, a marked decrease in precipitation amount over Lugano (Alps) and Udine, compared to CTRL. Intensities over these two spots are as low as 10 mm in the HR-500 simulation (Fig. 4c). This is not the case, however, for HR-2.8. Finally, combining all observation types for nudging (GPS–RAD–HR-500, Fig. 4d) yields a structure similar of that of the RAD simulations but with a weaker precipitation increase (Fig. 4b). It is worth mentioning the existence of model artefacts in the eastern part of the domain (Fig. 4d, for instance), which evidence the difficulties of dynamically downscaled simulations in initializing the microphysical species at the boundaries. This, however, does not affect the conclusions of this study.
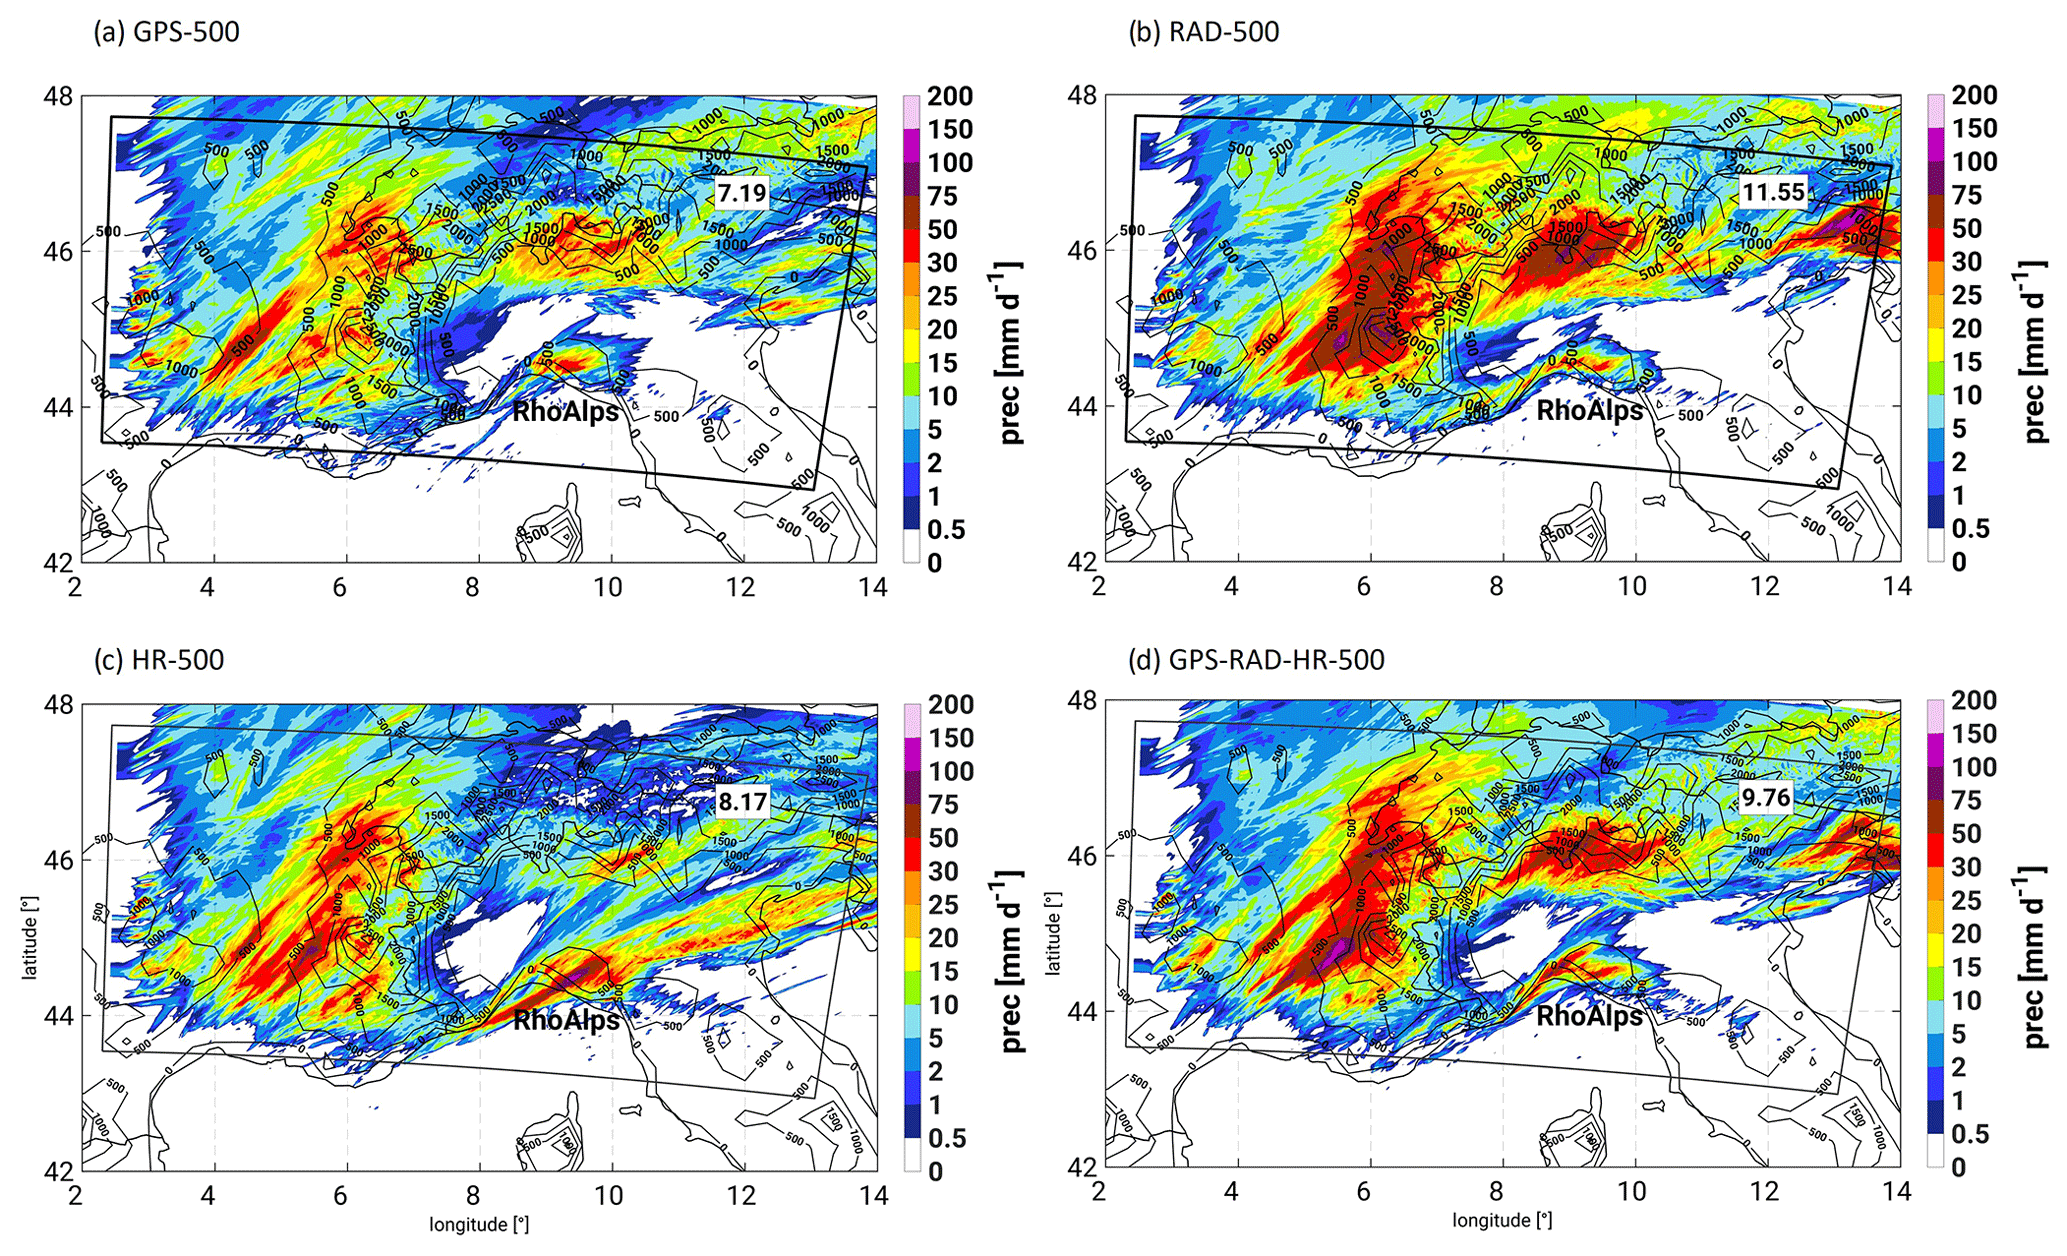
Figure 4As Fig. 3 but for GPS-500 (a), RAD-500 (b), HR-500 (c), and GPS–RAD–HR-500 (d). The analogous analyses using the 7 and 2.8 km grids are shown in the Supplement.
In the following we validate the assessed impact of the different observation types quantitatively by comparing precipitation observations (MSWEP) against the COSMO simulations. The use of MSWEP (resolution of 0.1∘) is motivated by the fact that it is a gridded product needed for the validation of precipitation correlation and structure. We validate for 24 September 2012 over investigation area RhoAlps, the spatially averaged 24-hourly aggregated precipitation (Fig. 5a), the 99th percentile of 3-hourly aggregated rainfall intensities (Fig. 5b), and the FSS (Fig. 5c). How these metrics are computed is introduced in Sect. 2.4. For the verification, all COSMO results have been coarse-grained to the native MSWEP grid.
Figure 5a confirms that all CTRL runs underestimate precipitation amount by about 4 mm. CTRL-7 shows the best result, since CTRL-2.8 and CTRL-500 emphasize more localized precipitation structures, which after spatial averaging contribute less to the final total. The simulations with nudged GPS data further reduce the precipitation amount, worsening the values in the comparison against observations for all resolutions with averages of approximately 8 mm only. The sole simulation able to increase the precipitation amount sufficiently is RAD, with values between 15 and 12 mm. This, as seen in Fig. 3b, is due to larger precipitation over the western Alps and Switzerland. Nudging HR, similarly to GPS, reduces the 24-hourly precipitation, resulting in worse scores. In this regard the higher vertical resolution of HR did not bring added value for this case study, compared to RAD. Finally, the combination of several observation types brings counteracting effects for all resolutions, dominated by drying induced by GPS and HR. Also noteworthy is the fact that for GPS, GPS–RAD, HR, RAD–HR, and GPS–RAD–HR, the most suitable resolution is 2.8 km.
In Fig. 5b, the analysis of 99th percentile intensities shows that CTRL represents intensities of extreme precipitation comparable to those of MSWEP. This implies that for this case a good simulation of extreme precipitation intensities did not imply a good prediction of the 24-hourly aggregates (Fig. 5a). CTRL-7 and CTRL-2.8 show similar intensities, but CTRL-500 has somewhat lower rates (by ∼ 5 mm). A plausible explanation is the use of a 3D closure for the turbulence scheme (see Table 1). Verrelle et al. (2015) showed that a 3D closure for the turbulence scheme induces larger horizontal diffusion in the area of the cloud base reducing convective intensity. GPS shows weak extreme precipitation intensities for all resolutions, with the best results for GPS-2.8 (20 mm). On the contrary, RAD shows a large increase with 3-hourly precipitation intensities in the order of 27 mm. The HR simulations show weak precipitation (between 16 and 23 mm), analogously to the underestimation of 24 h sums shown in Fig. 4a and c. Regarding the combined observations (GPS–RAD–HR), the use of RAD increases the precipitation intensities to more realistic values.
Finally, the FSS analysis (Fig. 5c) shows a good performance of the CTRL runs (FSS≈0.85). Nudging GPS reduces the FSS score due to the excessive precipitation reduction, which is consistent for all resolutions. RAD improves the representation of the precipitation structure (FSS≈0.95) due to the wider rain areas over Switzerland and the Rhône valley and the eastward shift to the western side of the Alps (Fig. 4b). HR also shows no added value for the improvement of precipitation area. Combined observations (GPS–RAD–HR) show little scale dependency and an improvement for the structure thanks to the impact of RAD. For this metric the 2.8 km grid shows the best value.
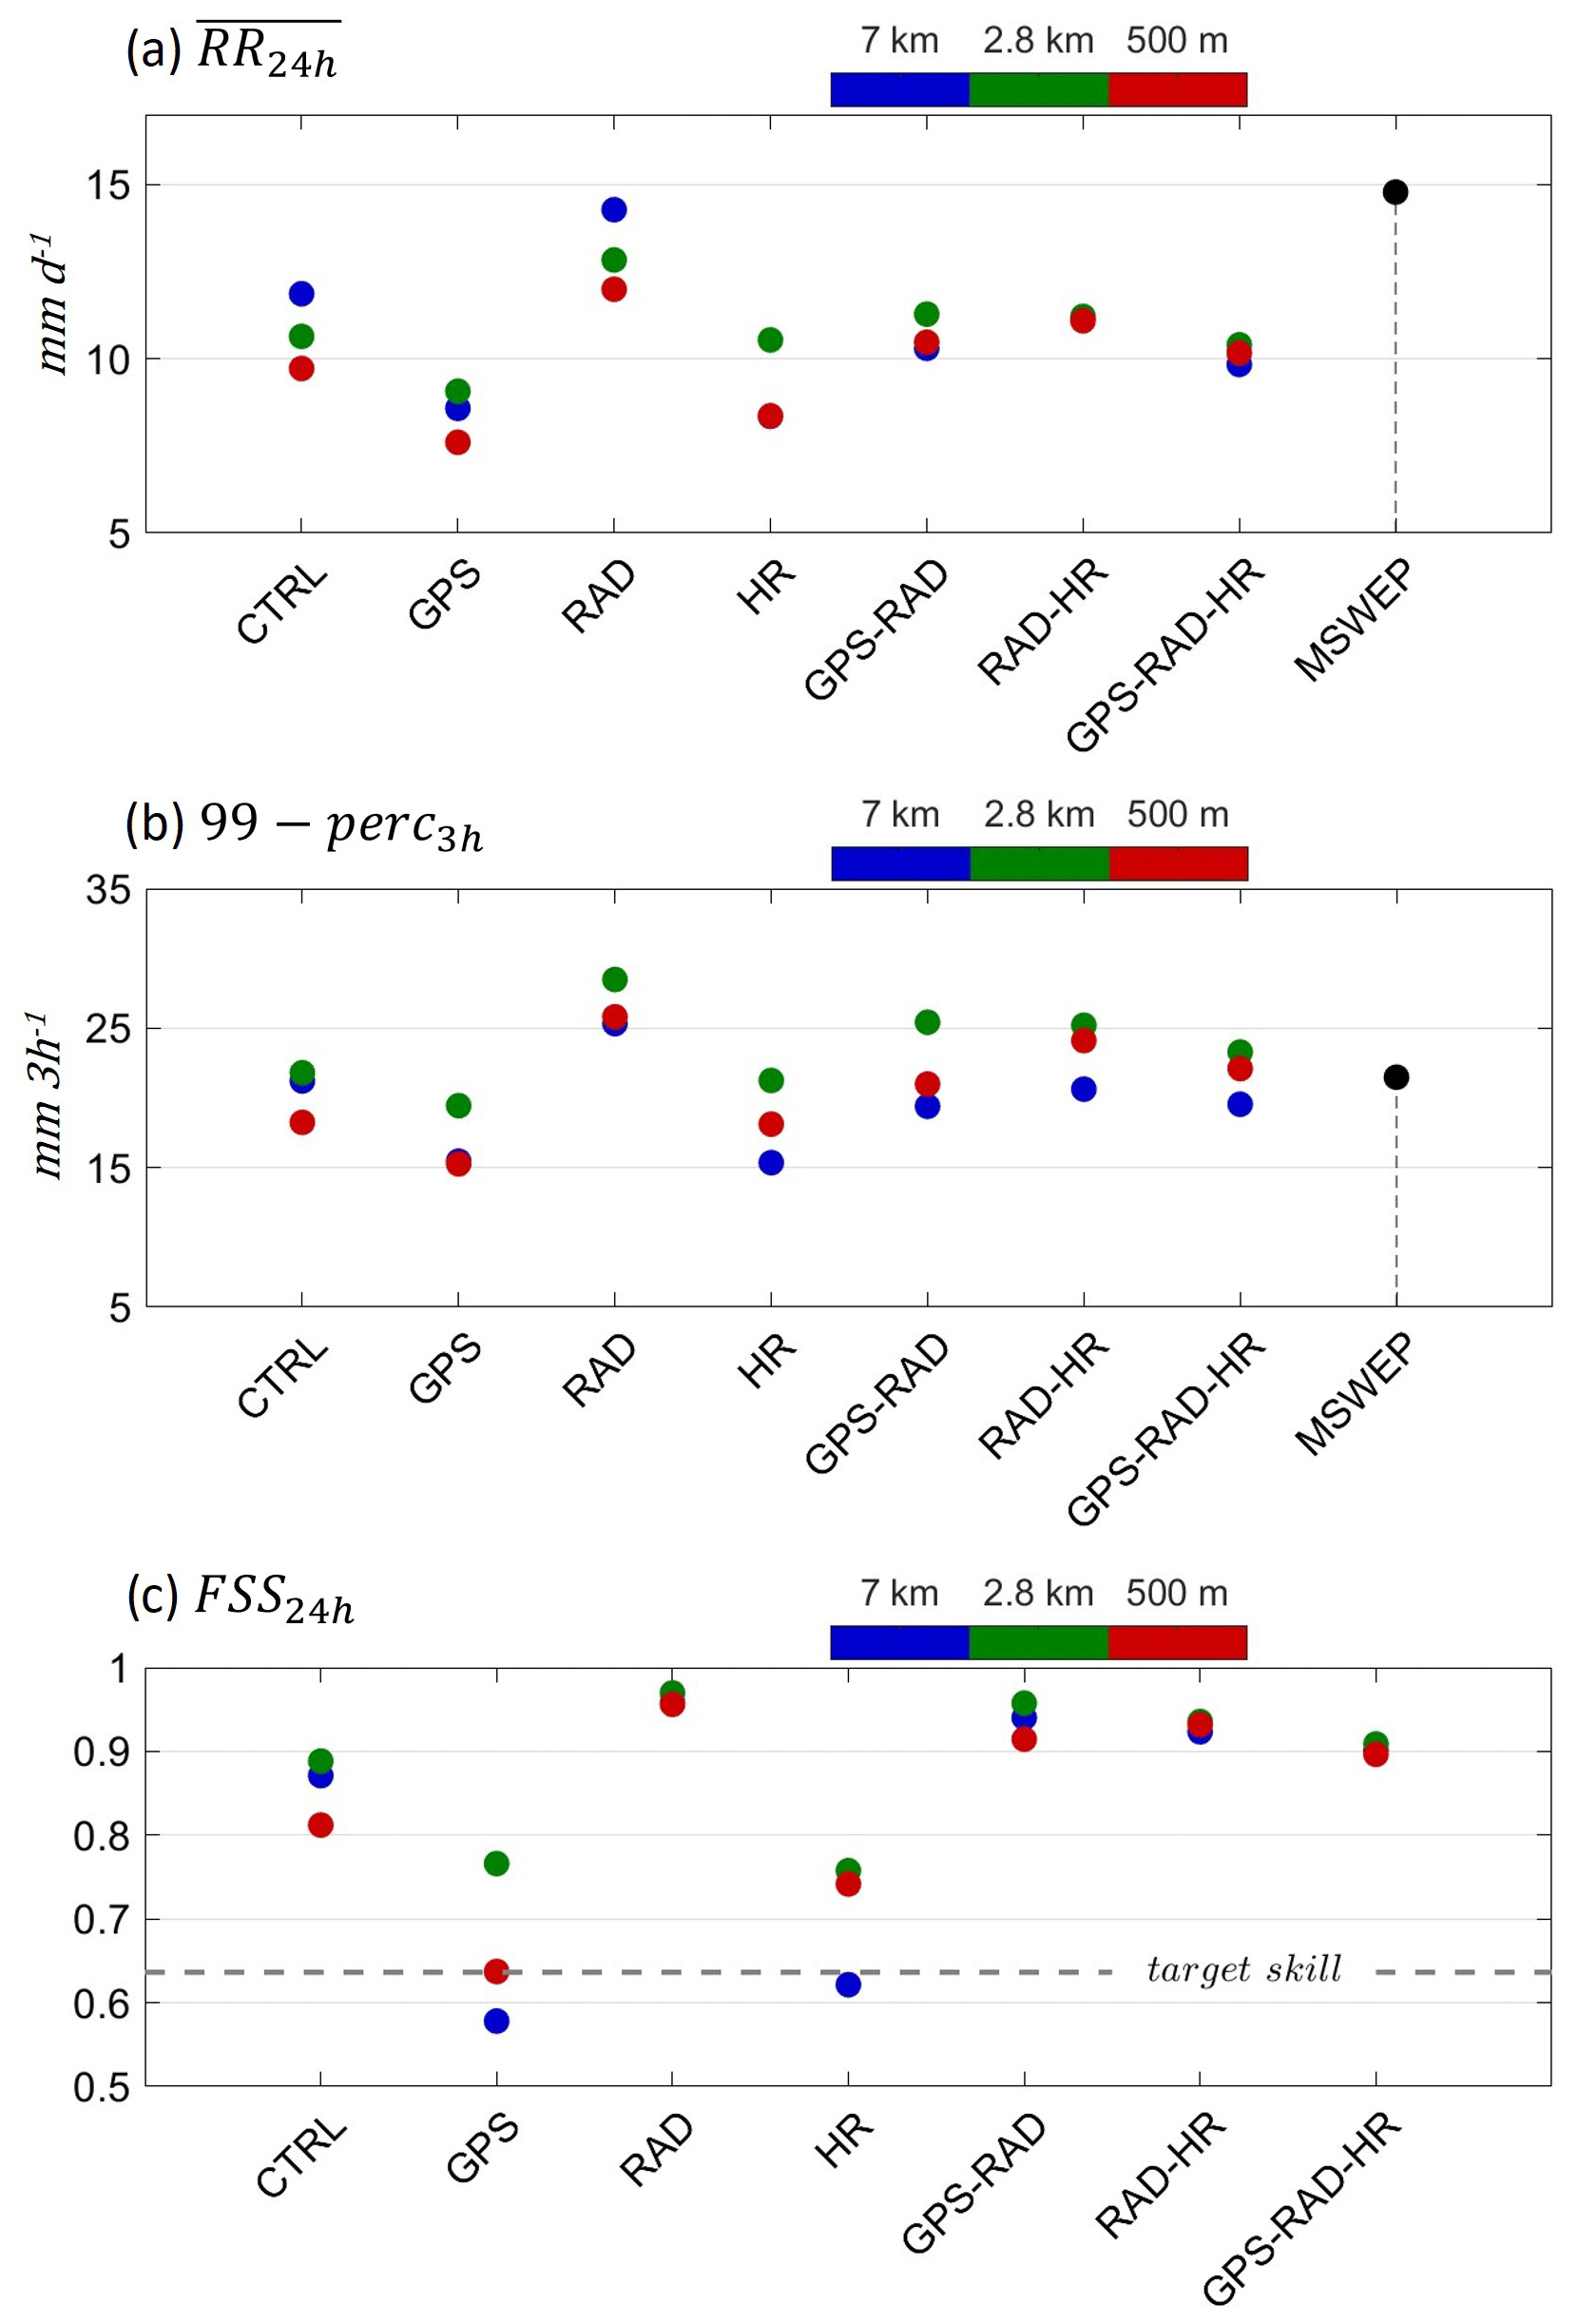
Figure 5(a) Accumulated precipitation amount during 24 September 2012, spatially averaged over RhoAlps, for COSMO and MSWEP. (b) The 99th percentile in millimetres per 3 h over the investigation area RhoAlps during 24 September 2012. (c) FSS of 24 h precipitation amount.
To understand the temporal evolution of the event, Fig. 6a shows spatially averaged precipitation over the investigation area RhoAlps. Precipitation as measured by MSWEP starts on 23 September at 21:00 UTC (black line in Fig. 6a), over the western part of the RhoAlps domain, reaching a steady maximum of 3 mm h−1 in the spatial averages between 06:00 and 18:00 UTC of 24 September (MSWEP; black colour). The convective decay is effective after 18:00 UTC where the last cells over the Italian–Slovenian border start to reduce their intensity. All simulations (colour lines in Fig. 6a) capture the event with a good representation of its initiation hour but simulate its decay between 3 and 2 h earlier. As in Fig. 4, only the results for the 500 m resolution are shown. The analogous results for the 7 and 2.8 km grid are given in the Supplement, which show a similar response to the different observation types. CTRL-500 (blue), GPS-500 (red), and HR-500 (green) show for most of the event's duration a spatially averaged intensity lower than MSWEP (between 0.5 and 1 mm h−1), explaining the differences in the 24-hourly aggregations (Figs. 4 and 5). Only the simulations including the operational soundings, RAD-500 (yellow) and GPS–HR–RAD-500 (purple), show a precipitation increase in agreement with the spatial distributions (Figs. 4b, d, and 5). The temporal evolution shows that a precipitation increase occurs after 24 September 06:00 UTC and reaches 4.5 mm h−1 for the former and 3 mm h−1 for the latter. In Sect. 4.3 we analyse the causes of the vast moisture increase in RAD.
To provide a quantitative score of the agreement in the temporal evolution of precipitation between observations (MSWEP; black line in Fig. 6a and the simulations; coloured lines), Fig. 6b shows the temporal correlation for the spatially averaged 3-hourly aggregations (as presented in Fig. 6a; see Sect. 2.4.2). CTRL-7 performs better than CTRL-2.8 and CTRL-500, with a correlation of up to 0.9 against MSWEP, due to a better location of precipitation variations at each grid point related to its more similar resolution to that of the observations (∼ 11 km). Nudging GPS data improves the temporal representation of precipitation of COSMO for all grid types (Fig. 6b). This is related to a smoother representation of the precipitation increase between 03:00 and 06:00 UTC and a flatter curve in contrast to other observation types (Fig. 6a). This is possibly due to the ability of the GPS nudging to improve the representation of the arrival of moisture and consequent increase, associated with precipitation initiation. RAD and HR bring little improvement, with even some deterioration for RAD-7. HR also brings some improvement due to a good representation of the timing of convective decay. Combining the different observation types (GPS–RAD–HR) brings a mixed impact (improvement by GPS and HR, worsening by RAD), which conceals the dependency on the model resolution used (r=0.82).
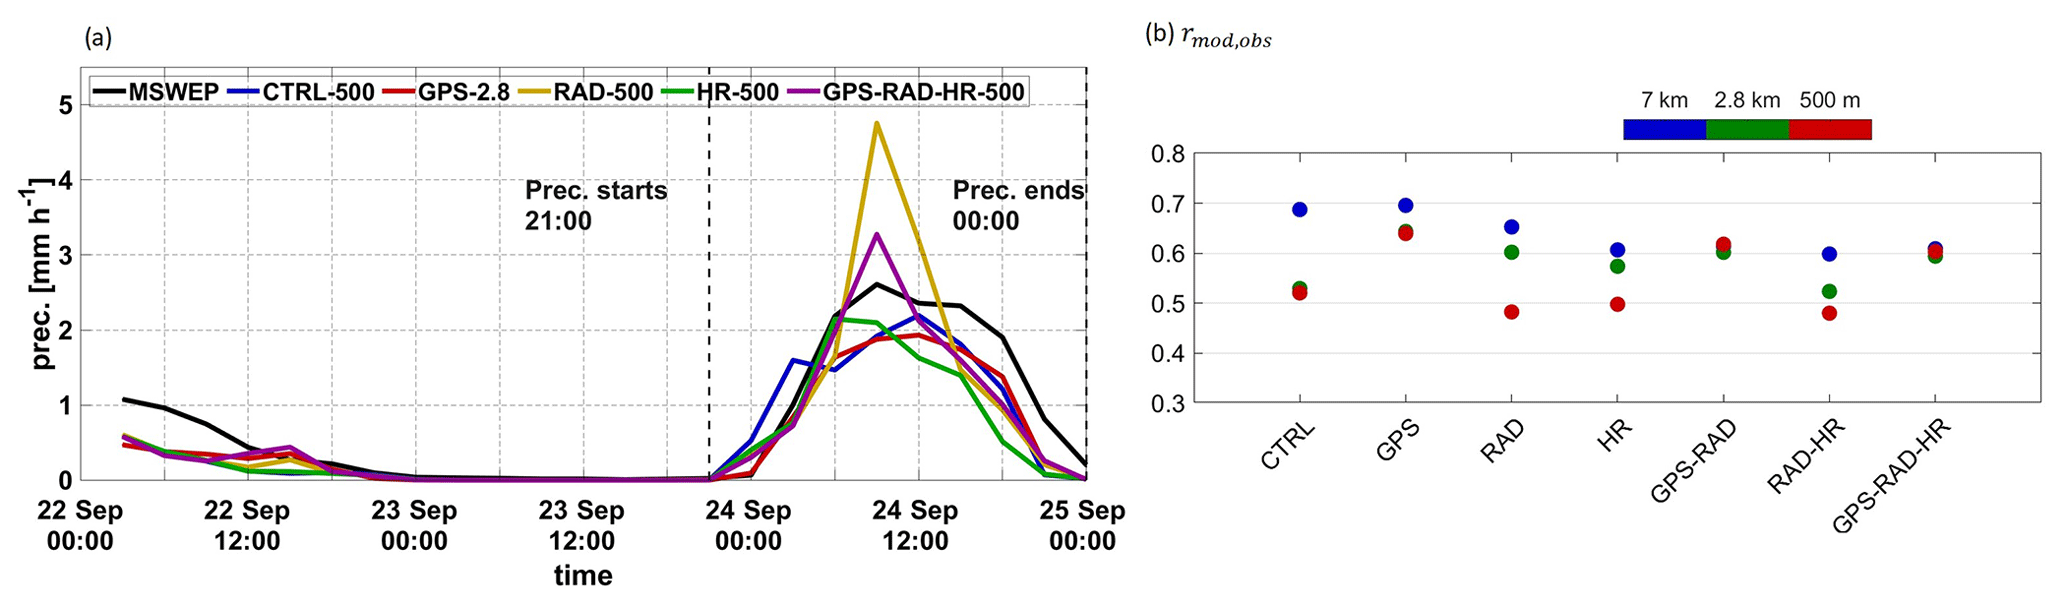
Figure 6Temporal evolution of spatially averaged precipitation (a) and temporal correlation validation of the precipitation temporal evolution (b). All simulations have been coarse-grained to the MSWEP spatial resolution (0.1∘). Spatial averages are performed for 3-hourly data. The corresponding results of (a) for the 7 and 2.8 km simulations can be found in Figs. S3a and S4a of the Supplement.
We conclude from the previous analysis that (a) only RAD brings an improvement to the simulation of precipitation; (b) GPS and HR excessively reduce the simulated precipitation, which could be related to model errors in COSMO; (c) GPS brings added value in simulating the timing of the event; and (d) there is overall little dependency on model resolution
4.2 Atmospheric moisture
Large moisture amounts were advected with the south-westerly to south-easterly flow up the Rhône valley during 23 September 2012. Figure 7 shows the evolution of spatially averaged hourly IWV from the 500 m COSMO simulations and GPS. For the following assessment we applied a correction to IWV for height differences between the model surface and the station altitude following Bock and Parracho (2019). The correction is based on an empirical linear relationship between IWV biases and height differences (dh) following the equation . Grid points with surface height differences larger than 500 m are dismissed. The average impact of these corrections does not exceed 1 % of IWV. The results for 2.8 and 7 km can be found in the Supplement. The highest GPS-IWV amount (27 mm; black line in Fig. 7, underneath the coloured lines) persists for 12 h over the study region starting on 24 September at midnight. CTRL-500 (blue line in Fig. 7) reproduces the IWV temporal evolution fairly well until 10:00 UTC on 23 September, when a period of considerable overestimation (+ 2 mm) begins, lasting until 05:00 UTC, well after convective precipitation had started. After 10:00 UTC, CTRL-500 matches better with the GPS-IWV observations. An overestimation of IWV by COSMO has already been assessed by previous studies (Caldas-Alvarez and Khodayar, 2020) and was also shown for the non-hydrostatic model AROME in Bastin et al. (2019). Nudging GPS (red line in Fig. 7) reduces the IWV overestimation until 06:00 UTC on 24 September. This observation type brings the best agreement with observations throughout the complete event. This is as expected, provided that the GPS-IWV observations are not independent from the assimilated GPS-ZTDs. Nudging RAD (yellow) also corrects the IWV overestimation until 05:00 UTC 24 September. However, an abrupt IWV increase takes place after 05:00 UTC on 24 September, with differences up to 2 mm against observations lasting for about 5 h. Nudging HR (green) corrects the IWV overestimation until the beginning of the event (21:00 UTC 23 September) but excessively dries the investigation area until 24 September 18:00 UTC. Nudging all observation types together (GPS–RAD–HR; purple) corrects the IWV overestimation until 21:00 UTC on 23 September 2012 (purple line in Fig. 7).

Figure 7Temporal evolution of spatially averaged IWV for the simulations with the 500 m grid. IWV is obtained through interpolation to the location of the GPS stations, applying a height correction following Bock and Parracho (2019). The corresponding results for the 7 and 2.8 km simulations can be found in Figs. S3b and S4b of the Supplement.
The temporal evolution in Fig. 7 has shown (a) the correction of the moisture overestimation by all observation types and (b) the relationship between IWV fluctuations and the timing of heavy precipitation over the RhoAlps area. To provide a quantitative assessment of the moisture representation in COSMO for this event, Table 2 shows the time averaged RMSE (left) and MB (right) between the COSMO simulations and the GPS measurements at the station locations. The MB is obtained as the MOD-OBS differences (Sect. 2.4). The results show that assimilating the GPS observations reduces RMSE and MB compared to CTRL (Table 2). Nudging RAD shows likewise a reduction of RMSE and MB in the convection-permitting grids (2.8 km and 500 m). This is, however, not seen for 7 km. Finally, the corrections induced in GPS–RAD–HR are dominated by the influence of the GPS measurements.
Table 2Root-mean-square error (RMSE; left) and mean bias (MB; right) of spatially and temporally averaged IWV between GPS and COSMO (22 September to 25 September 00:00 UTC) over RhoAlps. The averages are obtained from hourly IWV values, at the GPS station locations. The COSMO simulations have been coarse-grained to a common grid of 8 km grid spacing for this comparison. And a height correction on model data based on Bock and Parracho (2019) has been applied.
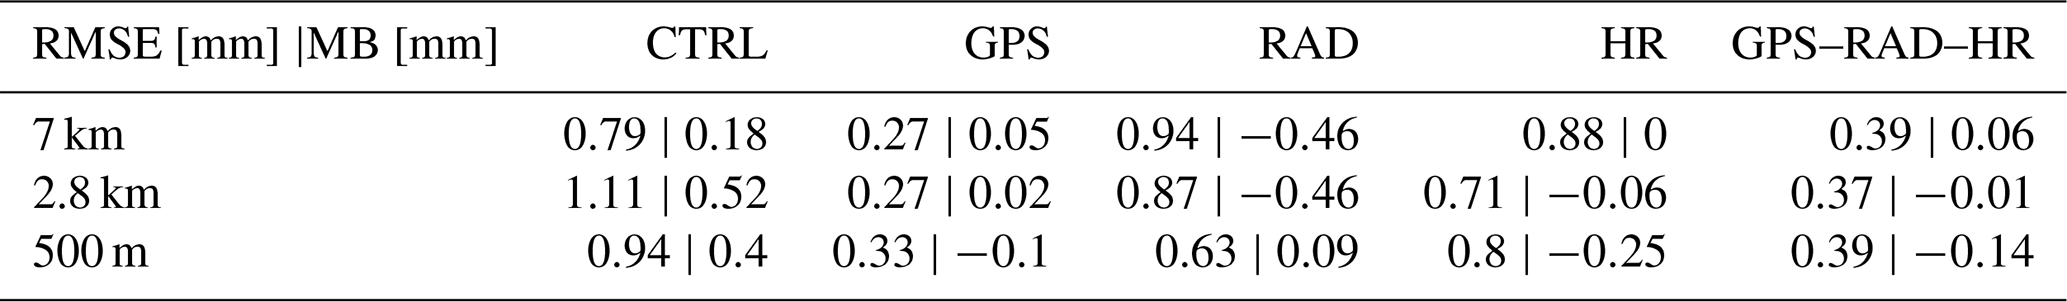
The fact that the GPS and HR observations improve the IWV representation, but generate too little precipitation, is indicative of errors in the model's numerics and physics for this case study. The results suggest that COSMO struggles to turn its excessive moisture content into precipitation, thus leaving the atmosphere too humid.
To understand how IWV errors are distributed in the vertical profile, Fig. 8 shows the MB (straight lines) and RMSE (dashed lines) of specific humidity between COSMO and four operational radiosondes of the RAD data set (Nîmes, Milan, San Pietro, and Udine; see Fig. 1b). All four stations are in the lowlands (height < 100 m) to avoid biases due to surface height differences. Although this comparison is not done against an independent data set, it provides valuable information of the vertical levels at which the nudging of the different observations has the largest impact. Furthermore, given that both the operational and the special high-resolution HyMeX radiosondes were used in the nudging experiments, no other vertical humidity profiles with high-accuracy were available for an independent comparison during this period.
CTRL-7 (Fig. 8a, blue) shows a MB within acceptable values (between −0.2 and 0.2 g kg−1). Similar RMSE and MB values are found for GPS-7 (red) and RAD-7 (yellow), but the latter with a slightly more negative MB (−0.2 g kg−1) throughout the complete profile, indicating a drier model at the selected four low-height stations. HR-7 (green) shows the largest deviations both for RMSE (up to 1.2 g kg−1 at 850 hPa) and MB, with an overestimation below 950 hPa and an underestimation above. GPS–RAD–HR-7 (purple) has the best MB and RMSE (∼ 0.6 g kg−1), demonstrating the added value of combining these observation types. The 2.8 km resolution (Fig. 8b) shows a somewhat different vertical distribution of specific humidity for CTRL-2.8 (blue) with an overestimation of the MB between 800 hPa and 600 hPa up to 0.3 g kg−1. GPS-2.8 (red) shows similar values of the RMSE, compared to its CTRL counterpart. The vertical gradient of MB is similar to CTRL-2.8 although somewhat drier in GPS-2.8, in agreement with the IWV reduction assessed in Fig. 7 and Table 2. This leads to the largest MB being found in the PBL (∼ −0.2 g kg−1) in GPS-2.8 (Fig. 8b; red). RAD-2.8 (yellow) has very good MB (0.2 g kg−1) and RMSE values (0.8 g kg−1), as expected, given the dependence on the observations in this comparison. This influence can also be seen for the good scores of GPS–RAD–HR-2.8 (purple). For the 500 m resolution (Fig. 8c), CTRL-500 (blue) shows an underestimation of moisture in the PBL and an overestimation above 800 hPa, up to 0.2 g kg−1. The impact of the different observation types is analogous to that observed in the 2.8 km simulations with the exception of HR-500 (green; Fig. 8c).
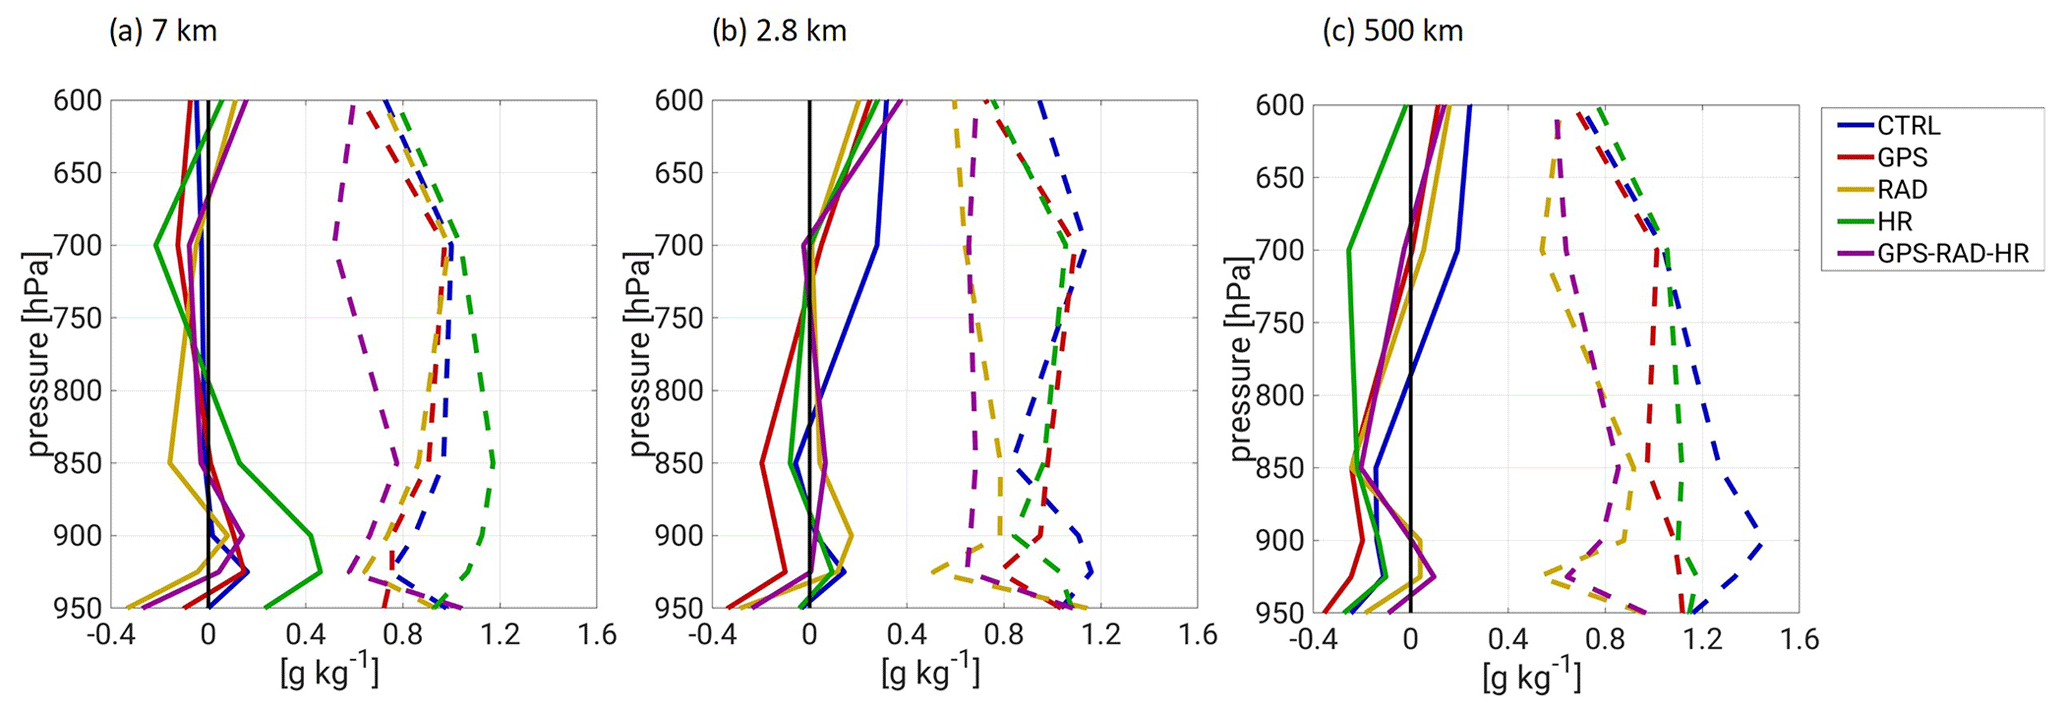
Figure 8Mean biases (solid lines) and RMSE (dashed lines) of specific humidity between the operational soundings for (a) the 7 km, (b) 2.8 km, and (c) and 500 m simulations. The differences are obtained at the four stations within the investigation area RhoAlps (Milan, Nîmes, Udine, San Pietro) and are averaged for all stations and for the complete simulation period (00:00 UTC 22 September to 00:00 UTC 25 September 2012).
The previous assessment leads to the conclusions that (a) COSMO misrepresents the humidity vertical gradient for this case study (too wet between 500 and 850 hPa), which was also found for another case study of the HyMeX period in Caldas-Alvarez and Khodayar (2020); and (b) nudging GPS did not help improve the representation of the vertical humidity gradient, as the correction at each level is applied based on the first guess. The latter explanations imply that COSMO should have simulated stronger convective updraughts to generate more precipitation at the surface and larger transport of moisture from the PBL to the LFT in the CTRL and GPS simulations.
4.3 The relevance of the Nîmes 05:00 UTC sounding
The good scores shown by RAD in the precipitation evaluation (Fig. 5) and the large increase in IWV and precipitation are worth an in-depth analysis of the impact of RAD on the humidity distribution and convective processes responsible for the remarkable precipitation increase. Figure 9 summarizes relevant information about the impact of RAD on humidity and precipitation. Between 23 and 24 September, before the arrival of the cold front, vast moisture amounts were transported up the Rhône valley by the south-westerly circulation (arrow in Fig. 9a). The moisture gathering up the valley preconditions the HPE. Once precipitation starts, the Nîmes RAD sounding at 05:15 UTC (hereafter referred to as Nîmes_0515) measured 6.5 g kg−1 of specific humidity at 700 hPa (Fig. 9b). Compared to other soundings (either operational or high-resolution) released in the area (Fig. 9b), Nîmes_0515 measured between 1.5 and 2.5 g kg−1 more specific humidity. For example, over Candillargues at 03:14 UTC on 24 September specific humidity at 700 hPa was 5 g kg−1, and over Marseille at 05:55 UTC it was lower than 4 g kg−1. This implies that after its assimilation, specific humidity at that level was considerably increased due to this one particular sounding. To demonstrate this aspect Fig. 9c shows that the reference runs of COSMO (CTRL-7 in blue) at that time over Nîmes have a 700 hPa level 1.5 g kg−1 drier than the observation. Hence the correction of humidity at that level after 05:15 UTC is crucial for the precipitation increase observed for RAD.
The Gaussian horizontal spreading of information induced by the nudging scheme (Schraff and Hess, 2012) and the transport of humidity with the south-westerly mean flow causes much wetter mid-levels over the Rhône valley and over the western Alps. This impact was similar for all resolutions. To demonstrate quantitatively this impact, Fig. 9d shows relative precipitation differences in percent (%) between the RAD-7 simulation and an auxiliary RAD-7 simulation where the Nîmes_0515 sounding is dismissed. The results show that the contribution to precipitation of the Nîmes_0515 sounding is a 40 % increase spatially averaged over the whole domain and up to 70 % downstream of Nîmes.

Figure 9(a) Location of the stations with RAD and HR profiles between 23 September 23:23 UTC and 24 September 05:55 UTC, as well as cold front position and direction of the mean flow. (b) Radiosonde measurements (RAD and HR) in the area. (c) Skew-T log p diagram of the Nîmes radiosonde at 05:15 UTC on 24 September and the simulation of the profile by CTRL-500, interpolated to the station location. (d) Precipitation differences between RAD-7 and the same simulation without the Nîmes sounding shown in panel (c).
The large impact of the Nîmes_0515 sounding gives important clues as to whether GPS systems were able to compensate for radiosondes for this case study. With no means to measure the vertical distribution of humidity, GPS struggles to bring the expected improvement in precipitation representation. The reason why other soundings close to Nîmes in time and space did not measure such a large humidity amount at 700 hPa is still unknown. The large spatial heterogeneity of this variable might have played a decisive role, and its undersampling has already been identified as a factor limiting heavy precipitation simulation (Khodayar et al., 2018). Unfortunately, no other humidity observations exist for that time and location (lidar, pressurized balloons, or dropsondes). Another possible explanation is an ascent of the Nîmes_0515 sounding through a precipitating system. In that case a saturated atmosphere would be present at 700 hPa where the sounding was launched. This implies existing errors in COSMO regarding the underestimation of humidity at the LFT (see Fig. 8) and the need of excessive moisture and rain are compensated for by this one sounding. This highlights the relevance and complications of targeted observations for DA. Moreover, it also highlights that, for this case study, the accurate location and timing of that one sounding were more relevant for precipitation simulation than the higher vertical resolution offered by the HR data set. Spatial distances of 60 km and temporal differences of 30 min are enough to miss/capture a crucial measurement of water vapour.
4.3.1 Impact on moisture flux, instability, and wind circulation
In order to better understand the precipitation increase due to nudging, we now investigate its impact on moisture advection, temperature, and instability. We focus on the 700 hPa level due to the humidity differences assessed earlier in this section. The temporal period analysed is the 6 h following the large precipitation increase in RAD, and the investigation area is now FR (Fig. 1), where the largest impact of the Nîmes_0515 sounding was seen. Only the 500 m results are shown given the analogous impact in the other two resolutions; the results for the 7 and 2.8 km grid can be found in the Supplement.
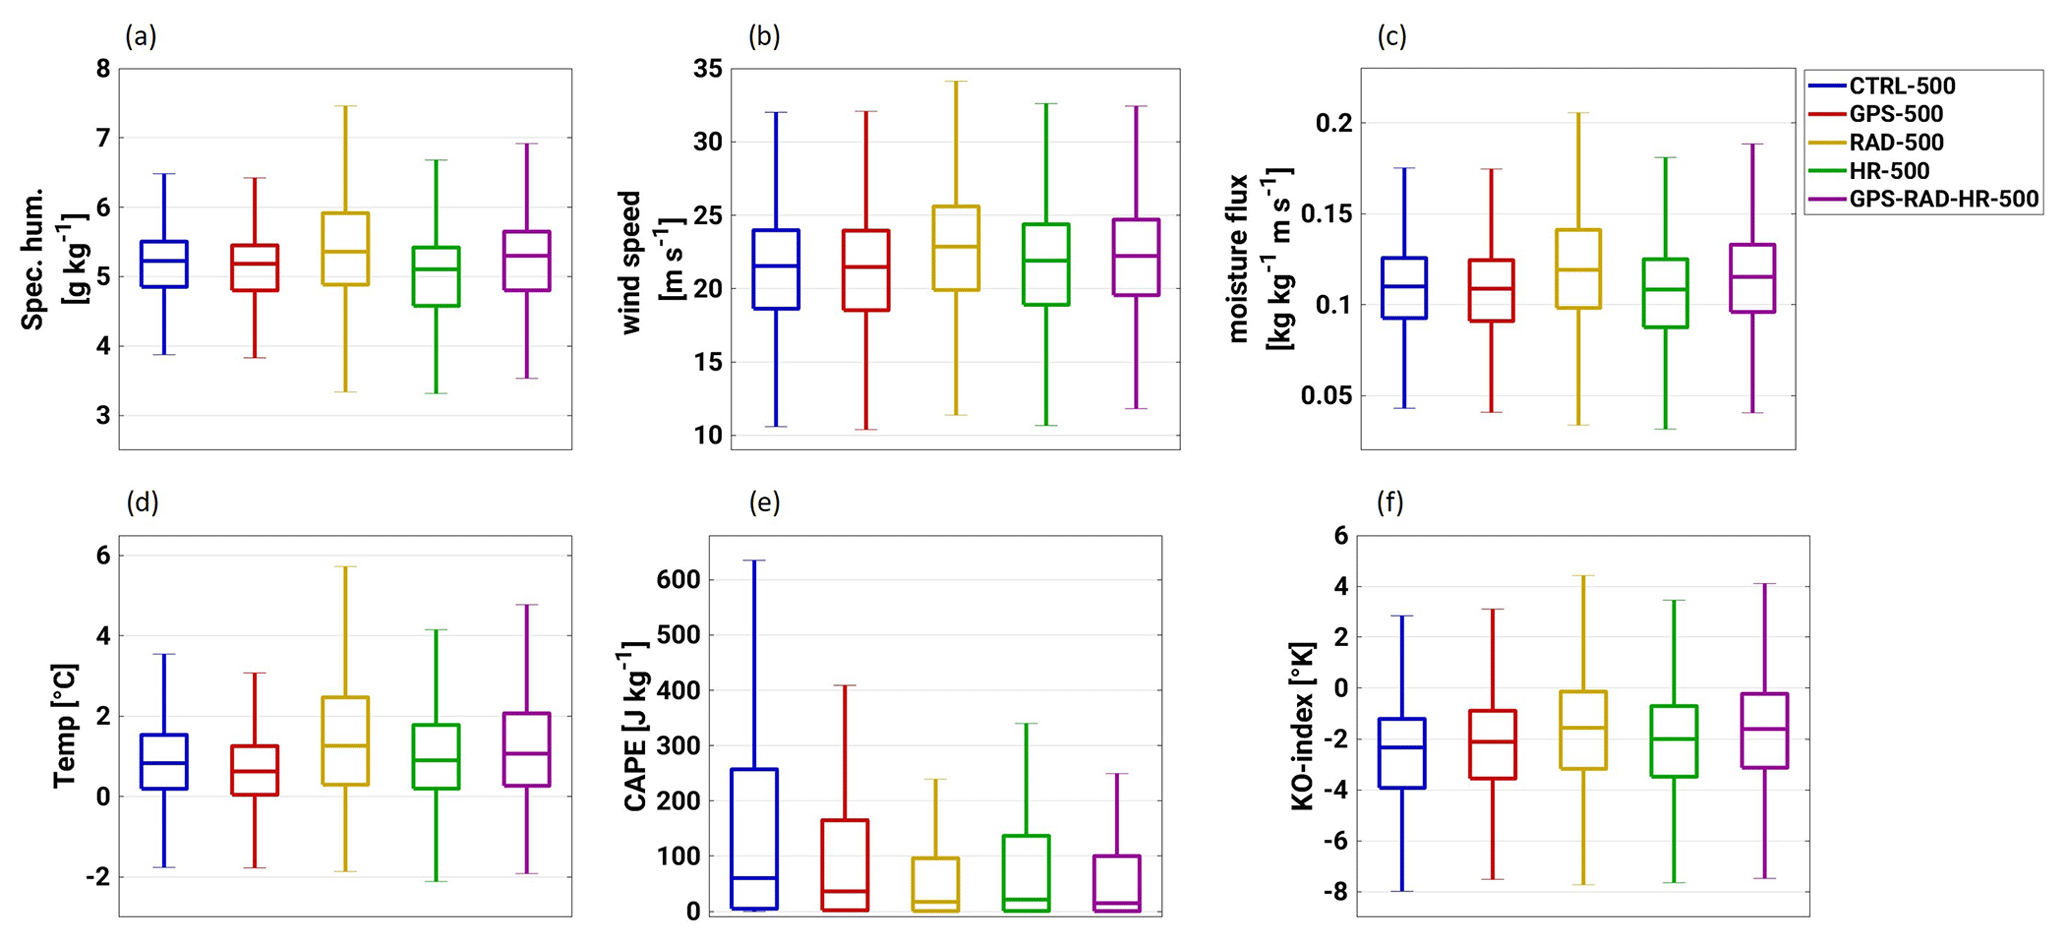
Figure 10Box-and-whisker plots showing the median, quartiles, and extremes of specific humidity (a), wind speed (b), moisture flux (c), temperature (d), CAPE (e), and KO index (f) at 700 hPa. All the values have been obtained from hourly COSMO output between 05:00 UTC and 10:00 UTC of 24 September 2012 over the study region FR.
Figure 10a shows that CTRL-500 (blue) and GPS-500 (red) have a similar distribution of specific humidity at 700 hPa, with median values of 5.3 g kg−1 and extremes as large as 6.5 g kg−1. The impact of exclusively nudging RAD (yellow) soundings is an increase in specific humidity. This is mostly due to the influence of the Nîmes_0515 sounding as discussed above. The impact of HR (Fig. 10a), in contrast, is a reduction of the median and larger variability compared to CTRL-500. The GPS–RAD–HR-500 (purple) simulation shows increased humidity, mostly due to the RAD contribution. Regarding horizontal wind speed (Fig. 10b), GPS-500 (red), HR-500 (green), and GPS–RAD–HR-500 (purple) show hardly any differences compared to CTRL (blue). However, the Nîmes_0515 sounding enhances the speed at this level, probably due to enhanced convection inducing stronger winds. The impact for moisture flux at 700 hPa (Fig. 10c) can be understood as the combination of humidity and wind changes. CTRL-500 (blue), GPS-500 (red), and HR-500 (green) show very similar median values of moisture flux, close to 0.12 kg ms−1. For their part, RAD-500 (yellow) and GPS–RAD–HR-500 (purple) show an increased moisture flux with extreme values reaching 0.2 and 0.19 kg ms−1, respectively (Fig. 10c). Regarding temperature (Fig. 10d), GPS-500 (red) slightly reduces the values as well as specific humidity. Due to weaker convection, less latent heat is released in the process of condensation and less mixing occurs from the PBL to the free troposphere. However, the RAD-500 (yellow) simulation shows larger extremes. This further supports the hypothesis that the Nîmes_0515 sounding sampled in a precipitation area affected by latent heating and vertical moisture fluxes. Finally, GPS–RAD–HR-500 (purple) shows 75th percentile values up to 4.5 ∘C influenced by the RAD and HR measurements. Regarding atmospheric instability, Fig. 10.d represents convective available potential energy (CAPE; Moncrieff and Miller, 1976), and Fig. 10e represents the KO index (Andersson et al., 1989). CAPE provides a quantitative estimation of the energy available for lifting of a hypothetical air parcel in the lowest 50 hPa of the atmosphere. The KO index provides an estimation of potential instability. CTRL-500 (blue) shows the largest atmospheric instability (high CAPE, low KO index). The nudged simulations show lower instability (CAPE and KO index). In the case of GPS-500 (red) and HR-500 (green), the latter is explicable from the drying of the atmospheric profile down to the surface, which reduces equivalent potential temperature (θe) for both CAPE and the KO index. For RAD-500 (yellow) and GPS–RAD–HR-500 (purple), the moisture increase at 700 hPa is interpreted as an increase in θe at that level, hence leading to a less steep lapse rate decreasing CAPE (Figs 10e) and increasing the KO index. It is worth noting that for this case study not only the low-level conditional instability defines the environment for convection but also the cold front and upper-level divergence that release potential instability. From this analysis we conclude that after 05:00 UTC the humidity increase at 700 hPa was the dominating factor invigorating convection.
This study assessed the impact of nudging GPS column water vapour estimates, operational soundings, and high-resolution soundings on high-resolution model simulations using an autumn convective precipitation event in the western Mediterranean as a case study (HyMeX-IOP6). The high density of observations obtained in the framework of HyMeX allowed a thorough investigation of assimilation experiments to systematically assess the added value, advantages, and disadvantages of the individual observation types and the sensitivity to model resolution. For example, GPS lacks vertical information but has a vast coverage in the western Mediterranean and a temporal resolution of 10 min, whereas high-resolution radiosondes have a high vertical resolution (∼ 700 levels) but a scarce coverage and sub-daily temporal resolution (6 to 12 h). We performed the sensitivity experiments using the COSMO model and the nudging scheme in model resolutions of 7 km, 2.8 km, and 500 m. The main conclusions are the following.
COSMO shows deficiencies in representing the mechanisms of heavy precipitation for this case study, which could not be corrected by nudging additional observations. The reference runs (no assimilated data) showed a moist bias before precipitation onset and an underestimation of precipitation, indicating that COSMO is unable to transform the excess of moisture (especially at the mid-levels) into precipitation. Nudging GPS and HR data corrected this moist bias but also further reduced precipitation, leading to worse verification scores irrespective of resolution.
Nudging operational radiosondes, however, brought a clear improvement in the representation of 24 h precipitation, precipitation intensities, and spatial structure. The improvement was brought about by a large precipitation increase (+40 % in the 7 km simulations) after 05:00 UTC on 24 September lasting 3 h. This was mainly caused by the assimilation of one particular sounding in southern France (i.e. from Nîmes at 05:15 UTC on 24 September), probably embedded in a precipitating convective cell, south of the main convective systems. The main mechanism was an increase in specific humidity of 2.5 g kg−1 at the 700 hPa level, 5 h after precipitation initiation, which likely reduced the entrainment of dry air and led to higher moisture availability.
The large impact brought about by an individual sounding implies, on the one hand, that traditional sounding systems, which need manned operations and have a lower spatial coverage and temporal resolution, will still be needed, even when GPS networks are also available. This is further supported by the difficulties of GPS observations to correct the vertical distribution of specific humidity. On the other hand, it implies that targeted observations, such as the ones carried out in HyMeX, can in fact be decisive for assimilation in convective situations – especially for variables with large spatial and temporal variability such as atmospheric moisture.
The overall performance and type of impact of each observation type were not dependent on the model resolution used. The 2.8 km resolution showed marginally better precipitation scores for all used observations, suggesting that a computationally more expensive resolution of 500 m is not needed for this case study. As 2.8 km is the operational configuration, model parameters are optimally set for this resolution, possibly giving an advantage that could be eliminated with a re-tuning for 500 m.
We would like to highlight the added value of GPS nudging in improving the temporal evolution of precipitation. GPS improves the anomaly correlation for all resolutions, suggesting that nudging together GPS and soundings can benefit both from the temporal evolution improvement and the vertical resolution of the radiosondes.
The fact that COSMO underestimates the precipitation amount with a pre-convective environment that is too moist in this case points to model errors in the physical parameterizations or numerics, which assimilation procedures could not compensate for. The results for this case study provide a first assessment, but further cases should be analysed to allow for generalization of the findings. Moreover, in follow-up work we investigate all precipitation events of the autumn 2012 and whether physics updates in the framework of the development of the successor model ICON have been able to reduce the highlighted problems.
The COSMO model is only accessible after request to the consortium and after agreeing on the terms and licences at http://www.cosmo-model.org/ (COSMO, 2021; Rockel at al., 2008).
The simulation data for precipitation and IWV used to produce Figs. 3b–d, 4, 5, 6, 7, 9d, S1, S2, S3, and S4 and Table 2, as well as post-processed humidity, instability, temperature, and wind model data used for Figs. 8, 9b–c, 10, S5, and S6, are accessible at https://doi.org/10.5445/IR/1000127550 (Caldas-Alvarez, 2021). Regarding observations, all data sets were provided by other groups or institutions; hence access is only possible after agreement with the corresponding authors. Most of the data belong to the HyMeX/MISTRALS data repository. All observational data sets are referenced, and contact details are provided when available.
The supplement related to this article is available online at: https://doi.org/10.5194/wcd-2-561-2021-supplement.
SK designed and planned the experiments and supervised ACA during his PhD work, to which this investigation belongs. ACA performed the nudging simulations. SK, PK, and ACA analysed the results. ACA and PK wrote the manuscript with comments from SK.
The authors declare that they have no conflict of interest.
This research work has been financed by the Bundesministerium für Bildung und Forschung (BMBF; German Federal 605 Ministry of Education and Research) project PREMIUM 01LN1319A. We would like to thank the HyMeX and MISTRALS projects, with grants MISTRALS/HyMeX and ANR-11-BS56-0005 IODA-MED, for providing most of the observational data used for assimilation and model validation. These are the RG, the operational soundings, the high-resolution soundings and the GPS-ZTD, and GPS-IWV products. The latter two data sets have been contributed by Oliver Bock and the LAboratoire de Recherche En Géodésie (LAREG) of the French Institute of the Geographic and Forest Information (IGN). We also want to thank Hylke Beck for sharing the MSWEP precipitation data for the study period (Beck et al., 2017).
Regarding the COSMO model, we are grateful to the German Weather Service (DWD) for sharing a distribution of the model and in particular to U. Schättler for supporting the installation of the model, C. Schraff for helping to install and run the nudging scheme, and to U. Blahak for his scripts to run sub-kilometre simulations with COSMO. The whole simulation effort would not have been possible without the support from the Steinbuch Centre for Computing, hosted at KIT, in particular the high-performance computer Forschungshochleistungs-rechners II (ForHLRII). PK acknowledges project B6 “New data assimilation approaches to better predict tropical convection” of the Transregional Collaborative Research Center SFB/TRR 165 “Waves to Weather” funded by the German Science Foundation (DFG). Finally we would like to thank the reviewers for their fruitful questions and comments.
This research has been supported by the Bundesministerium für Bildung und Forschung (grant no. PREMIUM 01LN1319A).
This paper was edited by Silvio Davolio and reviewed by Dominik Jacques and Thomas Gastaldo.
Andersson, T., Andersson, M., Jacobsson, C., and Nilsson, S.: Thermodynamic indices for forecasting thunderstorms in southern Sweden, Meteorol. Mag., 118, 141–146, 1989.
Baldauf, M., Seifert, A., Förstner, J., Majewski, D., Raschendorfer, M., and Reinhardt, T.: Operational Convective-Scale Numerical Weather Prediction with the COSMO Model: Description and Sensitivities, Mon. Weather Rev., 139, 3887–3905, https://doi.org/10.1175/mwr-d-10-05013.1, 2011.
Barthlott, C. and Hoose, C.: Spatial and temporal variability of clouds and precipitation over Germany: multiscale simulations across the “gray zone”, Atmos. Chem. Phys., 15, 12361–12384, https://doi.org/10.5194/acp-15-12361-2015, 2015.
Bastin, S., Drobinski, P., Chiriaco, M., Bock, O., Roehrig, R., Gallardo, C., Conte, D., Domínguez Alonso, M., Li, L., Lionello, P., and Parracho, A. C.: Impact of humidity biases on light precipitation occurrence: observations versus simulations, Atmos. Chem. Phys., 19, 1471–1490, https://doi.org/10.5194/acp-19-1471-2019, 2019.
Bauer, P., Thorpe, A., and Brunet, G.: The quiet revolution of numerical weather prediction, Nature, 525, 47–55, https://doi.org/10.1038/nature14956, 2015.
Beck, H. E., van Dijk, A. I. J. M., Levizzani, V., Schellekens, J., Miralles, D. G., Martens, B., and de Roo, A.: MSWEP: 3-hourly 0.25∘ global gridded precipitation (1979–2015) by merging gauge, satellite, and reanalysis data, Hydrol. Earth Syst. Sci., 21, 589–615, https://doi.org/10.5194/hess-21-589-2017, 2017.
Benjamin, S. G., Jamison, B. D., Moninger, W. R., Sahm, S. R., Schwartz, B. E., and Schlatter, T. W.: Relative Short-Range Forecast Impact from Aircraft, Profiler, Radiosonde, VAD, GPS-PW, METAR, and Mesonet Observations via the RUC Hourly Assimilation Cycle, Mon. Weather Rev., 138, 1319–1343, https://doi.org/10.1175/2009mwr3097.1, 2010.
Bernstein, D. N. and Neelin, J. D.: Identifying sensitive ranges in global warming precipitation change dependence on convective parameters, Geophys. Res. Lett., 43, 5841–5850, https://doi.org/10.1002/2016gl069022, 2016.
Bock, O., Bosser, P., Pacione, R., Nuret, M., Fourrié, N., and Parracho, A.: A high-quality reprocessed ground-based GPS dataset for atmospheric process studies, radiosonde and model evaluation, and reanalysis of HyMeX Special Observing Period, Q. J. Roy. Meteor. Soc., 142, 56–71, https://doi.org/10.1002/qj.2701, 2016.
Bock, O. and Parracho, A. C.: Consistency and representativeness of integrated water vapour from ground-based GPS observations and ERA-Interim reanalysis, Atmos. Chem. Phys., 19, 9453–9468, https://doi.org/10.5194/acp-19-9453-2019, 2019.
Bonekamp, P. N. J., Collier, E., and Immerzeel, W. W.: The Impact of Spatial Resolution, Land Use, and Spinup Time on Resolving Spatial Precipitation Patterns in the Himalayas, J. Hydrometeorol., 19, 1565–1581, https://doi.org/10.1175/jhm-d-17-0212.1, 2018.
Borderies, M., Caumont, O., Delanoë, J., Ducrocq, V., Fourrié, N., and Marquet, P.: Impact of airborne cloud radar reflectivity data assimilation on kilometre-scale numerical weather prediction analyses and forecasts of heavy precipitation events, Nat. Hazards Earth Syst. Sci., 19, 907–926, https://doi.org/10.5194/nhess-19-907-2019, 2019.
Businger, S., Chiswell, S. R., Bevis, M., Duan, J., Anthes, R. A., Rocken, C., Ware, R. H., Exner, M., VanHove, T., and Solheim, F. S.: The Promise of GPS in Atmospheric Monitoring, B. Am. Meteor. Soc., 77, 5–18, https://doi.org/10.1175/1520-0477(1996)077<0005:tpogia>2.0.co;2, 1996.
Caldas-Alvarez, A.: The impact of GPS and high-resolution radiosonde nudging on the simulation of heavy precipitation during HyMeX IOP6, KITOpen, Karlsruhe Institute of Technology, https://doi.org/10.5445/IR/1000127550, 2021.
Caldas-Alvarez, A. and Khodayar, S.: Assessing atmospheric moisture effects on heavy precipitation during HyMeX IOP16 using GPS nudging and dynamical downscaling, Nat. Hazards Earth Syst. Sci., 20, 2753–2776, https://doi.org/10.5194/nhess-20-2753-2020, 2020.
Campins, J., Navascués, B., Santos, C., and Amo-Baladrón, A.: Influence of targeted observations on short-term forecasts of high-impact weather events in the Mediterranean, Nat. Hazards Earth Syst. Sci., 13, 2891–2910, https://doi.org/10.5194/nhess-13-2891-2013, 2013.
Carlin, J. T., Gao, J., Snyder, J. C., and Ryzhkov, A. V.: Assimilation of ZDR Columns for Improving the Spinup and Forecast of Convective Storms in Storm-Scale Models: Proof-of-Concept Experiments, Mon. Weather Rev., 145, 5033–5057, https://doi.org/10.1175/mwr-d-17-0103.1, 2017.
Chan, S. C., Kendon, E. J., Fowler, H. J., Blenkinsop, S., Ferro, C. A. T., and Stephenson, D. B.: Does increasing the spatial resolution of a regional climate model improve the simulated daily precipitation?, Clim. Dynam., 41, 1475–1495, https://doi.org/10.1007/s00382-012-1568-9, 2012.
Coppola, E., Sobolowski, S., Pichelli, E., Raffaele, F., Ahrens, B., Anders, I., Ban, N., Bastin, S., Belda, M., Belusic, D., Caldas-Alvarez, A., Cardoso, R. M., Davolio, S., Dobler, A., Fernandez, J., Fita, L., Fumiere, Q., Giorgi, F., Goergen, K., Güttler, I., Halenka, T., Heinzeller, D., Hodnebrog, Ø., Jacob, D., Kartsios, S., Katragkou, E., Kendon, E., Khodayar, S., Kunstmann, H., Knist, S., Lavıìn-Gullón, A., Lind, P., Lorenz, T., Maraun, D., Marelle, L., van Meijgaard, E., Milovac, J., Myhre, G., Panitz, H.-J., Piazza, M., Raffa, M., Raub, T., Rockel, B., Schär, C., Sieck, K., Soares, P. M. M., Somot, S., Srnec, L., Stocchi, P., Tölle, M. H., Truhetz, H., Vautard, R., de Vries, H., and Warrach-Sagi, K.: A first-of-its-kind multi-model convection permitting ensemble for investigating convective phenomena over Europe and the Mediterranean, Clim. Dynam., 5, 3–34, https://doi.org/10.1007/s00382-018-4521-8, 2018.
COSMO: Consortium for Small-scale Modeling, available at: http://www.cosmo-model.org/, last access: 25 June 2021.
Davolio, S., Silvestro, F., and Gastaldo, T.: Impact of Rainfall Assimilation on High-Resolution Hydrometeorological Forecasts over Liguria, Italy, J. Hydrometeorol., 18, 2659–2680, https://doi.org/10.1175/jhm-d-17-0073.1, 2017.
Dayan, U., Nissen, K., and Ulbrich, U.: Review Article: Atmospheric conditions inducing extreme precipitation over the eastern and western Mediterranean, Nat. Hazards Earth Syst. Sci., 15, 2525–2544, https://doi.org/10.5194/nhess-15-2525-2015, 2015.
Doms, G., Förstner, J., Heise, E., Herzog, H.-J., Mironov, D., Raschendorfer, M., Reinhardt, T., Ritter, B., Schrodin, R., Schulz, J.-P., and Vogel, G.: A Description of the Nonhydrostatic Regional COSMO Model Part II: Physical Parameterization, Deutscher Wetterdienst (DWD), P.O. Box 100465, 63004, Offenbach, Germany, 2011.
Ducrocq, V., Braud, I., Davolio, S., Ferretti, R., Flamant, C., Jansa, A., Kalthoff, N., Richard, E., Taupier-Letage, I., Ayral, P.-A., Belamari, S., Berne, A., Borga, M., Boudevillain, B., Bock, O., Boichard, J.-L., Bouin, M.-N., Bousquet, O., Bouvier, C., Chiggiato, J., Cimini, D., Corsmeier, U., Coppola, L., Cocquerez, P., Defer, E., Delanoë, J., Girolamo, P. D., Doerenbecher, A., Drobinski, P., Dufournet, Y., Fourrié, N., Gourley, J. J., Labatut, L., Lambert, D., Coz, J. L., Marzano, F. S., Molinié, G., Montani, A., Nord, G., Nuret, M., Ramage, K., Rison, W., Roussot, O., Said, F., Schwarzenboeck, A., Testor, P., Baelen, J. V., Vincendon, B., Aran, M., and Tamayo, J.: HyMeX-SOP1: The Field Campaign Dedicated to Heavy Precipitation and Flash Flooding in the Northwestern Mediterranean, B. Am. Meteorol. Soc., 95, 1083–1100, https://doi.org/10.1175/bams-d-12-00244.1, 2014.
Federico, S., Petracca, M., Panegrossi, G., Transerici, C., and Dietrich, S.: Impact of the assimilation of lightning data on the precipitation forecast at different forecast ranges, Adv. Sci. Res., 14, 187–194, https://doi.org/10.5194/asr-14-187-2017, 2017.
Federico, S., Torcasio, R. C., Avolio, E., Caumont, O., Montopoli, M., Baldini, L., Vulpiani, G., and Dietrich, S.: The impact of lightning and radar reflectivity factor data assimilation on the very short-term rainfall forecasts of RAMS@ISAC: application to two case studies in Italy, Nat. Hazards Earth Syst. Sci., 19, 1839–1864, https://doi.org/10.5194/nhess-19-1839-2019, 2019.
Ferretti, R., Pichelli, E., Gentile, S., Maiello, I., Cimini, D., Davolio, S., Miglietta, M. M., Panegrossi, G., Baldini, L., Pasi, F., Marzano, F. S., Zinzi, A., Mariani, S., Casaioli, M., Bartolini, G., Loglisci, N., Montani, A., Marsigli, C., Manzato, A., Pucillo, A., Ferrario, M. E., Colaiuda, V., and Rotunno, R.: Overview of the first HyMeX Special Observation Period over Italy: observations and model results, Hydrol. Earth Syst. Sci., 18, 1953–1977, https://doi.org/10.5194/hess-18-1953-2014, 2014.
Fourrié, N., Nuret, M., Brousseau, P., and Caumont, O.: Data assimilation impact studies with the AROME-WMED reanalysis of the first special observation period of the Hydrological cycle in the Mediterranean Experiment, Nat. Hazards Earth Syst. Sci., 21, 463–480, https://doi.org/10.5194/nhess-21-463-2021, 2021.
Gilabert, J. and Llasat, M. C.: Circulation weather types associated with extreme flood events in Northwestern Mediterranean, Int. J. Climatol., 38, 1864–1876, https://doi.org/10.1002/joc.5301, 2017.
Goger, B., Rotach, M. W., Gohm, A., Fuhrer, O., Stiperski, I., and Holtslag, A. A. M.: The Impact of Three-Dimensional Effects on the Simulation of Turbulence Kinetic Energy in a Major Alpine Valley, Bound.-Lay. Meteorol., 168, 1–27, https://doi.org/10.1007/s10546-018-0341-y, 2018.
Guerova, G., Jones, J., Douša, J., Dick, G., de Haan, S., Pottiaux, E., Bock, O., Pacione, R., Elgered, G., Vedel, H., and Bender, M.: Review of the state of the art and future prospects of the ground-based GNSS meteorology in Europe, Atmos. Meas. Tech., 9, 5385–5406, https://doi.org/10.5194/amt-9-5385-2016, 2016.
Hally, A., Richard, E., and Ducrocq, V.: An ensemble study of HyMeX IOP6 and IOP7a: sensitivity to physical and initial and boundary condition uncertainties, Nat. Hazards Earth Syst. Sci., 14, 1071–1084, https://doi.org/10.5194/nhess-14-1071-2014, 2014.
Hastings, D. A., Dunbar, P. K., and Hittelman, A. M.: Assessing the global land one-km base elsevation DEM, in: Geodesy Beyond 2000, edited by: Schwarz, K. P., International Association of Geodesy Symposia, 121, Springer, Berlin, Heidelberg, https://doi.org/10.1007/978-3-642-59742-8_16, 2000.
Hdidou, F. Z., Mordane, S., Moll, P., Mahfouf, J.-F., Erraji, H., and Dahmane, Z.: Impact of the variational assimilation of ground-based GNSS zenith total delay into AROME-Morocco model, Tellus A, 72, 1–13, https://doi.org/10.1080/16000870.2019.1707854, 2020.
Honda, T. and Kawano, T.: How does mid-tropospheric dry air affect the evolution of supercellular convection?, Atmos. Res., 157, 1–16, https://doi.org/10.1016/j.atmosres.2015.01.015, 2015.
Jacobsen, I. and Heise, E.: A new economic method for the computation of the surface temperature in numerical models, Contr. Atmos. Phys., 55, 128–141, 1982.
Jacques, D., Michelson, D., Caron, J.-F., and Fillion, L.: Latent Heat Nudging in the Canadian Regional Deterministic Prediction System, Mon. Weather Rev., 146, 3995–4014, https://doi.org/10.1175/mwr-d-18-0118.1, 2018.
Jolliffe, I. T. and Stephenson, D. B.: Forecast Verification: A Practitioner's Guide in Atmospheric Science, Wiley, New Jersey, USA, 2011.
Jones, J., Guerova, G., Douša, J., Dick, G., de Haan, S., Pottiaux, E., Bock, O., Pacione, R., and van Malderen, R.: Advanced GNSS Tropospheric Products for Monitoring Severe Weather Events and Climate, edited by: Jones, J., Springer-Verlag GmbH, available at: https://www.ebook.de/de/product/37897541/advanced_gnss_tropospheric_ products_for_monitoring_severe_weather_events_and_climate.html (last access: 23 June 2021), 2019.
Keil, C., Röpnack, A., Craig, G. C., and Schumann, U.: Sensitivity of quantitative precipitation forecast to height dependent changes in humidity, Geophys. Res. Lett., 35, 1–5, https://doi.org/10.1029/2008gl033657, 2008.
Kendon, E. J., Roberts, N. M., Senior, C. A., and Roberts, M. J.: Realism of Rainfall in a Very High-Resolution Regional Climate Model, J. Climate, 25, 5791–5806, https://doi.org/10.1175/jcli-d-11-00562.1, 2012.
Khodayar, S., Czajka, B., Caldas-Alvarez, A., Helgert, S., Flamant, C., Girolamo, P. D., Bock, O., and Chazette, P.: Multi-scale observations of atmospheric moisture variability in relation to heavy precipitating systems in the northwestern Mediterranean during HyMeX IOP12, Q. J. Roy. Meteor. Soc., 144, 2761–2780, https://doi.org/10.1002/qj.3402, 2018.
Khodayar, S., Kalthoff, N., and Kottmeier, C.: Atmospheric conditions associated with heavy precipitation events in comparison to seasonal means in the western mediterranean region, Clim. Dynam., 51, 951–967, https://doi.org/10.1007/s00382-016-3058-y, 2016.
Kwon, I.-H., English, S., Bell, W., Potthast, R., Collard, A., and Ruston, B.: Assessment of Progress and Status of Data Assimilation in Numerical Weather Prediction, B. Am. Meteorol. Soc., 99, ES75–ES79, https://doi.org/10.1175/bams-d-17-0266.1, 2018.
Lee, E., Lee, E.-H., and Choi, I.-J.: Impact of Increased Vertical Resolution on Medium-Range Forecasts in a Global Atmospheric Model, Mon. Weather Rev., 147, 4091–4106, https://doi.org/10.1175/mwr-d-18-0387.1, 2019.
Lee, K.-O., Flamant, C., Duffourg, F., Ducrocq, V., and Chaboureau, J.-P.: Impact of upstream moisture structure on a back-building convective precipitation system in south-eastern France during HyMeX IOP13, Atmos. Chem. Phys., 18, 16845–16862, https://doi.org/10.5194/acp-18-16845-2018, 2018.
Lintner, B. R., Adams, D. K., Schiro, K. A., Stansfield, A. M., Rocha, A. A. A., and Neelin, J. D.: Relationships among climatological vertical moisture structure, column water vapor, and precipitation over the central Amazon in observations and CMIP5 models, Geophys. Res. Lett., 44, 1981–1989, https://doi.org/10.1002/2016gl071923, 2017.
Lintner, B. R., Holloway, C. E., and Neelin, J. D.: Column Water Vapor Statistics and Their Relationship to Deep Convection, Vertical and Horizontal Circulation, and Moisture Structure at Nauru, J. Climate, 24, 5454–5466, https://doi.org/10.1175/jcli-d-10-05015.1, 2011.
Lovat, A., Vincendon, B., and Ducrocq, V.: Assessing the impact of resolution and soil datasets on flash-flood modelling, Hydrol. Earth Syst. Sci., 23, 1801–1818, https://doi.org/10.5194/hess-23-1801-2019, 2019.
Markowski, P. and Richardson, Y.: Mesoscale Meteorology in Midlatitudes, chap. Part III John Wiley & Sons, Ltd., 181-272, 2010.
Martinet, M., Nuissier, O., Duffourg, F., Ducrocq, V., and Ricard, D.: Fine-scale numerical analysis of the sensitivity of the HyMeX IOP16a heavy precipitating event to the turbulent mixing-length parametrization, Q. J. Roy. Meteor. Soc., 143, 3122–3135, https://doi.org/10.1002/qj.3167, 2017.
Mascitelli, A., Federico, S., Fortunato, M., Avolio, E., Torcasio, R. C., Realini, E., Mazzoni, A., Transerici, C., Crespi, M., and Dietrich, S.: Data assimilation of GPS-ZTD into the RAMS model through 3D-Var: preliminary results at the regional scale, Meas. Sci. Technol., 30, 55801, https://doi.org/10.1088/1361-6501/ab0b87, 2019.
Mazzarella, V., Maiello, I., Capozzi, V., Budillon, G., and Ferretti, R.: Comparison between 3D-Var and 4D-Var data assimilation methods for the simulation of a heavy rainfall case in central Italy, Adv. Sci. Res., 14, 271–278, https://doi.org/10.5194/asr-14-271-2017, 2017.
Meredith, E. P., Ulbrich, U., and Rust, H. W.: Subhourly rainfall in a convection-permitting model, Environ. Res. Lett., 15, 34031, https://doi.org/10.1088/1748-9326/ab6787, 2020.
Mile, M., Benáček, P., and Rózsa, S.: The use of GNSS zenith total delays in operational AROME/Hungary 3D-Var over a central European domain, Atmos. Meas. Tech., 12, 1569–1579, https://doi.org/10.5194/amt-12-1569-2019, 2019.
Moncrieff, M. W. and Miller, M. J.: The dynamics and simulation of tropical cumulonimbus and squall lines, Q. J. Roy. Meteor. Soc., 102, 373–394, 1976.
Neelin, J. D., Peters, O., and Hales, K.: The Transition to Strong Convection, J. Atmos. Sci., 66, 2367–2384, https://doi.org/10.1175/2009jas2962.1, 2009.
Panosetti, D., Böing, S., Schlemmer, L., and Schmidli, J.: Idealized Large-Eddy and Convection-Resolving Simulations of Moist Convection over Mountainous Terrain, J. Atmos. Sci., 73, 4021–4041, https://doi.org/10.1175/jas-d-15-0341.1, 2016.
Petrucci, O., Papagiannaki, K., Aceto, L., Boissier, L., Kotroni, V., Grimalt, M., Llasat, M. C., Llasat-Botija, M., Rosselló, J., Pasqua, A. A., and Vinet, F.: MEFF: The database of MEditerranean Flood Fatalities (1980 to 2015), J Flood Risk Manag., 12, e12461, https://doi.org/10.1111/jfr3.12461, 2018.
Pichelli, E., Rotunno, R., and Ferretti, R.: Effects of the Alps and Apennines on forecasts for Po Valley convection in two HyMeX cases, Q. J. Roy. Meteor. Soc., 143, 2420–2435, https://doi.org/10.1002/qj.3096, 2017.
Pinto, J. G., Ulbrich, S., Parodi, A., Rudari, R., Boni, G., and Ulbrich, U.: Identification and ranking of extraordinary rainfall events over Northwest Italy: The role of Atlantic moisture, J. Geophys. Res.-Atmos., 118, 2085–2097, https://doi.org/10.1002/jgrd.50179, 2013.
Prein, A. F., Langhans, W., Fosser, G., Ferrone, A., Ban, N., Goergen, K., Keller, M., Tölle, M., Gutjahr, O., Feser, F., Brisson, E., Kollet, S., Schmidli, J., van Lipzig, N. P. M., and Leung, R.: A review on regional convection-permitting climate modeling: Demonstrations, prospects, and challenges, Rev. Geophys., 53, 323–361, https://doi.org/10.1002/2014rg000475, 2015.
Ribaud, J.-F., Bousquet, O., and Coquillat, S.: Relationships between total lightning activity, microphysics and kinematics during the 24 September 2012 HyMeX bow-echo system, Q. J. Roy. Meteor. Soc., 142, 298–309, https://doi.org/10.1002/qj.2756, 2016.
Ricard, D., Ducrocq, V., and Auger, L.: A Climatology of the Mesoscale Environment Associated with Heavily Precipitating Events over a Northwestern Mediterranean Area, J. Appl. Meteorol. Clim., 51, 468–488, https://doi.org/10.1175/jamc-d-11-017.1, 2012.
Ritter, B. and Geleyn, J.-F.: A Comprehensive Radiation Scheme for Numerical Weather Prediction Models with Potential Applications in Climate Simulations, Mon. Weather Rev., 120, 303–325, https://doi.org/10.1175/1520-0493(1992)120<0303:acrsfn>2.0.co;2, 1992.
Roberts, N. M. and Lean, H. W.: Scale-Selective Verification of Rainfall Accumulations from High-Resolution Forecasts of Convective Events, Mon. Weather Rev., 136, 78–97, https://doi.org/10.1175/2007mwr2123.1, 2008.
Rockel, B., Will, A., and Hense, A.: Hense The regional climate model COSMO-CLM (CCLM), Meteorol. Z., 17, 347–348, https://doi.org/10.1127/0941-2948/2008/0309, 2008.
Schättler, U., Doms, G., and Schraff, C.: A Description of the Non-hydrostatic Regional COSMO-Model Part VII: User’s Guide, DeutscherWetterdienst, P.O. Box 100465, 63004 Offenbach, Germany, 2016.
Schlemmer, L. and Hohenegger, C.: Modifications of the atmospheric moisture field as a result of cold-pool dynamics, Quarterly Journal of the Royal Meteorological Society, 142(694), 30–42, https://doi.org/10.1002/qj.2625, 2015.
Schraff, C., Reich, H., Rhodin, A., Schomburg, A., Stephan, K., Periáñez, A., and Potthast, R.: Kilometre-scale ensemble data assimilation for the COSMO model (KENDA), Q. J. Roy. Meteor. Soc., 142, 1453–1472, https://doi.org/10.1002/qj.2748, 2016.
Schraff, C. and Hess, R.: A Description of the Nonhydrostatic Regional COSMO-Model Part III: Data Assimilation, German Weather Service (DWD), P.O. Box 100465, 63004 Offenbach, 2012.
Schumacher, R. S.: Sensitivity of Precipitation Accumulation in Elevated Convective Systems to Small Changes in Low-Level Moisture, J. Atmos. Sci., 72, 2507–2524, https://doi.org/10.1175/jas-d-14-0389.1, 2015.
Singh, R., Ojha, S. P., Puviarasan, N., and Singh, V.: Impact of GNSS Signal Delay Assimilation on Short Range Weather Forecasts Over the Indian Region, J. Geophys. Res.-Atmos., 124, 9855–9873, https://doi.org/10.1029/2019jd030866, 2019.
Skamarock, W. and Klemp, J.: The stability of time-split numerical methods for the hydrostatic and nonhydrostatic elasic equations, Mon. Weather Rev., 120, 2109–2127, 1992.
Skok, G. and Roberts, N.: Analysis of Fractions Skill Score properties for random precipitation fields and ECMWF forecasts, Q. J. Roy. Meteor. Soc., 142, 2599–2610, https://doi.org/10.1002/qj.2849, 2016.
Taufour, M., Vié, B., Augros, C., Boudevillain, B., Delanoë, J., Delautier, G., Ducrocq, V., Lac, C., Pinty, J.-P., and Schwarzenböck, A.: Evaluation of the two-moment scheme LIMA based on microphysical observations from the HyMeX campaign, Q. J. Roy. Meteor. Soc., 144, 1398–1414, https://doi.org/10.1002/qj.3283, 2018.
Tiedtke, M.: A Comprehensive Mass Flux Scheme for Cumulus Parameterization in Large-Scale Models, Mon. Weather Rev., 117, 1779–1800, https://doi.org/10.1175/1520-0493(1989)117<1779:acmfsf>2.0.co;2, 1989
Toreti, A., Xoplaki, E., Maraun, D., Kuglitsch, F. G., Wanner, H., and Luterbacher, J.: Characterisation of extreme winter precipitation in Mediterranean coastal sites and associated anomalous atmospheric circulation patterns, Nat. Hazards Earth Syst. Sci., 10, 1037–1050, https://doi.org/10.5194/nhess-10-1037-2010, 2010.
Verrelle, A., Ricard, D., and Lac, C.: Sensitivity of high-resolution idealized simulations of thunderstorms to horizontal resolution and turbulence parametrization, Q. J. Roy. Meteor. Soc., 141, 433–448, https://doi.org/10.1002/qj.2363, 2015.
Virman, M., Bister, M., Sinclair, V. A., Järvinen, H., and Räisänen, J.: A New Mechanism for the Dependence of Tropical Convection on Free-Tropospheric Humidity, Geophys. Res. Lett., 45, 2516–2523, https://doi.org/10.1002/2018gl077032, 2018.
Zhuang, Y., Fu, R., and Wang, H.: How Do Environmental Conditions Influence Vertical Buoyancy Structure and Shallow-to-Deep Convection Transition across Different Climate Regimes?, J. Atmos. Sci., 75, 1909–1932, https://doi.org/10.1175/jas-d-17-0284.1, 2018.
Zuidema, P., Torri, G., Muller, C., and Chandra, A.: A Survey of Precipitation-Induced Atmospheric Cold Pools over Oceans and Their Interactions with the Larger-Scale Environment, Surv. Geophys., 38, 1283–1305, https://doi.org/10.1007/s10712-017-9447-x, 2017.