the Creative Commons Attribution 4.0 License.
the Creative Commons Attribution 4.0 License.
 | 06 Jan 2022
Moisture origin, transport pathways, and driving processes of intense wintertime moisture transport into the Arctic
David Hauswirth
Katharina Hartmuth
A substantial portion of the moisture transport into the Arctic occurs in episodic, high-amplitude events with strong impacts on the Arctic's climate system components such as sea ice. This study focuses on the origin of such moist-air intrusions during winter and examines the moisture sources, moisture transport pathways, and their linkage to the driving large-scale circulation patterns. For that purpose, 597 moist-air intrusions, defined as daily events of intense (exceeding the 90th anomaly percentile) zonal mean moisture transport into the polar cap (≥70∘ N), are identified. Kinematic backward trajectories combined with a Lagrangian moisture source diagnostic are then used to pinpoint the moisture sources and characterize the airstreams accomplishing the transport.
The moisture source analyses show that the bulk of the moisture transported into the polar cap during these moist-air intrusions originates in the eastern North Atlantic with an uptake maximum poleward of 50∘ N. Trajectories further reveal an inverse relationship between moisture uptake latitude and the level at which moisture is injected into the polar cap, consistent with ascent of poleward-flowing air in a baroclinic atmosphere. Focusing on intrusions in the North Atlantic (424 intrusions), we find that lower tropospheric moisture transport is predominantly accomplished by two types of airstreams: (i) cold, polar air warmed and moistened by surface fluxes and (ii) air subsiding from the mid-troposphere into the boundary layer. Both airstreams contribute about 36 % each to the total transport. The former accounts for most of the moisture transport during intrusions associated with an anomalously high frequency of cyclones east of Greenland (218 intrusions), whereas the latter is more important in the presence of atmospheric blocking over Scandinavia and the Ural Mountains (145 events). Long-range moisture transport, accounting for 17 % of the total transport, dominates during intrusions with weak forcing by baroclinic weather systems (64 intrusions). Finally, mid-tropospheric moisture transport is invariably associated with (diabatically) ascending air and moisture origin in the central and western North Atlantic, including the Gulf Stream front, accounting for roughly 10 % of the total transport. In summary, our study shows that moist-air intrusions into the polar atmosphere result from a combination of airstreams with predominantly high-latitude or high-altitude origin, whose relative importance is determined by the underlying driving weather systems (i.e., cyclones and blocks).
- Article
(10492 KB) - Full-text XML
-
Supplement
(1698 KB) - BibTeX
- EndNote


The atmospheric transport of moisture from mid-latitudes towards the pole constitutes an essential component of the Arctic energy and freshwater budgets (e.g., Dufour et al., 2016; Singh et al., 2017; Mayer et al., 2019). Variations of this transport have direct consequences for sea ice (e.g., Boisvert et al., 2016; Mortin et al., 2016; Woods and Caballero, 2016), the mass balance of Greenland's ice sheet (e.g., Chen et al., 2016; Fettweis et al., 2017; Hermann et al., 2020), and the stratification of the Arctic Ocean (e.g., Serreze et al., 2006). Furthermore, a long-term increase in atmospheric water content in the Arctic, mainly caused by enhanced meridional moisture transport (Nygård et al., 2020), is thought to contribute to the amplified warming of the Arctic as compared to lower latitudes primarily via enhanced downward longwave radiation (Francis and Hunter, 2006; Doyle et al., 2011; Kapsch et al., 2013; Graversen and Burtu, 2016; Vihma et al., 2016; Lee et al., 2017; Rinke et al., 2019). Hence, improving our mechanistic understanding of the processes that drive the meridional transport of moisture and its variability is essential for better understanding the Arctic climate system and its rapid changes (Gimeno et al., 2019; Henderson et al., 2021).
A substantial portion of moisture transport into the polar cap occurs in episodic, high-amplitude, zonally confined injections of moisture, often referred to as moist-air intrusions (Doyle et al., 2011; Woods et al., 2013; Graversen and Burtu, 2016; Dufour et al., 2016; Messori et al., 2017; Naakka et al., 2019). Variations in the frequency of moist-air intrusions contribute towards a large inter-annual variability of Arctic temperatures and sea ice extent. Furthermore, the warming trend of the Arctic is most pronounced during winter (e.g., Screen and Simmonds, 2010), and a significant part of this trend can be attributed to changes in the frequency and intensity of moist-air intrusions (Park et al., 2015b, a; Woods and Caballero, 2016; Lee et al., 2017; Gong et al., 2017). In summer, in contrast, moist-air intrusions are less important for the warming trend as air-mass exchanges between mid-latitudes and the Arctic are generally reduced (Orbe et al., 2015; Papritz, 2020), and local feedback processes dominate the warming (Alekseev et al., 2019). Consequently, the focus of this study lies on moist-air intrusions during extended winter (November to March; NDJFM).
Geographically, wintertime moist-air intrusions are most frequent in three regions, namely the Nordic Seas and the Barents and Kara seas in the Atlantic sector, the Labrador Sea located west of Greenland, and Bering Strait in the Pacific sector (Woods et al., 2013; Dufour et al., 2016; Naakka et al., 2019). Various large-scale circulation patterns and weather systems have been identified to drive poleward transport of warm and humid air in these regions (see Henderson et al., 2021, for a comprehensive overview). For example, moist-air intrusions in the Atlantic sector are associated with a zonally aligned dipole of mid- and upper-tropospheric geopotential height anomalies (Luo et al., 2017; Messori et al., 2018). The negative geopotential height anomaly is linked to an enhanced frequency of cyclones along Greenland's east coast (Sorteberg and Walsh, 2008; Villamil-Otero et al., 2018; Messori et al., 2018). In fact, Fearon et al. (2021) established that 74 % of the annual moisture flux into the polar cap north of 70∘ N is related to poleward-propagating cyclones. The positive geopotential height anomaly, in turn, is linked to blocks over Scandinavia and the Ural Mountains (Woods et al., 2013; Liu and Barnes, 2015; Gong and Luo, 2017; Ruggieri et al., 2020), whereby blocks can directly cause a poleward moisture flux via their associated circulation or indirectly via the poleward deflection of cyclone tracks (Madonna et al., 2020; Papritz and Dunn-Sigouin, 2020). Moreover, Luo et al. (2017, 2019) found poleward moisture transport in the Nordic Seas and towards the Barents Sea to be particularly efficient when blocking over Scandinavia or the Ural Mountains coincided with a strengthened North Atlantic storm track as reflected by the positive phase of the North Atlantic Oscillation (NAO+). Similarly, the interplay of synoptic-scale waves and blocking over Alaska has been shown to contribute to moisture transport in the Pacific sector (Baggett et al., 2016). These finding are in line with Papritz and Dunn-Sigouin (2020), who identified the most intense poleward moisture transport events at 70∘ N to coincide with blocking over Scandinavia or Alaska and a pronounced poleward deflection of the mid-latitude storm tracks.
Several studies have explored the geographical origin of moisture transported into the Arctic or specific subregions. Using a climate model equipped with water vapor tracers, Singh et al. (2017) found that moisture precipitating in the Arctic during winter originates mainly in the North Atlantic in a band between 50–70∘ N, whereas contributions from the North Pacific, land areas, and lower latitudes are comparatively small. An alternative approach diagnoses moisture sources based on reanalysis data using kinematic trajectories (e.g., Sodemann et al., 2008) or dynamical recycling models (e.g., Zhong et al., 2018). Focusing on wintertime precipitation in the Barents and Kara seas, Zhong et al. (2018) identified the warm Norwegian Sea as an important source region for moisture transported from remote areas into the target region. Similarly, Sodemann et al. (2008) and Schuster et al. (2021) found the Norwegian Sea to contribute substantially to precipitation over the Greenland ice sheet and an arid region in northeast Greenland, respectively. Finally, the results by Vázquez et al. (2016) agree with those of the preceding studies in that they portray a predominantly oceanic origin of atmospheric moisture in the Arctic during winter. However, their findings suggest long-range transport of moisture evaporating from the ocean surface near the western boundary currents; i.e., the Gulf Stream and the Kuroshio, which are the regions where climatological evaporation is most intense, are the principal source regions. The importance of long-range moisture transport from the western North Atlantic towards the Arctic is further supported by the moisture transport pathway from the Gulf Stream extension towards the Barents and Kara seas proposed by Luo et al. (2019). While the discrepancies in previously identified moisture sources for the Arctic can partly be explained by the different target areas in the Arctic and the methodologies used, they also indicate that the origin of moisture in the Arctic and its transport pathways are still not fully understood.
In this study, we aim to combine the two main lines of earlier research that focused either on the dynamical mechanisms causing moist-air intrusions into the Arctic or on the moisture origin. In contrast to many previous studies focusing on particular subregions of the Arctic, we widen the geographical focus to the entire Arctic by considering moisture origin associated with moist-air intrusions at 70∘ N. An important goal of this study is to explore how the various driving weather systems influence moisture origin and transport pathways, as well as how they are interlinked with the thermodynamic evolution of the air that transports the moisture. For that purpose, we use the ERA5 reanalysis and compute, in a first step, kinematic trajectories to identify the origin and transport pathways of moisture associated with wintertime moist-air intrusions into the Arctic at 70∘ N. Then, we use this data set to explore how different configurations of the large-scale flow conducive for moist-air intrusions are linked to specific sources and transport pathways of moisture as well as to transformations of the related air masses. The study is structured as follows: in the next section, we describe the identification procedures for moist-air intrusions and moisture sources based on kinematic trajectories, which we illustrate in Sect. 3 with the aid of an exemplar case. In Sect. 4 we present the results of the climatological analyses, followed by concluding remarks in Sect. 5.
2.1 Data
In this study we use the ERA5 reanalysis from the European Centre for Medium-Range Weather Forecasts (ECMWF; Hersbach et al., 2020). We use fields at hourly temporal resolution on model levels and spatially interpolated to a grid, including horizontal and vertical winds, (potential) temperature, specific humidity, and potential vorticity. In addition, we also consider 500 hPa geopotential height, surface pressure and mean sea-level pressure, and sea surface temperature (SST). The study period comprises 39 extended winters (NDJFM), starting with winter 1979/80.
2.2 Meridional moisture transport and identification of moist-air intrusions
The zonally integrated transport of moisture across 70∘ N is given by
where ps denotes surface pressure and v and q are the meridional wind velocity and specific humidity; g is the gravitational acceleration; and λ, ϕ, and p denote longitude, latitude, and pressure, respectively. The vertically integrated moisture transport is computed every 3 h from the ERA5 model level data. Reanalyses are generally not mass conserving due to analysis increments and model errors, which can lead to biases in zonal mean meridional fluxes of moisture (and heat, e.g., Liang et al., 2018). Therefore, we apply a mass flux correction scheme to remove possible inconsistencies in the conservation of mass in ERA5 following the method by Trenberth (1991). For that purpose the SPHEREPACK library (Adams and Swarztrauber, 1997) is used. From the 3-hourly mass flux corrected meridional moisture fluxes we then compute daily mean fluxes .
As shown by Liang et al. (2018), a major portion of meridional moist static energy fluxes on the daily timescale results from fluxes of mass into and out of the polar cap at the average moist static energy of the polar cap. Such mass fluxes do not change the average moist static energy in the polar cap. The same issue arises when, instead of moist static energy, moisture alone is considered. Since in this study we are interested in events of highly anomalous, intense meridional moisture transport that cause excess moisture to accumulate in the Arctic, as reflected by a substantial increase in the average moisture content in the polar cap – we subtract these extensive fluctuations from . Specifically, we define the daily mean meridional moisture flux as
where is the mass flux across 70∘ N, 1 is the average moisture content of the polar cap, and is the mass of the polar cap (Liang et al., 2018). Finally, since we are interested in the anomaly, we remove the seasonality and the long-term trend by subtracting a transient calendar day climatology from . Following Messori et al. (2018), the transient climatology for a given day and year is obtained from a smoothing of with a 21 d running mean filter and subsequent centered averaging over 9 years. At the beginning and end of the time series, the climatology is kept constant across years. This is to ensure that neither the seasonality nor the long-term increase in poleward moisture transport biases the selection of anomalous events based on a fixed percentile threshold towards the warmer (and more humid) extended winter months or the later years in the study period. This is important since our goal is to gain insight into the dynamical mechanisms linking moisture sources and the Arctic, whereas seasonality and long-term trends of poleward moisture transport are not our focus. We then select all 597 time steps of daily poleward moisture transport for further analysis for which anomalies exceed the 90th percentile. From here on, these anomalous events of daily moisture transport will be referred to as moist-air intrusions or intrusions.
2.3 Trajectory calculation and moisture source identification
Kinematic backward trajectories provide the basis for analyzing the moisture transport and identifying moisture source regions. For each moist-air intrusion, the computation of trajectories and identification of the moisture sources involves three main steps. In the first step, potential trajectory starting points at 70∘ N are defined every 3 h on the day of the moist-air intrusion (from 00:00 to 21:00 UTC) on an equidistant grid with spacing of 50 km in longitude and 20 hPa in the vertical, ranging from 10 to 610 hPa above ground level. This yields potential trajectory starting points per moist-air intrusion. The instantaneous meridional moisture transport is then interpolated to these points (see Fig. S1 in the Supplement for an example) for all 3-hourly time steps, and transport values at potential trajectory starting points are ranked from highest to lowest. Finally, the highest ranked points are selected as trajectory starting points such that together they account for 50 % of the integrated poleward moisture transport on that day (red circles in Fig. S1b). With this approach we ensure that selected trajectories provide a representative sample of the upper half of the daily moisture flux into the polar cap.
In the second step, we compute for each moist-air intrusion 8 d kinematic backward trajectories from the selected grid points using the Lagrangian Analysis Tool (LAGRANTO; Wernli and Davies, 1997; Sprenger and Wernli, 2015). Thereby, trajectories are started every 3 h between 00:00 and 21:00 UTC. A trajectory is characterized by time relative to the initialization, longitude, latitude, and pressure. Further variables such as (potential) temperature and specific humidity are interpolated to the trajectory positions.
The third and final step comprises the identification of moisture sources following the approach by Sodemann et al. (2008). This approach identifies moisture sources, thereafter also referred to as moisture uptakes, from positive increments of specific humidity along a trajectory. To filter out spurious fluctuations of specific humidity along the trajectory, which for example can arise due to numerical errors in the spatial interpolation, we only consider changes in specific humidity exceeding (detection threshold). Since an air parcel can undergo several cycles of moisture uptakes and losses via precipitation prior to reaching 70∘ N, intermittent precipitation events are considered by reducing the contribution (or weight) of preceding moisture uptakes. The moisture transported into the target area by a trajectory is, therefore, given by a weighted sum of all moisture uptakes along the trajectory. In contrast to Sodemann et al. (2008), moisture uptakes above the planetary boundary layer are included to account for moistening caused by convective transport of moisture from the boundary layer into the free troposphere.
2.4 Large-scale flow features: extratropical cyclones, atmospheric blocks, and marine cold air outbreaks
In order to link moisture uptake and transport to large-scale circulation patterns, we further consider 500 hPa geopotential height as well as a number of weather features that are potentially important for inducing moisture transport, namely extratropical cyclones, atmospheric blocking, and marine cold air outbreaks. For that purpose, we use established identification schemes that produce binary fields indicating at a given grid point whether the respective type of weather feature is present (1) or not (0). Temporally averaging these binary fields over a set of time steps, e.g., days preceding selected moist-air intrusions, yields the fraction of time a given flow feature is present, thereafter referred to as the feature frequency. These frequencies can then be compared to climatology to obtain frequency anomalies.
Extratropical cyclones are identified from minima in sea-level pressure, and the cyclone area is delimited by the outermost closed sea-level pressure contour surrounding a sea-level pressure minimum (Wernli and Schwierz, 2006; Sprenger et al., 2017). The detection of atmospheric blocking is based on 5 d persistent negative anomalies of vertically averaged upper tropospheric potential vorticity anomalies below −1.3 pvu (; see Croci-Maspoli et al., 2007, for details about the methodology). Finally, marine cold air outbreaks are identified as ocean grid points where the potential temperature difference between the sea surface and the 900 hPa level exceeds 4 K (; Papritz et al., 2015). This criterion captures regions of lower tropospheric instability and intense upward sensible heat and moisture fluxes (Papritz and Spengler, 2017).
In this section, we consider an exemplar case that serves to illustrate the methodology and at the same time reveals the diversity of air flows associated with moist-air intrusions. For that purpose, we select a moist-air intrusion on 17 January 1995 for which 75 % of the poleward moisture transport occurs in the Nordic Seas and the Barents Sea, i.e., between 45∘ W–60∘ E. This is the region where climatologically most of the moist-air intrusions into the Arctic take place (e.g., Woods et al., 2013). Figure 1a and b show the subset of all moisture transport trajectories associated with this moist-air intrusion (see Sect. 2.3) initialized in the lower and mid-troposphere near the 900 and 700 hPa levels, respectively. Note that we consider the 700 hPa level as mid-tropospheric since the moisture transport characteristics at this level are clearly distinct from those at lower altitudes (see Sect. 4).
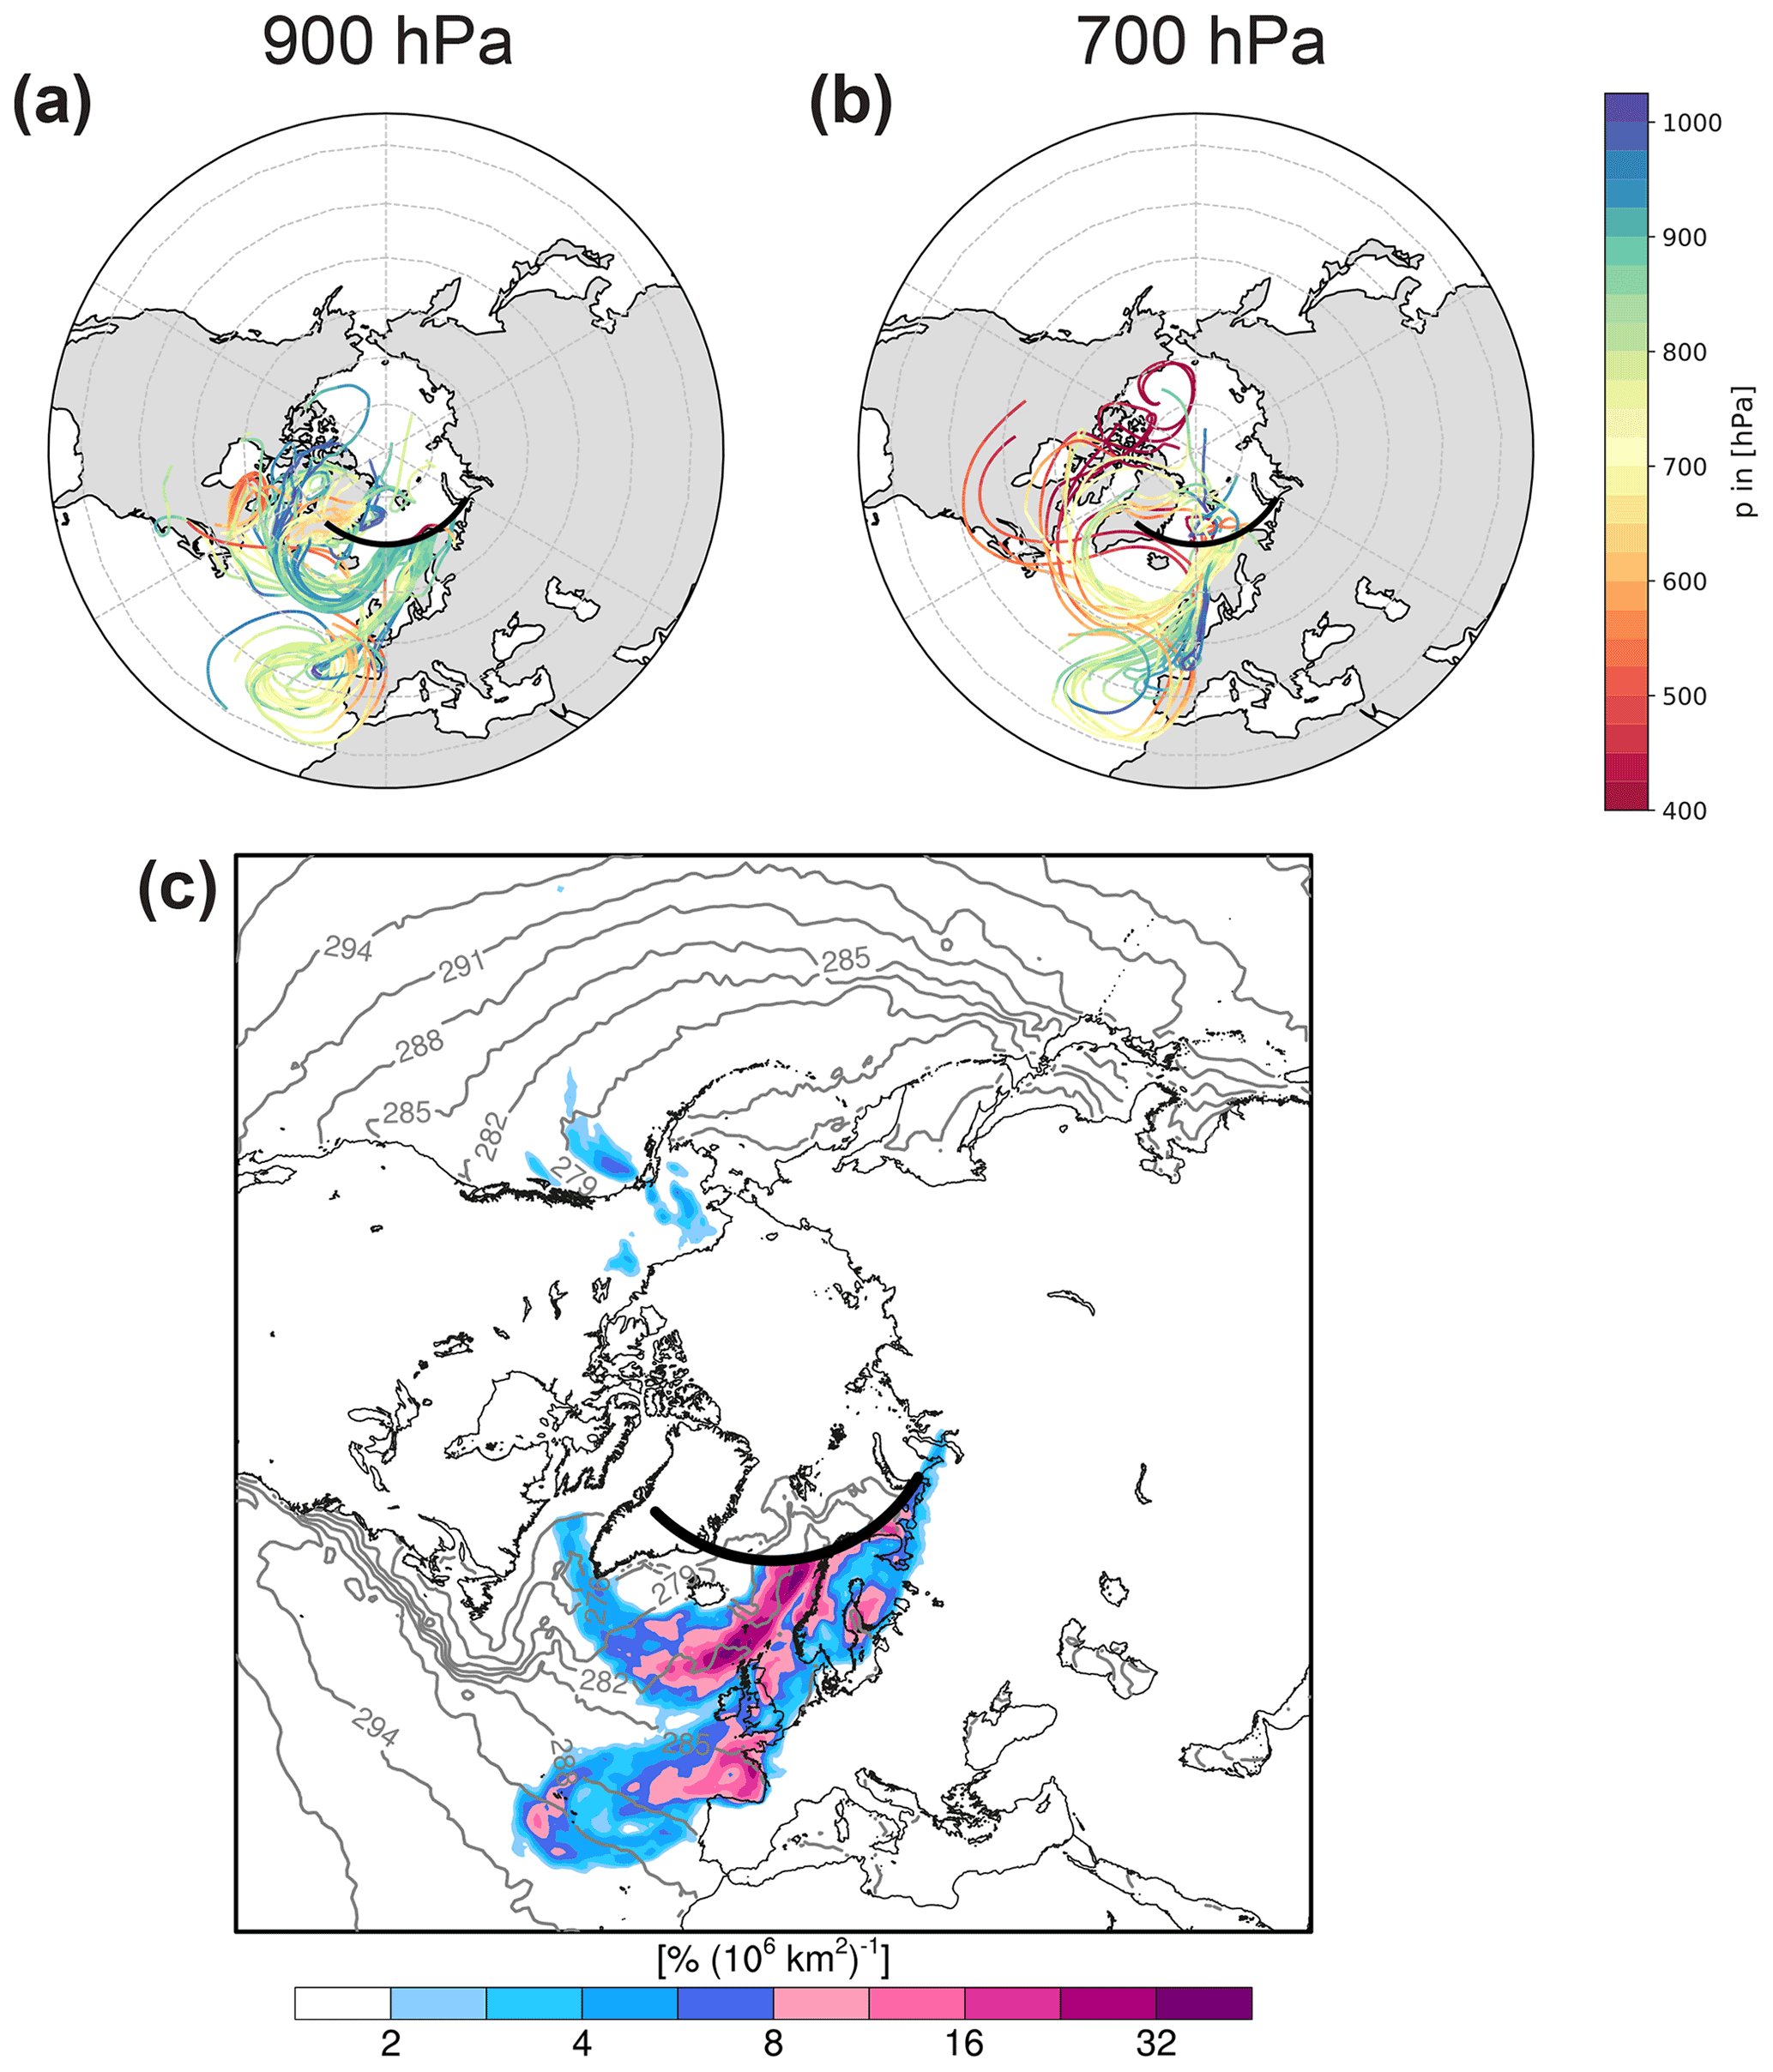
Figure 1Exemplar case of a moist-air intrusion in the North Atlantic on 17 January 1995. Shown in panels (a) and (b) are the 8 d kinematic backward trajectories colored according to pressure and initialized at 70∘ N (black solid line) in the pressure ranges of (a) 895–905 hPa and (b) 695–705 hPa. Shown in panel (c) is moisture uptake per area in percent of the total moisture transported across 70∘ N by the trajectories. Gray contours show SST in intervals of 3 K.
Lower tropospheric trajectories follow two distinct branches (Fig. 1a). Trajectories in the first branch originate over the Canadian Archipelago, representing originally cold and, therefore, also dry Arctic air. These trajectories subsequently move south and reach open ocean in the Labrador Sea, from where they turn cyclonically around Greenland and then move poleward into the Nordic Seas. During their path over open ocean, they remain in the lower troposphere. As they are exposed to a comparatively warm ocean surface, they experience warming and moistening via surface sensible and latent heat fluxes (e.g., Papritz and Spengler, 2017).
Trajectories in the second branch, in contrast, originate at lower latitudes in the mid-troposphere. They have anti-cyclonic curvature and descend in an anti-cyclone west of the Iberian Peninsula to well below 800 hPa, subsequently moving poleward as a coherent bundle (Fig. 1a and b). Thus, this second branch transports relatively dry, free-tropospheric air into the lower troposphere, gaining moisture as it enters the boundary layer. Prior to arrival at 70∘ N, some of the trajectories ascend again, leading to a deep moisture transport extending vertically to 700 hPa (Fig. 1b). Furthermore, Fig. 1b shows a few additional trajectories arriving at 700 hPa with a cyclonic curvature and descending over the North Atlantic from above 500 hPa.
The two main branches are associated with clear imprints in the moisture source field (Fig. 1c). The cyclonic branch results in an elongated band with large moisture uptake contributions stretching from the Labrador Sea around Greenland into the Nordic Seas. Thereby, moisture uptake contributions increase over warmer ocean (see SST contours) and towards the coast of Norway, where the maximum occurs. The anti-cyclonic branch is associated with moisture uptake west of the Iberian Peninsula and the Bay of Biscay but also the North Sea and Scandinavia (compare trajectories in Fig. 1a and regions of high uptake contributions in Fig. 1c).
This exemplar case suggests that individual moist-air intrusions can result from a combination of various airstreams, each characterized by different origin of the air, thermodynamic evolution, and moisture uptake patterns. Thus, an important aspect of the following will be to systematically investigate what types of airstreams contribute to moist-air intrusions and how they are linked to the large-scale circulation.
4.1 Characteristics of moisture transport at 70∘ N
Arctic moisture transport occurs in well-known, relatively narrow regions (e.g., Woods et al., 2013). This is confirmed by vertical cross sections at 70∘ N (Fig. 2a and b) showing the frequency of trajectory starting points associated with the moist-air intrusions and the mean intensity of the moisture transport (v⋅q) accomplished by the moisture transport trajectories. These cross sections highlight three distinct sectors where most of the moisture transport associated with the intrusions takes place: the North Atlantic between Greenland and Scandinavia with by far the highest frequency of moisture transport trajectories, the Labrador Sea west of Greenland, and the Bering Strait in the North Pacific. The latter two show substantially lower frequencies than the North Atlantic east of Greenland. Furthermore, most of the transport occurs in the lower troposphere below 800 hPa. Nevertheless, fairly high trajectory frequencies reach up to the mid-troposphere to 600 hPa and above, especially in the eastern North Atlantic.
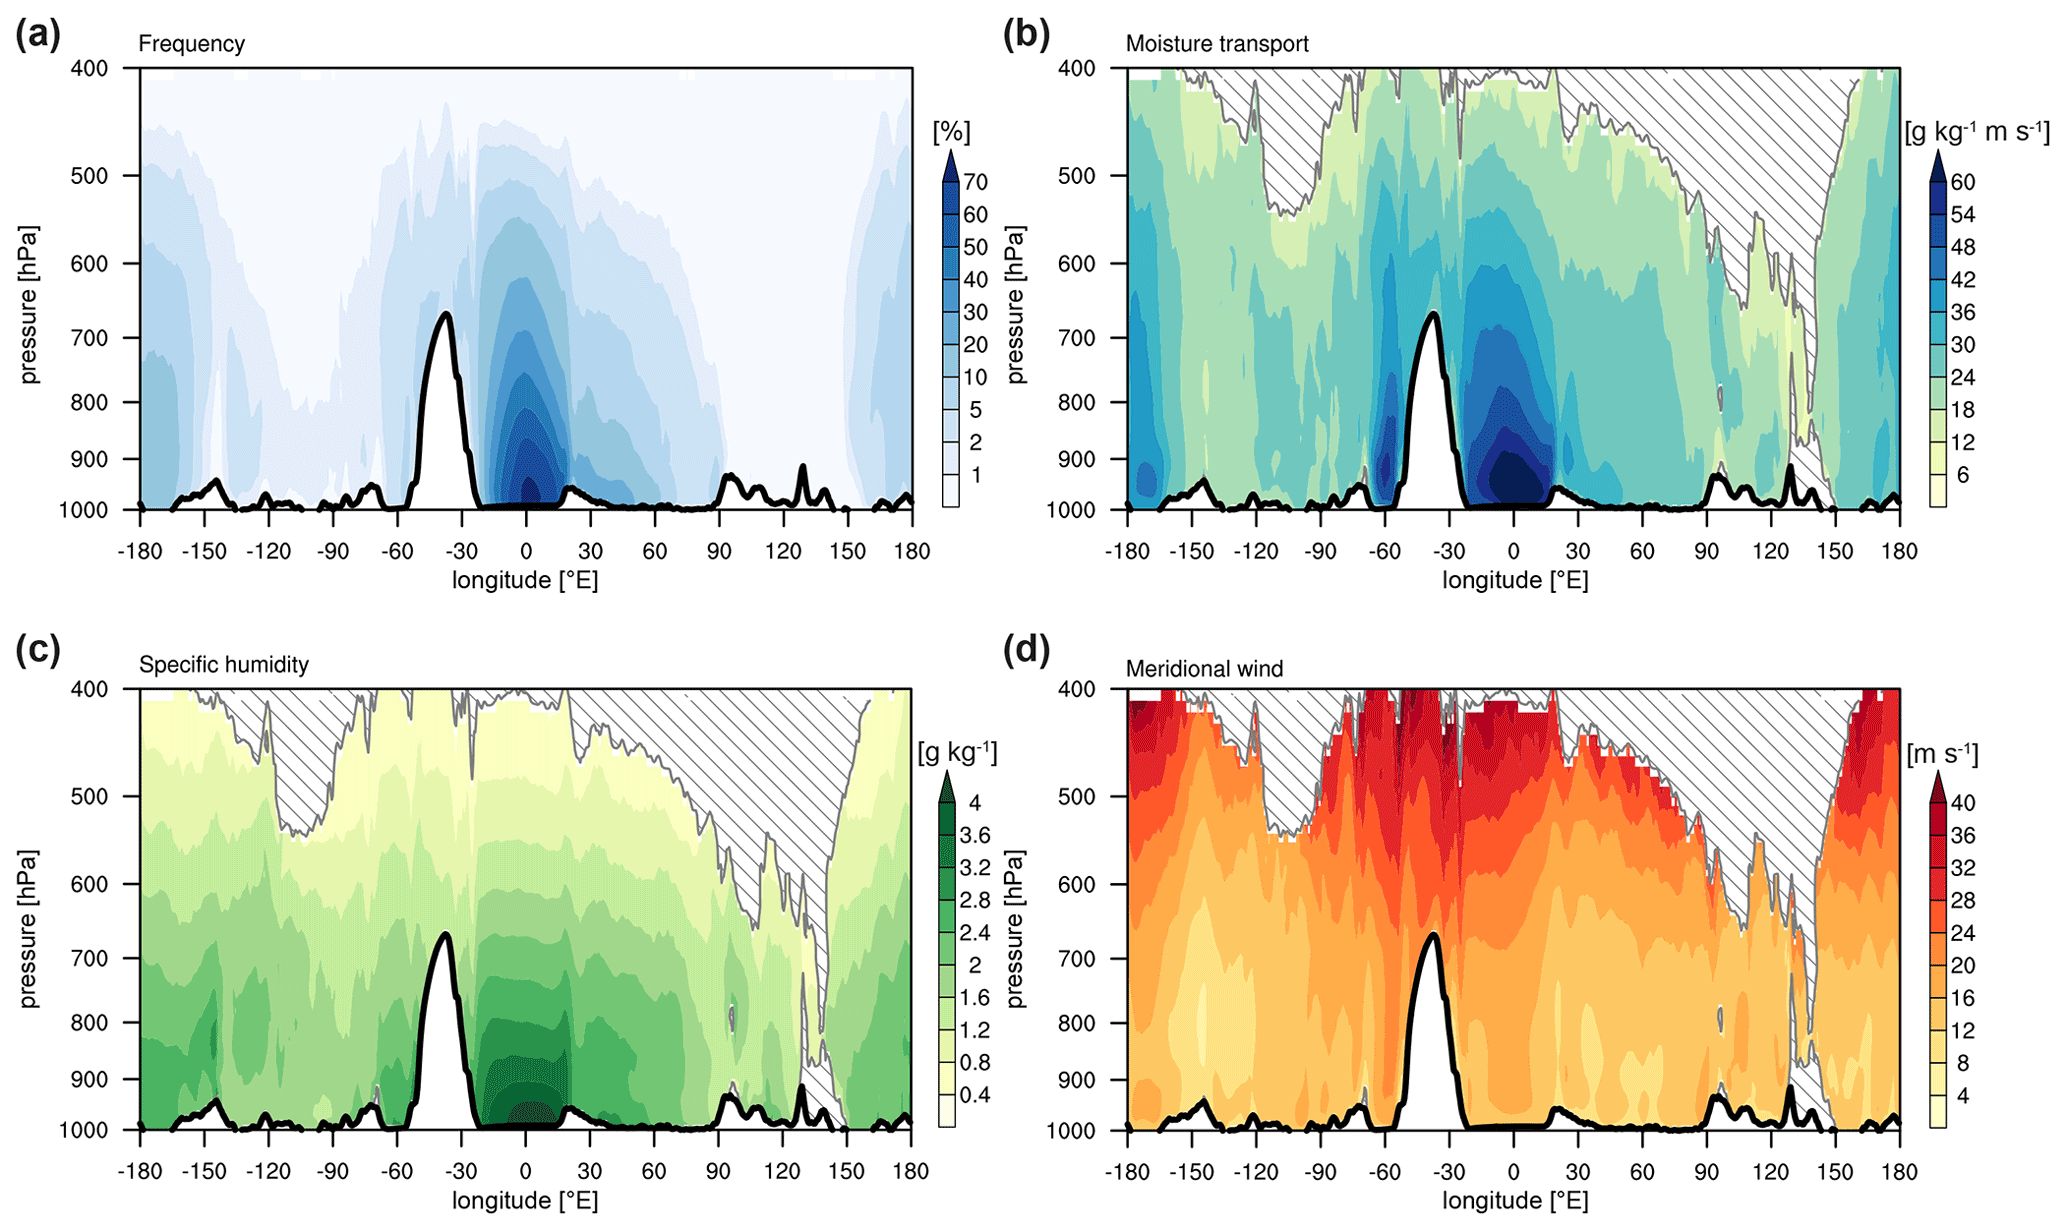
Figure 2Vertical cross sections at 70∘ N showing (a) relative frequency of trajectory starting points contributing to moist-air intrusions and mean (b) meridional moisture transport (v⋅q), (c) specific humidity (q), and (d) meridional wind (v) during moist-air intrusions as a function of longitude and pressure. In panels (b)–(d) regions with a trajectory frequency of less than 0.1 % are masked out by gray hatching.
The mean poleward moisture transport v⋅q associated with moisture transport trajectories is most intense in the eastern North Atlantic and the Labrador Sea with peaks of about below 850 hPa (Fig. 2b). Moist-air intrusions in the Labrador Sea are associated with lower specific humidity but higher poleward wind speeds than intrusions in the eastern North Atlantic (Fig. 2c and d) – likely related to topographic channeling of the flow along Greenland's west coast. In both sectors, the transport is fairly deep, extending well into the mid-troposphere and with an intensity of the transport in excess of at 600 hPa. Along with the rapid decrease in specific humidity with altitude (Fig. 2c), mid-tropospheric moisture transport is accomplished by strong poleward wind speeds, which at 600 hPa are more than twice as large as in the lower troposphere (>30 vs. ; Fig. 2d). Finally, moist-air intrusions in the North Pacific are slightly less intense than in the North Atlantic, mainly because of lower specific humidity.
4.2 Geographical distribution of moisture sources
In the following, we first consider the spatial distribution of moisture sources for all intrusions (Fig. 3). The moisture sources are unevenly distributed across the Northern Hemisphere with most of the moisture originating in the eastern North Atlantic – a fairly small portion of the Northern Hemisphere's ocean basins. The striking asymmetry between the North Atlantic and the North Pacific essentially reflects the fact that most of the moist-air intrusions take place east of Greenland in the Nordic Seas (Fig. 2a). Most of the moisture uptake occurs in the planetary boundary layer (Fig. S2 in the Supplement) between Iceland and the British Isles, as well as the Norwegian Sea along the warm ocean currents flowing poleward. In addition, a tongue of enhanced moisture uptake extends into the western North Atlantic along the warm side of the Gulf Stream front.
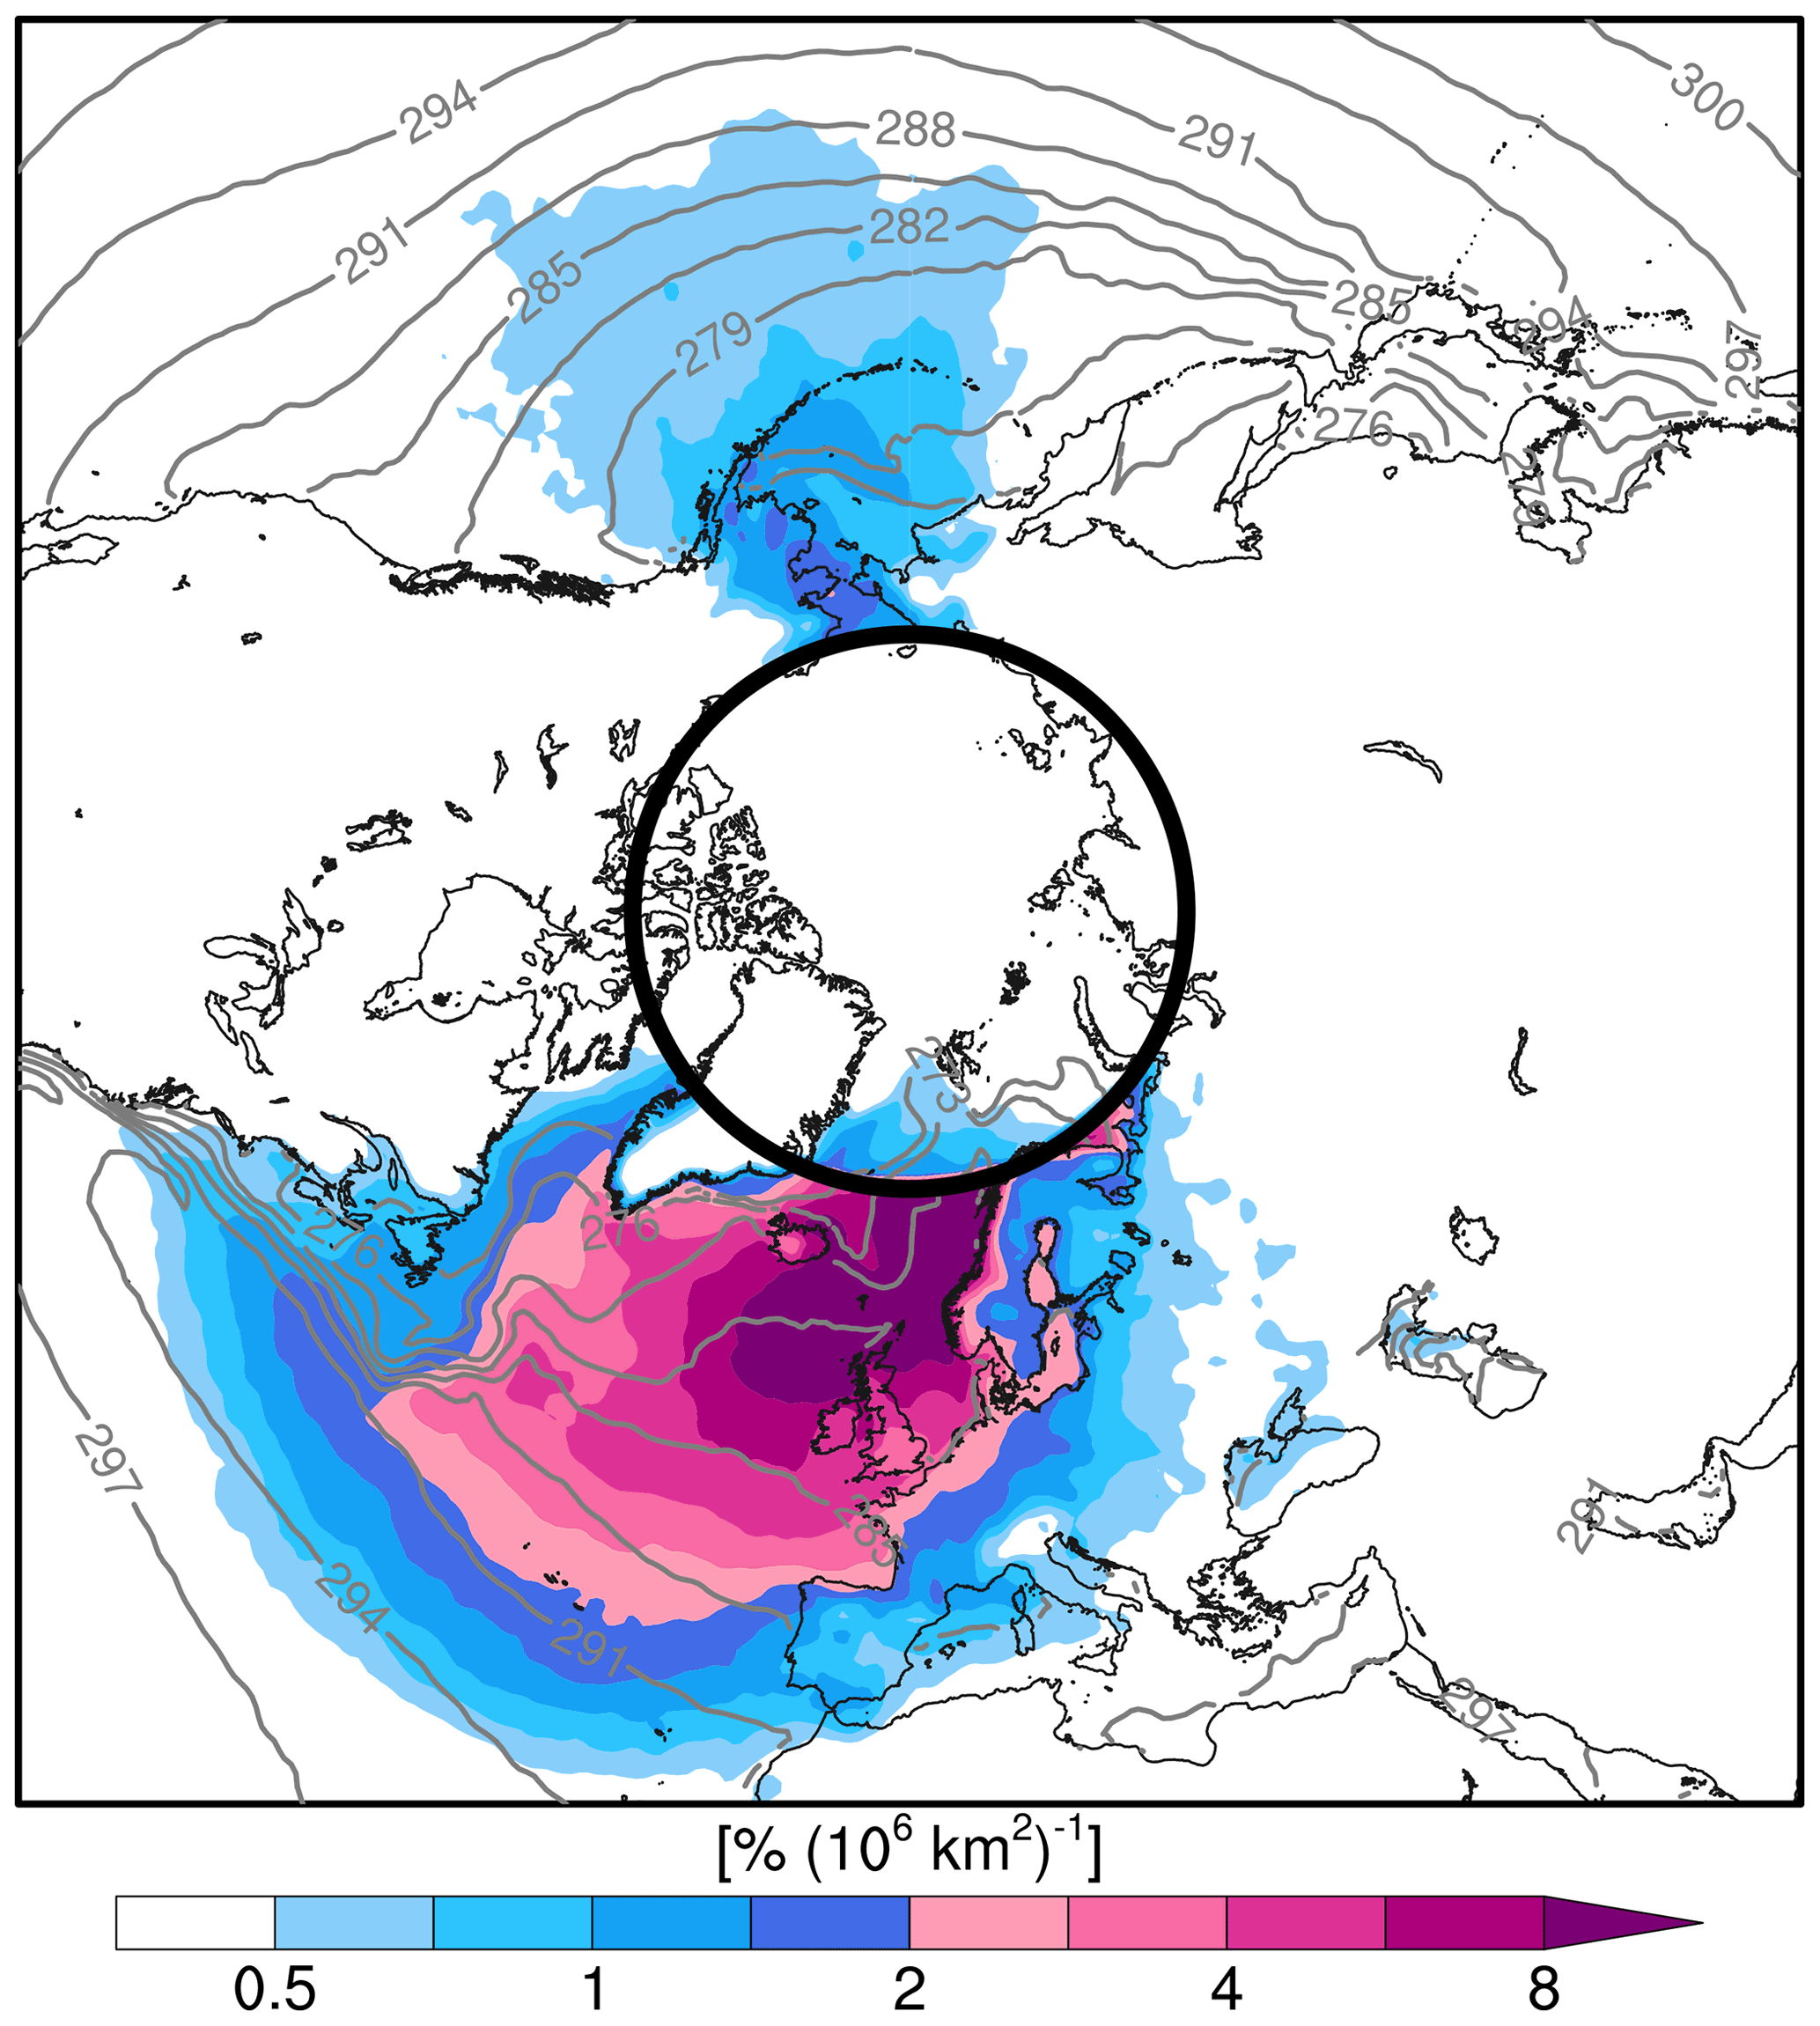
Figure 3Moisture uptake per area for all moist-air intrusions in percent of the total moisture transported across 70∘ N by the trajectories. Gray contours show SST in intervals of 3 K.
To gain a more detailed insight into the geographical distribution of moisture sources, we group moist-air intrusions according to the sector in which the bulk of the moisture transport occurs. Specifically, we attribute intrusions to the North Atlantic, the Labrador Sea, or the North Pacific if at least 75 % of the zonally integrated, poleward moisture transport takes place within the longitude bands 45∘ W–60∘ E, 100–45∘ W, and 140∘ E–120∘ W, respectively. This results in 424 intrusions in the North Atlantic, 9 in the Labrador Sea, 22 in the North Pacific, and 142 intrusions that cannot be uniquely attributed to one of these regions, which can happen, for instance, if intense poleward moisture transport occurs in two sectors simultaneously.
Figure 4 shows the moisture sources and contributions by latitude segments separately for intrusions in the three sectors. The geographical distribution of moisture uptake associated with intrusions in the North Atlantic shows several interesting features. The moisture uptake contributions increase almost monotonically with latitude with disproportionate contributions between 40 and 65∘ N as compared to the area covered by the respective latitude bands (Fig. 4d). The largest uptake contributions occur between 55 and 65∘ N over the relatively warm ocean between Iceland and the British Isles and along the Norwegian coast (Fig. 4a), followed by a sharp decrease poleward of 65∘ N. Contributions from the western North Atlantic, with the exception of a band stretching along the warm side of the Gulf Stream front, are weak.
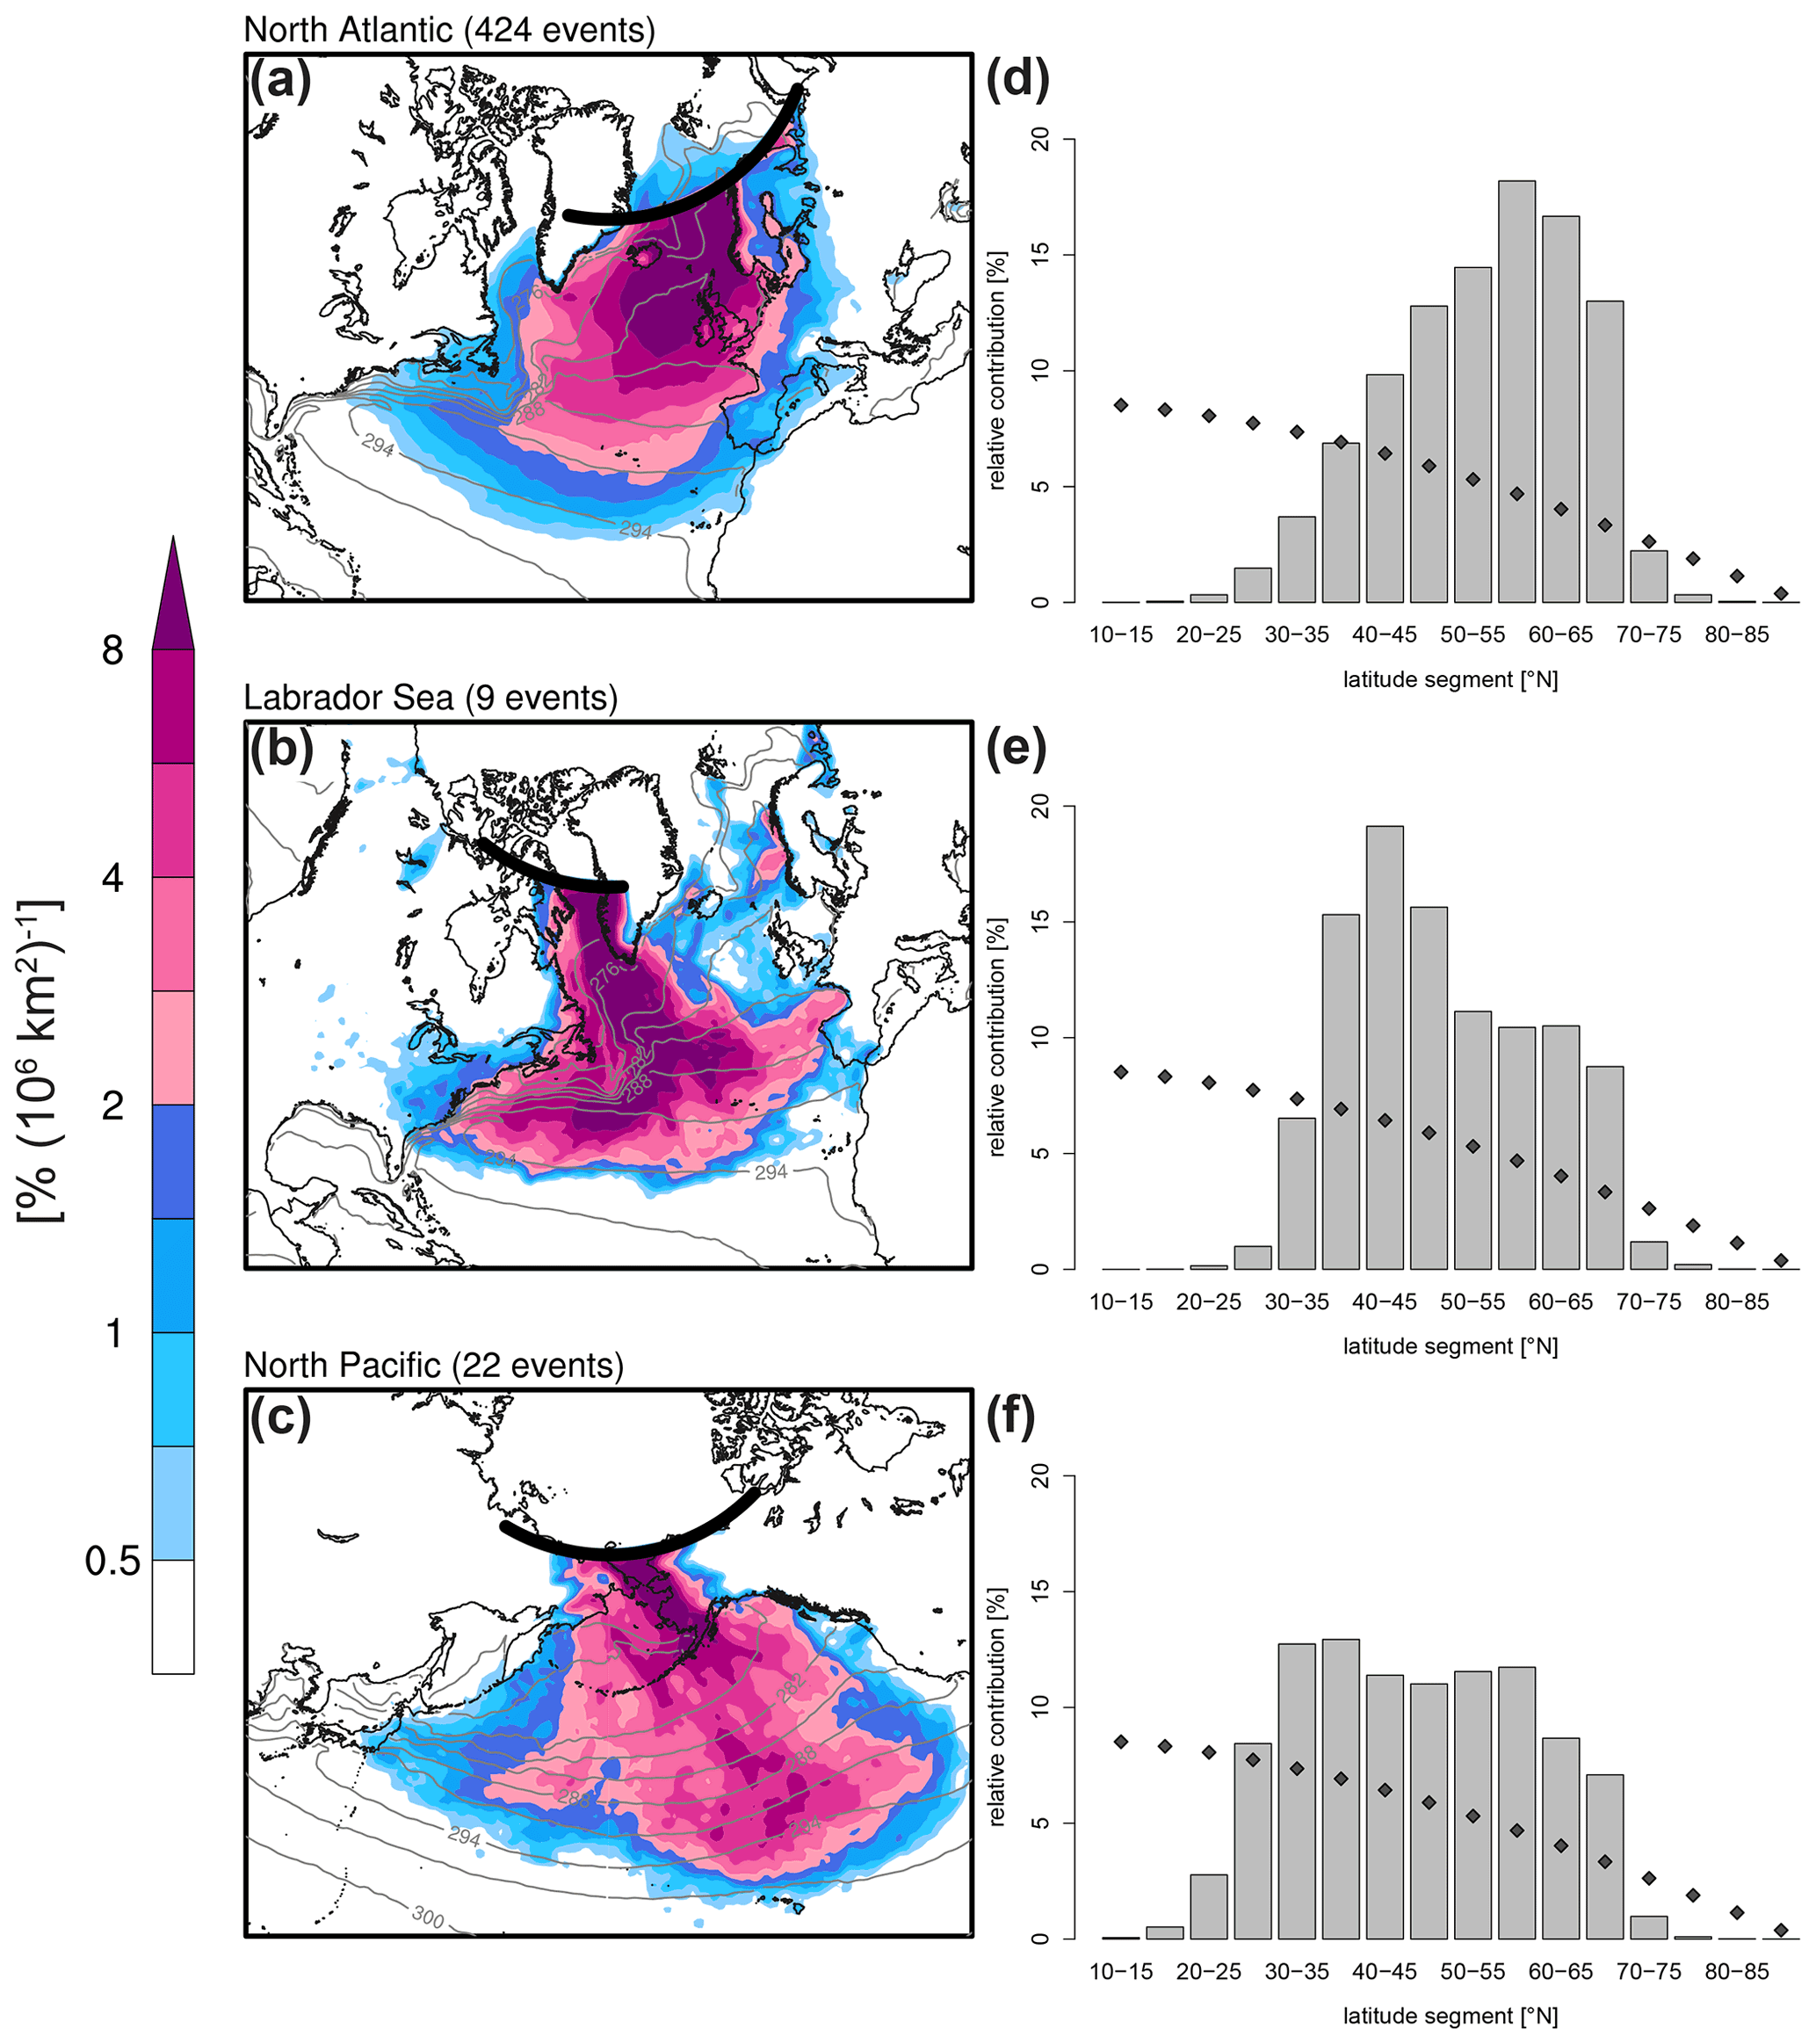
Figure 4Moisture uptake (a–c) per area (as in Fig. 3) and (d–f) per latitude segment in percent of the total moisture transported across 70∘ N by the trajectories during moist-air intrusions in (a, d) the North Atlantic, (b, e) the Labrador Sea, and (c, f) the North Pacific. Additionally, diamonds in panels (d)–(f) indicate the fractional area of the Northern Hemisphere occupied by each latitude segment. Furthermore, solid black lines in panels (a)–(c) show the longitude ranges based on which moist-air intrusions are attributed to the respective sector. Gray contours show SST in intervals of 3 K.
The bulk of the moisture uptake associated with intrusions in the Labrador Sea occurs between 35 and 50∘ N (Fig. 4e). Major contributions stem from the warm side of the Gulf Stream front and its extension with a maximum east of Newfoundland, as well as from the mid-latitude central North Atlantic (Fig. 4b). Finally, the North Pacific features a relatively uniform distribution of moisture uptake from 30∘ N across mid-latitudes (Fig. 4f), suggesting that long-range moisture transport is more important in the North Pacific than in the North Atlantic and the Labrador Sea. Furthermore, the center of mass of the moisture uptake field is located in the eastern North Pacific (Fig. 4c), indicating that moisture follows an anti-cyclonic pathway from the source region towards Bering Strait, where the injection into the polar cap takes place.
4.3 Linkage of moisture sources and transport to characteristic airstreams
The previous analyses have shed light on the geographical origin of moisture contributing to moist-air intrusions. In this section, our goal is to investigate how favorable conditions for moisture uptake and the subsequent moisture transport towards the Arctic are established. Moisture uptake along a trajectory requires the formation of sub-saturated conditions. From a mechanistic point of view, various thermodynamic pathways of a trajectory can lead to such conditions. They include, for example, air subsiding from the mid-troposphere towards the ocean surface, thereby undergoing adiabatic warming due to compression. An alternate pathway comprises cold air that is progressively warmed by surface sensible heat fluxes as it moves over a warm ocean surface. In the following, we introduce a method to systematically classify trajectories according to their thermodynamic evolution. We will then use this classification to explore the relative importance of different thermodynamic pathways for the moist-air intrusions, as well as the relationship between moisture origin, transport, and the link to the weather systems accomplishing the moisture transport.
4.3.1 Thermodynamic classification method for trajectories
We characterize trajectories according to the temporal evolution of temperature and potential temperature following the procedure by Binder et al. (2017) and Papritz (2020). Specifically, for each trajectory we consider the maximum absolute changes of temperature ΔT and potential temperature Δθ (for details see Papritz, 2020). The maximum absolute change of a quantity is given by the difference between the quantities' final value and the minimum or maximum value attained along the trajectory depending on which difference has the larger magnitude. Hence, the maximum absolute change of, e.g., temperature, is positive for a trajectory experiencing an overall temperature increase.
This characterization of trajectories allows for a straightforward classification based on the signs of ΔT and Δθ into four categories. Following the symbolic notation introduced by Papritz (2020), the four categories are denoted , , , and , where indicates the sign of the respective term. Each of these categories represents a different type of airstream characterized by a unique thermodynamic evolution. This is visualized in the θ−T diagram (Fig. 5a), showing the temporal evolution of T and θ averaged over all trajectories in each category (see also Papritz, 2020, for a more detailed discussion of this type of diagram). Following the thermodynamic energy equation (e.g., Holton and Hakim, 2012), temperature changes along a trajectory are the result of adiabatic compression and expansion associated with vertical motion as well as diabatic heating and cooling. Thus, jointly considering the evolution of T and θ in these diagrams provides insight into the interplay of vertical motion and diabatic processes. Moreover, the thermodynamic evolution and vertical motion are closely related to the moisture budget of a trajectory, for instance via the generation of favorable conditions for moisture uptake along the trajectories. Therefore, the trajectory categories also have distinct signatures in the evolution of specific humidity and pressure (Fig. 5b). In the following, we will discuss the temperature and moisture evolution of the four trajectory categories in more detail.
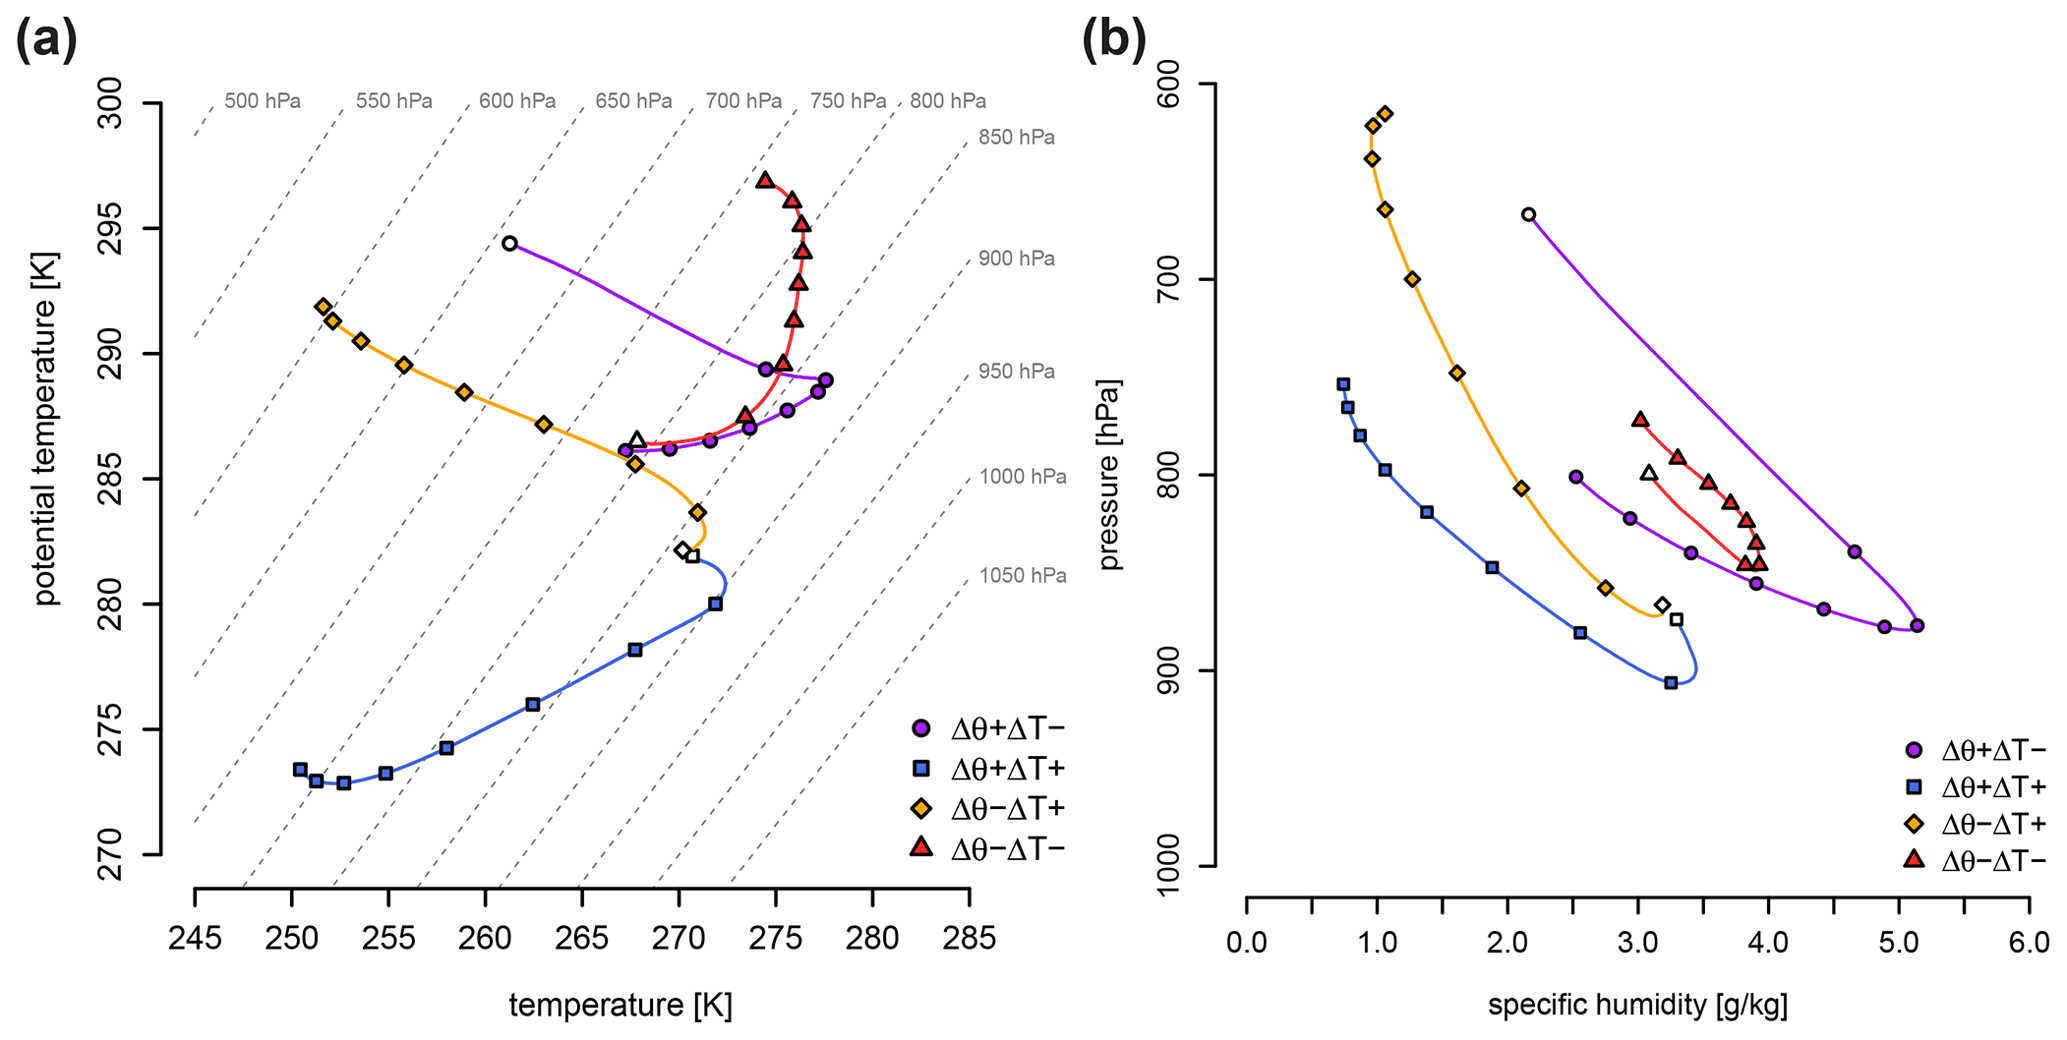
Figure 5(a) θ−T diagrams showing the evolution of θ and T averaged over the trajectories in each category with symbols every 24 h and time of arrival at 70∘ N (t=0 h) indicated by white filled symbols. Gray dashed lines show isobars. (b) Same as panel (a) but for the evolution of specific humidity vs. pressure.
Trajectories in the category experience diabatic heating (positive Δθ) and at the same time a temperature decrease (negative ΔT). This requires trajectories to ascend such that associated adiabatic cooling exceeds the temperature increase caused by diabatic heating (Fig. 5a). Ascent and diabatic heating take place primarily during the final 2 d prior to arrival at 70∘ N, where the diabatic heating is mainly due to latent heat release, as can be seen from the rapid reduction of specific humidity during ascent (Fig. 5b). Favorable conditions for moisture uptake along these trajectories are generated prior to ascent when they slowly subside into the lower troposphere. As a consequence of the final ascent, trajectories in this category contribute to the poleward moisture transport mainly in the mid-troposphere, associated with relatively low values of specific humidity but high wind speeds (see Fig. 2).
Trajectories in the category lack substantial ascent and temperature increases strongly as a result of intense diabatic heating. Trajectories in this category are originally cold, subsiding slowly into the lower troposphere under diabatic cooling, followed by a vigorous diabatic warming phase in which temperature and potential temperature increase rapidly (Fig. 5a). This thermodynamic evolution is typical for marine cold air outbreaks in which cold air sweeps over a warm ocean surface and moisture is continuously replenished by ocean evaporation (Fig. 5b) along with the warming of the air by sensible heat fluxes (Papritz and Spengler, 2017). Due to the lack of ascent, these trajectories can only contribute to moisture transport in the lower troposphere.
The remaining categories comprise trajectories that are diabatically cooled – for instance via longwave radiation – with various degrees of subsidence determining the sign of ΔT. Trajectories in the category subside from the mid-troposphere towards the surface and, therefore, experience an overall temperature increase despite diabatic cooling (Fig. 5a). Low initial specific humidity and adiabatic warming cause sub-saturated conditions such that they quickly gain moisture as they enter into the boundary layer (Fig. 5b). This is opposed to trajectories in the category, which show much less subsidence and shortly before arrival at 70∘ N even modest ascent (Fig. 5a). Initial temperature and specific humidity are high along these trajectories, and moisture gains along the trajectories are smaller in comparison (Fig. 5b). Along with trajectories in the category, these two categories contribute to moisture transport mainly in the lower troposphere.
4.3.2 Relative contributions of trajectory categories to moisture transport
How important are the four trajectory categories for the Arctic moisture transport? Quantifying the relative contributions of the categories to the total poleward moisture transport at 70∘ N, we find that in fact all four trajectory categories are relevant for moist-air intrusions (Fig. 6). In the North Atlantic, the largest contributions to the moisture transport are due to trajectories in the and categories, contributing slightly more than 35 % each, followed in descending order by trajectories in the and categories (Fig. 6a). In the Labrador Sea and the North Pacific, in contrast, subsiding trajectories (; Fig. 6b and c) dominate with contributions of about 35 % to 40 %, respectively. Furthermore, diabatically ascending trajectories () contribute 10 % to 15 % more in these sectors than in the North Atlantic at the expense of cold air outbreak trajectories (). Relative numbers of trajectories (see symbols in Fig. 6) are in close agreement with the categories' contribution to moisture transport, indicating that the mean magnitude of moisture transport is fairly uniform across categories.

Figure 6Relative contributions of trajectory categories to meridional moisture transport associated with moist-air intrusions in (a) the North Atlantic, (b) the Labrador Sea, and (c) the North Pacific. Symbols indicate the percentage of trajectories in each of the categories.
4.3.3 Geographical distribution of moisture sources associated with trajectory categories
Each trajectory category is associated with preferred moisture uptake regions and moisture transport pathways. To illustrate this, we focus in the following on moist-air intrusions in the North Atlantic, which due to their large number allow for a robust decomposition of moisture sources by trajectory category. Figure 7 shows moisture uptake fields for each trajectory category as well as the trajectory density 6 d prior to arrival at 70∘ N. Note that the moisture source uptake field is normalized with respect to the total moisture transport at 70∘ N, i.e., the moisture transport associated with trajectories from all four categories. Accordingly, the sum of the moisture uptake fields shown in the four panels yields the total moisture uptake shown previously in Fig. 4a.
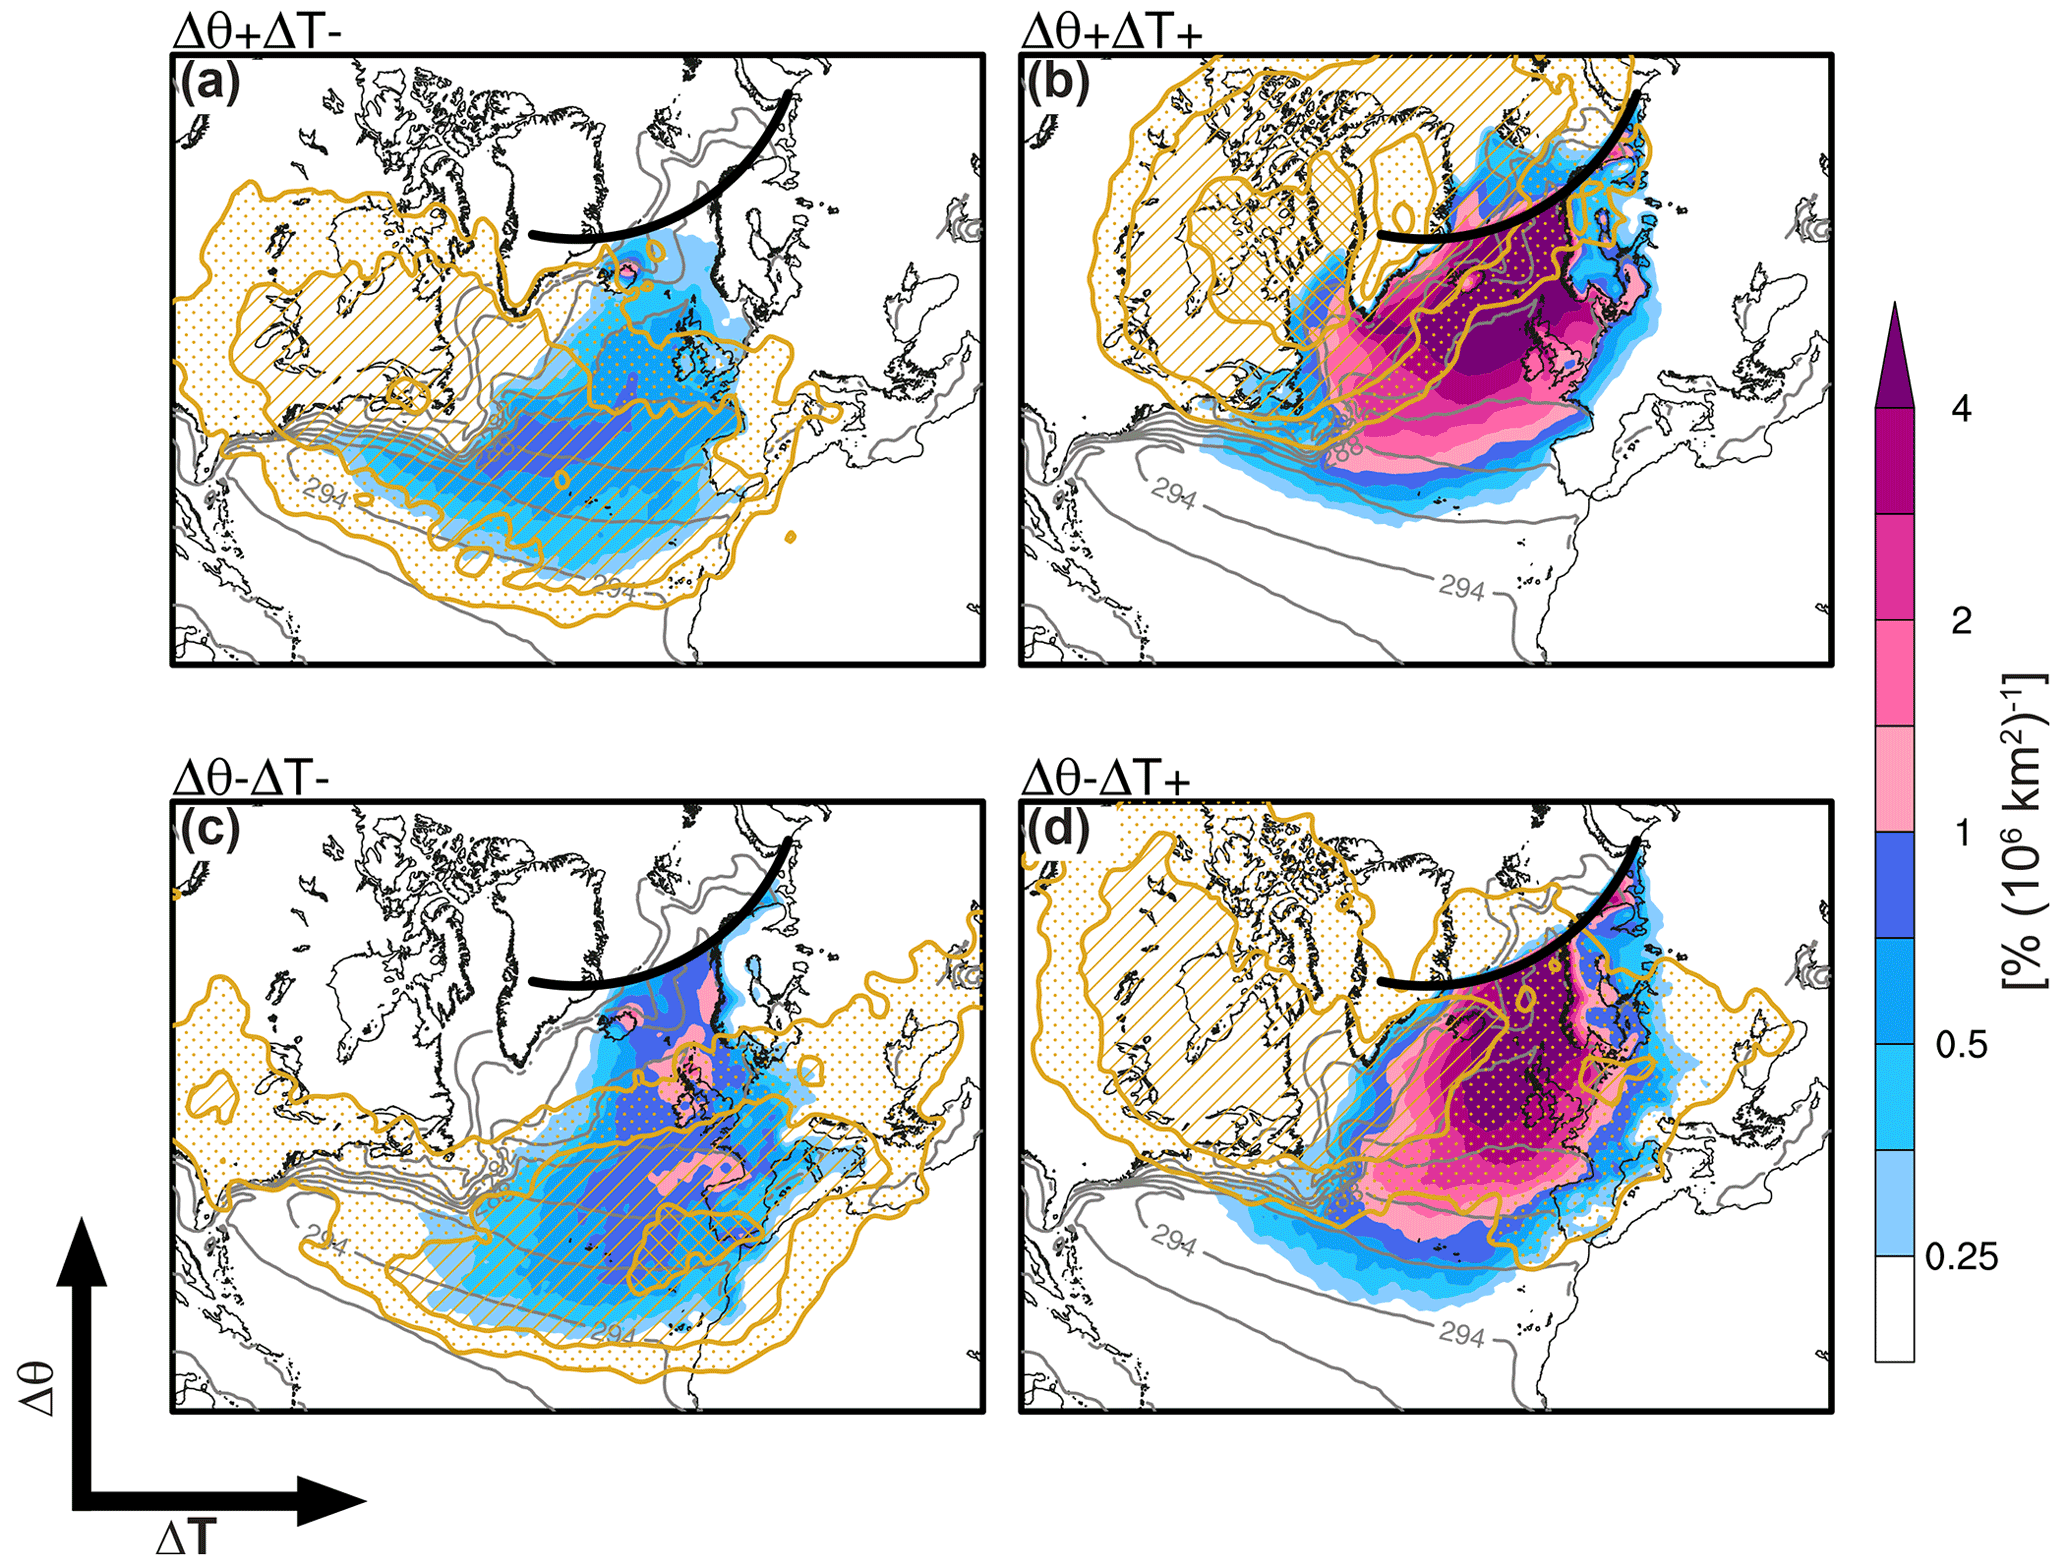
Figure 7Moisture uptake per area as in Fig. 3 but for moist-air intrusions in the North Atlantic stratified by trajectory categories, i.e., for (a) , (b) , (c) , and (d) . The percentages are relative to the total of all four categories. The 1 %, 2 %, and 5 % (106 km2)−1 probability contours of finding a trajectory of the given category at a certain location 6 d prior to arrival at 70∘ N () are shown by yellow dotted, hatched, and cross-hatched areas, respectively. Gray contours show SST in intervals of 3 K.
We first consider diabatically heated, ascending trajectories (). They are initially spread out over much of the mid-latitude North Atlantic and eastern North America (Fig. 7a). Moisture sources are distributed across mid-latitudes with a maximum east of the Gulf Stream extension (see the kink in SST contours) and comparatively low contributions from the eastern North Atlantic and the Norwegian Sea. Accordingly, moisture sources associated with this category of trajectories tend to be more remote than for the mean of all trajectories (Fig. 4a). This is in line with moisture uptakes preceding diabatic ascent, which takes place during the final 2 d (Fig. 5a and b). In a similar fashion, the high initial temperature and specific humidity of trajectories suggests an origin at rather low latitudes (Fig. 5a and b). This is confirmed by Fig. 7c, showing that 6 d before arrival the trajectories are located in the subtropics and at mid-latitudes. Moisture uptake occurs mainly in the eastern North Atlantic with high contributions from west of the Iberian Peninsula to the Norwegian Sea, which is consistent with the small but continuous increase in moisture along these trajectories, as suggested by Fig. 5b.
Cold air outbreak trajectories (; Fig. 7b) and to a slightly lesser extent also subsiding trajectories (; Fig. 7d) have a remote, high-latitude origin, as evident from the high trajectory densities over the Canadian Archipelago and North America. Nevertheless, the dominant moisture sources are located in the eastern North Atlantic, the reasons for which are different for the two categories. Since ocean evaporation in cold air outbreaks is limited by the saturation vapor pressure at the SST (see Papritz et al., 2015, for a discussion of the relationship between SST and surface evaporation), the most intense moisture uptake occurs over the relatively warm waters in the eastern North Atlantic and not in the colder Labrador Sea. Subsiding trajectories, in contrast, do not experience substantial moisture uptake as long as they are in the free troposphere and they do not descend below 800 hPa until about 2 d before arrival at 70∘ N. Hence, the most intense moisture uptake occurs while they approach the eastern North Atlantic and the Norwegian Sea, leading to a similar distribution of moisture uptake as for trajectories.
4.4 Residence time of moisture
The remote origin of moisture and long-range transport in some categories and the rather local sources with short transport distances in others suggest different residence times of moisture, here defined as the time moisture spends in the atmosphere between uptake and arrival at 70∘ N (i.e., t=0 h). Figure 8 shows the accumulated fraction of moisture transported across 70∘ N that is attributed to uptakes taking place between t=0 h and the given time t.
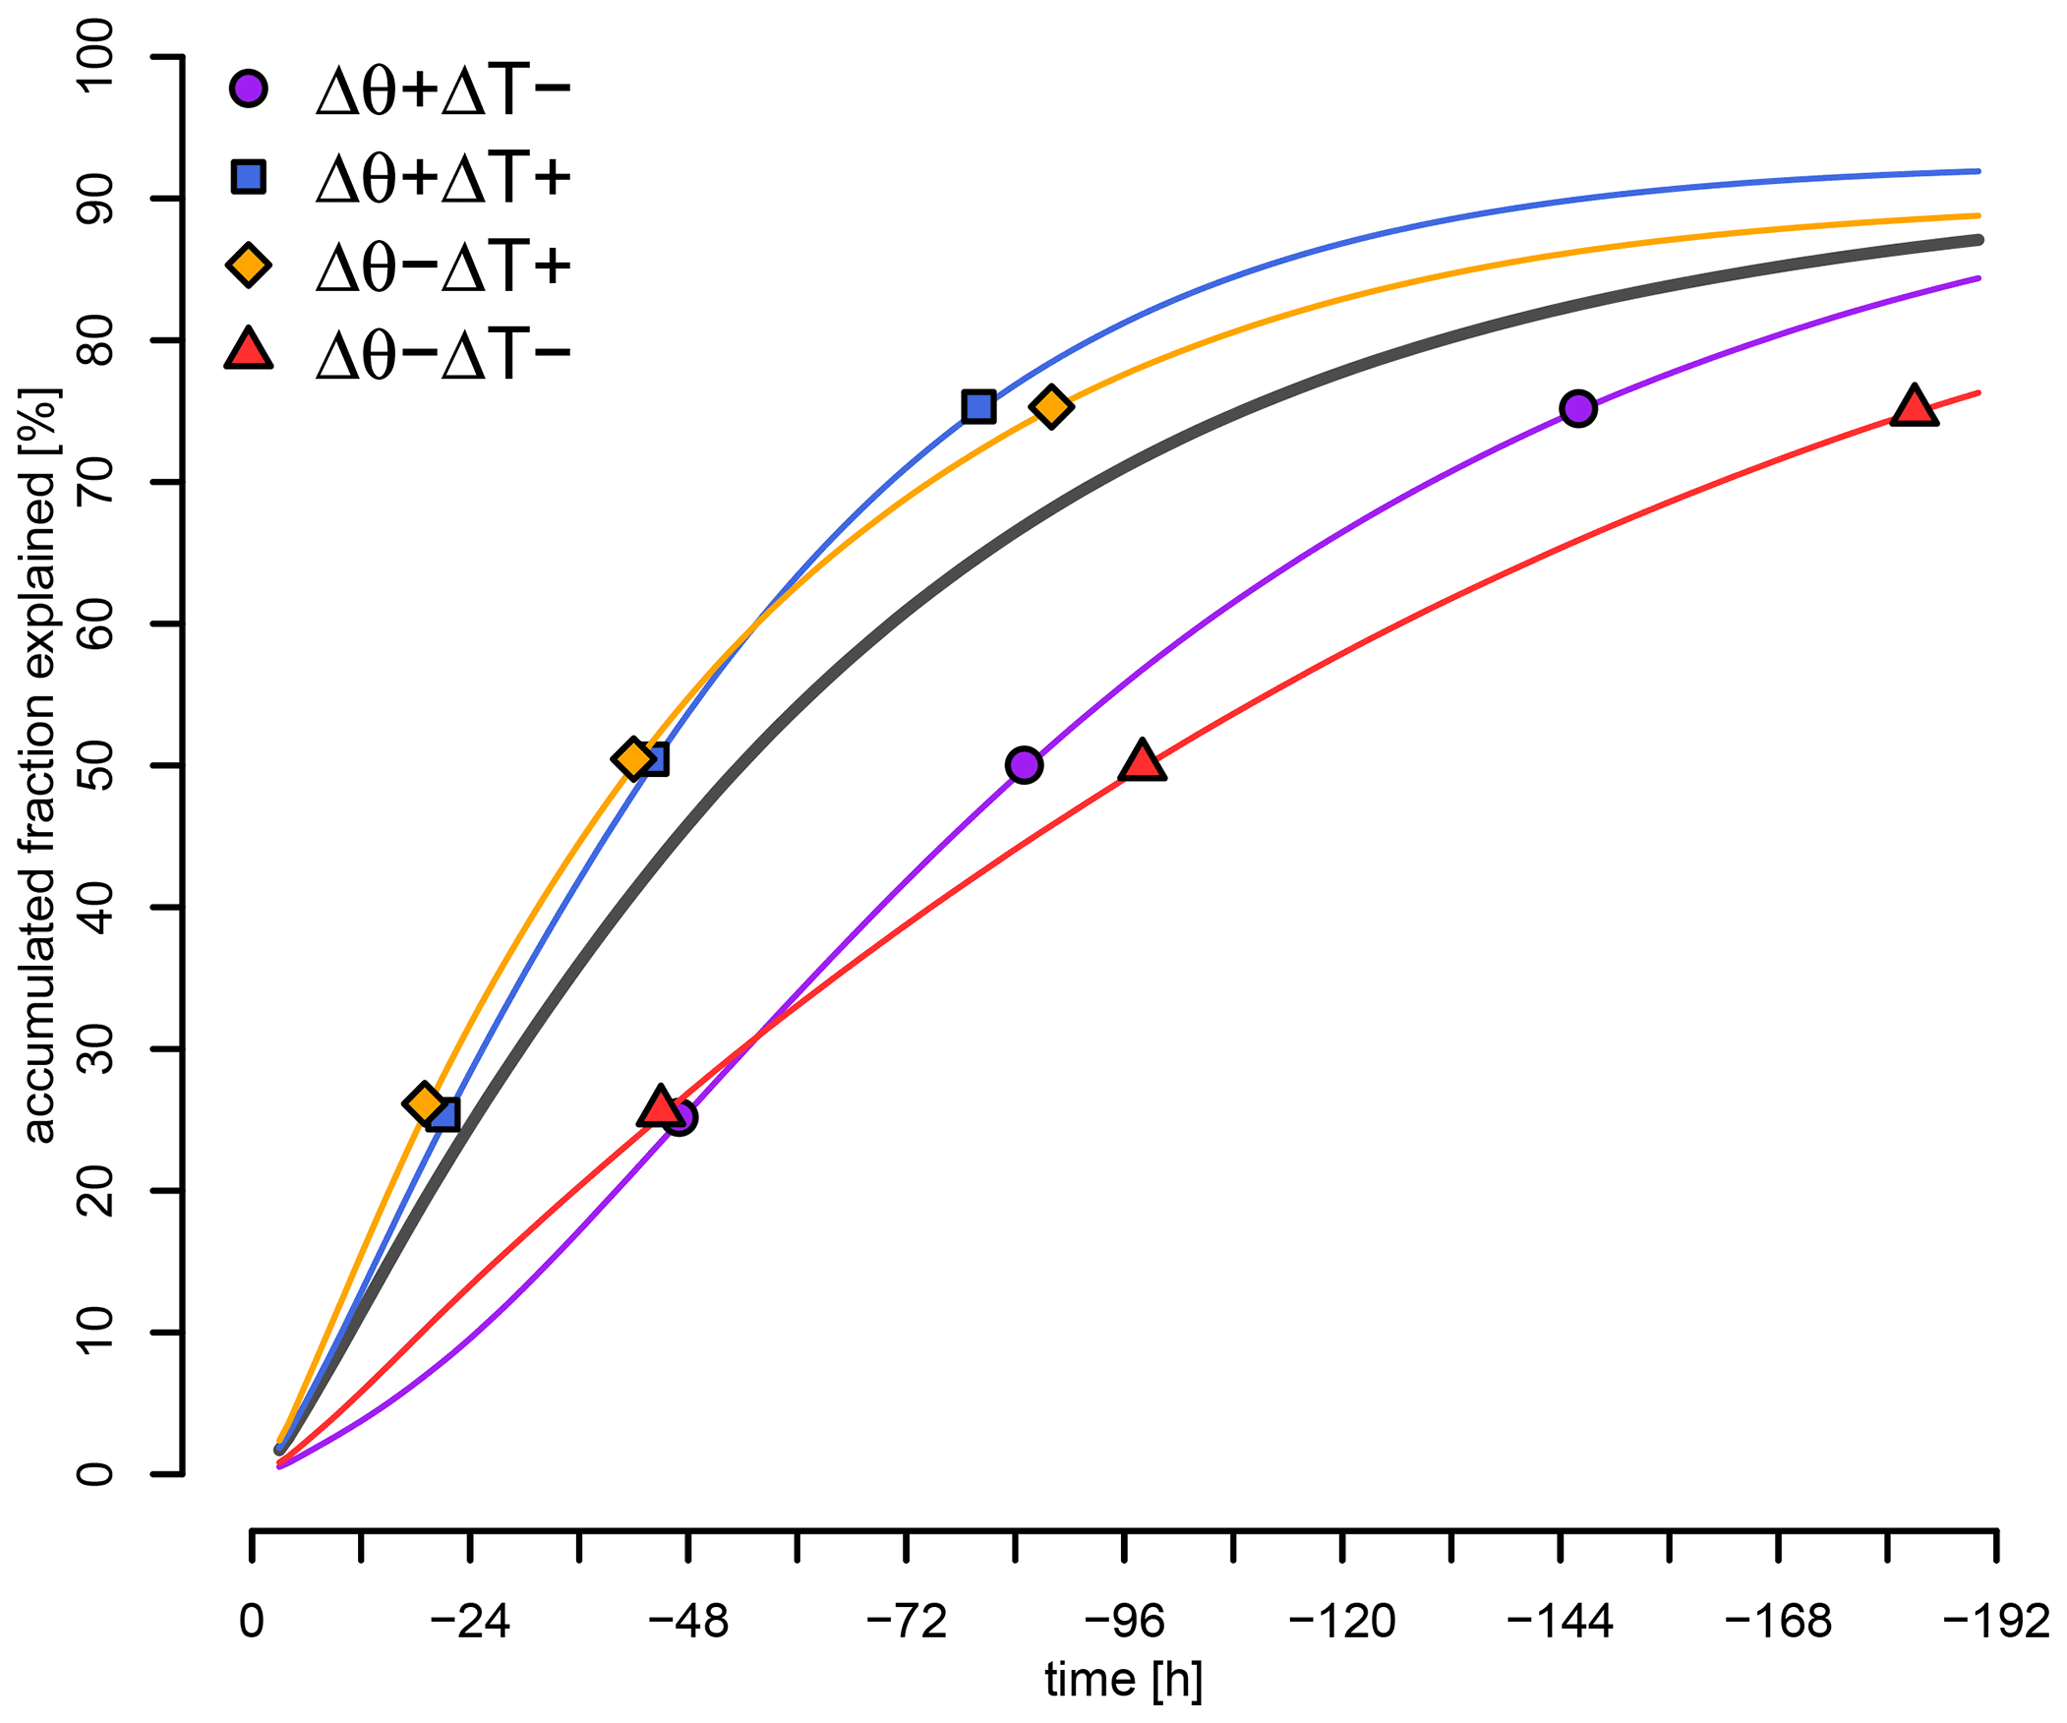
Figure 8Mean fraction of moisture attributed to moisture uptakes identified along the trajectories between the indicated time and t=0 h for all trajectories during moist-air intrusions (gray) and trajectories associated with intrusions in the North Atlantic only in the four trajectory categories (color). Symbols indicate the time when the explained fractions reach 25 %, 50 %, and 75 %.
Let us first consider all trajectories associated with all intrusions (gray curve). The rapid increase in the explained fraction for and the flattening of the curve for reveal that a substantial portion of the moisture uptakes take place only a short time before arrival at 70∘ N. Specifically, nearly 25 % of the moisture uptakes occur between t=0 and and an additional 25 % between and . This implies a median residence time of moisture between uptake and injection into the polar cap of around 60 h. If all identified moisture uptakes until are taken into account, nearly 85 % of the moisture transport is attributed to specific sources. The remaining 15 % of the moisture is picked up earlier or remains undetected by the moisture source diagnostic, for instance, because of moisture uptakes falling below the detection threshold (see methods and Sodemann et al., 2008). Note that the maximum explained fraction reduces to slightly less than 75 % for trajectories associated with intrusions in the North Atlantic, which is in line with the fact that these trajectories originate at low latitudes and have a high initial moisture content (Fig. 5b).
We now consider the median residence time for the four trajectory categories associated with intrusions in the North Atlantic (colored in Fig. 8). Comparing the four trajectory categories, we find large differences in the median residence time – in line with the different distribution of moisture uptake and the implied moisture transport distance. The median residence time is between 84 and 96 h for and trajectories, which are characterized by more remote uptakes and a longer moisture transport distance as compared to and trajectories. In contrast, the median residence time is clearly less than 48 h for the latter categories, which agrees with the fact that their moisture sources are largely confined to the triangle between Iceland, the British Isles, and Norway (Fig. 7b and d).
4.5 Role of the large-scale flow configuration
4.5.1 Clustering of moist-air intrusions in the North Atlantic
The exemplar case presented in Sect. 3 showed that moist-air intrusions can result from a combination of several distinct airstreams with characteristic moisture sources and thermodynamic evolution of the air. To shed light on the combinations of airstreams common during intrusions and their linkage to the driving large-scale weather systems, we first explore the co-variability of the moisture transport contributions to the moisture flux at 70∘ N accomplished by the four trajectory categories. For that purpose, we perform a principal component analysis on the standardized contributions to the moisture transport and consider the first two principal components. Figure 9a shows the projections of the moist-air intrusions as well as the four original basis vectors, representing the contributions of the four trajectory categories to the moisture transport, onto the plane spanned by the first two principal components (PC1 and PC2). The relative orientation of the four original basis vectors in the principal component space provides information about the co-variability of the contributions of the four trajectory categories; i.e., nearly parallel vectors indicate a high degree of co-variability, whereas perpendicular vectors indicate statistical independence of the variables. PC1 and PC2 explain approximately 47 % and 26 % of the total variance, respectively.
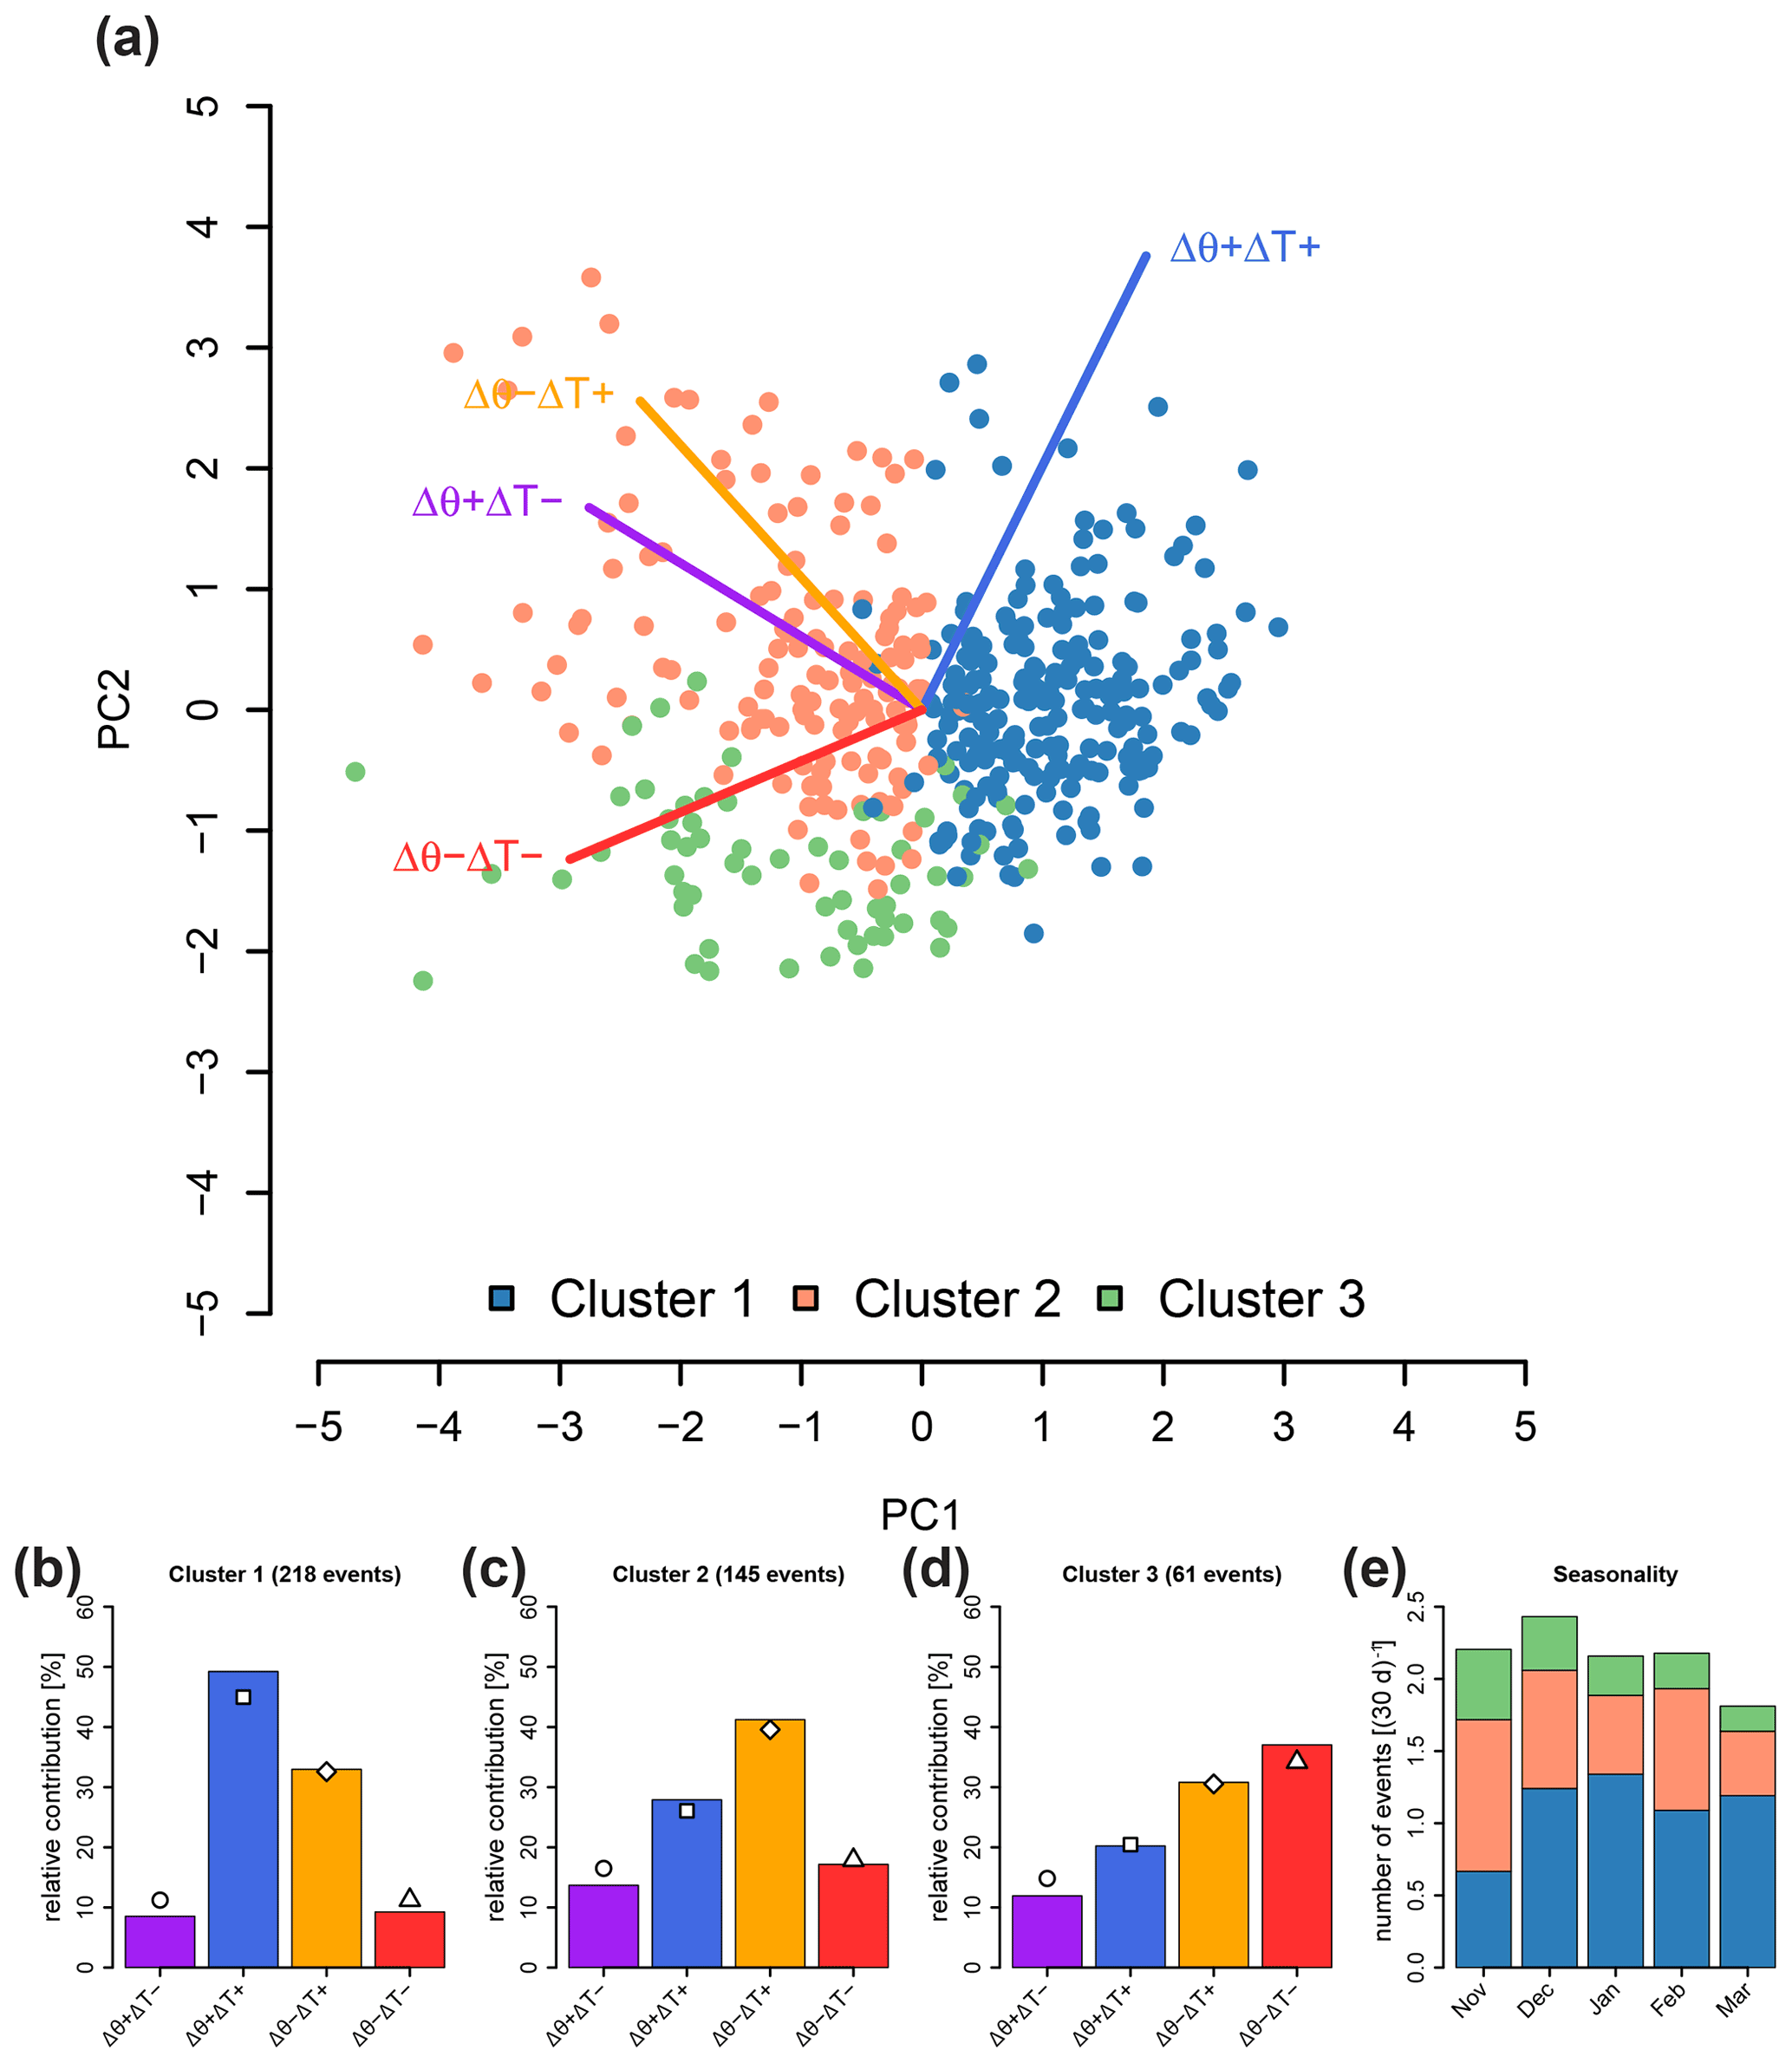
Figure 9(a) Biplot for moist-air intrusions in the North Atlantic based on a PCA of the contributions of the four trajectory categories to the moisture transport. The projections of individual intrusions on PC1 and PC2 are shown by dots colored according to the intrusion's attribution to clusters 1–3. Coloured lines indicate the projections of the original basis vectors (i.e., contributions to moisture transport) onto PC1 and PC2. Note that the latter have been scaled to optimize visibility, but relative magnitudes are retained. (b–d) Relative contributions of the four trajectory categories to the moisture transport (as in Fig. 6) for intrusions in (b) cluster 1, (c) cluster 2, and (d) cluster 3. (e) Mean number of intrusions per 30 d (cluster 1: blue; cluster 2: red; cluster 3: green).
The largest case-to-case variability occurs along PC1 separating the moisture transport contribution of trajectories from that of the remaining categories, as evident from the opposite orientation of the basis vectors along PC1. More specifically, intrusions with positive PC1 have important contributions from originally cold polar air (), whereas subsiding air () or longer-range poleward transport of moisture () is more important for intrusions with negative PC1. Furthermore, PC2 is more variable for intrusions with negative PC1 than for those with positive PC1, indicating that PC2 further stratifies intrusions with a weak contribution of according to the relative importance of and . This points towards the existence of several types of moist-air intrusions for which moisture transport is dominated by different processes.
In order to group moist-air intrusions according to their moisture transport characteristics, we use an agglomerative clustering algorithm based on the variance minimization method by Ward (1963) with a Euclidean distance metric. As input we take all four standardized contributions of the four trajectory categories to the moisture transport. Starting from single-element clusters, the idea of Ward's method is to merge elements one by one into larger clusters until all elements belong to one single cluster. At each merging step, the within-cluster variance is minimized. This results in a hierarchy of clusters as visualized in a dendrogram (Fig. S3 in the Supplement). In the following we choose a total of three clusters, and Fig. 9b–d show the relative contributions of the four trajectory categories to the moisture transport. Note that choosing a higher number of clusters does not reveal additional types of moist-air intrusions with clearly distinct moisture transport contributions by the trajectory categories (Fig. S4 in the Supplement).
The intensity of moist-air intrusions in terms of the poleward moisture transport is almost identical in all three clusters (not shown). Nearly 50 % of the moisture transport associated with intrusions in the first cluster (218 intrusions; Fig. 9b) results from cold air outbreak trajectories (), while about 35 % is due to subsiding trajectories (). The second cluster (145 intrusions; Fig. 9c) contains intrusions for which subsiding trajectories have the largest contribution to the moisture transport (; 40 %), followed by cold air outbreak trajectories (; 30 %). Finally, the third cluster (61 intrusions; Fig. 9d) represents intrusions associated with long-range moisture transport (; 40 %) and transport by subsiding trajectories (; 30 %).
The month-to-month variability in the number of intrusions is modest (Fig. 9e), with the highest number in December (nearly 2.5 intrusions per 30 d) and the lowest in March (about 1.8 intrusions per 30 d). However, the distribution of intrusions across clusters shows pronounced changes throughout winter. About 50 % of the intrusions in November are related to cluster 2, whereas cluster 1 accounts for the majority of intrusions during the other months with a peak in January. Cluster 3, finally, is slightly more frequent in early than in late winter.
4.5.2 Relationship to cyclones, blocks, and cold air outbreaks
The variable contributions of the different trajectory categories to the moisture transport suggests different dynamical drivers causing the moist-air intrusions in the three clusters. To test this, we analyze the large-scale flow patterns throughout the 3 d preceding the intrusions by means of cluster composites (Fig. 10). For all three clusters, this reveals the well-known dipole pattern in 500 hPa geopotential height anomalies known to favor episodes of strong poleward transport of warm and humid air in the Atlantic sector (contours in Fig. 10; Luo et al., 2017; Messori et al., 2018; Papritz, 2020), i.e., a positive anomaly over Scandinavia and a negative over Greenland. Differences between clusters occur in terms of the relative magnitudes and detailed orientation of the positive and negative anomalies. Considering the frequencies of specific weather features, namely cyclones, blocks, and cold air outbreaks, reveals substantial differences between the three clusters.

Figure 10Composites of (a–c) cyclone, (d–f) blocking, and (g–i) cold air outbreak frequency anomalies relative to climatology during the 3 d prior to moist-air intrusions in the North Atlantic in clusters (a, d, g) 1, (b, e, h) 2, and (c, f, i) 3. Blue contours indicate corresponding 500 hPa geopotential height anomalies in intervals of 20 m, with negative values dashed and the zero contour omitted.
Moist-air intrusions belonging to the first cluster are associated with a shift of the storm track towards Greenland's east coast and an especially strong cyclone frequency anomaly in the Irminger Sea (Fig. 10a), while there is only a weak enhancement in the frequency of blocks over Scandinavia (Fig. 10d). A trough over Greenland and cyclones in the Irminger Sea favor the advection of cold air off the ice in the Labrador Sea, consistent with a notable positive anomaly of cold air outbreak frequency (Fig. 10g), and the further transport of the air around the tip of Greenland and poleward toward the Arctic. This agrees with the large share of trajectories in the moisture transport in this cluster (Fig. 9b), as well as with the preferential origin of trajectories over the Canadian Archipelago (Fig. 7b).
Intrusions belonging to the second cluster feature frequent blocking over Scandinavia (Fig. 10e) and a storm track shift, similar to intrusions in cluster 1, albeit with a weaker amplitude (Fig. 10b). The lower cyclone frequency is consistent with reduced frequency of cold air outbreaks in the Labrador Sea (Fig. 10h) and lower contributions of cold air outbreak trajectories () to the moisture transport. However, the contribution of subsiding trajectories () is increased by roughly 10 % as compared to cluster 1 (Fig. 9c), in agreement with the high frequency of blocks over Scandinavia (Fig. 10e).
Cyclone, blocking, and cold air outbreak frequency anomalies in the third cluster, finally, are weak (Fig. 10c, f, and i), indicating that these intrusions are less related to transport by cyclones and blocks. Nevertheless, there is a clear geopotential height dipole (e.g., Fig. 10c) related to a favorable configuration of a trough over Greenland and a ridge over Scandinavia. Taken together, this indicates that the large-scale flow configuration is less baroclinic than in the other two clusters, favoring the poleward transport of warm and humid air with little ascent. This is consistent with large contributions of to the moisture transport (Fig. 9d).
In this study, we have analyzed the moisture sources and moisture transport pathways of 597 wintertime, moist-air intrusions across 70∘ N into the Arctic in the period 1979 to 2018. For that purpose, we have chosen a Lagrangian approach based on kinematic backward trajectories that allows us to identify moisture sources and to link them to the evolution of the air that carries the moisture poleward. Since the moist evolution of an air parcel is fundamentally linked to its thermodynamic evolution, we have classified air parcel trajectories according to their evolution in θ−T space by considering maximum absolute changes of θ and T. Based on this classification of trajectories, we have scrutinized the relationship between different configurations of the large-scale circulation that drive moist-air intrusions and the origin of the air, the regions where moisture uptake takes place, and the moisture transport pathways.
For 455 out of all 597 identified moist-air intrusions, 75 % of the zonally integrated moisture transport into the polar cap takes place in one of three sectors – that is, the North Atlantic (424 intrusions), the Labrador Sea (22 intrusions), and the North Pacific (9 intrusions). This uneven distribution of moist-air intrusions across the Northern Hemisphere is in line with previous work (Woods et al., 2013; Dufour et al., 2016; Naakka et al., 2019). The remaining 142 moist-air intrusions are associated with substantial moisture transport in more than one of these sectors.
5.1 Moisture source regions and important airstreams
Climatologically, the moisture injected into the polar cap during moist-air intrusions originates almost exclusively in the North Atlantic owing to the much higher number of intrusions in this basin. The largest contributions of moisture associated with intrusions in the North Atlantic stem from a band between 50 and 70∘ N (accounting for >50 % of the explained moisture), including the seas between Iceland, the British Isles, and Norway. Evaporation along the Gulf Stream front and its extension – the regions with the climatologically highest evaporation rates in the North Atlantic – provides only about 10 % of the moisture transported into the polar cap. In addition, the moisture originating in this region is only relevant for moisture transport at mid-tropospheric levels but not in the lower troposphere. For intrusions in the Labrador Sea, in contrast, the Gulf Stream front is an important source region along with the Labrador Sea itself. Finally, the sources associated with intrusions in the North Pacific are relatively uniformly distributed across the eastern parts of the Pacific basin in a wide latitudinal band stretching from 30 to 60∘ N.
Four types of airstreams are distinguished based on the maximum absolute changes of θ and T. They comprise polar cold air subject to diabatic warming and moisture uptake as the air is exposed to a warm ocean surface (), air subsiding from the mid-troposphere into the boundary layer (), warm and moist air ascending (diabatically) from the boundary layer into the mid-troposphere (), and warm and moist, low-latitude air subject to diabatic cooling that is transported poleward at low altitudes (). As evident from Fig. 11, a close relationship exists between these trajectory categories, moisture uptake latitude, and – in reverse – the level at which the moisture is injected into the polar cap. Lower tropospheric moisture transport, accounting for slightly more than 70 % of the total moisture transport during moist-air intrusions in the North Atlantic, is related to and trajectories, whereas mid-tropospheric moisture transport is associated with trajectories that ascended diabatically from the boundary layer (; accounting for 11 % of the total moisture transport). Long-range moisture transport, finally, peaks in between the lower and mid-troposphere around 800 hPa (; accounting for 17 % of the total moisture transport).
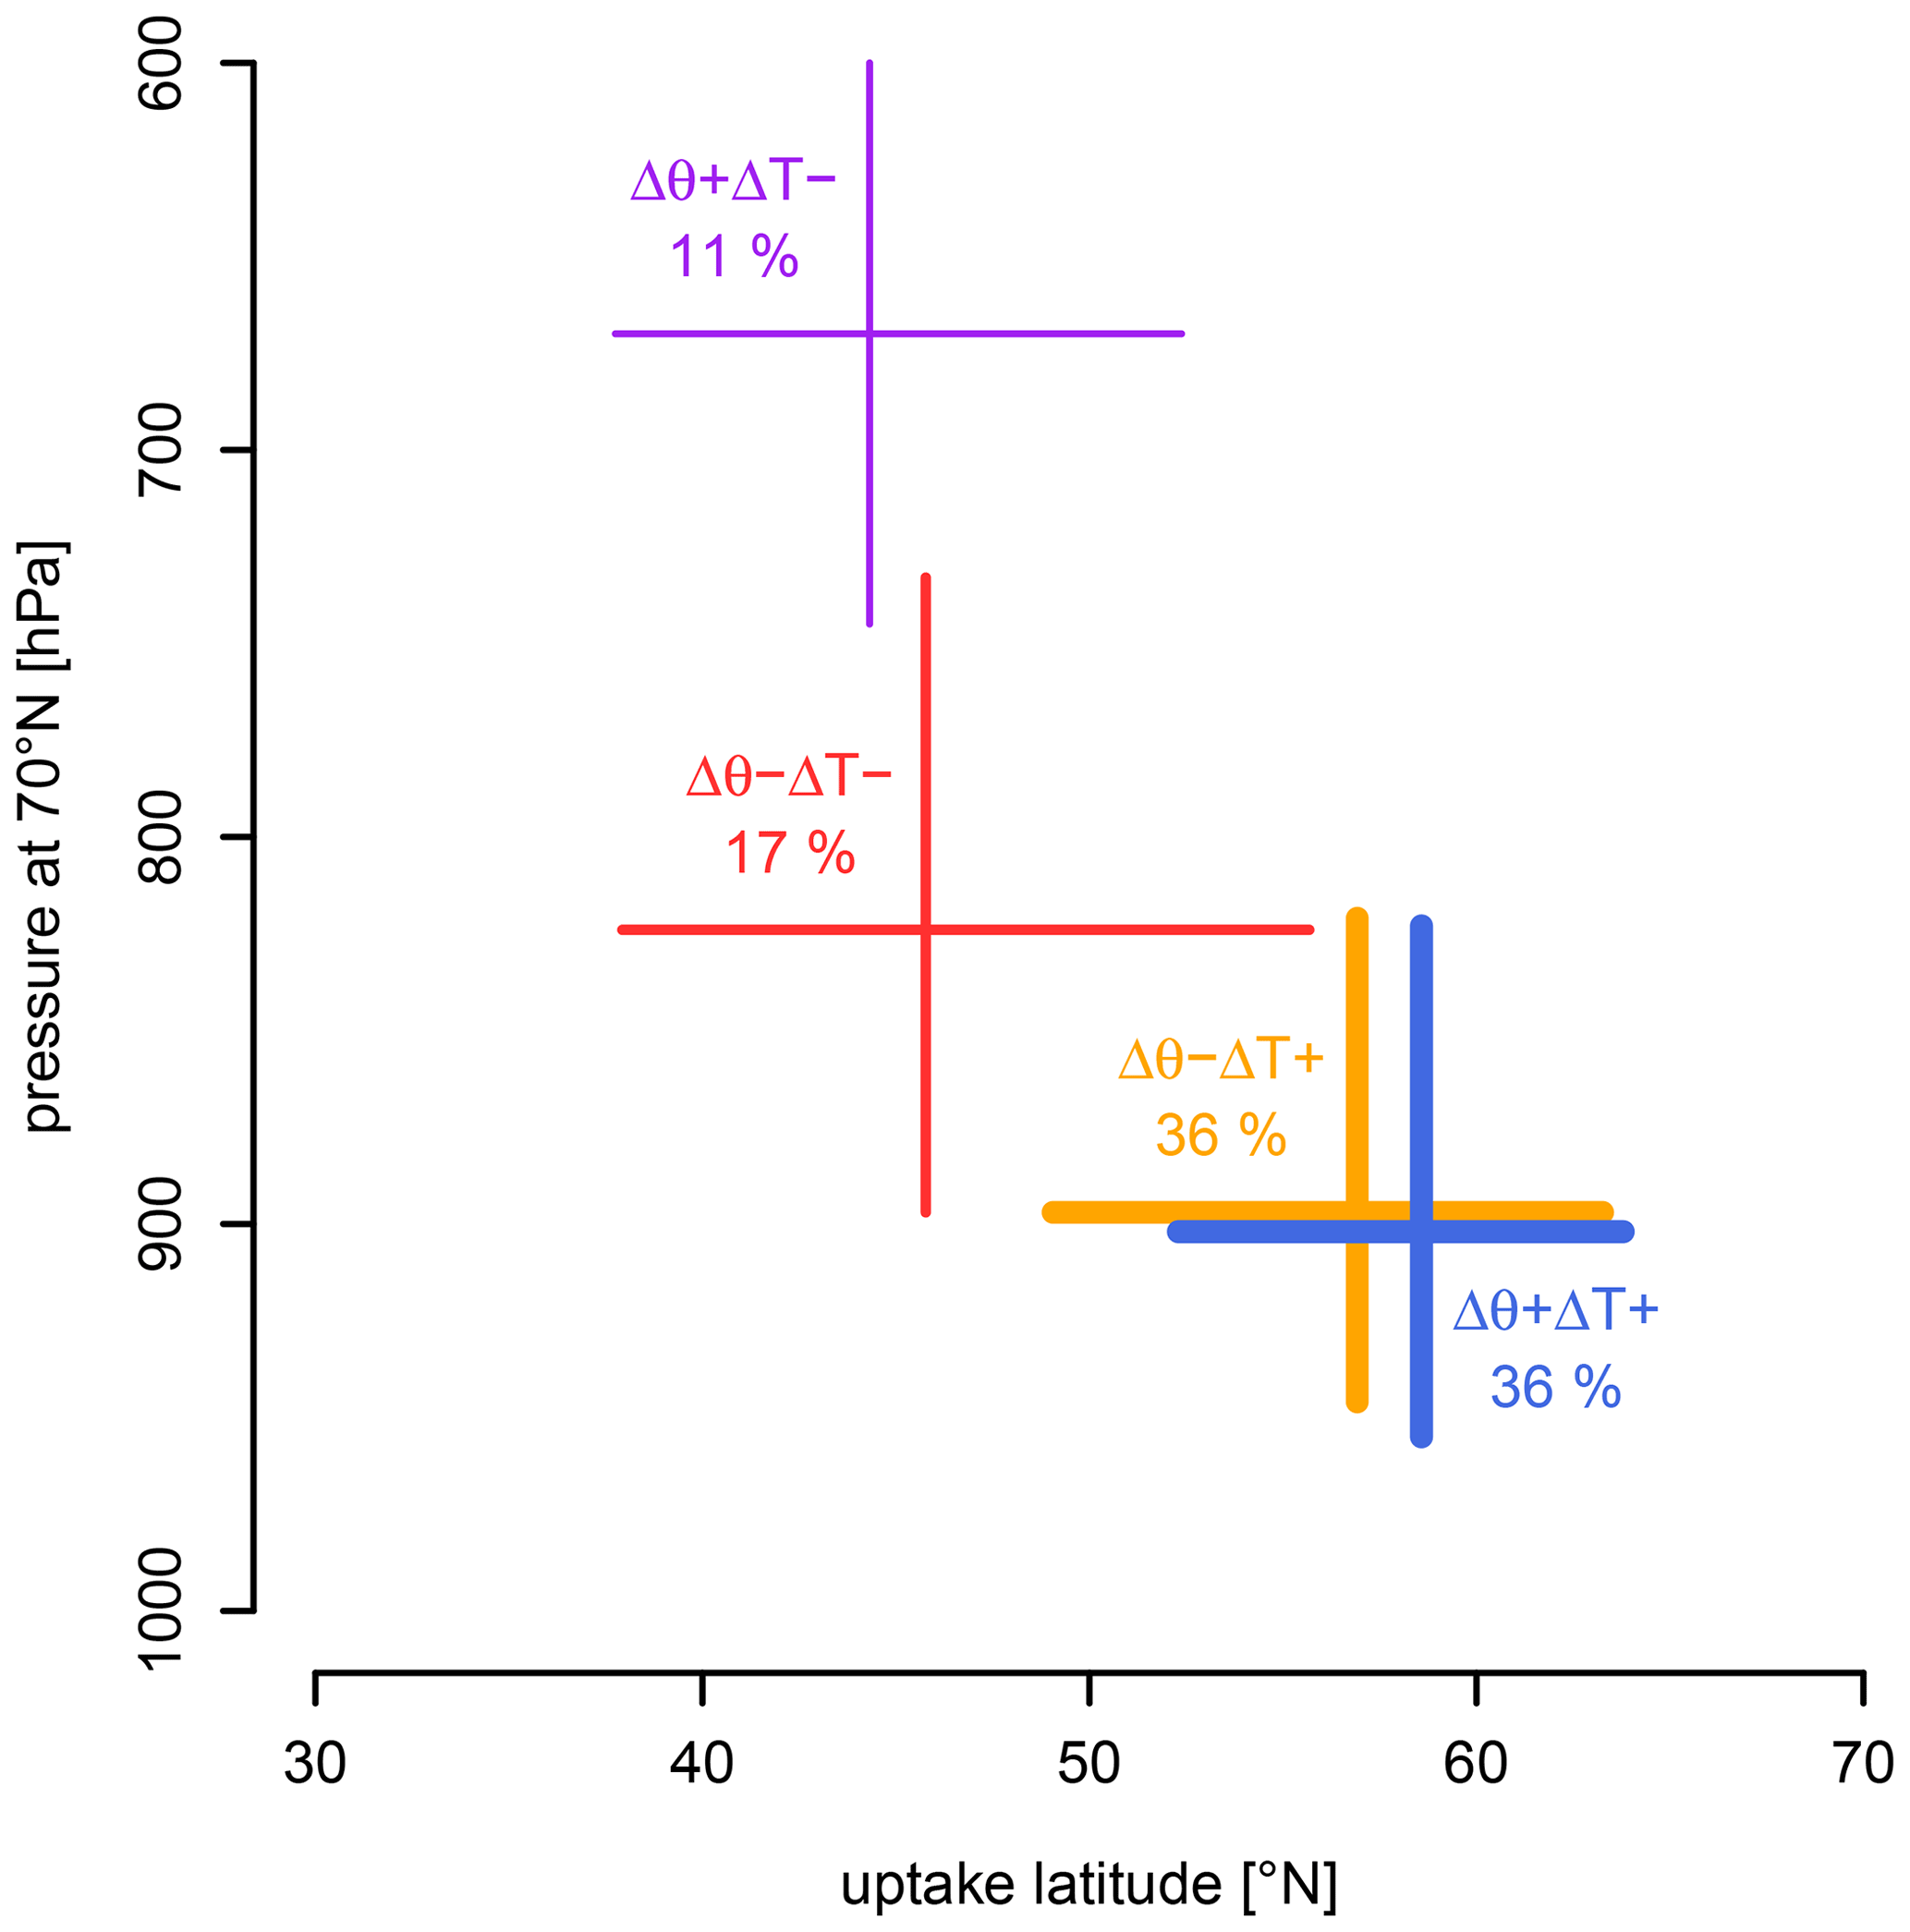
Figure 11Summary figure showing for moist-air intrusions in the North Atlantic the interquartile range of moisture uptake latitude vs. pressure at 70∘ N for the four trajectory categories. Line thickness is proportional to the relative contribution to the moisture transport, also indicated in percent (%).
As a consequence of the relatively short average distance between the moisture uptake regions in the North Atlantic and 70∘ N, the median residence time of the moisture in the atmosphere prior to arriving at 70∘ N is approximately 2.5 d. However, the residence time depends on the type of the airstream accomplishing the transport and, hence, on the origin of the air (e.g., polar, mid-tropospheric, or low latitudes). Residence times are typically below 2 d for polar cold air () or air subsiding from the mid-troposphere (), whereas they amount to almost 4 d for the other categories, which transport moisture over larger distances.
The prominent moisture uptake contributions of the latitude band between 50 and 70∘ N agree with the findings of Singh et al. (2017), who emphasize these latitudes as important source regions of moisture transported into the polar cap, as well as with those of Zhong et al. (2018) in terms of moisture sources for precipitation falling in the Barents and Kara seas. They contrast, however, with the results by Vázquez et al. (2016) and Luo et al. (2017, 2019) who find lower latitudes to be important. More specifically, they identify western boundary currents such as the Gulf Stream front and its extension as the dominant moisture sources. Some of this discrepancy is likely because of the consideration of a different target domain, which hampers a direct comparison. For instance, Vázquez et al. (2016) include major areas south of 70∘ N in the definition of the Arctic domain, whereas Luo et al. (2017, 2019) focus on the Barents and Kara seas, a subregion of the Arctic polar cap. While some of the moist-air intrusions considered in our study are associated with moisture transport into the Barents and Kara seas, most of the intrusions extend further poleward into the high Arctic. Finally, it is important to note that we do find moisture originating in the western North Atlantic, especially along the extension of the Gulf Stream front, to contribute to mid-tropospheric poleward moisture transport at 70∘ N ().
5.2 Linkage to large-scale flow and synoptic weather systems
From a synoptic perspective, moist-air intrusions in the North Atlantic have previously been shown to be associated with a dipole of 500 hPa geopotential height anomalies (e.g., Messori et al., 2018; Zhong et al., 2018), where the negative anomaly is linked to a shift of the storm track in the Nordic Seas towards Greenland's east coast and the positive anomaly to blocking over Scandinavia and the Ural Mountains (Luo et al., 2017; Papritz and Dunn-Sigouin, 2020). The relative amplitude of the two anomalies and, thus, the degree to which these flow features contribute to the transport vary greatly from one intrusion to another. Here, we have shown that the contributions of different types of airstreams to the poleward moisture transport are strongly influenced by the configuration of the large-scale flow, e.g., the presence of a cyclone or block.
More specifically, focusing on intrusions in the North Atlantic, we have found that moisture transport during intrusions with a pronounced shift and high intensity of the storm track (218 intrusions) is mainly accomplished by polar air originating in the Canadian Arctic, which is drawn southward and around the southern tip of Greenland in the cold sectors of cyclones with their centers located in the Irminger Sea (). Thereby, the cold air is warmed and moistened as it moves over increasingly warmer waters in a cold air outbreak type of flow. This type of intrusion is most frequent during the peak winter months (DJF) when cyclone activity in the Nordic Seas is strong and the air–sea temperature contrast over the North Atlantic is most intense. In the case of blocking-dominated moist-air intrusions (145 intrusions), which are most frequent in early winter (November), the moisture transport is in the first place accomplished by air that subsided from the mid-troposphere into the boundary layer prior to moisture uptake (). Similarly, subsiding air is also the most important contributor to the moisture flux during moist-air intrusions in the North Pacific. This is consistent with the frequent occurrence of blocking over Alaska and the minor role of poleward-propagating cyclones for the poleward moisture transport in this basin (e.g., Papritz and Dunn-Sigouin, 2020; Fearon et al., 2021). In situations with weak forcing by cyclones and blocks (61 intrusions), finally, the transport is from lower latitudes and of a longer-range nature () as compared to situations with strong synoptic forcing.
The relationship between uptake latitude and the level of the moist-air intrusion at 70∘N, as shown in Fig. 11, is a consequence of the fact that in a baroclinic atmosphere poleward-flowing air ascends along the slanted isentropes. As a result, moisture injected into the atmosphere at relatively low latitudes such as along the Gulf Stream front or in the subtropics is likely forced to ascend and rain out prior to reaching 70∘ N, if baroclinicity is strong. This suggests that baroclinic weather systems are unfavorable for transporting moisture over large distances towards the Arctic. In line with this argument, our results emphasize the importance of cold air outbreaks and subsiding air ( and ) for moist-air intrusions associated with a strong cyclonic influence. These airstreams are indeed closely related to the cold sector of cyclones (Fletcher et al., 2016; Papritz et al., 2015). Since the air associated with these airstreams typically originates at fairly high latitudes and the moisture sources are predominantly located poleward of 50∘ N, this implies a moisture transport over relatively short distances. In reverse, long-range moisture transport, as described by trajectories, becomes more important or even dominant during moist-air intrusions associated with blocking or weak synoptic forcing.
5.3 Limitations
An important limitation of our approach is that 15 % of the moisture transported into the polar cap cannot be attributed to specific sources, mainly because of uptakes that take place more than 8 d before arrival at 70∘ N and to a lesser extent also because of numerical issues such as uptakes falling below the detection threshold. The fraction of unattributed moisture depends on the type of airstream – that is, the trajectory category. It is below 10 % for cold air outbreak () and subsiding () trajectories that are typically very dry before taking up moisture en route to the Arctic, owing to their polar and mid-tropospheric origin, respectively. In contrast, it is notably higher for trajectories associated with longer-range moisture transport ( and trajectories). Thus, our method tends to underestimate the contribution of long-range moisture transport and, thus, more remote moisture sources. It is important to note, however, that this affects mainly moisture transported poleward near 800 hPa and above, including the mid-troposphere, but not the lowermost troposphere, where most of the moisture transport is due to and categories with high-latitude moisture sources (see Fig. 11).
In this study, we have focused on moisture transport at 70∘ N, which is a common choice among Arctic moisture transport studies (Sorteberg and Walsh, 2008; Woods et al., 2013; Dufour et al., 2016; Woods and Caballero, 2016; Naakka et al., 2019; Fearon et al., 2021). With this choice we include not only the high Arctic but also Bering Strait and marginal seas, such as the Barents Sea, where moist-air intrusions unfold an especially strong impact on sea ice variability and in recent years even have contributed to unusual wintertime melt events of sea ice (e.g., Boisvert et al., 2016). Yet, it is not as restrictive as 80∘ N, which would limit the analysis to the high Arctic, and it is not as expansive as 60∘ N, which would shift the analysis domain close to mid-latitudes and include areas that are not generally considered to belong to the Arctic. Since the synoptic drivers of poleward moisture transport depend somewhat on the considered latitude (compare supplement in Papritz and Dunn-Sigouin, 2020) as does the sector in which the moisture transport takes place (Dufour et al., 2016; Naakka et al., 2019), moisture source regions can be expected to shift along with the considered latitude, as well as the contributions of the different types of airstreams to the moisture transport. Nevertheless, we expect the mechanistic relationships between the driving synoptic weather systems and the airstreams accomplishing the moisture transport to be largely unaffected by the precise choice of latitude.
5.4 Final remarks and outlook
In summary, this study reveals a rich spectrum of dynamical processes and large-scale flow patterns acting together in shaping moist-air intrusions, which profoundly impact the Arctic's weather and climate. This richness of dynamical and thermodynamic processes and their interlinkages complicate a thorough understanding of how the Arctic's hydrological cycle changes as the climate warms. On one hand, thermodynamic changes might modulate the frequency of particular airstreams and their efficiency in extracting moisture from the ocean surface, as well as transporting it poleward. For example, the more rapid warming of the polar regions as compared to mid-latitudes implies a reduction of the sea–air temperature difference when polar air is advected over open ocean, which as shown in this study provides an important pathway for moisture transport into the Arctic. On the other hand, also the frequency and tracks of weather systems are subject to change. Combining kinematic trajectories and feature-based weather system diagnostics and employing them in simulations of future climate scenarios provides an interesting avenue for pinpointing causes of future changes in moisture transport towards the Arctic.
All results are based on the ERA5 reanalysis, which can be downloaded from the Copernicus Climate Service (https://climate.copernicus.eu/climate-reanalysis, Copernicus Climate Service, 2021). Codes and scripts for performing the analyses and plotting are available on request from the authors. The SPHEREPACK library (Adams and Swarztrauber, 1997) was used for the mass flux correction of vertically integrated moisture fluxes.
The supplement related to this article is available online at: https://doi.org/10.5194/wcd-3-1-2022-supplement.
The identification of moist-air intrusions, the moisture source identification, and the classification of trajectories were carried out by DH as part of his master's thesis project (Hauswirth, 2020), supervised by LP and KH, and the clustering analysis and composites were done by LP. LP wrote the first draft of the manuscript, supported by KH and DH. All authors contributed equally to the interpretation of results and the finalization of the manuscript.
At least one of the (co-)authors is a member of the editorial board of Weather and Climate Dynamics. The peer-review process was guided by an independent editor, and the authors also have no other competing interests to declare.
Publisher's note: Copernicus Publications remains neutral with regard to jurisdictional claims in published maps and institutional affiliations.
We thank the ECMWF for providing the ERA5 reanalysis, as well as two anonymous reviewers for their comments.
This research has been supported by the European Research Council under the Horizon 2020 research and innovation program (project INTEXseas, grant no. 787652).
This paper was edited by Gwendal Rivière and reviewed by two anonymous referees.
Adams, J. C. and Swarztrauber, P. N.: SPHEREPACK 2.0, Model Development Facility NCAR [code], NCAR Tech. Note NCAR/TN-436-STR, Boulder, Colorado, 1997. a, b
Alekseev, G., Kuzmina, S., Bobylev, L., Urazgildeeva, A., and Gnatiuk, N.: Impact of atmospheric heat and moisture transport on the Arctic warming, Int. J. Climatol., 39, 3582–3592, https://doi.org/10.1002/joc.6040, 2019. a
Baggett, C., Lee, S., and Feldstein, S.: An Investigation of the presence of atmospheric rivers over the North Pacific during planetary-scale wave life cycles and their role in Arctic warming, J. Atmos. Sci., 73, 4329–4347, https://doi.org/10.1175/JAS-D-16-0033.1, 2016. a
Binder, H., Boettcher, M., Grams, C. M., Joos, H., Pfahl, S., and Wernli, H.: Exceptional air mass transport and dynamical drivers of an extreme wintertime Arctic warm event, Geophys. Res. Lett., 44, 12028–12036, https://doi.org/10.1002/2017GL075841, 2017. a
Boisvert, L. N., Petty, A. A., and Stroeve, J. C.: The impact of the extreme winter 2015/16 Arctic cyclone on the Barents–Kara Seas, Mon. Weather Rev., 144, 4279–4287, https://doi.org/10.1175/MWR-D-16-0234.1, 2016. a, b
Chen, L., Fettweis, X., Knudsen, E. M., and Joahannessen, O. M.: Impact of cyclonic and anticyclonic activity on Greenland ice sheet surface mass balance variation during 1980–2013, Int. J. Climatol., 36, 3423–3433, https://doi.org/10.1002/joc.4565, 2016. a
Copernicus Climate Service: ERA5 reanalysis, available at: https://climate.copernicus.eu/climate-reanalysis, last access 11 March 2021. a
Croci-Maspoli, M., Schwierz, C., and Davies, H. C.: A multifaceted climatology of atmospheric blocking and its recent linear trend, J. Climate, 20, 633–649, https://doi.org/10.1175/JCLI4029.1, 2007. a
Doyle, J. G., Lesins, G., Thackray, C. P., Perro, C., Nott, G. J., Duck, T. J., Damoah, R., and Drummond, J. R.: Water vapor intrusions into the High Arctic during winter, Geophys. Res. Lett., 38, L12806, https://doi.org/10.1029/2011GL047493, 2011. a, b
Dufour, A., Zolina, O., and Gulev, S. K.: Atmospheric moisture transport to the Arctic: Assessment of reanalyses and analysis of transport components, J. Climate, 29, 5061–5081, https://doi.org/10.1175/JCLI-D-15-0559.1, 2016. a, b, c, d, e, f
Fearon, M. G., Doyle, J. D., Ryglicki, D. R., Finocchio, P. M., and Sprenger, M.: The role of cyclones in moisture transport into the Arctic, Geophys. Res. Lett., 48, e2020GL090353, https://doi.org/10.1029/2020GL090353, 2021. a, b, c
Fettweis, X., Box, J. E., Agosta, C., Amory, C., Kittel, C., Lang, C., van As, D., Machguth, H., and Gallée, H.: Reconstructions of the 1900–2015 Greenland ice sheet surface mass balance using the regional climate MAR model, The Cryosphere, 11, 1015–1033, https://doi.org/10.5194/tc-11-1015-2017, 2017. a
Fletcher, J., Mason, S., and Jakob, C.: The climatology, meteorology, and boundary layer structure of marine cold air outbreaks in both hemispheres, J. Climate, 29, 1999–2014, https://doi.org/10.1175/JCLI-D-15-0268.1, 2016. a
Francis, J. A. and Hunter, E.: New insight into the disappearing Arctic sea ice, EOS Trans. Am. Geophys. Union, 87, 509–511, 2006. a
Gimeno, L., Vázquez, M., Eiras-Barca, J., Sorí, R., Algarra, I., and Nieto, R.: Atmospheric moisture transport and the decline in Arctic Sea ice, WIREs Clim. Change, 10, 1–12, https://doi.org/10.1002/wcc.588, 2019. a
Gong, T. and Luo, D.: Ural blocking as an amplifier of the Arctic sea ice decline in winter, J. Climate, 30, 2639–2654, https://doi.org/10.1175/JCLI-D-16-0548.1, 2017. a
Gong, T., Feldstein, S., and Lee, S.: The role of downward infrared radiation in the recent Arctic winter warming trend, J. Climate, 30, 4937–4949, https://doi.org/10.1175/JCLI-D-16-0180.1, 2017. a
Graversen, R. G. and Burtu, M.: Arctic amplification enhanced by latent energy transport of atmospheric planetary waves, Q. J. Roy. Meteor. Soc., 142, 2046–2054, https://doi.org/10.1002/qj.2802, 2016. a, b
Hauswirth, D.: Dynamic drivers of heat and moisture transport into the Arctic, Master's thesis, ETH Zurich, Zurich, Switzerland, 2020. a
Henderson, G. R., Barrett, B. S., Wachowicz, L. J., Mattingly, K. S., Preece, J. R., and Mote, T. L.: Local and remote atmospheric circulation drivers of Arctic change: A review, Front. Earth Sci., 9, 709896, https://doi.org/10.3389/feart.2021.709896, 2021. a, b
Hermann, M., Papritz, L., and Wernli, H.: A Lagrangian analysis of the dynamical and thermodynamic drivers of large-scale Greenland melt events during 1979–2017, Weather Clim. Dynam., 1, 497–518, https://doi.org/10.5194/wcd-1-497-2020, 2020. a
Hersbach, H., Bell, B., Berrisford, P., Hirahara, S., Horányi, A., Muñoz-Sabater, J., Nicolas, J., Peubey, C., Radu, R., Schepers, D., Simmons, A., Soci, C., Abdalla, S., Abellan, X., Balsamo, G., Bechtold, P., Biavati, G., Bidlot, J., Bonavita, M., De Chiara, G., Dahlgren, P., Dee, D., Diamantakis, M., Dragani, R., Flemming, J., Forbes, R., Fuentes, M., Geer, A., Haimberger, L., Healy, S., Hogan, R. J., Hólm, E., Janisková, M., Keeley, S., Laloyaux, P., Lopez, P., Lupu, C., Radnoti, G., de Rosnay, P., Rozum, I., Vamborg, F., Villaume, S., and Thépaut, J.-N.: The ERA5 global reanalysis, Q. J. Roy. Meteor. Soc., 146, 1999–2049, https://doi.org/10.1002/qj.3803, 2020. a
Holton, J. R. and Hakim, G. J.: An introduction to dynamic meteorology, Academic Press, London, UK, 2012. a
Kapsch, M.-L., Graversen, R. G., and Tjernström, M.: Springtime atmospheric energy transport and the control of Arctic summer sea-ice extent, Nat. Clim. Change, 3, 744–748, https://doi.org/10.1038/nclimate1884, 2013. a
Lee, S., Gong, T., Feldstein, S. B., Screen, J. A., and Simmonds, I.: Revisiting the cause of the 1989–2009 Arctic surface warming using the surface energy budget: Downward infrared radiation dominates the surface fluxes, Geophys. Res. Lett., 44, 10654–10661, https://doi.org/10.1002/2017GL075375, 2017. a, b
Liang, M., Czaja, A., and Graversen, R.: Poleward energy transport: Is the standard definition physically relevant at all time scales?, Clim. Dyn., 50, 1785–1797, https://doi.org/10.1007/s00382-017-3722-x, 2018. a, b, c
Liu, C. and Barnes, E. A.: Extreme moisture transport into the Arctic linked to Rossby wave breaking, J. Geophys. Res.-Atmos., 120, 3774–3788, https://doi.org/10.1002/2014JD022796, 2015. a
Luo, B., Luo, D., Wu, L., Zhong, L., and Simmonds, I.: Atmospheric circulation patterns which promote winter Arctic sea ice decline, Environ. Res. Lett., 12, 054017, https://doi.org/10.1088/1748-9326/aa69d0, 2017. a, b, c, d, e, f
Luo, B., Wu, L., Luo, D., Dai, A., and Simmonds, I.: The winter midlatitude-Arctic interaction: effects of North Atlantic SST and high-latitude blocking on Arctic sea ice and Eurasian cooling, Clim. Dynam., 52, 2981–3004, https://doi.org/10.1007/s00382-018-4301-5, 2019. a, b, c, d
Madonna, E., Hes, G., Li, C., Michel, C., and Siew, P. Y. F.: Control of Barents Sea wintertime cyclone variability by large-scale atmospheric flow, Geophys. Res. Lett., 47, e2020GL090322, https://doi.org/10.1029/2020GL090322, 2020. a
Mayer, M., Tietsche, S., Haimberger, L., Trubouchi, T., Jayer, J., and Zuo, H.: An improved estimate of the coupled Arctic energy budget, J. Climate, 32, 7915–7934, https://doi.org/10.1175/JCLI-D-19-0233.1, 2019. a
Messori, G., Geen, R., and Czaja, A.: On the spatial and temporal variability of atmospheric heat transport in a hierarchy of models, J. Atmos. Sci, 74, 2163–2189, https://doi.org/10.1175/JAS-D-16-0360.1, 2017. a
Messori, G., Woods, C., and Caballero, R.: On the drivers of wintertime temperature extremes in the high Arctic, J. Climate, 31, 1597–1618, https://doi.org/10.1175/JCLI-D-17-0386.1, 2018. a, b, c, d, e
Mortin, J., Svensson, G., Graversen, R. G., Kapsch, M.-L., Stroeve, J. C., and Boisvert, L. N.: Melt onset over Arctic sea ice controlled by atmospheric moisture transport, Geophys. Res. Lett., 43, 6636–6642, https://doi.org/10.1002/2016GL069330, 2016. a
Naakka, T., Nygård, T., Vihma, T., Sedlar, J., and Graversen, R. G.: Atmospheric moisture transport between mid-latitudes and the Arctic: Regional, seasonal and vertical distributions, Int. J. Climatol., 39, 2862–2879, https://doi.org/10.1002/joc.5988, 2019. a, b, c, d, e
Nygård, T., Naakka, T., and Vihma, T.: Horizontal moisture transport dominates the regional moistening patterns in the Arctic, J. Climate, 33, 6793–6807, https://doi.org/10.1175/JCLI-D-19-0891.1, 2020. a
Orbe, C., Newman, P. A., Waugh, D. W., Holzer, M., Oman, L. D., Li, F., and Polvani, L. M.: Airmass origin in the Arctic. Part I: Seasonality, J. Climate, 28, 4997–5014, https://doi.org/10.1175/JCLI-D-14-00720.1, 2015. a
Papritz, L.: Arctic Lower-tropospheric warm and cold extremes: Horizontal and vertical transport, diabatic processes, and linkage to synoptic circulation features, J. Climate, 33, 993–1016, https://doi.org/10.1175/JCLI-D-19-0638.1, 2020. a, b, c, d, e, f
Papritz, L. and Dunn-Sigouin, E.: What configuration of the atmospheric circulation drives extreme net and total moisture transport into the Arctic, Geophys. Res. Lett., 47, e2020GL089769, https://doi.org/10.1029/2020GL089769, 2020. a, b, c, d, e
Papritz, L. and Spengler, T.: A Lagrangian climatology of wintertime cold air outbreaks in the Irminger and Nordic seas and their role in shaping air-sea heat fluxes, J. Climate, 30, 2717–2737, https://doi.org/10.1175/JCLI-D-16-0605.1, 2017. a, b, c
Papritz, L., Pfahl, S., Sodemann, H., and Wernli, H.: A climatology of cold air outbreaks and their impact on air-sea heat fluxes in the high-latitude South Pacific, J. Climate, 28, 342–364, https://doi.org/10.1175/JCLI-D-14-00482.1, 2015. a, b, c
Park, D.-S. R., Lee, S., and Feldstein, S. B.: Attribution of the recent winter sea ice decline over the Atlantic sector of the Arctic Ocean, J. Climate, 28, 4027–4033, https://doi.org/10.1175/JCLI-D-15-0042.1, 2015a. a
Park, H.-S., Lee, S., Son, S.-W., Feldstein, S. B., and Kosaka, Y.: The impact of poleward moisture and sensible heat flux on Arctic winter sea ice variability, J. Climate, 28, 5030–5040, https://doi.org/10.1175/JCLI-D-15-0074.1, 2015b. a
Rinke, A., Segger, B., Crewell, S., Maturilli, M., Naakka, T., Nygård, T., Vihma, T., Alshawaf, F., G. Dick, J. W., and Keller, J.: Trends of vertically integrated water vapor over the Arctic during 1979–2016: Consistent moistening all over?, J. Climate, 32, 6097–6116, https://doi.org/10.1175/JCLI-D-19-0092.1, 2019. a
Ruggieri, P., Alvarez-Castro, M. C., Athanasiadis, P., Bellucci, A., Materia, S., and Gualdi, S.: North Atlantic Circulation Regimes and Heat Transport by Synoptic Eddies, J. Climate, 33, 4769–4785, https://doi.org/10.1175/JCLI-D-19-0498.1, 2020. a
Schuster, L., Maussion, F., Langhamer, L., and Moseley, G. E.: Lagrangian detection of precipitation moisture sources for an arid region in northeast Greenland: relations to the North Atlantic Oscillation, sea ice cover, and temporal trends from 1979 to 2017, Weather Clim. Dynam., 2, 1–17, https://doi.org/10.5194/wcd-2-1-2021, 2021. a
Screen, J. A. and Simmonds, I.: Increasing fall-winter energy loss from the Arctic Ocean and its role in Arctic temperature amplification, Geophys. Res. Lett., 37, L16707, https://doi.org/10.1029/2010GL044136, 2010. a
Serreze, M. C., Barrett, A. P., Slater, A. G., Woodgate, R. A., Aagaard, K., Lammers, R. B., Steele, M., Moritz, R., Meredith, M., and Lee, C. M.: The large-scale freshwater cycle of the Arctic, J. Geophys. Res., 111, C11010, https://doi.org/10.1029/2005JC003424, 2006. a
Singh, H. K. A., Bitz, C. M., Donohoe, A., and Rasch, P. J.: A source–receptor perspective on the polar hydrologic cycle: Sources, seasonality, and Arctic–Antarctic parity in the hydrologic cycle response to CO2 doubling, J. Climate, 30, 9999–10017, https://doi.org/10.1175/JCLI-D-16-0917.1, 2017. a, b, c
Sodemann, H., Schwierz, C., and Wernli, H.: Interannual variability of Greenland winter precipitation sources: Lagrangian moisture diagnostic and North Atlantic Oscillation influence, J. Geophys. Res., 113, D03107, https://doi.org/10.1029/2007JD008503, 2008. a, b, c, d, e
Sorteberg, A. and Walsh, J. E.: Seasonal cyclone variability at 70∘ N and its impact on moisture transport into the Arctic, Tellus A, 60, 570–586, 2008. a, b
Sprenger, M. and Wernli, H.: The LAGRANTO Lagrangian analysis tool – version 2.0, Geosci. Model Dev., 8, 2569–2586, https://doi.org/10.5194/gmd-8-2569-2015, 2015. a
Sprenger, M., Fragkoulidis, G., Binder, H., Croci-Maspoli, M., Graf, P., Grams, C. M., Knippertz, P., Madonna, E., Schemm, S., Škerlak, B., and Wernli, H.: Global climatologies of Eulerian and Lagrangian flow features based on ERA-Interim, B. Am. Meteorol. Soc., 98, 1739–1748, https://doi.org/10.1175/BAMS-D-15-00299.2, 2017. a
Trenberth, K. E.: Climate Diagnostics from Global Analyses: Conservation of Mass in ECMWF Analyses, J. Climate, 4, 707–722, https://doi.org/10.1175/1520-0442(1991)004<0707:CDFGAC>2.0.CO;2, 1991. a
Vázquez, M., Nieto, R., Drumond, A., and Gimeno, L.: Moisture transport into the Arctic: Source-receptor relationships and the roles of atmospheric circulation and evaporation, J. Geophys. Res.-Atmos., 121, 13493–13509, https://doi.org/10.1002/2016JD025400, 2016. a, b, c
Vihma, T., Screen, J., Tjernström, M., Newton, B., Zhang, X., Popova, V., Deser, C., Holland, M., and Prowse, T.: The atmospheric role in the Arctic water cycle: A review on processes, past and future changes, and their impacts, J. Geophys. Res.-Biogeo., 121, 586–620, https://doi.org/10.1002/2015JG003132, 2016. a
Villamil-Otero, G. A., Zhang, J., He, J., and Zhang, X.: Role of extratropical cyclones in the recently observed increase in poleward moisture transport into the Arctic Ocean, Adv. Atmos. Sci., 35, 85–94, https://doi.org/10.1007/s00376-017-7116-0, 2018. a
Ward, J. H.: Hierarchical grouping to optimize an objective function, J. Am. Stat. Assoc., 58, 236–244, https://doi.org/10.1080/01621459.1963.10500845, 1963. a
Wernli, H. and Davies, H. C.: A Lagrangian-based analysis of extratropical cyclones. I: The method and some applications, Q. J. Roy. Meteor. Soc., 123, 467–489, https://doi.org/10.1002/qj.49712353811, 1997. a
Wernli, H. and Schwierz, C.: Surface cyclones in the ERA-40 dataset (1958–2001). Part I: Novel identification method and global climatology, J. Atmos. Sci., 63, 2486–2507, https://doi.org/10.1175/JAS3766.1, 2006. a
Woods, C. and Caballero, R.: The role of moist intrusions in winter Arctic warming and sea ice decline, J. Climate, 29, 4473–4485, https://doi.org/10.1175/JCLI-D-15-0773.1, 2016. a, b, c
Woods, C., Caballero, R., and Svensson, G.: Large-scale circulation associated with moisture intrusions into the Arctic during winter, Geophys. Res. Lett., 40, 4717–4721, https://doi.org/10.1002/grl.50912, 2013. a, b, c, d, e, f, g
Zhong, L., Hua, L., and Luo, D.: Local and external moisture sources for the Arctic warming over the Barents–Kara seas, J. Climate, 31, 1963–1982, https://doi.org/10.1175/JCLI-D-17-0203.1, 2018. a, b, c, d
The shorthand indicates integration over the polar cap poleward of 70∘ N.