the Creative Commons Attribution 4.0 License.
the Creative Commons Attribution 4.0 License.
 | 18 Nov 2022
Non-linear intensification of monsoon low-pressure systems by the BSISO
Kieran M. R. Hunt
Andrew G. Turner
More than half of the rainfall brought to the Indian subcontinent by the summer monsoon is associated with low-pressure systems (LPSs). Yet their relationship with the boreal summer intraseasonal oscillation (BSISO) – the dominant intraseasonal forcing on the monsoon – is only superficially understood. Using reanalysis data, we explore the relationship between the BSISO and LPS intensity, propagation and precipitation, and associated underlying mechanisms.
The BSISO has a large impact on mean monsoon vorticity and rainfall as it moves northward – maximising both in phases 2–3 over southern India and phases 5–6 over northern India – but a much weaker relationship with total column water vapour. We present evidence that LPS genesis also preferentially follows these phases of the BSISO. We identify significant relationships between BSISO phase and LPS precipitation and propagation: for example, during BSISO phase 5, LPSs over northern India produce 51 % heavier rainfall and propagate northwestward 20 % more quickly. Using a combination of moisture flux linearisation and quasi-geostrophic theory, we show that these relationships are driven by changes to the underlying dynamics rather than the moisture content or thermodynamic structure of the monsoon.
Using the example of LPSs over northern India during BSISO phase 5, we show that the vertical structure of anomalous vorticity can be split into contributions from the BSISO background circulation and the non-linear response of the LPS to anomalous BSISO circulation. Complementary hypotheses emerge about the source of this non-linear vorticity response: non-linear frictional convergence and secondary barotropic growth. We show that both are important. The BSISO imparts greater meridional shear on the background state, supporting LPS intensification. The BSISO background and non-linear LPS response both contribute significantly to anomalous boundary layer convergence, and we show through vortex budget arguments that the former supports additional LPS intensification in boundary layer, while the latter supports faster westward propagation.
This work therefore yields important insights into the scale interactions controlling one of the dominant synoptic systems contributing to rainfall during the monsoon.
- Article
(11667 KB) - Full-text XML
-
Supplement
(7687 KB) - BibTeX
- EndNote


The summer monsoon impacts the Indian subcontinent from June to September each year where it is responsible for 80 % of the annual rainfall, totalling almost 1 m over the season (Turner and Annamalai, 2012). The summer monsoon is very heterogeneous in both space and time, being subject to significant large-scale forcing from intraseasonal oscillations that result in extended periods of regional drought or deluges (Krishnamurthy and Shukla, 2000; Goswami and Ajayamohan, 2001; Pai et al., 2016). But the monsoon is also frequently punctuated by low-pressure systems (LPSs), of which there are usually about 15–20 per season and which are responsible for more than half of the total seasonal rainfall (Boos et al., 2015; Hunt and Fletcher, 2019).
1.1 The relationship between the BSISO and the South Asian summer monsoon
The boreal summer intraseasonal oscillation (BSISO) is the strongest external driver of intraseasonal variability in the summer monsoon (Kikuchi, 2021). While boreal winter is dominated by the Madden–Julian oscillation (MJO) that propagates eastward in time, the BSISO has an additional northward component (Kikuchi et al., 2012). This means that its passage is typically associated with northwest–southeast-orientated bands of alternately enhanced and suppressed convection that propagate to either the north or the northeast. Like the MJO (Wheeler and Hendon, 2004), it is typically separated into eight phases representing octants of the phase space describing its leading modes of variability. Phase 1 is usually associated with enhanced convection over the equatorial Indian Ocean, phases 2 and 3 with enhanced convection over the Indian Ocean and East Asia, phases 4 and 5 with enhanced convection over India and the Maritime Continent, phases 6 and 7 with enhanced convection over the Bay of Bengal and South China Sea, and phase 8 with enhanced convection over the western North Pacific (Lee et al., 2013). The average time between each phase is about 5.5 d (Lee et al., 2013).
1.2 The relationship between monsoon LPSs and intraseasonal variability
Monsoon low-pressure systems (LPSs) are synoptic-scale circulations that typically originate over the Bay of Bengal before passing northwestward over the subcontinent. Various studies that have probed their structure using radiosondes, satellites, or reanalyses show that they are associated with strong central vorticity, a warm-over-cold thermal structure, and a precipitation maximum to the southwest of their centre (Godbole, 1977; Sarker and Choudhary, 1988; Hurley and Boos, 2015; Hunt et al., 2016). Although associated with relatively light winds, LPSs can bring extremely heavy precipitation to India, occasionally resulting in widespread flooding (Hunt and Menon, 2019; Thomas et al., 2021; Suhas et al., 2022).
Previous research on the relationship between LPSs and monsoon intraseasonal variability has often reduced the latter to active and break phases. Such studies have invariably found that LPS activity is reduced during break phases and enhanced during active phases (e.g. Goswami et al., 2003; Krishnamurthy and Ajayamohan, 2010). More recent studies have explicitly explored the relationship between LPSs and the BSISO. Hatsuzuka and Fujinami (2017) showed that LPSs more frequently impacted Bangladesh when the BSISO was active over the northern Bay of Bengal. Karmakar et al. (2021) found that strong LPSs – known as monsoon depressions – formed more frequently when the BSISO was active over the Bay of Bengal and attributed this to favourable changes in large-scale vorticity and moist static energy. Deoras et al. (2021) found that the genesis of low-pressure systems increased significantly over Sri Lanka when the BSISO was active there (i.e. in phases 2 and 3) and increased significantly over the Bay of Bengal as the BSISO moved northwards (i.e. into phases 4 and 5).
So, while it is clear that the BSISO has a significant effect on LPS genesis, we still do not know how the relationship between the two affects other important LPS characteristics – such as propagation, precipitation, and intensity. These have obvious implications for LPS predictability and impacts.
This study is laid out as follows: Sect. 2 describes the data used; our results are then broken down into subsections exploring the relationship between the BSISO and the mean monsoon (Sect. 3.1), LPS genesis and propagation (Sect. 3.2), LPS precipitation (Sect. 3.3), and LPS intensification (Sect. 3.4). We discuss the implications and shortcomings of our work and conclude in Sect. 4.
2.1 ERA5: the fifth-generation ECMWF global reanalysis
To investigate the variations in structure of the monsoon and LPSs in response to modulation by the BSISO, we use data from the ECMWF ERA5 reanalysis (Hersbach et al., 2020). Data are available globally, at hourly resolution from 1950 onwards, on a 0.25∘ grid. Data are available over 37 pressure levels from 1000 to 0.01 hPa, as well as at or near the surface. Data are assimilated into the forecasting system from a large variety of sources, including satellites, automatic weather stations, and radiosondes. Data were downloaded using the interface from https://doi.org/10.24381/cds.bd0915c6 (Hersbach et al., 2018).
2.2 BSISO indices
Data for the BSISO were downloaded from http://iprc.soest.hawaii.edu/users/kazuyosh/Bimodal_ISO.html (last access: 14 November 2022; Kikuchi, 2022), whose methodology is described in Lee et al. (2013). In short, empirical orthogonal function analysis is applied to outgoing longwave radiation and 850 hPa zonal wind fields over a region covering most of South and Southeast Asia (40–160∘ E, 10∘ S–40∘ N). The first two principal components then describe a phase space that describes the northward-propagating variability often linked with MJO activity. This phase space is described in polar coordinates, giving the BSISO an amplitude and a phase. Although the phase is a continuous circular variable, it is typically discretised into integers 1–8.
It is used to assess the role of large-scale intraseasonal variability in modulating the diurnal cycle of precipitation over the Himalayas. The dataset has daily resolution, available from 1979–2018. It contains the normalised values of the first two principal components, as well as the resulting phase and amplitude.
2.3 LPS track dataset
We use the database of low-pressure system (LPS) tracks from Hunt and Fletcher (2019) in this study. Using 6-hourly ERA-Interim data, they tracked LPSs by computing the mean relative vorticity in the 900–800 hPa layer, then performing a spectral truncation at T63 (∼200 km at Equator) to filter out short-wavelength noise. They then identified regions of positive relative vorticity within this field and determined the centroid location for each one. These centroids were then linked in time, subject to constraints in distance and steering winds, to form candidate LPS tracks. This algorithm has been used for monsoon LPSs by a number of authors (e.g. Martin et al., 2020; Dong et al., 2020; Roy and Rao, 2022). Track data are available at https://doi.org/10.5281/zenodo.5575336 (Hunt, 2021). For this study, we consider only those LPSs that impact the Indian subcontinent, rejecting tracks that do not pass through 70–90∘ E, 4–24∘ N. We also only consider LPSs that spin up during the summer monsoon, i.e. between 1 June and 30 September. This leaves a total sample of 885 tracks from 1979 to 2018.
We first consider the effect of the BSISO on the mean monsoon (Sect. 3.1) and general LPS genesis and propagation behaviour (Sect. 3.2), before examining the effect on LPS precipitation and the role played by quasi-geostrophic and diabatic processes (Sect. 3.3) and finally the role of non-linear interactions (Sect. 3.4).
3.1 Effect of the BSISO on the mean monsoon
The interaction between the BSISO and the summer monsoon is often thought to be the primary cause of so-called “active” and “break” monsoon periods (Wang and Xie, 1997; Webster et al., 1998). In reality, the relationship is slightly more complicated – the BSISO is described by a continuous two-dimensional phase space, whereas the active/break periods describe points on this phase space with extremes of locally enhanced/suppressed convection over the monsoon core zone of central India. Figure 1 shows the effect of the passage of the BSISO over South Asia in a novel manner. Rather than showing traditional composites of one map for each phase, instead we attempt to relate BSISO phases to the largest anomalies on one map. This relies on the propagating nature of the BSISO, such that the largest anomalies for each phase will occur at different locations. For each grid point, we thus determine under which BSISO phase the (a) highest and (b) lowest monsoon rainfall occurs; the BSISO phase is indicated by the hue, while the darkness of the colour indicates the relative intensity (see figure caption). Following convention, we assign “phase 0” to days on which the standardised magnitude of the BSISO is less than one – that is, no appreciable BSISO is present. The BSISO clearly has a big impact on monsoon rainfall over much of the subcontinent, where particular phases are capable of increasing rainfall by more than 50 % and more than double it in some areas. The northward propagation is evident here too, while the strongest anomalies are found over the ocean and southern peninsular India. Phases 3 and 4 are associated with the greatest increase in rainfall over Sri Lanka and southern India, whereas phase 6 is associated with the greatest increase in much of the north of the country. The role of the BSISO in suppressing rainfall is less obvious, although the rain shadow (southeast India and nearby Bay of Bengal) is strongly affected by phases 6, 7, and 8 and rainfall across the north is consistently, if weakly, suppressed in phases 2 and 3.
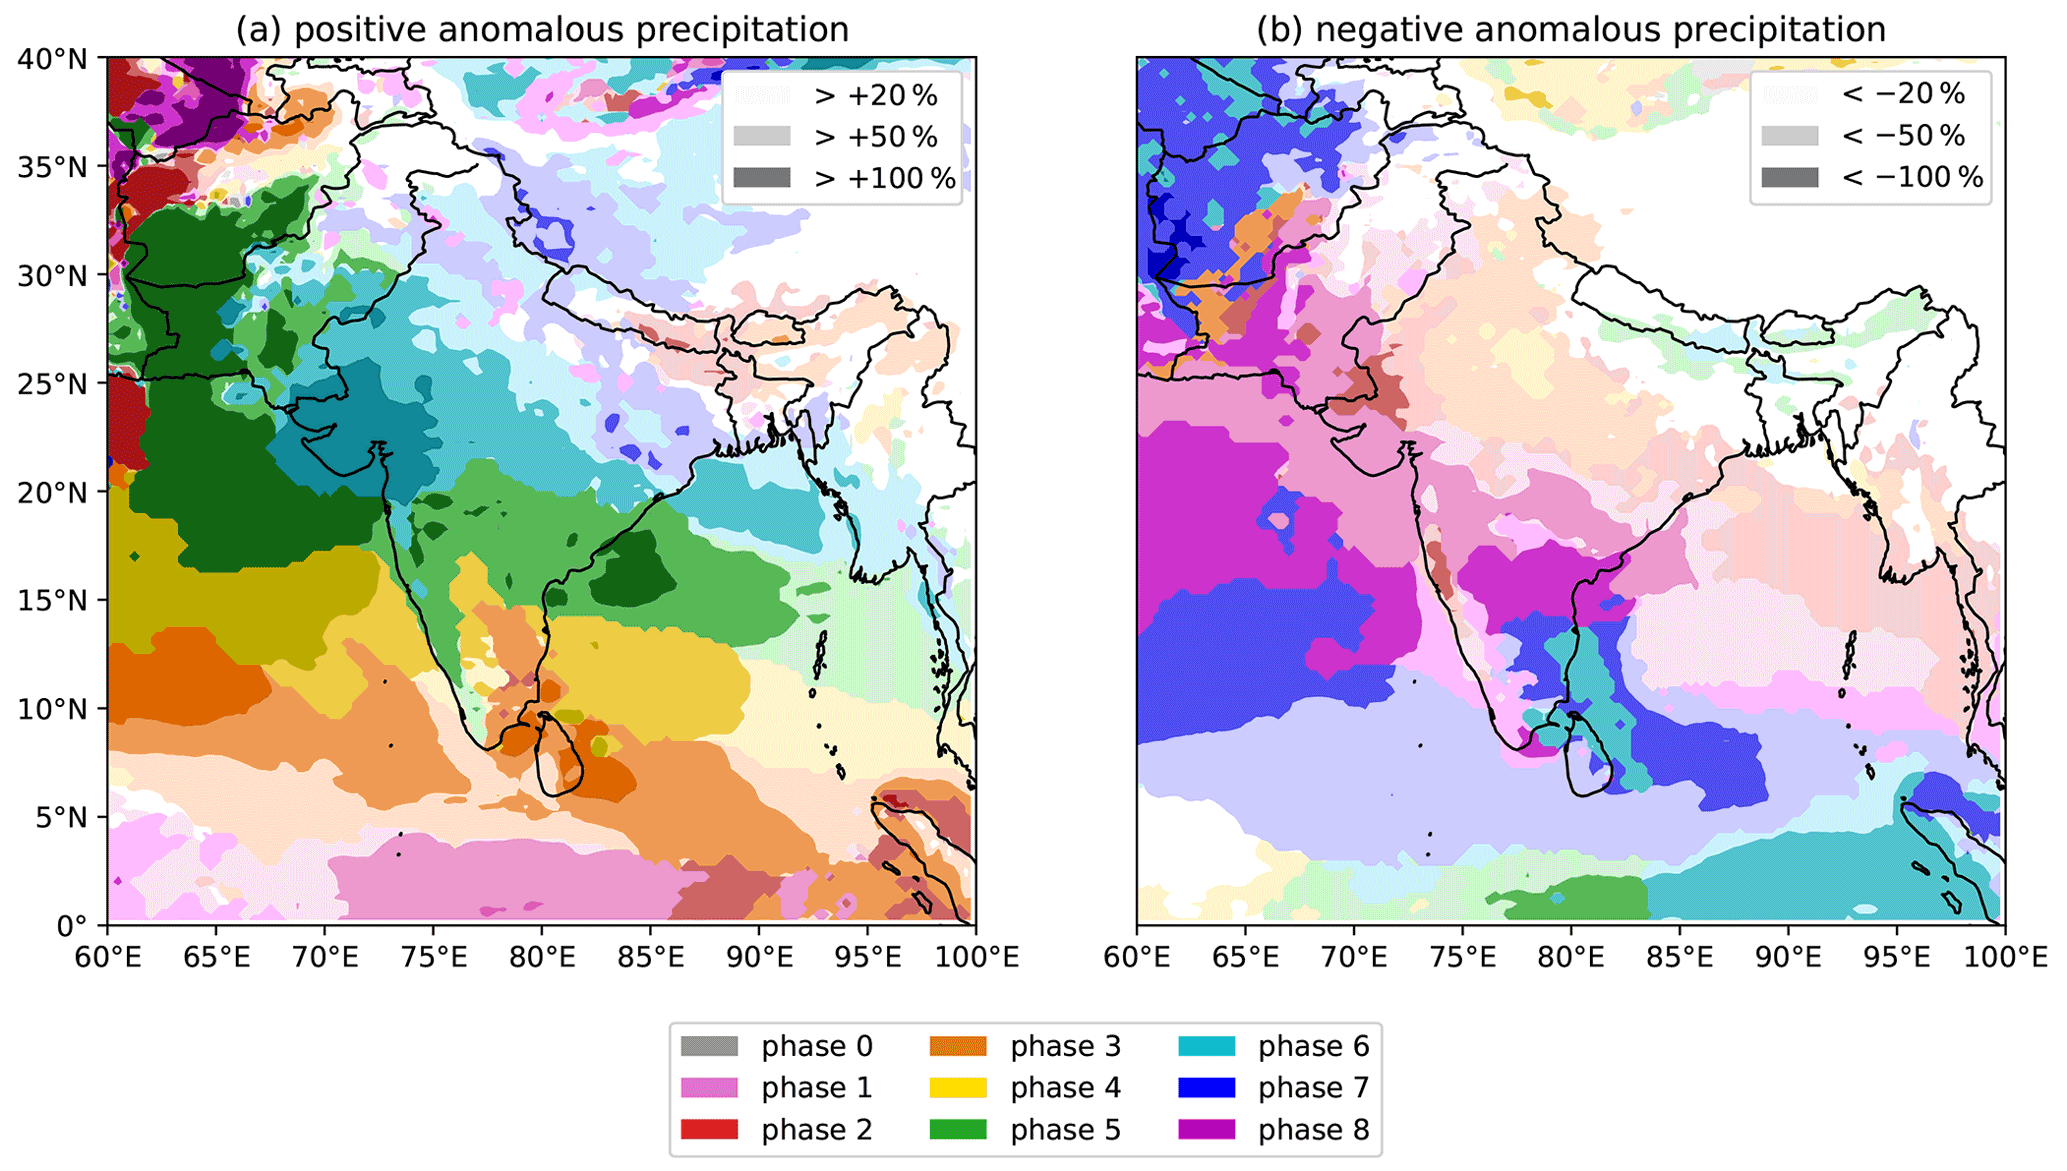
Figure 1The effect of the BSISO on monsoon precipitation over South Asia. Colours indicate the BSISO phase for which mean precipitation is (a) the highest and (b) the lowest. Three levels of lightness for each colour denote the difference between the mean precipitation in that phase and the full climatology, stratified at ±20 %, ±50 %, and ±100 %. A colourblind-friendly version of this figure, with the anomalies plotted separately for each BSISO phase, is given in Fig. S1 in the Supplement.
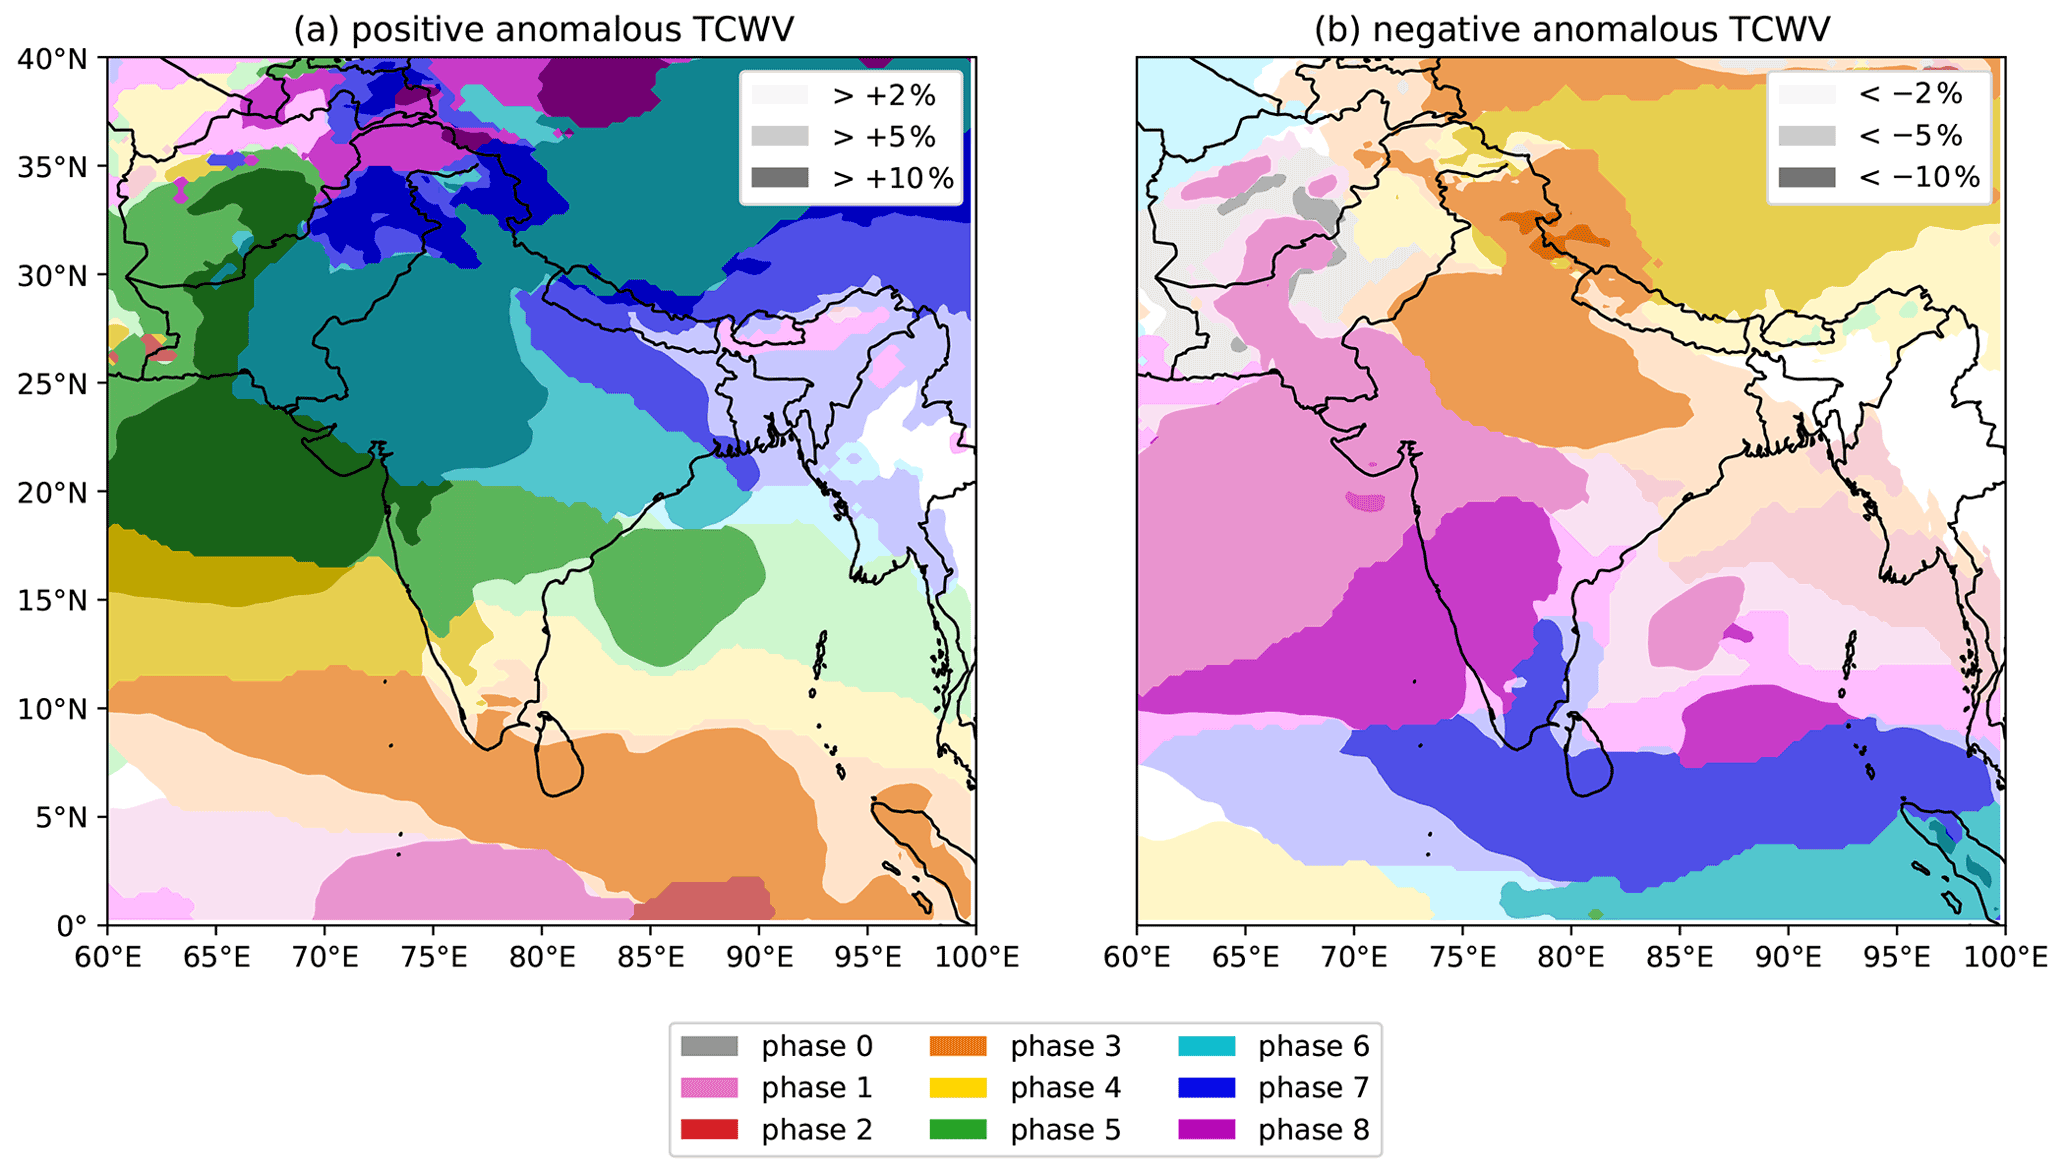
Figure 2The effect of the BSISO on total column water vapour during the summer monsoon over South Asia. Colours indicate the BSISO phase for which mean TCWV is (a) the highest and (b) the lowest. Three levels of lightness for each colour denote the difference between the mean TCWV in that phase and the full climatology, stratified at ±2 %, ±5 %, and ±10 %. A colourblind-friendly version of this figure, with the anomalies plotted separately for each BSISO phase, is given in Fig. S2.
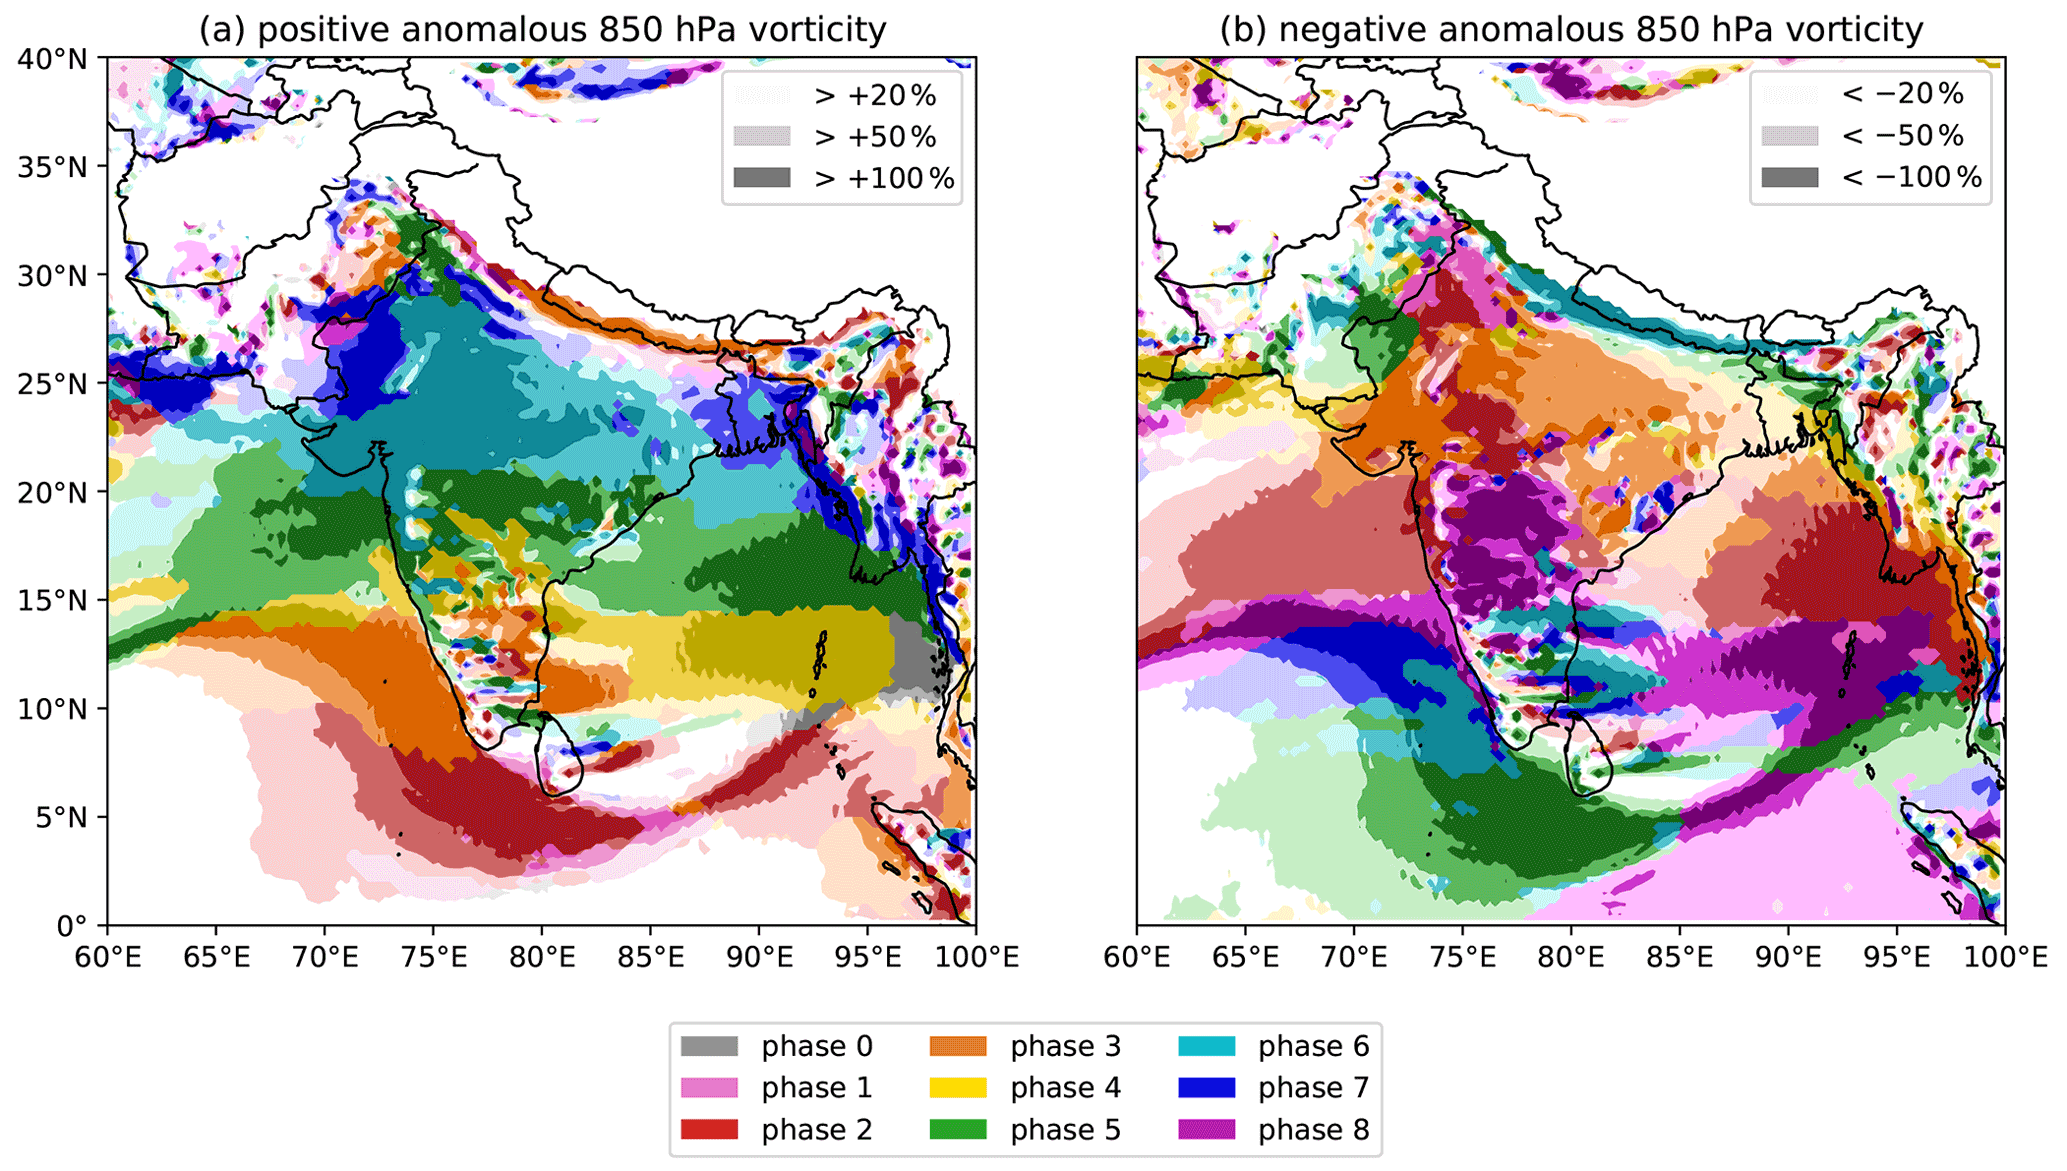
Figure 3The effect of the BSISO on 850 hPa relative vorticity during the summer monsoon over South Asia. Colours indicate the BSISO phase for which mean relative vorticity is (a) the highest and (b) the lowest. Three levels of lightness for each colour denote the difference between the mean relative vorticity in that phase and the full climatology, stratified at ±20 %, ±50 % and ±100 %. Areas where surface elevation is higher than 1500 m are masked. A colourblind-friendly version of this figure, with the anomalies plotted separately for each BSISO phase, is given in Fig. S3.
Differences in long-term average rainfall must be accounted for by changes to either the available moisture – for which we use total column water vapour (TCWV), shown in Fig. 2 – or the underlying dynamics – for which we use low-level relative vorticity, shown in Fig. 3. Both the TCWV and vorticity have similar responses to the BSISO as the precipitation: amplification of the climatological signal in phases 3 to 6 moving from south to north respectively, and suppression of the climatological signal by phases 6, 7, and 8 in the south and phases 2 and 3 in the north. However, there is one important difference: the effect on TCWV is much weaker. This is partially due to thermodynamic constraints – the monsoonal lower troposphere is already nearly saturated and so can hold little additional moisture. We also note the effect on both vorticity and TCWV is almost equal and opposite when three BSISO phases apart, even though the effect is much weaker on the latter. For example, the region of enhanced vorticity south of India and Sri Lanka associated with phase 2 is similarly suppressed in phase 5 – and thus the circulation response to active and suppressed BSISO phases is approximately symmetric. This is the same pattern reported in Kikuchi et al. (2012) and Lee et al. (2013). Together, these suggest that the control exerted by the BSISO on LPSs is more likely via the monsoon circulation.
3.2 Effect of the BSISO on LPS genesis and propagation
As discussed in the Introduction, while recent studies have shown a strong relationship between locally active BSISO conditions and LPS genesis frequency (Hatsuzuka and Fujinami, 2017; Karmakar et al., 2021; Deoras et al., 2021), they have typically been limited to regional analysis. We saw in Figs. 2 and 3 how large-scale variables associated with the monsoon respond dynamically to the northward propagation of the BSISO. These variables – low-level vorticity and total column water vapour – have also been shown to be important predictors of the genesis of stronger monsoon depressions (Ditchek et al., 2016), and so we hypothesise that the broader class of LPSs responds in a similar way.
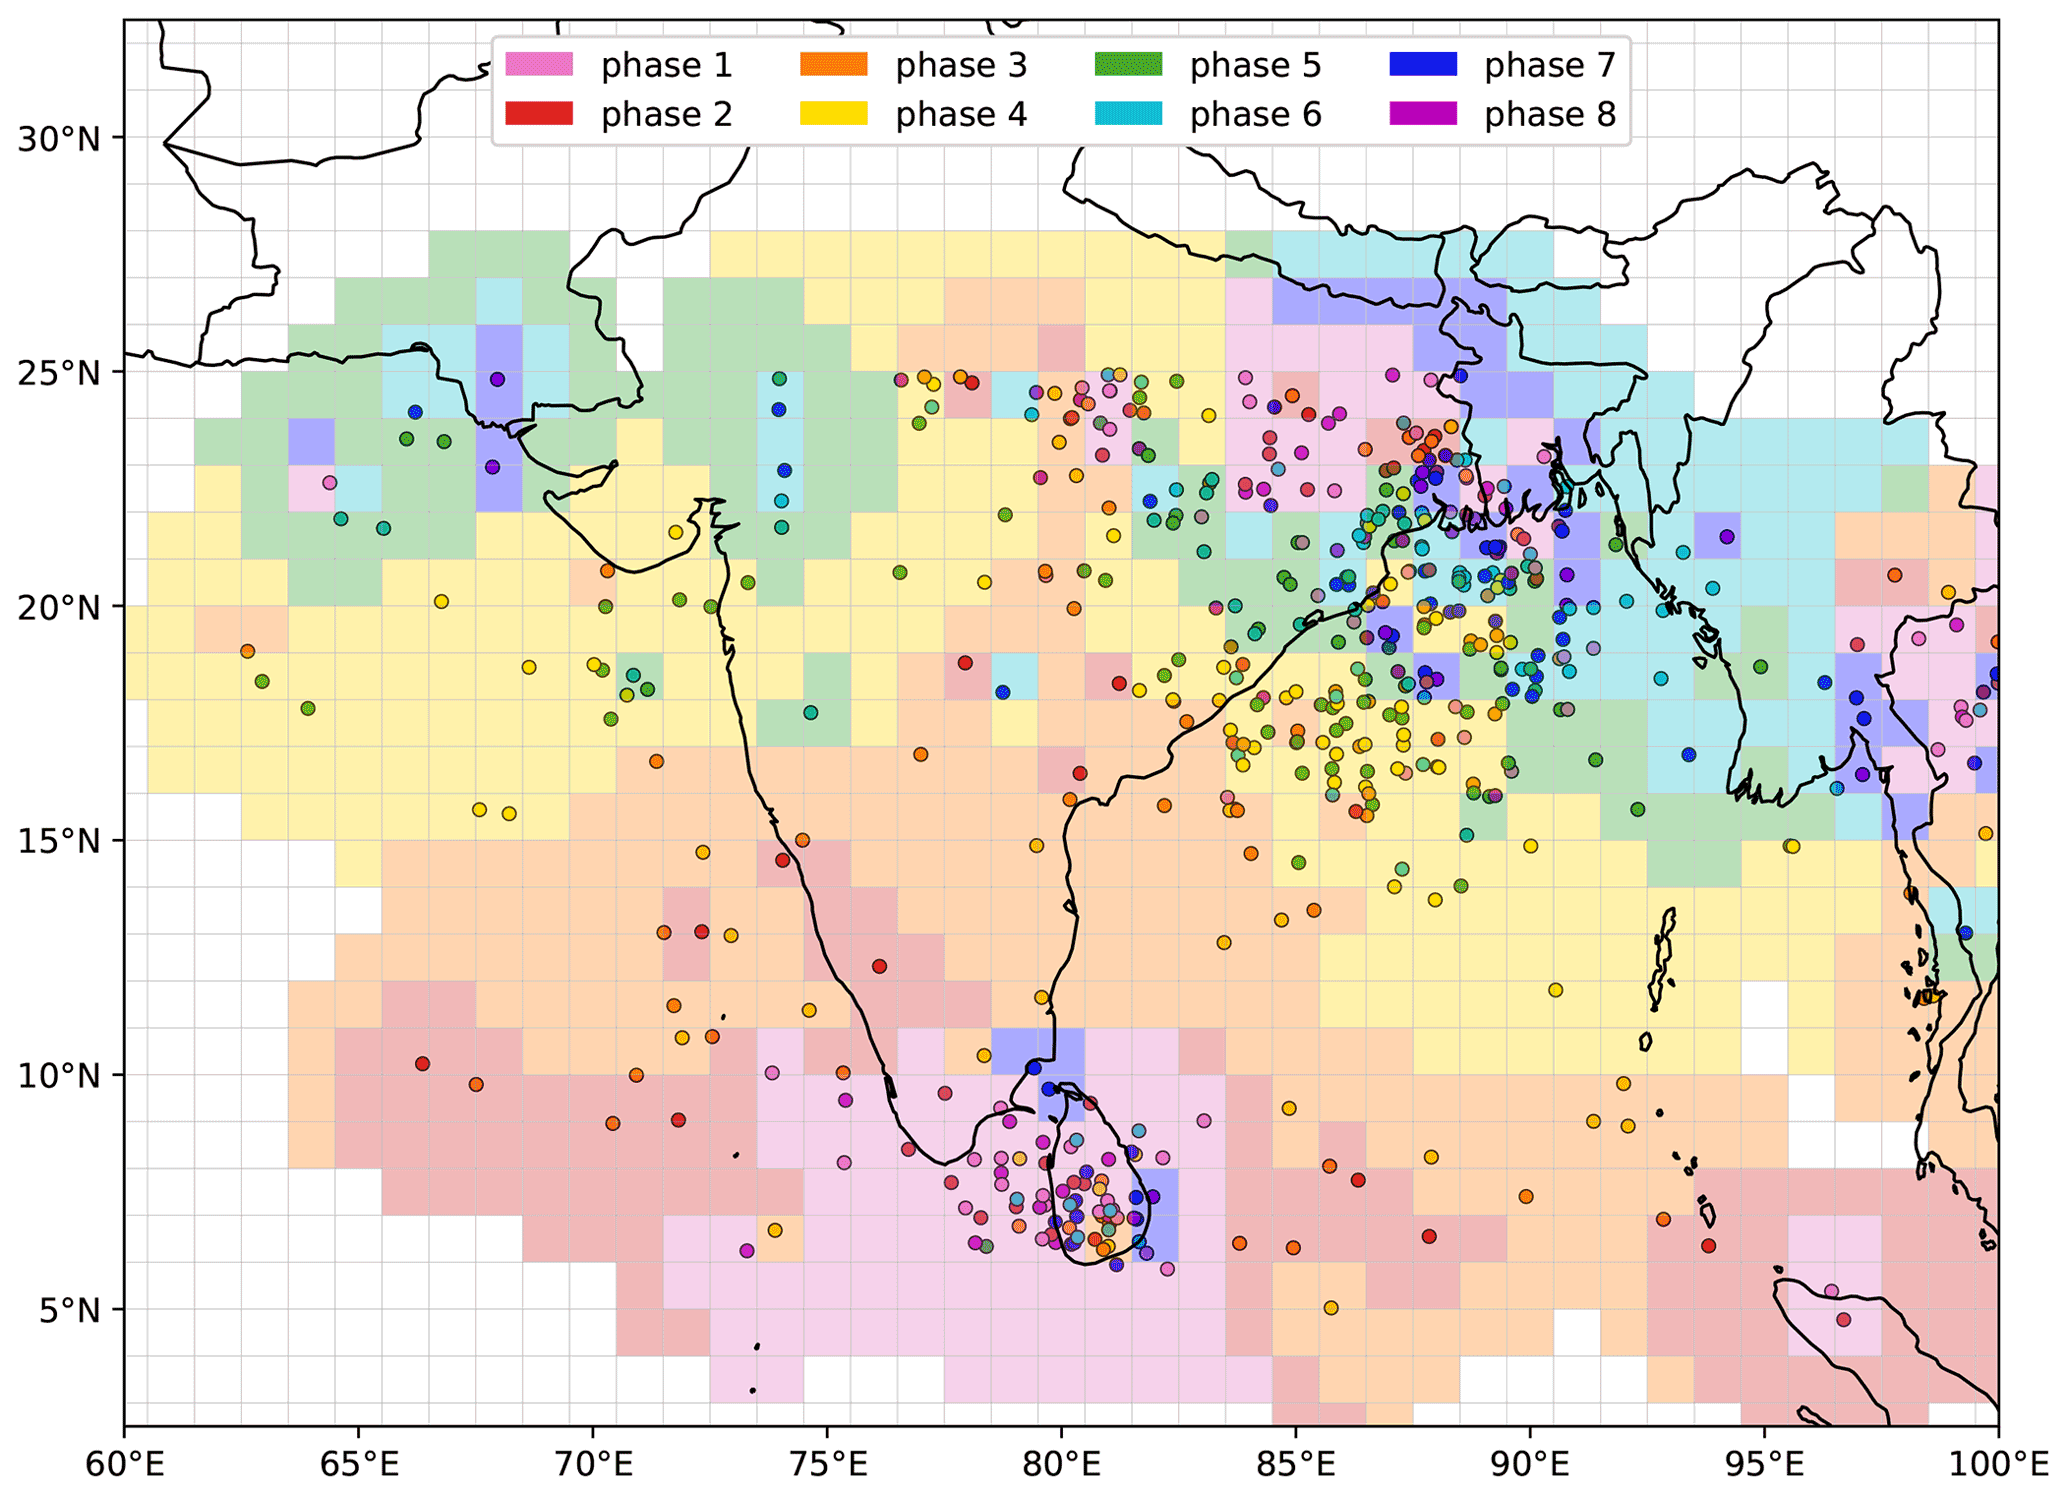
Figure 4The effect of the BSISO on monsoon LPS genesis. LPS genesis points (June–September 1979–2018) are coloured according to the phase of the BSISO in which they occurred. The background field estimates these values over a 1∘ grid by averaging all points using an inverse-square distance weighting. Grid squares are not coloured if there is no LPS genesis within 300 km during the analysis period. Genesis points occurring when the amplitude of the BSISO is less than one – about 41 % of the total sample – are not included.
We test this two ways in Fig. 4. Firstly, we plot the genesis locations of all 523 LPSs that spun up during a defined phase of the BSISO (i.e. in which the amplitude exceeds one), colouring those points by the active phase at the time. Secondly, to test coherence, we convert these points into a gridded field: for each point (i,j) on a 1∘ × 1∘ grid, the mean phase is computed over all genesis points, weighted by the inverse square of their distances to that grid point, while taking into account the fact that BSISO phase is a circular variable, i.e.
where
where ϕp is the BSISO phase associated with LPS p and the weights wpij are given by
Here, is a function describing the geodesic separation between two longitude–latitude pairs (x1,y1) and (x2,y2), and the subscript p indicates individual LPS genesis points which are to be summed over in Eq. (2).
We see a strong relationship between local BSISO phase and LPS genesis that responds to the northward propagation of the BSISO. LPSs most commonly form over Sri Lanka in phases 7, 8, 1, and 2; LPSs forming during phase 4 predominate over the central Bay of Bengal where the mean LPS genesis rate is slightly lower; and in phase 5 they are in a thin band north of that. Across northern India and the head of the Bay of Bengal, the picture is more mixed, but phases 6, 7, and 8 are evidently the most favourable for genesis. Overall, the mean genesis location for LPSs in each of the eight phases is all significantly different from each other. These results are in agreement with earlier studies but place the relationship into a larger, and spatial, context. We also note that the phases associated with LPS genesis are roughly half a phase1 behind those linked with enhanced low-level vorticity in Fig. 3. We attribute this to the delay between the BSISO producing a favourable environment and the convective response to that environment organising onto a scale that is large enough to reach geostrophic balance and spin up into LPSs. Taking into account all the analysis so far, the general sequence of events is an increase in vorticity, roughly simultaneous with, or slightly leading, an increase in LPS genesis (e.g. during phases 1 and 2 over Sri Lanka), followed by increased TCWV – as the LPS increases upwards surface latent heat flux and vertical moisture transport – and precipitation (e.g. during phase 3 over Sri Lanka). This pattern is confirmed through composite lag analysis using continuous BSISO phases (not shown).
The remaining 362 LPSs that spin up during phase 0 – i.e. when the BSISO amplitude is insufficient for the phase to be well defined – have genesis points distributed similarly to the 523 plotted in Fig. 4, i.e. maxima over the head of the Bay of Bengal and Sri Lanka with additional contributions from the Indo-Gangetic Plain, Arabian Sea, and central Bay of Bengal. This suggests an insignificant relationship between BSISO amplitude and LPS genesis, in agreement with similar results for the MJO (Haertel and Boos, 2017).
As the BSISO significantly affects the large-scale environment in which LPSs are embedded, including moist static energy (Karmakar et al., 2021) and mid-level steering winds (Hsu et al., 2017), we may also expect it to affect LPS propagation, for which the steering winds are a particularly important factor (Boos et al., 2015). To test this hypothesis, we separate LPSs into those either side of 15∘ N – roughly demarcating those forming over or near Sri Lanka and along the southern flank of the monsoonal westerlies from those forming over the head of the Bay of Bengal or within the monsoon trough – since the climatological circulation and effect of the BSISO differ considerably in each region. Based on the 500 hPa geopotential composites presented in Hsu et al. (2017), as well as additional 500 hPa wind composites (not shown), we would expect strong anomalous westward transport of LPSs north of 15∘ N in phases 5 and 6 and strong anomalous eastward transport in phases 8, 1, and 2. Similarly, for systems south of 15∘ N, we would expect strong anomalous westward transport in phases 1 and 2 and strong anomalous eastward transport in phases 5 and 6.
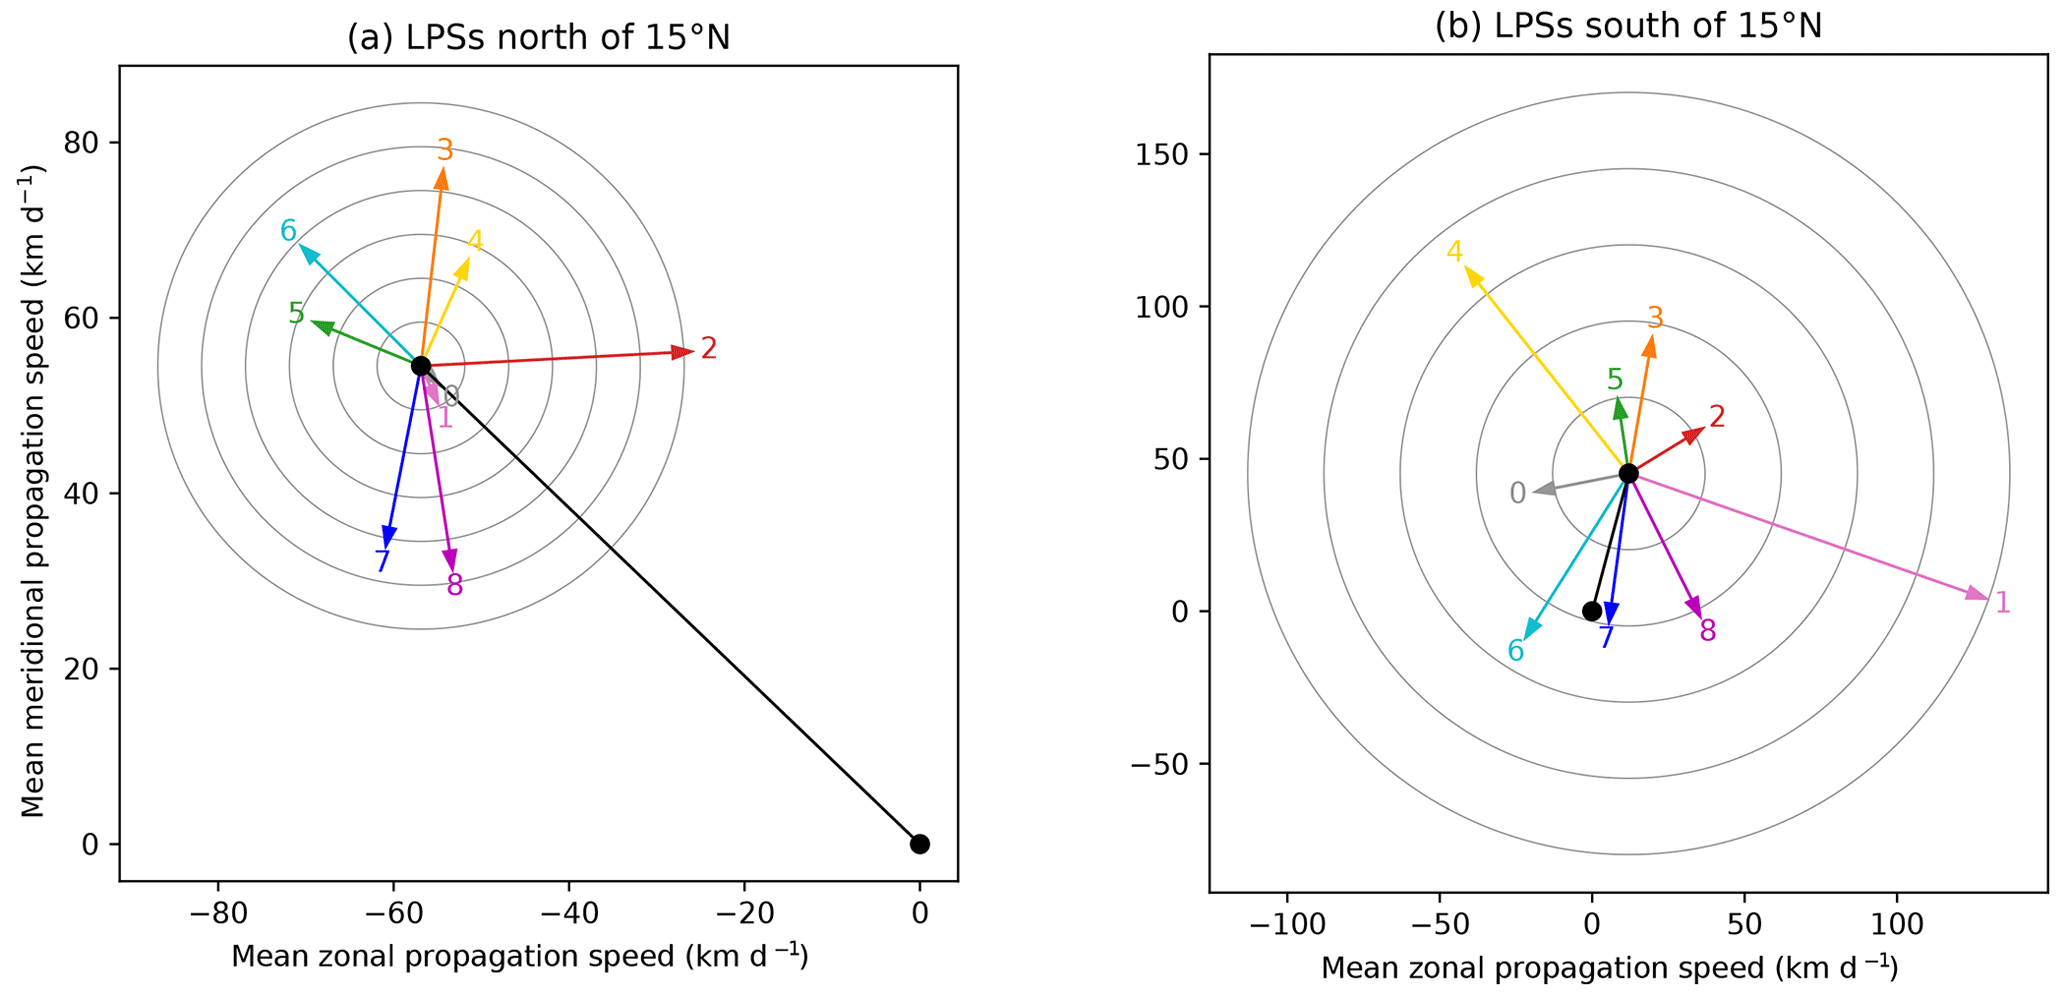
Figure 5The effect of the BSISO on monsoon LPS propagation velocity for (a) systems north of 15∘ N and (b) systems south of 15∘ N. In each case, the climatological propagation velocity is given in black, with the anomalies to this mean for each BSISO phase given by coloured arrows. Rings indicate anomalous speeds in multiples of 5 and 25 km d−1 in (a) and (b) respectively.
To measure this in more detail, Fig. 5 shows the mean and anomalous propagation vectors for LPSs on either side of 15∘ N. The vectors are computed for each LPS time step and then grouped according to the BSISO phase in which they occur. For those north of 15∘ N, the mean propagation vector for each BSISO phase except 1 (and 0) differs significantly from the overall mean. We see some of the expected features: anomalous west/northwest propagation during phases 5 and 6, amounting to an increase in the mean propagation speed of about 13 % and 22 % respectively. Similarly, anomalous eastward propagation in phase 2 slows the mean propagation speed down by about 20 %. However, the anomalous northward propagation in phase 3 and southward propagation in phases 7 and 8 cannot be explained by changes in the 500 hPa winds, implying that some other mechanism is at play.
The relationship breaks down completely for LPSs south of 15∘ N, where the BSISO has an even stronger effect on propagation velocity. During phase 1, which is associated with reasonably strong anomalous mid-level easterlies over Sri Lanka, LPSs have a large eastward component to their anomalous (and even total) propagation vector – i.e. the wrong direction altogether. During phase 5, which is associated with the strongest anomalous mid-level westerlies, LPSs have a small anomalous northward component to their propagation. It is clear that although LPSs may generally be steered by 500 hPa winds, the effect of the BSISO on their propagation does not operate by this mechanism.
3.3 Effect of the BSISO on LPS precipitation
As we have seen, passage of an active BSISO event can have a significant impact on local rainfall (Fig. 1) over monsoonal India. Since the majority of monsoon rainfall is brought by LPSs (Hunt and Fletcher, 2019), we ask whether it is simply the case that the BSISO just results in more LPSs (as in Fig. 4) or whether some additional interaction between the two is resulting in a change in LPS rainfall. Here, we again separate our analysis into LPSs on either side of 15∘ N. For each group, we plot the mean system-centred precipitation in the centre and use the eight surrounding subplots to show the anomaly to this mean for each of the eight defined BSISO phases. These are ordered anti-clockwise from bottom left, consistent with depictions of MJO and BSISO phase space in previous studies (Wheeler and Hendon, 2004; Lee et al., 2013). As with propagation (and hereafter), compositing is done according to simultaneous BSISO phase, meaning a single LPS may be distributed across several composites.
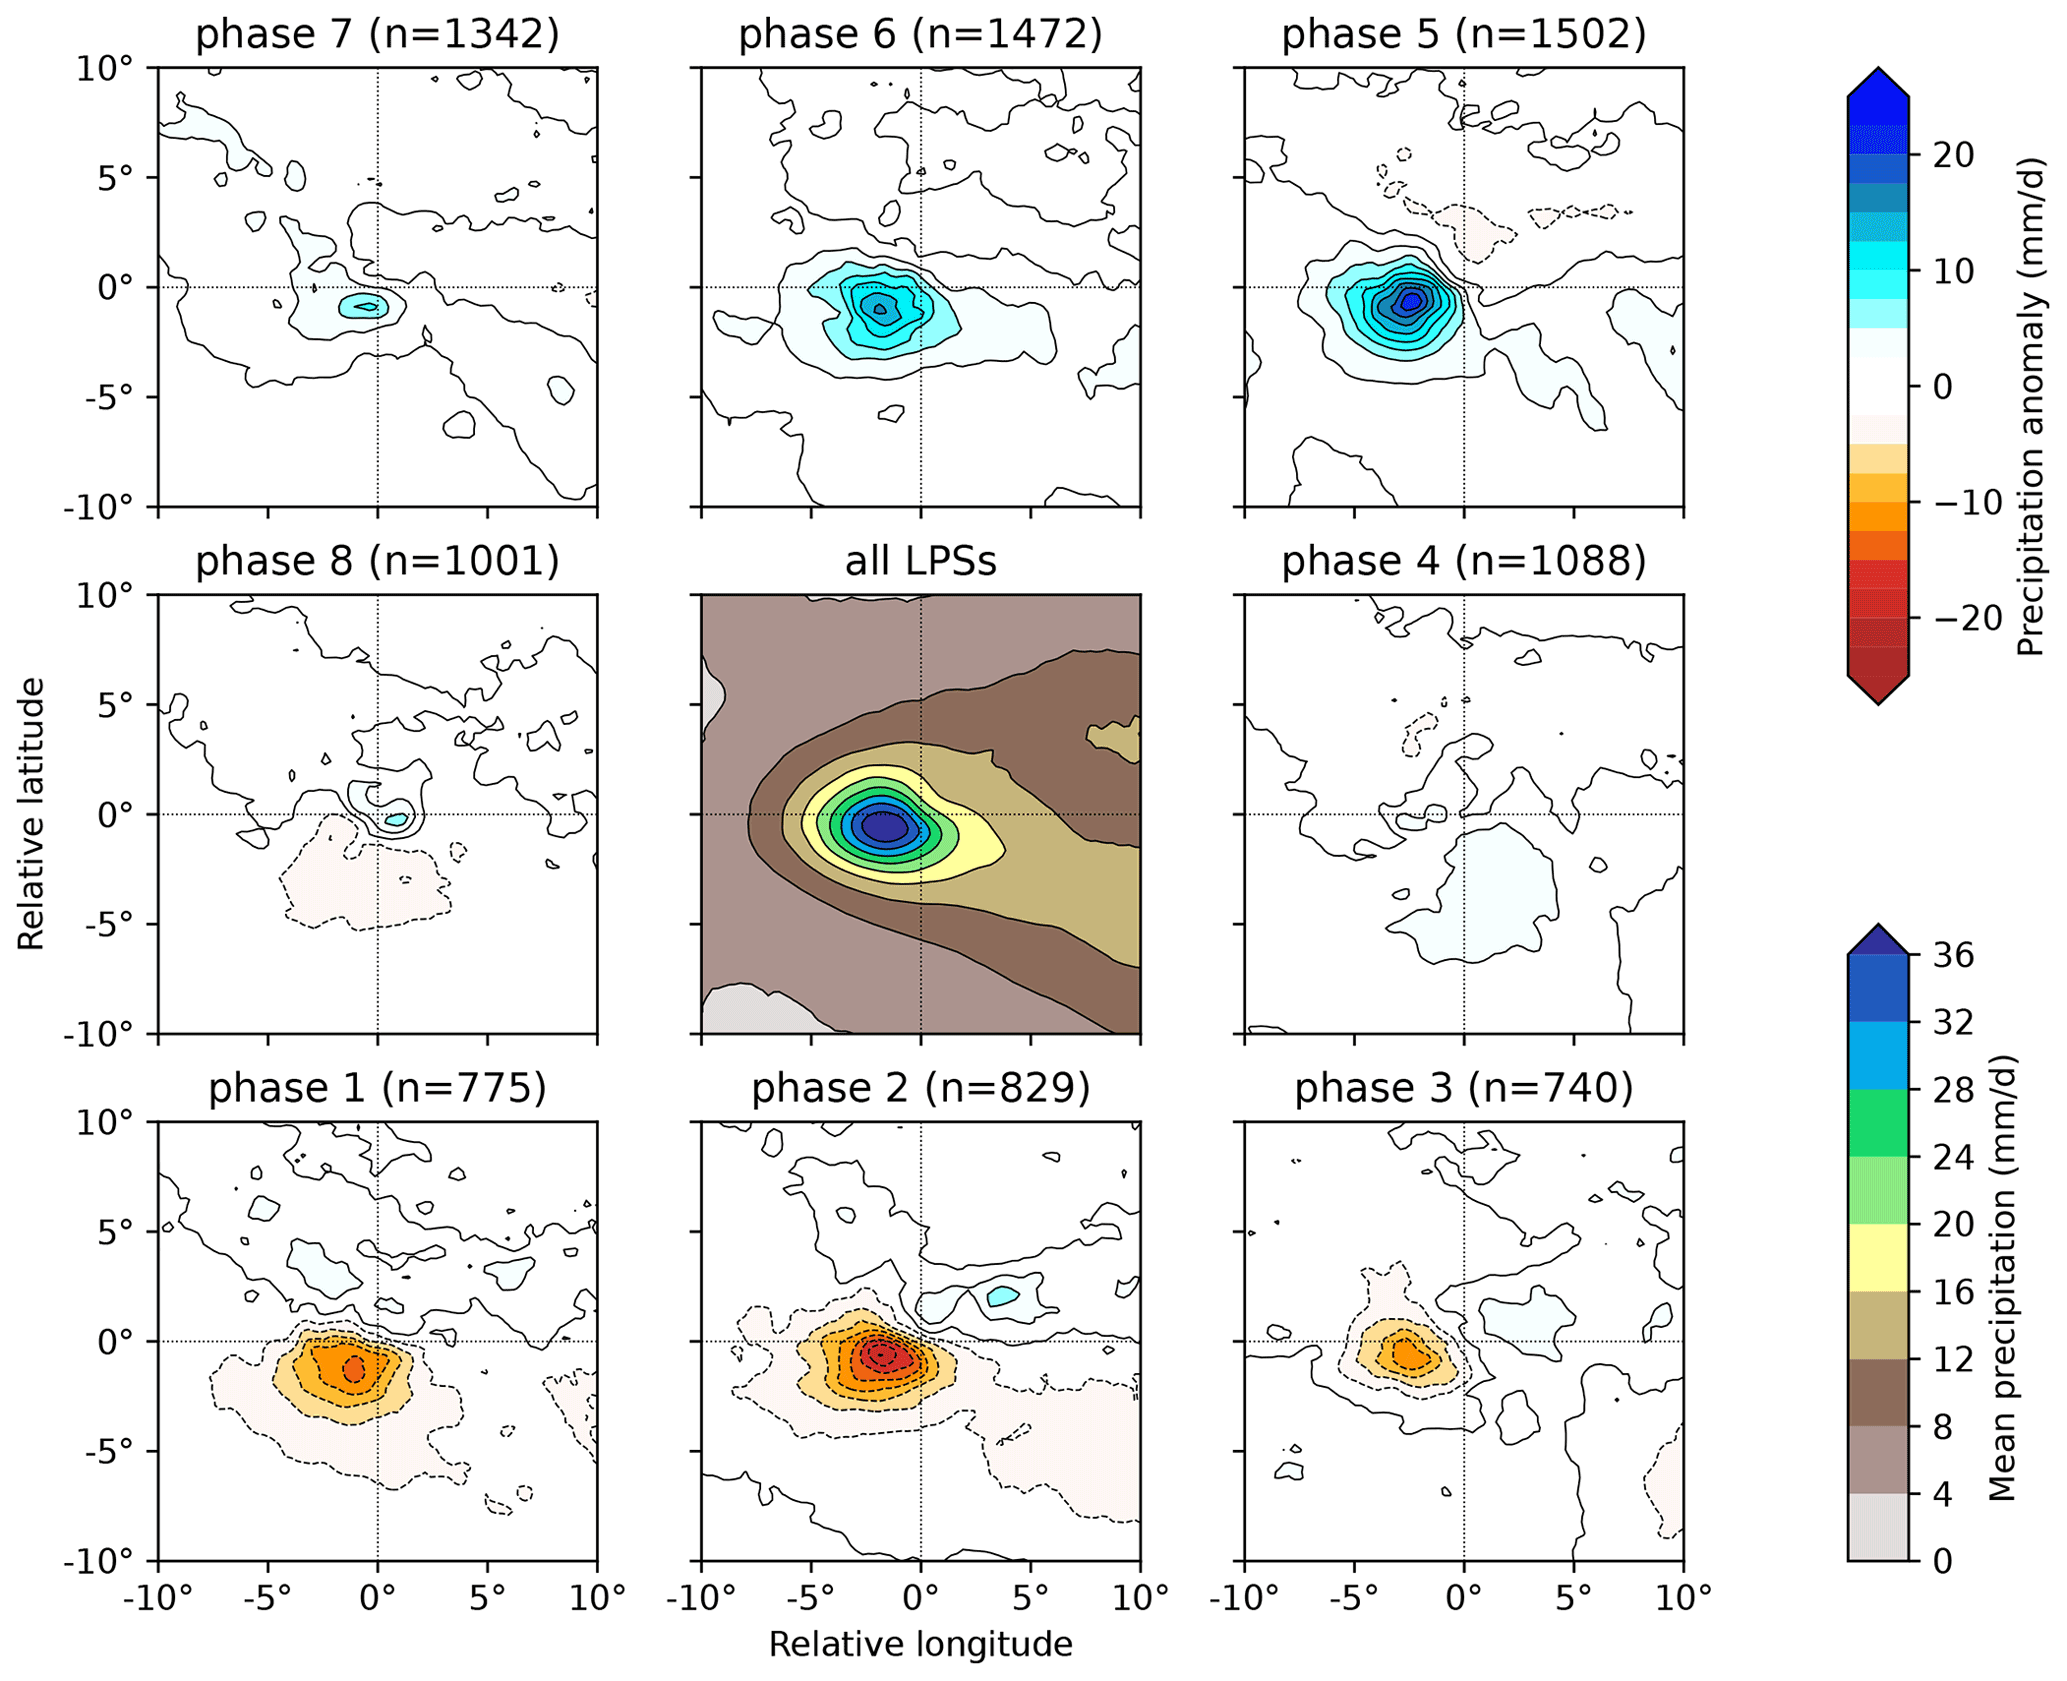
Figure 6The effect of the BSISO on precipitation in monsoon LPSs north of 15∘ N. The central panel shows the mean composite system-centred precipitation for all such LPSs (including those in phase 0). Anomalies to this mean as a function of BSISO phase, along with their respective sample sizes (total 6-hourly time steps), are given in the surrounding panels. Precipitation data from ERA5.
Results for LPSs north of 15∘ N are given in Fig. 6. Each phase has a good sample size, though there are about twice as many LPS time steps in phase 5 as in phase 1. Phases 1, 2, and 3 result in a significant decrease in LPS precipitation – reducing the composite maximum by 27 %, 39 %, and 19 % (and overall means by 13 %, 15 %, and 1 %) respectively. Phases 5, 6, and 7 result in a significant increase in LPS precipitation – increasing the composite maximum by 51 %, 35 %, and 14 % (and overall means by 11 %, 12 %, and 5 %) respectively. These changes are coherent over the BSISO cycle, rising from a single minimum in phase 2 to a single maximum in phase 5. Notably, the rainfall difference imparted by any given phase is not spatially uniform – instead it is closely related to the existing spatial distribution of LPS rainfall. This suggests that it is not just a case of the BSISO creating an environment with a large-scale increase in rainfall through which LPSs simply pass or interact weakly. Rather, the BSISO somehow affects the mechanisms driving LPS rainfall.
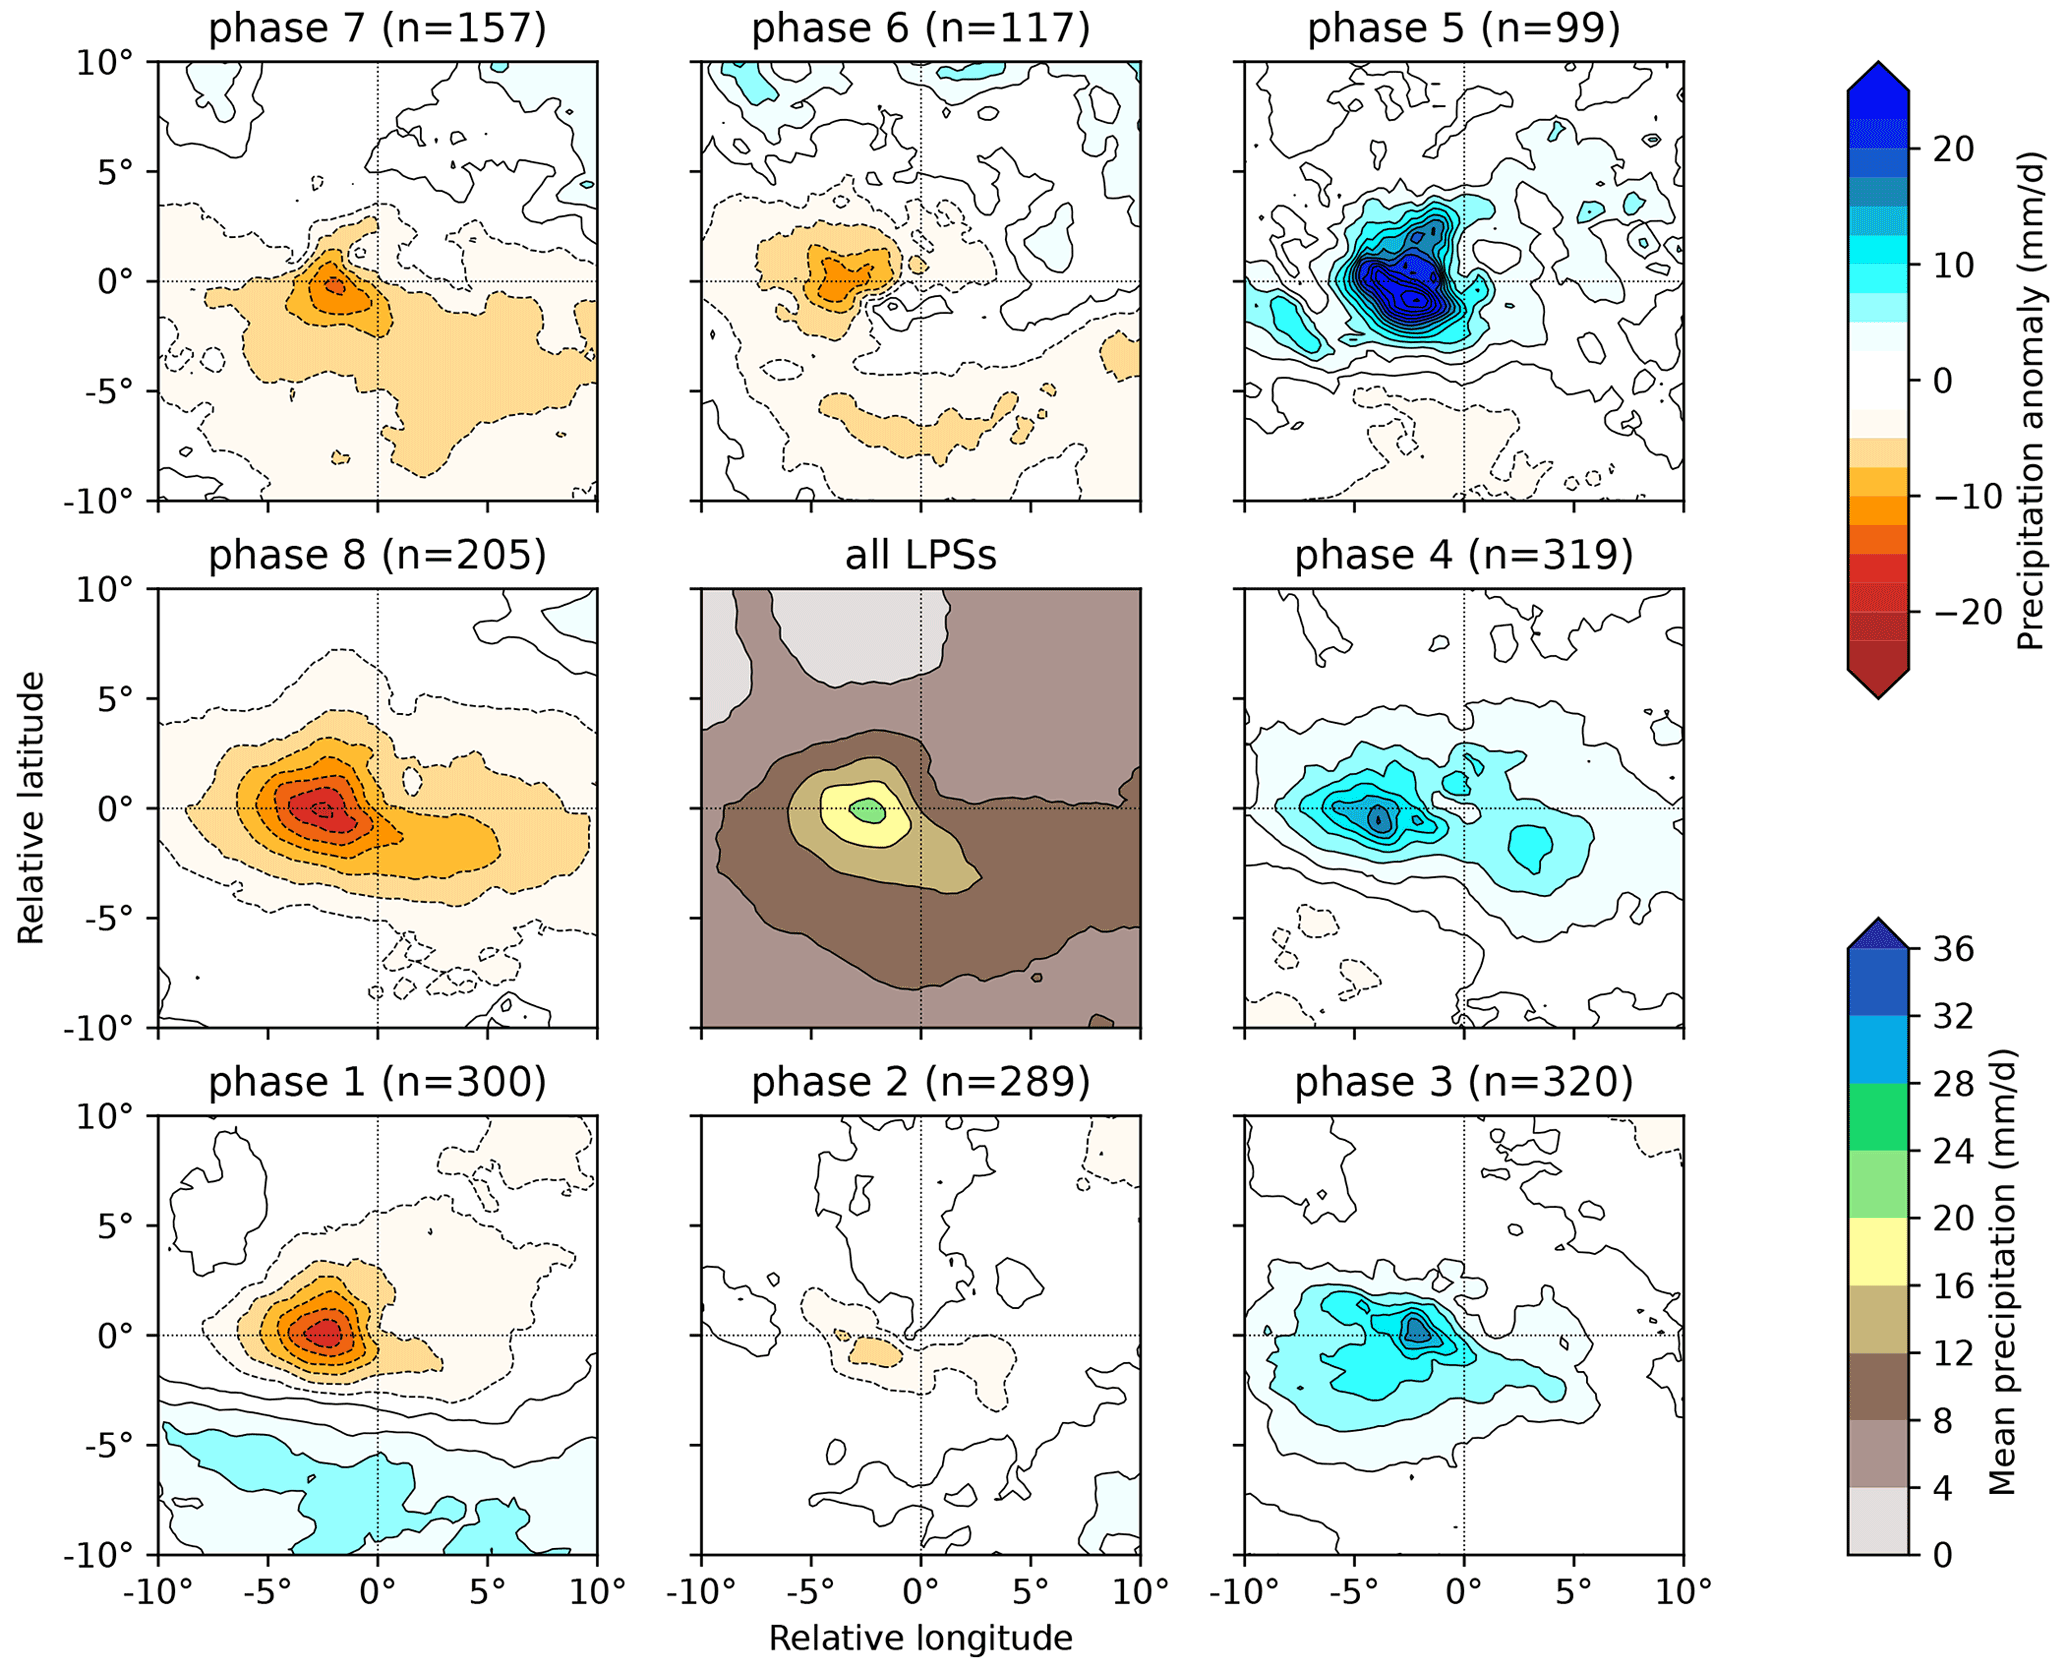
Figure 7The effect of the BSISO on precipitation in monsoon LPSs south of 15∘ N. The central panel shows the mean composite system-centred precipitation for all such LPSs (including those in phase 0). Anomalies to this mean as a function of BSISO phase, along with their respective sample sizes, are given in the surrounding panels. Precipitation data from ERA5.
A similar pattern emerges for LPSs south of 15∘ N (Fig. 7), though rotated two phases earlier. The mean rainfall associated with these LPSs is substantially lower than their northern counterparts, but the absolute change in rainfall associated with different BSISO phases is similar. This results in much larger fractional changes, not unlike those we saw for propagation earlier. Phases 7, 8, and 1 result in a significant decrease in LPS precipitation – reducing the composite maximum by 32 %, 48 %, and 27 % (and overall means by 35 %, 45 %, and 6 %) respectively. Phases 3, 4, and 5 result in a significant increase in LPS precipitation – increasing the composite maximum by 76 %, 68 %, and 146 % (and overall means by 25 %, 27 %, and 25 %) respectively.
Let us now investigate why these anomalies occur – i.e. what does the BSISO do to LPSs to suppress or enhance their precipitation? For the sake of brevity, we will now restrict our analysis to consider only LPSs north of 15∘ N and only to the two BSISO phases – 2 and 5 respectively – that most strongly suppress and enhance precipitation in such LPSs. Here, we can use moisture flux convergence to understand the synoptic-scale changes responsible for influencing precipitation, since the two fields are strongly related in the tropics (e.g. Neelin and Held, 1987).
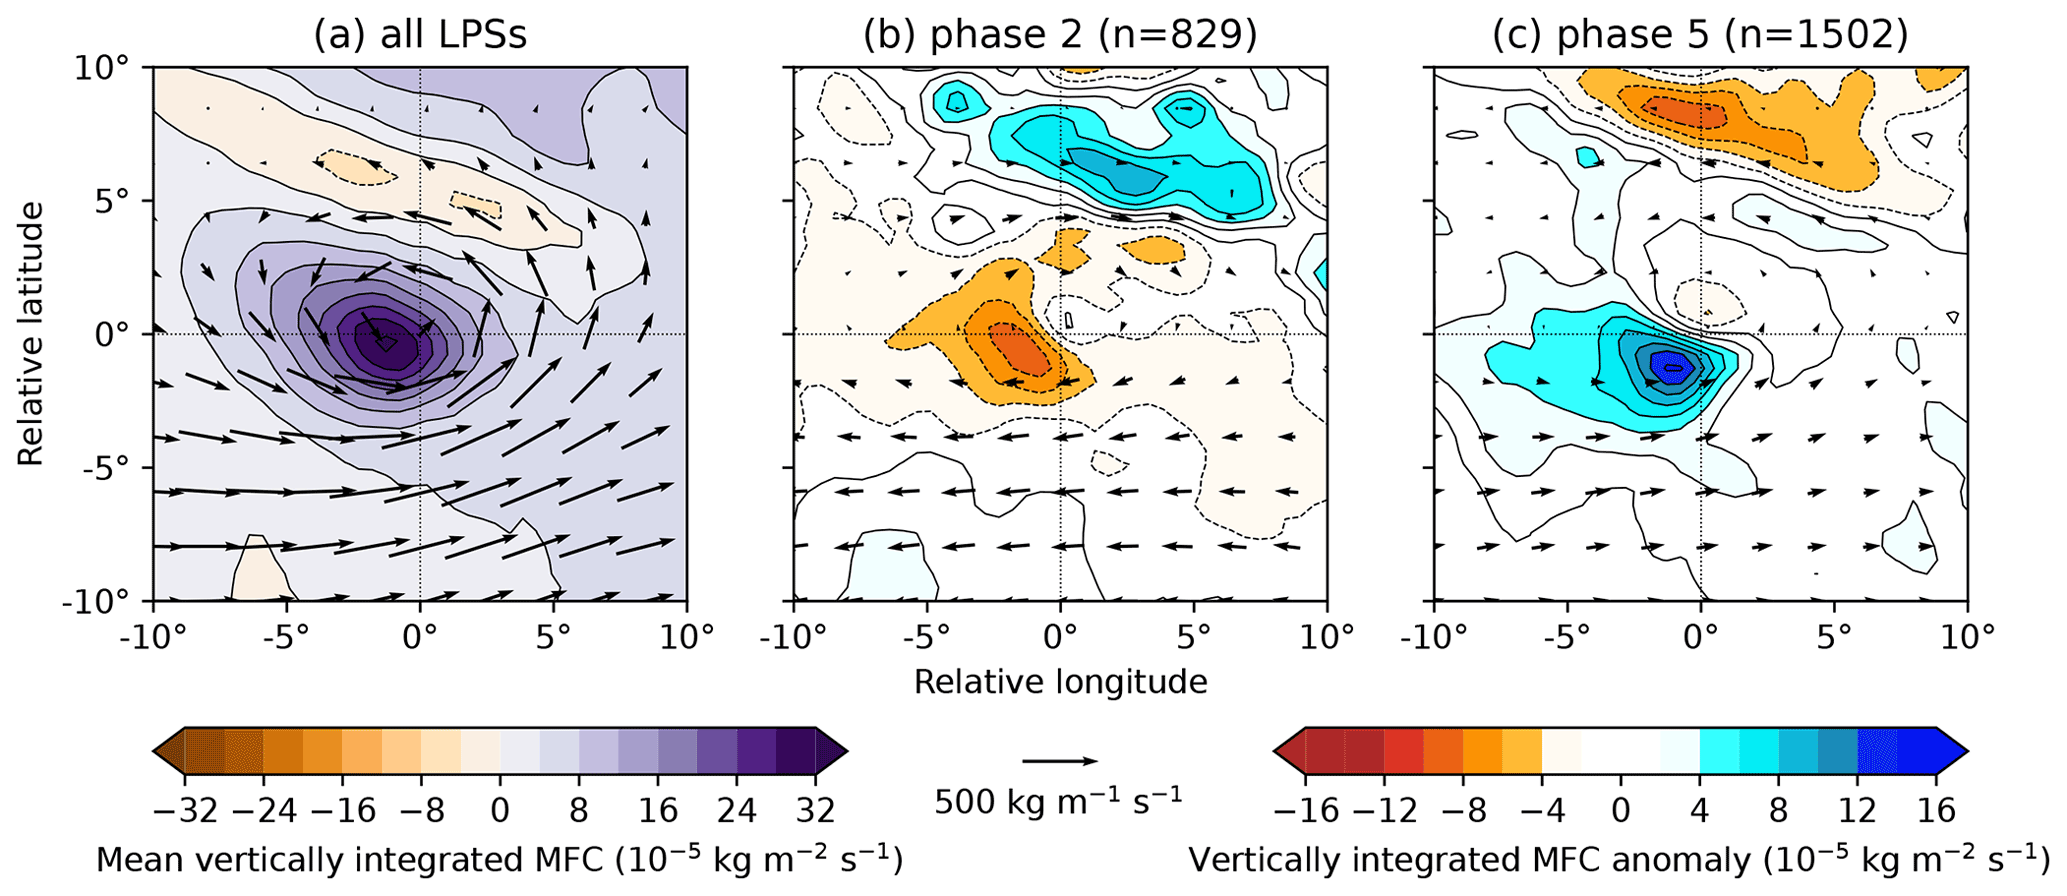
Figure 8The effect of the BSISO on vertically integrated moisture flux and moisture flux convergence (MFC) in monsoon LPSs north of 15∘ N. The composite for all such LPSs is given in (a), with the differences for LPS composites from BSISO phases 2 and 5 given in (b) and (c) respectively, along with their sample sizes.
Figure 8 shows vertically integrated moisture flux and moisture flux convergence, both as composite means for all monsoon LPSs north of 15∘ N and as anomalies to these means for LPSs in BSISO phases 2 and 5. The composite mean (Fig. 8a) shares many similarities with LPS-centred moisture flux composites from earlier studies (Hurley and Boos, 2015; Hunt et al., 2016; Deoras et al., 2022): cyclonic but with substantial meridional shear, and with a convergence maximum several hundred kilometres to the southwest – colocated with the precipitation maximum.
The anomalous fields (Fig. 8b and c) show a reduction in both cyclonicity and meridional shear for LPSs in phase 2 and an increase in both for LPSs in phase 5, with the associated moisture flux convergence behaving accordingly in each case. We also see anomalies of the opposite sign between 700 and 900 km north of the centre in both phases, suggesting either the development of an anomalous secondary meridional circulation within the LPS or an additional interaction between the BSISO and the Himalayan foothills to the north. The foothills start at about 26∘ N, consistent with the composite anomalies.
We also see, particularly in phase 5, that the anomalous increase in moisture flux convergence is not exactly collocated with the maximum in the full composite – instead being further south. The implication of this is that the anomalous moisture flux convergence does not explain the changes in maximum precipitation well: in phase 5 the maximum convergence increases by 37 % (cf. 51 % for precipitation), and in phase 2 the maximum convergence decreases by 24 % (cf. 39 % for precipitation).
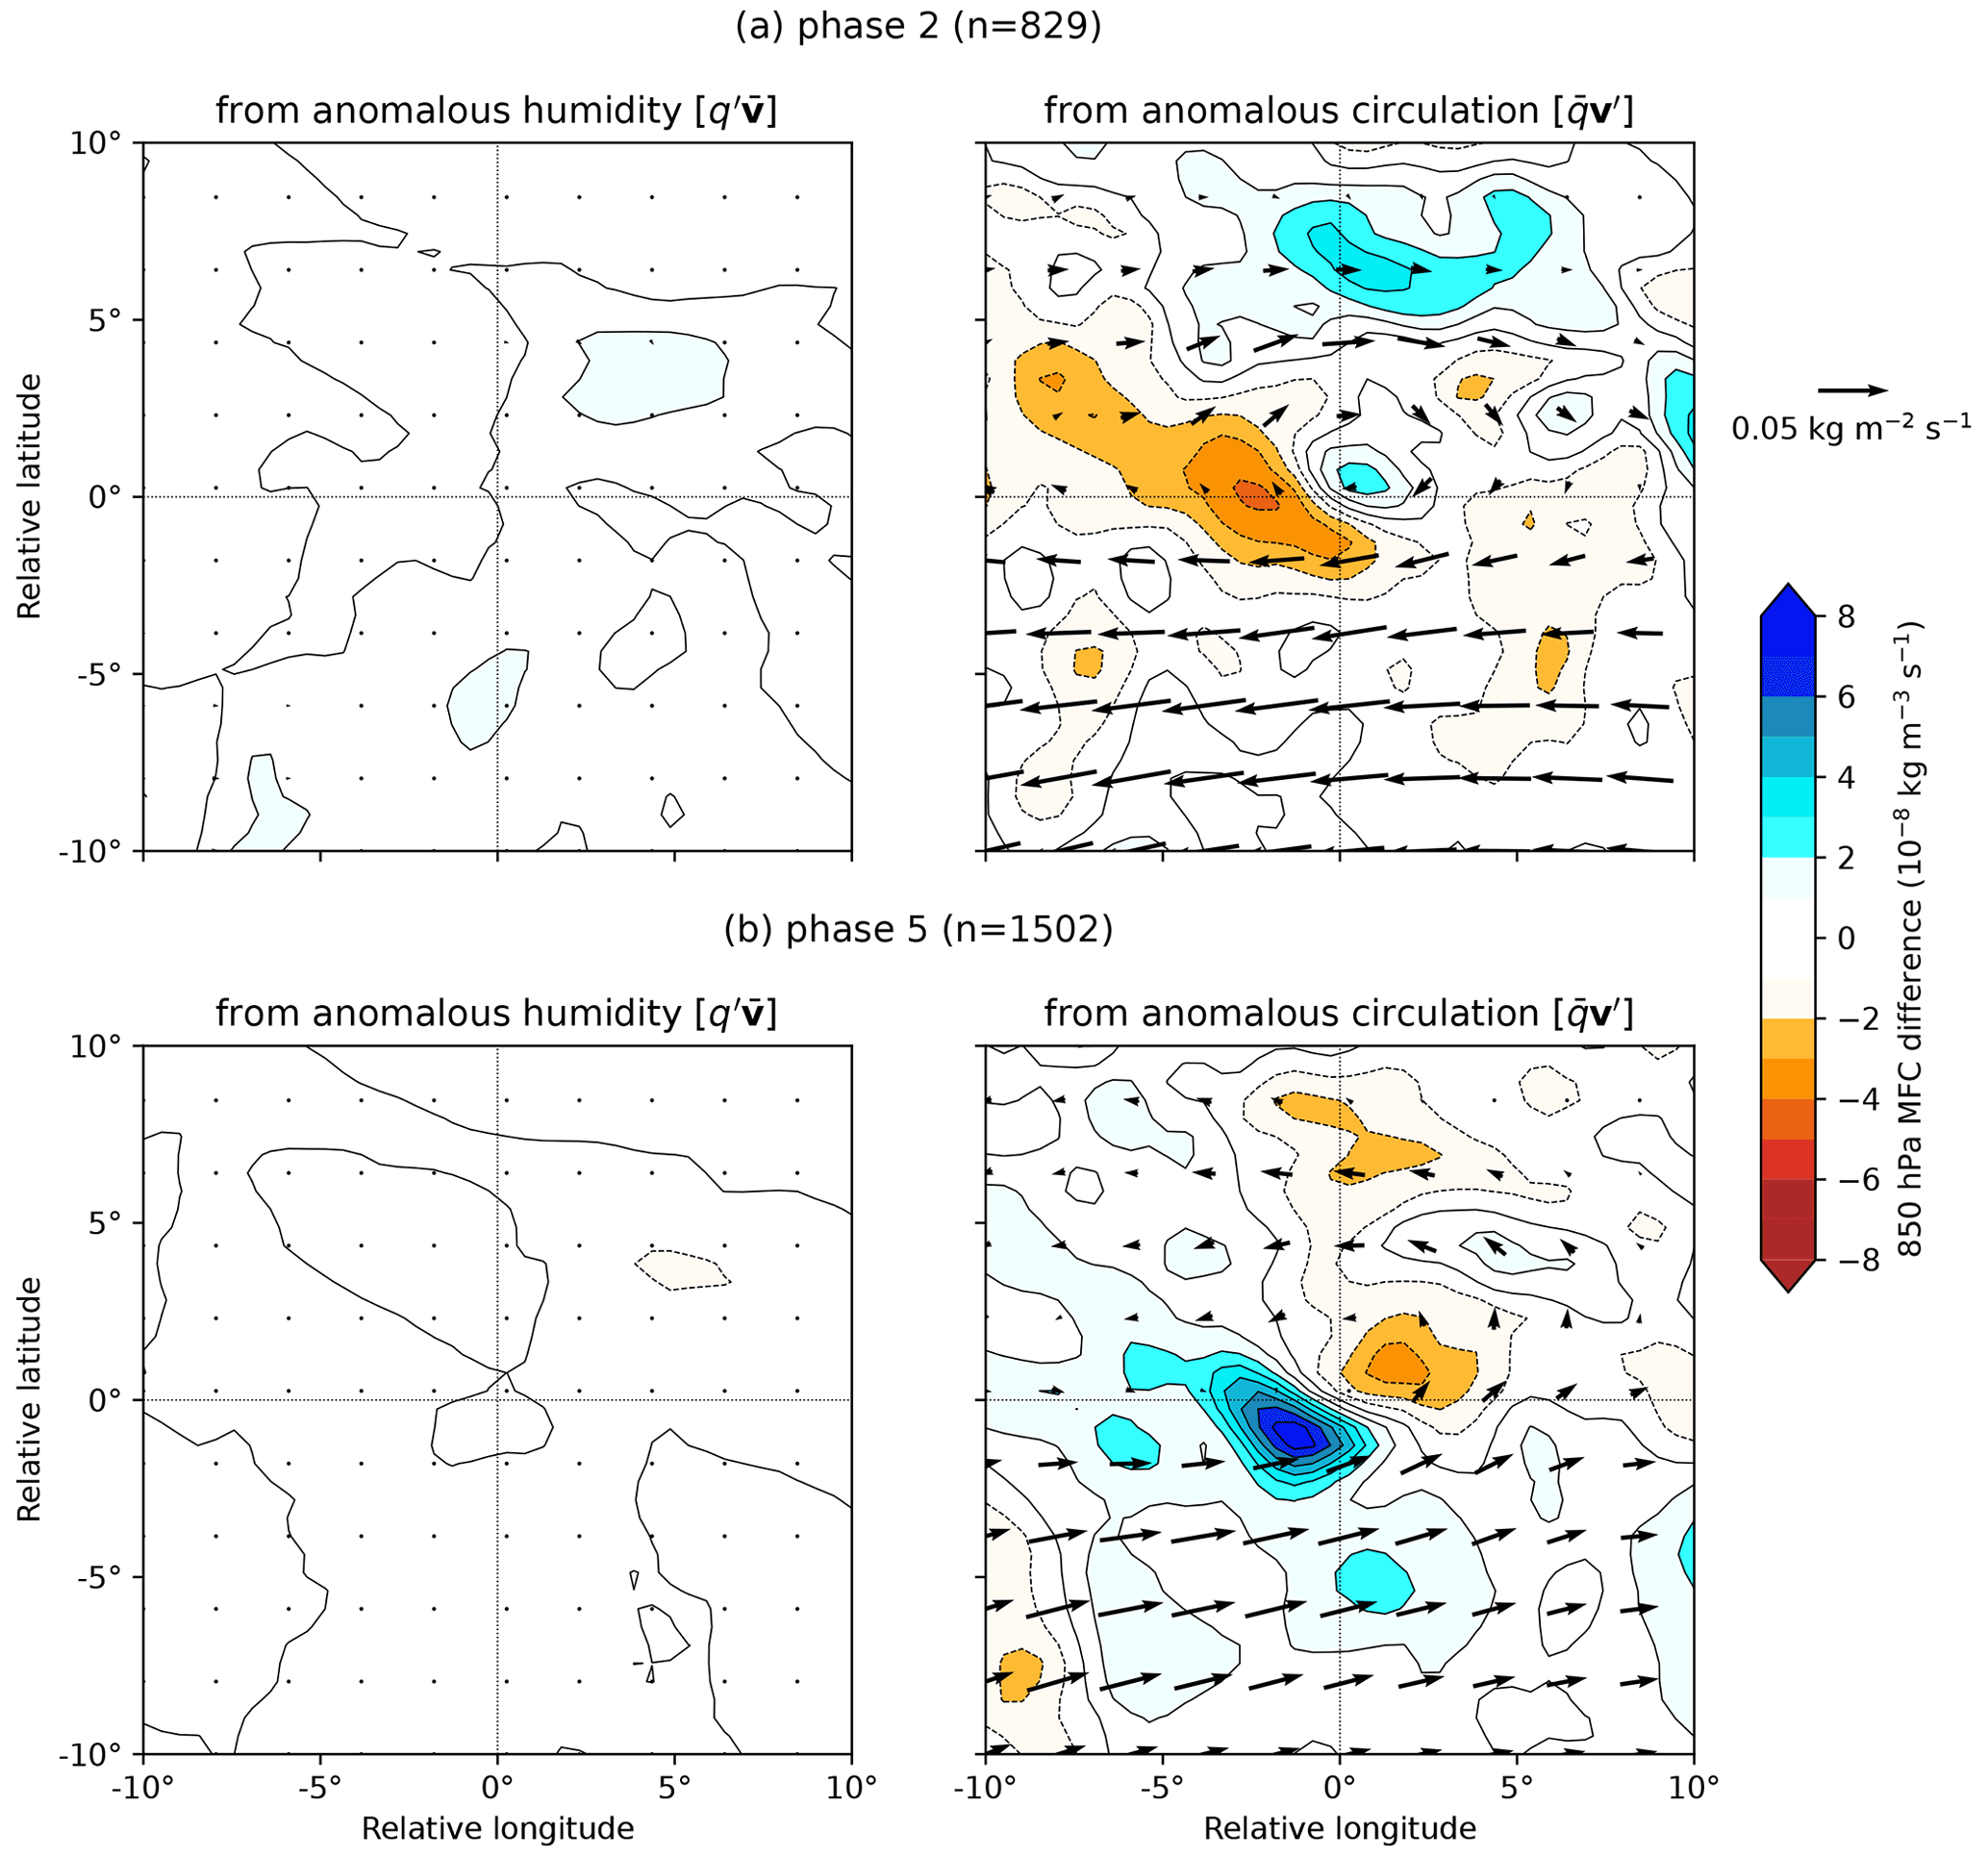
Figure 9Contribution to LPS-centred anomalous 850 hPa moisture flux and moisture flux convergence in (a) BSISO phase 2 and (b) BSISO phase 5 from (left) anomalous humidity and (right) anomalous circulation. In each case the contribution is computed by linearising about the mean LPS composite. Computed for monsoon LPSs north of 15∘ N.
Changes in moisture flux (and hence moisture flux convergence) can be understood through a simple linearisation:
where barred quantities indicate the all-LPS mean and primed quantities indicate the anomaly to that mean for the phase of interest. The first term on the right-hand side denotes the contribution to the anomalous moisture flux from changes to moisture alone, given in the left-hand panels of Fig. 9. This is approximately an order of magnitude smaller than the second term on the right-hand side – the contribution from anomalous winds alone – which is given in the right-hand panel of Fig. 9. The non-linear third term, the product of the two anomalies, is smaller still and neglected here. Note that for simplicity, and because the two fields are highly congruent, we use 850 hPa moisture flux here rather than the full vertical integral.
Figure 9 clearly indicates that increased moisture flux and moisture flux convergence associated with LPSs in BSISO phase 5 (and reduced flux and convergence in phase 2) are, to first order, due to changes in the circulation rather than the moisture field. This is perhaps to be expected, given that we saw in Figs. 2 and 3 that the BSISO had a much greater effect on vorticity than total column water vapour over the monsoon. As we will discuss shortly, there is still a potential secondary role for moisture, in providing perturbations to mid- and upper-level latent heating, modulating low-level ascent.
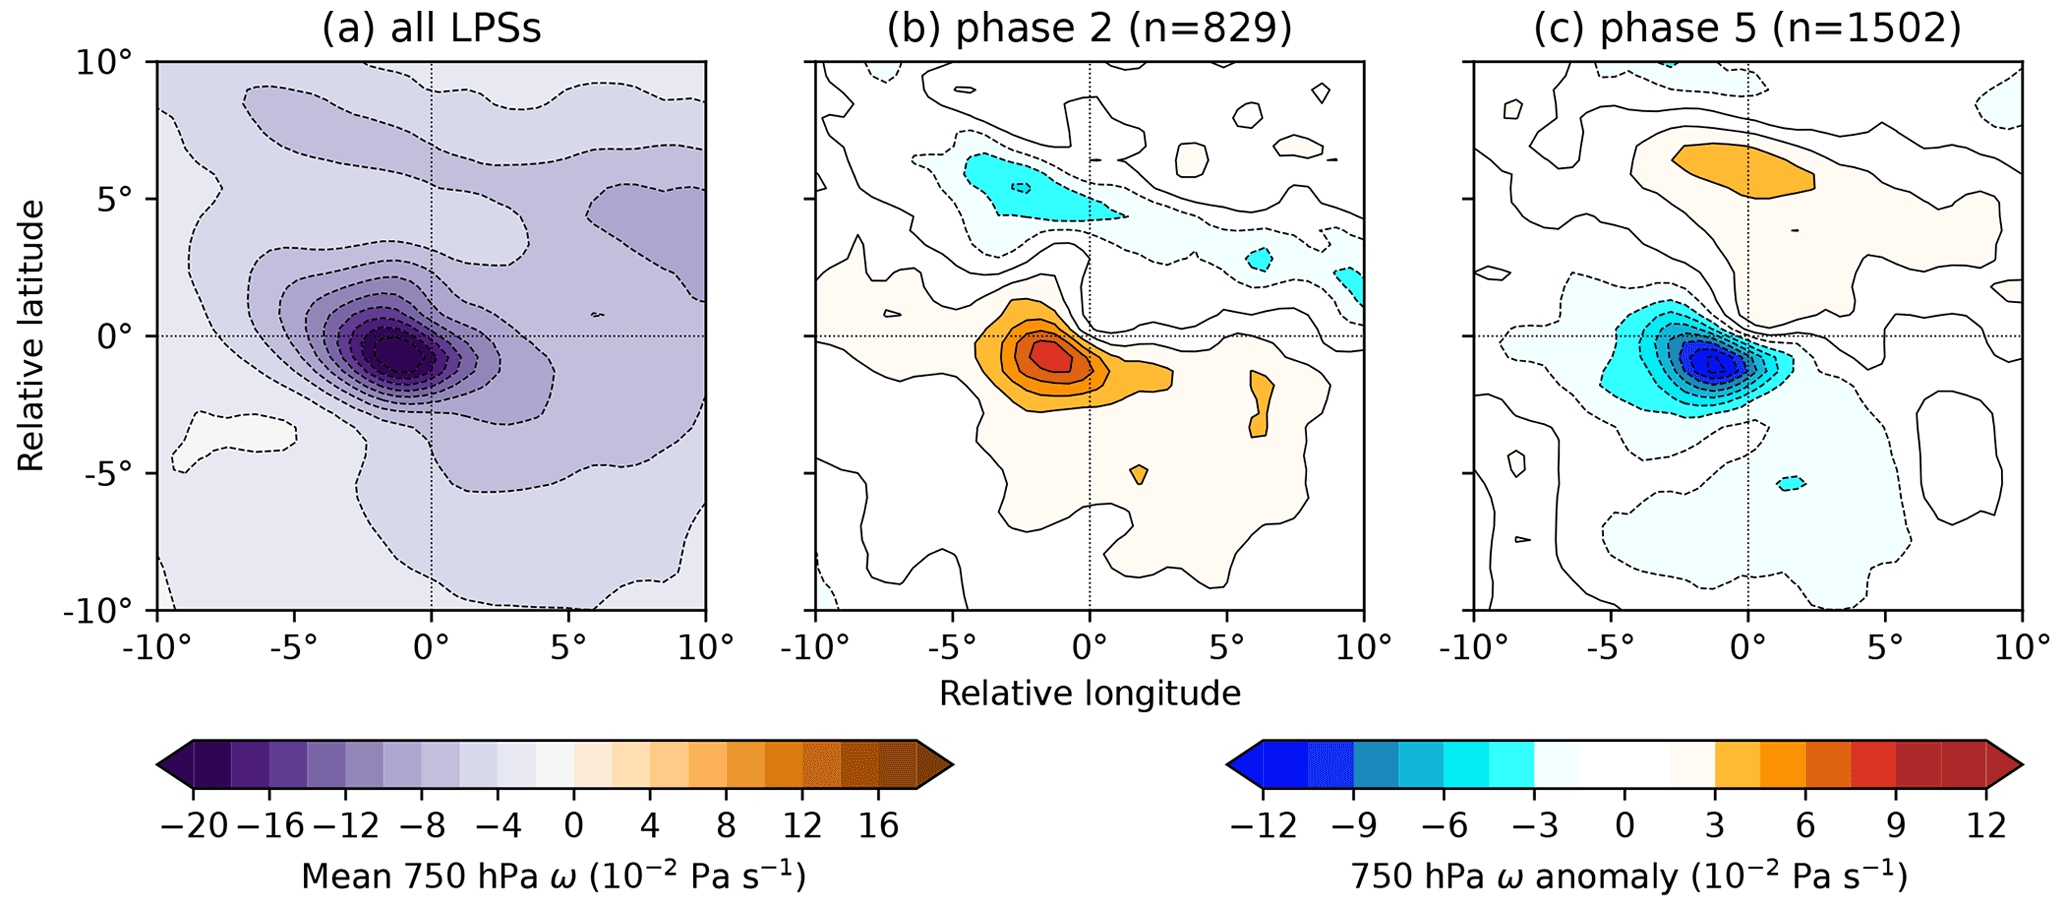
Figure 10The effect of the BSISO on 750 hPa ω (vertical velocity) in monsoon LPSs north of 15∘ N. The composite for all such LPSs is given in (a), with the differences for LPS composites from BSISO phases 2 and 5 given in (b) and (c) respectively, along with their sample sizes. Points where the surface pressure is less than 750 hPa are not included in the composites. Following convention, negative values of ω indicate upward motion.
Vertical velocity (ω) is diagnostically linked to low-level convergence through the continuity equation, and so we examine it here. The composite mean 750 hPa ω and the respective BSISO phase 2 and 5 anomalies are shown in Fig. 10. As expected, the mean closely resembles the composite precipitation and moisture flux convergence fields with a strong maximum in ascent a few hundred kilometres southwest of the system centre. The anomalies for phases 2 and 5 (Fig. 10b and c respectively) share a very similar form, though with opposite sign. The minimum in ω (maximum in ascent) is reduced in magnitude by 37 % in phase 2 and increased by 54 % in phase 5, closely following the changes in precipitation (39 % and 51 % respectively).
We can further break down the changes in vertical velocity using the (also diagnostic) ω equation:
where the symbols have their usual meanings. Here, the left-hand side can be thought of as a three-dimensional Laplacian of vertical velocity, with the operator behaving effectively like a negative sign. The first term on the right-hand side represents forcing due to differential advection of geostrophic absolute vorticity, the second term represents the forcing due to temperature advection, and the third term represents forcing due to local diabatic heating. The first two terms comprise the quasi-geostrophic forcing, which alone explain the existence of an ascent maximum – and hence precipitation maximum – in the southwest quadrant of LPSs (Rao and Rajamani, 1970). We neglect forcing due to friction, as it is negligible above the boundary layer (e.g. Bluestein, 1993).
We can now use the ω equation in Eq. (5) to explain these differences, splitting the right-hand side into two parts: the quasi-geostrophic component, which explains the forcing due to synoptic-scale dynamics, and the final term, which explains forcing due to gradients in diabatic heating. We include this final term for completeness, even though it is typically small for monsoon LPSs (Boos et al., 2015), because it may play an important role in secondary circulations (Chen et al., 2005).

Figure 11Mean system-centred ω forcing at 750 hPa, split into (a) quasi-geostrophic and (b) diabatic contributions. Left: the composite mean for all monsoon LPSs north of 15∘ N; centre: the difference between all LPSs and those occurring during BSISO phase 2; right: the difference between all LPSs and those occurring during BSISO phase 5.
These two terms are shown in Fig. 11a and b respectively for the composite of all LPSs north of 15∘ N and for phase 2 and phase 5 anomalies. The quasi-geostrophic forcing explains the ω pattern reasonably well, as expected from previous studies (Sanders, 1984; Boos et al., 2015), and is more than an order of magnitude stronger than the diabatic forcing – in both the mean and anomalies. This difference in the anomalies is in agreement with the relative difference in mean vorticity and total column water vapour perturbations caused by the BSISO (Figs. 2 and 3).
Breaking the quasi-geostrophic forcing into its two components (not shown), we note that the differential vorticity term easily dominates the temperature advection term. So, it is clear that when the BSISO affects LPS intensity and precipitation, either enhancing them (phases 5–7 for systems north of 15∘ N) or weakening them (phases 1–3), it does so through modulating the circulation of the monsoon rather than its moisture content or thermodynamic structure. Mean and anomalous forcing at 400 hPa, approximately the level of the upper-tropospheric warm core, is similarly balanced but about 5 times weaker than at 750 hPa (not shown). In the next section, we will explore precisely how the interaction between LPSs and the perturbed monsoon lead to changes in LPS intensity and propagation.
3.4 Non-linear intensification
We start by familiarising ourselves with the vertical structures of relevant LPS fields – vertical velocity and relative vorticity – and comparing these to the anomalies for LPSs during BSISO phase 5 (Fig. 12). Note that for the sake of brevity, analysis will now be constrained to BSISO phase 5, which features the strongest positive perturbation to LPS precipitation. Throughout, unless stated otherwise, the results for phase 2 can be taken to be approximately equal and opposite.
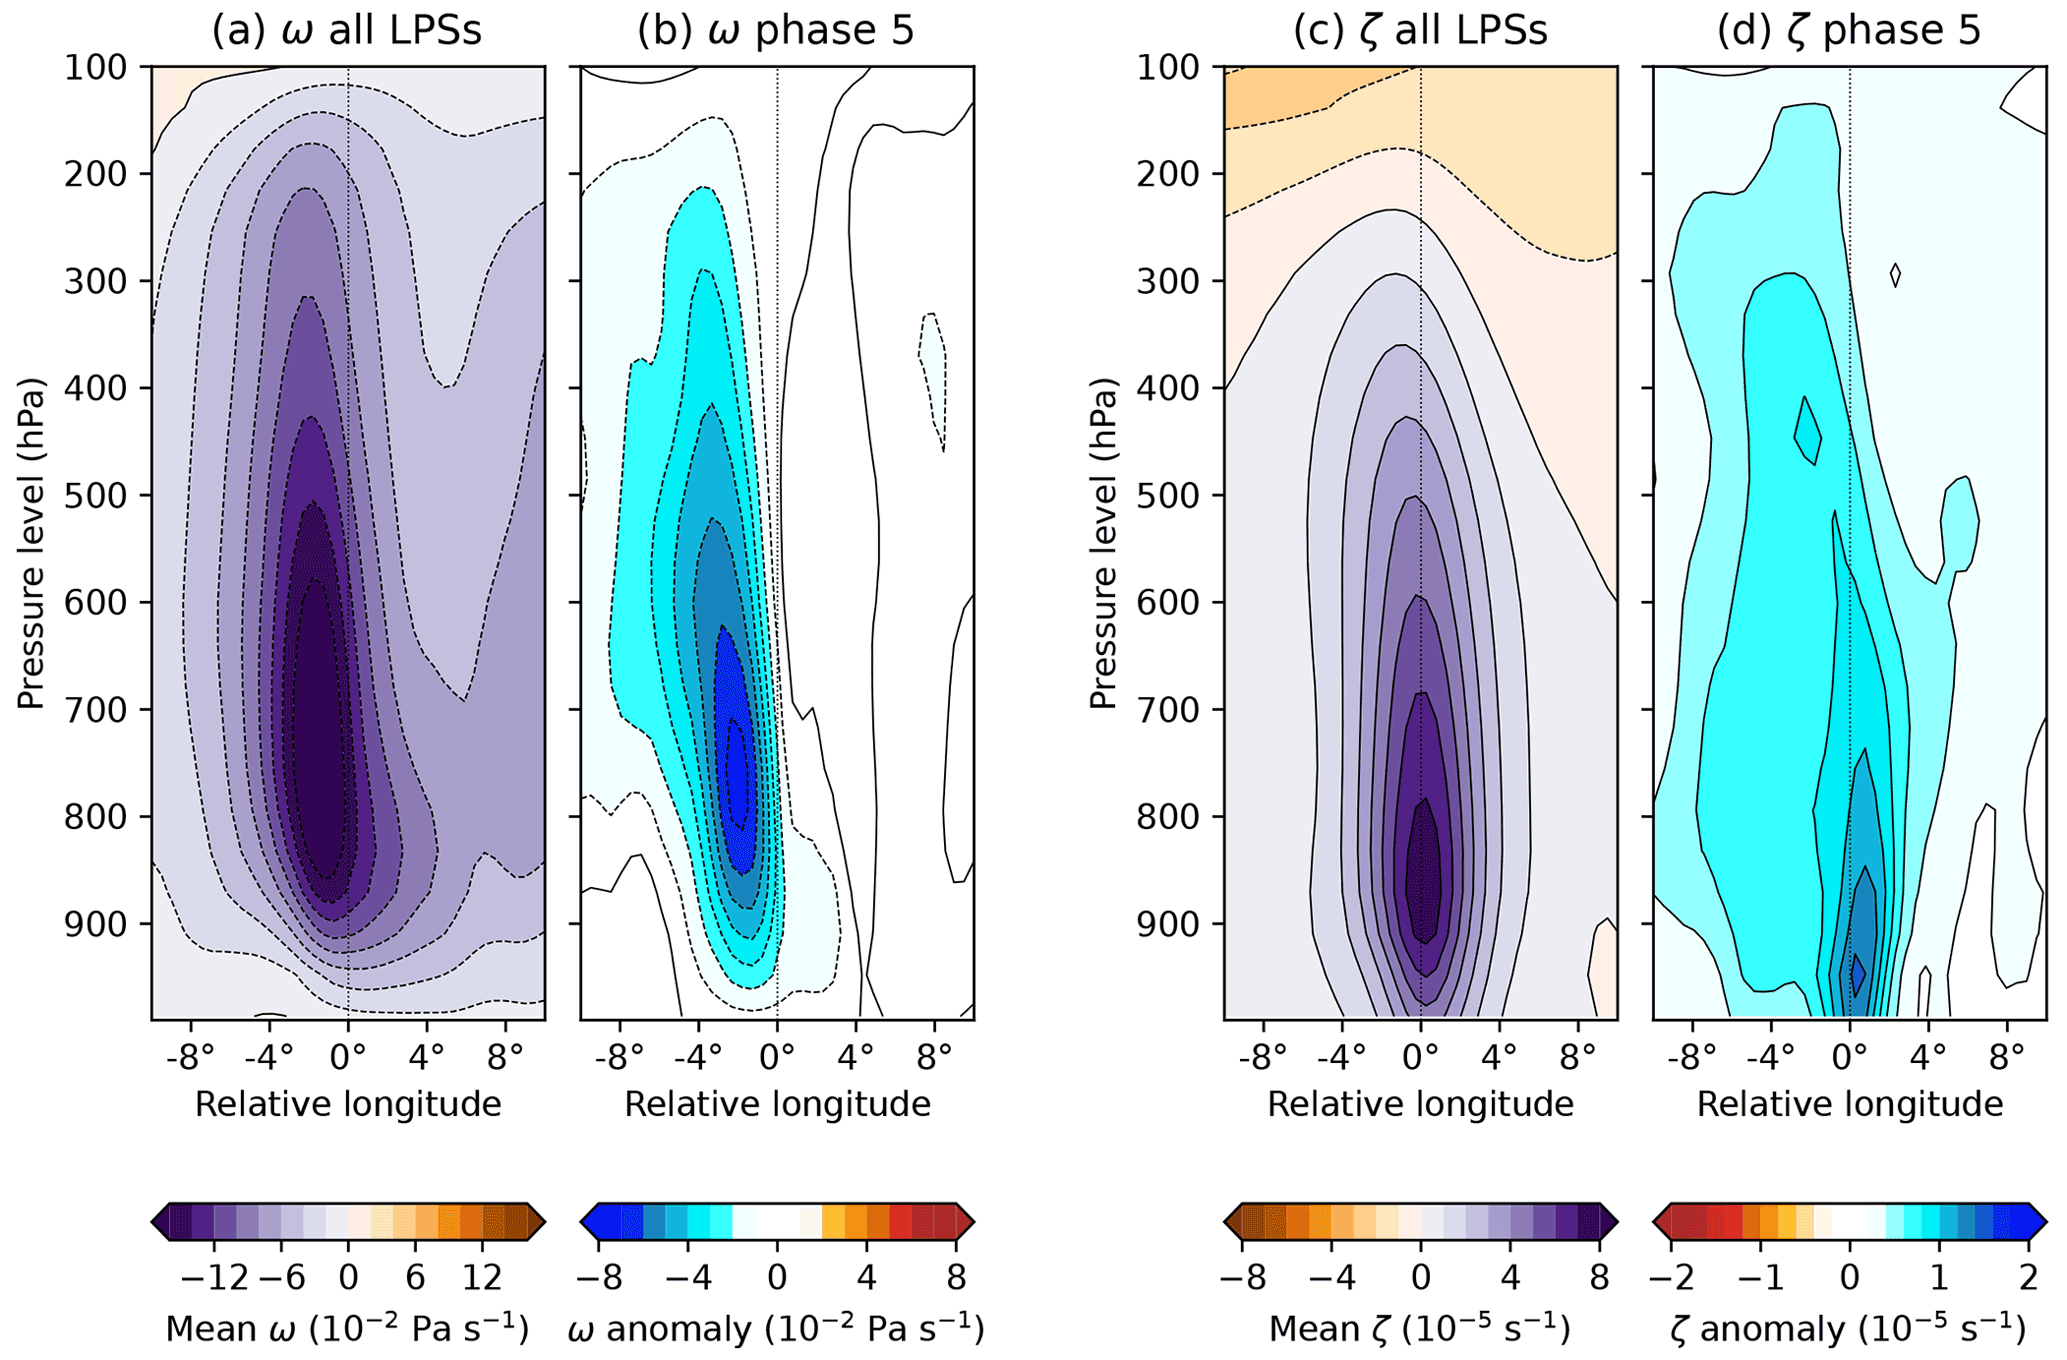
Figure 12Zonal-vertical cross-section through system-centred composite means of ω (a, b) and relative vorticity (c, d). For each variable, the mean for all LPSs is given on the left (a, c), and the anomaly for LPSs occurring during BSISO phase 5 is given on the right (b, d). Computed for monsoon LPSs north of 15∘ N. Cross-sections are taken as an average from 1∘ S to 1∘ of the central latitude. Data from levels below surface pressure have been excluded.
The vertical structure of composite monsoon LPSs has been the subject of many studies (e.g. Godbole, 1977; Hurley and Boos, 2015), and so we need only note the salient features here. Vertical velocity has a maximum at about 750 hPa, roughly 100 km west of the centre. Ascent is deep, effectively reaching the tropopause, but is very weak in the boundary layer. Vorticity has a central maximum at 850 hPa, with positive values extending up to about 300 hPa. Like ascent, it is weaker in the boundary layer, though not to the same extent.
Anomalous ascent in phase 5 has a very similar pattern to the mean, which it increases by an average of about 20 % over the cross-section. This corroborates the ω-forcing analysis in the previous section (Fig. 11), where we showed that the perturbation to quasi-geostrophic forcing generally acted multiplicatively. This is not the case for anomalous vorticity (Fig. 12d). Here, the changes do not appear to act on the mean structure and comprise two components: firstly, a broad, relatively weak increase that is largely uniform throughout most of the troposphere and is stronger towards the west of the system and secondly, a much smaller-scale, much larger increase, confined to the centre and mostly embedded in the boundary layer.
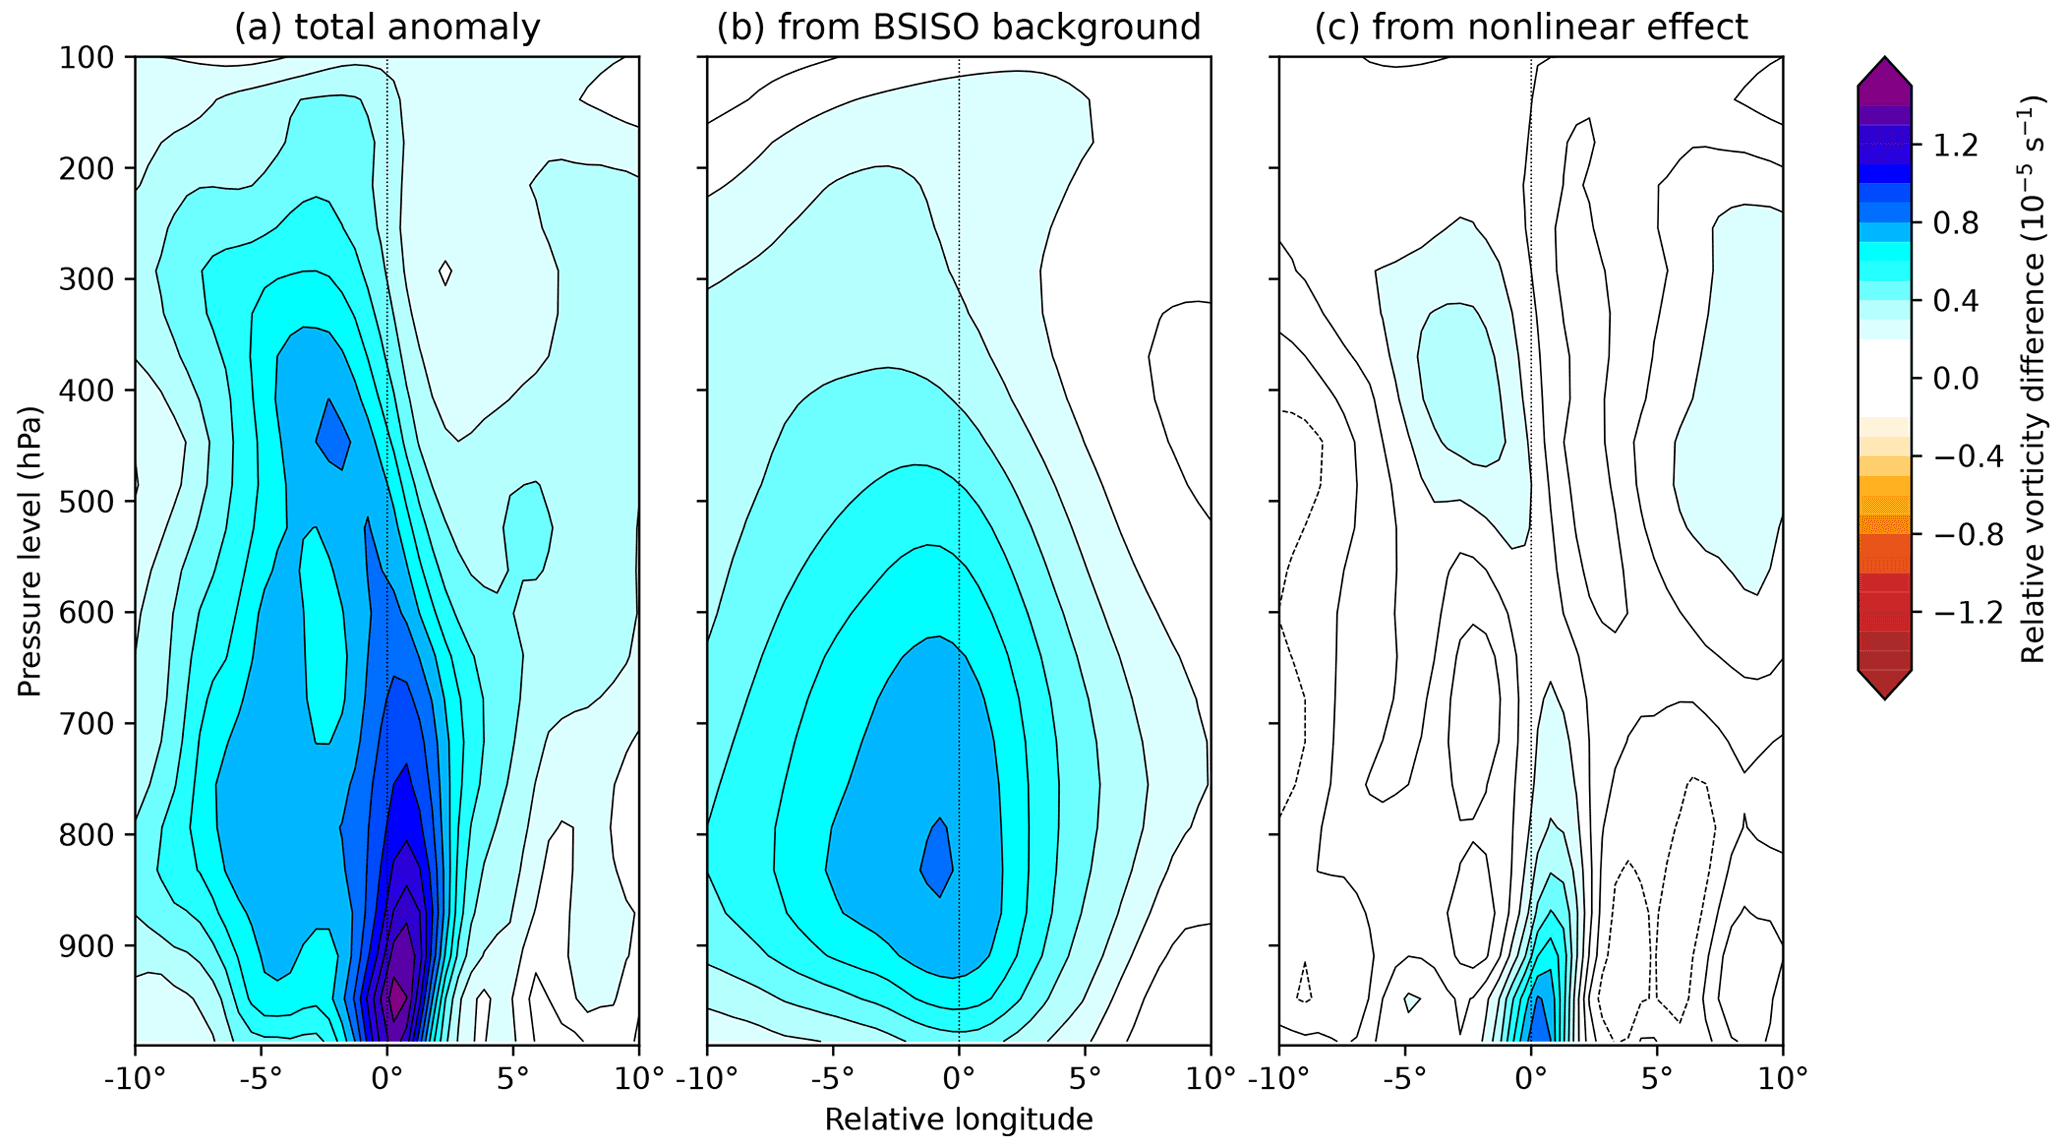
Figure 13Zonal-vertical cross-sections of anomalous system-centred relative vorticity for LPSs in BSISO phase 5, compared with the all-LPS mean. The total anomaly is given in (a), the contribution from the BSISO alone is given in (b), and the contribution from the interaction between the BSISO and LPSs is given in (c). Computed for monsoon LPSs north of 15∘ N.
These changes can be explained by taking the anomaly in Fig. 12d and splitting it into contributions from the BSISO background state and the subsequent non-linear LPS response to that state respectively shown in Fig. 13. To obtain the BSISO background contribution, we compute the mean three-dimensional anomalous relative vorticity over India and the surrounding region during BSISO phase 5 and then sample this field using the relevant LPS tracks as we would for a normal composite. To limit the effect of monsoon onset and withdrawal, the anomalies are computed using monthly means; e.g. the anomaly for 26 June 2016 is computed using June mean vorticity. The non-linear effect (Fig. 13c) is then taken as the difference between the actual anomaly (Fig. 13a) and the BSISO background effect (Fig. 13b).
The background effect of the BSISO is to impart the broad and relatively weak anomaly extending throughout the troposphere that we identified in Fig. 12. This represents an intensification of the monsoon trough, through which we can explain its structure: its greatest effect just above the boundary layer, at about 850 hPa, where monsoon winds are typically strongest, and the asymmetry favouring higher values towards the west reflects the fact that LPSs are more commonly found in the eastern part of the monsoon trough.
The non-linear term, i.e. the contribution to the anomalous vorticity due to the interaction between the LPS and the BSISO, is given in Fig. 13c. The anomalous vorticity is mostly confined to the boundary layer and very near to the system centre, where it reaches a comparatively large magnitude. There are two potential causes of this. Firstly, LPSs are thought to grow through moist barotropic instability, extracting energy from the basic state of the monsoon (Diaz and Boos, 2019). As phase 5 increases the intensity of the monsoon background state, LPSs could extract proportionally more energy and thus intensify further than in the absence of that perturbation. Secondly, frictional convergence scales approximately quadratically with near-surface winds (Smagorinsky, 1963); therefore an LPS vortex and a vortical BSISO background state constructively interfere to produce frictional convergence – and hence, through stretching, relative vorticity in the boundary layer – that is greater than the sum of its parts.
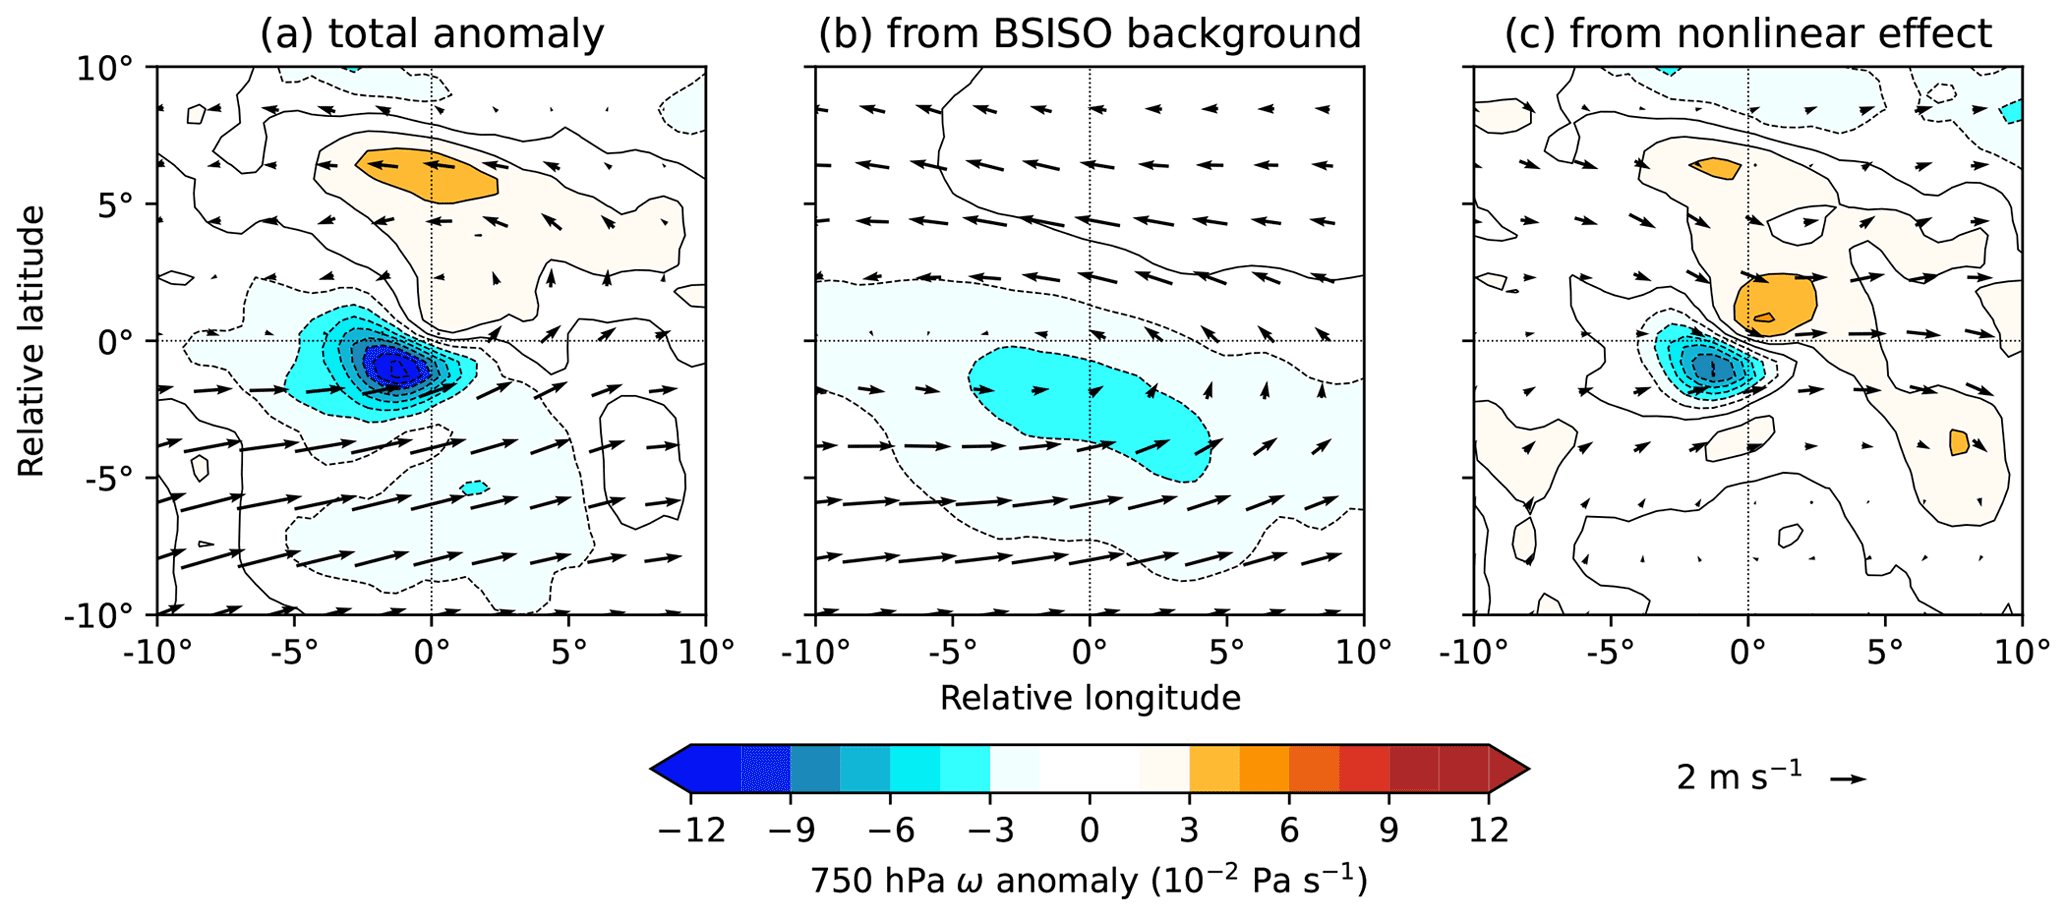
Figure 14Anomalous system-centred 750 hPa ω and winds for LPSs in BSISO phase 5, compared with the all-LPS mean. The total anomaly is given in (a), the contribution from the BSISO alone is given in (b), and the contribution from the interaction between the BSISO and LPSs is given in (c). Computed for monsoon LPSs north of 15∘ N.
To test the first of these hypotheses, we split the composite anomaly of both horizontal and vertical winds using the same technique as in Fig. 13. Figure 14 shows a horizontal cross-section through this composite taken at 750 hPa. The BSISO background state imparts a relatively strong cyclonic anomaly at this level, centred slightly to the south of the composite LPS. This is associated with a weak but relatively large-scale increase in ascent, located further south. In contrast, the non-linear contribution explains most of the anomalous ascent; but it is the winds that are of particular interest here. The presence of the LPS reduces the meridional shear associated with the BSISO, as easterlies present to the north of the composite LPS in the background state are significantly reduced in magnitude by the non-linear term. This implies that LPSs in this region can indeed extract the additional shear present during phase 5 of the BSISO, consequently intensifying more through moist barotropic instability than they would otherwise.
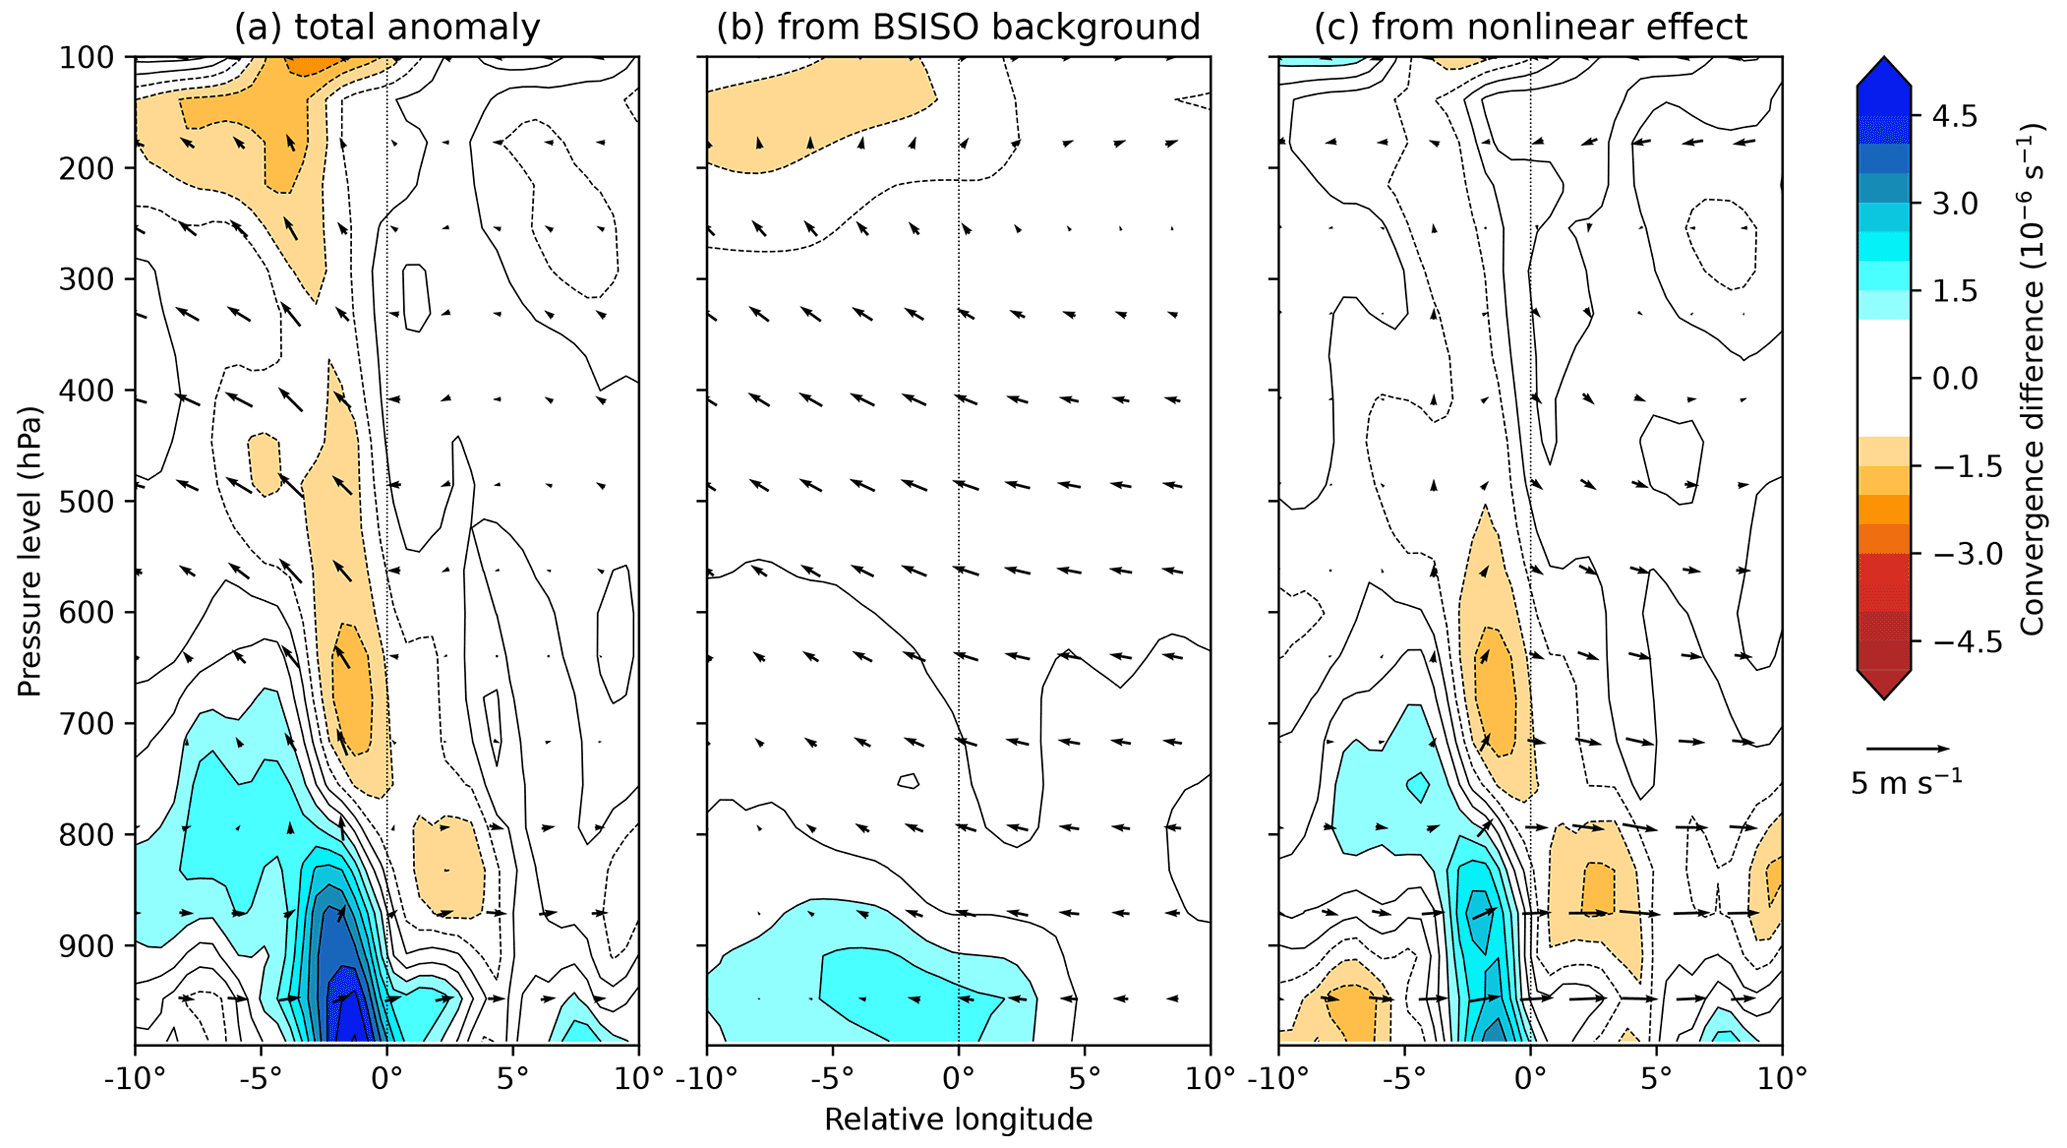
Figure 15Zonal-vertical cross-sections of anomalous system-centred convergence and winds (parallel to the plane, i.e. u and w components, with w exaggerated by a factor of 200, approximately in keeping with the figure aspect ratio) for LPSs in BSISO phase 5, compared with the all-LPS mean. The total anomaly is given in (a), the contribution from the BSISO alone is given in (b), and the contribution from the interaction between the BSISO and LPSs is given in (c). Computed for monsoon LPSs north of 15∘ N.
This only explains some of the anomalous vorticity in Fig. 13, since the anomalous winds associated with the BSISO background state are relatively weak in the boundary layer and barotropic growth is not sufficiently strong there to counteract that (Diaz and Boos, 2019). We therefore investigate the second of our hypotheses: the contribution of non-linear frictional convergence. Vertical composites of convergence, zonal, and vertical winds are given in Fig. 15, separated in the same way as in Figs. 13 and 14.
The anomalous convergence for LPSs in BSISO phase 5 is largest in the boundary layer, particularly near the surface, and is confined to within a few hundred kilometres of the centre of the LPS. The contribution of the anomalous BSISO background state to this is – as with vorticity – relatively broad and, although positive at the centre of the LPS, biased towards the west. The non-linear contribution, caused by the interaction between the composite LPS and the anomalous BSISO background state, explains most of the total anomaly. However, it is located away from the centre, meaning that it is unlikely to be directly responsible for the increase in vorticity seen in Fig. 13c, since the resultant stretching would occur several hundred kilometres too far west.
This out-of-phase relationship between convergence and vorticity – known as moisture vortex instability – has been observed in monsoon LPSs (Adames and Ming, 2018). However, it is unlikely to be occurring here since it requires the long timescales provided by organised deep convection, whereas this interaction deals with shallow convection confined largely to the boundary layer. However, the convergence caused by the BSISO background state is also reasonably strong: the composite maximum of 1.3 × 10⁻⁶ s−1 is only about 30 % weaker than the non-linear convergence maximum (1.9 × 10⁻⁶ s−1) and so may play an important role in vortex stretching.

Figure 16Zonal-vertical cross-sections of vortex stretching in monsoon LPSs. The composite average for all LPSs is given in (a). The remaining subplots show contributions to the anomalous stretching in LPSs during BSISO phase 5 from (b) convergence from the mean BSISO itself and (c) convergence provided by the non-linear interaction between LPSs and the BSISO. Computed for monsoon LPSs north of 15∘ N.
The vertical structure of anomalous vortex stretching (ζ∇⋅uh) is shown in Fig. 16. Here, we show the mean vortex stretching for all LPSs north of 15∘ N (Fig. 16a), and the anomalous terms (Fig. 16b and c) represent the stretching imparted on phase-5 LPSs by the BSISO background state and non-linear LPS convergence respectively. Two contrasting patterns emerge. The convergence provided by the BSISO stretches the vortex most strongly at the LPS centre and in the boundary layer – this pattern is similar to the overall mean, but about 15 % of the magnitude, and will result in boundary layer and low-level intensification of the LPS, in addition to that provided further aloft by the increased barotropic instability discussed in the analysis of Fig. 10.
On the other hand, stretching provided by the non-linear convergence occurs off-centre, to the west, and extends more deeply into the lower troposphere, where it peaks at about 850 hPa, the typical level associated with maximum LPS vorticity (Fig. 12c). This has implications for propagation – increased stretching to the west results in an increase in there, accelerating westward LPS movement during BSISO phase 5. LPSs are typically thought to propagate through advection by mid-level steering winds (Boos et al., 2015) and interaction with the orography to the north (Hunt and Parker, 2016), but we have seen that anomalous steering winds do not explain the anomalous LPS propagation seen during different BSISO phases, and of course the orography is fixed. Therefore, even though vortex stretching plays a relatively minor role in mean LPS propagation – notably it is largest to the southwest (Sanders, 1984; Chen et al., 2005), although LPSs propagate to the northwest – we propose that it might at least partially explain the anomalous propagation in Fig. 5.
In this study, we investigated the relationship between the BSISO – the largest mode of intraseasonal variability affecting the South Asian monsoon – and low-pressure systems – the dominant synoptic event responsible for monsoon rainfall.
We started by quantifying the effect of the BSISO on the mean monsoon, where it has a strong relationship with both low-level vorticity and rainfall – in some regions more than doubling their climatological values – with the effect moving northwards from phases 2 and 3 over the south of the peninsula to phases 5 and 6 over the monsoon trough and Himalayan foothills. The active (i.e. where rainfall and vorticity are enhanced) and break (i.e. where rainfall and vorticity are suppressed) phases of the BSISO behave largely in an equal and opposite manner.
We showed that LPS genesis similarly follows this northward propagation of BSISO activity, reporting results similar to Deoras et al. (2021) that LPS genesis is strongly preferred over Sri Lanka in phase 2, over the central Bay of Bengal in phase 4, and over the head of the Bay of Bengal in phases 5 and 6. This relationship is strongest in regions with climatologically low monsoon LPS genesis, like the Arabian Sea and the centre and south of the Bay of Bengal. This relationship formed part of a delayed relationship: BSISO activity first increases the background relative vorticity, then, after a few days, LPS genesis increases, followed by total column water vapour and precipitation. Further research is still needed to better understand the relationship between favourable conditions, organised convection, and LPS genesis. We found no relationship between BSISO amplitude and LPS genesis, following similar results reported for the MJO by Haertel and Boos (2017).
Before moving onto composite analysis, we split LPSs into two groups – north and south of 15∘ N – noting that the two subsets exist in significantly different environments, affected by different phases of the BSISO.
We found that the phase of the BSISO strongly affects the propagation of LPSs in both groups. Northern LPSs travel northwestward about 20 % faster during phases 5 and 6 but about 20 % slower in phase 2. Southern LPSs are much more strongly affected, with their propagation direction – not just speed – being a function of BSISO phase. For example, mean propagation is southeast in phases 8 and 1, northeast in phases 2 and 3, northwest in phases 4 and 5, and southwest in phases 6 and 7. We argue that even though mean propagation is well explained for all LPSs by mid-level steering winds (as in Boos et al., 2015), these propagation anomalies are not.
We also found that the phase of the BSISO strongly affects LPS precipitation. Rainfall associated with northern LPSs is significantly increased during BSISO phases 5, 6, and 7 and significantly reduced during phases 1, 2, and 3. This has a profound impact on the composite rainfall maximum – which is 51 % higher than the all-LPS mean during phase 5 and 39 % lower than the all-LPS mean during phase 2. For southern LPSs, even though their mean rainfall is much lower, the absolute effect of the BSISO is comparable to that for northern LPSs, although this is shifted through two phases on account of their different mean latitudes so that rainfall is increased during phases 3, 4, and 5 and reduced during phases 7, 8, and 1. This results in much larger fractional changes: the composite maximum is more than twice as high during phase 5 as in the all-LPS mean.
By linearising the anomalous moisture flux convergence associated with LPSs during phase 5, we showed that the large rainfall anomalies are explained by changes imparted by the BSISO on monsoon circulation, rather than moisture. Using the ω-forcing equation and quasi-geostrophic theory, we further narrow this down to the result of changes to the vertical structure of vorticity of the monsoon by the BSISO, as opposed to changes in the thermodynamic structure or large-scale diabatic heating from additional convection.
We then used the case of northern LPSs occurring during BSISO phase 5 to investigate the how the BSISO affects internal LPS dynamics. We found that the vertical structure of anomalous vorticity – that is the difference in vorticity between phase 5 LPSs and all LPSs – could be separated into two distinct components: that provided directly by the BSISO and that arising from a non-linear interaction between the LPS and the BSISO. The background BSISO term is broad in scale and persists through much of the troposphere but is relative weak; in contrast, the non-linear term is strongly confined to the centre of the LPS where it is strongest in the boundary layer and does not penetrate much into the troposphere. We suggested two hypotheses for the origin of this non-linear term: firstly, that it arises due to the approximately quadratic relationship between near-surface winds and frictional convergence (Smagorinsky, 1963) and secondly, that the LPS is responding to the increased barotropic instability of the background state.
We found that both hypotheses were valid, with the barotropic instability argument likely to explain increased vorticity in the lower troposphere and the frictional convergence argument likely to explain the increased vorticity in the boundary layer. Similarly separating anomalous convergence into BSISO and non-linear contributions, we showed that both were important in the boundary layer and that the BSISO contribution was in fact only slightly weaker. Future work could employ targeted modelling to understand the relationship between and relative importance of these two sources of convergence and low-level vorticity.
Finally, we computed anomalous vortex stretching terms by multiplying these anomalous convergence terms with the total vorticity. The convergence associated with the BSISO background state is mostly centred on the LPS, as is its related stretching, which we suggest results in increased LPS intensity. In contrast, the stretching associated with the non-linear term occurs off-centre, to the west, where we argue it supports the anomalously fast northwestward propagation of phase 5 LPSs. Further exploration of the role of the interaction between anomalous vortex stretching and anomalous steering winds in driving anomalous LPS propagation in different BSISO phases is left for future work.
All data used are freely available with repository links given in Sect. 2.
The supplement related to this article is available online at: https://doi.org/10.5194/wcd-3-1341-2022-supplement.
KMRH performed the data analysis and led the conceptual design and drafting of the manuscript following discussion with AGT. The manuscript was iterated by AGT, who also procured the funding for the work.
The contact author has declared that neither of the authors has any competing interests.
Publisher’s note: Copernicus Publications remains neutral with regard to jurisdictional claims in published maps and institutional affiliations.
Kieran M. R. Hunt and Andrew G. Turner are funded through the Weather and Climate Science for Service Partnership (WCSSP) India, a collaborative initiative between the Met Office, supported by the UK Government's Newton Fund, and the Indian Ministry of Earth Sciences (MoES).
This research has been supported by the Newton Fund (grant no. WCSSP India Lot 2, WP2).
This paper was edited by Juliane Schwendike and reviewed by Nirupam Karmakar and two anonymous referees.
Adames, Á. F. and Ming, Y.: Interactions between water vapor and potential vorticity in synoptic-scale monsoonal disturbances: Moisture vortex instability, J. Atmos. Sci., 75, 2083–2106, 2018. a
Bluestein, H. B.: Synoptic-dynamic meteorology in midlatitudes. Volume II. Observations and theory of weather systems, New York, NY (United States), Oxford University Press, p. 392, ISBN-13: 978-0195062687, 1993. a
Boos, W. R., Hurley, J. V., and Murthy, V. S.: Adiabatic westward drift of Indian monsoon depressions, Q. J. Roy. Meteor. Soc., 141, 1035–1048, https://doi.org/10.1002/qj.2454, 2015. a, b, c, d, e, f
Chen, T.-C., Yoon, J.-H., and Wang, S.-Y.: Westward propagation of the Indian monsoon depression, Tellus, 57A, 758–769, https://doi.org/10.1111/j.1600-0870.2005.00140.x, 2005. a, b
Deoras, A. S., Hunt, K. M. R., and Turner, A. G.: The four varieties of South Asian monsoon low-pressure systems and their modulation by tropical intraseasonal variability, Weather, 76, 194–200, 2021. a, b, c
Deoras, A. S., Turner, A. G., and Hunt, K. M. R.: The structure of strong Indian monsoon low-pressure systems in Subseasonal-to-Seasonal prediction models, Q. J. Roy. Meteor. Soc., 148, 2147–2166, https://doi.org/10.1002/qj.4296, 2022. a
Diaz, M. and Boos, W. R.: Monsoon depression amplification by moist barotropic instability in a vertically sheared environment, Q. J. Roy. Meteor. Soc., 145, 2666–2684, 2019. a, b
Ditchek, S. D., Boos, W. R., Camargo, S. J., and Tippett, M. K.: A genesis index for monsoon disturbances, J. Climate, 29, 5189–5203, https://doi.org/10.1175/JCLI-D-15-0704.1, 2016. a
Dong, W., Ming, Y., and Ramaswamy, V.: Projected changes in South Asian monsoon low pressure systems, J. Climate, 33, 7275–7287, 2020. a
Godbole, R. V.: The composite structure of the monsoon depression, Tellus, 29, 25–40, https://doi.org/10.1111/j.2153-3490.1977.tb00706.x, 1977. a, b
Goswami, B. N. and Ajayamohan, R. S.: Intraseasonal oscillations and interannual variability of the Indian summer monsoon, J. Climate, 14, 1180–1198, 2001. a
Goswami, B. N., Ajayamohan, R. S., Xavier, P. K., and Sengupta, D.: Clustering of synoptic activity by Indian summer monsoon intraseasonal oscillations, Geophys. Res. Lett., 30, 1431, https://doi.org/10.1029/2002GL016734, 2003. a
Haertel, P. and Boos, W. R.: Global association of the Madden-Julian Oscillation with monsoon lows and depressions, Geophys. Res. Lett., 44, 8065–8074, 2017. a, b
Hatsuzuka, D. and Fujinami, H.: Effects of the South Asian monsoon intraseasonal modes on genesis of low pressure systems over Bangladesh, J. Climate, 30, 2481–2499, 2017. a, b
Hersbach, H., Bell, B., Berrisford, P., Biavati, G., Horányi, A., Muñoz Sabater, J., Nicolas, J., Peubey, C., Radu, R., Rozum, I., Schepers, D., Simmons, A., Soci, C., Dee, D., and Thépaut, J.-N.: ERA5 hourly data on pressure levels from 1959 to present, Copernicus Climate Change Service (C3S) Climate Data Store (CDS) [data set], https://doi.org/10.24381/cds.bd0915c6, 2018. a
Hersbach, H., Bell, B., Berrisford, P., et al.: The ERA5 global reanalysis, Q. J. Roy. Meteor. Soc., 146, 1999–2049, 2020. a
Hsu, P.-C., Lee, J.-Y., Ha, K.-J., and Tsou, C.-H.: Influences of boreal summer intraseasonal oscillation on heat waves in monsoon Asia, J. Climate, 30, 7191–7211, 2017. a, b
Hunt, K. M. R.: Monsoon low-pressure-system tracks over South Asia (1979–2019) (2.1.2), Zenodo [data set], https://doi.org/10.5281/zenodo.5575336, 2021. a
Hunt, K. M. R. and Fletcher, J. K.: The relationship between Indian monsoon rainfall and low-pressure systems, Clim. Dynam., 53, 1–13, 2019. a, b, c
Hunt, K. M. R. and Menon, A.: The 2018 Kerala floods: a climate change perspective, Clim. Dynam., 54, 2433–2446, 2019. a
Hunt, K. M. R. and Parker, D. J.: The movement of Indian Monsoon Depressions by interaction with image vortices near the Himalayan wall, Q. J. Roy. Meteor. Soc., 142, 2224–2229, https://doi.org/10.1002/qj.2812, 2016. a
Hunt, K. M. R., Turner, A. G., Inness, P. M., Parker, D. E., and Levine, R. C.: On the structure and dynamics of Indian monsoon depressions, Mon. Weather Rev., 144, 3391–3416, https://doi.org/10.1175/MWR-D-15-0138.1, 2016. a, b
Hurley, J. V. and Boos, W. R.: A global climatology of monsoon low pressure systems, Q. J. Roy. Meteor. Soc., 141, 1049–1064, https://doi.org/10.1002/qj.2447, 2015. a, b, c
Karmakar, N., Boos, W. R., and Misra, V.: Influence of intraseasonal variability on the development of monsoon depressions, Geophys. Res. Lett., 48, e2020GL090425, https://doi.org/10.1029/2020GL090425, 2021. a, b, c
Kikuchi, K.: The boreal summer intraseasonal oscillation (BSISO): A review, J. Meteorol. Soc. Jpn. Ser. II, 9, 933–972, 2021. a
Kikuchi, K.: Bimodal ISO index from historical data analysis to real time monitoring, University of Hawaii [data set], http://iprc.soest.hawaii.edu/users/kazuyosh/Bimodal_ISO.html, last access: 14 November 2022. a
Kikuchi, K., Wang, B., and Kajikawa, Y.: Bimodal representation of the tropical intraseasonal oscillation, Clim. Dynam., 38, 1989–2000, 2012. a, b
Krishnamurthy, V. and Ajayamohan, R. S.: Composite structure of monsoon low pressure systems and its relation to Indian rainfall, J. Climate, 23, 4285–4305, https://doi.org/10.1175/2010JCLI2953.1, 2010. a
Krishnamurthy, V. and Shukla, J.: Intraseasonal and interannual variability of rainfall over India, J. Climate, 13, 4366–4377, 2000. a
Lee, J.-Y., Wang, B., Wheeler, M. C., Fu, X., Waliser, D. E., and Kang, I.-S.: Real-time multivariate indices for the boreal summer intraseasonal oscillation over the Asian summer monsoon region, Clim. Dynam., 40, 493–509, 2013. a, b, c, d, e
Martin, G. M., Brooks, M. E., Johnson, B., Milton, S. F., Webster, S., Jayakumar, A., Mitra, A. K., Rajan, D., and Hunt, K. M. R.: Forecasting the monsoon on daily to seasonal time-scales in support of a field campaign, Q. J. Roy. Meteor. Soc., 146, 2906–2927, https://doi.org/10.1002/qj.3620, 2020. a
Neelin, J. D. and Held, I. M.: Modeling tropical convergence based on the moist static energy budget, Mon. Weather Rev. 115, 3–12, 1987. a
Pai, D. S., Sridhar, L., and Ramesh Kumar, M. R.: Active and break events of Indian summer monsoon during 1901–2014, Clim. Dynam., 46, 3921–3939, 2016. a
Rao, K. and Rajamani, S.: Diagnostic study of a monsoon depression by geostrophic baroclinic model, Indian Journal of Meteorology and Geophysics, 21, 187–194, 1970. a
Roy, P. and Rao, T. N.: Precipitation Characteristics of Cyclonic Disturbances over South Asia Region as Revealed by TRMM and GPM, J. Climate, 35, 4943–4957, https://doi.org/10.1175/JCLI-D-21-0774.1, 2022. a
Sanders, F.: Quasi-geostrophic diagnosis of the monsoon depression of 5–8 July 1979, J. Atmos. Sci., 41, 538–552, https://doi.org/10.1175/1520-0469(1984)041<0538:QGDOTM>2.0.CO;2, 1984. a, b
Sarker, R. P. and Choudhary, A.: A diagnostic study of monsoon depressions, Mausam, 39, 9–18, 1988. a
Smagorinsky, J.: General circulation experiments with the primitive equations: I. The basic experiment, Mon. Weather Rev., 91, 99–164, 1963. a, b
Suhas, D. L., Ramesh, N., Kripa, R. M., and Boos, W. R.: Influence of monsoon low pressure systems on South Asian disasters and implications for disaster prediction, Nat. Hazards [preprint], https://doi.org/10.21203/rs.3.rs-1498790/v1, 2022. a
Thomas, T. M., Bala, G., and Srinivas, V. V.: Characteristics of the monsoon low pressure systems in the Indian subcontinent and the associated extreme precipitation events, Clim. Dynam., 56, 1859–1878, 2021. a
Turner, A. G. and Annamalai, H.: Climate change and the South Asian summer monsoon, Nat. Clim. Change, 2, 587–595, 2012. a
Wang, B. and Xie, X.-S.: A model for the boreal summer intraseasonal oscillation, J. Atmos. Sci., 54, 72–86, 1997. a
Webster, P. J., Magaña, V. O., Palmer, T. N., Shukla, J., Tomas, R. A., Yanai, M., and Yasunari, T.: Monsoons: Processes, predictability, and the prospects for prediction, J. Geophys. Res.-Oceans, 103, 14451–14510, https://doi.org/10.1029/97JC02719, 1998. a
Wheeler, M. C. and Hendon, H. H.: An all-season real-time multivariate MJO index: Development of an index for monitoring and prediction, Mon. Weather Rev., 132, 1917–1932, 2004. a, b
Recall that BSISO phase numbers are discretised from a continuous circular distribution, with e.g. “phase 3” including phase numbers between 2.5 and 3.5. In the discrete space used in our maps, half a phase is the difference between being in the spatial centre of a phase and being at its boundary.
boreal summer intraseasonal oscillation– the chief means of large-scale control on the monsoon at timescales of a few weeks. Our study offers new insights for useful prediction of these storms, important for both water resources planning and disaster early warning.