the Creative Commons Attribution 4.0 License.
the Creative Commons Attribution 4.0 License.
 | 24 Nov 2022
Can low-resolution CMIP6 ScenarioMIP models provide insight into future European post-tropical-cyclone risk?
Elliott Michael Sainsbury
Reinhard K. H. Schiemann
Kevin I. Hodges
Alexander J. Baker
Len C. Shaffrey
Kieran T. Bhatia
Stella Bourdin
Post-tropical cyclones (PTCs) can cause extensive damage across Europe through extreme winds and heavy precipitation. With increasing sea surface temperatures, tropical cyclones (TCs) may form and travel further poleward and eastward than observed historically. Recent work has suggested that the frequency of intense Europe-impacting PTCs may increase substantially in the future.
Using an objective feature-tracking scheme and TC identification method, we track and identify the full life cycle of TCs in the North Atlantic in five CMIP6 climate models in the historical (1984–2014) period and in the future under the SSP5-85 scenario (2069–2099). These five models are selected based on their ability to simulate TC frequency similar to observed in the North Atlantic, although model deficiencies remain.
We find no robust changes in Europe-impacting PTC frequency or intensity in the future. This is because two competing factors – a significant decrease in TC frequency of 30 %–60 % and an increase in the proportion of TCs reaching Europe – are approximately the same size. The projected increase in the proportion of TCs reaching Europe is largely driven by an increase in the likelihood of recurvature and is consistent with projected decreases in vertical wind shear and increases in potential intensity along the US East Coast in the future. The projected increased likelihood of recurvature is also associated with a shift in TC genesis away from the main development region, where model biases cause very few TCs to recurve. This study indicates that large uncertainties surround future Europe-impacting PTCs and provides a framework for evaluating PTCs in future generations of climate models.
- Article
(8633 KB) - Full-text XML
-
Supplement
(2779 KB) - BibTeX
- EndNote


Post-tropical cyclones (PTCs) can bring Europe hazardous weather such as extreme precipitation, high winds, and large waves (Bieli et al., 2019; Evans et al., 2017; Jones et al., 2003). Compared to the overall European cyclone climatology, PTCs are disproportionately responsible for the most intense windstorms to impact Europe during hurricane season (Sainsbury et al., 2020) and often attain their maximum intensity a couple of days after impacting the region, enhancing their destructive potential (Baker et al., 2021; Dekker et al., 2018).
In 2017, Hurricane Ophelia (Rantanen et al., 2020) became the easternmost major hurricane on record (Stewart, 2018), and in 2019 Hurricane Lorenzo became the easternmost category 5 hurricane on record. Both cyclones later impacted Europe as PTCs, and Ophelia was responsible for Ireland's highest-recorded wind gust of 53 m s−1 (119 mph). Projected increases in sea surface temperature (SST) and the range of latitudes occupied by TCs (Studholme et al., 2022), combined with the observed trend in TC lifetime maximum intensity latitude (Kossin et al., 2014), open the possibility for more cyclones to form – and attain high intensities – further poleward and eastward in the basin, closer to Europe (Baker et al., 2022; Haarsma et al., 2013; Haarsma, 2021). Additionally, as TCs attain greater intensities they may become more resilient to hostile environmental conditions such as decreasing SSTs and increasing wind shear (Baker et al., 2022; Michaelis and Lackmann, 2019), increasing their likelihood of both recurving (Sainsbury et al., 2022a) and reaching Europe (Sainsbury et al., 2022b). Diabatic processes have also been shown to be important in case studies of high-impact PTCs (Rantanen et al., 2020), implying a future increased PTC risk in a warmer atmosphere which is capable of holding a larger amount of moisture (Haarsma, 2021).
Few studies have investigated the projected changes of Europe-impacting PTCs, and those that do only considered storm-force (Baatsen et al., 2015) and hurricane-force (Haarsma et al., 2013) PTCs. Using a high-resolution (∼25 km in midlatitudes) climate model with prescribed SSTs, Haarsma et al. (2013) found large increases in hurricane-force PTC frequency over Norway, the North Sea, and the Bay of Biscay by the end of the 21st century under the IPCC Representative Concentration Pathway 4.5 (RCP 4.5) scenario but based on a small sample size. The projected increase was associated with an increase in SSTs, extending the TC genesis region poleward and eastward and therefore allowing more TCs to reach the baroclinic midlatitudes before dissipating. When considering storm-force Europe-impacting PTCs in the same simulations, the minimum sea level pressure that the cyclones attained was found to be 8 hPa lower at the end of the 21st century (Baatsen et al., 2015).
Liu et al. (2017) considered North Atlantic TCs undergoing extratropical transition (ET) more generally and found an increase in TC density in the eastern North Atlantic under the RCP 4.5 emission scenario by the end of the century in a flux-adjusted version of the FLOR model (Vecchi et al., 2014), indicating an increase in TC-related risks for Europe. A statistically significant increase in the fraction of TCs undergoing ET is also found in the future (Liu et al., 2017). This trend has also been found in several (but not all) reanalyses (Baker et al., 2021), and mixed results have been found in climate model studies (Michaelis and Lackmann, 2019; Bieli et al., 2020). Using a pseudo-global-warming (PGW) approach to dynamical downscaling, Jung and Lackmann (2019) found that Hurricane Irene (Avila and Cangialosi, 2011) would be considerably stronger (>20 hPa deeper) in a future climate under the RCP 8.5 scenario and would undergo extratropical transition for considerably (18 h) longer, extending TC-like conditions further poleward than in the present climate. Further PGW case studies also show increases in precipitation during the ET phase (Liu et al., 2020) and an increase in TC strength during the ET process (Jung and Lackmann, 2021), further highlighting the potential future increase in TC-related hazards to midlatitude regions. Finally, Baker et al. (2022) find an increase in the frequency of ET events in the North Atlantic along with a poleward shift in ET location by 2050 in HighResMIP models under the RCP 8.5 scenario. While this is the first multi-model study of projected changes in ET in an ensemble of high-resolution climate models, it does not have a European focus. Additionally, projections are limited to 2050, by which time forced changes may not have fully emerged.
Given the potential for an increased PTC risk to Europe in the future, a multi-model study with a focus on Europe is necessary to quantify the associated model uncertainty and to assess whether lower-resolution models can provide insight into future PTC changes. Many lower-resolution climate models do not simulate a realistic TC frequency (e.g. Camargo, 2013), and even high-resolution climate models are unable to capture the strongest TCs (e.g. Walsh et al., 2015; Vidale et al., 2021; Roberts et al., 2020a). In this paper we investigate the projected changes in Europe-impacting PTCs in an ensemble of five CMIP6 models which are shown to simulate a realistic North Atlantic TC frequency compared to observations. Some of these models have a lower horizontal resolution than previous studies (e.g. Baker et al., 2022; Haarsma et al., 2013), and thus simulated TCs are expected to be weaker. However, a multi-model study using models containing multiple ensemble members allows for a greater sample size and greater uncertainty quantification. It is unknown whether low-resolution CMIP6 models can give insight into projected changes in TC and PTC statistics despite their deficiencies and biases. This is investigated in this study. As far as the authors are aware, a multi-model study with a focus particularly on Europe-impacting PTCs has never been undertaken.
This paper aims to answer the following questions.
-
To what extent can CMIP6 models capture the characteristics of the North Atlantic TC climatology?
-
How well do CMIP6 models capture the disproportionate intensity associated with Europe-impacting PTCs relative to the overall cyclone climatology?
-
Are there any areas of model consensus regarding projected changes in PTC frequency over Europe?
In Sect. 2, we describe the cyclone detection and tracking scheme, TC identification procedure, and CMIP6 models included in this study. Section 3 contains an overview of the TC climatologies in the selected CMIP6 models, the projected changes in the frequency and intensity of Europe-impacting PTCs, and further analysis to investigate the cause of the projected changes. The paper concludes with a discussion in Sect. 4.
2.1 Data
For this study, we use data from the fully coupled historical and SSP5-85 model simulations from phase 6 of the Coupled Model Intercomparison Project (CMIP6; Eyring et al., 2016). Although many CMIP6 models have a resolution too low to simulate the observed structure and intensity of TCs, low-resolution climate models can often still simulate TC-like vortices (Haarsma et al., 1993). On average, there are 6.4 North Atlantic hurricanes (wind speeds m s−1) per year in observations (HURDAT2) between 1950 and 2014. Climate models tend to underestimate TC frequency, therefore models which simulate a median TC frequency >6.4 yr−1 during the North Atlantic hurricane season (1 June–30 November), averaged over the entire historical run, are selected. This threshold is chosen to ensure we focus on CMIP6 models which simulate North Atlantic TC frequency reasonably compared to observations and to ensure the selected models have a sufficient sample size of TCs and Europe-impacting PTCs for meaningful statistical analysis. Information on TC identification can be found in Sect. 2.3, and additional information on CMIP6 model selection can be found in the Supplement (Fig. S1).
The chosen five models are CNRM-CM6-1-HR (CNRM hereafter), HadGEM3-GC31-MM (HadGEM hereafter), KIOST-ESM (KIOST hereafter), MIROC6 (MIROC hereafter), and IPSL-CM6A-LR (IPSL hereafter). CNRM and HadGEM have a higher horizontal resolution in the atmosphere and ocean than the other selected models (Table 1). While CNRM and HadGEM also have HighResMIP simulations available, they use a different experimental protocol (e.g. different aerosol forcing and land surface scheme) and only run out to the year 2050. In this study we focus on the ScenarioMIP simulations for consistency with the other selected models. The period 1984–2014 is used for the historical run and 2069–2099 for the SSP5-85 scenario, giving an 85-year difference between the midpoints of the two time periods considered in this study. More information can be found in Table 1. Key results have been reproduced using only ensemble members which are available for both the historical and SSP5-85 scenario simulations and are shown in the Supplement (Fig. S7 and Table S1). The 6-hourly wind components are utilized at 850, 500, and 250 hPa for calculation of the vorticity fields necessary for TC identification (more information in Sect. 2.2). The 6-hourly mean sea level pressure and 10 m wind data are also used to investigate the intensity of the cyclones. Monthly mean temperature and specific humidity profiles are utilized to calculate potential intensity (PI), monthly mean relative humidity, wind, and SSTs to construct the genesis potential index (Emanuel and Nolan, 2004).
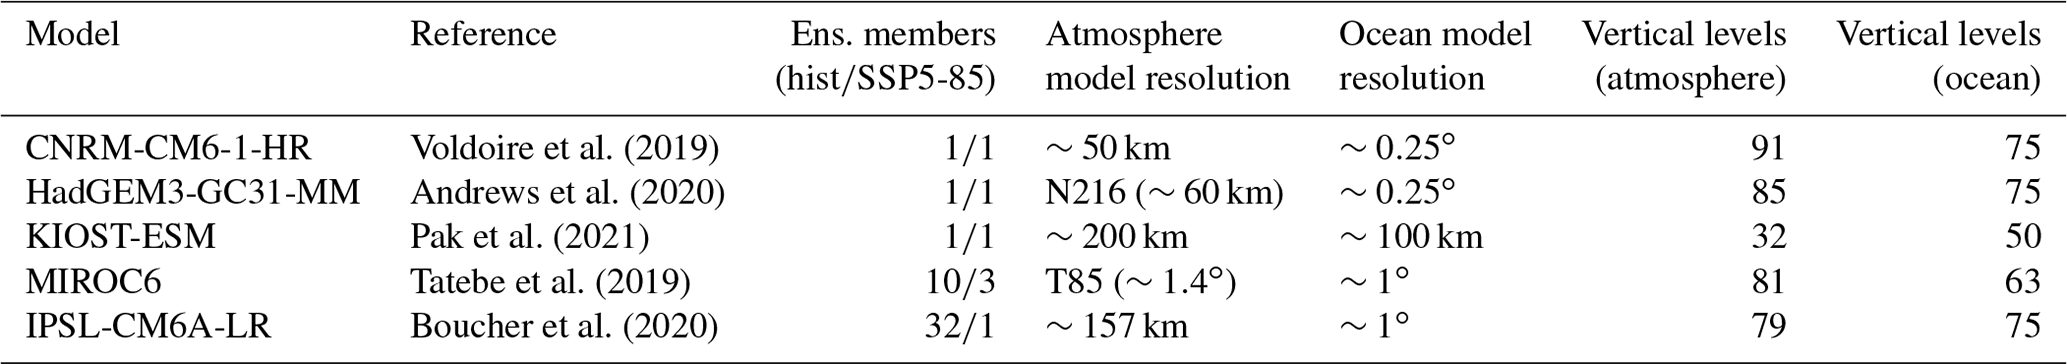
Table 1Summary of the CMIP6 models used in this study, including model name (column 1), reference to model development (column 2), number of ensemble members used (column 3), atmospheric model resolution (column 4), ocean model resolution (column 5), and number of vertical layers in the atmosphere (column 6) and ocean (column 7) models.
Using the same tracking and TC identification scheme as CMIP6 models, the European Centre for Medium-Range Weather Forecasts fifth reanalysis (ERA5; Hersbach et al., 2020) is used for verification of model TC climatologies from 1984–2014. The 6-hourly relative vorticity fields from ERA5 are used for cyclone tracking and TC identification, and 6-hourly sea level pressure and 10 m winds from ERA5 are used to investigate cyclone intensity.
The 6-hourly position, 10 m wind speed, and sea level pressure data from the Hurricane Database version 2 (HURDAT2; Landsea and Franklin, 2013) are used between 1984 and 2014 in Sect. 3.1 to compare TC intensity and spatial distribution with those simulated in ERA5 and CMIP6.
2.2 Cyclone tracking
Cyclone detection and tracking is performed using the objective feature-tracking scheme, TRACK (Hodges, 1994, 1995, 1999), configured for TCs. The tracking is performed on the spectrally filtered (T63 resolution) relative vorticity fields vertically averaged (600–850 hPa) for ERA5 and at 850 hPa (spectrally filtered to T42) for CMIP6 due to data availability. Vorticity anomalies exceeding s−1 are initialized into cyclone tracks using a nearest-neighbour method. The tracks are then refined by minimizing a cost function for track smoothness. For more information on the tracking scheme, see Hodges et al. (2017).
The spatial distribution of the TC track and genesis densities are calculated from the cyclone tracks using the spherical kernel method described in Hodges (1996). Densities are expressed as cyclones per year per unit area, where the unit area is equivalent to a spherical cap with a radius of 5∘ (Figs. 1 and 2).
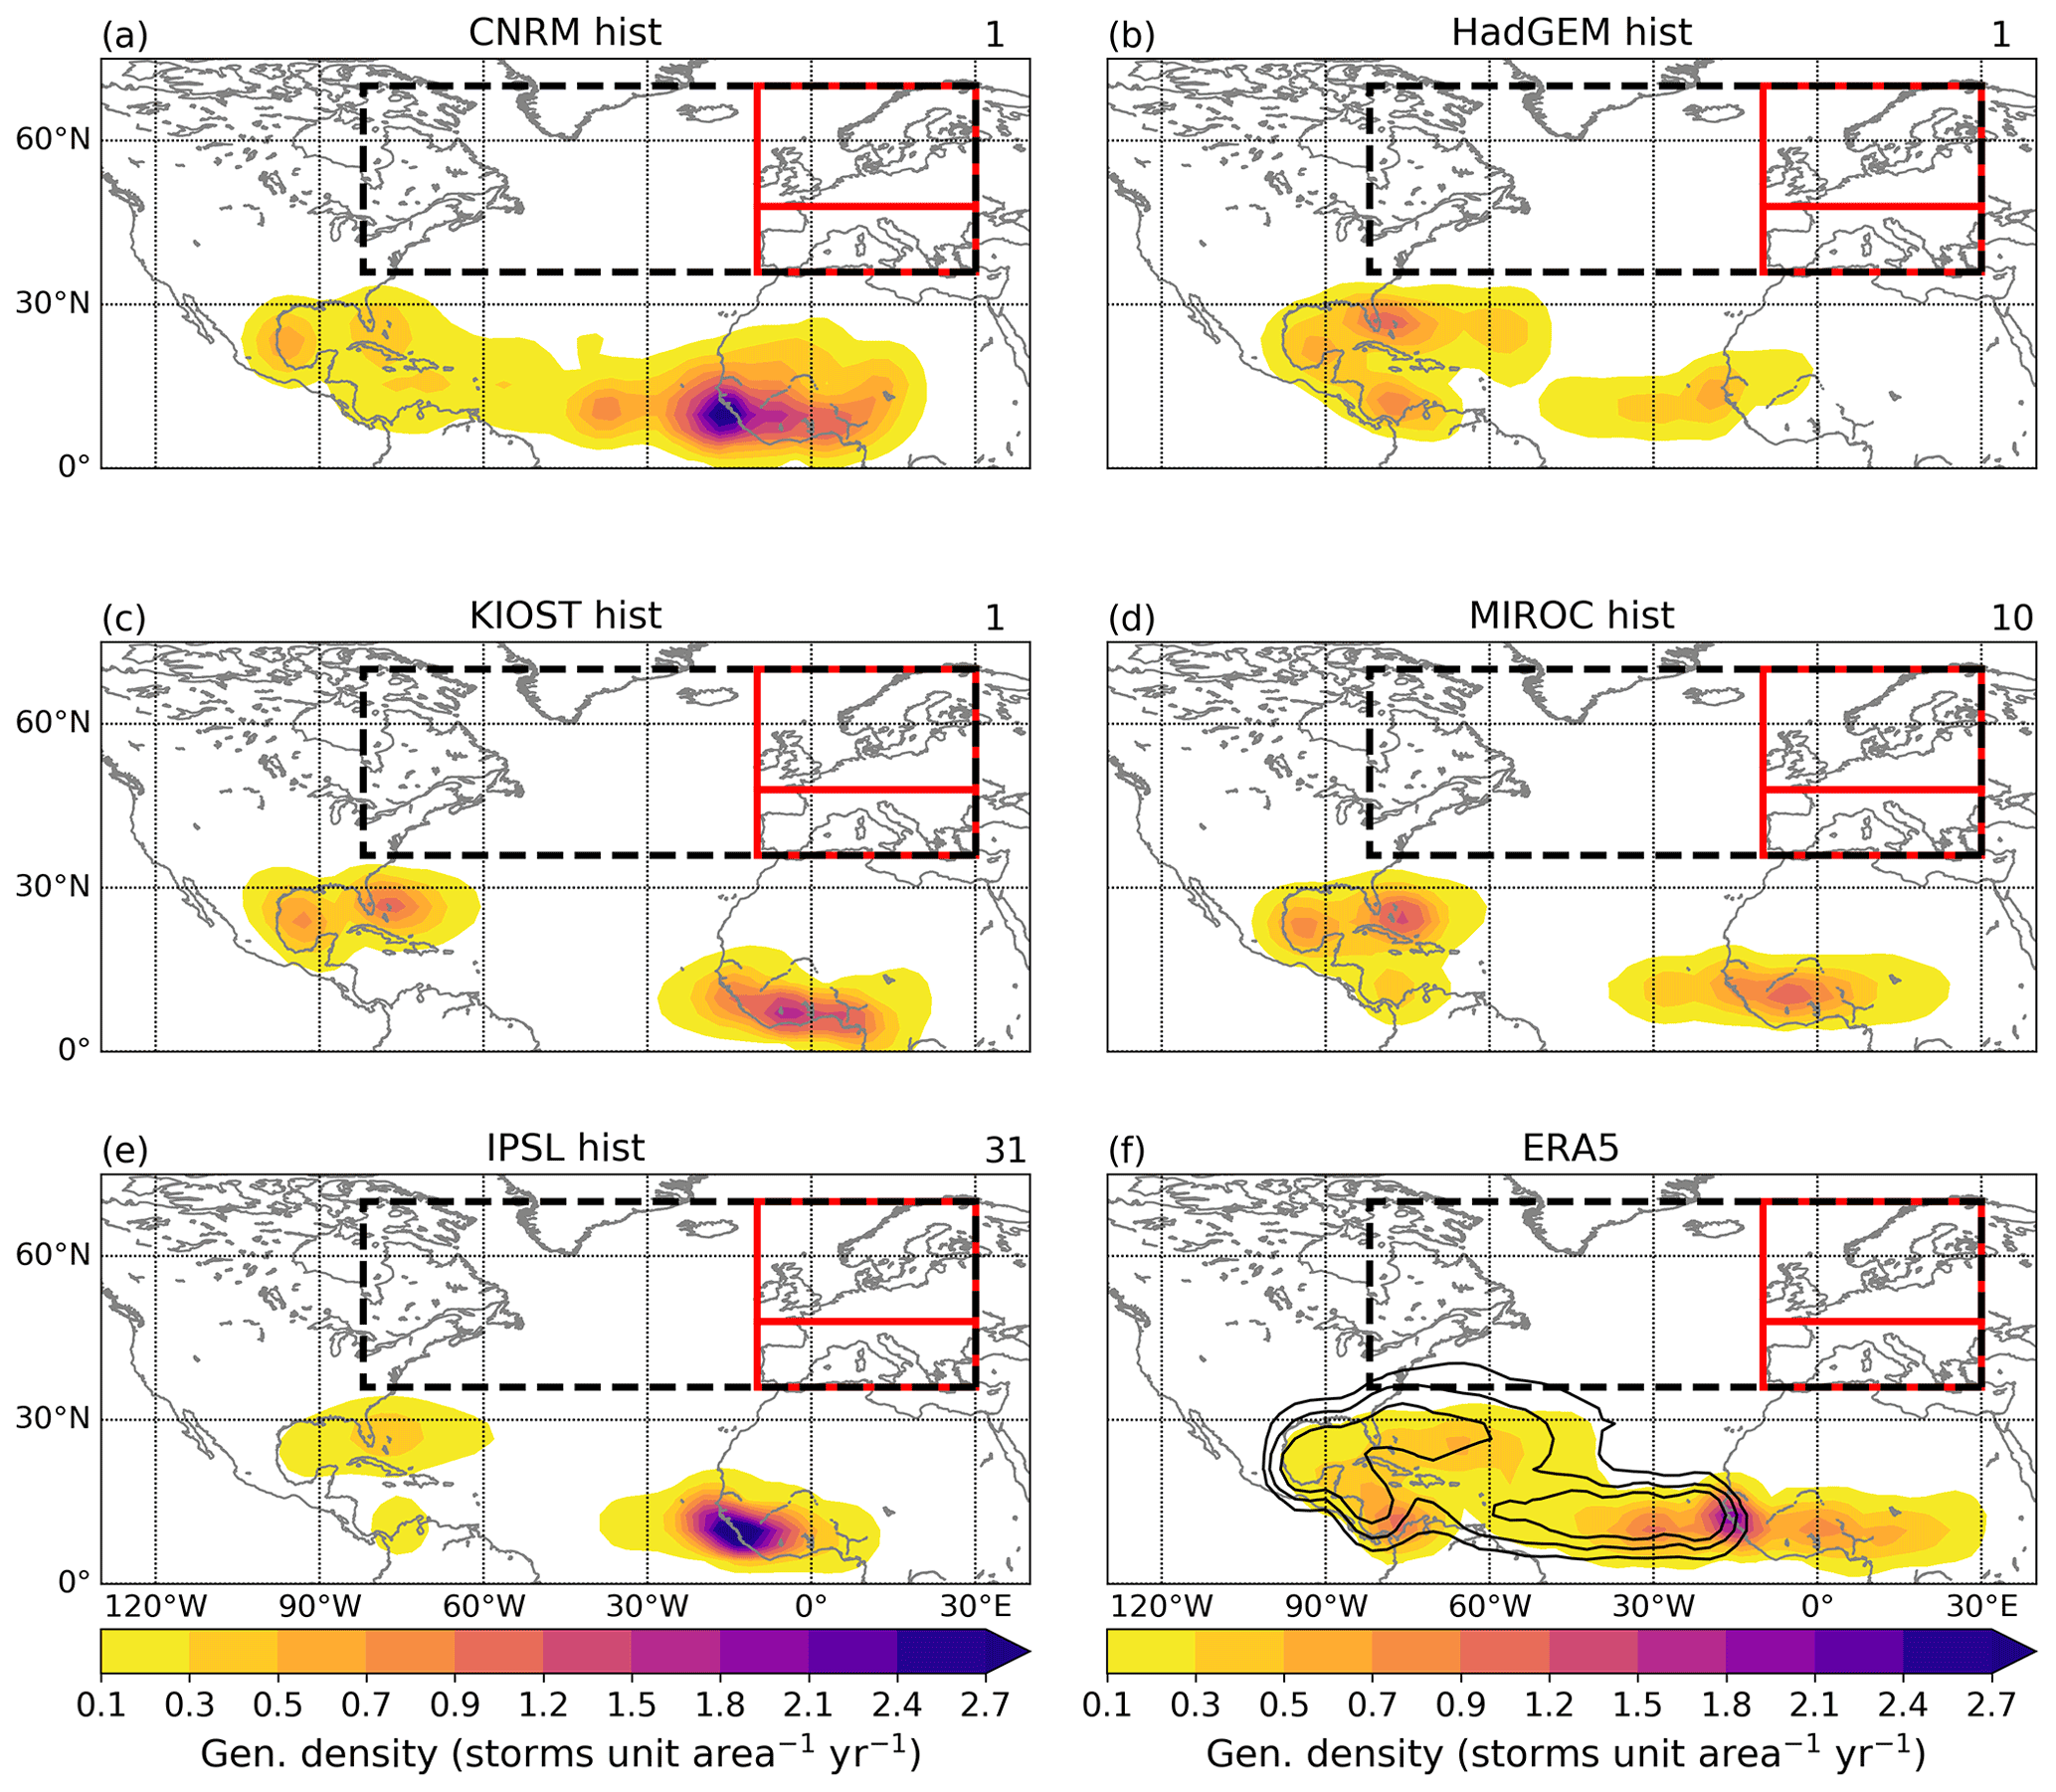
Figure 1Genesis density (storms per unit area per year, where the unit area is equal to a spherical cap with a 5∘ radius) for the 1984–2014 period from the historical runs of five CMIP6 models (a–e), and ERA5 (filled) and HURDAT2 (black lines, f). Only TCs forming during the North Atlantic hurricane season are considered. The number of ensemble members used is shown in the top right of each panel. Densities of less than 0.1 have been masked for clarity. HURDAT2 contours in panel (f) are 0.1, 0.3, 0.5, and 0.7 storms per unit area per year, where the unit area is equal to a spherical cap of 5∘ radius. The black dashed region represents the recurvature domain, red regions represent the northern Europe (top), southern Europe (bottom) and Europe (whole red region) domains.
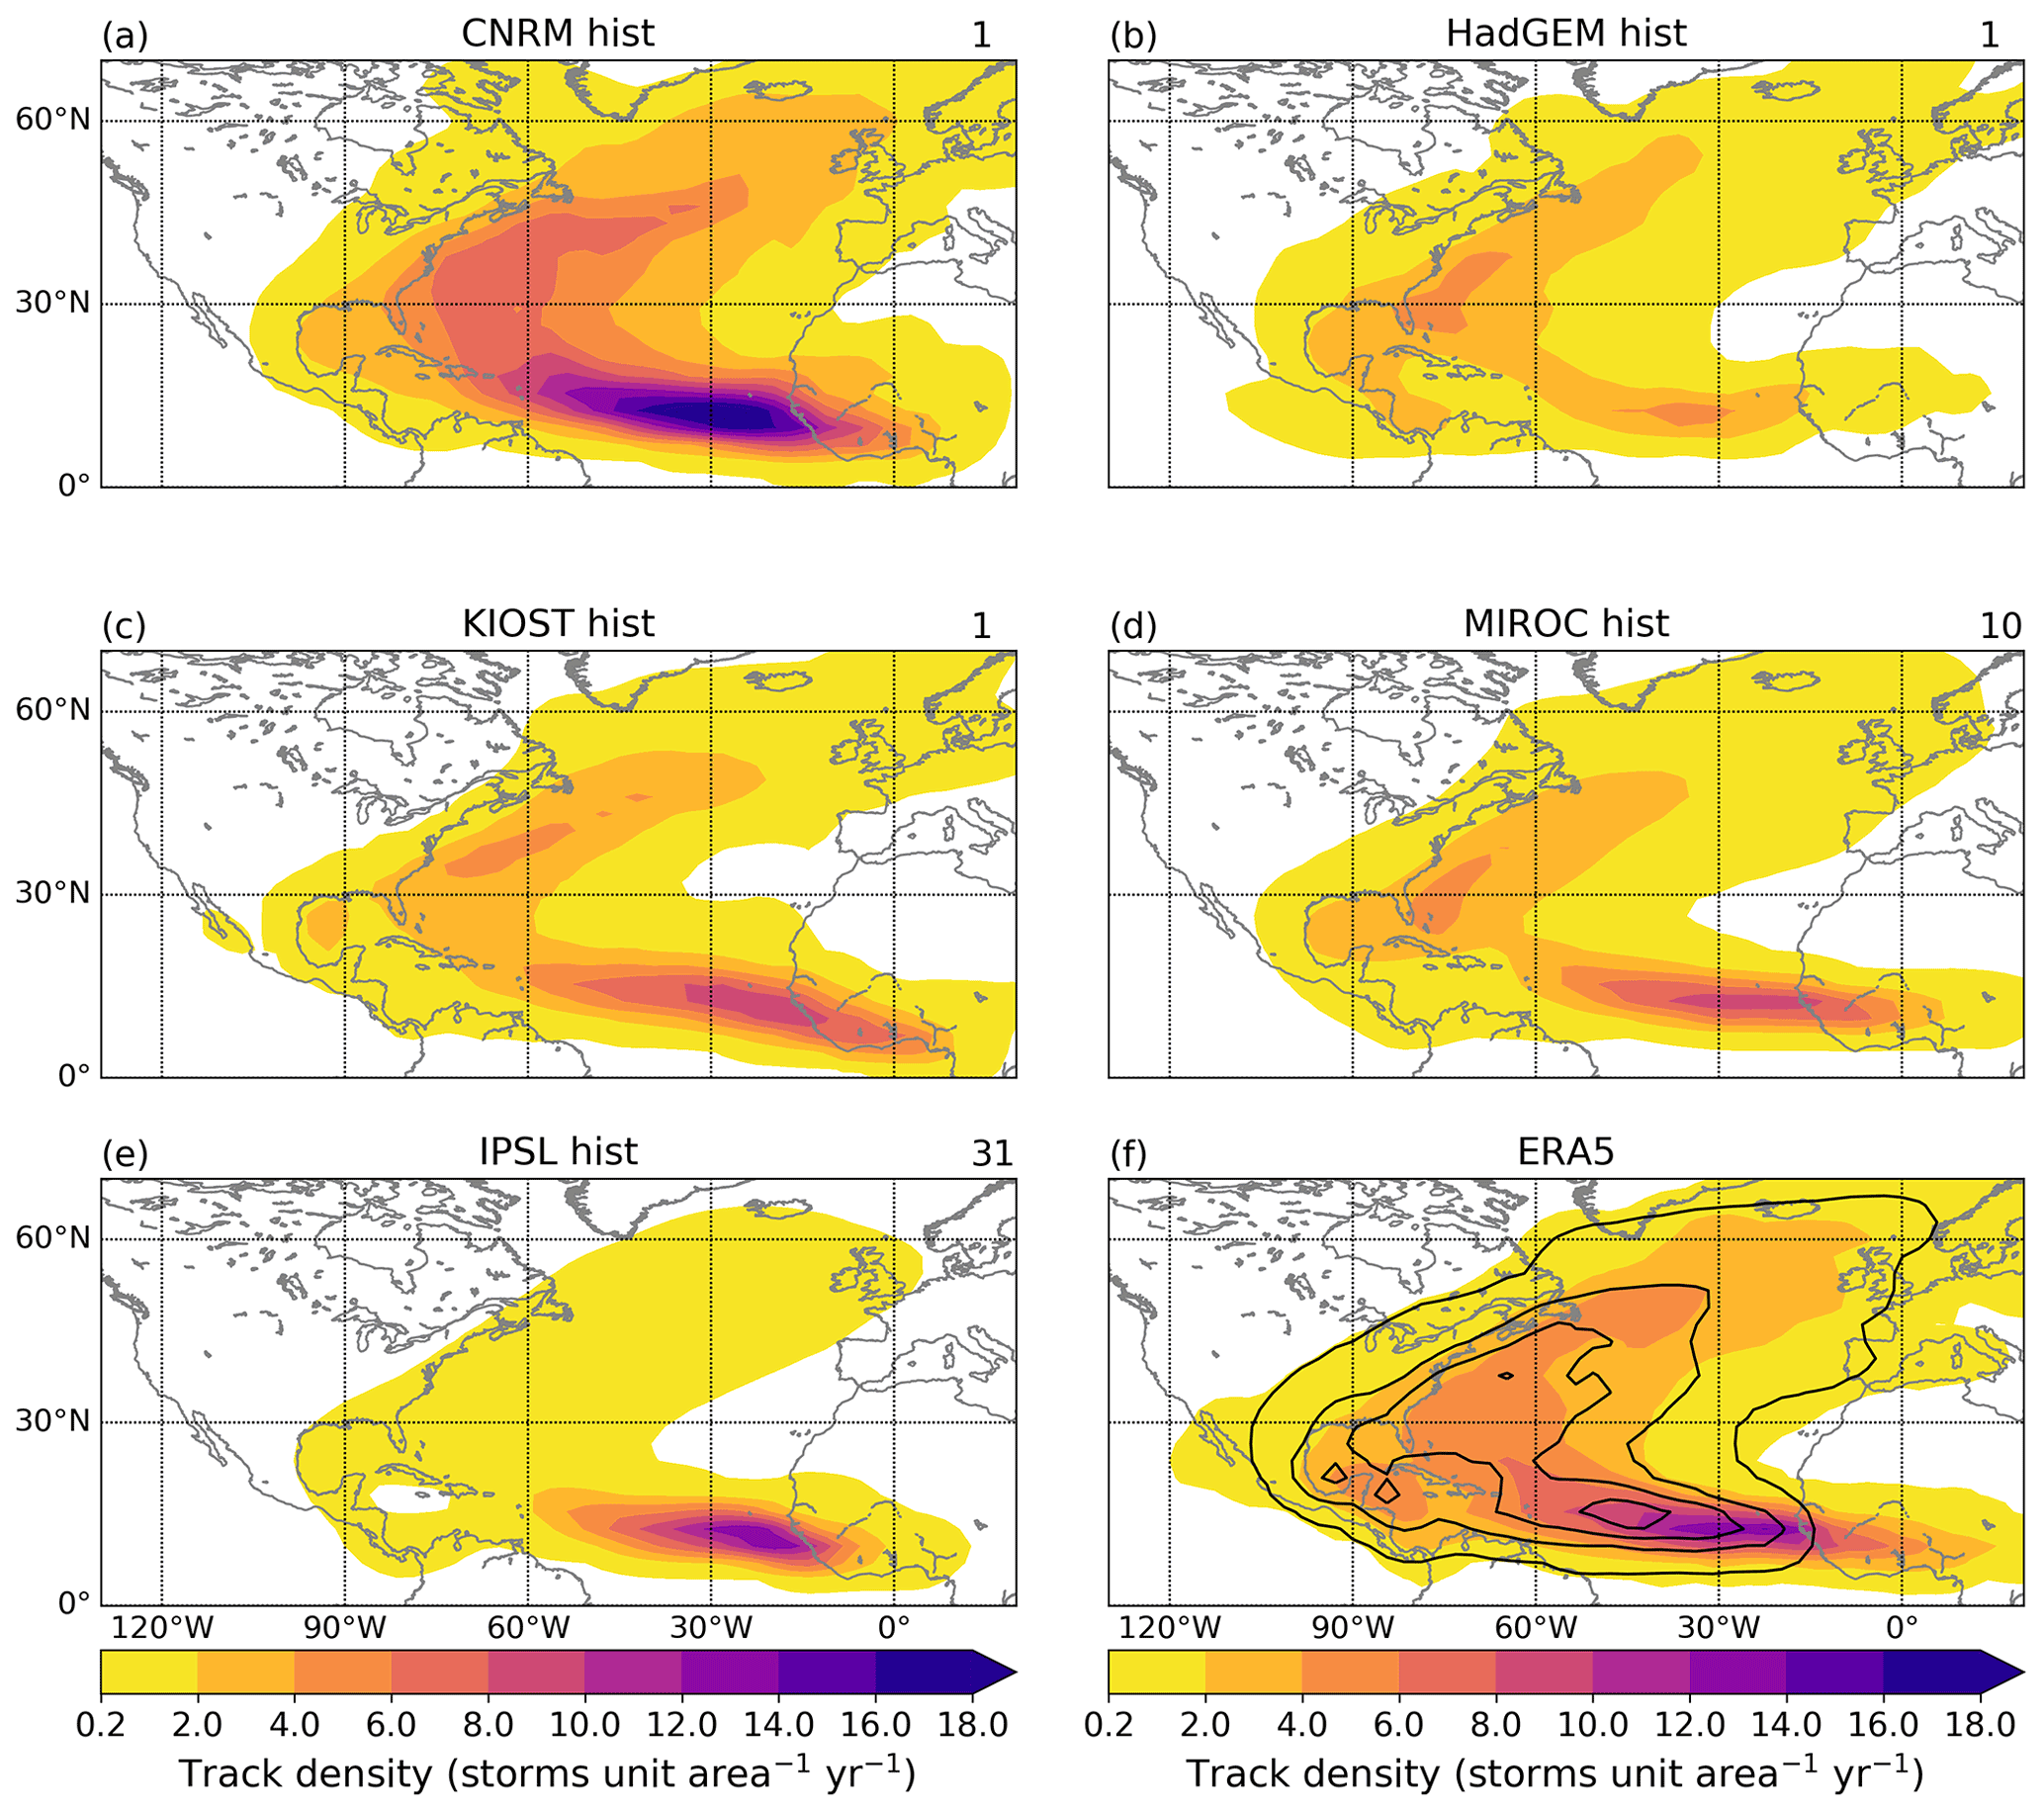
Figure 2As in Fig. 1 but for track density. Densities less than 0.2 have been masked for clarity. Black contours in panel (f) represent 0.2, 2.0, 4.0, 6.0, and 8.0 storms per unit area per year.
2.3 Objective TC identification
TCs are identified from the larger sample of tracked cyclones using the methodology of Hodges et al. (2017). A cyclone track is identified as a TC if the following criteria are met:
-
the first point in the cyclone track (genesis) is equatorward of 30∘ N,
-
the T63 relative vorticity exceeds s−1,
-
the difference in T63 relative vorticity between 850 and 200 hPa exceeds s−1 to indicate the existence of a deep warm core via thermal wind balance, and
-
a T63 relative vorticity signature must exist at each pressure level between 250 and 850 hPa to indicate a coherent vertical structure.
Cyclone tracking and TC identification are performed entirely using relative vorticity fields, and no wind speed or sea level pressure thresholds are used. TC identification methods which use wind speed thresholds often have to account for model resolution by modifying the thresholds depending on model resolution (Walsh et al., 2015), whereas this methodology aims to be as resolution independent as possible. Criteria 2–4 must be met for at least four consecutive time steps (1 d) over the ocean. This method of TC identification allows us to capture the entire life cycle of TCs, including the pre- and post-TC stages. Only tracks which form in the North Atlantic hurricane season (1 June–30 November) are considered in this study. The TC identification criteria are applied to the vorticity fields at the 850, 700, 600, 500, 400, 300, and 250 hPa pressure levels for ERA5 but only to the 850, 500, and 250 hPa levels for CMIP6 models due to data availability. Previous (unpublished) work found little sensitivity on cyclone statistics to this difference in data and methodology for tracking and TC identification (not shown). The SSTs are expected to increase as a result of climate change, and so the poleward extent of TC genesis may move poleward, potentially beyond 30∘ N (which is the latitude constraint placed on genesis of TCs in Hodges et al., 2017). To ensure that our TC identification method is suitable, we first check that there is no robust projected increase in TC genesis poleward of 30∘ N. This is achieved by modifying the TC identification method by relaxing the latitude constraint for genesis to 45∘ N and then re-identifying TCs. We then investigate the change in genesis density between the 2069–2099 and 1984–2014 periods. No robust trend in TC genesis poleward of 30∘ N is found (Fig. S2), and so the original TC identification method is retained.
The TC identification method used here has been used in numerous studies based on reanalyses (Hodges et al., 2017; Baker et al., 2021) and climate models (e.g. Baker et al., 2022; Roberts et al., 2015; Vidale et al., 2021). It has been shown that PTC impacts over Europe in the present climate are similar whether this objective TC identification method or objective track matching with observational data is used (Sainsbury et al., 2020).
2.4 Recurvature, Europe definitions, and regional domains
Changes in TC statistics, recurving TC statistics, and Europe-impacting PTC statistics are considered in this study. A recurving TC is defined as a TC which enters a domain in the North Atlantic midlatitudes from 36–70∘ N, 82∘ W–30∘ E (as in Sainsbury et al., 2022a). A Europe-impacting PTC is defined as a TC which enters a European domain defined as 36–70∘ N, 10∘ W–30∘ E (as used in Baker et al., 2021; Sainsbury et al., 2020, 2022b). The regions are constructed such that every Europe-impacting PTC is a recurving TC by definition and are illustrated in Fig. 1. PTCs can reach Europe with either a cold core or a lower level warm core (warm seclusion development; Baker et al., 2021; Dekker et al., 2018). In this study, both types are considered.
In Sect. 3.2.2, we investigate North Atlantic TC genesis regionally. North Atlantic TCs are separated based on genesis into three regions: the main development region (MDR, 0–20∘ N, 70∘ W–30∘ E), the subtropical Atlantic (SUB, 20–30∘ N, 82∘ W–30∘ E), and the western Atlantic comprising the Gulf of Mexico and the region south of the Caribbean (denoted WEST, vertices at (4∘ N, 70∘ W), (4∘ N, 90∘ W), (14∘ N, 90∘ W), (14∘ N, 100∘ W), (30∘ N, 100∘ W), (30∘ N, 82∘ W), (20∘ N, 82∘ W), and (20∘ N, 70∘ W)). These regions span the entire tropical North Atlantic, and all simulated TCs form in one of these regions. The boundaries of these regions are shown in Fig. 7. It should be noted that metrics are conditioned in two different ways throughout the results section. For example, in Figs. 5 and 9 metrics are presented which are conditional on cyclones reaching Europe (e.g. given that a set of cyclones reach Europe, what fraction are PTCs?), whereas in the rest of the paper metrics are conditioned on cyclones being TCs (e.g. given that a set of cyclones are TCs, what fraction reach Europe as PTCs?).
2.5 Environmental field analysis
Changes in large-scale environment fields known to be associated with TC genesis and intensification are investigated in CMIP6 using the genesis potential index (GPI; Emanuel and Nolan, 2004).
where η is the 850 hPa absolute vorticity, H is the relative humidity at 600 hPa, Vshear is the magnitude of the 250–850 hPa wind shear, and Vpot is the potential intensity (PI; Emanuel, 1986), implemented using the tcpyPI python package (Gilford, 2021). Fields are first re-gridded to a common resolution (1×1∘) to ensure comparability.
Deep layer steering flow is also used and is defined as in Colbert and Soden (2012). However, due to data availability, we use the 250 hPa field instead of the 200 hPa field.
3.1 North Atlantic tropical cyclone climatologies in historical CMIP6 simulations
In this section we examine the climatology and properties of the TCs simulated by each of the selected CMIP6 models. If we wish to learn something about how PTC impacts may change across Europe in the future, we need to understand whether these models are able to capture features of the observed TC climatology and also identify any biases which may translate into biases in the projected changes in PTC statistics.
3.1.1 Spatial statistics
Figure 1 shows the genesis density in the historical period for the five selected CMIP6 models (panels a–e) and ERA5 and HURDAT2 (panel f). Comparisons between HURDAT2 and ERA5/CMIP6 models should be made cautiously due to differences in how TCs are identified. For example, the cyclone detection and tracking scheme used in this study allows for the identification of TC precursors. Therefore, the genesis densities shown for the CMIP6 models and ERA5 represent the genesis density of the precursors to TCs, whereas the HURDAT2 genesis density shows where these precursors developed into TCs. This explains the differences in genesis density between CMIP6/ERA5 and HURDAT2 over west Africa. The CMIP6 models, ERA5 and HURDAT2, typically show two regions of genesis maxima: one centred between 0 and 30∘ W in the eastern tropical Atlantic, where the African easterly waves that act as TC precursors originate (Arnault and Roux, 2011; Thorncroft and Hodges, 2001), and a second to the western side of the basin. In ERA5 and HURDAT2, TC genesis is more of a continuum across the tropical Atlantic, whereas in the CMIP6 models (with the exception of CNRM) TC genesis is in two discrete regions. CNRM and HadGEM most closely match the spatial distribution of genesis seen during the same period in ERA5 and HURDAT2. Further information on the proportion of North Atlantic TCs forming in different subregions of the basin in CMIP6 and ERA5 can be found in Table 3. Additional analysis on 10 further CMIP6 models which did not meet our TC criteria (blue shaded boxes, Fig. S1 in the Supplement) showed very little (or no) genesis in the MDR, which is likely responsible for the low TC counts in these additional models (not shown). The cause(s) of the bias in TC activity in the MDR in these additional models is outside of the scope of this paper but may be associated with insufficient horizontal resolution, differences in the representation of the large-scale circulation and tropical environment into which TCs are forming, and differences in the representation of TCs seeds (frequency, intensity, and conversion rate).
All of the models capture the maxima in track density in the main development region (MDR) and the maxima in track density recurving around the US East Coast, heading towards Europe (as shown in Baker et al., 2021). As with genesis density (Fig. 1), many of the models have two apparent storm tracks, one associated with storms originating in the MDR and one associated with storms originating further west in the basin. In all models except CNRM, track density decreases rapidly from east to west across the MDR, and this is particularly clear in IPSL (Fig. 2e). The lysis density (Fig. S3) is greater in the MDR in KIOST, MIROC, and IPSL than it is in ERA5, indicating that in these models TCs forming in the MDR dissipate too quickly. This is particularly clear for IPSL, which shows almost all MDR TCs dissipating whilst still in the MDR, close to where they formed. MDR-forming TCs in ERA5 have a mean track length of ∼9700 km and last for ∼16.5 d, compared to a mean track length of ∼4200 km and a mean duration of 8.7 d in IPSL.
Coupled with the lack of genesis in the western MDR in these models (Fig. 1), the track (Fig. 2) and lysis (Fig. S3) density plots suggest that conditions in the models are too hostile for TC genesis or intensification in this region. In particular, vertical wind shear in all models except CNRM is higher (∼2–6 m s−1) than ERA5 over the 1984–2014 period, with the biggest biases in the central and western MDR (Fig. S4), consistent with previous studies (Han et al., 2022).
3.1.2 Seasonal cycle
Figure 3 shows the seasonal cycle for the selected CMIP6 models and ERA5. TCs in HURDAT2 are identified later in their life cycle than TCs tracked and identified objectively (Sect. 2.2 and 2.3) in ERA5 and CMIP6 models. HURDAT2 data are therefore not included in Fig. 3. CNRM has a bias towards early season North Atlantic TC activity (compared to ERA5), with a peak in August. This can also be seen in KIOST but to a lesser extent. The other three CMIP6 models all show a peak in North Atlantic TC formation in September, the same as in ERA5. While the seasonal cycle is captured well by the models, all but CNRM underestimate North Atlantic TC frequency during hurricane season, with the largest underestimation found in HadGEM during the months of peak activity (August–October), consistent with too few simulated TCs originating in the MDR (Figs. 1 and 2). All models except the CNRM underestimate Europe-impacting PTC frequency (Fig. 3b). This is because in all models except CNRM, proportionally too few TCs originating in the MDR recurve (Table 3). As a result, there are fewer TCs reaching the midlatitudes – the region which often provides the baroclinicity to facilitate extratropical transition and future reintensification on approach to Europe. All selected CMIP6 models except KIOST have similar SST gradients along the midlatitude storm track to those found in ERA5 during hurricane season. In the KIOST, SST gradients are slightly higher, which may be associated with the greater proportion of recurving TCs reaching Europe in the historical period (Table 2).
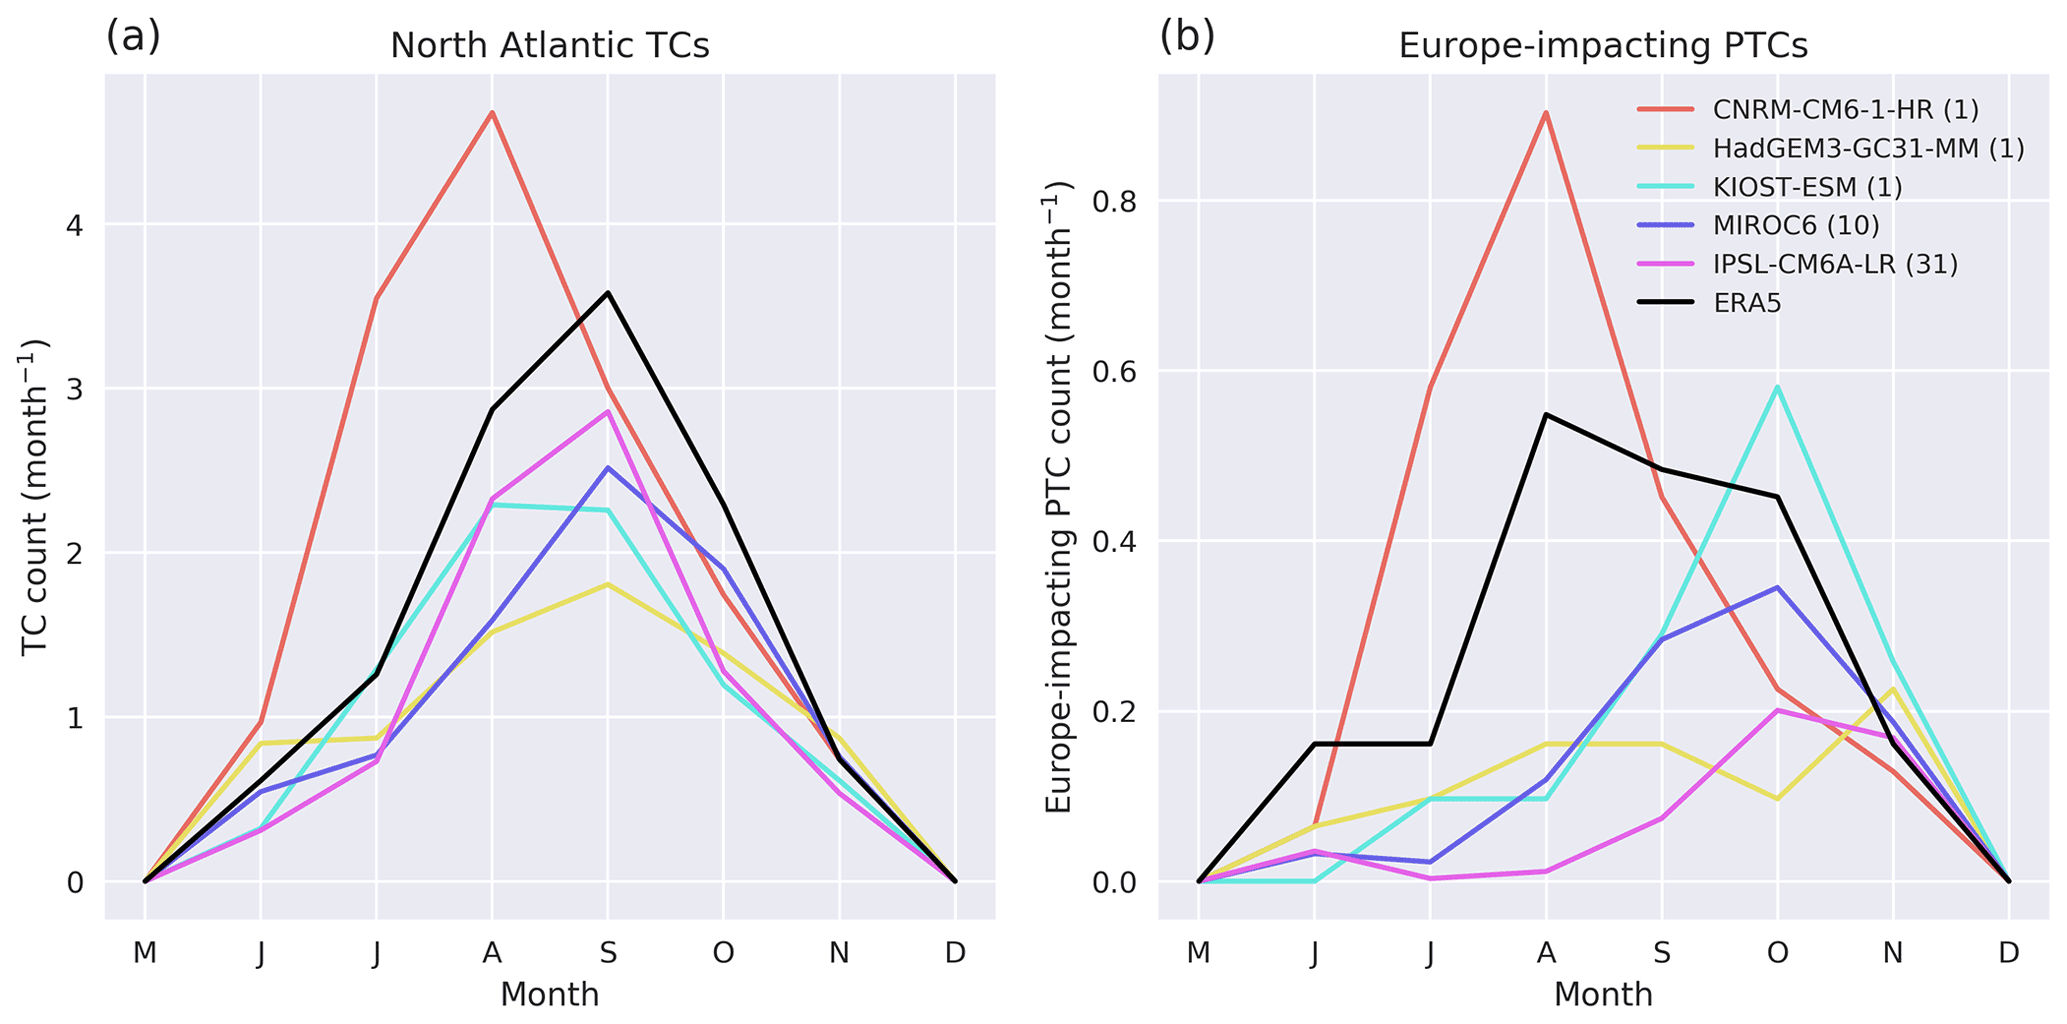
Figure 3Seasonal cycle of North Atlantic TCs (a) and Europe-impacting PTCs (b) in the historical run (1984–2014) of five CMIP6 models (coloured lines) and ERA5 (same time period, black). Cyclones are binned by the month of genesis. TCs forming outside of hurricane season are not included in this study, and so these months are set equal to zero. The number of ensemble members used for each model is shown in brackets in the key.
Table 2Counts of Europe-impacting PTCs, North Atlantic TCs, likelihood of recurvature, and likelihood that a recurving TC will reach Europe for the historical (1984–2014) period and the future (2069–2099) period under the SSP5-85 scenario. Fractional changes are shown under the “Diff” columns. Bold values represent significance at the 95 % level using a bootstrapping method.
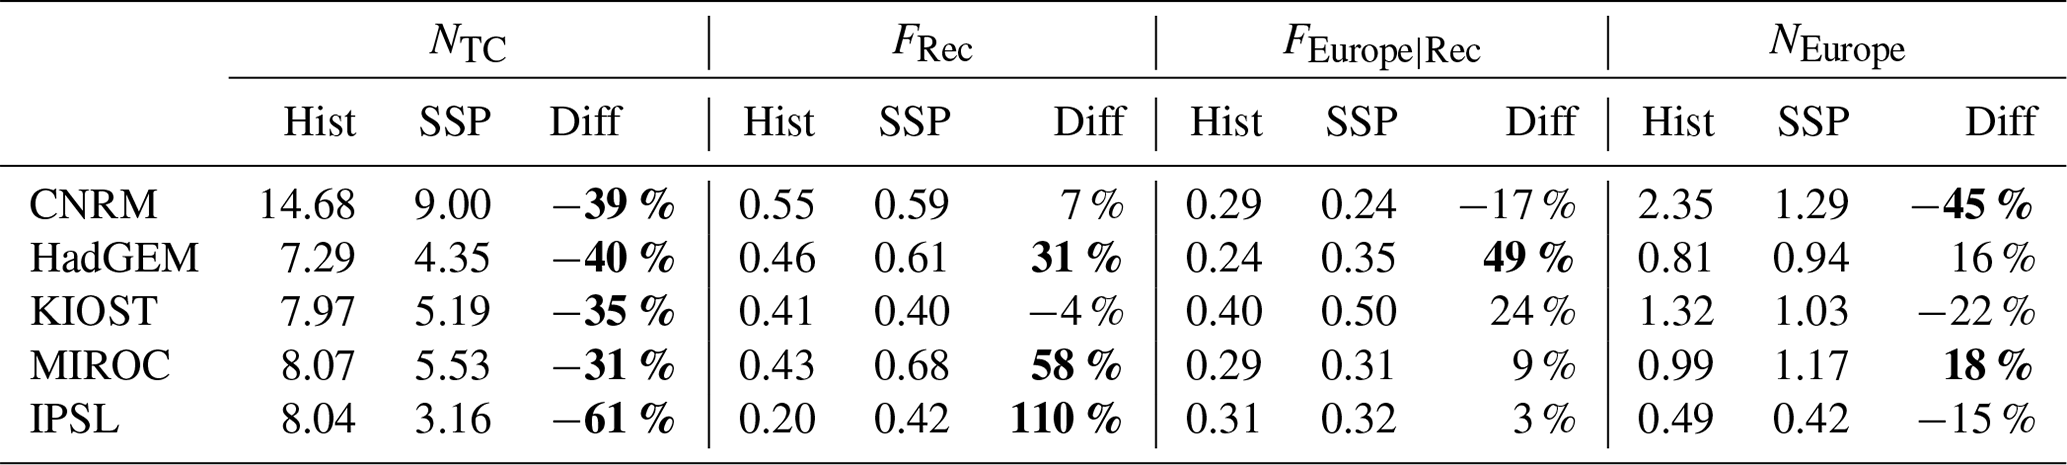
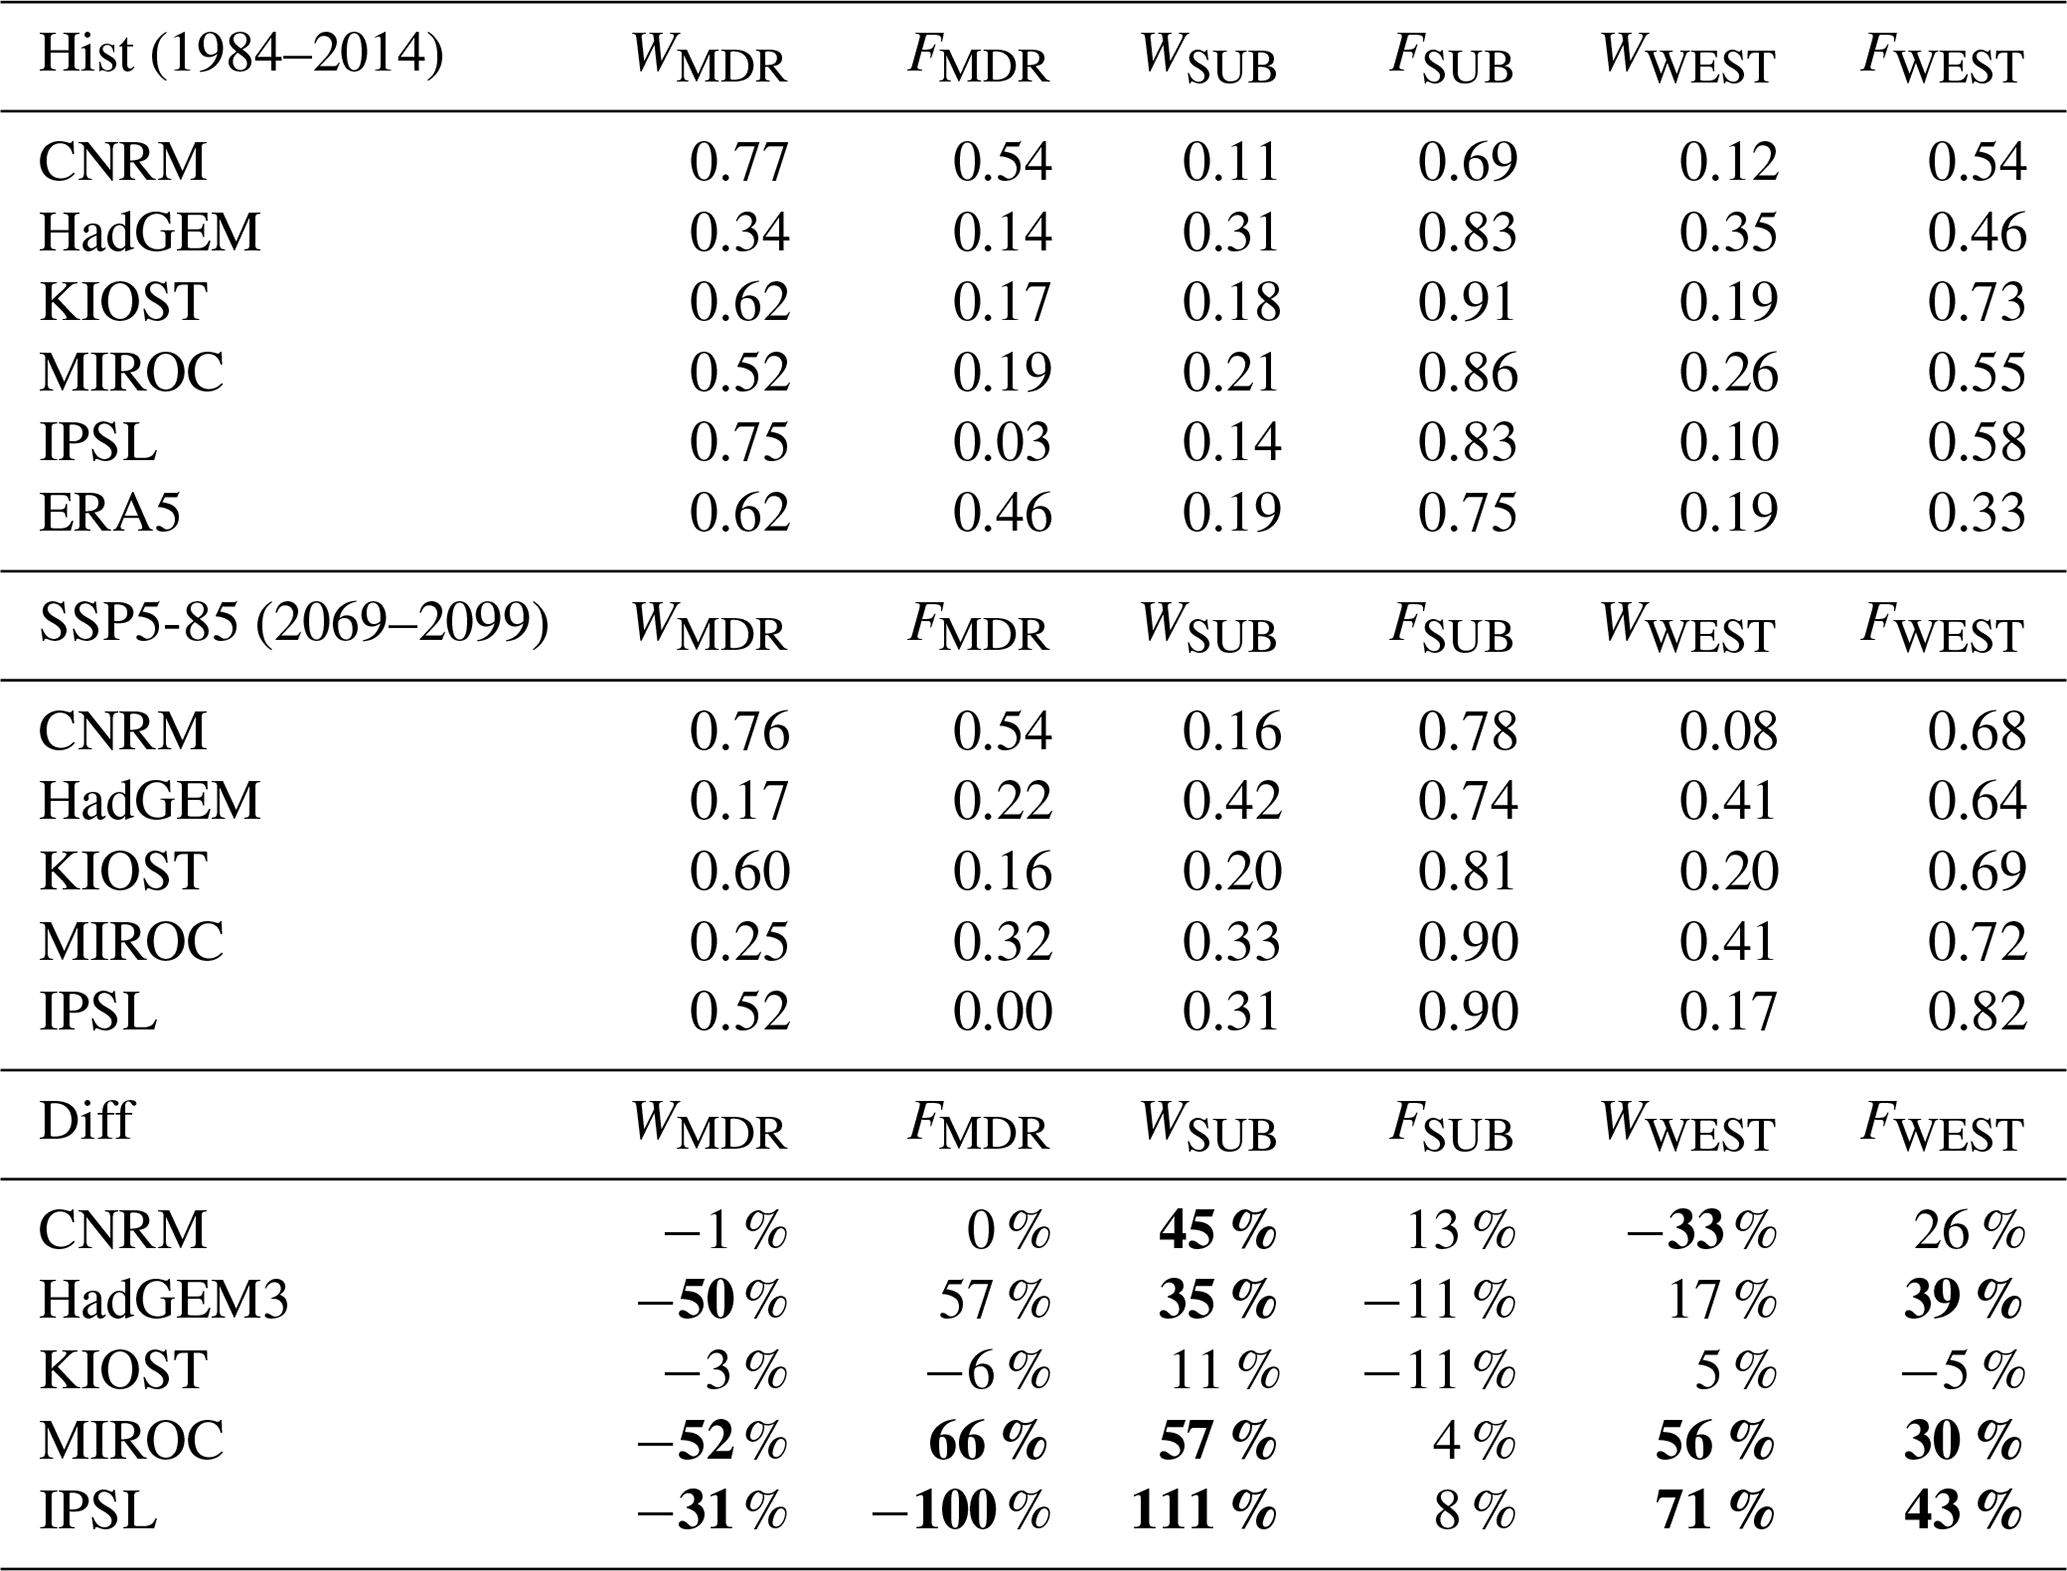
Table 3Tabulated values of the terms of the right-hand side of Eq. (3) for the historical run (top), the future run under SSP5-85 (middle), and the fractional change (bottom) for the five selected CMIP6 models. Bolded differences represent statistical significance at the 95 % level.
3.1.3 Lifetime maximum intensity
TC lifetime maximum intensity (LMI) distributions for the selected CMIP6 models are shown in Fig. 4. All models use the same sampling frequency for wind speed (all are indexed as 3hrPt on the CMIP6 archive). All selected CMIP6 models underestimate the mean TC LMI and are unable to simulate the strongest observed TCs. CNRM is able to simulate stronger TCs than the other CMIP6 models and ERA5, with some TCs approaching 50 m s−1 (category 3 on the Saffir–Simpson scale). MIROC is able to simulate storms with a similar intensity to ERA5; however, it is still biased towards weaker TCs. The other CMIP6 models are unable to simulate TCs with LMIs of hurricane force (33 m s−1). The wind–pressure relationship (Fig. S5) also shows that TCs in ERA5 and CMIP6 models have wind speeds too low for a given sea level pressure (compared to HURDAT2), which is expected as low-resolution models tend to simulate larger TCs, reducing their pressure gradient.
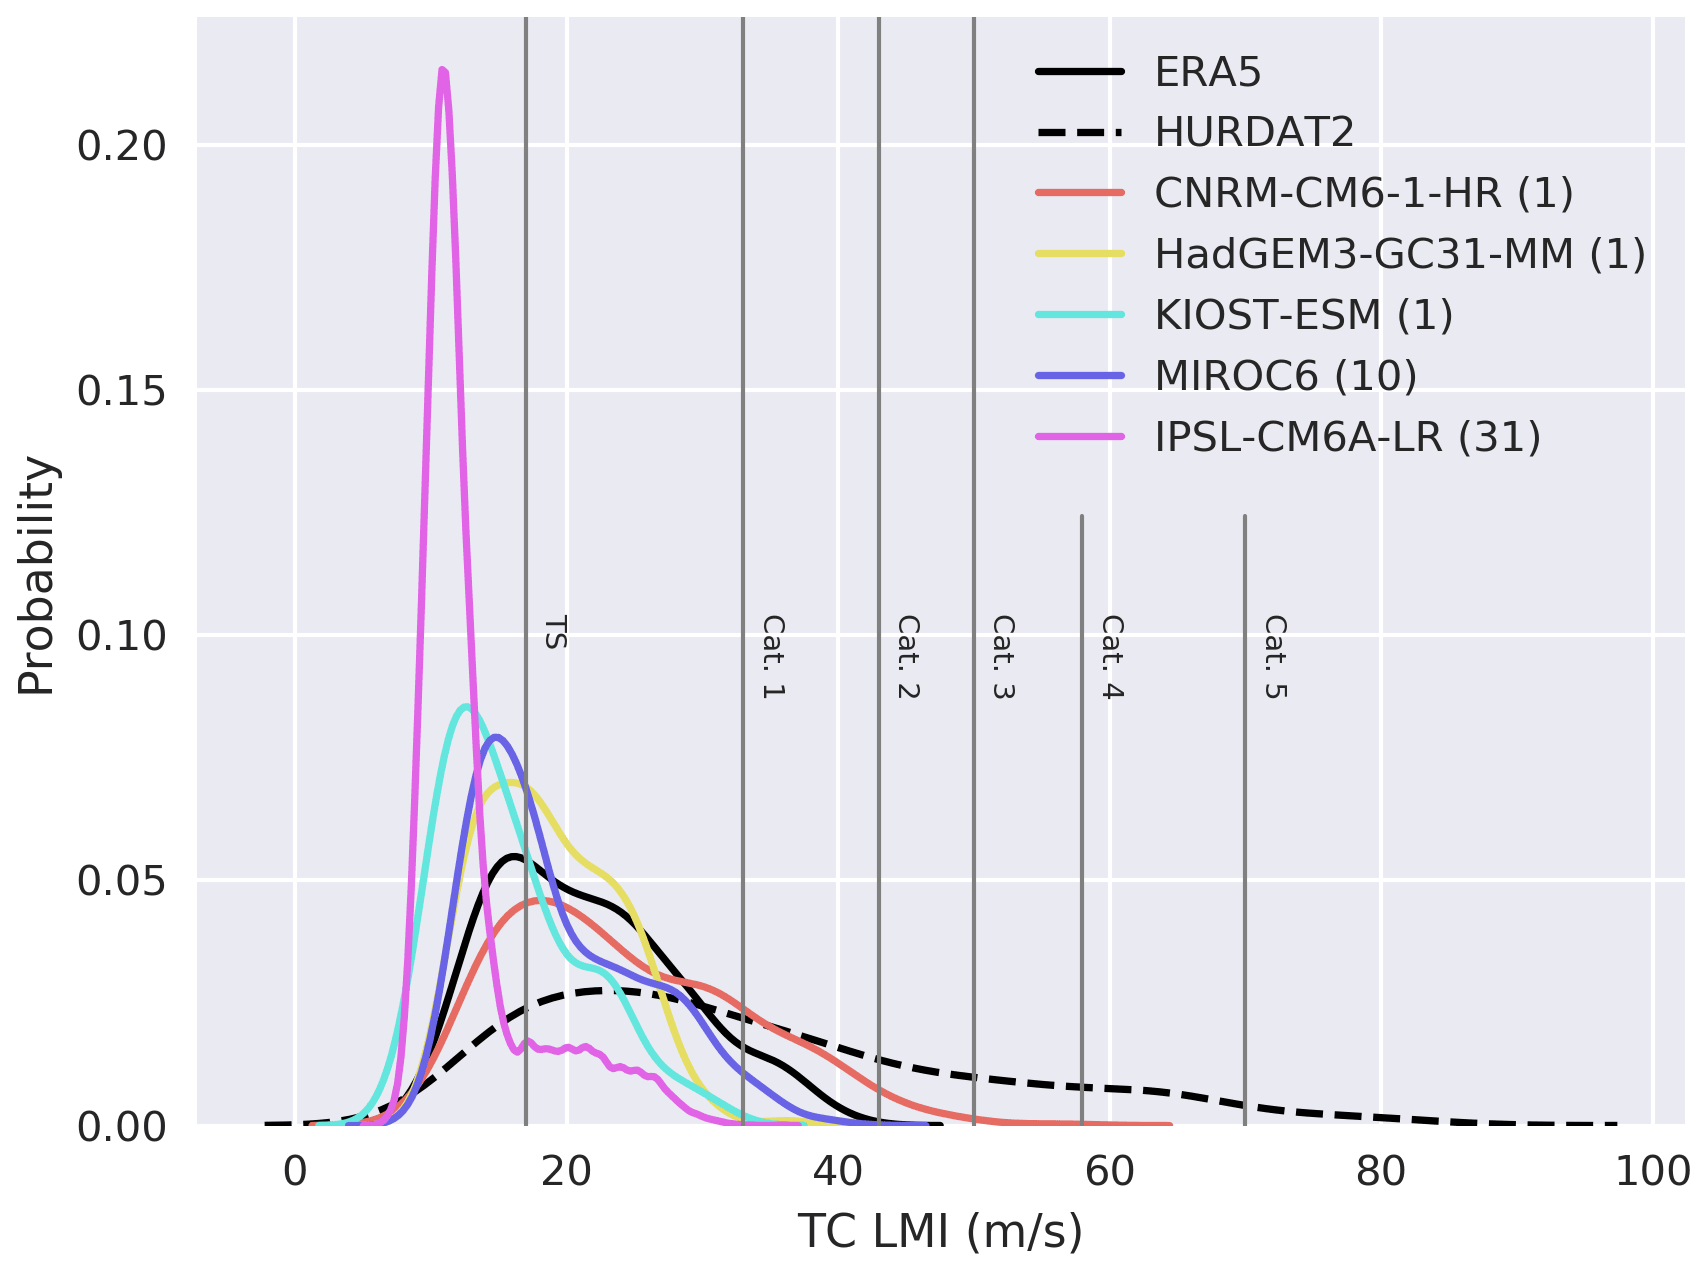
Figure 4TC lifetime maximum intensity distributions for the historical (1984–2014) period for selected CMIP6 models, ERA5 (black, solid), and HURDAT2 (black, dashed). Only TCs forming during the North Atlantic hurricane season are considered. Densities are approximated as kernel density estimates. Vertical grey lines represent the different categories on the Saffir–Simpson scale. The number of ensemble members used for each model is shown in brackets in the key.
The majority of TCs identified in the historical period of IPSL are extremely weak, with 10 m wind speeds less than tropical storm (17 m s−1) strength. While IPSL does have positive wind shear biases and negative potential intensity biases compared with ERA5, these are no larger than for the other selected models (Fig. S4). The large peak in TC LMI between approximately 10 and 15 m s−1 in IPSL corresponds to TCs forming in the MDR. TC LMI values in the right-hand tail of the IPSL distribution correspond to TCs originating in the Gulf of Mexico and along the Gulf Stream (not shown). The TCs in IPSL forming in the Gulf of Mexico and along the Gulf stream are forming at higher latitudes (∼25–30∘ N) than those in the MDR (∼10–20∘ N). One (speculative) possibility is that TCs forming in the deep tropics (MDR) are purely diabatically driven, whereas those forming along the US East Coast derive a component of their energy from baroclinic sources (consistent with Fig. 1; Elsner et al., 1996; Kossin et al., 2010). Any issue with the parametrization of diabatic fluxes in IPSL would therefore lead to MDR TCs which are much too weak but would not affect higher-latitude-forming TCs as strongly, potentially explaining the difference. IPSL also uses a regular horizontal grid (Boucher et al., 2020), and so effective resolution increases with latitude. Systems are likely to be larger in scale at higher latitudes and hence better represented at this resolution than at lower latitudes (for example, in the MDR). This may also in part explain the better representation of TC intensity with latitude, but a dedicated study would be necessary to test these hypotheses and quantify their importance.
Despite clear model biases, the selected CMIP6 models represent many features of the observed TC climatology, with spatial patterns and frequencies in qualitative agreement with observations. TC frequency, seasonal cycle, and spatial distribution in these selected CMIP6 models are comparable to those found in higher-resolution modelling studies, such as Climate-SPHINX (Vidale et al., 2021), UPSCALE (Roberts et al., 2015), and HighResMIP-PRIMAVERA (Roberts et al., 2020a; Haarsma et al., 2016; Baker et al., 2022), which used the same tracking and identification scheme. However, many high-resolution climate models are able to simulate TCs with intensities greater than 50 m s−1 (Baker et al., 2022; Vidale et al., 2021), unlike all selected CMIP6 models except CNRM in this study. Many high-resolution models contain biases in their large-scale environment, but in most cases these biases are not consistent between models (Roberts et al., 2020a). This is also true for the selected CMIP6 models with the exception of vertical wind shear, which is too high in the MDR in all selected models except CNRM (Fig. S4). Improving model resolution does not systematically improve historical biases in the large-scale environmental fields correlated with TC genesis and intensification but does reduce historical biases in TC frequency and improves the spatial distribution of TCs, particularly in the MDR (Roberts et al., 2020a; Vidale et al., 2021; Baker et al., 2022). It is therefore possible that the lack of genesis in the western MDR in many of the selected CMIP6 models is the result of too much vertical wind shear and insufficient model resolution.
3.1.4 Recurving TC and Europe PTC statistics
To gain insight into the projected changes in Europe-impacting PTCs, CMIP6 models must also capture the key features of the recurving TC and Europe-impacting PTC climatologies. Previous work has shown that, to first order, TC activity governs recurving TC frequency (Sainsbury et al., 2022a). The selected CMIP6 models also capture the strong relationship between TC frequency and recurving TC frequency (Fig. S6), highlighting that the models can capture the main driver of the interannual variability of recurving TCs, which may have important implications for European PTC risk.
A key feature of the observed PTC climatology is that PTC maximum intensities over Europe are, on average, larger than those found for the broader class of midlatitude cyclones (MLCs, defined as all cyclones which are not PTCs) forming during hurricane season (Sainsbury et al., 2020). In Fig. 5, we identify the maximum intensity associated with each PTC and MLC over Europe and subregions (northern/southern Europe, shown in Fig. 1) and investigate the fraction of cyclones in each intensity bin which are PTCs.
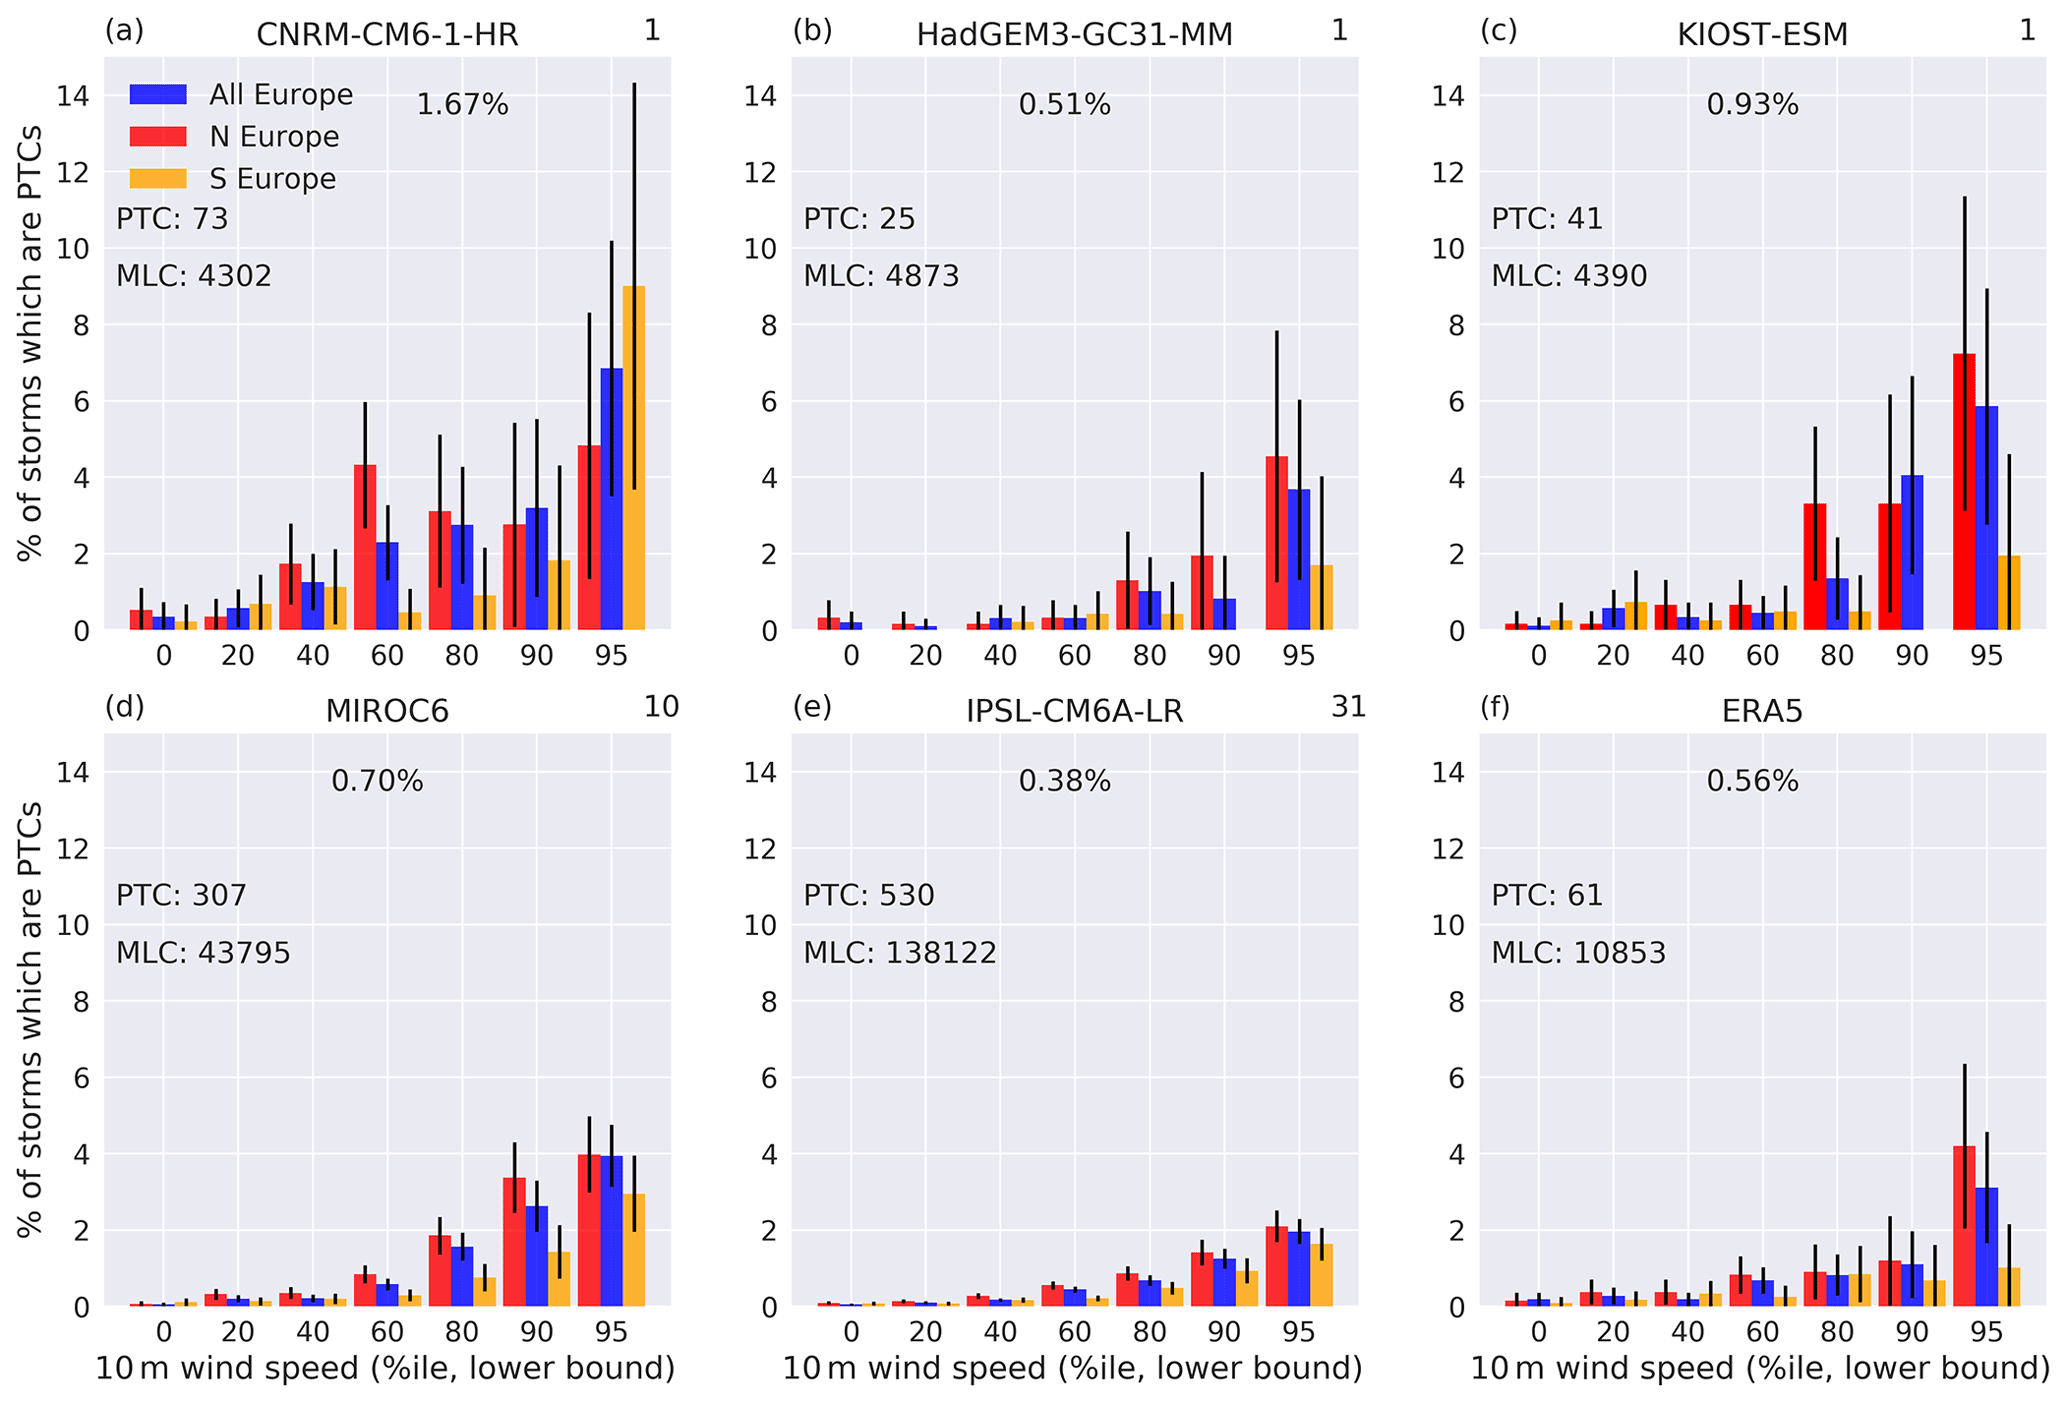
Figure 5Fraction of hurricane-season-forming, Europe-impacting cyclones which are PTCs for CNRM (a), HadGEM (b), KIOST (c), MIROC (d), IPSL (e), and ERA5 (f), where cyclones are binned by their maximum 10 m wind speed over Europe (blue), northern Europe (red), and southern Europe (yellow) in the historical runs of the selected CMIP6 models (a–e). Northern Europe is defined as 48–70∘ N, 10∘ W–30∘ E, and southern Europe is defined as 36–48∘ N, 10∘ W–30∘ E. The number of PTCs and MLCs impacting Europe (whole domain) during the North Atlantic hurricane season and the percentage of cyclones impacting Europe (whole domain) during the hurricane season which are PTCs are shown in each panel. The number of ensemble members used for each model is shown in the upper right of each panel. Vertical bars show the 95 % binomial proportion confidence interval.
To ensure that the sample size remains reasonable across bins and across models, we bin the cyclones based on percentiles of the combined distribution. For each model, we combine the (Europe-impacting) PTC and MLC cyclone tracks over both time periods (historical and future) and calculate percentiles of this joint distribution of their maximum 10 m wind speeds over Europe. These percentiles are then used to bin the data. The bins therefore correspond to 0–20th, 20–40th, 40–60th, 60–80th, 80–90th, 90–95th, and >95th percentiles.
In ERA5, only 0.56 % of cyclones reaching Europe during the North Atlantic hurricane season are PTCs. However, when considering the highest-intensity bin (>95th percentile), this fraction is 3.11 %, which is over 5 times larger. While these numbers are different to those found in Sainsbury et al. (2020; ∼0.5 % in the lowest-intensity bin and ∼9 % in the highest-intensity bin) due to differences in date range and the bins used to bin the data, the key point remains: there is an increasing trend in the fraction of cyclones which are PTCs with intensity. Despite being unable to simulate intense TCs, all five CMIP6 models capture the relationship between TC frequency and recurving TC frequency, as well as the disproportionate intensity associated with Europe-impacting PTCs. PTC and MLC counts for each bin can be found in the Supplement (Table S1).
3.2 Projected changes in Europe-impacting PTC frequency
In this section we investigate the projected changes in Europe-impacting PTC counts. We consider the projected changes in three key components: (i) changes in basin-wide North Atlantic TC counts, (ii) changes in the likelihood that a North Atlantic TC will recurve, and (iii) changes in the likelihood that a recurving North Atlantic TC will reach Europe.
While some overlap exists, these three components are likely driven by different factors. Changes in basin-wide TC counts to an extent depend on how the large-scale environment (sea surface temperature, vertical wind shear, atmospheric moisture, etc.) and teleconnections (e.g. ENSO) change in the future (e.g. genesis potential index; Camargo, 2013). Changes in likelihood of recurvature may depend on changes to the large-scale steering flow, changes in TC intensity (stronger TCs survive longer), changes in where TCs are forming (TCs in some regions are more prone to recurve than in other regions; Sainsbury et al., 2022a), and changes to the large-scale environmental conditions in the subtropical Atlantic (more favourable conditions for TCs in the subtropics may lead to a larger proportion of TCs successfully making the transit from the tropics to the extratropics; Haarsma et al., 2013). Changes in the likelihood that a recurving TC will reach Europe may be related to changes in the midlatitude jet and the intensity of TCs (Haarsma, 2021; Sainsbury et al., 2022b).
Europe-impacting PTC counts are therefore expressed as
where NEurope is the number of Europe-impacting PTCs, NTC is the number of North Atlantic TCs, FRec is the fraction of North Atlantic TCs which recurve (the likelihood of recurvature), and FEurope | Rec is the fraction of recurving TCs which reach Europe (the likelihood that a recurving TC will reach Europe). Each term is calculated for the historical and future SSP5-85 projection for each model and shown (with the fractional changes) in Table 2.
All five selected models project a statistically significant (to 95 %) decrease in North Atlantic TC frequency (NTC) of 30 %–60 % by the end of the 21st century. Four models also show an increase in the likelihood of recurvature (FRec), which is significant in HadGEM, MIROC and IPSL. HadGEM is the only model with a significant projected increase in FEur|Rec, and all other models have non-significant projected changes. Overall, there is no robust model response in Europe-impacting PTC frequency in the future (NEurope), with CNRM projecting a significant decrease, MIROC projecting a significant increase, and the remaining models showing no significant change.
In all models except CNRM, the fractional decrease in TC counts is much larger than the fractional change in Europe-impacting PTC counts, with two models even projecting an increase in Europe-impacting PTC counts in the future. Therefore, in four of the five models, there is a projected increase in the proportion of North Atlantic TCs which reach Europe in the future (FRec FEur|Rec), which is significant in MIROC and IPSL (Fig. 10a). In HadGEM, IPSL and MIROC the reduction in TC counts is offset by a projected increase in the likelihood of recurvature, highlighting that future TCs may be more likely to impact the heavily populated US East Coast. The projected increase in FRec is consistent with the projected increase in potential intensity and projected decrease in vertical wind shear along the US East Coast (Fig. 6). The projected changes shown in Table 2 are not sensitive to whether all ensemble members are used, or whether only ensemble members common to both the historical and future periods (same realization, initialization, and physics) are used (Table S1 in the Supplement). There is a large ensemble spread in the statistics presented in Table 2 in the MIROC and IPSL. However, the projected changes in North Atlantic TC frequency, likelihood of recurvature, and the proportion of North Atlantic TCs reaching Europe are considerably larger than the ensemble spread (Table S3). The analysis of Table 2 is also repeated for 10 additional CMIP6 ScenarioMIP models which did not meet our selection criteria but have sufficient data available for cyclone tracking and TC identification (Tables S4 and S5). These additional models support the results in Table 2 and highlight the robustness of the projected changes in North Atlantic TC frequency, likelihood of recurvature, and proportion of TCs reaching Europe in CMIP6 simulations.
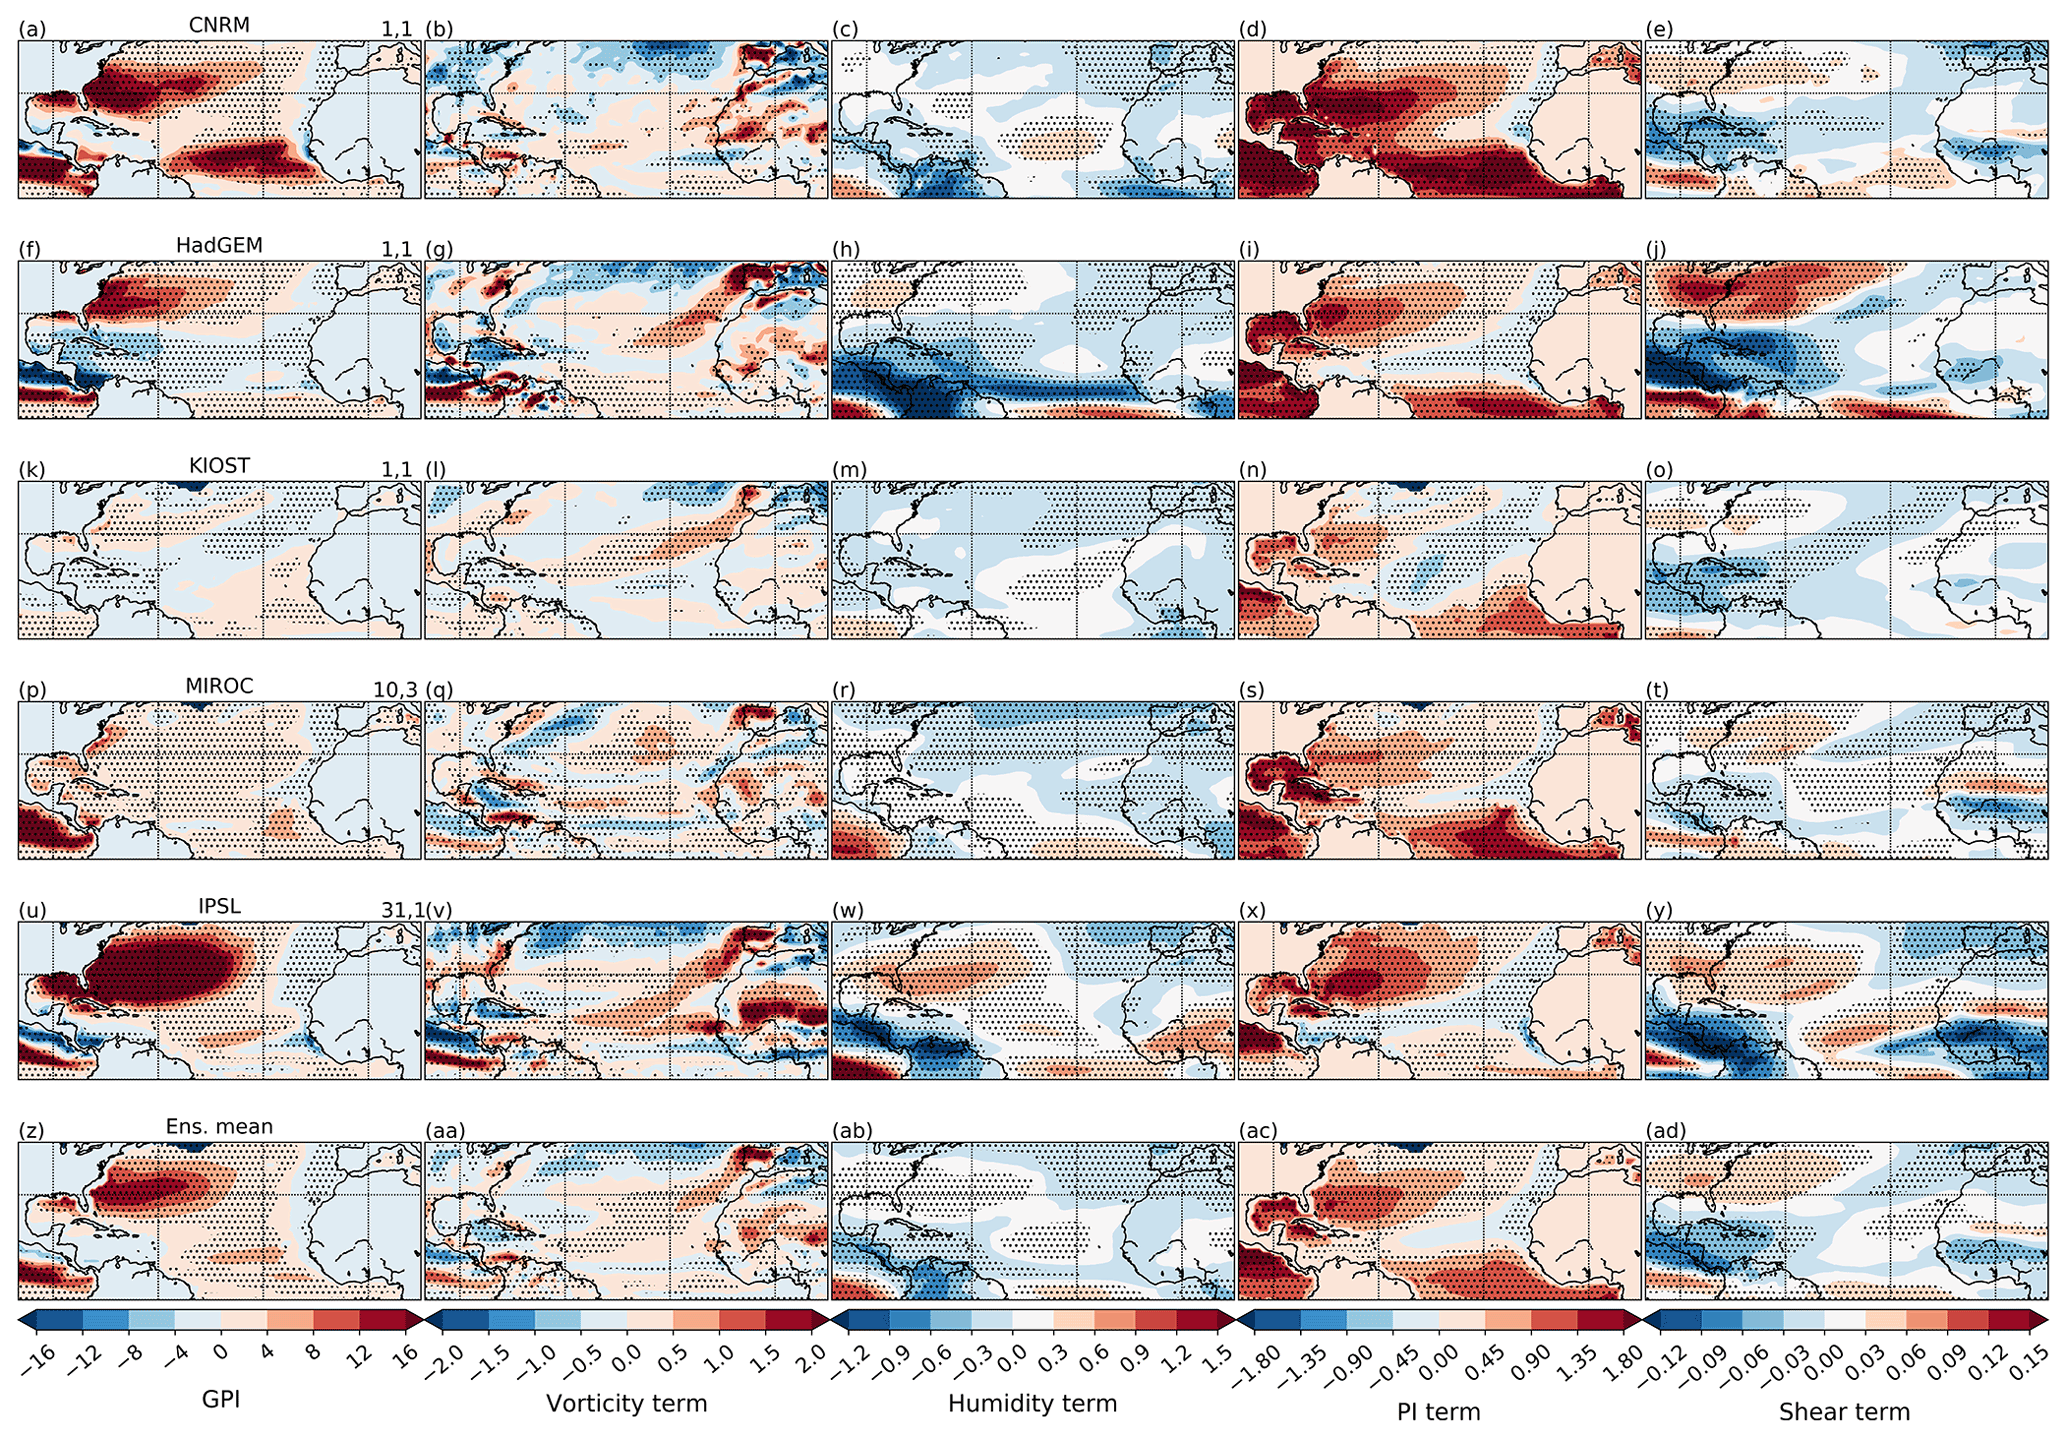
Figure 6Projected change (future minus historical) in the GPI (first column) and the individual terms of the GPI equations (columns 2–5) for CNRM (top row), HadGEM (second row), KIOST (third row) MIROC (fourth row), and IPSL (fifth row) and ensemble mean (sixth row): vorticity term (second column), humidity term (third column), PI term (fourth column), and shear term (fifth column). Note that the vertical wind shear term is a function of the reciprocal of the wind shear, and so a positive difference indicates less vertical wind shear in the future. The number of ensemble members used for the historical and future periods are shown in the upper right of the first column (historical, future). Stippling represents statistical significance at the 95 % level using Welch's t test.
3.2.1 Projected change in the number of North Atlantic TCs (NTC)
To investigate the significant projected decrease in North Atlantic TC counts (Table 2), the projected change in the genesis potential index and its terms (as calculated in Sect. 2.5) during the North Atlantic hurricane season are calculated and shown in Fig. 6. The historical biases in GPI and its terms for the selected CMIP6 models can be found in the Supplement (Fig. S4). Although all models have some biases in GPI and comprising terms, the main similarity between the selected CMIP6 models is a positive wind shear bias in the MDR in all models except CNRM. Overall, the genesis potential index is projected to significantly increase along the US East Coast between approximately 30 and 40∘ N (Fig. 6z). This indicates that, in the future, TCs travelling through this region will be exposed to more favourable conditions for TCs, increasing the probability that they reach the recurvature domain. This is consistent with the projected increase in the likelihood of recurvature found in Table 2. In the selected models, the increase in GPI in this region is associated with a projected increase in potential intensity (PI, column 4) and a decrease in vertical wind shear (VWS, column 5), which is significant across all models.
While the projected changes in Fig. 6 are consistent with an increased probability of recurvature, they do not help to explain the significant decrease in basin-wide TC counts towards the end of the century. Previous studies have shown that saturation deficit may be a better metric for TC genesis potential than relative humidity (Emanuel et al., 2008) and is projected to increase in the future (increasing hostility). Furthermore, it has been proposed that an increase in static stability may lead to a reduction in TC frequency (Bengtsson et al., 2007; Sugi et al., 2002). These factors may help to explain why we see such a large projected decrease in TC counts in the North Atlantic despite an overall increase in the GPI.
3.2.2 Projected change in the fraction of recurving North Atlantic TCs (FRec)
Table 2 shows a statistically significant increase in the likelihood of recurvature in three of the five models. Whether or not a TC recurves could depend on multiple factors (Sainsbury et al., 2022a): the location in which the TC forms, TC intensity (stronger TCs are more resilient to hostile conditions), and the steering flow (Colbert and Soden, 2012). In this subsection, we aim to investigate which of these factors – if any – are responsible for the projected increased in FRec.
Projected increases in GPI along the US East Coast are consistent with the increased likelihood of recurvature. In this region, a reduction in wind shear is collocated with a projected increase in PI (Fig. 6). This is consistent with CMIP5 models (Camargo, 2013) and indicates that future TCs traversing the US East Coast may retain TC-like conditions further poleward, increasing their likelihood of both making it to the midlatitudes (and being identified as recurving as a result) and potentially also reaching Europe. The projected increase in GPI along the US East Coast supports previous studies which suggest an increase in the latitude of TC LMI and an overall expansion of the tropical genesis region (Kossin et al., 2014; Haarsma, 2021). However, all five models show an increase in GPI along the US East Coast, but only three models have a significant increase in FRec, indicating that other factors must also play a role.
Figure 7 shows the normalized TC track density for the historical and future periods, along with the difference (future minus historical). The track densities are normalized by dividing by the total number of TCs, so the differences show the geographical redistribution of North Atlantic TCs rather than the change in total number (NTC).

Figure 7Normalized TC track density for the five selected CMIP6 models during the historical (first column) period, towards the end of the century under SSP5-85 (middle) and the difference (future minus historical, right column). Densities less than 1 have been masked for clarity. Black domains represent the boundaries of the MDR, SUB, and WEST regions.
HadGEM, IPSL, and MIROC have many similarities in normalized track density difference. There is proportionally less track density in the MDR and proportionally higher track density in the future along the East Coast of the US heading towards Europe. The large decrease in normalized TC track density in the MDR indicates a potential shift in genesis, away from the MDR towards the west of the North Atlantic, as confirmed by the normalized genesis densities (Fig. S8). To investigate this further, we separate the North Atlantic TCs based on genesis into three regions: the main development region (MDR), subtropical Atlantic (SUB), and western Atlantic (WEST). These regions are constructed such that all North Atlantic TCs form in one of these regions, and the boundaries for these regions can be found in Sect. 2.4.
We decompose the likelihood of recurvature based on these three regions of genesis:
where Wi represents the weighting terms, the proportion of North Atlantic TCs which form in region i, and Fi represents the proportion of TCs forming in region i which recurve (i= MDR, SUB, WEST). The six terms on the right-hand side of Eq. (3) are calculated for the historical and future runs of the five selected CMIP6 models and are shown in Table 3.
Rows 2–6 of Table 3 highlight the significant bias historically of many of the models (all but CNRM) for recurvature of TCs originating in the MDR. Approximately 46 % of MDR-forming TCs recurve in ERA5, but this value is between 3 % and 19 % in four of the five models, with only CNRM correctly capturing this fraction. The three models which have a significant increase in FRec – HadGEM, MIROC, and IPSL – all see a significant shift in proportional genesis away from the MDR towards the SUB and WEST regions. Due to the FMDR bias in these models, the shift in genesis from the MDR to the other regions leads to an increase in FRec. A component of the projected increase in FRec is therefore likely a manifestation of model biases. To quantify the contribution of genesis shifts to the projected change in FRec, we split the change in FRec into three terms as described in the Appendix (Eq. A4). Term 1 represents the contribution to the change in FRec caused by a change in the likelihood of recurvature within each region which recurve, and term 2 represents the contribution to the change in FRec caused by a shift in genesis location. Term 3 is the nonlinear combination of a shift in genesis location and a change in the likelihood of recurvature within each region. This term is usually small but is included for completeness.
Term 2 dominates for the three models which have a significant increase in FRec, indicating a significant contribution to FRec from a shift in genesis location away from the MDR to the SUB and WEST regions in these three (and only these three) models. The projected change in GPI (Fig. 6) does not show a large increase in hostility in the MDR compared to other regions in the future. Changes in TC seeds have been shown to influence TC frequency (Vecchi et al., 2019), and so the shift in TC genesis away from the MDR could be the result of (i) a projected decrease in the frequency or intensity of TC seeds in the MDR or (ii) a change in the conversion rate of seeds into TCs. The results of Tables 3 and 4 are not sensitive to the exact position of the region boundaries (not shown).
Table 4Contribution to projected change in FRec from terms 1 (second column), 2 (third column), and 3 (fourth column) of Eq. (A4). Bolded values represent significance at 95 % using a bootstrapping method. For significant values, the 95 % confidence interval is shown in brackets.
While shifts in genesis explain most of the projected change in FRec in HadGEM, MIROC, and IPSL, they do not explain all of the projected increase. To further investigate the projected changes in FRec, the relationship between projected TC LMI changes and projected FRec changes is explored in the MDR, WEST, and SUB regions of the five selected models. Significant increases in TC LMI are found in the WEST region of HadGEM, MIROC, and IPSL and in the MDR in MIROC. A significant increase in FRec is also found in the same regions and models (Table 3). A significant relationship (Pearson's correlation coefficient of 0.52) is found between TC LMI changes and FRec changes across the five models (Fig. S9), suggesting that projected increases in TC LMI may be associated with the projected increases in FRec in HadGEM, MIROC, and IPSL.
Figure 8 shows the change in the hurricane-season mean deep layer steering flow (Colbert and Soden, 2012). All models have a significantly weaker westerly flow between 30 and 40∘ N over the US East Coast corresponding to the region in which shear decreases in the future (Fig. 6). Differences in the steering flow are very small in the tropics in all models except HadGEM. In HadGEM, the easterly flow in the western tropical Atlantic is reduced, with increased poleward flow in the subtropical North Atlantic. This difference in flow between the historical and future periods would suggest an increased likelihood for recurvature for TCs forming at a given latitude in the WEST region (as the TCs are not being steered as strongly westward towards land) and an increase in the likelihood of recurvature in the MDR, where the slower easterly flow in the western MDR and stronger poleward flow in the subtropics may aid recurvature. This is consistent with Table 3, which shows a significant increase in the likelihood of recurvature in the WEST region and a non-significant increase in the MDR.
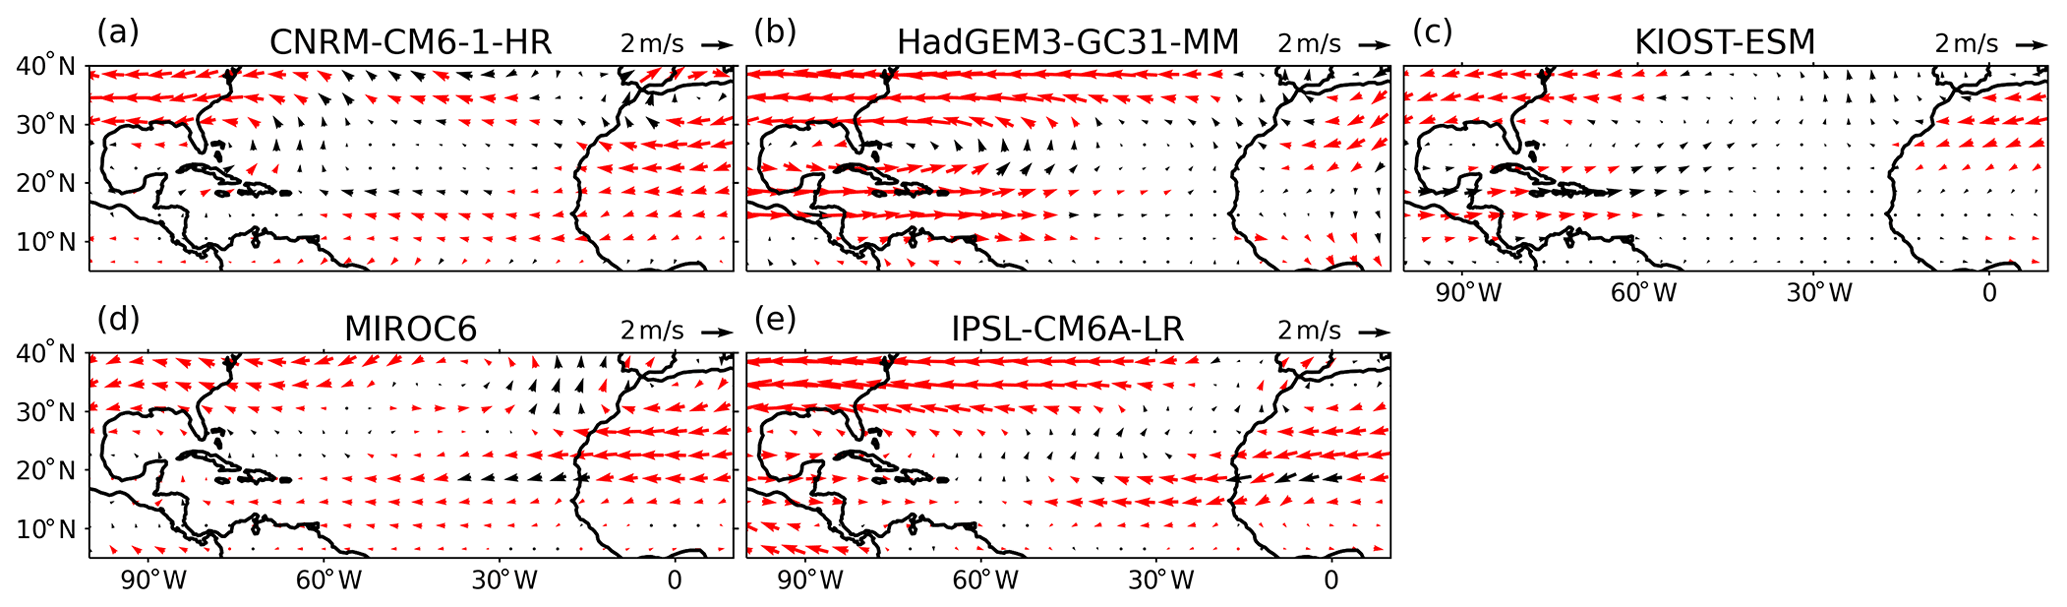
Figure 8Difference (future minus historical) in the hurricane-season averaged deep layer steering flow for the five selected CMIP6 models. Statistically significant differences between the future and historical period at the 95 % level are shown in red and are calculated using Welch's t test.
Three of the five CMIP6 models project a significant increase in FRec. Section 3.2.2 suggests that a shift in genesis from the MDR towards the SUB and WEST regions is responsible for the majority of this projected increase, some of which is likely to be associated with historical model biases. In these three models, increases in TC LMI may also be associated with the projected increase in FRec, and in HadGEM, changes in the steering flow may also play a role. Reduction in vertical wind shear (VWS) and increases in PI (Fig. 6), seen across the models, are also consistent with enhanced longevity, implying increased likelihood of recurvature.
3.2.3 Projected change in the fraction of recurving North Atlantic TCs which reach Europe (FEur|Rec)
While four of the five CMIP6 models agree on the sign of the change in FEur|Rec, this projected increase is only significant in one model, HadGEM. This is associated with a shift in seasonality in HadGEM. In the future in this model, most recurving TCs interact with the midlatitudes later in the hurricane season, a result unique to HadGEM (not shown). A similar change in seasonality of extratropical transition was found across HighResMIP models (Baker et al., 2022). Climatologically, midlatitude baroclinicity increases throughout hurricane season, and so in the future many recurving TCs in HadGEM encounter a more favourable midlatitude environment. This suggests that recurving TCs in HadGEM in the future are more likely to undergo extratropical reintensification, which has been shown to be linked to whether a recurving TC will reach Europe (Sainsbury et al., 2022b).
3.3 Projected changes in Europe-impacting PTC intensity
Figure 9 shows the absolute number (per ensemble member) of Europe-impacting PTCs in each bin during the historical and future periods (bars), with the fractional change overlaid. CNRM and KIOST show a decrease in the absolute number of strong Europe-impacting PTCs (Fig. 9a and e). IPSL and MIROC ensembles show an increase. HadGEM is mixed, with a decrease in the number of PTCs in the highest-intensity bin but increases in the second- and third-highest-intensity bins (Fig. 9b). The projected changes in Europe-impacting PTC intensity shown in Fig. 9 are not significantly different if reproduced using only ensemble members common to both the historical and future periods (Fig. S7).
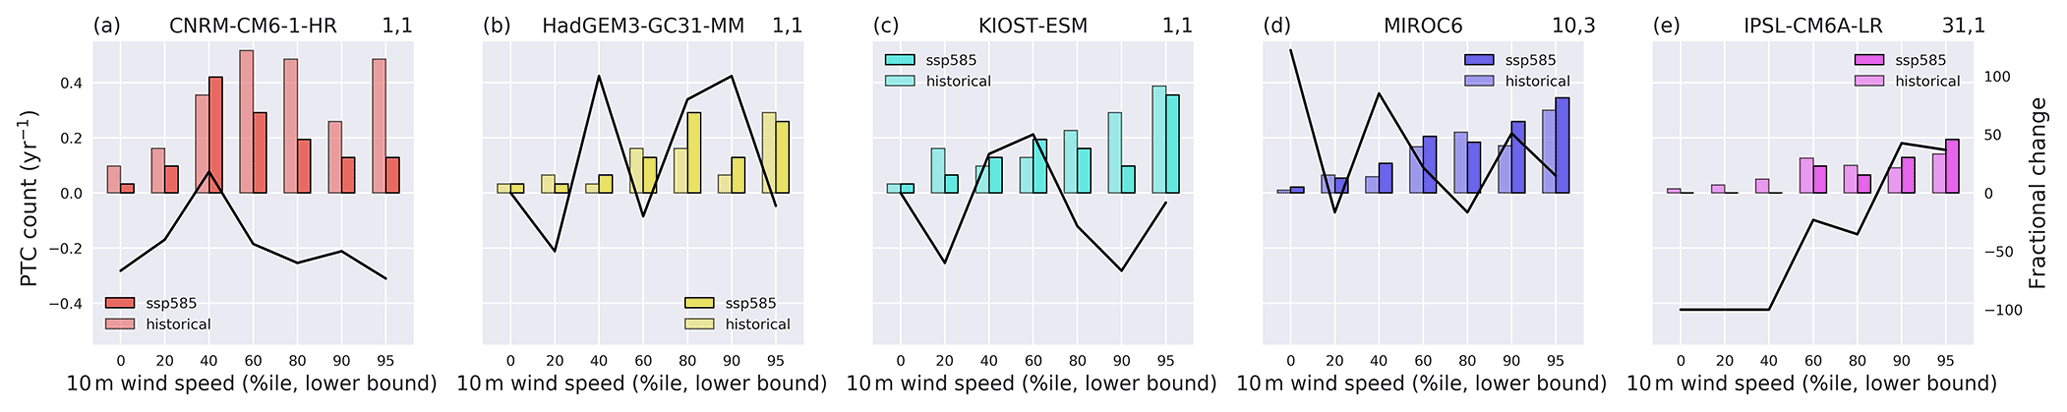
Figure 9Bar plot showing the number of Europe-impacting PTCs (per ensemble member) in each intensity bin for the five selected CMIP6 models for the historical (1984–2014, lighter colours) period and towards the end of the century under the SSP5-85 scenario (2069–2099, darker colours). Fractional change in the counts in the future period compared to historical is shown as the black line corresponding to the right-hand-side y axis. Number of ensemble members used for the historical and future periods are shown in the upper right of each panel (historical, future).
In HadGEM, KIOST, MIROC, and IPSL, the decrease in TC frequency basin-wide is considerably larger than the change in strong Europe-impacting PTCs. For example, MIROC has an increase in the number of strong Europe-impacting PTCs despite a 31 % reduction in the number of North Atlantic TCs. This implies that the proportion of North Atlantic TCs which impact Europe as strong PTCs is projected to increase. This is illustrated in Fig. 10, which shows the proportion of all North Atlantic TCs which reach Europe as strong PTCs (Fig. 10b) and very strong PTCs (Fig. 10c). Strong PTCs are defined as PTCs which impact Europe with winds greater than the 90th percentile of the distribution of maximum winds over Europe during hurricane season (considering all PTCs and MLCs in the historical and future period). Very strong PTCs are PTCs which impact Europe with winds greater than the 95th percentile.
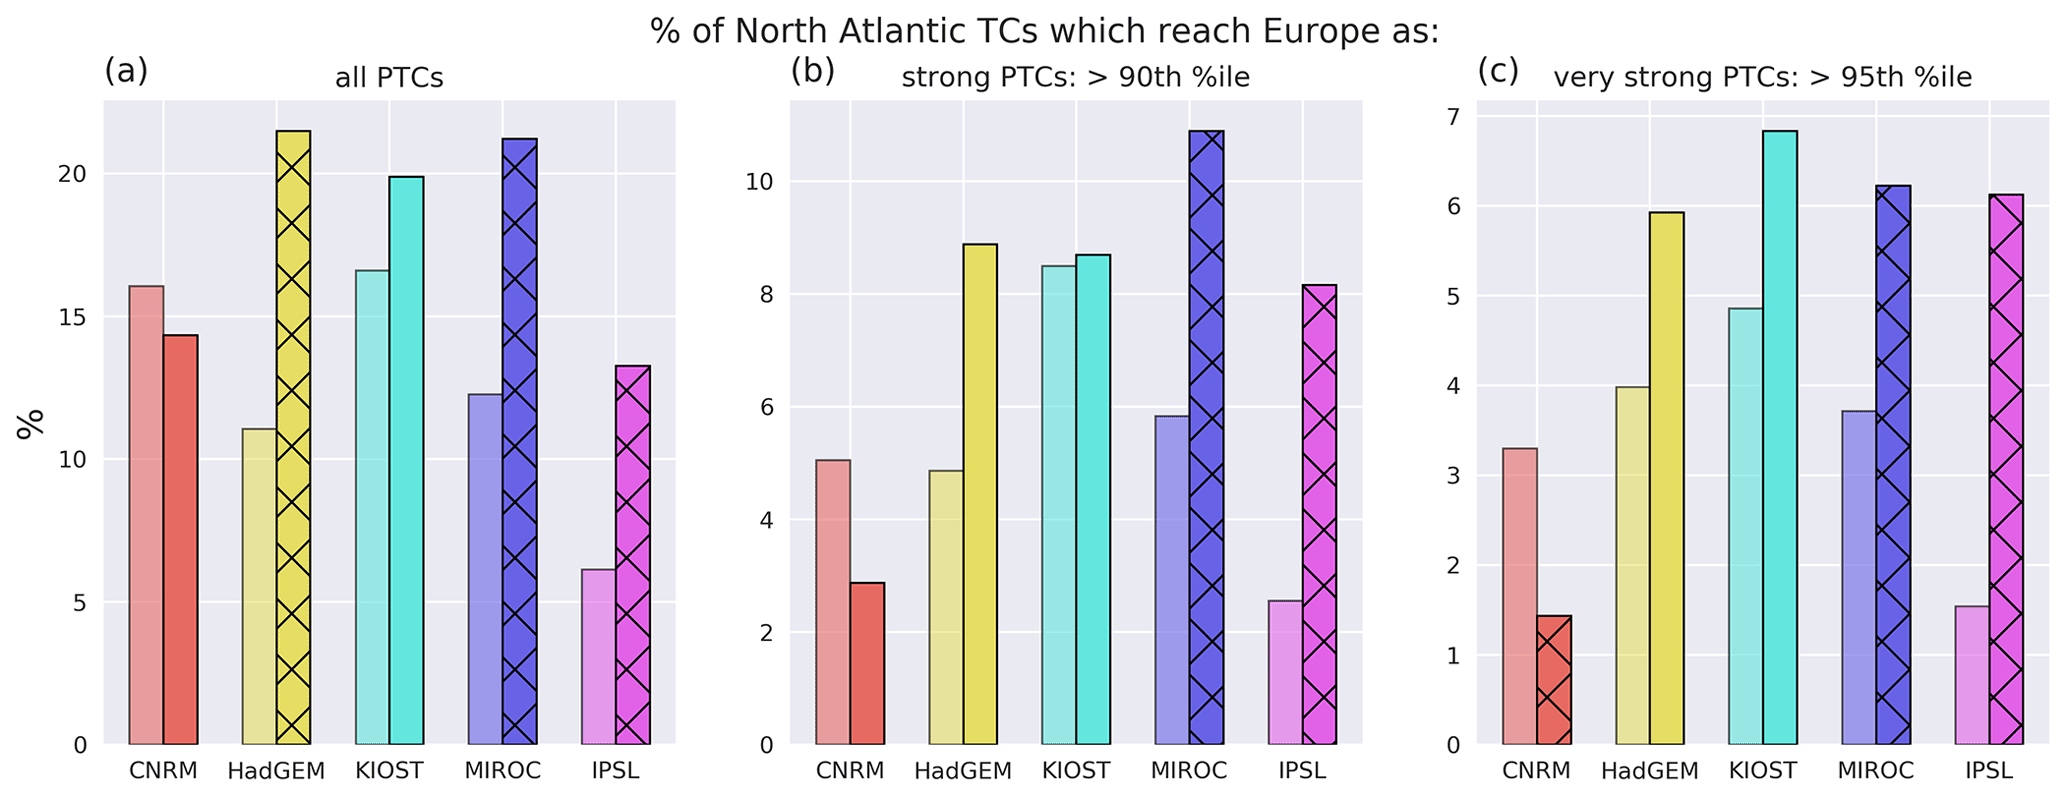
Figure 10Bar charts showing the proportion of North Atlantic TCs which impact Europe as (a) PTCs, (b) strong PTCs (max winds >90th percentile of the distribution of maximum winds over Europe), and (c) very strong PTCs (>95th percentile). Lighter colours show the values for the historical period and darker bars for the future period. Hatching is overlaid in models where the projected change is significant to 95 % using a bootstrapping method.
Four of the five models show an increase in the proportion of North Atlantic TCs which reach Europe as strong and very strong PTCs, and this difference is statistically significant in IPSL and MIROC. Our results therefore suggest that the future risk posed by PTCs to Europe may depend on how TC activity basin-wide changes in the future. If TC frequency decreases substantially (as suggested by this analysis), then the number of strong Europe-impacting PTCs is unlikely to change significantly. However, if TC frequency does not decrease much, or potentially increases, then Europe could be subject to significantly more strong PTCs in the future, as was found in Haarsma et al. (2013).
Haarsma et al. (2013) find a large increase in the frequency of hurricane-force PTCs reaching Europe by the end of the century. The interpretation of Figs. 9 and 10 does not change when using the regions (Norway, North Sea, west UK and Ireland, and Bay of Biscay) and season (August–October) used in Haarsma et al. (2013; Figs. S10–S12). Despite using RCP 4.5, the prescribed SSTs used in Haarsma et al. (2013) are similar to the projected SST changes found in this study (not shown). The differences between Fig. S10 and Fig. 2f in Haarsma et al. (2013) could be caused by different projected changes in North Atlantic TC counts (which were not investigated in their study), differences in model resolution, differences in TC identification methodology, or differences model configuration (coupled vs. atmosphere only).
In this study, we have presented the first multi-model analysis of how Europe-impacting PTC frequency and intensity may change by 2100. Using a vorticity-based tracking scheme and objective TC identification method, we identify all North Atlantic TCs in five CMIP6 models in the historical (1984–2014) period and the future (2069–2099) period under the SSP5-85 scenario, using all available ensemble members. These five models were selected from a wider sample of CMIP6 models based on their ability to simulate North Atlantic TC frequency compared to observations (Fig. S1 in the Supplement). While CMIP6 models do not have sufficient resolution to resolve all TC-related processes, the number of models and ensemble members allows us to investigate projected Europe-impacting PTCs changes with a considerably larger TC sample size than available for previous studies. The key results are as follows.
-
The five selected CMIP6 models are able to simulate many aspects of the North Atlantic TC climatology compared to observations. They capture the relationship between TC frequency and recurving TC frequency and capture the disproportionate risk associated with PTCs compared to extratropical cyclones over Europe. However, the models still have many deficiencies. In particular, TCs forming in the MDR are too short lived and therefore unlikely to recurve, and TC intensity is significantly underestimated.
-
No robust model response in Europe-impacting PTC frequency (overall or as strong storms) is found in the future. This is because two competing factors – a decrease in North Atlantic TC frequency and an increase in the proportion of TCs reaching Europe – are of approximately the same size.
-
The projected decrease in North Atlantic TC frequency is statistically significant in all five models, with decreases of between 30 % and 60 % found by the end of the 21st century.
-
The projected increase in the proportion of TCs reaching Europe is found in four of the five models and is associated with a projected increase in the likelihood of recurvature. The increased likelihood of recurvature may be associated with a more favourable environment for TCs along the US East Coast, where wind shear is projected to decrease and potential intensity is projected to increase in the future. This result is also consistent with previous studies which highlight that conditions between where TCs typically form and Europe are overall likely to become more favourable for tropical cyclogenesis in the future (Haarsma et al., 2013; Baatsen et al., 2015; Liu et al., 2017).
-
The projected increase in the likelihood of recurvature in the North Atlantic is also associated with a shift in genesis, with proportionally fewer TCs forming in the MDR in the future, where model biases cause very few TCs to recurve.
Our results highlight the large uncertainty associated with projected changes in Europe-impacting PTC intensity and frequency. Even the model with the largest projected increase in intense Europe-impacting PTCs has a considerably lower increase than found in previous studies (Haarsma et al., 2013; Baatsen et al., 2015). The large uncertainties in the projected responses are anticipated – model uncertainties in TC genesis (Yamada et al. 2021; Yang et al. 2021; Vecchi et al. 2019; Camargo 2013; Ting et al., 2015), TC recurvature (Colbert and Soden, 2012), TC intensity (Kossin et al., 2020), and midlatitude environment (for example, jet location and intensity; Harvey et al., 2020) could translate to model uncertainty in Europe-impacting PTCs due to the complex life cycle of these systems.
Projected decreases in North Atlantic TC counts are found in many previous studies which explicitly track TCs (Roberts et al., 2015; Gualdi et al., 2008; Rathman et al., 2014), but not all (e.g. Bhatia et al. 2018). There are also physical arguments which support a decrease in TC activity due to an increase in static stability (e.g. Bengtsson et al., 2007; Sugi et al., 2002). However, other methods such as statistical and dynamical downscaling are more mixed in terms of the sign of the projected change (Emanuel, 2021, 2013; Jing et al., 2021), and there are often sensitivities to the tracking scheme when TCs are tracked explicitly (Roberts et al., 2020b). Previous studies have also suggested a broadening of weak TC circulations in the future (Sugi et al., 2020), which would result in future TCs having lower associated vorticity. As a result, tracking schemes which used a fixed vorticity threshold may capture a lower proportion of all model-simulated TCs in the future. The use of a percentile-based vorticity threshold may alleviate this problem. It is therefore necessary to reduce the uncertainty associated with North Atlantic TC frequency projections before greater confidence in future European PTC risk can be achieved. This should involve further work on our theoretical understanding of what drives TC genesis and further quantification of the uncertainty associated with different TC identification methods (e.g. Bourdin et al., 2022).
Model biases, particularly in the MDR, are likely to manifest in the future projections. Furthermore, TC LMI, which is not adequately captured by these models, has been shown to be associated with the likelihood of recurvature (Sainsbury et al., 2022a) and the likelihood that a recurving TC will reach Europe (Sainsbury et al., 2022b). The model deficiencies in TC intensity may therefore be contributing to the low bias in likelihood of recurvature across many of the models during the historical period. Additionally, there is a mismatch between climate model projections and observations of the zonal temperature gradient in the tropical Pacific, which has implications for North Atlantic vertical wind shear (Seager et al., 2019), which is important for TC genesis and may be important for the projected change in the likelihood of recurvature of North Atlantic TCs. Therefore, CMIP6 models must be used cautiously when investigating projected changes to TC recurvature or Europe PTC impacts in the future. Previous studies suggest that TCs will be more intense in the future (Knutson et al., 2010, 2019; Bhatia et al., 2018; Bender et al., 2010; Emanuel, 2021; Walsh et al., 2019), implying greater longevity and a greater probability of reaching Europe (Sainsbury et al., 2022b). Multi-model studies using high-resolution climate models, which are capable of better simulating the distribution of TC intensities, are therefore necessary to fully explore the projected changes in Europe-impacting PTCs.
By splitting the North Atlantic basin into different spatial regions, the fraction of recurving North Atlantic TCs in the historical, H, and future, S, periods can be defined as
where i is MDR, SUB, and WEST; Wi is the proportion of North Atlantic TCs forming in region i; and Fi represents the fraction of TCs forming in region i which recurve. The absolute change in the fraction of recurving TCs, can then be expressed as
Replacing with and with and rearranging and cancelling common terms allows ΔF to be expressed as three separate terms:
The relative contribution of each term can be investigated by dividing the right-hand side by ΔF, as shown in Table 4:
HURDAT2 data can be downloaded from the NOAA's Hurricane Research Division (https://www.aoml.noaa.gov/hrd/hurdat/, last access: 30 September 2019; Landsea and Franklin, 2013). ERA5 data can be obtained from the Copernicus C3S Climate Data Store (https://www.ecmwf.int/en/forecasts/datasets/reanalysis-datasets/era5, last access: 1 September 2022; Hersbach et al., 2020). CMIP6 data can be obtained from the Earth System Grid Federation (https://esgf.llnl.gov/, last access: 1 September 2022; Eyring et al., 2016). Potential intensity is calculated using the tcpyPI Python package, available at https://github.com/dgilford/tcpyPI (last access: 1 August 2022; Gilford, 2021). TRACK can be downloaded from https://gitlab.act.reading.ac.uk/track/track (last access: 1 August 2022; Hodges, 1994, 1995, 1999), and version 1.5.2 is used for this study.
The supplement related to this article is available online at: https://doi.org/10.5194/wcd-3-1359-2022-supplement.
EMS designed the study with input from RKHS, KIH, AJB, LCS, and KTB. EMS performed TC identification and the analysis on cyclone tracks and environmental fields. All authors provided valuable feedback and shaped the study. KIH performed cyclone tracking on ERA5 and the CMIP6 models. EMS prepared the manuscript with input from all co-authors. RKHS, KIH, AJB, and LCS obtained the funding for this project. SB read the manuscript and provided feedback.
The contact author has declared that none of the authors has any competing interests.
Publisher's note: Copernicus Publications remains neutral with regard to jurisdictional claims in published maps and institutional affiliations.
The authors thank Michiel Baatsen and an anonymous reviewer for their comments which greatly improved the clarity of this paper. Elliott Michael Sainsbury was funded by the Natural Environment Research Council (NERC) via the SCENARIO Doctoral Training Partnership with additional CASE funding from BP. Reinhard K. H. Schiemann, Kevin I. Hodges, Alexander J. Baker, and Len C. Shaffrey are supported by the UK National Centre for Atmospheric Science (NCAS) at the University of Reading. Alexander J. Baker acknowledges funding from the PRIMAVERA project received from the European Commission and NERC funding through the North Atlantic Climate System Integrated Study (ACSIS) grant. We thank Olivier Boucher and Thibaut Lurton (IPSL) for re-running the IPSL-CM6A-LR model to provide us with the SSP5-85 scenario data needed to include the model in this study. The IPSL-CM6 experiments were performed using the HPC resources of TGCC (project gencmip6), provided by GENCI (Grand Équipement National de Calcul Intensif). This work benefited from French state aid, managed by the ANR under the “Investissements d'avenir” programme. Stella Bourdin is supported by public funding from the CEA and the EUR IPSL-Climate. Len C. Shaffrey and Reinhard K. H. Schiemann acknowledge funding from the NERC CANARI project.
This research has been supported by the Natural Environment Research Council (grant nos. NE/S0077261/1, NE/N018044/1, and NE/W004984/1), the European Commission Horizon 2020 Framework Programme (PRIMAVERA, grant no. 641727), the Grand Équipement National De Calcul Intensif (grant no. 2021-A0100107732), and the Commissariat Général à l'Investissement (grant no. ANR-11-IDEX-0004-17-EURE-0006).
This paper was edited by Christian M. Grams and reviewed by Michiel Baatsen and one anonymous referee.
Andrews, M. B., Ridley, J. K., Wood, R. A., Andrews, T., Blockley, E. W., Booth, B., Burke, E., Dittus, A. J., Florek, P., Gray, L. J., Haddad, S., Hardiman, S. C., Hermanson, L., Hodson, D., Hogan, E., Jones, G. S., Knight, J. R., Kuhlbrodt, T., Misios, S., Mizielinski, M. S., Ringer, M. A., Robson, J., and Sutton, R. T.: Historical Simulations With HadGEM3-GC3.1 for CMIP6, J. Adv. Model. Earth Syst., 12, e2019MS001995, https://doi.org/10.1029/2019MS001995, 2020.
Arnault, J. and Roux, F.: Characteristics of African easterly waves associated with tropical cyclogenesis in the Cape Verde Islands region in July–August–September of 2004-=2008, Atmos. Res., 100, 61–82, https://doi.org/10.1016/j.atmosres.2010.12.028, 2011.
Avila, L. A. and Cangialosi, J.: Tropical Cyclone Report – Hurricane Irene, National Hurricane Center, 21–28, https://www.nhc.noaa.gov/data/tcr/AL092011_Irene.pdf (last access: 16 November 2022), 2011.
Baatsen, M., Haarsma, R. J., Van Delden, A. J., and de Vries, H.: Severe Autumn storms in future Western Europe with a warmer Atlantic Ocean, Clim. Dynam., 45, 949–964, https://doi.org/10.1007/s00382-014-2329-8, 2015.
Baker, A., Roberts, M. J., Vidale, P. L., Hodges, K. I., Seddon, J., Vanniere, B., Haarsma, R. J., Schiemann, R. K. H., Kapetanakis, D., Tourigny, E., Lohmann, K., Roberts, C. D., and Terray, L.: Extratropical transition of tropical cyclones in a multiresolution ensemble of atmosphere-only and fully coupled global climate models, J. Climate, 35, 5283–5306, https://doi.org/10.1175/JCLI-D-21-0801.1, 2022.
Baker, A. J., Hodges, K. I., Schiemann, R. K. H., and Vidale, P. L.: Historical variability and lifecycles of North Atlantic midlatitude cyclones originating in the tropics, J. Geophys. Res.-Atmos., 126, e2020JD033924, https://doi.org/10.1029/2020jd033924, 2021.
Bender, M. A., Knutson, T. R., Tuleya, R. E., Sirutis, J. J., Vecchi, G. A., Garner, S. T., and Held, I. M.: Modeled impact of anthropogenic warming on the frequency of intense Atlantic hurricanes, Science, 327, 454–458, https://doi.org/10.1126/science.1180568, 2010.
Bengtsson, L., Hodges, K. I., Esch, M., Keenlyside, N., Kornblueh, L., Luo, J. J., and Yamagata, T.: How may tropical cyclones change in a warmer climate?, Tellus Ser. A Dyn. Meteorol. Oceanogr., 59A, 539–561, https://doi.org/10.1111/j.1600-0870.2007.00251.x, 2007.
Bhatia, K. T., Vecchi, G. A., Murakami, H., Underwood, S. D., and Kossin, J. P.: Projected Response of Tropical Cyclone Intensity and Intensification in a Global Climate Model, J. Climate, 31, 8281–8303, https://doi.org/10.1175/JCLI-D-17-0898.1, 2018.
Bieli, M., Camargo, S. J., Sobel, A. H., Evans, J. L., and Hall, T.: A global climatology of extratropical transition. Part I: Characteristics across basins, J. Climate, 32, 3557–3582, https://doi.org/10.1175/JCLI-D-17-0518.1, 2019.
Bieli, M., Sobel, A. H., Camargo, S. J., Murakami, H., and Vecchi, G. A.: Application of the Cyclone Phase Space to Extratropical Transition in a Global Climate Model, J. Adv. Model. Earth Syst., 12, e2019MS001878, https://doi.org/10.1029/2019MS001878, 2020.
Boucher, O., Servonnat, J., Albright, A. L., Aumont, O., Balkanski, Y., Bastrikov, V., Bekki, S., Bonnet, R., Bony, S., Bopp, L., Braconnot, P., Brockmann, P., Cadule, P., and Caubel, A.: Presentation and evaluation of the IPSL-CM6A-LR climate model, J. Adv. Model. Earth Syst., 12, e2019MS002010, https://doi.org/10.1029/2019MS002010, 2020.
Bourdin, S., Fromang, S., Dulac, W., Cattiaux, J., and Chauvin, F.: Intercomparison of Four Tropical Cyclones Detection Algorithms on ERA5, EGUsphere [preprint], https://doi.org/10.5194/egusphere-2022-179, 2022.
Camargo, S. J.: Global and regional aspects of tropical cyclone activity in the CMIP5 models, J. Climate, 26, 9880–9902, https://doi.org/10.1175/JCLI-D-12-00549.1, 2013.
Colbert, A. J. and Soden, B. J.: Climatological variations in North Atlantic tropical cyclone tracks, J. Climate, 25, 657–673, https://doi.org/10.1175/JCLI-D-11-00034.1, 2012.
Dekker, M. M., Haarsma, R. J., Vries, H. de, Baatsen, M., and van Delden, A. J.: Characteristics and development of European cyclones with tropical origin in reanalysis data, Clim. Dynam., 50, 445–455, https://doi.org/10.1007/s00382-017-3619-8, 2018.
Elsner, J. B., Lehmiller, G. S., and Kimberlain, T. B.: Objective Classification of Atlantic Hurricanes, J. Climate, 9, 2880–2889, https://doi.org/10.1175/1520-0442(1996)009<2880:OCOAH>2.0.CO;2, 1996.
Emanuel, K.: Response of global tropical cyclone activity to increasing CO2: Results from downscaling CMIP6 models, J. Climate, 34, 57–70, https://doi.org/10.1175/JCLI-D-20-0367.1, 2021.
Emanuel, K. and Nolan, D. S.: Tropical Cyclone Activity and the Global Climate System, in: 26th Conference on Hurricanes and Tropical Meteorology, 240–241, http://ams.confex.com/ams/pdfpapers/75463.pdf (last access: 15 November 2022), 2004.
Emanuel, K. A.: An Air-Sea Interaction Theory for Tropical Cyclones. Part I: Steady-State Maintenance, J. Atmos. Sci., 43, 585–605, https://doi.org/10.1175/1520-0469(1986)043<0585:AASITF>2.0.CO;2, 1986.
Emanuel, K. A.: Downscaling CMIP5 climate models shows increased tropical cyclone activity over the 21st century, P. Natl. Acad. Sci. USA, 110, 12219–12224, https://doi.org/10.1073/pnas.1301293110, 2013.
Emanuel, K. A., Sundararajan, R., and Williams, J.: Hurricanes and global warming, B. Am. Meteorol. Soc., 89, 347–368, https://doi.org/10.1175/BAMS-89-3-347, 2008.
Evans, C., Wood, K. M., Aberson, S. D., Archambault, H. M., Milrad, S. M., Bosart, L. F., Corbosiero, K. L., Davis, C. A., Pinto, J. R. D., Doyle, J., Fogarty, C., Galarneau, T. J., Grams, C. M., Griffin, K. S., Gyakum, J., Hart, R. E., Kitabatake, N., Lentink, H. S., Mctaggart-Cowan, R., Perrie, W., Quinting, J. F. D., Reynolds, C. A., Riemer, M., Ritchie, E. A., Sun, Y., and Zhang, F.: The extratropical transition of tropical cyclones. Part I: Cyclone evolution and direct impacts, Mon. Weather Rev., 145, 4317–4344, https://doi.org/10.1175/MWR-D-17-0027.1, 2017.
Eyring, V., Bony, S., Meehl, G. A., Senior, C. A., Stevens, B., Stouffer, R. J., and Taylor, K. E.: Overview of the Coupled Model Intercomparison Project Phase 6 (CMIP6) experimental design and organization, Geosci. Model Dev., 9, 1937–1958, https://doi.org/10.5194/gmd-9-1937-2016, 2016.
Gilford, D. M.: pyPI (v1.3): Tropical Cyclone Potential Intensity Calculations in Python, Geosci. Model Dev., 14, 2351–2369, https://doi.org/10.5194/gmd-14-2351-2021, 2021 (code available at: https://github.com/dgilford/tcpyPI, last access: 1 August 2022).
Gualdi, S., Scoccimarro, E., and Navarra, A.: Changes in Tropical Cyclone Activity due to Global Warming: Results from a High-Resolution Coupled General Circulation Model, J. Climate, 21, 5204–5228, https://doi.org/10.1175/2008JCLI1921.1, 2008.
Haarsma, R.: European windstorm risk of post Tropical Cyclones and the impact of climate change, Geophys. Res. Lett., 40, 1783–1788, https://doi.org/10.1029/2020gl091483, 2021.
Haarsma, R. J., Mitchell, J. F. B., and Senior, C. A.: Tropical disturbances in a GCM, Clim. Dynam., 8, 247–257, https://doi.org/10.1007/BF00198619, 1993.
Haarsma, R. J., Hazeleger, W., Severijns, C., De Vries, H., Sterl, A., Bintanja, R., Van Oldenborgh, G. J., and Van Den Brink, H. W.: More hurricanes to hit western Europe due to global warming, Geophys. Res. Lett., 40, 1783–1788, https://doi.org/10.1002/grl.50360, 2013.
Haarsma, R. J., Roberts, M. J., Vidale, P. L., Senior, C. A., Bellucci, A., Bao, Q., Chang, P., Corti, S., Fučkar, N. S., Guemas, V., von Hardenberg, J., Hazeleger, W., Kodama, C., Koenigk, T., Leung, L. R., Lu, J., Luo, J.-J., Mao, J., Mizielinski, M. S., Mizuta, R., Nobre, P., Satoh, M., Scoccimarro, E., Semmler, T., Small, J., and von Storch, J.-S.: High Resolution Model Intercomparison Project (HighResMIP v1.0) for CMIP6, Geosci. Model Dev., 9, 4185–4208, https://doi.org/10.5194/gmd-9-4185-2016, 2016.
Han, Y., Zhang, M. Z., Xu, Z., and Guo, W.: Assessing the performance of 33 CMIP6 models in simulating the large-scale environmental fields of tropical cyclones, Clim. Dynam., 58, 1683–1698, https://doi.org/10.1007/s00382-021-05986-4, 2022.
Harvey, B. J., Cook, P., Shaffrey, L. C., and Schiemann, R. K. H.: The Response of the Northern Hemisphere Storm Tracks and Jet Streams to Climate Change in the CMIP3 , CMIP5 , and CMIP6 Climate Models Journal of Geophysical Research: Atmospheres, J. Geophys. Res.-Atmos., 125, e2020JD032701, https://doi.org/10.1029/2020JD032701, 2020.
Hersbach, H., Bell, B., Berrisford, P., Hirahara, S., Horányi, A., Muñoz-Sabater, J., Nicolas, J., Peubey, C., Radu, R., Schepers, D., Simmons, A., Soci, C., Abdalla, S., Abellan, X., Balsamo, G., Bechtold, P., Biavati, G., Bidlot, J., Bonavita, M., De Chiara, G., Dahlgren, P., Dee, D., Diamantakis, M., Dragani, R., Flemming, J., Forbes, R., Fuentes, M., Geer, A., Haimberger, L., Healy, S., Hogan, R. J., Hólm, E., Janisková, M., Keeley, S., Laloyaux, P., Lopez, P., Lupu, C., Radnoti, G., de Rosnay, P., Rozum, I., Vamborg, F., Villaume, S., and Thépaut, J. N.: The ERA5 global reanalysis, Q. J. Roy. Meteorol. Soc., 146, 1999–2049, https://doi.org/10.1002/qj.3803, 2020 (data available at: https://www.ecmwf.int/en/forecasts/datasets/reanalysis-datasets/era5, last access: 1 September 2022).
Hodges, K., Cobb, A., and Vidale, P. L.: How well are tropical cyclones represented in reanalysis datasets?, J. Climate, 30, 5243–5264, https://doi.org/10.1175/JCLI-D-16-0557.1, 2017.
Hodges, K. I.: A general method for tracking analysis and its application to meteorological data, Mon. Weather Rev., 122, 2573–2586, https://doi.org/10.1175/1520-0493(1994)122<2573:AGMFTA>2.0.CO;2, 1994 (data available at: https://gitlab.act.reading.ac.uk/track/track, last access: 1 August 2022).
Hodges, K. I.: Feature Tracking on the Unit Sphere, Mon. Weather Rev., 123, 3458–3465, https://doi.org/10.1175/1520-0493(1995)123<3458:ftotus>2.0.co;2, 1995.
Hodges, K. I.: Spherical nonparametric estimators applied to the UGAMP model integration for AMIP, Mon. Weather Rev., 124, 2914–2932, https://doi.org/10.1175/1520-0493(1996)124<2914:SNEATT>2.0.CO;2, 1996.
Hodges, K. I.: Adaptive constraints for feature tracking, Mon. Weather Rev., 127, 1362–1373, https://doi.org/10.1175/1520-0493(1999)127<1362:acfft>2.0.co;2, 1999.
Jing, R., Lin, N., Emanuel, K. A., Vecchi, G. A., and Knutson, T. R.: A Comparison of Tropical Cyclone Projections in a High-Resolution Global Climate Model and from Downscaling by Statistical and Statistical-Deterministic Methods, J. Climate, 34, 9349–9364, https://doi.org/10.1175/JCLI-D-21-0071.1, 2021.
Jones, S. C., Harr, P. A., Abraham, J., Bosart, L. F., Bowyer, P. J., Evans, J. L., Hanley, D. E., Hanstrum, B. N., Hart, R. E., Lalaurette, F., Sinclair, M. R., Smith, R. K., and Thorncroft, C.: The extratropical transition of tropical cyclones: Forecast challenges, current understanding, and future directions, Weather Forecast., 18, 1052–1092, https://doi.org/10.1175/1520-0434(2003)018<1052:TETOTC>2.0.CO;2, 2003.
Jung, C. and Lackmann, G. M.: Extratropical Transition of Hurricane Irene (2011) in a Changing Climate, J. Climate, 32, 4847–4871, https://doi.org/10.1175/jcli-d-18-0558.1, 2019.
Jung, C. and Lackmann, G. M.: The response of extratropical transition of tropical cyclones to climate change: Quasi-idealized numerical experiments, J. Climate, 34, 4361–4381, https://doi.org/10.1175/JCLI-D-20-0543.1, 2021.
Knutson, T., Camargo, S. J., Chan, J. C. L., Emanuel, K., Ho, C. H., Kossin, J., Mohapatra, M., Satoh, M., Sugi, M., Walsh, K., and Wu, L.: Tropical cyclones and climate change assessment. Part II: Projected Response to Anthropogenic Warming, B. Am. Meteorol. Soc., 100, 1987–2007, https://doi.org/10.1175/BAMS-D-18-0189.1, 2019.
Knutson, T. R., McBride, J. L., Chan, J. C. L., Emanuel, K. A., Holland, G., Landsea, C. W., Held, I. M., Kossin, J. P., Srivastava, A. K., and Sugi, M.: tropical cyclones and climate change, Nat. Geosci., 3, 157–163, https://doi.org/10.1038/ngeo779, 2010.
Kossin, J. P., Camargo, S. J., and Sitkowski, M.: Climate modulation of north atlantic hurricane tracks, J. Climate, 23, 3057–3076, https://doi.org/10.1175/2010JCLI3497.1, 2010.
Kossin, J. P., Emanuel, K. A., and Vecchi, G. A.: The poleward migration of the location of tropical cyclone maximum intensity, Nature, 509, 349–352, https://doi.org/10.1038/nature13278, 2014.
Kossin, J. P., Knapp, K. R., Olander, T. L., and Velden, C. S.: Global increase in major tropical cyclone exceedance probability over the past four decades, P. Natl. Acad. Sci. USA, 117, 11975–11980, https://doi.org/10.1073/pnas.2021573117, 2020.
Landsea, C. W. and Franklin, J. L.: Atlantic hurricane database uncertainty and presentation of a new database format, Mon. Weather Rev., 141, 3576–3592, https://doi.org/10.1175/MWR-D-12-00254.1, 2013 (data available at: https://www.aoml.noaa.gov/hrd/hurdat/, last access: 30 September 2019).
Liu, M., Vecchi, G. A., Smith, J. A., and Murakami, H.: The present-day simulation and twenty-first-century projection of the climatology of extratropical transition in the North Atlantic, J. Climate, 30, 2739–2756, https://doi.org/10.1175/JCLI-D-16-0352.1, 2017.
Liu, M., Yang, L., Smith, J. A., and Vecchi, G. A.: Response of Extreme Rainfall for Landfalling Tropical Cyclones Undergoing Extratropical Transition to Projected Climate Change: Hurricane Irene (2011), Earth's Futur., 8, e2019EF001360, https://doi.org/10.1029/2019EF001360, 2020.
Michaelis, A. C. and Lackmann, G. M.: Climatological changes in the extratropical transition of tropical cyclones in high-resolution global simulations, J. Climate, 32, 8733–8753, https://doi.org/10.1175/JCLI-D-19-0259.1, 2019.
Pak, G., Noh, Y., Lee, M. I., Yeh, S. W., Kim, D., Kim, S. Y., Lee, J. L., Lee, H. J., Hyun, S. H., Lee, K. Y., Lee, J. H., Park, Y. G., Jin, H., Park, H., and Kim, Y. H.: Korea Institute of Ocean Science and Technology Earth System Model and Its Simulation Characteristics, Ocean Sci. J., 56, 18–45, https://doi.org/10.1007/s12601-021-00001-7, 2021.
Rantanen, M., Räisänen, J., Sinclair, V. A., Lento, J., and Järvinen, H.: The extratropical transition of Hurricane Ophelia (2017) as diagnosed with a generalized omega equation and vorticity equation, Tellus, Ser. A Dyn. Meteorol. Oceanogr., 72, 1–26, https://doi.org/10.1080/16000870.2020.1721215, 2020.
Rathman, N. M., Yang, S., and Kaas, E.: Tropical cyclones in enhanced resolution CMIP5 experiments, Clim. Dynam., 42, 665–681, https://doi.org/10.1007/s00382-013-1818-5, 2014.
Roberts, M. J., Vidale, P. L., Mizielinski, M. S., Demory, M. E., Schiemann, R., Strachan, J., Hodges, K., Bell, R., and Camp, J.: Tropical cyclones in the UPSCALE ensemble of high-resolution global climate models, J. Climate, 28, 574–596, https://doi.org/10.1175/JCLI-D-14-00131.1, 2015.
Roberts, M. J., Camp, J., Seddon, J., Vidale, P. L., Hodges, K., Vanniere, B., Mecking, J., Haarsma, R., Bellucci, A., Scoccimarro, E., Caron, L. P., Chauvin, F., Terray, L., Valcke, S., Moine, M. P., Putrasahan, D., Roberts, C., Senan, R., Zarzycki, C., and Ullrich, P.: Impact of model resolution on tropical cyclone simulation using the HighResMIP-PRIMAVERA multimodel ensemble, J. Climate, 33, 2557–2583, https://doi.org/10.1175/JCLI-D-19-0639.1, 2020a.
Roberts, M. J., Camp, J., Seddon, J., Vidale, P. L., Hodges, K., Vannière, B., Mecking, J., Haarsma, R., Bellucci, A., Scoccimarro, E., Caron, L. P., Chauvin, F., Terray, L., Valcke, S., Moine, M. P., Putrasahan, D., Roberts, C. D., Senan, R., Zarzycki, C., Ullrich, P., Yamada, Y., Mizuta, R., Kodama, C., Fu, D., Zhang, Q., Danabasoglu, G., Rosenbloom, N., Wang, H., and Wu, L.: Projected Future Changes in Tropical Cyclones Using the CMIP6 HighResMIP Multimodel Ensemble, Geophys. Res. Lett., 47, e2020GL088662, https://doi.org/10.1029/2020GL088662, 2020b.
Sainsbury, E. M., Schiemann, R. K. H., Hodges, K. I., Shaffrey, L. C., Baker, A. J., and Bhatia, K. T.: How Important Are Post-Tropical Cyclones for European Windstorm Risk?, Geophys. Res. Lett., 47, e2020GL089853, https://doi.org/10.1029/2020GL089853, 2020.
Sainsbury, E. M., Schiemann, R. K. H., Hodges, K. I., Baker, A. J., Shaffrey, L. C., and Bhatia, K. T.: What Governs the Interannual Variability of Recurving North Atlantic Tropical Cyclones?, J. Climate, 35, 3627–3641, https://doi.org/10.1175/jcli-d-21-0712.1, 2022a.
Sainsbury, E. M., Schiemann, R. K. H., Hodges, K. I., Baker, A. J., Shaffrey, L. C., and Bhatia, K. T.: Why do some Post-Tropical Cyclones impact Europe?, Mon. Weather Rev., 150, 2553–2571, 2022b.
Seager, R., Cane, M., Henderson, N., Lee, D. E., Abernathey, R., and Zhang, H.: Strengthening tropical Pacific zonal sea surface temperature gradient consistent with rising greenhouse gases, Nat. Clim. Chang., 9, 517–522, https://doi.org/10.1038/s41558-019-0505-x, 2019.
Stewart, S. R.: Tropical Cyclone Report: Hurricane Ophelia, National Hurricane Center, 1–32, https://www.nhc.noaa.gov/data/tcr/AL172017_Ophelia.pdf (last access: 16 November 2022), 2018.
Studholme, J., Fedorov, A. V., Gulev, S. K., Emanuel, K., and Hodges, K.: Poleward expansion of tropical cyclone latitudes in warming climates, Nat. Geosci., 15, 14–28, https://doi.org/10.1038/s41561-021-00859-1, 2022.
Sugi, M., Noda, A., and Sato, N.: Influence of the global warming on tropical cyclone climatology an experiment with the JMA global model, J. Meteorol. Soc. Jpn., 80, 249–272, https://doi.org/10.2151/jmsj.80.249, 2002.
Sugi, M., Yamada, Y., Yoshida, K., Mizuta, R., Nakano, M., Kodama, C., and Satoh, M.: Future Changes in the Global Frequency of Tropical Cyclone Seeds, Sci. Online Lett. Atmos., 16, 70–74, https://doi.org/10.2151/sola.2020-012, 2020.
Tatebe, H., Ogura, T., Nitta, T., Komuro, Y., Ogochi, K., Takemura, T., Sudo, K., Sekiguchi, M., Abe, M., Saito, F., Chikira, M., Watanabe, S., Mori, M., Hirota, N., Kawatani, Y., Mochizuki, T., Yoshimura, K., Takata, K., O'ishi, R., Yamazaki, D., Suzuki, T., Kurogi, M., Kataoka, T., Watanabe, M., and Kimoto, M.: Description and basic evaluation of simulated mean state, internal variability, and climate sensitivity in MIROC6, Geosci. Model Dev., 12, 2727–2765, https://doi.org/10.5194/gmd-12-2727-2019, 2019.
Thorncroft, C. and Hodges, K.: African easterly wave variability and its relationship to Atlantic tropical cyclone activity, J. Climate, 14, 1166–1179, https://doi.org/10.1175/1520-0442(2001)014<1166:AEWVAI>2.0.CO;2, 2001.
Ting, M., Camargo, S. J., Li, C., and Kushnir, Y.: Natural and Forced North Atlantic Hurricane Potential Intensity Change in CMIP5 Models, J. Climate, 28, 3926–3942, https://doi.org/10.1175/jcli-d-14-00520.1, 2015.
Vecchi, G. A., Delworth, T., Gudgel, R., Kapnick, S., Rosati, A., Wittenberg, A. T., Zeng, F., Anderson, W., Balaji, V., Dixon, K., Jia, L., Kim, H. S., Krishnamurthy, L., Msadek, R., Stern, W. F., Underwood, S. D., Villarini, G., Yang, X., and Zhang, S.: On the seasonal forecasting of regional tropical cyclone activity, J. Climate, 27, 7994–8016, https://doi.org/10.1175/JCLI-D-14-00158.1, 2014.
Vecchi, G. A., Delworth, T. L., Murakami, H., Underwood, S. D., Wittenberg, A. T., Zeng, F., Zhang, W., Baldwin, J. W., Bhatia, K. T., Cooke, W., He, J., Kapnick, S. B., Knutson, T. R., Villarini, G., van der Wiel, K., Anderson, W., Balaji, V., Chen, J.-H., Dixon, K. W., Gudgel, R., Harris, L. M., Jia, L., Johnson, N. C., Lin, S. J., Liu, M., Ng, C. H. J., Rosati, A., Smith, J. A., and Yang, X.: Tropical cyclone sensitivities to CO2 doubling: roles of atmospheric resolution, synoptic variability and background climate changes, Clim. Dynam., 53, 5999–6033, https://doi.org/10.1007/s00382-019-04913-y, 2019.
Vidale, P. L., Hodges, K., Vannière, B., Davini, P., Roberts, M. J., Strommen, K., Weisheimer, A., Plesca, E., and Corti, S.: Impact of stochastic physics and model resolution on the simulation of Tropical Cyclones in climate GCMs, J. Climate, 34, 4315–4341, https://doi.org/10.1175/jcli-d-20-0507.1, 2021.
Voldoire, A., Saint-Martin, D., Sénési, S., Decharme, B., Alias, A., Chevallier, M., Colin, J., Guérémy, J.-F., Michou, M., Moine, M.-P., Nabat, P., Roehrig, R., Salas Y Mélia, D., Séférian, R., Valcke, S., Beau, I., Belamari, S., Berthet, S., Cassou, C., Cattiaux, J., Deshayes, J., Douville, H., Ethé, C., Franchistéguy, L., Geoffroy, O., Lévy, C., Madec, G., Meurdesoif, Y., Msadek, R., Ribes, A., Sanchez-Gomez, E., Terray, L., and Waldman, R.: Evaluation of CMIP6 DECK Experiments With CNRM-CM6-1, J. Adv. Model. Earth Syst., 11, 2177–2213, https://doi.org/10.1029/2019MS001683, 2019.
Walsh, K., Camargo, S. J., Knutson, T. R., Kossin, J. P., Lee, T.-C., Murakami, H., and Patricola, C. M.: Tropical cyclones and climate change, Trop. Cyclone Res. Rev., 8, 240–250, https://doi.org/10.1016/j.tcrr.2020.01.004, 2019.
Walsh, K. J. E., Camargo, S. J., Vecchi, G. A., Daloz, A. S., Elsner, J., Emanuel, K., Horn, M., Lim, Y. K., Roberts, M., Patricola, C., Scoccimarro, E., Sobel, A. H., Strazzo, S., Villarini, G., Wehner, M., Zhao, M., Kossin, J. P., La Row, T., Oouchi, K., Schubert, S., Wang, H., Bacmeister, J., Chang, P., Chauvin, F., Jablonowski, C., Kumar, A., Murakami, H., Ose, T., Reed, K. A., Saravanan, R., Yamada, Y., Zarzycki, C. M., Luigi Vidale, P., Jonas, J. A., and Henderson, N.: Hurricanes and climate: The U.S. Clivar working group on hurricanes, B. Am. Meteorol. Soc., 96, 997–1017, https://doi.org/10.1175/BAMS-D-13-00242.1, 2015.
Yamada, Y., Kodama, C., Satoh, M., Sugi, M., Roberts, M. J., Mizuta, R., Noda, A. T., Nasuno, T., Nakano, M., and Vidale, P. L.: Evaluation of the contribution of tropical cyclone seeds to changes in tropical cyclone frequency due to global warming in high-resolution multi-model ensemble simulations, Prog. Earth Planet. Sci., 8, 1–17, 2021.
Yang, W., Hsieh, T.-L., and Vecchi, G. A.: Hurricane annual cycle controlled by both seeds and genesis probability, P. Natl. Acad. Sci. USA, 118, , https://doi.org/10.1073/pnas.2108397118, 2021.