the Creative Commons Attribution 4.0 License.
the Creative Commons Attribution 4.0 License.
 | 01 Apr 2022
Impact of climate change on wintertime European atmospheric blocking
Sara Bacer
Fatima Jomaa
Julien Beaumet
Hubert Gallée
Enzo Le Bouëdec
Martin Ménégoz
Chantal Staquet
We study the impact of climate change on wintertime atmospheric blocking over Europe focusing on the frequency, duration, and size of blocking events. These events are identified via the weather type decomposition (WTD) methodology applied on the output of climate models of the Coupled Model Intercomparison Project phase 6 (CMIP6). Historical simulations and two future scenarios, SSP2-4.5 and SSP5-8.5, are considered. The models are evaluated against the reanalysis, and only a subset of climate models, which better represent the blocking weather regime in the recent-past climate, is considered for the analysis. We show that the spatio-temporal characteristics of recent-past atmospheric blocking are in agreement with previous studies that define blocking events with blocking indexes. We find that frequency and duration of blocking events remain relatively stationary over the 21st century. We define a methodology that relies on the WTD for the blocking event identification in order to quantify the size of the blocking events, and we find that the blocking size is basically unchanged in the future.
- Article
(4334 KB) - Full-text XML
-
Supplement
(6826 KB) - BibTeX
- EndNote


Atmospheric blocking is a persistent and quasi-stationary phenomenon which highly impacts the mid-latitude circulation. By obstructing the usual westerly winds, atmospheric blocking can promote cut-off cyclones (Munoz et al., 2020) and enhance cooling in winter and warming in summer. Its long duration (from days to weeks) affects surface weather and climate and fosters regional extreme events, such as heatwaves, droughts, and severe cold weather in winter (Barriopedro et al., 2010; Woollings et al., 2018; Kautz et al., 2021, and references therein). Blocking events are generally associated with high-pressure systems. During anticyclonic periods, solar radiation and high temperatures in summer promote ozone formation, while thermal inversions with subsidence conditions in winter promote the accumulation of particulate matter (e.g. Largeron and Staquet, 2016; Hou and Wu, 2016).
Simulating blocking is a challenging task for atmospheric models as it requires an accurate description of the topography, a fine resolution both vertically and horizontally, appropriate physical parameterizations, and a correct description of internal dynamics (Davini et al., 2017). It has been shown that general circulation models (GCMs) are able to reproduce the blocking regime and its variability, although they tend to underestimate frequency and persistence of blocking events (Dunn-Sigouin et al., 2013; Masato et al., 2013, 2014; Woollings et al., 2018; Davini and D'Andrea, 2020). Increasing model resolution can improve the blocking occurrence as the transient eddies and orography are better described (Berckmans et al., 2013; Schiemann et al., 2017). Since atmospheric blocking is related to stratospheric variability (e.g. the stratospheric sudden warming; Davini et al., 2014), a good representation of the stratosphere can also improve blocking simulations.
The identification of blocking events in numerical simulations is complicated by the fact that blocking is determined by various dynamical mechanisms and presents different patterns. Several blocking indexes have been proposed in the literature based on meteorological fields, usually the geopotential height at 500 hPa (e.g. Tibaldi and Molteni, 1990), or anomalies of meteorological fields (e.g. Dole and Gordon, 1983). Blocking indexes focus on different characteristics of blocking, so the choice of the index depends on the purpose of the study. Additionally, index definitions depend on various (user-dependent) parameters, like latitude band limits, latitude references, and anomaly thresholds (a review of the blocking indexes can be found in Barriopedro et al., 2010, while a recent discussion about their differences is in Pinheiro et al., 2019). Given the variety of blocking indexes, the comparison across studies is not straightforward.
Atmospheric blocking can also be identified via the so-called weather type decomposition (WTD) methodology, which classifies the atmospheric circulation into discrete weather regimes (Michelangeli et al., 1995). The WTD methodology, referred to as the WTD hereafter for brevity, relies on a partitioning algorithm that groups data of a meteorological variable (usually geopotential height or sea level pressure) into clusters so that the variance between clusters is maximized and the variance within a given cluster is minimized. In this way, the clusters (weather regimes or weather types) are the result of a mathematical algorithm. The results of the WTD depend on certain user choices, such as the sector size, the clustering algorithm, and the initialization of this algorithm. Despite the fact that the clusters may not be well separated, the WTD has proved to be very useful in the literature. In fact, the WTD can be used to explain most of the atmospheric variability and has largely been used to define weather regimes especially in the Northern Hemisphere (e.g. Michelangeli et al., 1995; Cassou et al., 2004; Barriopedro et al., 2006; Ullmann et al., 2014; Fabiano et al., 2020). In the Euro-Atlantic sector, for example, four winter weather types have been recognized: positive North Atlantic Oscillation (NAO), negative NAO, Atlantic ridge, and European blocking. The WTD has also been used to analyse weather types in relation to other quantities like temperature (e.g. Cassou et al., 2005), precipitation (e.g. Ullmann et al., 2014), winds (e.g. Jiménez et al., 2009), and pollutants (e.g. Russo et al., 2014). In this study, the WTD is used to identify blocking events in the Euro-Atlantic sector.
The impact of blocking events on weather and climate is related to their spatio-temporal characteristics, such as occurrence, duration, and size. Many studies investigated frequency and duration of blocking events in the past climate using reanalysis data (e.g. Wiedenmann et al., 2002; Barriopedro et al., 2006; Mokhov et al., 2013; Cheung et al., 2013; Drouard and Woollings, 2018; Lupo et al., 2019). Understanding the impact of climate change on atmospheric blocking is of fundamental importance to estimate future climate and extreme events; thus, future blocking has also been investigated in response to global warming. For example, the Arctic amplification has been studied in relation to the intensity and frequency of blocking events; although some studies suggest that the Arctic warming yields to an increment of these two quantities (e.g. Francis and Vavrus, 2012), further investigations are necessary to understand the Arctic amplification effect on blocking (Hassanzadeh et al., 2014; Barnes et al., 2014). So far, studies have mainly focused on frequency and duration of future blocking events. Some of these studies found that blocking frequency will decrease in the Northern Hemisphere (e.g. Dunn-Sigouin and Son, 2013; Matsueda and Endo, 2017; Fabiano et al., 2020; Davini and D'Andrea, 2020), while blocking duration may either increase (Sillmann and Croci-Maspoli, 2009) or decrease (Fabiano et al., 2020). Other studies showed that blocking frequency and duration will not change notably in a warming climate (Dunn-Sigouin and Son, 2013; Huguenin et al., 2020). Future changes in blocking size have received less attention (Hassanzadeh et al., 2014; Nabizadeh et al., 2019).
Most of the studies mentioned above determined blocking events via blocking indexes (Sillmann and Croci-Maspoli, 2009; Dunn-Sigouin and Son, 2013; Hassanzadeh et al., 2014; Matsueda and Endo, 2017; Nabizadeh et al., 2019; Davini and D'Andrea, 2020) and considered GCMs participating in the Coupled Model Intercomparison Project phase 5 (CMIP5; Dunn-Sigouin and Son, 2013; Matsueda and Endo, 2017; Huguenin et al., 2020) or idealized GCMs (Hassanzadeh et al., 2014). To our knowledge, only Fabiano et al. (2020) applied the WTD to CMIP6 models in order to analyse the changes in frequency and duration of the blocking weather type during the 21st century.
In this study, we investigate the impact of climate change on European atmospheric blocking in terms of frequency, duration, and especially size. Several GCMs of the latest model intercomparison CMIP6 are considered for this purpose under two different future scenarios (SSP2-4.5 and SSP5-8.5). In order to identify blocking events, the WTD is applied. We focus on wintertime blocking as it is more frequent, longer, and stronger than blocking in summer in the Euro-Atlantic sector (Barriopedro et al., 2006; Cheung et al., 2013; Lupo et al., 2019). Moreover, winter blocking events are often associated with severe particulate matter pollution episodes. We define a method, referred to as the WTD method, to quantify the size of blocking events that are identified via the WTD. We compare the results obtained with this method with the results obtained for the blocking events identified via the index of Dole and Gordon (1983). Besides using GCMs of the latest CMIP phase, investigating frequency, duration, and size of blocking events that are determined via the WTD instead of blocking indexes makes this work an original study.
Daily means of geopotential height at 500 hPa (Z500) are used for the WTD. More precisely, the WTD is applied to winter anomalies of Z500, in which the winter season is defined from 1 November to 31 March (NDJFM, like in Cassou, 2008, for instance). The numerical domain of Z500 covers the Euro-Atlantic sector whose boundaries are 20∘ N–80∘ N, 80∘ W–50∘ E.
In this study, GCMs of the CMIP6 (Eyring et al., 2016) are considered. It has been shown that the weather regimes are reproduced better in CMIP6 models than in CMIP5 models, especially over the Euro-Atlantic sector (Fabiano et al., 2020; Davini and D'Andrea, 2020). We use historical runs to analyse blocking conditions in recent-past climate and two future projections, SSP2-4.5 and SSP5-8.5 (Riahi et al., 2017), to investigate their changes in future climate. SSP2-4.5 assumes that social, economic, and technological trends broadly follow their historical patterns and is considered as a likely scenario given the current policies. In contrast, SSP5-8.5 projects strong increments of emissions without mitigation policies; it is the worst-case scenario and is considered unlikely (Hausfather and Peters, 2020). We also use the ERA5 reanalysis of the European Centre for Medium-Range Weather Forecasts with a resolution of 31 km (Hersbach et al., 2020) to evaluate the GCMs' ability to reproduce the blocking weather regime.
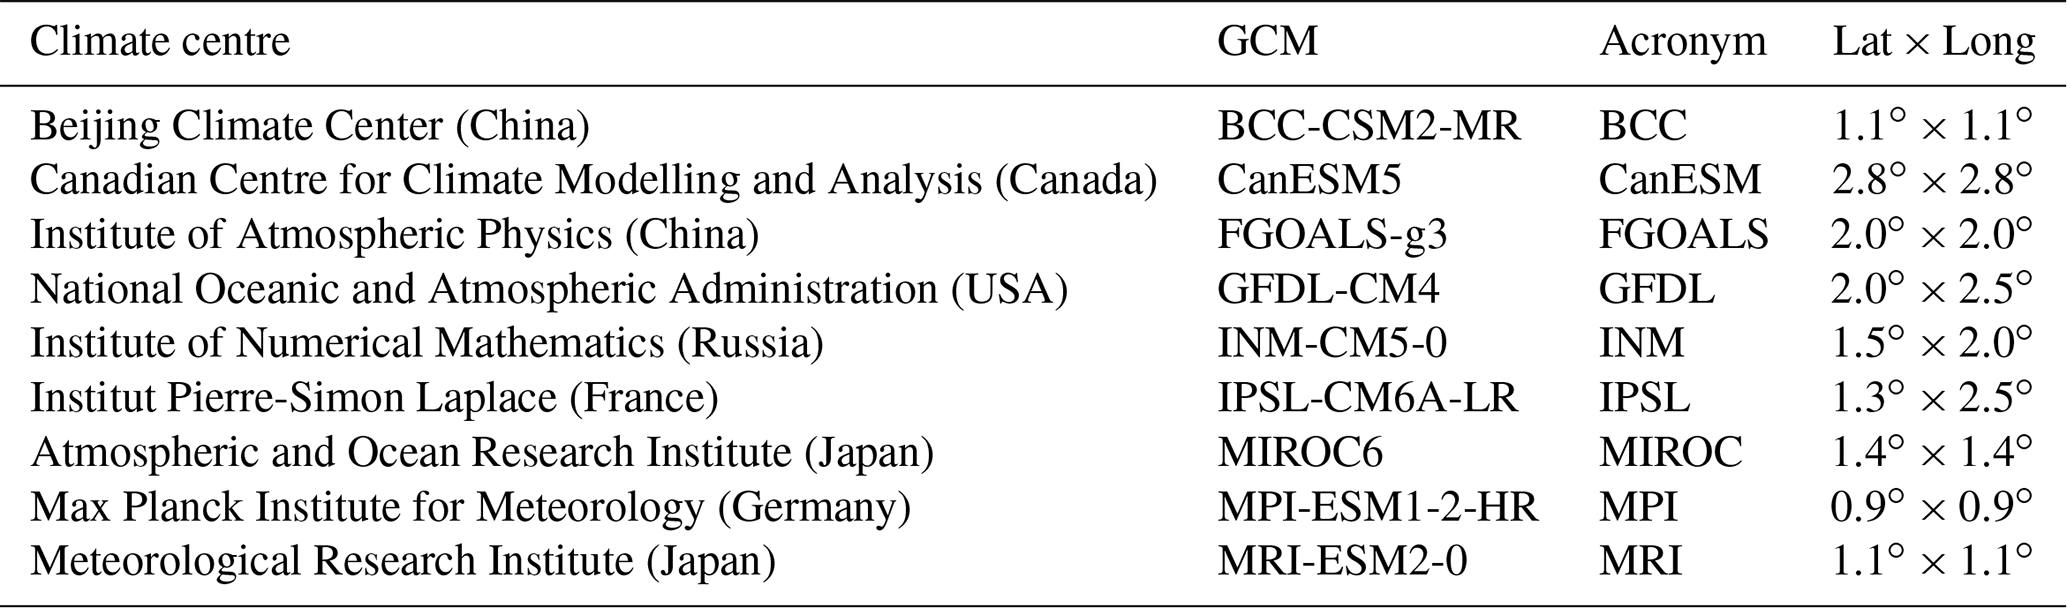
The Z500 outputs considered in this study are archived in the Mésocentre ESPRI (Ensemble de services pour la recherche à l'IPSL). We selected the nine CMIP6 GCMs presented in Table 1 according to the following criteria: one GCM per each climate research centre, as different versions of the same model could present model-dependent similarities (Ullmann et al., 2014); GCMs having both SSP2-4.5 and SSP5-8.5 scenarios available; and GCMs with the “r1i1p1f1” run available (where “r1”: initial conditions; “i1”: initialization method; “p1”: physical scheme; and “f1”: forcing configuration), as this is the most frequently accessible simulation. The analysed periods are 30 yr long: 1980–2009 (HIST hereafter) and 2070–2099 (SSP2 or SSP5 hereafter, according to the scenario).
Table 1The CMIP6 GCMs used in this study. The columns contain, from left to right, the name of the research centre developer of the GCM, the name of the GCM, the acronym used in this study, and the resolution of the Z500 output. All data were provided by the Mésocentre ESPRI.
3.1 Detection of the blocking weather regime
The following procedure is carried out for each GCM of Table 1 and ERA5 and for each period (HIST, SSP2, and SSP5). First, daily anomalies of Z500, denoted ΔZ500, are computed as difference between the daily means of Z500 and the annual cycle (including the mean) of the 30 yr period used as a climatology reference (see Sect. 3.2); only the winter season (NDJFM) is retained. Second, the anomalies are weighted (multiplied) by the square root of the cosine of the latitude (Chung and Nigam, 1999) in order to account for the convergence of the meridians and to decrease the impact of high-latitude grid boxes that represent a small area of the globe (like in Cassou, 2008; Ullmann et al., 2014; Cortesi et al., 2019). Since the GCMs have different resolutions (Table 1), the anomalies are linearly interpolated onto a common grid of resolution .
Blocking events are identified through the application of the WTD. This weather classification has largely been used in order to infer the recurrent atmospheric features at mid-latitudes (Michelangeli et al., 1995; Philipp et al., 2016). It can be divided into two steps: dimensional reduction of the data set and clustering. Similarly to other studies (e.g. Boé and Terray, 2008; Hertig and Jacobeit, 2014; Sáenz and Durán-Quesada, 2015), we apply the principal component analysis (PCA) for the first step and the k-means algorithm for the second step. Therefore, the PCA is applied to the resulting anomalies, and the eigenvectors necessary to explain 95 % of the total variance (24 eigenvectors on average) are retained to define the reduced data set. Then, k-means is applied to this data set by imposing that the number of clusters (k) is equal to 4, i.e. the four well-known weather types of the Euro-Atlantic sector (positive and negative NAO, Atlantic ridge, and European blocking), as done in Cassou (2008), Ullmann et al. (2014), and Fabiano et al. (2020), and each day of HIST, SSP2, and SSP5 is assigned to one of the four weather types. Only the weather regime corresponding to the European atmospheric blocking is analysed in this study.
On the whole, while identifying blocking via blocking indexes implies making several choices, identifying blocking via the WTD can be considered as a standard procedure. This motivated us to apply the WTD and to explore this methodology for identifying blocking events and then studying their main characteristics (frequency, duration, size).
3.2 Z500 anomalies
Climate change causes an overall increase in Z500 due to the warming of air masses. In order to study the changes in the spatio-temporal characteristics of blocking in the future, we compute the anomalies in all periods (HIST, SSP2, SSP5) by subtracting from Z500 the annual cycle of that period; these anomalies are denoted ΔZ500HIST, ΔZ500SSP2, and ΔZ500SSP5. Being the blocking events identified with the departure (anomaly) from the atmospheric mean state, the comparison between recent-past and future results will allow us to quantify the dynamical climate signal ignoring the thermodynamical signal related to the anthropogenic warming. We also compute the future anomalies by subtracting the HIST annual cycle from Z500 of the future periods; these anomalies are denoted ΔZ500SSP2−HIST and ΔZ500SSP5−HIST. In this case, the comparison between recent-past and future anomalies will show the gross impact on blocking of the total climate change signal, governed by greenhouse gas increase, global warming, and associated regional circulation changes.
3.3 Definition of blocking events
Consecutive days that belong to the blocking weather type can form a blocking event. The blocking events considered in this study must be at least 5 d long (like in Barriopedro et al., 2006; Matsueda et al., 2009; Mokhov et al., 2013). A single non-blocking day (“hole”) might represent a failure of k-means on that day, like in Matsueda et al. (2009). Concretely, the k-means result is processed in such a way that (1) two blocking events equal to/longer than 2 d separated by a hole form one blocking event and (2) one blocking event equal to/longer than 3 d and 1 blocking day separated by a hole (and then vice versa) form one blocking event. Overall, the number of holes that are converted into blocking days is very small, about 0.3 % of the number of winter days (4530).
We clarify here the meaning of some specific terms. We call centroids the four centres of mass defined by the k-means algorithm in the reduced space, i.e. the space whose coordinates are the eigenvectors. Weather regime (or weather type) refers to the centroid transformed into the original latitude–longitude coordinate space. From now on, we call blocking days those days which belong to a blocking event. Finally, we refer to the temporal mean of ΔZ500 over the blocking days of a blocking event as the composite of that event.
3.4 Computation of blocking area
We quantify the size of a blocking event by its area. Two distinct methods are used to compute the blocking area: the so-called WTD method, introduced in this study, and the DG method, used by Nabizadeh et al. (2019).
3.4.1 WTD method
We introduce this method to compute the area of the composites of the blocking events inferred from the WTD. The WTD method starts from the detection of the centre of each composite. In this study, we define as centre of the European atmospheric blocking the location of the maximum positive anomaly of the composite between 30∘ W and 50∘ E (similarly to Barriopedro et al., 2006) in order to discard blocking with positive anomaly on the westernmost part of the sector. The blocking size is quantified by the area enclosed within the contour line equal to a certain threshold of ΔZ500. Such a threshold must be lower than the minimum value among the centres over all periods and all GCMs in order to get non-zero areas and compare past and future results among the GCMs. In this study, the threshold is 75 m considering ΔZ500HIST, ΔZ500SSP2, and ΔZ500SSP5. Technical details about the WTD method are reported in the Supplement.
3.4.2 DG method
This method follows the work of Nabizadeh et al. (2019), who determined the size of the atmospheric blocking events identified with the index of Dole and Gordon (1983) (DG index hereafter). Thus, we also compute the daily DG index for each grid box of the domain and identify as blocking events those grid boxes where the DG index is higher than 1.5 for at least 5 consecutive days. We will refer to these days as DG-blocking days and to the blocking events as DG-blocking events. The DG method consists of computing, for each DG-blocking day, the area enclosed by the contour line where the DG index is equal to 1, i.e. the contour line equal to a certain threshold of ΔZ500: 112 m for ΔZ500HIST, ΔZ500SSP2, and ΔZ500SSP5. Then, daily areas are averaged along the event duration to get the area of the DG-blocking event (more details about the DG method are in the Supplement). In the present paper, the DG-blocking days are identified within the blocking events inferred from the WTD (and not during the entire winter, as considered by Dole and Gordon, 1983).
Therefore, these methods compute the area of blocking events that are identified via two different approaches: the WTD and the DG index. Although the algorithm to compute the blocking area within a certain contour line is the same, it is applied to blocking composites in the WTD method and to daily ΔZ500 in the DG method. Another difference between these two methods is the definition of the ΔZ500 values of the contour lines (i.e. the thresholds).
4.1 Evaluation of the GCMs
Before analysing the impact of climate change on European atmospheric blocking events, the ability of the GCMs (Table 1) in reproducing atmospheric blocking is evaluated with respect to the reanalysis with a Taylor diagram (Fig. 1). This diagram compares the blocking composites of each GCM during HIST with the ERA5 composite. The deviation is quantified in terms of pattern correlation (R), standard deviation (σ), and root-mean-square difference (RMSD). All GCMs are able to represent blocking variability (i.e. σ) quite close to the variability obtained with the reanalysis (σERA5≅61 m). More precisely, the variability of all GCMs is within the range σERA5±6 m, apart from INM and IPSL. Six models (MPI, BCC, MRI, GFDL, INM, and FGOALS) show a high correlation (R≥0.79) with ERA5, while three models (CanESM, MIROC, and IPSL) present a lower correlation (R<0.6) and a high RMSD. Hertig and Jacobeit (2014) also found that historical runs of CanESM cannot reproduce well the blocking pattern, getting a correlation with reanalysis lower than 0.4. In this study, CanESM is the GCM with the coarsest resolution (Table 1), and it has been shown that a low resolution hinders a good description of the atmospheric variability patterns (Berckmans et al., 2013).
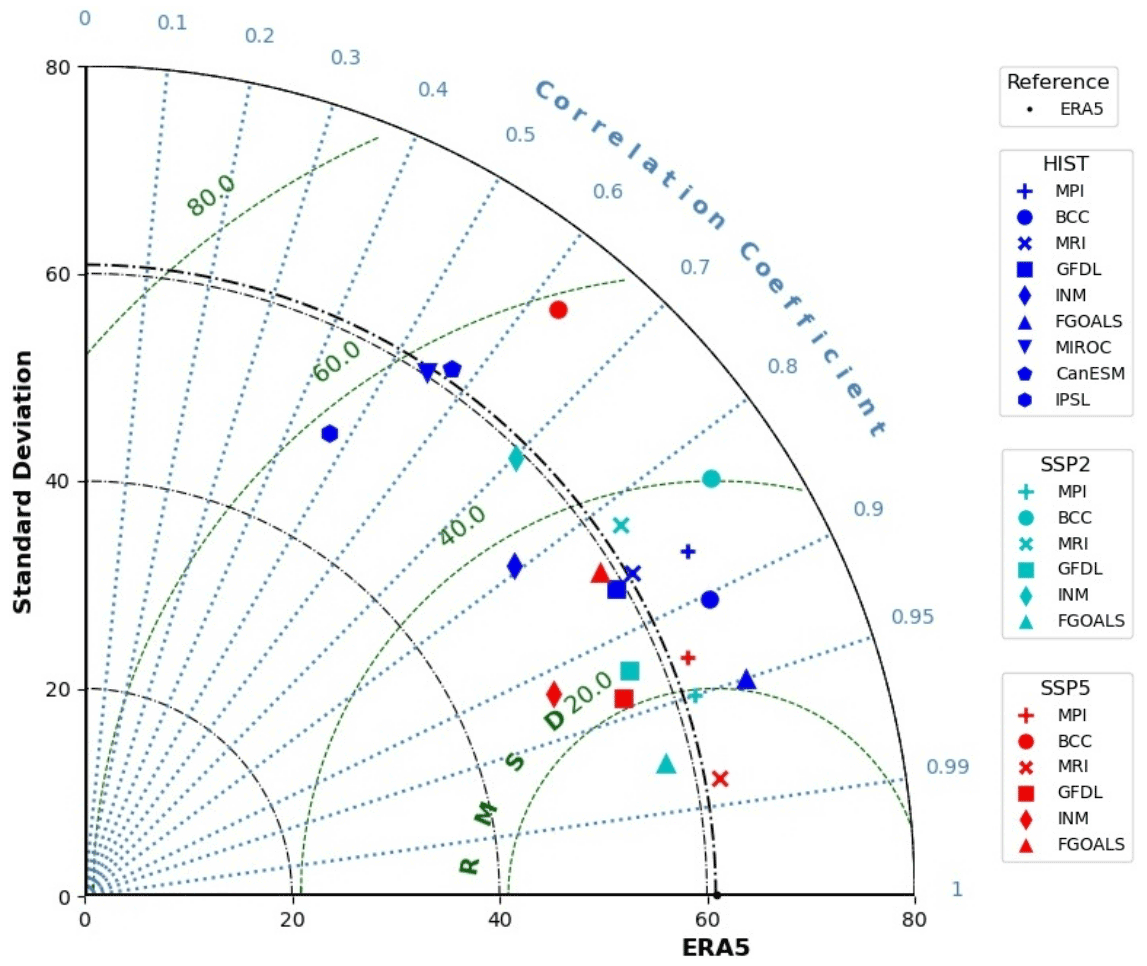
Figure 1Taylor diagram for the mean composites over all blocking events for ERA5 and all GCMs for the winter HIST period (1980–2009). The diagram allows us to quantify standard deviation (black), correlation coefficient (light blue), and root-mean-square difference (green) between the mean GCM composites and the mean ERA5 composite. SSP2 and SSP5 results are obtained with ΔZ500SSP2 and ΔZ500SSP5, respectively.
This analysis points out that MIROC, CanESM, and IPSL are less accurate in capturing the blocking pattern in recent-past climate (as also observable in Fig. 2e, f, g), and we expect these models to be less reliable in future projections of blocking. Previous studies (e.g. Chhin and Yoden, 2018; Mokhov and Timazhev, 2019; Khan et al., 2020) suggest to use a subset of GCMs selected according to their ability in simulating the quantity of interest (atmospheric blocking in this study) in the past in order to reduce the uncertainties associated with the future projections of that quantity. Therefore, we exclude MIROC, CanESM, and IPSL from the next analysis and focus on the results obtained by the other six GCMs: MPI, BCC, MRI, GFDL, INM, and FGOALS. In the same Taylor diagram, blocking projected in future climates (both SPP2-4.5 and SSP5-8.5) by these six GCMs is also shown. Overall, correlation coefficients, standard deviations, and RMSDs vary in a non-systematic way, so we do not find any regularity in the reproducibility of future blocking by the GCMs.
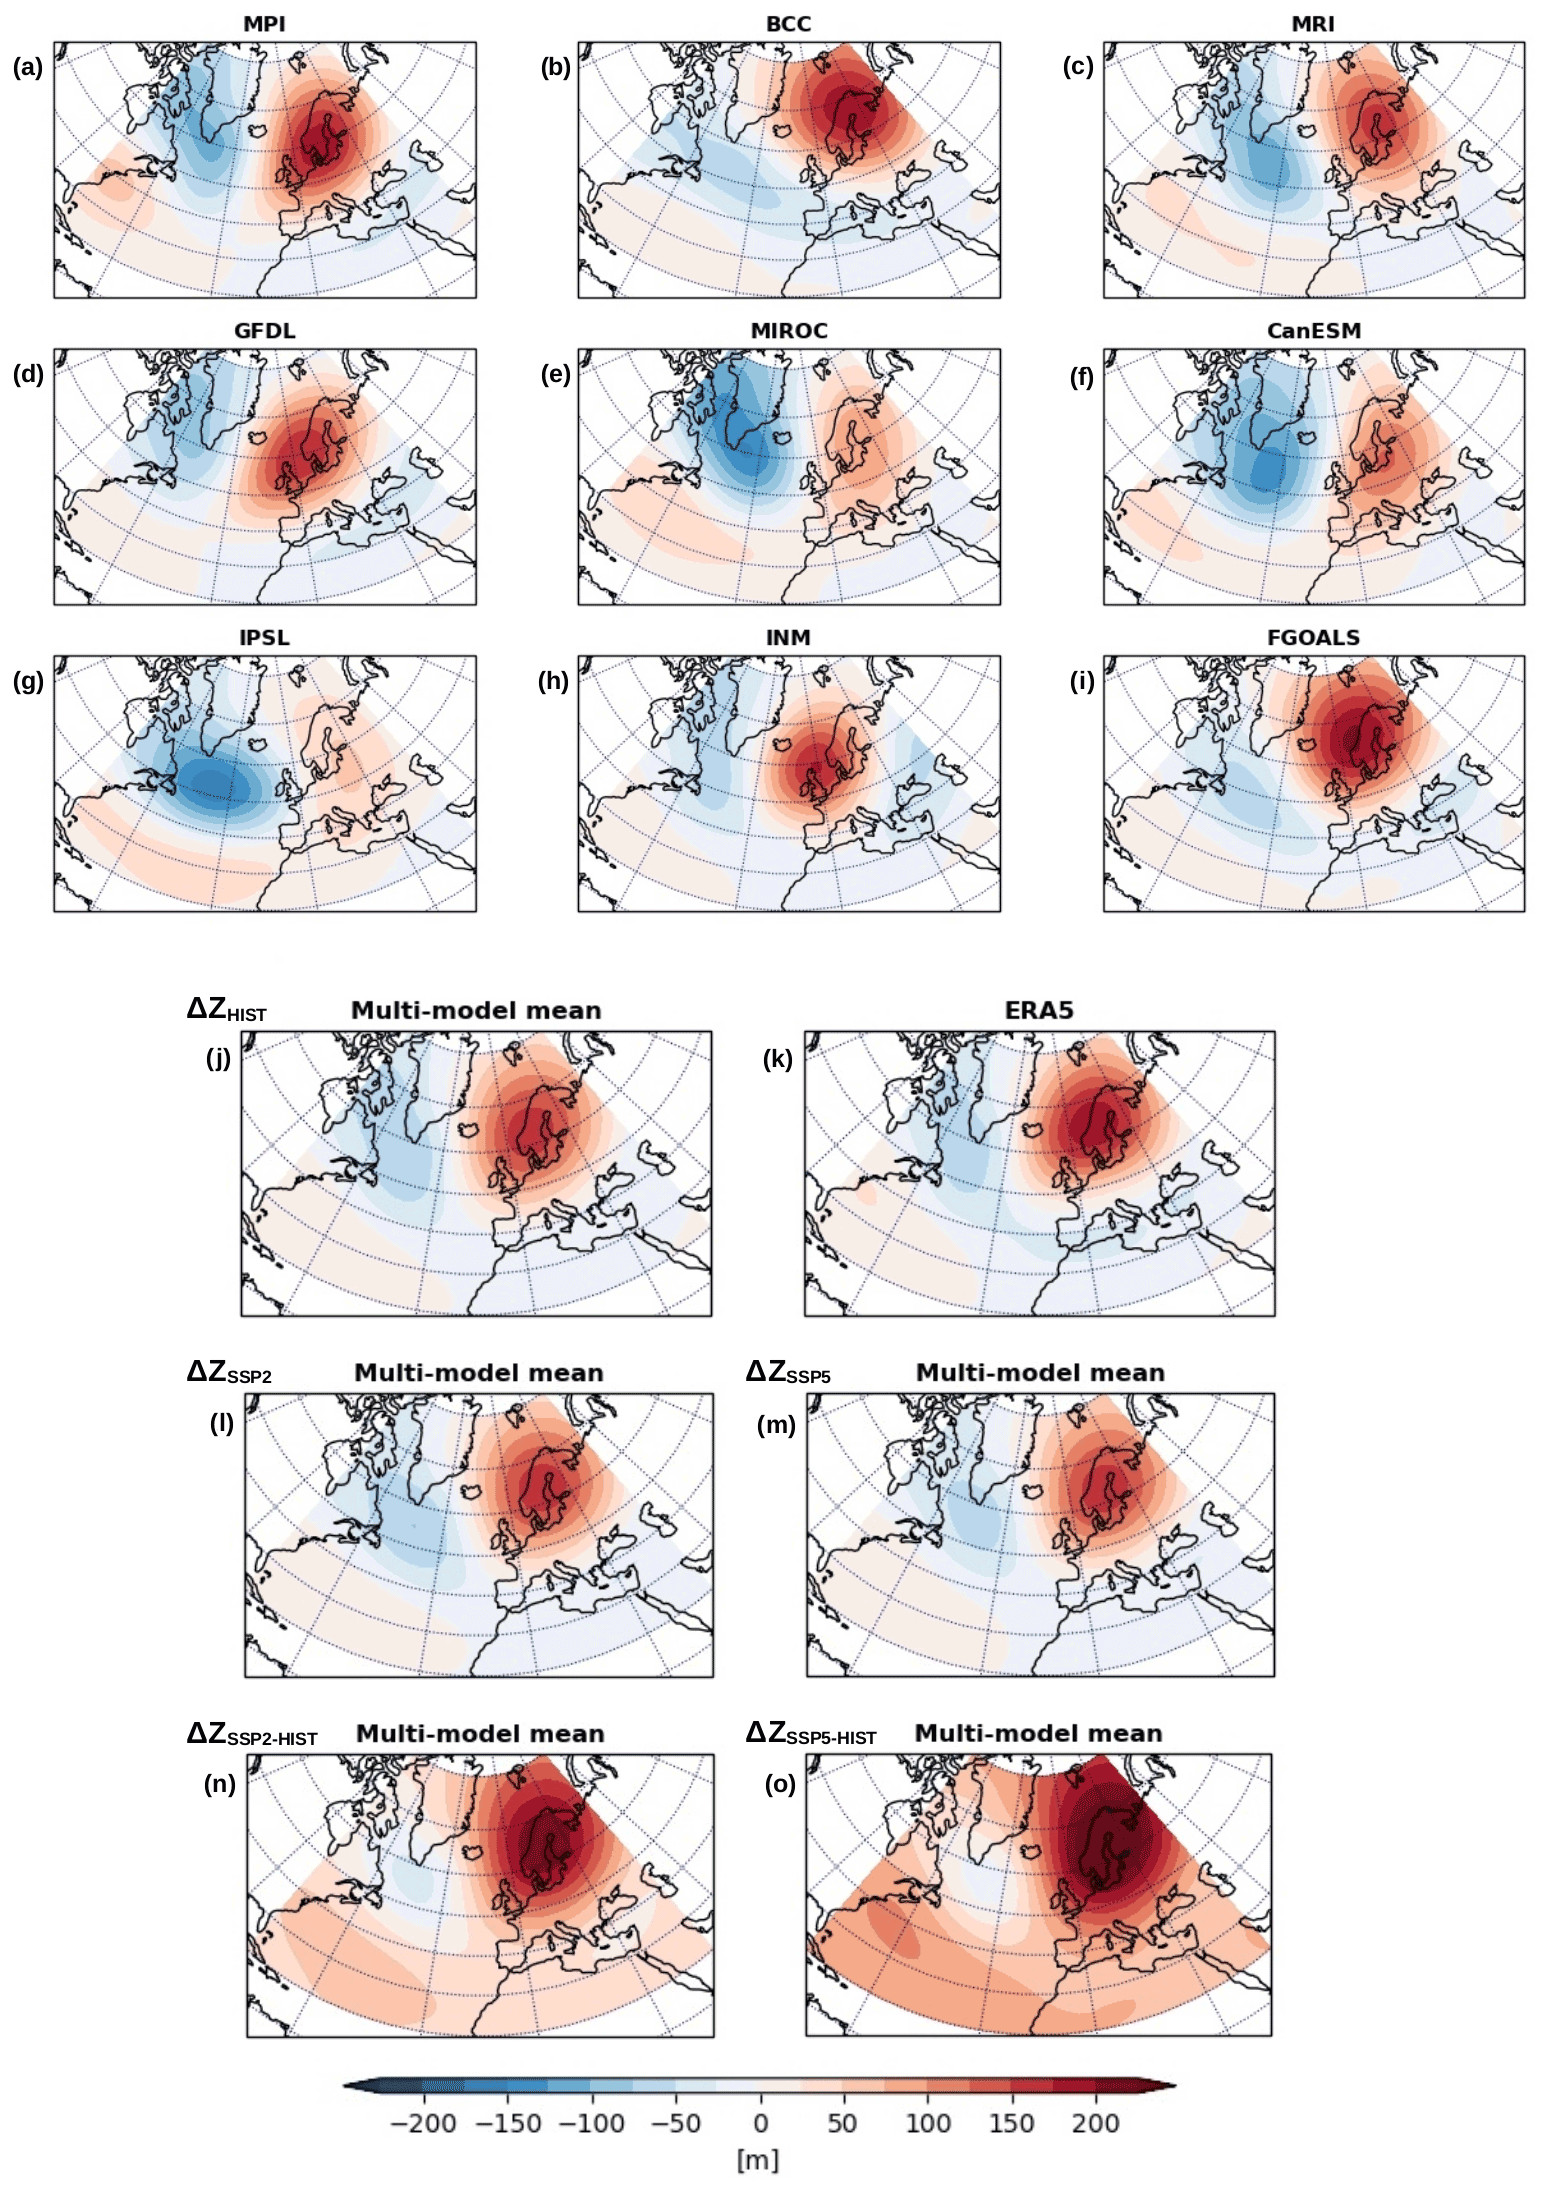
Figure 2Blocking composites averaged over all blocking events for each GCM (a–i) and ERA5 (k) during the winter HIST period (1980–2009). The multi-model means are computed over all blocking events of the six selected GCMs for the HIST period (1980–2009) using ΔZ500HIST (j) and for the future period (2070–2099) using ΔZ500SSP2 (l), ΔZ500SSP5 (m), ΔZ500SSP2−HIST (n), and ΔZ500SSP5−HIST (o).
The spatial patterns of blocking during recent-past climate are shown in Fig. 2a–i. All GCMs are considered during HIST, and the dissimilarity of CanESM, MIROC, and IPSL with respect to ERA5 (Fig. 2k) is evident. According to the reanalysis, the European blocking is centred over the Scandinavian peninsula and extends over northern Europe. Blocking occurrence is about 27 % (Table S1 in the Supplement) in accordance with previous studies that considered, for example, NCEP/NCAR (National Centers for Environmental Prediction and National Center for Atmospheric Research) reanalysis (27 %; Cassou, 2008) and ERA-interim reanalysis (26 %; Ullmann et al., 2014). MPI, BCC, and MRI reproduce an occurrence similar to ERA5, while GFDL, INM, and FGOALS simulate less-frequent blocking with an occurrence of about 23 %. We observe that the first three models have the highest resolution (see Table 1), so we also find that the underestimation of atmospheric blocking occurrence is reduced in higher-resolution GCMs. We compute the multi-model (MM) mean as the average of the composites over all blocking events of the six selected GCMs. The spatial pattern of the MM mean during HIST (Fig. 2j) is very close to the ERA5 blocking, as also demonstrated by the statistics: R≅0.98, RMSD≅13 m, and σMM≅56 m. In future climate (Fig. 2l–m), the spatial characteristics of the blocking composites are very similar to the ones of the HIST period (these results will be confirmed in Sect. 4.3 and 4.4). Considering the ΔZ500SSP2−HIST and ΔZ500SSP5−HIST results (Fig. 2n–o), blocking events get wider in SSP2 and especially in SSP5, and their centres are characterized by higher values. (The blocking composites computed for each GCM in the future are in Figs. S2 and S3.) Thus, we find that atmospheric blocking presents a dynamical component whose pattern is relatively stationary over the 21st century and a thermodynamical component that, as expected, is broadly driven by the overall warming of air masses in relation to the anthropogenic signal.
4.2 Frequency and duration of blocking events
Blocking events are identified for each GCM following the definition in Sect. 3.3. The number of blocking days and blocking events per winter averaged over all winters of the 30 yr periods and the duration of blocking events averaged over these periods are graphically represented in Fig. 3 to facilitate the comparison of the HIST results against the future (SSP2 and SSP5) results. We find that, during recent-past conditions, the MM mean number of blocking days per winter is about 30 and the MM mean number of events per winter is about 3. Our results are slightly lower than the findings of Mokhov et al. (2014), 35.8 d and 4.7 events, who detected blocking events in an Euro-Atlantic sector using a Z500-based blocking index applied to one GCM (IPSL). The MM mean of blocking duration is 9.9±0.9 d and is close to the mean duration of blocking events of 10.2±5.3 d obtained with the reanalysis. These results are in agreement with mean blocking durations found in the literature, e.g. 10.5 d for winter blocking in the Euro-Atlantic sector by Lupo et al. (2019) using reanalysis (NCEP/NCAR) of Z500 and 7.6 d by Mokhov et al. (2014). In summary, the mean temporal characteristics of blocking events during HIST are well reproduced by the GCMs: the MM means of number of blocking days and duration are close to the results obtained with the reanalysis, although most of the models tend to underestimate these quantities. When analysing the impact of climate change, no significant impact is found on blocking frequency and duration. With respect to the HIST results, MPI, BCC, and MRI simulate less-frequent blocking events in both future scenarios, while the other GCMs present a higher blocking frequency (Fig. 3). However, the uncertainty of the results is large (Table S2), so the differences between the periods are not statistically significant. Additionally, results for SSP2-4.5 and SSP5-8.5 are not in agreement among the various models (sometimes estimates are higher in SSP2 and sometimes in SSP5).
The analysis of the occurrence of blocking events as a function of duration also indicates that the GCM projections agree well with the reanalysis (Figs. 4 and S4). The occurrence of blocking events decreases exponentially with duration, consistent with the findings of Wiedenmann et al. (2002), Barriopedro et al. (2006), Matsueda et al. (2009), Dunn-Sigouin and Son (2013), and Mokhov et al. (2014). The distributions of all periods show long tails up to 30 d, but some isolated events can be even longer. In future climate, we find that the occurrence of short (5–8 d) blocking events slightly increases under the SSP5-8.5 scenario, while the occurrence of long (more than 10 d) events tends to decrease, as indicated by the mean lifetime (τ) of the exponential fit, which is lower for SSP5 (τ≈9 d) than for SSP2 and HIST (τ≈10 d).

Figure 3Number of blocking days (a) and blocking events (b) averaged over all winters of the 30 yr periods, as well as mean duration (in days) of blocking events occurring in 30 winters (c) for recent-past climate and future scenarios (SSP2-4.5 and SSP5-8.5) considering ΔZ500HIST (x axis) and ΔZ500SSP2 and ΔZ500SSP5 (y axis). The dashed black line is the ERA5 mean. (The values are taken from Table S2.)

Figure 4Occurrence of blocking events as a function of blocking duration for ERA5 and MM means during HIST, SSP2, and SSP5, considering ΔZ500HIST, ΔZ500SSP2, and ΔZ500SSP5. Exponential fits are drawn for ERA5 and MM means.
4.3 Centres of blocking events
We now analyse the blocking centres (as defined in Sect. 3.4) of the composites of blocking events in terms of their location and intensity, i.e. the value of ΔZ500 at that location. The geographical distribution of the centre locations averaged over all blocking events of a given 30 yr period is shown in Fig. 5a–b. The ERA5 centre is located over Sweden. The GCM centres during HIST are over and close to the Scandinavian peninsula. In the future, we observe a general eastward shift of the centre locations. In particular, four out of six models during SSP2 and SSP5 show blocking centres that are eastward with respect to the centres in HIST. The SSP2 and SSP5 MM means of the centre locations are located about 4 and 5∘ eastward to the HIST MM mean, respectively. An eastward shift of European blocking would lead to an increase in blocking over western Russia (Dunn-Sigouin and Son, 2013). More uncertain is the meridional shift of the centres in the future. An eastward and northeastward shift of European blocking was also found by Masato et al. (2013, 2014) and Sillmann and Croci-Maspoli (2009), respectively. However, it must be stressed that there is a large variability associated with the blocking centre locations in both meridional and zonal directions (as attested by the error bars in Fig. 5), and the shift of the centres is not significant.
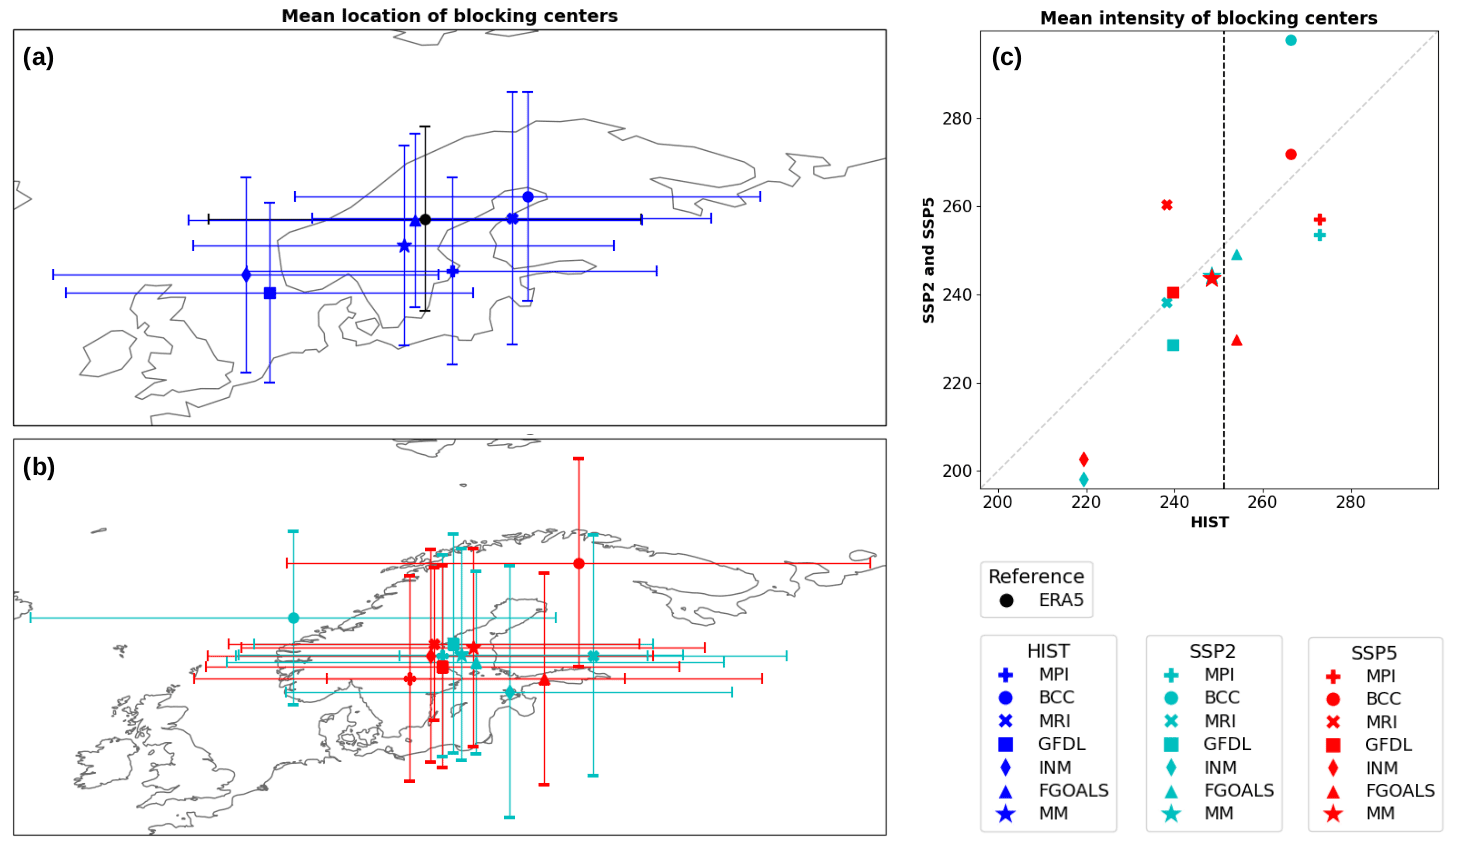
Figure 5(a–b) Locations of the blocking composite centres averaged over all blocking events for ERA5 and the GCMs during HIST considering ΔZ500HIST (a) and during SSP2 and SSP5 considering ΔZ500SSP2 and ΔZ500SSP5 (b). The error bars indicate the standard deviations of latitudinal and longitudinal coordinates of the blocking centres. (c) Intensities (in m) of the blocking composite centres averaged over all blocking events during HIST, SSP2, and SSP5 considering ΔZ500HIST on the x axis and ΔZ500SSP2 and ΔZ500SSP5 on the y axis. The dashed black line is the ERA5 mean. (The values are taken from Table S3.)
The MM mean of the blocking centre intensities during HIST is 248±18 m, very close to the ERA5-intensity, 251±48 m (Table S3). The minimum intensity is simulated by INM, 219±50 m, and the maximum one by MPI, 273±61 m. Under the SSP2-4.5 and SSP5-8.5 scenarios, the centre intensities are very similar, on average, to the intensities of the blocking events in recent-past conditions (Fig. 5c). Also the variability of the centres, in terms of standard deviations and minimum–maximum intervals of the intensities (Table S3), do not change, implying that the future blocking intensities will not be affected by atmospheric dynamical changes. Additionally, we observe that differences between SSP2 and SSP5 periods are smaller than inter-model differences.
4.4 Size of blocking events
4.4.1 WTD method
Blocking area is computed for each composite of blocking event by using the WTD method described in Sect. 3.4. This method takes into account events whose centre is between 30∘ W and 50∘ E to focus on European blocking, although some events can extend westwards in the Euro-Atlantic sector. This is due to the fact that the events are identified via a partitioning algorithm (k-means) and not via blocking indexes designed for geopotential fields that are typical during atmospheric blocking. We could verify that, on average, only four events per GCM (i.e. ∼4 %) are of this type during HIST; we preferred not to disregard them in order not to introduce any subjectivity into the analysis, and the results are considered as an overestimation of the blocking size.
The MM mean size in HIST is 9.1×10⁶ km2, very close to the value obtained for ERA5 (Table S4). As expected from Fig. 2j–m, the future blocking size is comparable to the recent-past blocking size. Actually, the MM mean size decreases by 0.3×10⁶ km2 (i.e. about 3 %) during SSP2 and SSP5, although not in a statistically significant way. We also analyse the blocking size results in relation to the centre intensity. We find a linear relation between size of blocking events and intensity of blocking centres (Fig. 6a). The correlation is significant and higher than 0.7 during HIST and SSP2. The linear relation is in agreement with Barriopedro et al. (2010). Again, our results are in line with previous studies that followed a different approach for the blocking detection, based on the use of blocking indexes instead of the WTD. Moreover, Figs. 6b and S5 show that blocking size is characterized by a normal distribution (e.g. Whiteman, 1982; Barriopedro et al., 2006). This is valid in all periods. In particular, the MM means of blocking area during SSP2 and SSP5 are very similar and close to the MM mean of the past blocking area.

Figure 6(a) Mean area versus mean centre intensity of blocking events computed for ERA5 and the GCMs during HIST, SSP2, and SSP5. (b) Occurrence of blocking events as a function of blocking area for ERA5 and the GCMs during HIST, SSP2, and SSP5. Gaussian fits are drawn for ERA5 and MM means. Both plots show the results for ΔZ500HIST, ΔZ500SSP2, and ΔZ500SSP5.
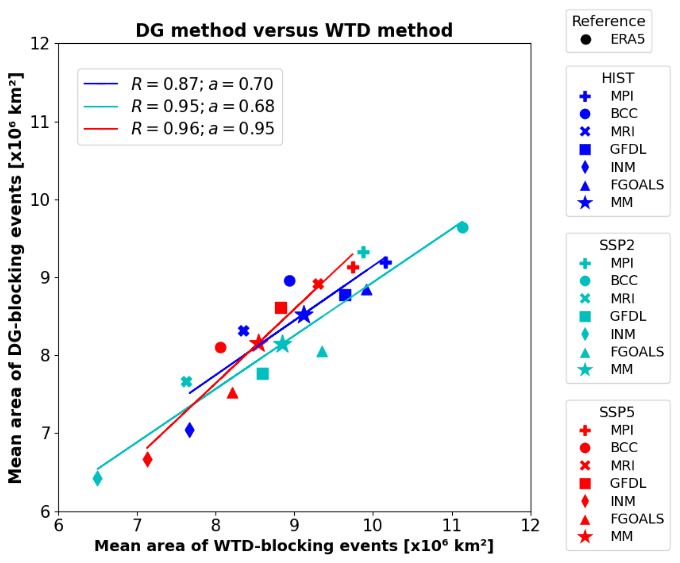
Figure 7Mean area of blocking events computed with the DG method versus mean area of blocking events computed with the WTD method considering ΔZ500HIST, ΔZ500SSP2, and ΔZ500SSP5. R is the correlation; a is the slope of the linear regression; regression lines (found by the least-squares fit) are drawn when the correlation is statistically significant (at the 90 % confidence level).
4.4.2 Comparison with the DG method
In order to check the reliability of the WTD method in estimating the area of blocking events, we compute that area by another approach relying on the DG index to identify blocking events, as done by Nabizadeh et al. (2019). As indicated in Sect. 3.4, the latter events will be denoted DG-blocking events; for clarity, in this section, the blocking events identified by the WTD will be denoted WTD-blocking events. We apply the DG method to compute the area of those DG-blocking days that belong to the WTD-blocking events (see Sect. 3.4). Despite the fact that the number of these DG-blocking days may not match with the duration of the respective WTD-blocking events, we find that the two quantities generally agree (Fig. S6).
The blocking areas resulting from the WTD method and the DG method are compared in Fig. 7. These areas are linearly correlated with statistical significance in all periods, the slopes of the linear regression being around 0.70 or larger (in SSP5). Therefore, the size of the blocking events identified via the WTD is in agreement with the size of the blocking events identified via the DG index.
We identify wintertime European blocking events by applying the weather type decomposition methodology on the Euro-Atlantic sector. Our aim is to quantify the impact of climate change on the frequency, duration, and size of blocking events. For this purpose, we consider 30 yr of historical runs and two future scenarios (SSP2-4.5 and SSP5-8.5) of nine CMIP6 GCMs. We show that the GCMs considered in this study capture well the spatio-temporal characteristics of atmospheric blocking in the recent-past climate; nevertheless, only those representing blocking patterns and variability closer to the reanalysis are used to investigate future blocking changes.
We find that the impact of climate change on blocking frequency and duration is not statistically significant. This is in line with the recent study of Huguenin et al. (2020), who found that changes in frequency and duration of weather types over central Europe in a warming climate are small and within the internal climate variability. By contrast, Fabiano et al. (2020), by applying the WTD as well, and Davini and D'Andrea (2020), by using blocking indexes, showed that frequency and duration of blocking events decrease significantly with climate change. It must be mentioned that the methodology in Fabiano et al. (2020) is a bit different in terms of, for example, the data to be processed (the geopotential height anomalies are detrended, and the seasonal cycle removal is different than here) and the number of retained eigenvectors (only 4 against 24 here). Overall, a clear long-term change in blocking frequency in the past has not emerged so far (Barnes et al., 2014; Woollings et al., 2018), and Woollings et al. (2018) highlighted the fact that there is no general consensus on the tendency of blocking frequency in future climate. In fact, Dunn-Sigouin and Son (2013) and Matsueda and Endo (2017) found a significant decrease in blocking frequency in the Euro-Atlantic sector involving all durations of blocking events simulated with a subset of CMIP5 GCMs, and Mokhov et al. (2014) found a general increase in the blocking frequency with four CMIP5 GCMs, while Masato et al. (2014) found that European blocking frequency remains unchanged using four CMIP5 GCMs as well. Clearly, further investigations are needed, focusing on the latest generation of models (i.e. CMIP6).
We introduce the WTD method to quantify the size of blocking composites. We find that blocking area and centre intensity are linearly correlated. Blocking patterns and size in the future are similar to the results obtained for the recent-past climate. This means that the spatial characteristics of blocking events will not change at the end of the century with respect to the future atmospheric mean state. We also apply another method, the DG method, to compute the blocking size, and we obtain similar results. Our findings are in agreement with Hassanzadeh et al. (2014), who found a smaller blocking area in a scenario in which the mid-latitude-to-pole surface temperature difference is reduced, as expected in a warming climate; this result is in contrast to Nabizadeh et al. (2019), who showed that blocking size is projected to increase with climate change using a two-layer quasi-geostrophic model (and derived a scaling law for the blocking-event size). As only a few studies investigated blocking size by applying different methodology and data sets (e.g idealized GCMs or GCMs from different CMIPs), more efforts should be devoted to this topic.
In general, we observe that the differences between SSP2 and SSP5 results are smaller than differences among the various GCM results, suggesting that there is no clear signal of climate change on blocking frequency, duration, and size. To the best of our knowledge, this is the first study investigating all these characteristics of blocking events that are identified via the WTD. Moreover, there are still few studies addressing this topic using GCMs of the CMIP6. Our results for past climate are in agreement with previous findings in which blocking events are defined with blocking indexes. This confirms that the application of the WTD is also a good strategy to analyse blocking event characteristics.
Before comparing blocking event areas with other studies, it must be remembered that the results depend on the defined threshold. Moreover, it must be pointed out that the four weather types imposed in the k-means algorithm allow us to recover the ones usually obtained with the reanalysis. However, a different number of weather types may need to be computed in some models where the variability is different from the reanalysis (e.g. five regimes are considered in the CNRM model by Ménégoz et al., 2018). The optimal number of clusters also depends on the data to be processed; for instance, by applying the clustering on the full field data, Falkena et al. (2020) found that k=6 is an optimal choice.
This study could be improved by analysing more GCMs, although other studies that considered many GCMs initially used only the best few GCMs for the analysis later; for example, Lee and Ahn (2017) selected 5 GCMs among 22 CMIP5 GCMs to study atmospheric blocking over the Pacific Ocean. Given the decadal variability in weather regimes (Dorrington and Strommen, 2020), longer past and future periods could be considered (e.g. periods of 50 yr, like in Fabiano et al., 2020) so as to better smooth the dependency of the results on this decadal variability. Moreover, those days for which the geopotential height anomaly field does not resemble the blocking weather regime pattern could be classified as “neutral days”, like in Dorrington et al. (2021), and excluded from the analysis. Finally, a sensitivity analysis of the results to the clear-cut character of the clusters could be conducted, for instance, by removing the influence of the jet speed from the geopotential height field, like in Dorrington and Strommen (2020).
The model data (both CMIP6 outputs and reanalysis) used in this study are archived at the Mésocentre ESPRI (Ensemble de services pour la recherche à l'IPSL, https://mesocentre.ipsl.fr/, last access: 13 May 2021).
The algorithm used to compute the blocking area in this study is available upon request.
The supplement related to this article is available online at: https://doi.org/10.5194/wcd-3-377-2022-supplement.
All authors contributed to designing the study. SB and FJ analysed the data, together with ELB, and produced the figures. SB, FJ, JB, HG, ELB , MM, and CS discussed the results. SB wrote the paper; all the authors provided assistance in finalizing the article.
The contact author has declared that neither they nor their co-authors have any competing interests.
Publisher’s note: Copernicus Publications remains neutral with regard to jurisdictional claims in published maps and institutional affiliations.
The authors thank Ebrahim Nabizadeh for the useful discussion. The authors acknowledge the World Climate Research Programme (WCRP), which coordinated and promoted CMIP6, the climate modelling groups for producing and making available their model output, and the Mésocentre ESPRI for the access to the data used in this study. Sara Bacer thanks the LEGI for the postdoctoral support; Enzo Le Bouëdec and Fatima Jomaa thank the IDEX programme MobilAir for the PhD and MSc support, respectively.
This paper was edited by Pedram Hassanzadeh and reviewed by two anonymous referees.
Barnes, E. A., Dunn-Sigouin, E., Masato, G., and Woollings, T.: Exploring recent trends in Northern Hemisphere blocking, Geophys. Res. Lett., 41, 638–644, https://doi.org/10.1002/2013GL058745, 2014. a, b
Barriopedro, D., García-Herrera, R., Lupo, A. R., and Hernández, E.: A Climatology of Northern Hemisphere Blocking, J. Climate, 19, 1042–1063, https://doi.org/10.1175/JCLI3678.1, 2006. a, b, c, d, e, f, g
Barriopedro, D., García-Herrera, R., and Trigo, R. M.: Application of blocking diagnosis methods to General Circulation Models. Part I: a novel detection scheme, Clim. Dynam., 35, 1373–1391, https://doi.org/10.1007/s00382-010-0767-5, 2010. a, b, c
Berckmans, J., Woollings, T., Demory, M.-E., Vidale, P.-L., and Roberts, M.: Atmospheric blocking in a high resolution climate model: influences of mean state, orography and eddy forcing, Atmos. Sci. Lett., 14, 34–40, https://doi.org/10.1002/asl2.412, 2013. a, b
Boé, J. and Terray, L.: A Weather-Type Approach to Analyzing Winter Precipitation in France: Twentieth-Century Trends and the Role of Anthropogenic Forcing, J. Climate, 21, 3118–3133, https://doi.org/10.1175/2007JCLI1796.1, 2008. a
Cassou, C.: Intraseasonal interaction between the Madden–Julian Oscillation and the North Atlantic Oscillation, Nature, 455, 523–527, https://doi.org/10.1038/nature07286, 2008. a, b, c, d
Cassou, C., Terray, L., Hurrell, J. W., and Deser, C.: North Atlantic Winter Climate Regimes: Spatial Asymmetry, Stationarity with Time, and Oceanic Forcing, J. Clim., 17, 1055–1068, https://doi.org/10.1175/1520-0442(2004)017<1055:NAWCRS>2.0.CO;2, 2004. a
Cassou, C., Terray, L., and Phillips, A.: Tropical Atlantic Influence on European Heat Waves, J. Clim., 18, 2805–2811, https://doi.org/10.1175/JCLI3506.1, 2005. a
Cheung, H., Zhou, W., Mok, H., Wu, M., and Shao, Y.: Revisiting the climatology of atmospheric blocking in the Northern Hemisphere, Adv. Atmos. Sci., 30, 397–410, https://doi.org/10.1007/s00376-012-2006-y, 2013. a, b
Chhin, R. and Yoden, S.: Ranking CMIP5 GCMs for Model Ensemble Selection on Regional Scale: Case Study of the Indochina Region, J. Geophys. Res.-Atmos., 123, 8949–8974, https://doi.org/10.1029/2017JD028026, 2018. a
Chung, C. and Nigam, S.: Weighting of geophysical data in Principal Component Analysis, J. Geophys. Res.-Atmos., 104, 16925–16928, https://doi.org/10.1029/1999JD900234, 1999. a
Cortesi, N., Torralba, V., Gonzáez-Reviriego, N., Soret, A., and J.Doblas-Reyes, F.: Characterization of European wind speed variability using weather regimes, Clim. Dynam., 53, 4961–4976, https://doi.org/10.1007/s00382-019-04839-5, 2019. a
Davini, D. and D'Andrea, F.: From CMIP3 to CMIP6: Northern Hemisphere Atmospheric Blocking Simulation in Present and Future Climate, J. Clim., 33, 10021–10038, https://doi.org/10.1175/JCLI-D-19-0862.1, 2020. a, b, c, d, e
Davini, P., Cagnazzo, C., and Anstey, J. A.: A blocking view of the stratosphere-troposphere coupling, J. Geophys. Res.-Atmos., 119, 11100–11115, https://doi.org/10.1002/2014JD021703, 2014. a
Davini, P., Corti, S., D'Andrea, F., Rivière, G., and von Hardenberg, J.: Improved Winter European Atmospheric Blocking Frequencies in High-Resolution Global Climate Simulations, J. Adv. Model. Earth Syst., 9, 2615–2634, https://doi.org/10.1002/2017MS001082, 2017. a
Dole, R. M. and Gordon, N. D.: Persistent Anomalies of the Extratropical Northern Hemisphere Wintertime Circulation: Geographical Distribution and Regional Persistence Characteristics, Mon. Weather Rev., 111, 1567–1586, https://doi.org/10.1175/1520-0493(1983)111<1567:PAOTEN>2.0.CO;2, 1983. a, b, c, d
Dorrington, J. and Strommen, K. J.: Jet Speed Variability Obscures Euro-Atlantic Regime Structure, Geophys. Res. Lett., 47, e2020GL087907, https://doi.org/10.1029/2020GL087907, 2020. a, b
Dorrington, J., Strommen, K., and Fabiano, F.: How well does CMIP6 capture the dynamics of Euro-Atlantic weather regimes, and why?, Weather Clim. Dynam. Discuss. [preprint], https://doi.org/10.5194/wcd-2021-71, in review, 2021. a
Drouard, M. and Woollings, T.: Contrasting Mechanisms of Summer Blocking Over Western Eurasia, Geophys. Res. Lett., 45, 12040–12048, https://doi.org/10.1029/2018GL079894, 2018. a
Dunn-Sigouin, E. and Son, S.-W.: Northern Hemisphere blocking frequency and duration in the CMIP5 models, J. Geophys. Res.-Atmos., 118, 1179–1188, https://doi.org/10.1002/jgrd.50143, 2013. a, b, c, d, e, f, g
Dunn-Sigouin, E., Son, S.-W., and Lin, H.: Evaluation of Northern Hemisphere Blocking Climatology in the Global Environment Multiscale Model, Mon. Weather Rev., 141, 707–727, https://doi.org/10.1175/MWR-D-12-00134.1, 2013. a
Eyring, V., Bony, S., Meehl, G. A., Senior, C. A., Stevens, B., Stouffer, R. J., and Taylor, K. E.: Overview of the Coupled Model Intercomparison Project Phase 6 (CMIP6) experimental design and organization, Geosci. Model Dev., 9, 1937–1958, https://doi.org/10.5194/gmd-9-1937-2016, 2016. a
Fabiano, F., Meccia, V. L., Davini, P., Ghinassi, P., and Corti, S.: A regime view of future atmospheric circulation changes in northern mid-latitudes, Weather Clim. Dynam., 2, 163–180, https://doi.org/10.5194/wcd-2-163-2021, 2021. a, b, c, d, e, f, g, h, i
Falkena, S. K., de Wiljes, J., Weisheimer, A., and Shepherd, T. G.: Revisiting the identification of wintertime atmospheric circulation regimes in the Euro-Atlantic sector, Q. J. Roy. Meteorol. Soc., 146, 2801–2814, https://doi.org/10.1002/qj.3818, 2020. a
Francis, J. A. and Vavrus, S. J.: Evidence linking Arctic amplification to extreme weather in mid-latitudes, Geophys. Res. Lett., 39, 6, https://doi.org/10.1029/2012GL051000, 2012. a
Hassanzadeh, P., Kuang, Z., and Farrell, B. F.: Responses of midlatitude blocks and wave amplitude to changes in the meridional temperature gradient in an idealized dry GCM, Geophys. Res. Lett., 41, 5223–5232, https://doi.org/10.1002/2014GL060764, 2014. a, b, c, d, e
Hausfather, Z. and Peters, G.: Emissions – the 'businessas usual' story is misleading, Nature, 577, 618–620, https://doi.org/10.1038/d41586-020-00177-3, 2020. a
Hersbach, H., Bell, B., Berrisford, P., Hirahara, S., Horányi, A., Muñoz Sabater, J., Nicolas, J., Peubey, C., Radu, R., Schepers, D., Simmons, A., Soci, C., Abdalla, S., Abellan, X., Balsamo, G., Bechtold, P., Biavati, G., Bidlot, J., Bonavita, M., De Chiara, G., Dahlgren, P., Dee, D., Diamantakis, M., Dragani, R., Flemming, J., Forbes, R., Fuentes, M., Geer, A., Haimberger, L., Healy, S., Hogan, R. J., Hólm, E., Janisková, M., Keeley, S., Laloyaux, P., Lopez, P., Lupu, C., Radnoti, G., de Rosnay, P., Rozum, I., Vamborg, F., Villaume, S., and Thépaut, J.-N.: The ERA5 global reanalysis, Q. J. Roy. Meteorol. Soc., 146, 1999–2049, https://doi.org/10.1002/qj.3803, 2020. a
Hertig, E. and Jacobeit, J.: Variability of weather regimes in the North Atlantic-European area: past and future, Atmos. Sci. Lett., 15, 314–320, https://doi.org/10.1002/asl2.505, 2014. a, b
Hou, P. and Wu, S.: Long-term Changes in Extreme Air Pollution Meteorology and the Implications for Air Quality, Sci. Rep., 6, 23792, https://doi.org/10.1038/srep23792, 2016. a
Huguenin, M. F., Fischer, E. M., Kotlarski, S., Scherrer, S. C., Schwierz, C., and Knutti, R.: Lack of Change in the Projected Frequency and Persistence of Atmospheric Circulation Types Over Central Europe, Geophys. Res. Lett., 47, 9, https://doi.org/10.1029/2019GL086132, 2020. a, b, c
Jiménez, P. A., González-Rouco, J., Montávez, J., García-Bustamante, E., and Navarro, J.: Climatology of wind patterns in the northeast of the Iberian Peninsula, Int. J. Climatol., 29, 501–525, https://doi.org/10.1002/joc.1705, 2009. a
Kautz, L.-A., Martius, O., Pfahl, S., Pinto, J. G., Ramos, A. M., Sousa, P. M., and Woollings, T.: Atmospheric Blocking and Weather Extremes over the Euro-Atlantic Sector – A Review, Weather Clim. Dynam. Discuss. [preprint], https://doi.org/10.5194/wcd-2021-56, in review, 2021. a
Khan, N., Shahid, S., Ahmed, K., Wang, X., Ali, R., Ismail, T., and Nawaz, N.: Selection of GCMs for the projection of spatial distribution of heat waves in Pakistan, Atmos. Res., 233, 104688, https://doi.org/10.1016/j.atmosres.2019.104688, 2020. a
Largeron, Y. and Staquet, C.: Persistent inversion dynamics and wintertime PM10 air pollution in Alpine valleys, Atmos. Environ., 135, 92–108, https://doi.org/10.1016/j.atmosenv.2016.03.045, 2016. a
Lee, D. Y. and Ahn, J.-B.: Future change in the frequency and intensity of wintertime North Pacific blocking in CMIP5 models, Int. J. Climatol., 37, 2765–2781, https://doi.org/10.1002/joc.4878, 2017. a
Lupo, A., Jensen, A., Mokhov, I., Timazhev, A., Eichler, T., and Efe, B.: Changes in Global Blocking Character in Recent Decades, Atmosphere, 10, 92, https://doi.org/10.3390/atmos10020092, 2019. a, b, c
Masato, G., Hoskins, B. J., and Woollings, T.: Winter and Summer Northern Hemisphere Blocking in CMIP5 Models, J. Clim., 26, 7044–7059, https://doi.org/10.1175/JCLI-D-12-00466.1, 2013. a, b
Masato, G., Woollings, T., and Hoskins, B. J.: Structure and impact of atmospheric blocking over the Euro-Atlantic region in present-day and future simulations, Geophys. Res. Lett., 41, 1051–1058, https://doi.org/10.1002/2013GL058570, 2014. a, b, c
Matsueda, M. and Endo, H.: The robustness of future changes in Northern Hemisphere blocking: A large ensemble projection with multiple sea surface temperature patterns, Geophys. Res. Lett., 44, 5158–5166, https://doi.org/10.1002/2017GL073336, 2017. a, b, c, d
Matsueda, M., Mizuta, R., and Kusunoki, S.: Future change in wintertime atmospheric blocking simulated using a 20-km-mesh atmospheric global circulation model, J. Geophys. Res.-Atmos., 114, D12114, https://doi.org/10.1029/2009JD011919, 2009. a, b, c
Ménégoz, M., Cassou, C., Swingedouw, D., Ruprich-Robert, Y., Bretonniére, P.-A., and Doblas-Reyes, D.: Role of the Atlantic Multidecadal Variability in modulating the climate response to a Pinatubo-like volcanic eruption, Clim. Dynam., 51, 1863–1883, https://doi.org/10.1007/s00382-017-3986-1, 2018. a
Michelangeli, P.-A., Vautard, R., and Legras, B.: Weather Regimes: Recurrence and Quasi Stationarity, J. Atmos. Sci., 52, 1237–1256, https://doi.org/10.1175/1520-0469(1995)052<1237:WRRAQS>2.0.CO;2, 1995. a, b, c
Mokhov, I. and Timazhev, A.: Atmospheric Blocking and Changes in its Frequency in the 21st Century Simulated with the Ensemble of Climate Models, Russ. Meteorol. Hydrol, 44, 369–377, https://doi.org/10.3103/S1068373919060013, 2019. a
Mokhov, I., Akperov, M., Prokofyeva, M., Timazhev, A., Lupo, A., and Le Treut, H.: Blockings in the Northern Hemisphere and EuroAtlantic Region:Estimates of Changes from Reanalysis Data and Model Simulations, Dokl. Earth Sci., 449, 430–433, https://doi.org/10.1134/S1028334X13040144, 2013. a, b
Mokhov, I. I., Timazhev, A. V., and Lupo, A. R.: Changes in atmospheric blocking characteristics within Euro-Atlantic region and Northern Hemisphere as a whole in the 21st century from model simulations using RCP anthropogenic scenarios, Global Planet. Change, 122, 265–270, https://doi.org/10.1016/j.gloplacha.2014.09.004, 2014. a, b, c, d
Munoz, C., Schultz, D., and Vaughan, G.: A Midlatitude Climatology and Interannual Variability of 200- and 500-hPa Cut-Off Lows, J. Clim., 33, 2201–2222, https://doi.org/10.1175/JCLI-D-19-0497.1, 2020. a
Nabizadeh, E., Hassanzadeh, P., Yang, D., and Barnes, E. A.: Size of the Atmospheric Blocking Events: Scaling Law and Response to Climate Change, Geophys. Res. Lett., 46, 13488–13499, https://doi.org/10.1029/2019GL084863, 2019. a, b, c, d, e, f
Philipp, A., Beck, C., Huth, R., and Jacobeit, J.: Development and comparison of circulation type classifications using the COST 733 dataset and software, Int. J. Climatol., 36, 2673–2691, https://doi.org/10.1002/joc.3920, 2016. a
Pinheiro, M., Ullrich, P., and Grotjahn, R.: Atmospheric blocking and intercomparison of objective detection methods: flow field characteristics, Clim. Dynam., 53, 4189–4216, https://doi.org/10.1007/s00382-019-04782-5, 2019. a
Riahi, K., van Vuuren, D. P., Kriegler, E., Edmonds, J., O'Neill, B. C., Fujimori, S., Bauer, N., Calvin, K., Dellink, R., Fricko, O., Lutz, W., Popp, A., Cuaresma, J. C., KC, S., Leimbach, M., Jiang, L., Kram, T., Rao, S., Emmerling, J., Ebi, K., Hasegawa, T., Havlik, P., Humpenöder, F., Da Silva, L. A., Smith, S., Stehfest, E., Bosetti, V., Eom, J., Gernaat, D., Masui, T., Rogelj, J., Strefler, J., Drouet, L., Krey, V., Luderer, G., Harmsen, M., Takahashi, K., Baumstark, L., Doelman, J. C., Kainuma, M., Klimont, Z., Marangoni, G., Lotze-Campen, H., Obersteiner, M., Tabeau, A., and Tavoni, M.: The Shared Socioeconomic Pathways and their energy, land use, and greenhouse gas emissions implications: An overview, Global Environ. Change, 42, 153–168, https://doi.org/10.1016/j.gloenvcha.2016.05.009, 2017. a
Russo, A., Trigo, R. M., Martins, H., and Mendes, M. T.: NO2, PM10 and O3 urban concentrations and its association with circulation weather types in Portugal, Atmos. Environ., 89, 768–785, https://doi.org/10.1016/j.atmosenv.2014.02.010, 2014. a
Sáenz, F. and Durán-Quesada, A.: A climatology of low level windregimes over Central America using aweather type classification approach, Front. Earth Sci., 3, 15, https://doi.org/10.3389/feart.2015.00015, 2015. a
Schiemann, R., Demory, M., Shaffrey, L. C., Strachan, J., Vidale, P. L., Mizielinski, M. S., Roberts, M. J., Matsueda, M., Wehner, M. F., and Jung, T.: The Resolution Sensitivity of Northern Hemisphere Blocking in Four 25-km Atmospheric Global Circulation Models, J. Clim., 30, 337–358, https://doi.org/10.1175/JCLI-D-16-0100.1, 2017. a
Sillmann, J. and Croci-Maspoli, M.: Present and future atmospheric blocking and its impact on European mean and extreme climate, Geophys. Res. Lett., 36, 10, https://doi.org/10.1029/2009GL038259, 2009. a, b, c
Tibaldi, S. and Molteni, F.: On the operational predictability of blocking, Tellus A, 42, 343–365, https://doi.org/10.1034/j.1600-0870.1990.t01-2-00003.x, 1990. a
Ullmann, A., Fontaine, B., and Roucou, P.: Euro-Atlantic weather regimes and Mediterranean rainfall patterns: present-day variability and expected changes under CMIP5 projections, Int. J. Climatol., 34, 2634–2650, https://doi.org/10.1002/joc.3864, 2014. a, b, c, d, e, f
Whiteman, C. D.: Breakup of Temperature Inversions in Deep Mountain Valleys: Part I. Observations, J. Appl. Meteorol., 21, 270–289, https://doi.org/10.1175/1520-0450(1982)021<0270:BOTIID>2.0.CO;2, 1982. a
Wiedenmann, J. M., Lupo, A. R., Mokhov, I. I., and Tikhonova, E. A.: The Climatology of Blocking Anticyclones for the Northern and Southern Hemispheres: Block Intensity as a Diagnostic, J. Clim., 15, 3459–3473, https://doi.org/10.1175/1520-0442(2002)015<3459:TCOBAF>2.0.CO;2, 2002. a, b
Woollings, T., Barriopedro, D., Methven, J., Son, S.-W., Martius, O., Harvey, B., Sillmann, J., Lupo, A. R., and Seneviratne, S.: Blocking and its Response to Climate Change, Curr. Clim. Change Rep., 4, 287–300, https://doi.org/10.1007/s40641-018-0108-z, 2018. a, b, c, d