the Creative Commons Attribution 4.0 License.
the Creative Commons Attribution 4.0 License.
 | 24 Jan 2023
Warm conveyor belts in present-day and future climate simulations – Part 1: Climatology and impacts
Michael Sprenger
Hanin Binder
Urs Beyerle
Heini Wernli
This study investigates how warm conveyor belts (WCBs) will change in a future climate. WCBs are strongly ascending airstreams in extratropical cyclones that are responsible for most of their precipitation. In conjunction with the cloud formation, latent heat is released, which has an impact on the potential vorticity distribution and therefore on the atmospheric circulation in the middle and upper troposphere. Because of these and other impacts of WCBs, it is of great importance to investigate changes in their frequencies, regions of occurrence, and physical characteristics in a warmer climate. To this aim, future climate simulations (Representative Concentration Pathway 8.5 – RCP8.5 – scenario; 2091–2100) are performed with the Community Earth System Model version 1 (CESM1) and compared to present-day climate (1991–1999). Trajectories are calculated based on 6-hourly 3D wind fields, and WCBs are identified as trajectories that ascend at least 600 hPa in 2 d. WCBs are represented reasonably well in terms of location and occurrence frequency compared to WCBs in the ERA-Interim reanalyses. In a future climate, WCB inflow regions in the North Pacific are systematically shifted northward in winter, which is in agreement with the northward shift of the storm track in this region. In the North Atlantic, increased frequencies are discernible in the southwest and there is a decrease to the south of Iceland. Finally, in the Southern Hemisphere, WCB frequencies increase in the South Atlantic in both seasons and to the east of South Africa and the Indian Ocean in June–July–August (JJA). These changes are partly consistent with corresponding changes in the occurrence frequencies of extratropical cyclones, i.e. the driving weather systems of WCBs. Changes are also found in the WCB characteristics, which have implications for WCB impacts in a future climate. The increase in inflow moisture in the different regions and seasons – ∼23 %–33 % (∼14 %–20 %) in winter (summer) – leads to (i) an increase in WCB-related precipitation – ∼13 %–23 % (∼7 %–28 %) in winter (summer) – especially in the upper percentiles and thus a possible increase in extreme precipitation related to WCBs, (ii) a strong increase in diabatic heating – ∼20 %–27 % (∼17 %–33 %) in winter (summer) – in the mid-troposphere, and (iii) a higher outflow level – ∼10 K (∼10–16 K) in winter (summer) – which favours WCBs more strongly interacting with the upper-level Rossby waveguide. In summary, by investigating a distinct weather system, the WCB, and how it changes in its occurrence frequency and characteristics in a future climate, this study provides new insights into the dynamics and impacts of climate change in the extratropical storm track regions.
- Article
(12101 KB) - Full-text XML
- Companion paper
-
Supplement
(4256 KB) - BibTeX
- EndNote


The two-way interaction between clouds and the large-scale atmospheric circulation constitutes one of the grand challenges in understanding the Earth’s climate system and its accurate representation in numerical models (Bony et al., 2015). The specifics of this challenge differ between climate regions, since they are characterized by different weather systems and predominant cloud structures. Whereas deep convective clouds associated with the Hadley–Walker circulation dominate in the tropics, shallow clouds prevail in the quasi-permanent subtropical anticyclones (Bony et al., 2015). The extratropical storm track regions, i.e. the regions with the frequent passage of extratropical cyclones and their attendant fronts (Schemm et al., 2018), typically reveal elongated cloud bands, so-called warm conveyor belts (WCBs) (Browning and Emanuel, 1990). Their formation is mainly related to the process of baroclinic instability, i.e. the interaction of near-tropopause Rossby waves with the low-level baroclinic zone (Hoskins et al., 1985). More specifically, the propagation and evolution of Rossby waves, i.e. of upper-level troughs and ridges, determine the regions of dynamically forced ascent (Davies, 2015) and thereby the formation of clouds and precipitation. However, the formation of clouds can also feed back into the circulation, via both radiative effects of clouds and the release of latent heat during condensation and freezing in clouds. Both radiation and latent heat release lead to diabatic changes in potential temperature and, except in the tropics, in potential vorticity, which in turn affect the atmospheric flow (Hoskins et al., 1985; Stoelinga, 1996). A detailed investigation of these linkages between clouds and the circulation, based on observations, reanalyses, and model simulations, is essential for improving the capability of climate models to realistically simulate the observed climate and to provide useful climate projections for a warmer future (Bony et al., 2015; Shaw et al., 2016). This study aims to contribute to this endeavour by analysing the occurrence of WCBs, i.e. of a particular cloud system in the extratropical storm track regions in present-day and future climate simulations.
In this paragraph, we introduce the concept of WCBs in more detail, and in particular emphasize their key role in the formation of clouds and precipitation in the extratropics, their associated radiative forcing, and their direct impact on the atmospheric circulation. In satellite imagery, WCBs correspond to stratiform cloud bands with a length of up to 3000 km, often intersected by embedded convection (Browning et al., 1973; Bader et al., 1995; Oertel et al., 2019). These cloud bands correspond to coherent airstreams, which most often move rapidly poleward while ascending from the boundary layer in the warm sector of an extratropical cyclone to the upper troposphere (Wernli and Davies, 1997). During this saturated ascent, temperatures decrease from typically +20 to below −50 ∘C, and consequently WCB-related clouds evolve from liquid clouds at the beginning of the ascent at lower latitudes to mixed-phase and eventually to ice clouds in the cold upper troposphere at higher latitudes (Joos and Wernli, 2012; Wernli et al., 2016). WCBs occur most frequently in winter (Madonna et al., 2014), when baroclinicity and the dynamical forcing for ascent are strongest. They contribute essentially to the precipitation climatology in the storm track regions and, in particular, to the formation of extreme precipitation events (Browning and Emanuel, 1990; Pfahl et al., 2014). Embedded convection in WCBs can lead to local maxima in precipitation intensity (Oertel et al., 2019). The net cloud radiative forcing of WCBs at the top of the atmosphere varies strongly along the ascent, from negative values in the equatorward part of the associated cloud band to larger, and in winter positive, values further poleward (Joos, 2019). Overall, WCBs contribute up to 10 W m−2 to the climatological winter maximum of net cloud radiative forcing in the central North Atlantic (Joos, 2019), indicating their important role also in the Earth’s radiative balance in the extratropics. Last but not least, WCBs can have a direct effect on atmospheric dynamics. The latent heating in WCBs can contribute to the intensification of the associated extratropical cyclone (Binder et al., 2016) and the downstream upper-level ridge (Grams et al., 2011; Madonna et al., 2014). The latter process implies that cloud bands formed by the poleward ascent of WCBs can significantly affect the amplitude and propagation of Rossby waves, which in turn determine the downstream flow evolution. As a consequence, a realistic representation of WCBs in models is essential for medium-range weather prediction (e.g. Grams et al., 2018; Rodwell et al., 2018) as well as for climate simulations.
This study investigates, for the first time, the representation of WCBs in simulations with one of the state-of-the-art climate models, the Community Earth System Model (CESM; see Sect. 2). More specifically, we address the following research questions:
-
Is CESM, in present-day simulations, able to reasonably capture geographical patterns and seasonal frequencies of WCBs, as compared to the climatologies in ERA-Interim?
-
How do these geographical distributions and frequencies change in a future climate, and how do these changes relate to corresponding signals in the WCB-driving extratropical cyclones?
-
How do the characteristics of WCBs, like inflow moisture, associated precipitation, total diabatic heating, and the isentropic outflow level, change in a warmer climate?
-
What are the implications of the changes in the geographical patterns and in the characteristics for the atmospheric circulation and precipitation?
A particularly challenging aspect is the identification of WCBs from large climate data sets. The established procedure to identify WCB airstreams is based on Lagrangian air parcel trajectories (e.g. Wernli and Davies, 1997; Madonna et al., 2014). To compute accurate trajectories, 6-hourly three-dimensional wind fields on all model levels are required, which are typically not available from climate model simulations. Therefore, this study is based on re-simulations of the CESM large ensemble (Kay et al., 2015) and the storage of the three-dimensional fields every 6 h.
The study is organized as follows: the technical details of the WCB and cyclone identification are explained in Sect. 2, and Sect. 3 presents WCB frequencies in present-day climate CESM simulations and a comparison with the WCB climatology based on ERA-Interim reanalyses (Madonna et al., 2014). Section 4 then reveals the effects of climate change on the frequency and location of WCBs, according to Representative Concentration Pathway 8.5 (RCP8.5) scenario simulations with CESM, and Sect. 5 discusses the potential impact of these WCB changes, e.g. on surface precipitation, mid-tropospheric diabatic heating, and upper-level disturbances. Finally, Sect. 6 summarizes the main results, provides some caveats of the study, and presents an outlook.
2.1 CESM simulations and ERA-Interim reanalysis
The present-day and future climate simulations are performed with the Community Earth System Model version 1 (CESM; Hurrell et al., 2013), based on restart files from the CESM large-ensemble project (CESM-LENS; Kay et al., 2015). Atmospheric fields are saved at 6-hourly temporal resolution, with a horizontal resolution of approximately 1∘ and 30 vertical levels. For both periods, 1990–1999 and 2091–2100, five 10-year members of the ensemble are used to identify WCBs, resulting in 50 years of CESM data for present-day climate (1990–1999; HIST) and 50 years for an end-of-century climate (2091–2100; RCP8.5). Specifically, the WCB identification is based on the following fields of the CESM simulations: horizontal wind components (u, v, in m s−1), vertical wind speed (ω, in Pa s−1), and surface pressure (in hPa). Additionally, mean sea level pressure (SLP, in hPa) is used to identify surface cyclones.
ERA-Interim reanalysis data (Dee et al., 2011), which are used for assessing the ability of CESM to simulate WCBs in HIST, have a horizontal resolution of approx. 80 km and 60 vertical levels, thus twice as many as CESM1. The reduced number of vertical levels in CESM might have an influence on the calculation of WCB trajectories. These differences in the vertical resolution have to be kept in mind when comparing WCBs in ERA-Interim and CESM.
2.2 WCB identification
Warm conveyor belts are identified in the CESM simulations in the same way as for ERA-Interim in Madonna et al. (2014). The ERA-Interim WCB climatology is publicly available (Sprenger et al., 2017). Basically, 48 h forward trajectories are started every 6 h in the 50-year present-day and future climate periods from a global grid with 80 km equidistantly spaced starting points. Vertically, the air parcels are released from 14 equidistant levels spanning the range from 1050 to 790 hPa. If starting positions on these isobaric surfaces fall below the topography, they are neglected. Typically, around 680 000 trajectories are started every 6 h. The kinematic trajectories are calculated with the Lagrangian analysis tool LAGRANTO (Wernli and Davies, 1997; Sprenger and Wernli, 2015), based on the 6-hourly CESM wind fields. If trajectories intersect the topography, which can occur because of numerical inaccuracies or unresolved wind components in the CESM simulations, the air parcels are lifted to 10 hPa above the topography, from where they are allowed to continue their path.
Based on this global set of 48 h forward trajectories, potential WCB trajectories are identified by applying a simple ascent criterion: the trajectories must ascend at least 600 hPa from their release in the lower troposphere until their arrival in the upper troposphere, 48 h later. All trajectories fulfilling this criterion are accepted as potential WCB trajectories; all the others – the huge majority – are neglected. A technical issue is related to the end-of-year transition of the trajectories. The CESM simulations come in blocks of 10-year continuous periods, but we treat all the years in the 50-year periods separately. Therefore, the trajectories are not allowed to cross the year's end, with the implication that four days around the end of the year are not covered in this WCB climatology.
Two further selection criteria are subsequently applied to the potential WCB trajectories. First, we make use of the conceptual view of the WCB as a coherent airstream attributed to an extratropical cyclone. To this aim, surface cyclones are identified in the SLP fields of the CESM simulations with the method by Wernli and Schwierz (2006) that was further refined in Sprenger et al. (2017). To be selected as a real WCB trajectory, a potential WCB trajectory must intersect at any time an identified cyclone mask, defined as the outermost closed isobar surrounding a local SLP minimum. To exclude trajectories that might be ascending in a tropical cyclone, we artificially set the cyclone masks to zero in a tropical band between 25∘ S and 25∘ N. The intersection of a WCB trajectory with a cyclone mask might occur at any time instance during the 48 h ascent period. In addition to being used as a WCB-selecting feature, the cyclone frequencies in CESM are – of course – by themselves of great interest and will also be discussed as a distinct meteorological feature in conjunction with the WCBs. Note that the attribution of potential WCB trajectories to cyclones relies on all cyclone masks, irrespective of the lifetime of the cyclone. In addition, we apply a cyclone tracking algorithm to follow the cyclones from genesis to maturity and finally lysis. Based on this cyclone tracking, we also apply a minimum lifetime criterion of 24 h to the cyclone tracks, and in the discussion of cyclone climatologies, we restrict the analysis to the set of these more relevant systems. The resulting trajectories all fulfil the required ascent criterion of a WCB and are tied to a (extratropical) cyclone. A second selection criterion guarantees that the trajectories started at consecutive, 6-hourly time instances are not counted multiple times. A detailed description of this double-count (or multiple-count) filter, illustrated by specific examples, can be found in Madonna et al. (2014). An example of the selected WCB trajectories is shown in Fig. 1a, where the trajectories are shown in black and the positions of WCB air parcels at times 0 h (start of ascent), 24 h (during ascent), and 48 h (end of ascent) are marked with coloured dots in order to show their ascent from typically about 950 to 300 hPa.
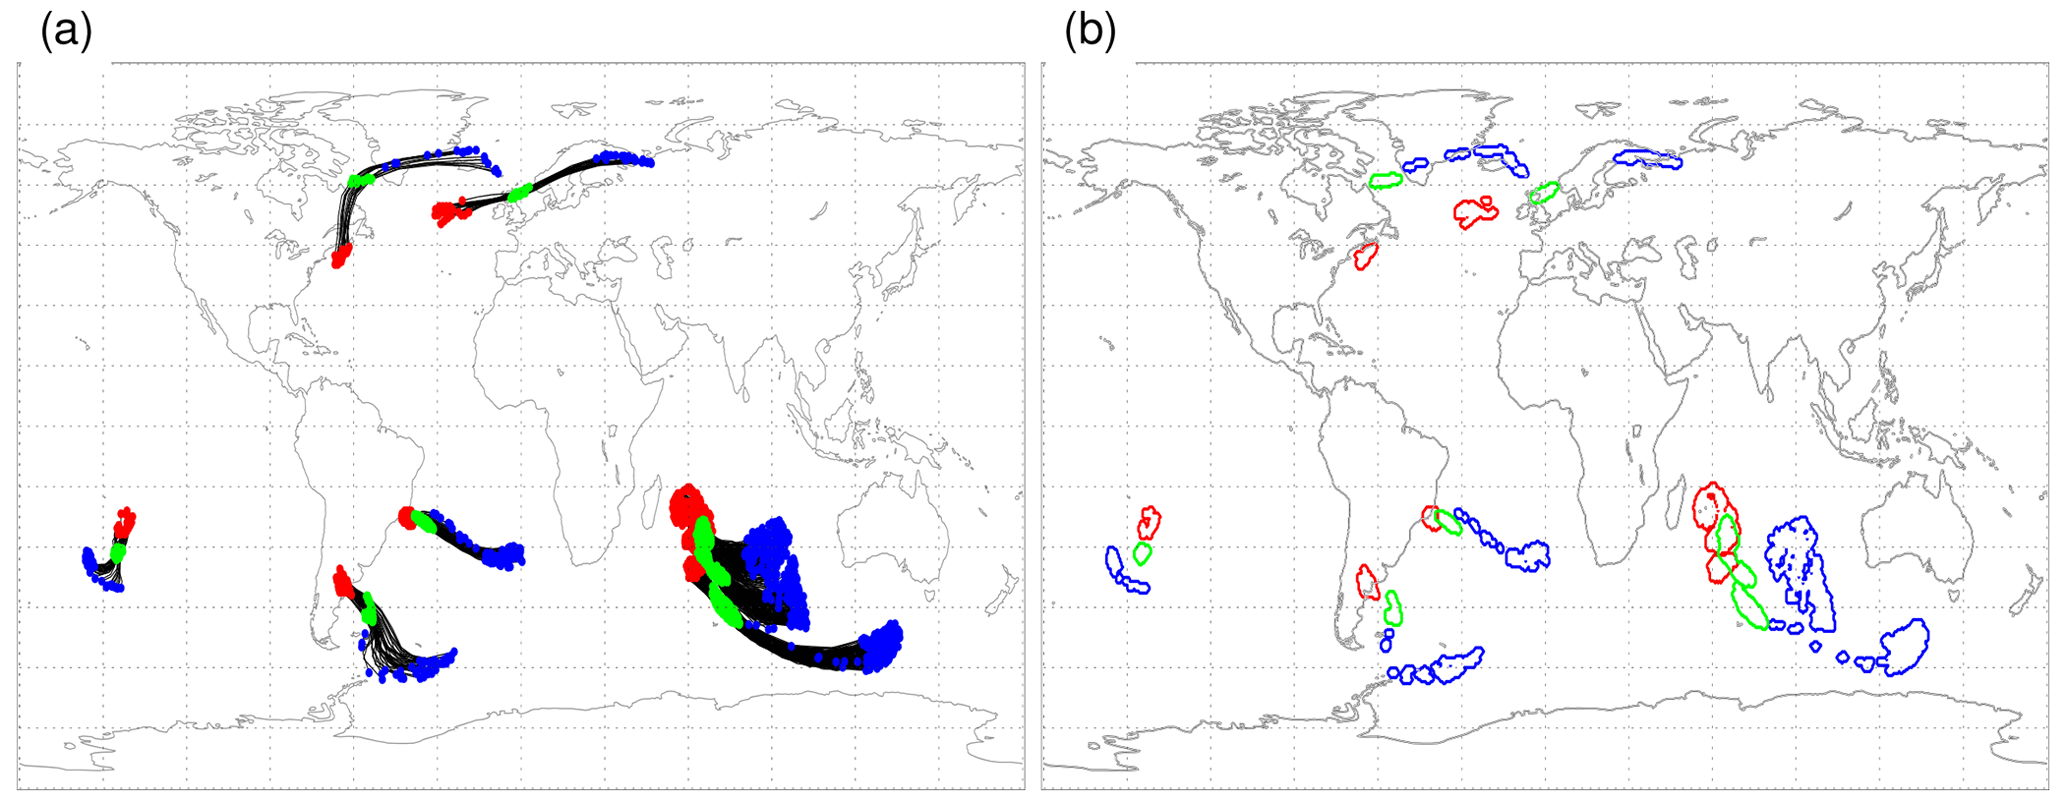
Figure 1Example of identified WCB trajectories started at 00:00 UTC on 15 December 1990 in an ensemble member of HIST. (a) The 48 h forward trajectories (black); the positions at times 0 h (start of ascent), 24 h (during ascent), and 48 h (end of ascent) are marked with red, green, and blue dots, respectively. (b) WCB masks, with a 100 km blown-up radius, at the same times and with the same colours as in (a). The three WCB masks at times 0, 24, and 48 h, averaged over the whole ERA-Interim and CESM periods and all ensemble members, build the basis for the climatologies in Sects. 3 and 4 (see text for details).
Finally, the Lagrangian WCB trajectories are gridded to a regular latitude–longitude grid with horizontal resolution. This is done for WCBs calculated based on both data sets, ERA-Interim and CESM, in order to make the gridded data sets comparable. These gridded 2D fields build the basis for the climatological analysis of WCBs in CESM and for the comparison with ERA-Interim. More specifically, at every 6-hourly time step it is determined if a grid point is near (<100 km) a WCB trajectory. We do that separately for all times of the WCB ascent, yielding maps for the location of WCB air parcels at the times t=0, 6, …, 48 h. Figure 1b shows the resulting WCB masks at times t=0, 24, and 48 h for the trajectories shown in Fig. 1a.
2.3 Test for statistical significance
Geographical maps of yearly and seasonal WCB and cyclone frequencies will be presented in this study, for ERA-Interim, HIST, and RCP8.5. If we assume that HIST realistically captures atmospheric dynamics and thus provides a set of WCB and cyclone frequency maps that represent the present climate, two questions arise. First, how do the 37 yearly and seasonal maps from ERA-Interim (1979–2016) compare to the 50 yearly and seasonal maps of HIST? Second, how do the 50-year HIST and RCP8.5 simulations, i.e. the corresponding WCB and cyclone frequency maps, compare to each other? These two questions ask for a careful statistical analysis to see if the differences between ERA-Interim and HIST and between HIST and RCP8.5, respectively, are statistically significant and thus point to systematic differences or reflect only the natural variability. However, given that we only have 2×50 years of climate simulations and 37 years of ERA-Interim data at hand and we therefore only have the same number of seasonal WCB and cyclone frequency maps for comparison, a robust statistical analysis remains elusive. Such an analysis would require about 10 times more data, which however is not feasible due to the computational constraints (in particular, the large computational cost of trajectory calculations). Therefore, the comparison between ERA-Interim and HIST and between HIST and RCP8.5 will remain at a rather qualitative level, still relying however on physical plausibility.
In contrast, when considering properties of individual WCB trajectories, a robust statistical analysis (e.g. of diabatic heating rates and precipitation) is perfectly feasible, since the 50 and 37 years for CESM and ERA-Interim, respectively, contain a large number (many thousands) of single WCB events. The adopted statistical approach to analyse potential differences in these characteristics between HIST and RCP8.5 will be introduced and discussed in Sect. 4.
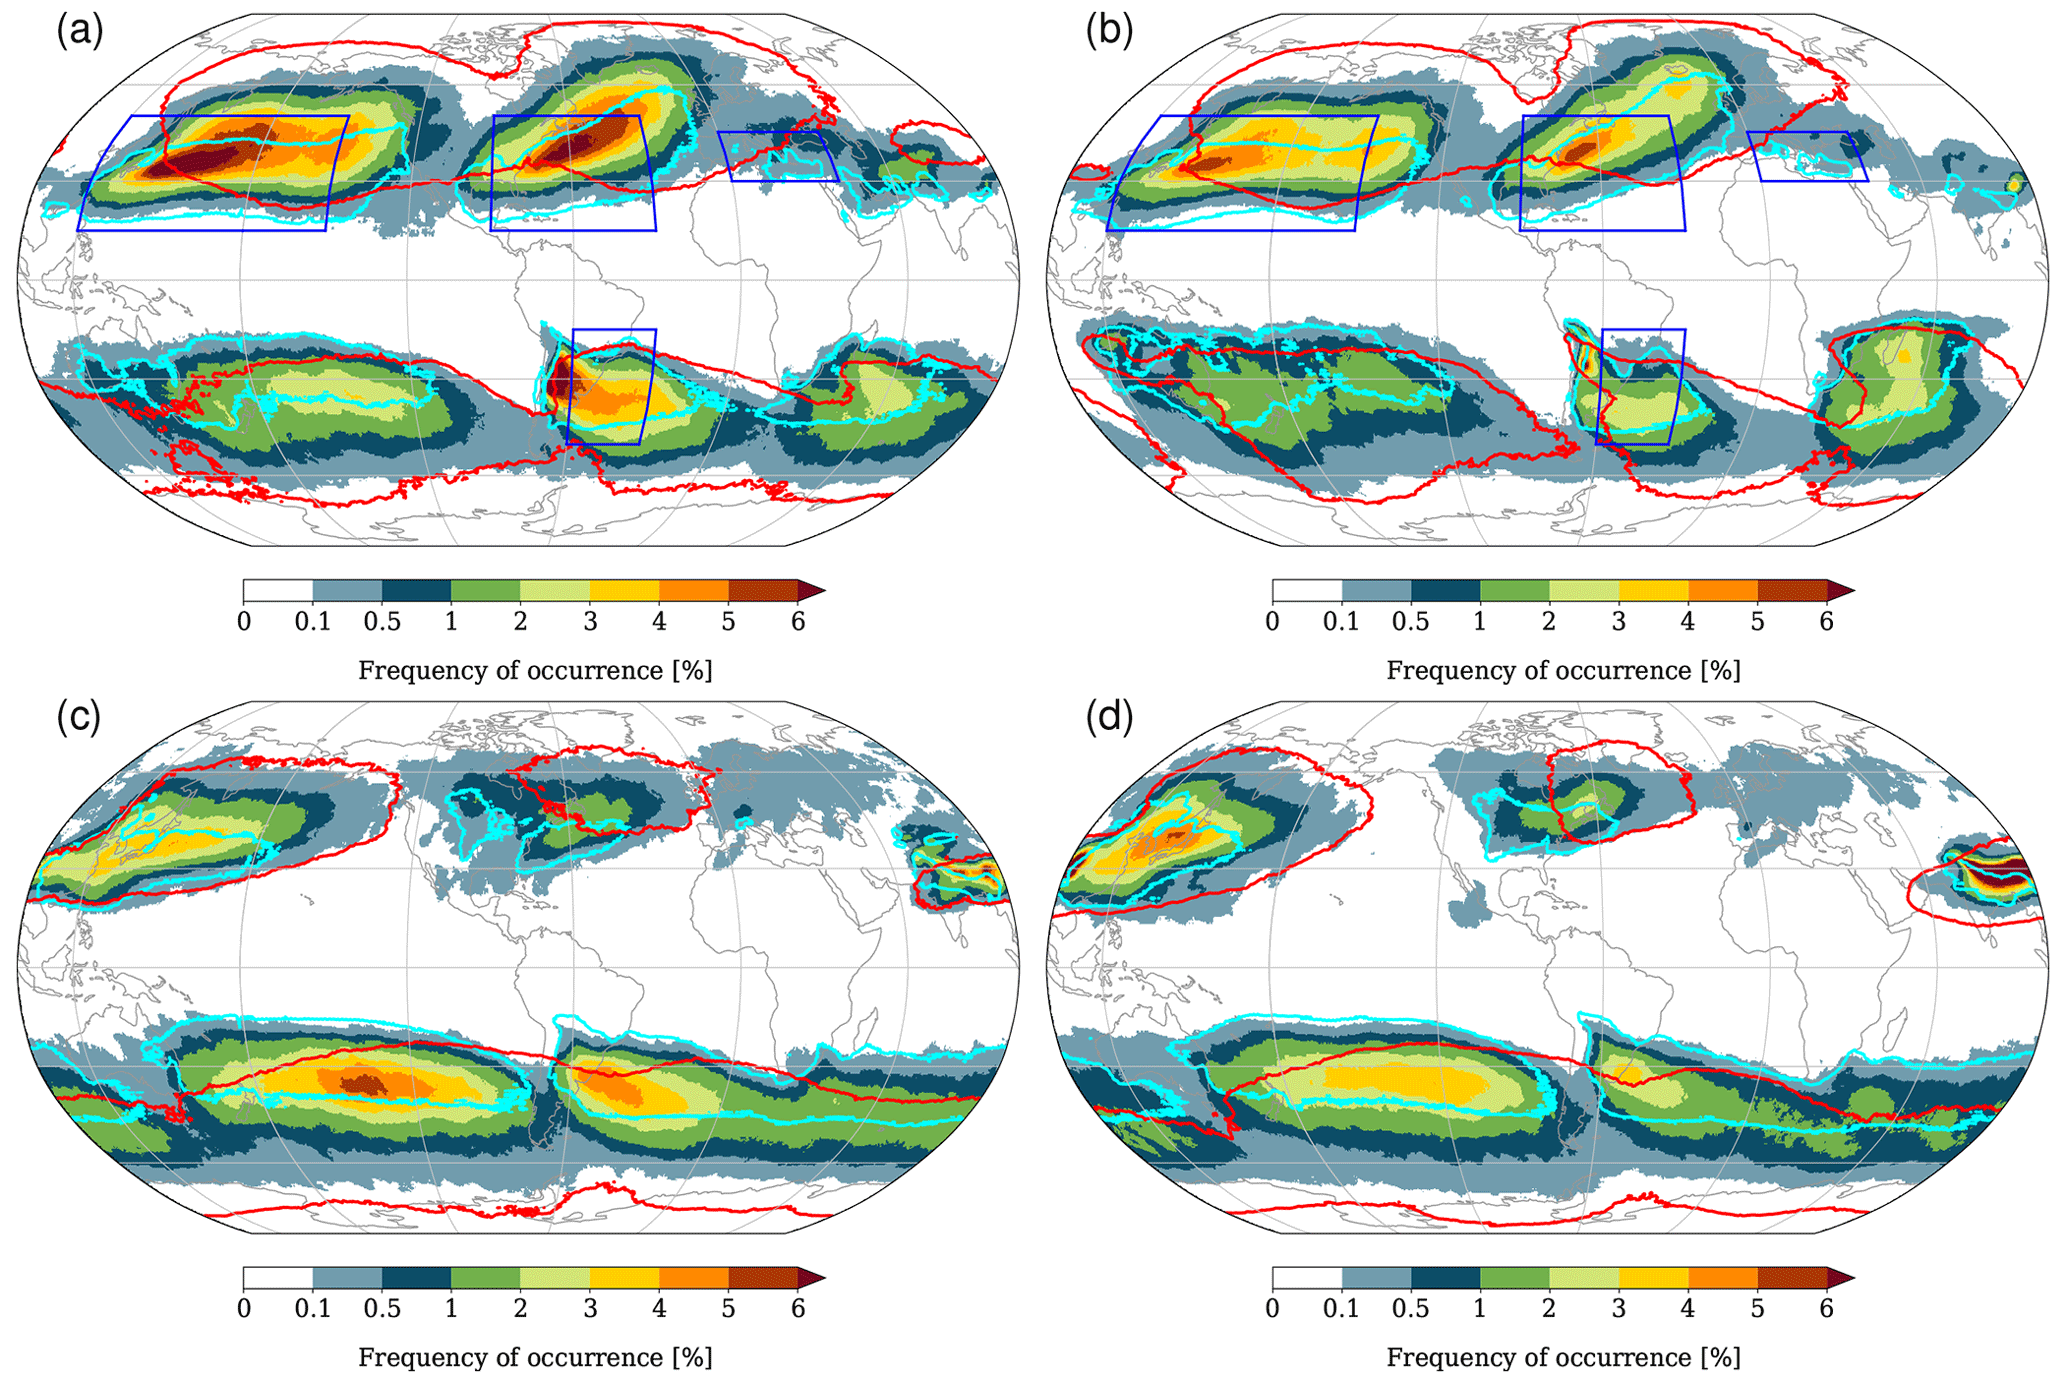
Figure 2Climatological frequency of WCBs in December–January–February (DJF) (a, b) and June–July–August (JJA) (c, d) for ERA-Interim (a, c) and HIST (b, d). Colours denote the percentage of 6-hourly time steps during which at least one WCB trajectory is located in a circle of 100 km around the considered grid point, 24 h after the start of the ascent. The turquoise line shows a frequency of 1 % for WCBs at their starting time t=0 h, and the red line shows a frequency of 1 % for WCBs at the end of their ascent at t=48 h. The blue boxes in panel (a) show the regions that are used for the regional analysis of WCBs in Figs. 8–12.
In this section we discuss the representation of WCBs in the HIST simulations and compare the results to the WCB climatology based on ERA-Interim (Madonna et al., 2014). In Fig. 2 the frequency of occurrence of WCBs in boreal winter (DJF) is shown for ERA-Interim (left column) and HIST (right column). WCBs are most frequent in the extratropical storm tracks in the winter hemisphere, as they are per definition linked to extratropical cyclones, which in turn constitute the storm tracks and are most prevalent during winter. Two maxima in the WCB starting (or inflow) regions, i.e. the locations where the WCBs start their 48 h ascent, are discernible in the North Atlantic and North Pacific (see turquoise lines) as well as in a band encircling the Southern Ocean between 25 and 40∘ S. During their main mid-tropospheric ascent, WCB air parcels travel east- and poleward, leading to frequency maxima in the storm track regions of ∼7 % in the Northern Hemisphere and 5 % in the Southern Hemisphere (see colours). The WCB outflow, i.e. the regions covered by WCB air parcels at the end of their 48 h ascent, is spread out over large parts of the extratropical hemispheres (see red lines). During boreal summer (JJA; Fig. 2c and d), two maxima in WCB starting and ascent regions are discernible over the North American continent and its east coast as well as over the western North Pacific and the Himalayan region. Whereas the WCB activity near the Himalayas is connected to the Asian monsoon, the maximum over the North Pacific is linked to the mei-yu/baiu front. A more detailed description of the WCB climatology, i.e. its regional hotspots and seasonal cycle, can be found in Madonna et al. (2014).
Comparing the WCB climatology in ERA-Interim (Fig. 2a and c) to the one calculated based on HIST (Fig. 2b and d), it is striking to see the similarity between the two, which thus points to CESM's capability to realistically simulate WCBs. In fact, both the frequency amplitude and the geographical location of their inflow, ascent, and outflow regions agree very well between both data sets. Of course, regional differences can still be identified, for instance, in the poleward and eastward movement of WCBs (e.g. in the North Atlantic and North Pacific) and also in the frequency amplitudes (e.g. in the lee of the Andes and the Himalayas). The difference between ERA-Interim and HIST is shown in more detail in the Supplement (Figs. S1 and S2). The reduced frequency of occurrence of WCBs in HIST (see reddish areas), especially when they reach the upper troposphere (see time steps t=24 and t=48 h in Figs. S1 and S2d and f), might also have an impact on the underestimation of blocking in climate models (Woollings et al., 2018). The patterns emerging from a difference plot (as shown in the Supplement) must however be carefully interpreted. We only have 37 years of ERA-Interim and 50 years of CESM-HIST data available, and it remains very challenging (or even impossible – see discussion in Sect. 2.3) to assess the statistical significance of the emerging difference patterns based on these relatively few years. Hence, part of the emerging patterns might “only” reflect interannual variability.
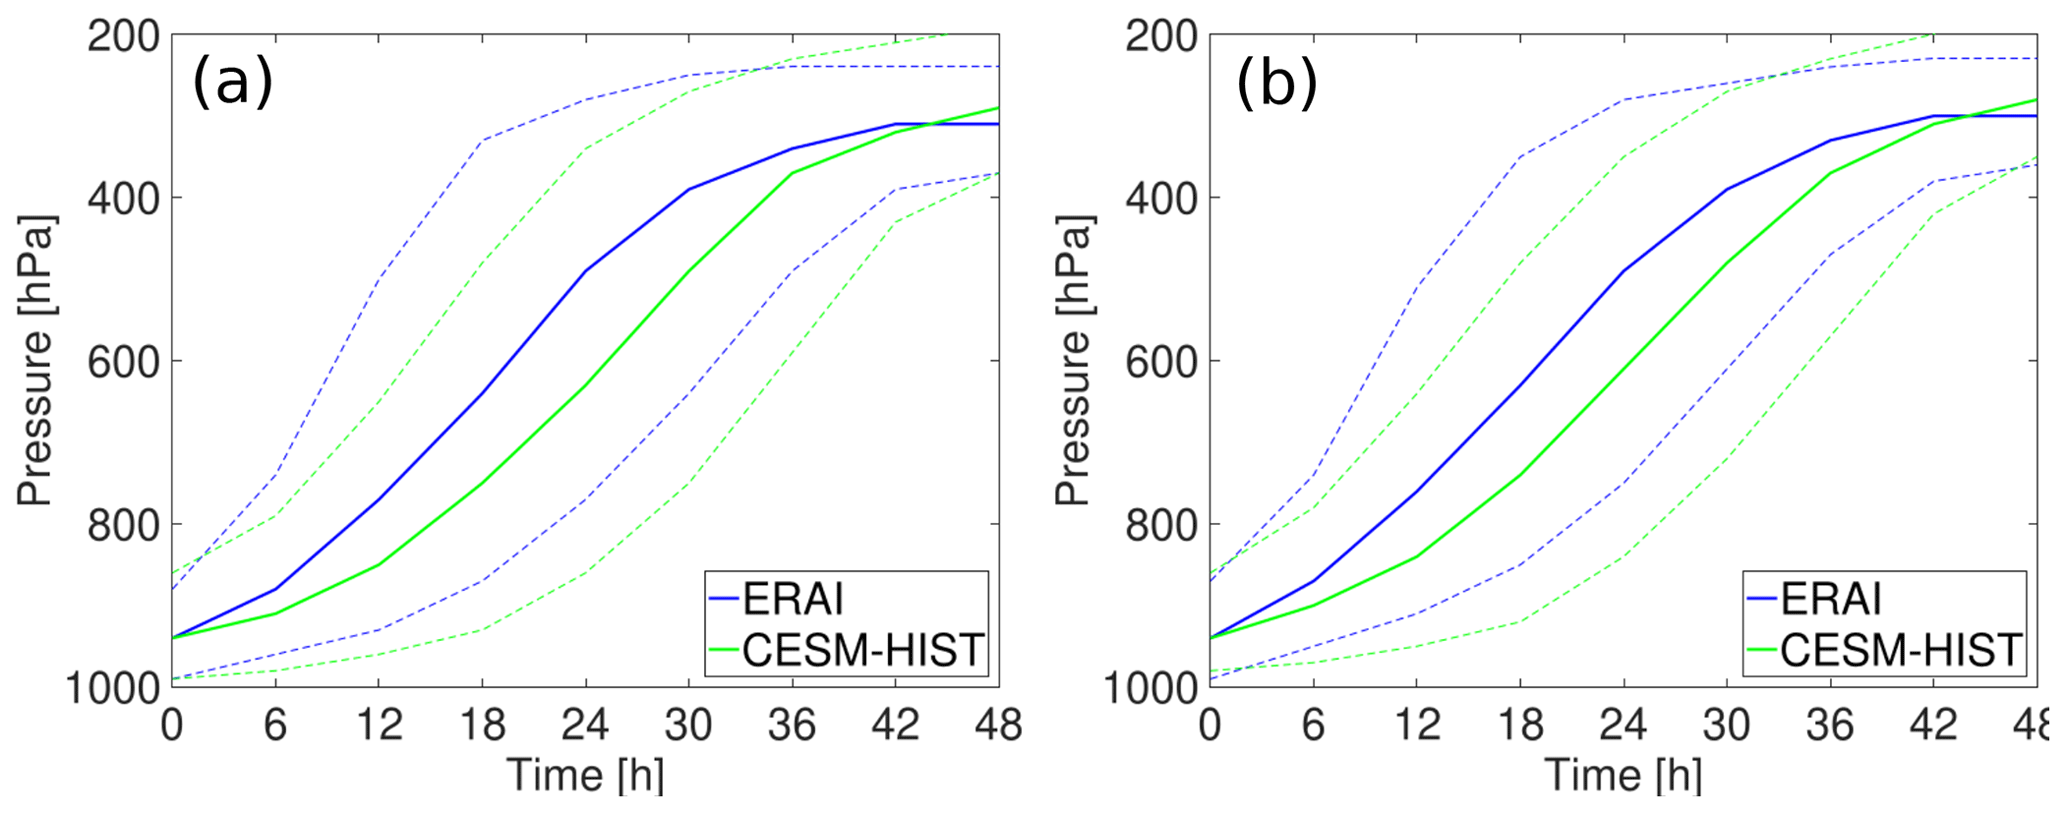
Figure 3Mean time evolution of pressure (in hPa) along all WCB trajectories in (a) boreal winter and (b) boreal summer. Solid lines denote the mean over all trajectories and dashed lines the 10th and 90th percentiles for ERA-Interim (blue) and HIST (green).
We also restricted the calculation of the WCB climatologies based on ERA-Interim to the 10-year time period from 1990–1999 (i.e. to the time period of HIST). The overall agreement between both data sets is also very good (not shown); however the differences between ERA-Interim and HIST did not decrease by restricting the ERA-Interim period to the 10 years used for HIST. We therefore decided to consider the full ERA-Interim time period for comparison to have a more robust estimation of the average WCB climatology.
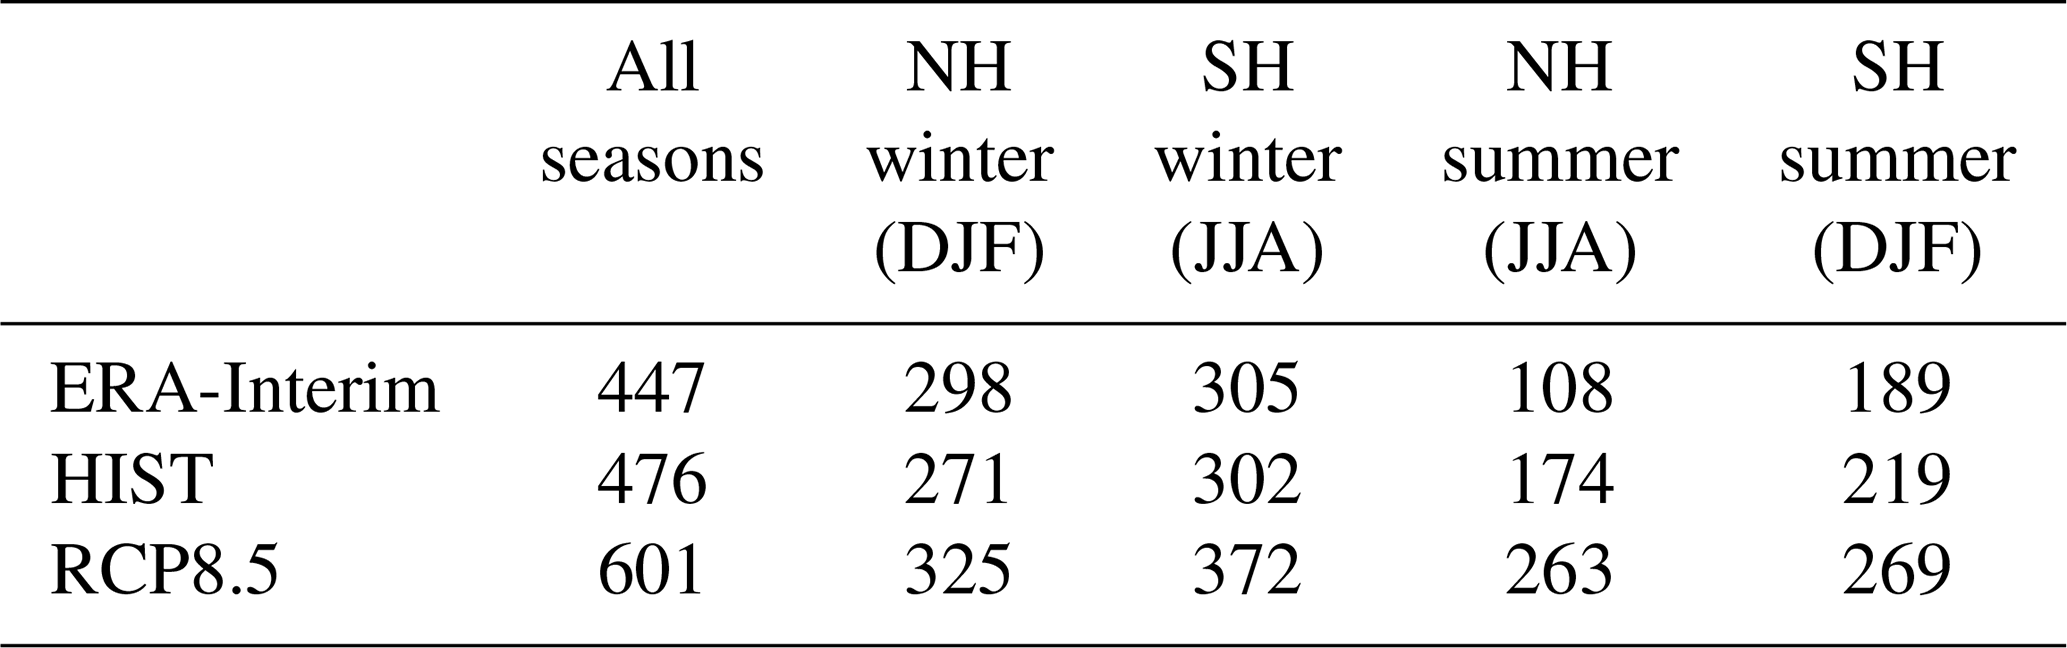
Whereas the maps in Fig. 2 show that HIST agrees well with ERA-Interim in capturing the frequencies of WCBs, they do not quantify the “intensity” of the ascending airstreams, which most easily is defined as the number of ascending WCB trajectories per 6 h time interval. This information is listed in Table 1 for ERA-Interim and HIST and for later reference also for RCP8.5. The numbers for ERA-Interim and HIST agree well, in particular during winter in the Northern Hemisphere and Southern Hemisphere. During summer, HIST seems to overestimate the number of WCB trajectories, in particular in the Northern Hemisphere. Some additional information on the WCB intensity in HIST can be gained from intensity maps, which complement the frequency maps in Fig. 2 and are available in the Supplement (Figs. S1a, c, e and S2a, c, e).
Table 1Number of WCB trajectories per 6 h interval for ERA-Interim, HIST, and RCP8.5, determined as an average for the 37 ERA-Interim and 50 CESM years. The different columns give the global and yearly average (column 2), the winter averages for the Northern Hemisphere (NH) and Southern Hemisphere (SH) (columns 3 and 4), and correspondingly the summer averages (columns 5 and 6).
In addition to the geographical pattern of WCB occurrence, we also analysed the ascent behaviour in both data sets. Figure 3 shows the time evolution of pressure along the 48 h ascent for all WCB trajectories. During both seasons, WCBs start from the lower troposphere at ∼950 hPa and ascend to a height of ∼300 hPa, on average. The average time WCB air parcels in HIST need to fulfil the 600 hPa ascent criterion equals ∼42 h. Thereby, the ERA-Interim trajectories reach this criterion slightly earlier than the HIST trajectories, which is also reflected in the faster and earlier ascent in ERA-Interim. However, given the differences in (vertical) resolution between ERA-Interim and CESM (see Sect. 2.1) and the large variability in the ascent (see dashed lines), the ascent behaviour is remarkably similar between ERA-Interim and HIST.
In summary, the agreement between ERA-Interim and HIST suggests that the latter is able to simulate, for a present-day climate, the WCBs' spatial occurrence, their frequency, and their ascent behaviour in a physically reasonable way (see comments in Sect. 2.3 about statistically robust inferences). In fact, an exact agreement cannot be expected because two models are compared that substantially differ in their parameterizations of sub-grid-scale processes and their (vertical) resolution. Furthermore, two different time periods are considered. Whereas for calculating the ERA-Interim trajectories, the time period from 1979–2018 is used, for HIST we use 5×10 years representative of 1990–1999 to obtain a 50-year climatology. Since the CESM simulations are coupled, they also develop for instance their own El Niño–Southern Oscillation (ENSO) cycle, and therefore during 1990–1999 they also represent different ENSO characteristics than ERA-Interim. Considering these aspects, the results of this section, however, point to a physically reasonable representation of WCBs in HIST, and therefore we will use HIST in combination with RCP8.5 to assess the potential change in WCBs in a future RCP8.5 climate in Sect. 4.
In this section, WCBs in HIST will be compared to the ones in RCP8.5. To this aim, we calculated WCB trajectories in five ensemble members of the RCP8.5 simulation that are representative of the years 2090–2099 under the RCP8.5 emission scenario (see Sect. 2.1 and 2.2). In a first part (Sect. 4.1) we focus on differences between the geographical patterns and occurrence frequencies. Then, in Sect. 4.2, we will characterize the WCBs in several hotspot regions by means of key parameters (e.g. their associated precipitation), followed by a more refined analysis of a potential effect of climate change on WCB characteristics.
4.1 Geographical changes in WCB occurrence frequencies
The absolute frequencies of WCBs in boreal winter (DJF) in HIST as well as the difference in the WCB frequencies between HIST and RCP8.5 are displayed in Fig. 4, separately for the times t=0 h (starting locations), t=24 h (ascent), and t=48 h (outflow). In RCP8.5, more WCBs start near the US east coast and over the southern US states (Fig. 4b). On the other hand, the starting frequencies south of Iceland are lower. In the North Pacific, the opposite signal can be observed, with a decreased frequency in RCP8.5 around 30∘ N and an increased frequency further north. Climate change signals are also discernible in the Southern Hemisphere. For instance, over South America, the WCB frequency at time t=0 h is slightly increased, whereas it is somewhat decreased near Madagascar.
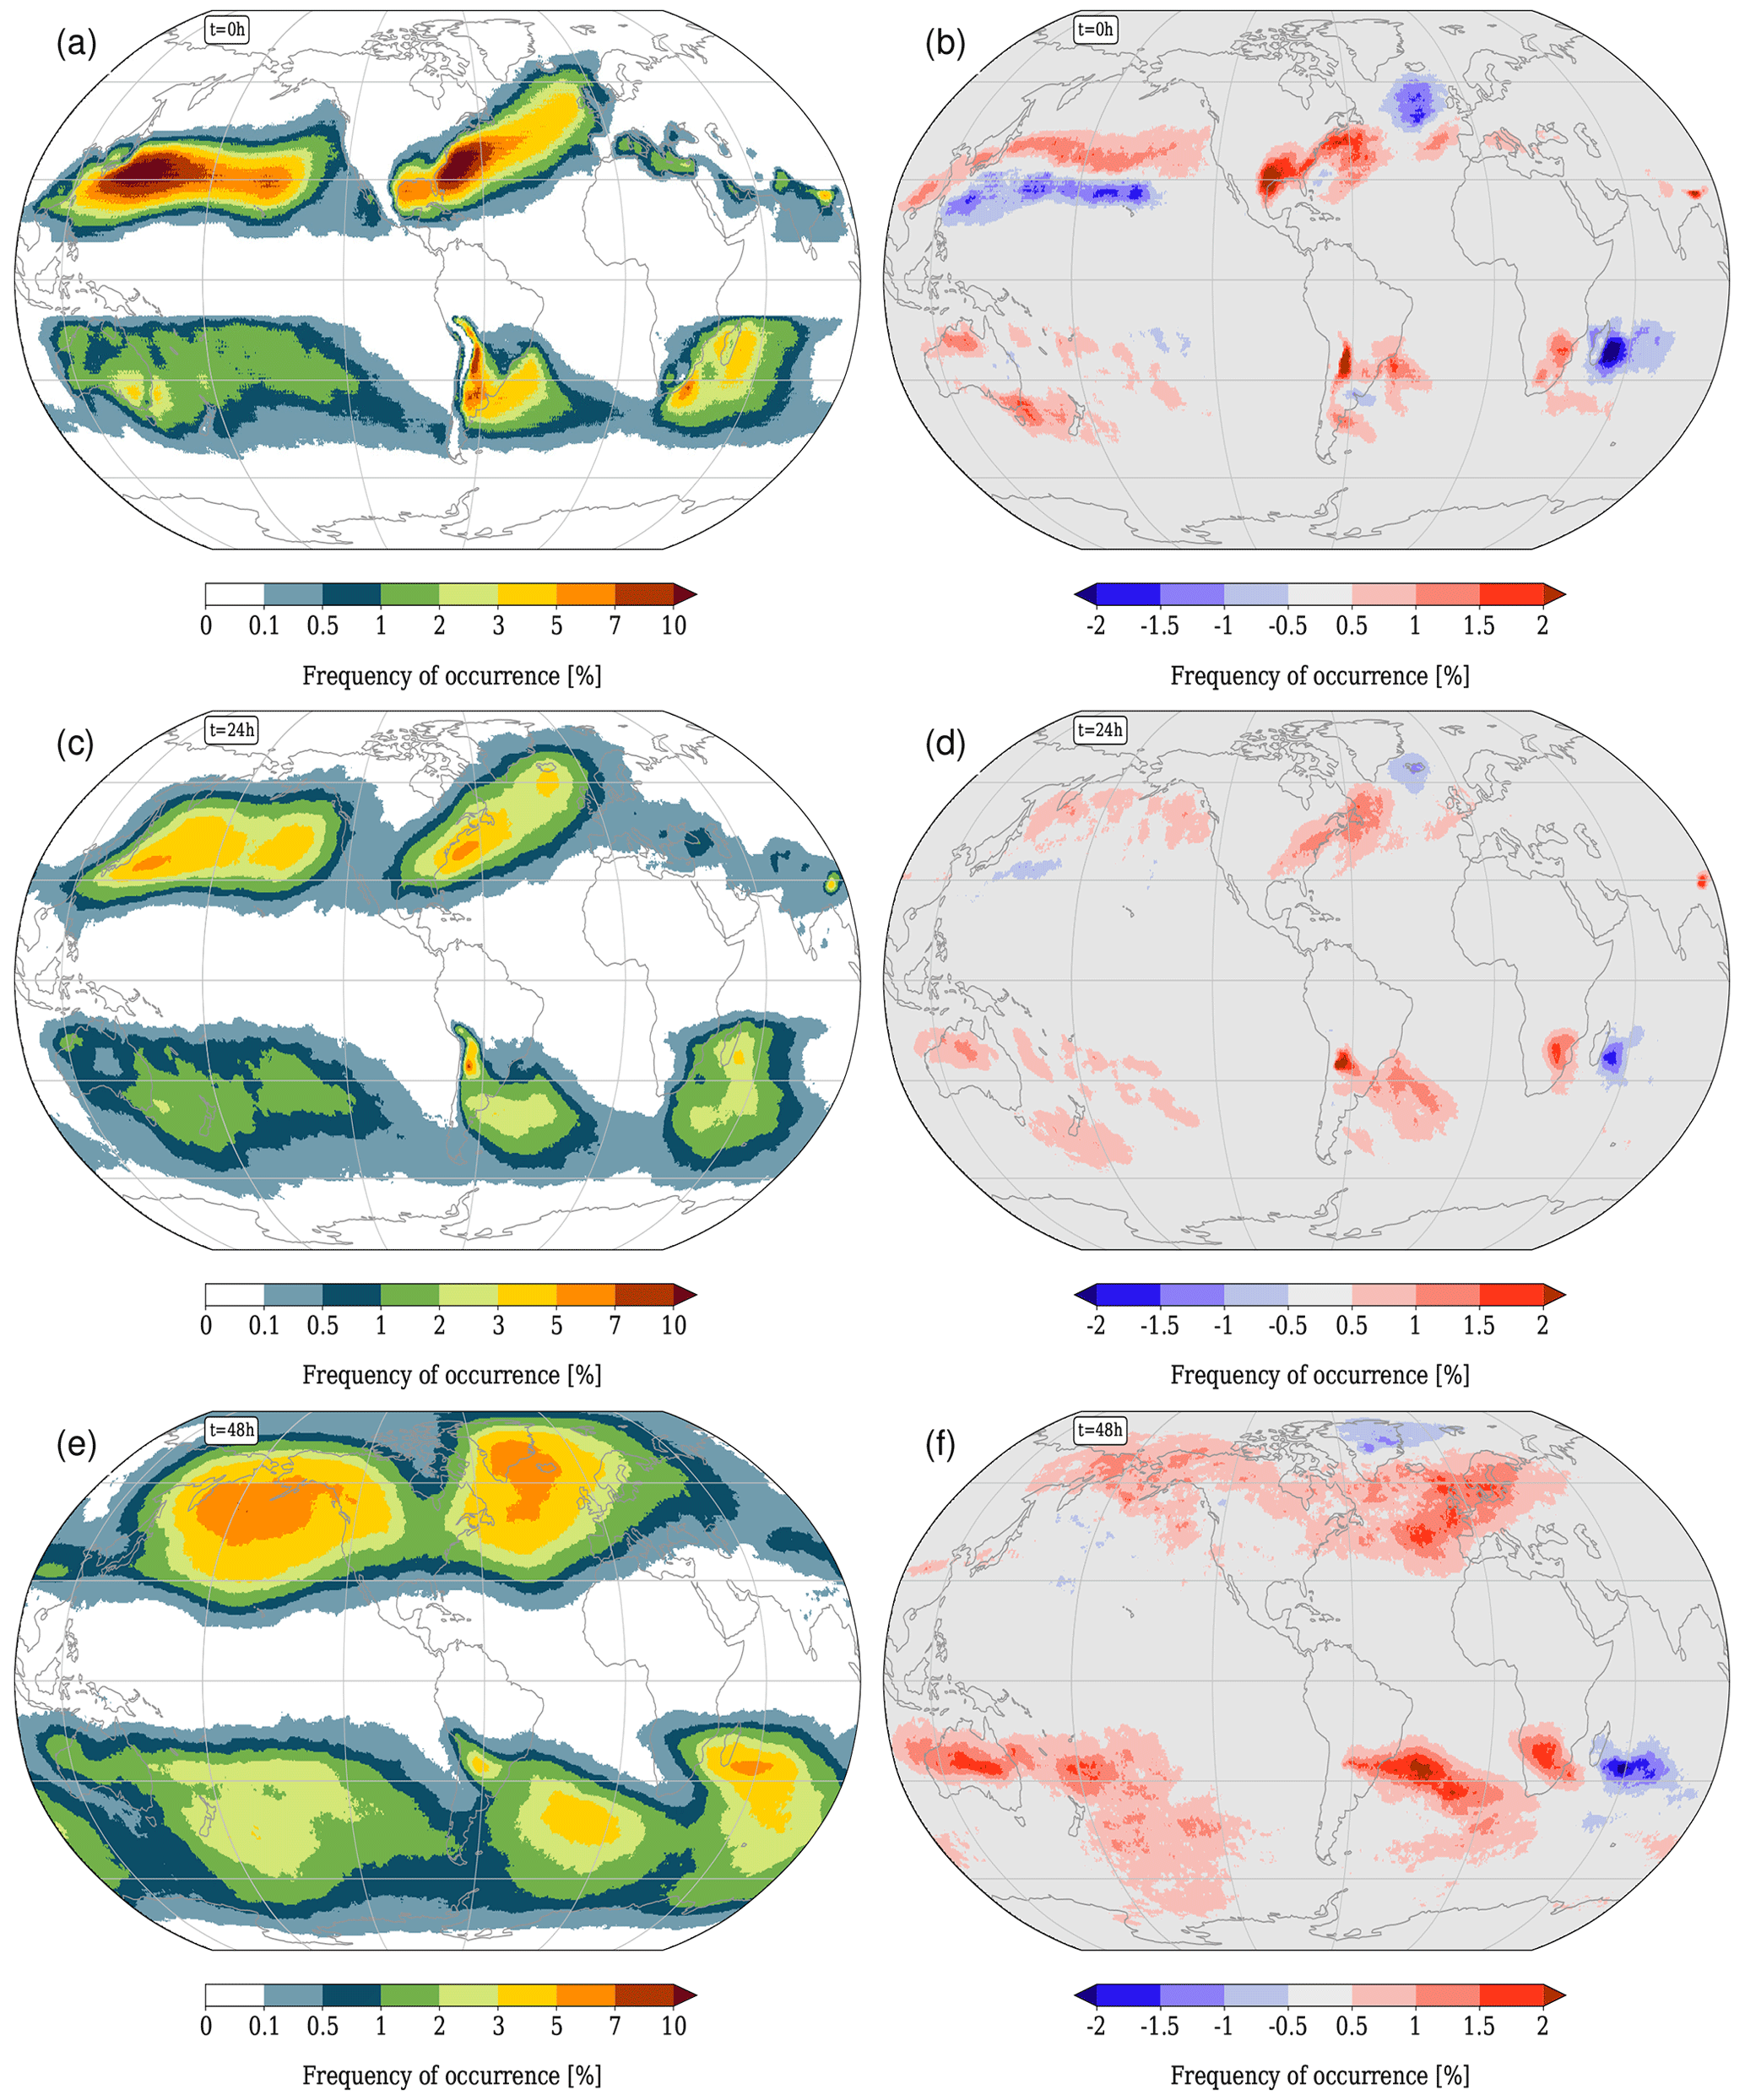
Figure 4Absolute values of WCB frequencies (in %) for HIST (a, c, e) and difference RCP8.5 − HIST during boreal winter (DJF) for WCB ascent times t=0 h (a, b), t=24 h (c, d), and t=48 h (e, f).
In the following 24 h, i.e. during the WCBs' ascent (Fig. 4c and d), the differences observed at t=0 h move downstream (to the east), leading to decreased frequencies over the North Atlantic around Iceland, near 30∘ N in the Pacific, and east of Madagascar. An increased WCB frequency in RCP8.5 is also discernible near the US east coast, north of 30∘ N in the North Pacific, and east of South America.
At t=48 h and thus at the time when the trajectories reach upper-troposphere levels (Fig. 4e and f), the WCB trajectories spread out substantially and, consequently, the differences between HIST and RCP8.5 cover considerably larger areas than at earlier times. In the North Atlantic south of ∼70∘ N, higher frequencies are found in RCP8.5, whereas lower frequencies prevail north of 70∘ N. Over the North Pacific, the WCB outflow is shifted northward, in accordance with the northward shift of the WCB inflow (t=0 h), and an increased frequency can be seen north of 60∘ N. Finally, in the Southern Hemisphere, the difference signal at t=24 h also propagates further downstream and at t=48 h covers considerably larger areas due to the spreading out of the WCBs in the upper-troposphere outflow.
The differences between HIST and RCP8.5 in the Northern Hemisphere summer (JJA) are displayed in Fig. 5. Over the central USA and eastern Canada, a dipole is discernible: fewer WCBs start over the central USA in RCP8.5 but more over eastern Canada. In the Himalayas and the adjacent North Pacific, the most pronounced increase in WCB frequency is observed in RCP8.5. Also the Southern Hemisphere exhibits higher frequencies over the Atlantic Ocean and Indian Ocean. On the other hand, a decrease over the subtropical western South Pacific is observed. These differences in the WCB starting regions (t=0 h) again propagate downstream with time (see Fig. 5d). At t=48 h (Fig. 5f) a considerable increase in RCP8.5 is discernible in large areas over Southeast Asia and the western North Pacific as well as the Southern Ocean.
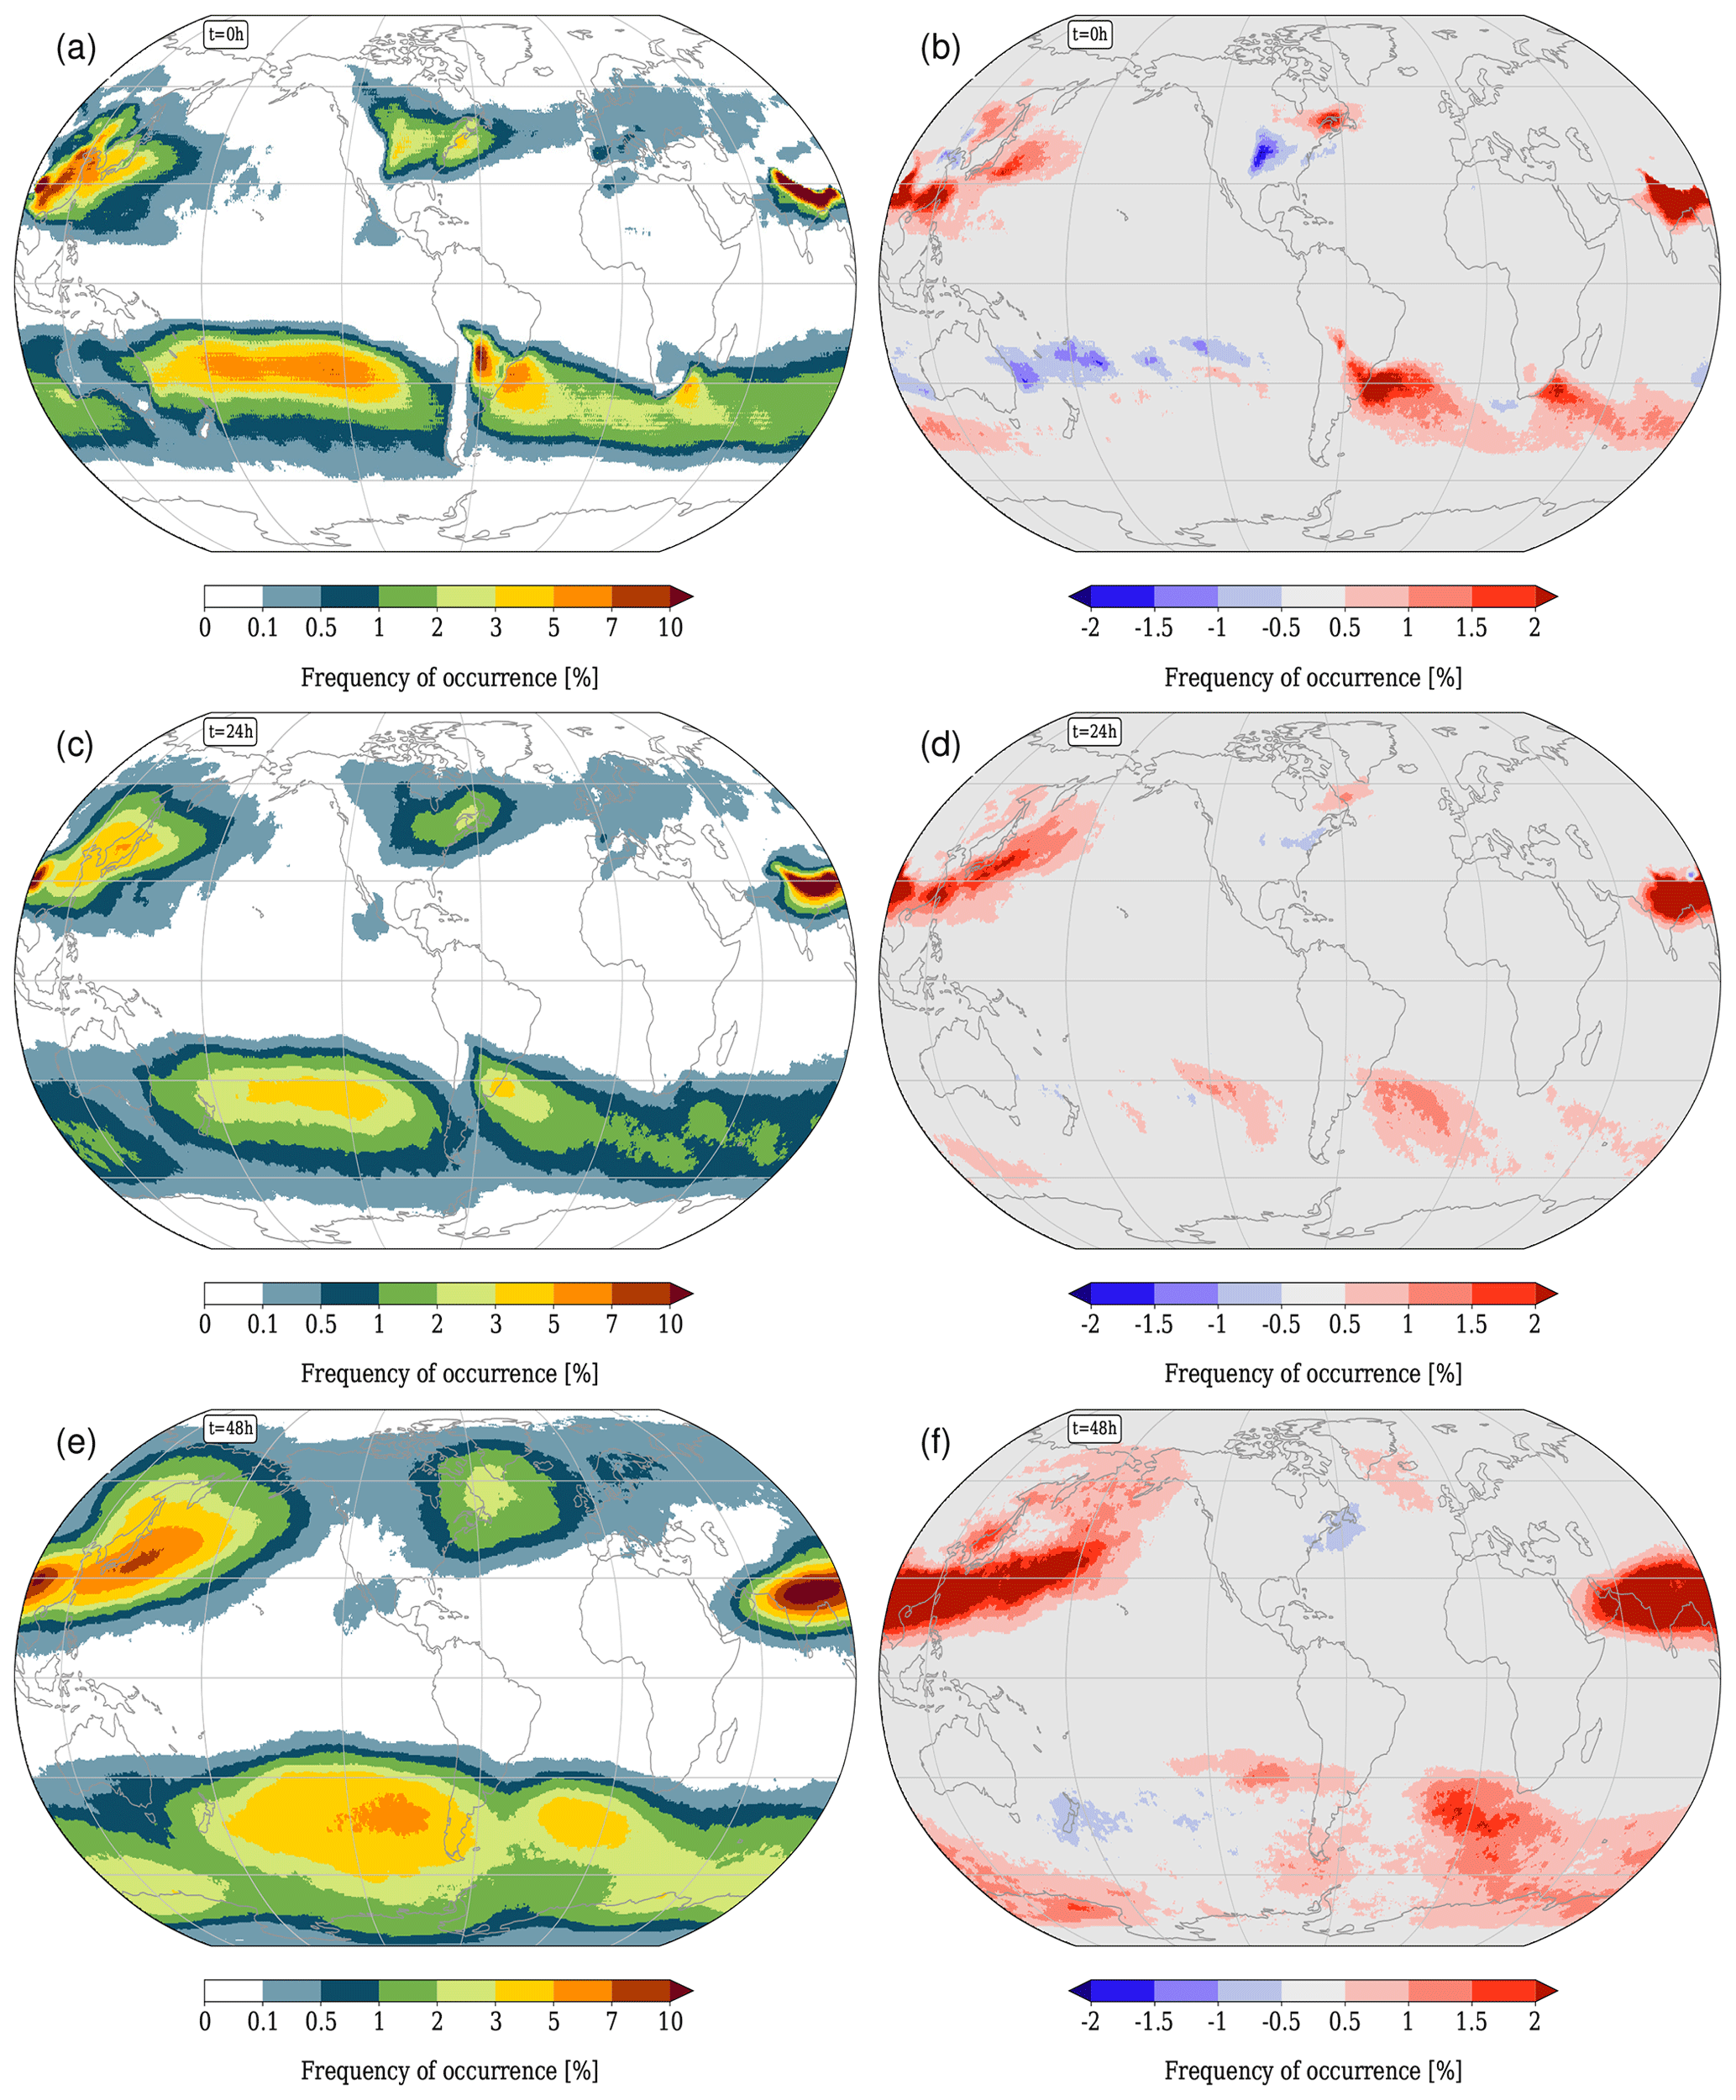
Figure 5Same as Fig. 4 but for JJA.
The maps in Figs. 4 and 5 compare the frequencies with which a specific region is affected by a WCB. However, they neglect – as in the comparison between ERA-Interim and HIST in Sect. 3 – a potential change in WCB intensities. With WCB intensities, we consider how many WCB air parcels are located nearby the considered grid point. Indeed, a substantial increase in WCB intensity is discernible in RCP8.5 when comparing the number of WCB trajectories per 6 h interval (see Table 1). Consistently, the numbers are higher (by about 26 %) in RCP8.5 than in HIST for all seasons and separately in the Northern Hemisphere and Southern Hemisphere. This increase is also seen in the WCB-intensity maps, showing the number of trajectories per square kilometre and 6 h interval, which is provided in the Supplement (Figs. S1 and S2).
In Sect. 3 we compared the pressure evolution of WCB trajectories in ERA-Interim and HIST, finding that the overall ascent is well captured in CESM, in particular with respect to the maximum altitude reached by the WCB air parcels. Here, we now compare the ascent behaviour of WCB trajectories in HIST and RCP8.5 (Fig. 6), expecting that the overall warmer atmosphere and increased moisture content potentially influence not only the maximum altitude but also the ascent rate of the WCBs. However, the global mean pressure decrease during the 48 h ascent is very similar in both simulations. In fact, in DJF, trajectories start from the same pressure levels in HIST and RCP8.5, and they ascend to only slightly higher levels in RCP8.5. In JJA, the starting and ending pressures are slightly higher in RCP8.5, but this vertical shift is not accompanied by a pronounced change in the WCB ascent rate, at least in the global and seasonal mean shown in Fig. 6. This result indicates that the WCBs in a future climate keep their essential ascent characteristics (but see also Sect. 5.1).
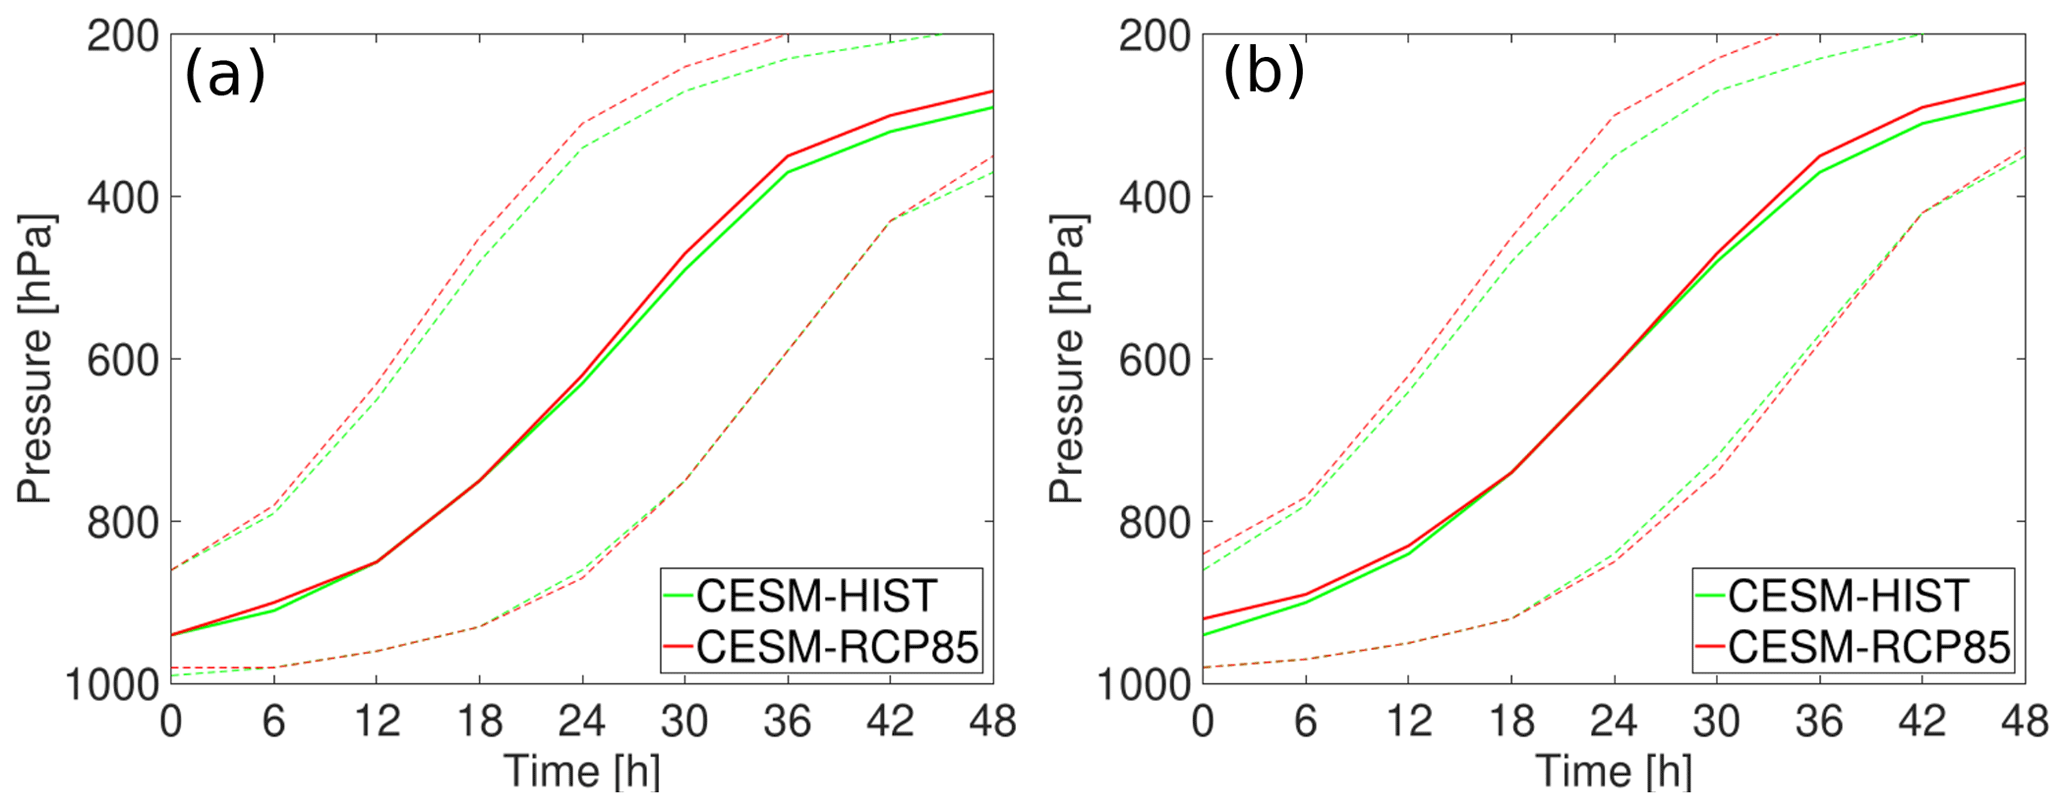
Figure 6Time evolution of pressure (in hPa) along all WCB trajectories in (a) boreal winter and (b) boreal summer. Solid lines denote the mean over all trajectories and dashed lines the 10th and 90th percentiles for HIST (green) and RCP8.5 (red).
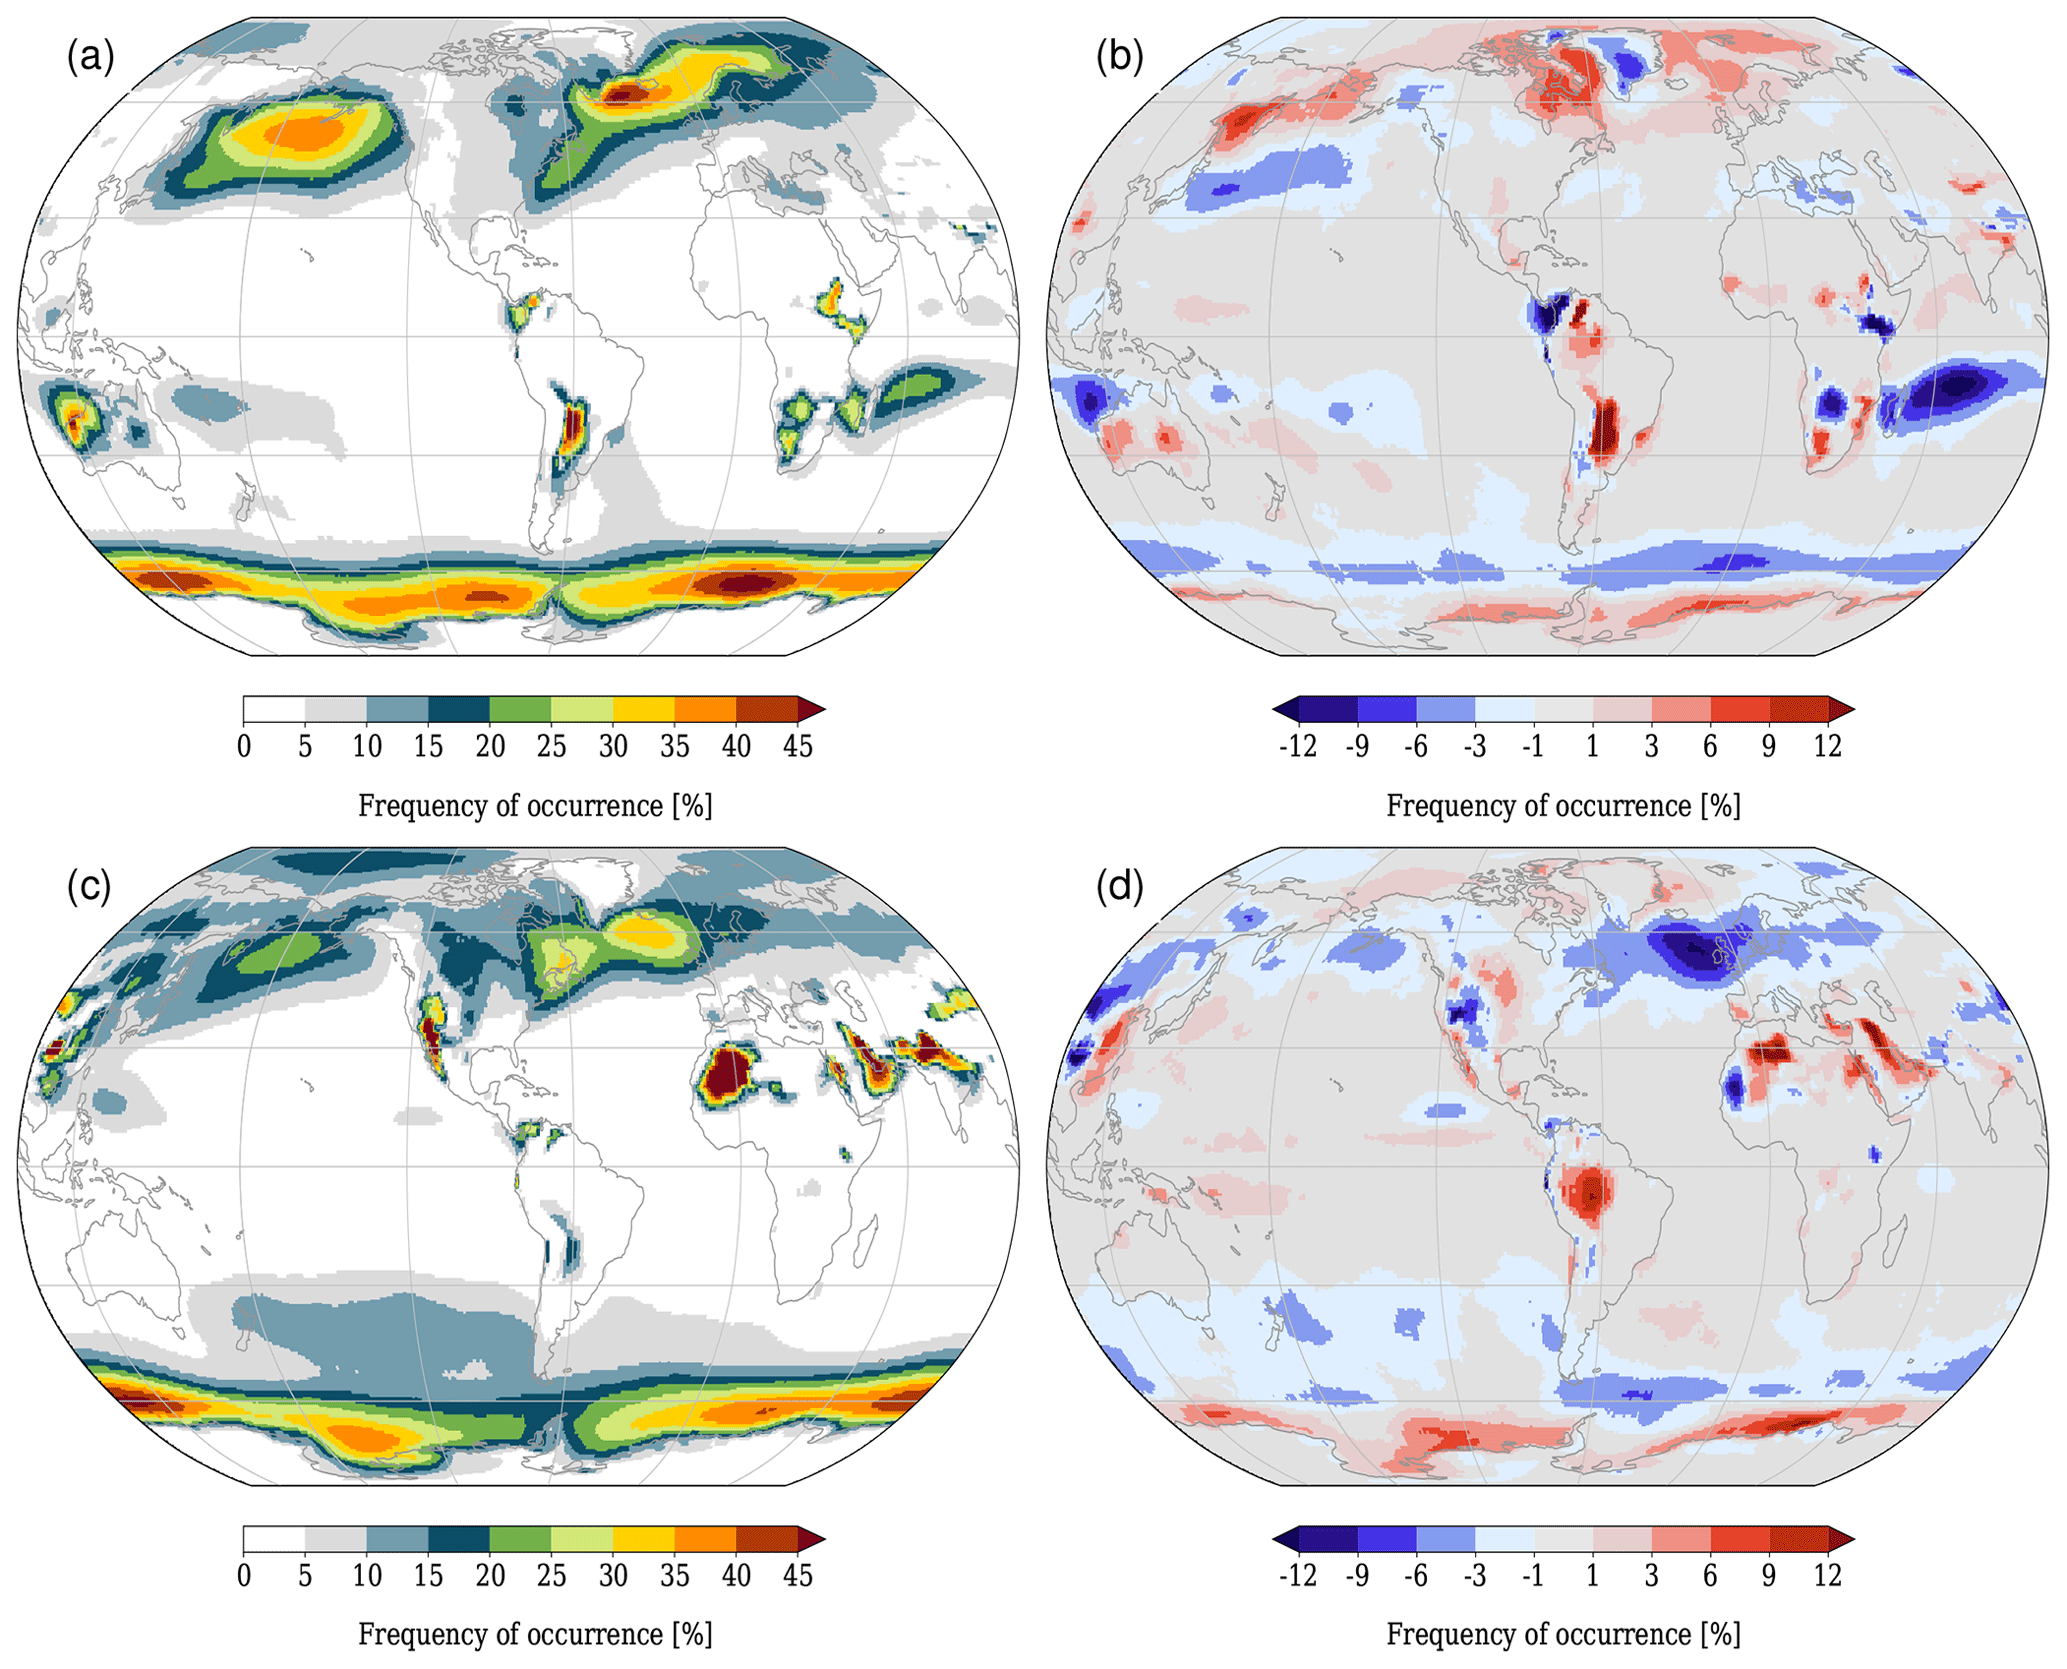
Figure 7Absolute values of cyclone frequency for HIST in (a) DJF and (c) JJA and differences in cyclone frequencies between RCP8.5 and HIST in (b) DJF and (d) JJA.
Finally, we ask the question of how the climate-change-related shifts in WCB frequencies can be explained. To this aim, it is worthwhile to keep in mind that the WCB is one of the characteristic airstreams in extratropical cyclones, which is also reflected in the fact that our WCB definition (Sect. 2.2) explicitly links any WCB to a cyclone. This, in turn, means that any change in WCB frequencies (spatially and in amplitude) might be related to changes in cyclone frequencies. In fact, several of the signals discussed before can be associated with corresponding signals in cyclone frequencies. For instance in DJF, the WCB frequency in the North Pacific decreases in RCP8.5 near 30∘ N and increases further north. This signal is consistent with the corresponding change in cyclone frequencies in the North Pacific, where fewer cyclones are found near 30∘ N and more around 60∘ N (Fig. 7b). Note that a northward shift of the North Pacific storm track in a warmer climate is also found in other studies (e.g. Tamarin-Brodsky and Kaspi, 2017; Priestley and Catto, 2022). Consistent signals are also found over South America, where both the WCB frequency at time t=0 h and the cyclone frequency are slightly increased. A (partly) consistent decrease in WCB and cyclone frequencies is found over Madagascar, where fewer cyclones occur in an area reaching from Madagascar to the northwest coast of Australia. However, a more detailed analysis of the cyclones in the vicinity of Madagascar revealed that the strong reduction in cyclone frequency is mainly caused by a reduction in the frequency of tropical cyclones. This reduction in tropical cyclones in the southern Indian Ocean and Australasian regions is in agreement with results based on CMIP5 models (Roberts et al., 2020). Thus, the WCB signal that can be seen close to Madagascar is not related to extratropical cyclones. This also manifests in the relative stationarity of the WCB movement from t=0 to t=48 h (see Fig. 4). As in this study we do not focus on tropical cyclones, the signal around Madagascar will not be discussed further.
There are, however, also regions where cyclone and WCB frequencies do not exhibit consistent signals. For instance, this is the case in DJF, when WCBs increase over the western and decrease over the eastern North Atlantic, south of Iceland. The cyclone frequencies, in contrast, completely lack such a clear dipole structure. This discrepancy points to an important aspect: in addition to frequency changes in cyclones in a specific region, it might also be the cyclone structure itself that changes and thus allows for more or fewer WCBs to occur. Stated otherwise, in a warming climate the WCB efficiency of cyclones due to changes in inflow moisture and/or baroclinicity could (regionally) change and thus contribute to the climate-related WCB signals. The decomposition (or attribution) of the WCB changes into a cyclone frequency and efficiency part is, however, not trivial and beyond the scope of this study.
4.2 Regional changes in WCB characteristics
Despite the very similar ascent behaviour in both considered climates (Fig. 6), we have shown that differences in the WCB frequency occur in the main WCB ascent regions (Figs. 4 and 5). Therefore, we now analyse characteristics of WCBs and associated WCB impacts like precipitation separately for the world's main WCB ascent regions, namely the North Atlantic (NATL) and North Pacific (NPAC) storm tracks, the Mediterranean (MED), and the South Atlantic (SATL). The selected regions are shown in Fig. 2a. We characterize the WCBs by calculating different measures: the specific humidity at time t=0 h, i.e. at the beginning of the WCB ascent; the accumulated precipitation along the ascent from t=0 to t=48 h; the difference in potential temperature (Δθ) between the start and the end of the ascent1; and the potential temperature at the end of the ascent (θend). The results are shown in Fig. 8 for winter only, i.e. DJF for the North Atlantic, North Pacific, and Mediterranean, and JJA for the South Atlantic.

Figure 8Box-and-whisker plots for different characteristics of WCBs in the North Atlantic (NATL), North Pacific (NPAC), Mediterranean (MED), and South Atlantic (SATL). The panels show (a) specific humidity in the WCB inflow, (b) the increase in potential temperature along the WCB, (c) accumulated surface precipitation along the WCB, and (d) potential temperature at the end of the WCB ascent. Only winter is considered, i.e. DJF for NATL, NPAC, and MED and JJA for SATL. The results for HIST are shown in blue and for RCP8.5 in red bars. The diagrams show: the interquartile range (coloured bar), median (bold black line), mean (diamond), and the 5th-to-95th-percentile range (thin lines).
The distribution of specific humidity in the WCB inflow increases substantially from HIST to RCP8.5 in all considered regions (Fig. 8a). The 5th and 95th percentiles as well as the mean and median of the distributions are shifted to significantly higher values, whereas the width of the distributions is also slightly increased in RCP8.5. The difference is most pronounced in the Mediterranean region where the interquartile ranges are almost completely separated. In general, in all regions the increases in specific humidity and temperature are qualitatively in accordance with the Clausius–Clapeyron relationship. The increased moisture values in the WCB inflow lead in all regions, consequently, to an increase in total precipitation that falls along the ascending WCBs (Fig. 8c). This increase arises from changes in the resolved, large-scale precipitation, whereas parameterized convective precipitation remains rather unchanged in RCP8.5 compared to HIST (not shown). The increase in inflow moisture in a future climate also has a strong impact on the increase in potential temperature (Δθ), i.e. the cross-isentropic flow of the WCB (Fig. 8b). More diabatic heating due to cloud formation leads to the enhanced Δθ. This is true for all regions, and it is particularly pronounced in the upper percentiles. Connected to the more diabatic nature of WCBs and the increase in Δθ, WCBs reach higher isentropes at the end of their ascent (Fig. 8d). In all regions except for the Mediterranean, WCBs in RCP8.5 reach above the 320 K isentrope. The difference is most pronounced in the Mediterranean, where the two distributions are almost completely separated for HIST and RCP8.5. Hence, in RCP8.5, WCBs in the Mediterranean reach 310 K on average, whereas this level is only reached by the most extreme WCBs in HIST.
In summer, the properties of WCBs also change in RCP8.5 (see Fig. 9). Specific humidity in the WCB inflow increases in all regions, whereby, in contrast to winter, the change is most pronounced in the North Pacific and South Atlantic (Fig. 9a). In the Mediterranean, the smallest change is observed. Due to the increase in moisture, the precipitation along the ascending WCBs is also increased (Fig. 9c). The mean precipitation and median precipitation only slightly increase in the North Atlantic and South Atlantic, and almost no increase is discernible in the Mediterranean. The most pronounced increase occurs in the North Pacific in the higher percentiles, where it amounts to an almost 20 % increase. Thus, in RCP8.5, extreme precipitation events connected to WCBs potentially become more severe in the North Pacific. Interestingly, the shift in the upper percentiles is much less pronounced in the North Atlantic. The change in potential temperature is shown in Fig. 9b. Again, the cross-isentropic flow and thus the diabatic character of WCBs are strongly enhanced in RCP8.5. In all regions Δθ strongly increases, whereas the changes are smallest in the Mediterranean region. Linked to the enhanced diabatic activity, the ascending WCB airstreams reach considerably higher isentropes. Indeed, in all regions the interquartile ranges of the distributions are completely separated (see Fig. 9d). The increase in the Mediterranean is mainly caused by an increase in θ in the WCB inflow, which reflects the strong surface temperature increase in the Mediterranean in RCP8.5 (not shown).

As mentioned before, for several characteristics the box-and-whisker plots between HIST and RCP8.5 differ in particular for the range between the 5th and 95th percentiles. For instance, for precipitation, the former remains rather unchanged and the latter increases substantially in winter from ∼40 mm (48 h)−1 in HIST in NATL, NPAC, and MED to ∼50 mm (48 h)−1 in RCP8.5. Further, in summer, the upper percentiles of precipitation in the North Pacific exhibit a much more pronounced shift than the corresponding shifts in the North Atlantic. This indicates that there is actually a shift to more extreme precipitation events associated with WCBs in RCP8.5 but that it depends on the considered region. This is, however, difficult to quantitatively determine from Figs. 8 and 9, and thus we proceed with a more refined statistical analysis that allows for a detailed quantification of the shift in the precipitation percentiles.
In essence, the percentiles of the HIST and RCP8.5 precipitation values integrated along the WCBs are first calculated, and then their difference is determined, separately for the four target regions and for winter and summer (Fig. 10). The horizontal axis gives the percentile and the vertical axis the difference (RCP8.5 − HIST) of the precipitation at the corresponding percentiles. For instance, the median precipitation (50th percentile) increases by 2.5 mm (48 h)−1 for MED and even 5.0 mm (48 h)−1 for SATL. The most striking signal in the percentile differences is, however, the substantial increase for the more extreme percentiles. In winter the increase for the highest percentiles amounts to 5.0 mm (48 h)−1 for MED and even more than 15.0 mm (48 h)−1 for the other regions (Fig. 10a), which is a very substantial increase in the most extreme precipitation values. In fact, these increases can also be compared to the typical precipitation values in Figs. 8 and 9. The climate change effect (in terms of absolute increase in WCB-related precipitation) becomes even larger in summer, particularly in the region NPAC (Fig. 10b).
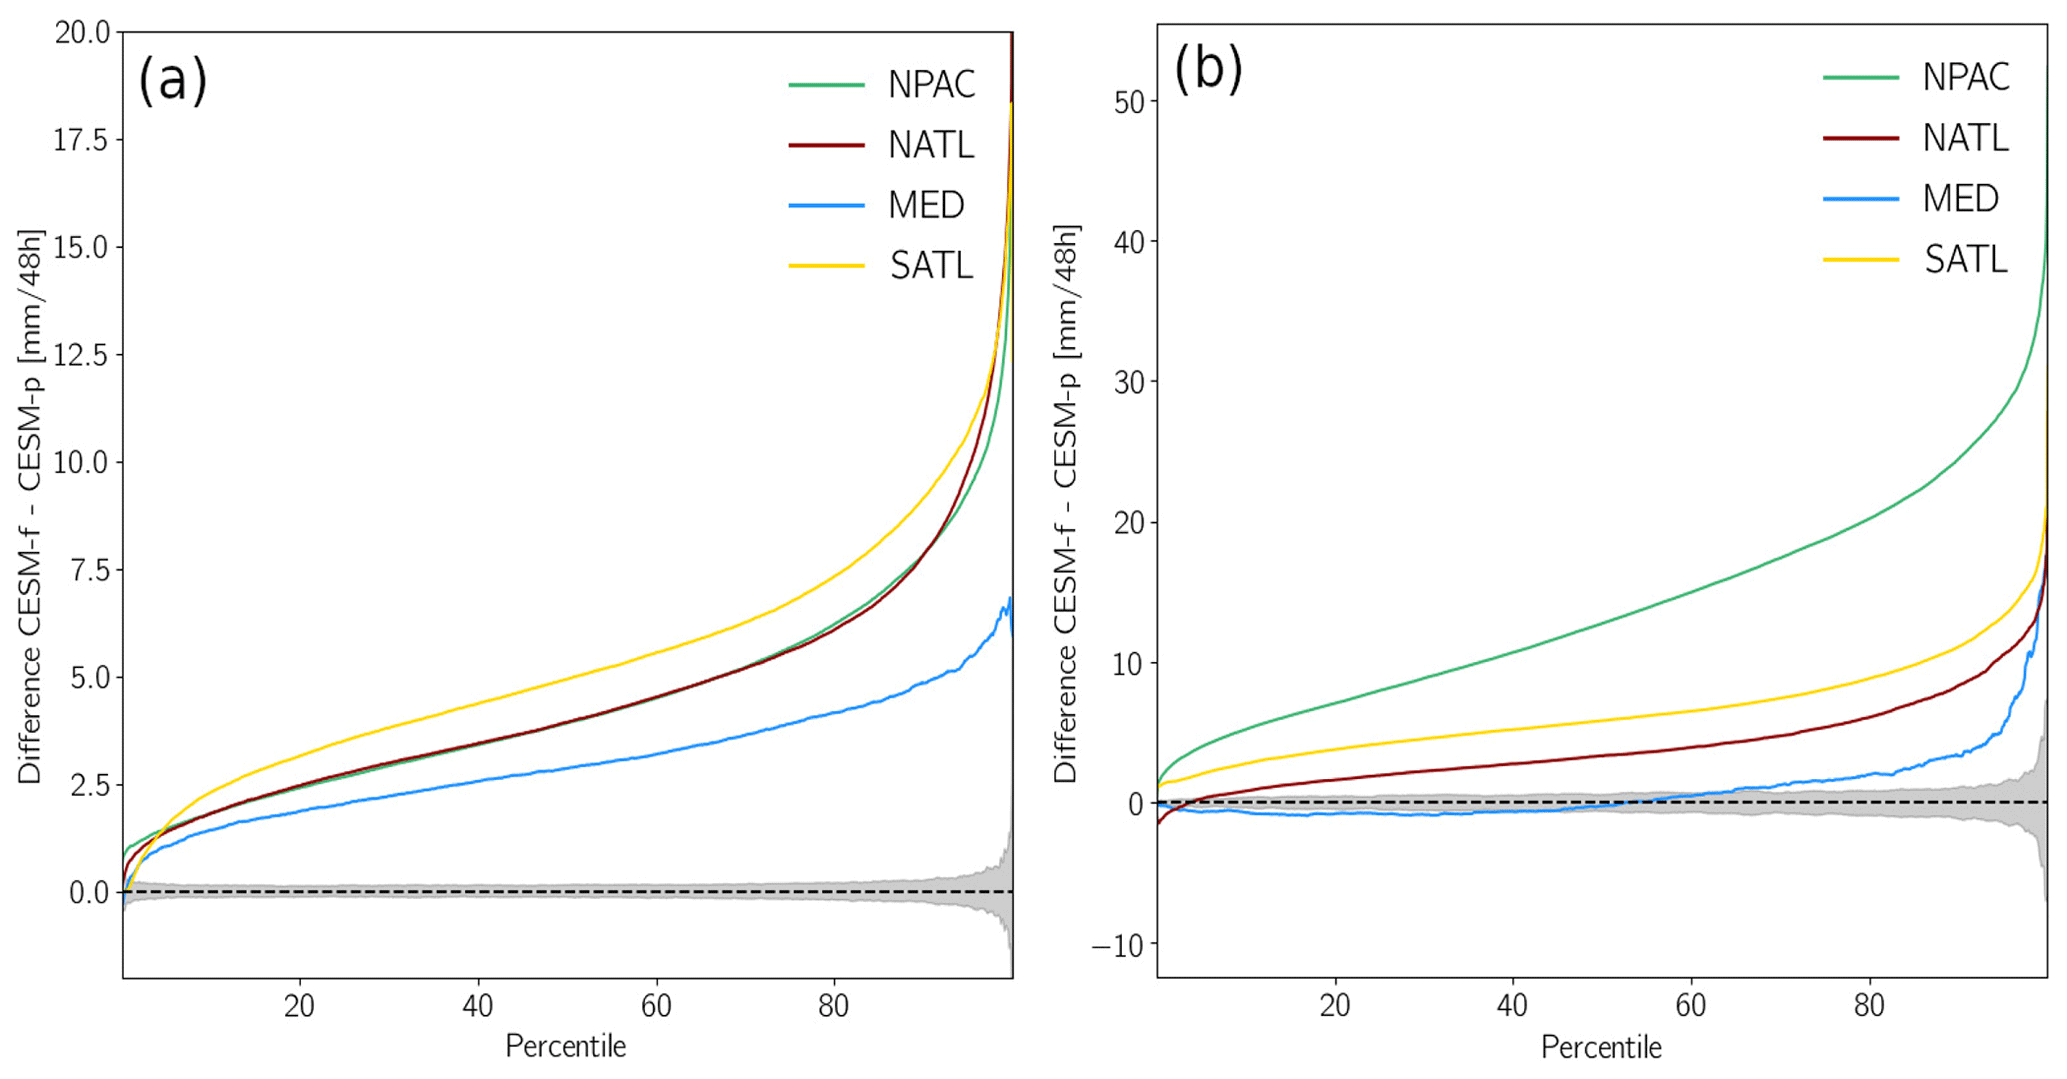
Figure 10Difference in precipitation percentiles for the four target regions, in (a) winter and (b) summer. The grey-shaded area corresponds to the 95 % confidence interval under the null hypothesis that the two precipitation distributions for HIST and RCP8.5 do not differ. This confidence interval is only shown for MED; for the other regions it falls within the one for MED. The confidence interval is calculated based on a resampling approach (see text for details). Note the different vertical axis scales in the two panels.
To assess the statistical significance of the RCP8.5 − HIST percentile differences in Fig. 10, we applied a resampling approach to determine for each percentile difference the 95 % confidence interval. More specifically, we assume that the WCB-related precipitation distributions of HIST and RCP8.5 do not differ, i.e. that they belong to a common distribution. Under this null hypothesis, we draw two equally sized samples and determine the percentile difference for these two samples. This step is repeated 10 000 times, and for each percentile the 2.5 %-to-97.5 % range of the resampling differences is shaded in grey. This is shown in Fig. 10 for the region MED, and for the other regions the corresponding confidence intervals fall within the MED confidence interval. Hence, if the actual RCP8.5 − HIST percentile difference for MED falls outside this grey range, it indicates that the null hypothesis is not valid and the difference, at the corresponding percentile, is statistically significant at the 5 % level. The fact that this essentially is the case for all percentiles strongly underlines the climate-warming-related shifts in WCB-related precipitation.
In the previous sections we have shown that not only WCB frequencies but also many of their characteristics considerably change in a warming climate. More specifically, the WCB-related precipitation strongly increases in the upper percentiles, but it remains open where on the globe these changes will be most pronounced. Furthermore, the more diabatic nature of the WCB ascent linked to a higher outflow isentrope has been discussed, whereas the implications of these changes remain unclear. In this section we will therefore discuss in more detail three different WCB impacts that are associated with these changes, namely (i) the interaction of WCB outflows with the upper troposphere and lower stratosphere (UTLS), (ii) mid-tropospheric diabatic heating, and (iii) the geographical distribution of WCB-related surface precipitation.
5.1 WCB impact on the upper-troposphere flow
When WCBs reach the UTLS region at the end of their ascent, they have the potential to modify the upper-level flow by interacting with the potential vorticity (PV) waveguide (or jet stream). They can initiate Rossby waves (Roethlisberger et al., 2018), amplify upper-level ridges, or contribute to the formation or maintenance of blocks (e.g. Wernli, 1997; Pomroy and Thorpe, 2000; Grams et al., 2011; Pfahl et al., 2015b). In some cases, these local modifications of the upper-level flow can propagate downstream and influence the evolution and the predictability of the weather downstream (Grams et al., 2011, 2018). For a WCB to exert a substantial impact on the upper-level flow, it must reach levels close to the tropopause. Hence, it is physically most elucidating to show the WCB outflow region together with the position of the (dynamical) tropopause, which we here define as the 2 pvu isosurface. This is done in Fig. 11, which includes the zonal mean tropopause position and isentropes, as well as the distribution of the WCB outflow positions for the four different regions (NATL, NPAC, MED, and SATL) and for HIST and RCP8.5.

Figure 11The 50-year mean potential temperature (grey lines) and potential vorticity (2 pvu isolines; black lines), zonally averaged over the four target regions (a) NATL, (b) NPAC, (c) MED, and (d) SATL. For both fields, dashed lines correspond to RCP8.5 and solid lines to HIST. Solid green lines show the normalized frequency (bin size 5∘, 25 hPa) of the WCB air parcels at the end of their ascent for HIST (outermost line for 0.2 % with an increment of 0.2 % for NATL, NPAC, and SATL and 0.3 % for MED). The corresponding effect of climate change on the normalized WCB frequency, RCP8.5 − HIST, is shown in colour shading. All panels are for winter in the corresponding hemisphere, i.e. DJF in (a)–(c) and JJA in (d), and the PV has been multiplied by −1 in SATL.
The isentropes ascend towards the poles, whereas the dynamical tropopause descends from about 100 hPa in the tropics to about 300 hPa in the polar regions, with steep slopes where jet streams are located. Due to the warmer temperatures in RCP8.5, the isentropes are consistently shifted to lower altitudes in the troposphere (dashed grey lines). The tropopause, however, only slightly increases in altitude in the warmer climate (solid and dashed black lines). In HIST, air parcels in the WCB outflows, i.e. at the end of their ascent, reach the UTLS on average at a latitude of ∼45∘ (Fig. 11) for the regions NATL, NPAC, and SATL and ∼50∘ N for MED (see green lines). Interesting is the location of the outflow altitude relative to the dynamical tropopause. Whereas the outflow peak is located below the mean tropopause in NATL and MED, this is not the case for NPAC and SATL. There, the maximum of the outflow is located either very close to the mean tropopause altitude or even within the lower stratosphere. In RCP8.5, all regions experience a poleward and upward shift in the WCB outflows (see colour shading). Given that the dynamical tropopause remains rather unchanged in RCP8.5, this points to WCBs being able to more strongly disturb the upper-level flow, with implications for the formation of intense ridges and blocks, for the downstream weather evolution, and for predictability, as discussed before. This finding is, of course, also consistent with the isentropic level reached at the end of the WCB ascent (see Fig. 8d). For instance, in the NATL the end-of-ascent isentropic level changes (in terms of the median) from ∼313 K in HIST to ∼322 K in RCP8.5, which fairly well matches the isentropic levels in Fig. 11 and supports the finding that the outflow is shifted closer to the tropopause. However, a poleward shift of the ascent region, could also lead to an irrotational outflow closer to the upper-level jet and therefore also modify the upper-level flow. Another important aspect of the shift in the WCB outflow altitude relative to the tropopause concerns the transport of water vapour into the stratosphere. As troposphere-to-stratosphere transport also occurs in the extratropical storm tracks (Škerlak et al., 2014), changes in WCB outflow heights and frequencies in a future climate might also modify the transport of water vapour across the tropopause. A more detailed analysis of this important topic is however out of the scope of this study.
5.2 Mid-tropospheric diabatic heating in WCBs
Figure 12 shows frequency distributions of the location (altitude vs. latitude) of the maximum diabatic heating rate (DHR) occurring in the WCBs as a zonal mean for each of the four regions. Here we consider the change in potential temperature along WCB trajectories as a proxy for the diabatic heating (DHR) rate as the DHR is not available from the model output. The maximum DHR in HIST is located at a height of 600–700 hPa in NATL, NPAC, and MED, whereas it is located at slightly higher altitudes (500–600 hPa) in SATL (see green lines). The change in the position of the maximum DHR from HIST to RCP8.5 is shown in colour. In all considered regions, the maximum in the DHR shifts upward and poleward. Particularly in MED, the latitude of maximum diabatic heating is considerably shifted ∼5∘ northward. In contrast, the vertical shift of maximum diabatic heating is equally pronounced in all regions. The location of maximum heating rises to higher altitudes (lower pressure values). Additionally, we calculated the absolute values of the maximum DHR (see Fig. S5a in the Supplement). The mean maximum values strongly increase by about 2–3 K (6 h)−1 from HIST to RCP8.5, whereas the increase in the upper percentiles of the maximum values is slightly more pronounced with 3–4 K (6 h)−1. This signal is consistent with the increase in precipitation and Δθ along the ascending WCBs, as shown in Fig. 8b and c, and supports the increased diabatic nature of WCBs in RCP8.5. The increase in the maximum DHR and the shift to higher altitudes potentially also have an effect on the intensification of the associated cyclones, caused by changes in the associated diabatic modification of potential vorticity, as discussed in more detail by Binder et al. (2023). On the other hand, changes in the location and amplitude of diabatic heating in the extratropical storm tracks can have an impact on the location of the eddy-driven jet (e.g. Lachmy and Kaspi, 2020), whereas Papritz and Spengler (2015) discussed the importance of mid-tropospheric diabatic heating for the slope of isentropic surfaces as a measure for baroclinicity. They showed that in the upper troposphere, the diabatic heating due to cloud processes is the dominant mechanism maintaining the isentropic slope. The observed changes in the DHR from HIST to RCP8.5 could thus potentially influence the jet location and baroclinicity. A detailed analysis of these effects is however beyond the scope of this work.
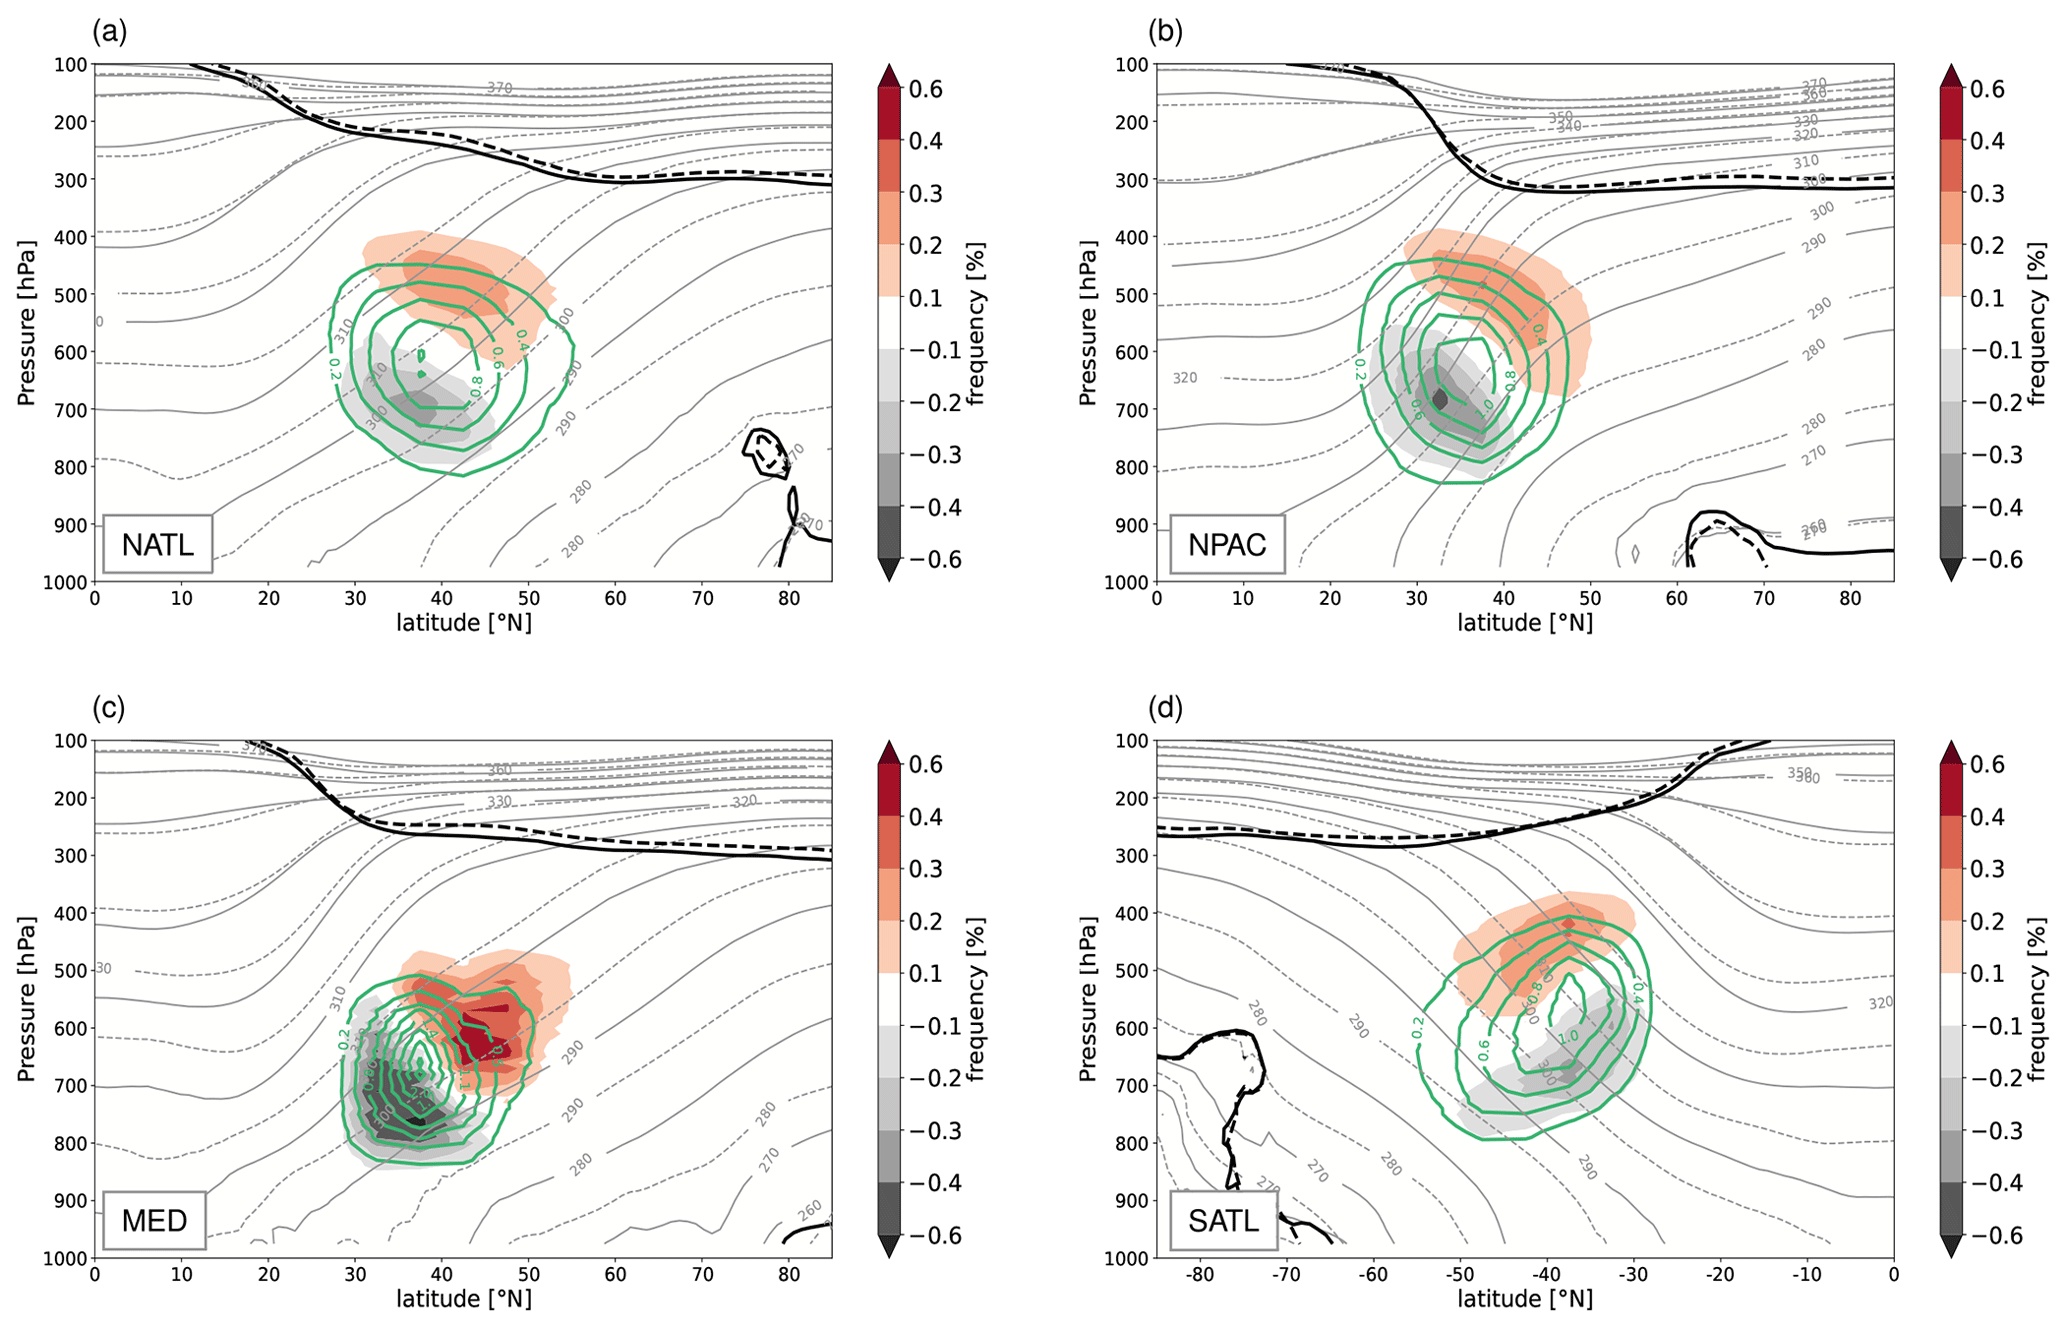
Figure 12The 50-year mean potential temperature (grey lines) and potential vorticity (2 pvu isolines; black lines), zonally averaged over the four target regions (a) NATL, (b) NPAC, (c) MED, and (d) SATL. Dashed lines correspond to RCP8.5 and solid lines to HIST. Solid green lines show the normalized frequency (bin size 5∘, 25 hPa) distribution of the WCB air parcels during the time of maximum diabatic heating for HIST (outermost line for 0.2 % with an increment of 0.2 % for NATL, NPAC, and SATL and 0.3 % for MED). The climate change effect of the distribution of maximum latent heating, RCP8.5 − HIST, is shown in colour shading. All panels are for winter in the corresponding hemisphere, i.e. DJF in (a)–(c) and JJA in (d), and the PV has been multiplied by −1 in SATL.
In summer, the position of the maximum DHR along WCBs is located slightly higher than in winter; however a very similar upward and poleward shift from HIST to RCP8.5 in the maximum DHR is observed as in winter (not shown). The absolute values of the maximum DHR are higher compared to winter, whereby the changes in the upper percentiles are even more pronounced in the future climate (see Fig. S5b).
5.3 Geographical distribution of WCB-related precipitation
In Figs. 8c and 9c, it has been shown that the WCB-related precipitation increases in RCP8.5 and the most pronounced change from HIST to RCP8.5 is seen in the upper percentiles. In Fig. 13 we therefore depict in more detail the geographical distribution of total precipitation and its changes in the RCP8.5 simulation, as well as the WCB-related precipitation and its changes in RCP8.5. In Fig. 13a, the 50-year climatology of total precipitation is shown for DJF. Precipitation maxima occur over the inter-tropical convergence zone as well as in the main storm track regions and at high mountain ranges (e.g. Rocky Mountains, west coast of Norway). In the North Atlantic and North Pacific, precipitation is highest in the centre of the storm tracks, whereas in the Southern Hemisphere storm tracks, a poleward decrease in precipitation occurs with exceptions for areas with high mountain ranges. Figure 13b shows the difference in total precipitation (RCP8.5 − HIST). In the North Pacific storm track, total precipitation increases in the northern part, whereas a decrease is discernible in the southern part. In the North Atlantic, precipitation increases in the southwestern and northeastern part of the storm track and decreases south and west of Iceland as well as over the eastern Mediterranean. In the Southern Hemisphere, precipitation increases over most parts of the storm tracks, with exceptions east of Madagascar and in the central South Pacific. The changes in total precipitation shown here for RCP8.5 are very similar to changes found in other CESM1 simulations (e.g. Meehl et al., 2013) or in CMIP5 multi-model mean precipitation (e.g. Knutti and Sedlácek, 2012; Giorgi et al., 2019).
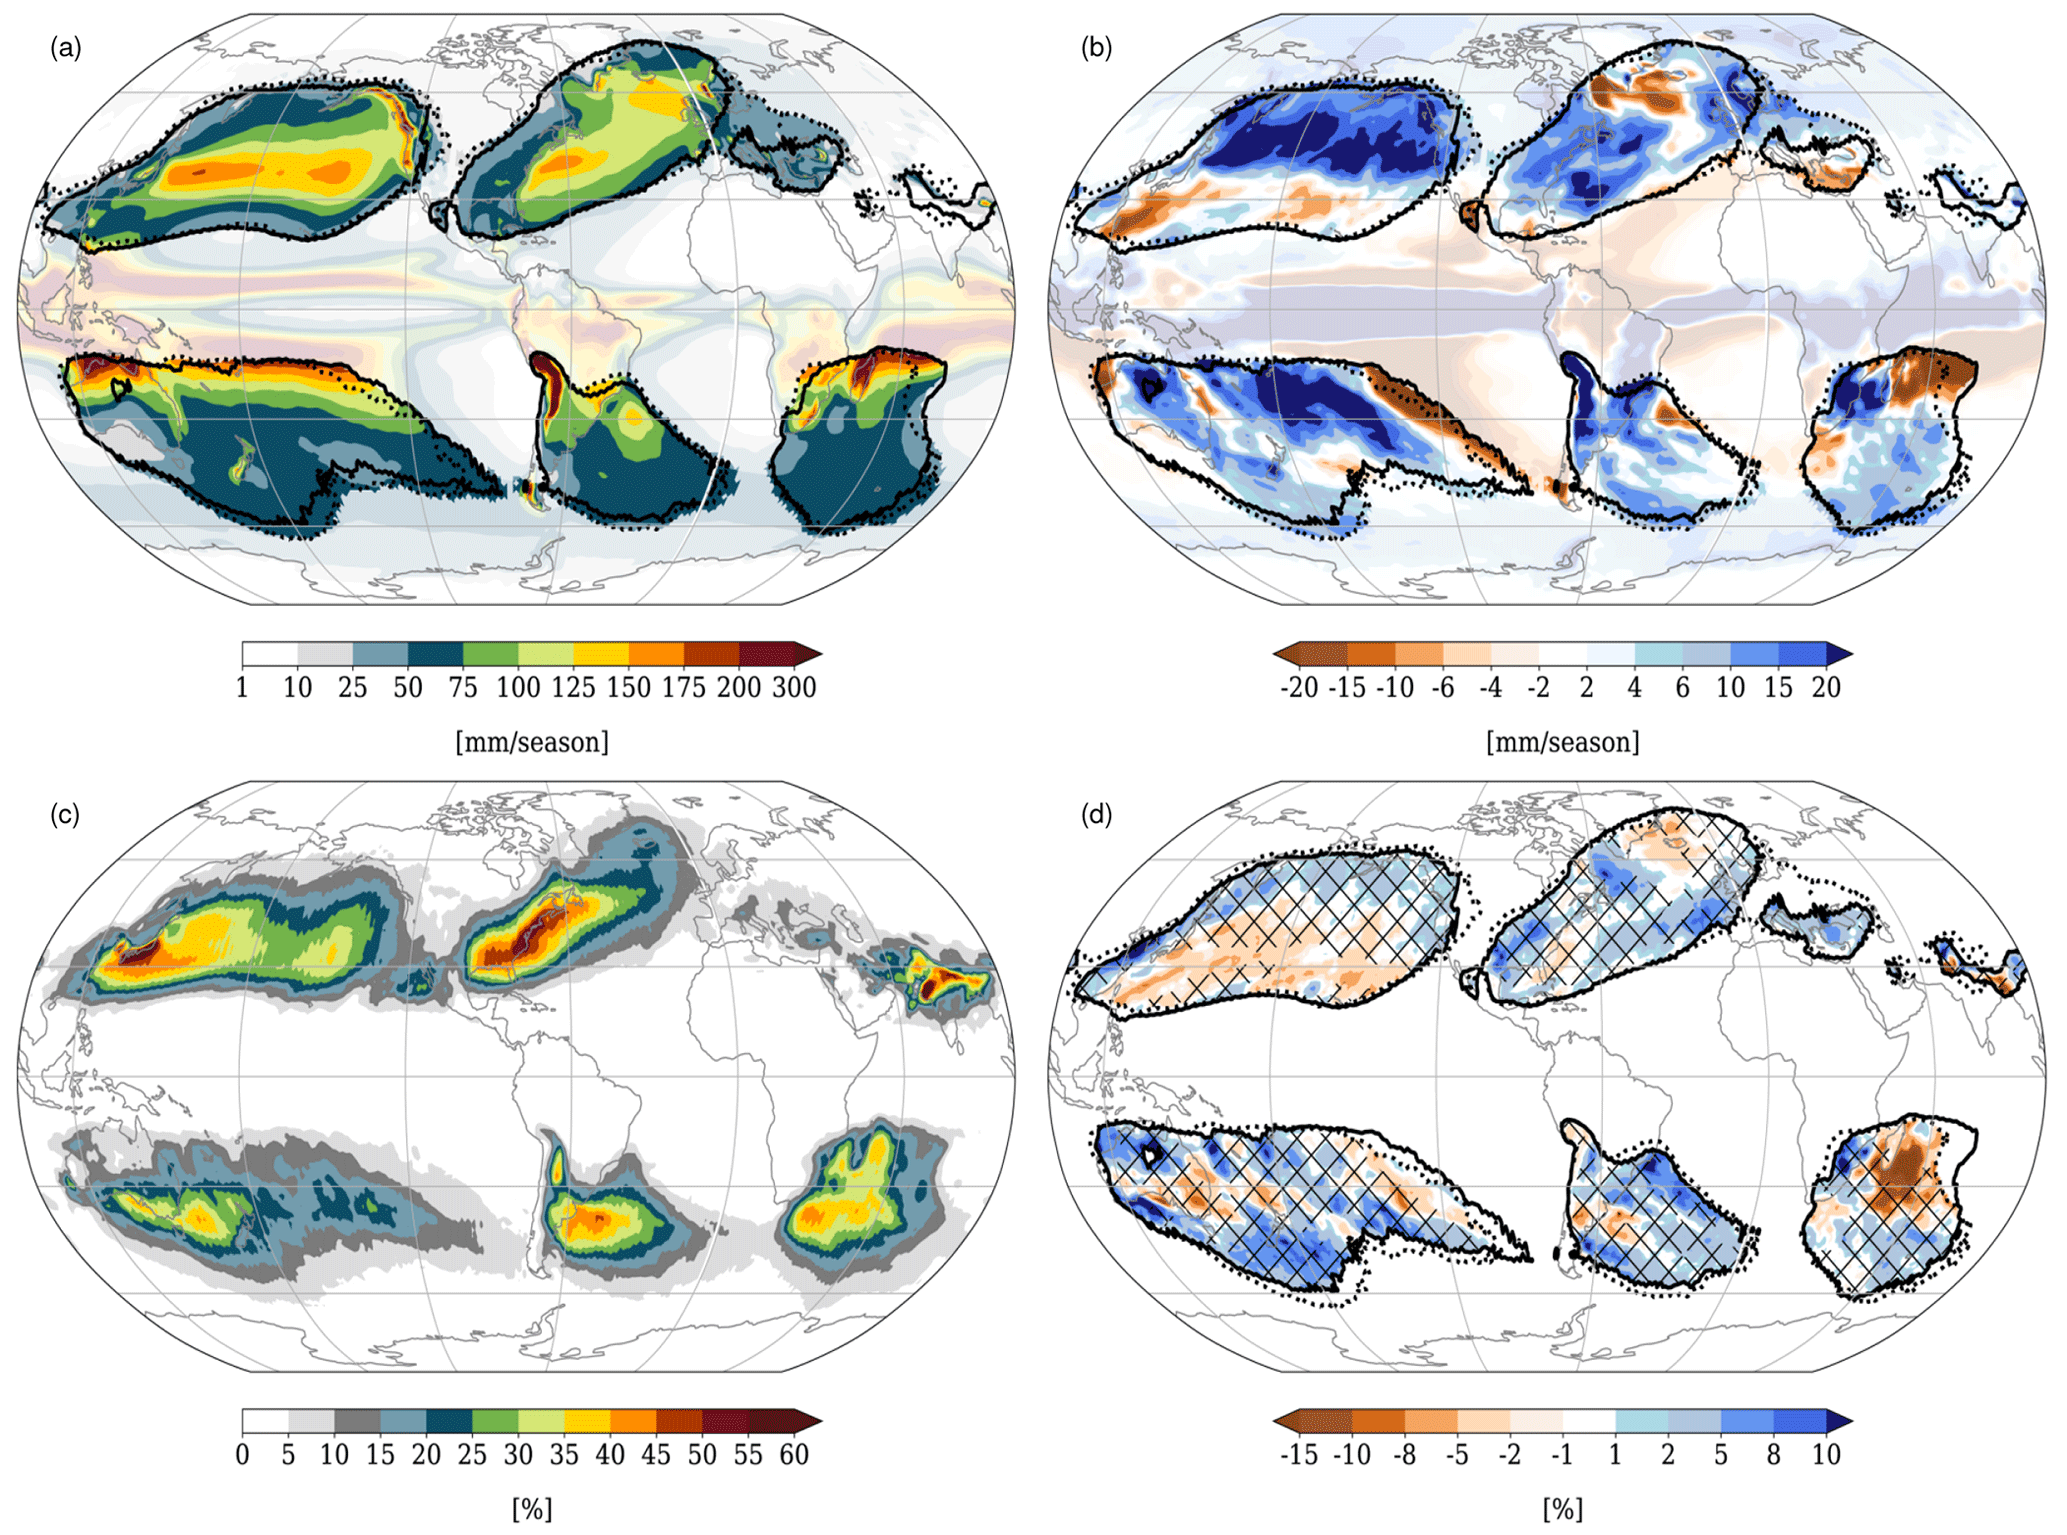
Figure 13(a) The 50-year climatology of total precipitation in DJF (in mm per 3 months) for HIST, (b) difference in total precipitation between RCP8.5 and HIST, (c) percentage of precipitation that is linked to WCBs in DJF, and (d) difference of RCP8.5 minus HIST for percentage of DJF precipitation linked to WCBs. Solid and dashed black lines denote the 1 % occurrence frequencies of WCB inflow and ascent (i.e. while the air parcels are located below 400 hPa). Hatched regions show where there is an increase in total precipitation; thus they correspond to the blue colours in (b). Fields are shown in pale colour (a, b) and not shown (c, d) in all regions where the occurrence frequencies of WCBs in the inflow and ascent phase are less than 1 %.
Figure 13c shows the percentage of total precipitation linked to WCBs. In order to attribute the precipitation to WCBs, we mask all grid points that are part of the ascent phase of a WCB. More precisely, we select all longitude–latitude positions along the WCB trajectories, as long as the WCB is still in its ascent phase with pressure values larger than 400 hPa. These positions are then interpolated to a regular grid. We thus obtain 2D masks for every 6 h time step, which contain all grid points that are part of an ascending WCB. The precipitation that occurs at these grid points is defined to be linked to WCBs. In the storm track regions, where the frequency of WCB occurrence is also highest (see Fig. 4a and b), WCBs are responsible for up to 50 % of precipitation, and in the eastern North Atlantic, close to Iceland, they are still responsible for ∼25 %. In the Southern Hemisphere more than 50 % of the total precipitation is associated with WCBs downstream of South America, Africa, and Australia. This result is in very good agreement with the one presented in Pfahl et al. (2014). There, it was investigated how much precipitation can be attributed to WCBs in the ERA-Interim data set, and it was found that in DJF more than 60 % of total precipitation is associated with WCBs in the main storm track regions (see their Fig. 7b). These results also confirm that the CESM model is able to reasonably capture the integrated effect of dynamical and microphysical processes that lead to precipitation.
The difference in the percentage of WCB-related precipitation between RCP8.5 and HIST is shown in Fig. 13d but only in regions where the occurrence frequencies of WCBs in their inflow and ascent areas exceed 1 % (solid and dashed black lines). The hatched areas highlight regions where there is an increase in total precipitation in RCP8.5 (corresponding to blue colours in Fig. 13b). Changes in the percentage of WCB-related precipitation can occur because in a certain region the frequency of WCBs changes or because a WCB can become more or less effective in the formation of precipitation. Overall, the changes in WCB-related precipitation are small. In some regions, like in the North Pacific, at the US east coast, or on the polar side of the Southern Hemisphere storm track, an increase in total precipitation together with an increase in the WCB-related precipitation is observed. As mentioned above, this signal can be caused by the increased inflow moisture of WCBs, by an increased occurrence frequency of WCBs, or by an interplay of both effects. However, in these regions the potential for WCB-related extreme precipitation might be increased in RCP8.5. In other regions, e.g. close to Iceland or Madagascar, a decrease in WCB-related precipitation might be caused by a decrease in the occurrence frequencies. The most important changes in WCB-related precipitation are, however, already shown in Figs. 8c, 9c, and 10, where it can be seen that the overall amount of precipitation integrated along a WCB increases in RCP8.5, especially in the upper percentiles. This points to a potential increase in extreme precipitation events linked to WCBs in a warmer world.
In this study we made use of 50 years of present-day (1990–1999) and future (RCP8.5 scenario; 2091–2100) simulations with the CESM1 climate model. Thanks to the availability of 6-hourly three-dimensional fields at ∼1∘ spatial resolution, it was possible to identify, for the first time, WCBs in climate simulations using a detailed Lagrangian approach. This allowed assessing if WCBs can reasonably be represented in climate models and determining if their frequency of occurrence, geographical distribution, and characteristics change in the warmer climate, according to our RCP8.5 simulations. The WCBs are identified based on a Lagrangian diagnostic: (i) kinematic air parcel trajectories are released equidistantly (80 km mesh size) and at a 6-hourly time interval in the near-surface layer (up to 790 hPa) over the whole globe; (ii) an ascent criterion of 600 hPa within 48 h is then applied to capture the WCB ascent, and it is verified that the ascent occurs close to an extratropical cyclone. The resulting 50-year climatologies of WCBs in HIST and RCP8.5 build the basis of this study. They are also compared to an existing 37-year climatology of WCBs based on ERA-Interim (1980–2018). Based on these data sets and closing the circle on the research questions raised in the Introduction, the main results of the study can be summarized as follows:
-
The climate simulation HIST produces frequency maps of WCB occurrence that capture many hotspots that have previously been identified in reanalysis data sets (e.g. ERA-Interim). In particular, WCB hotspots occur in the North Atlantic and North Pacific storm track regions and similarly in the storm track of the Southern Ocean. Also the seasonal cycle and the frequency amplitudes are comparable to ERA-Interim. Secondary WCB peaks are also captured, e.g. in the Mediterranean. Finally, also the globally averaged ascent behaviour (pressure evolution as a function of time) of the HIST WCBs is remarkably similar to the ERA-Interim one. Still, local discrepancies exist between the climate simulations and the reanalysis data. This, however, must be expected due to natural variability and the comparatively short time periods available for comparison. Because all of the discrepancies look physically plausible, we assume that CESM1 is able to realistically represent WCBs.
-
In a future (RCP8.5) climate the main WCB frequency hotspots remain similar to the ones for the present-day (HIST) climate, both in winter and in summer. Still, some geographical shifts in the frequency patterns are discernible, in addition to an overall increased amplitude (number of WCB trajectories) in RCP8.5. For instance, the WCB inflow regions in boreal winter (DJF) are systematically shifted towards the north in the western North Pacific. In the North Atlantic storm track region, the shift takes rather the form of a southwest–northeast dipole, with increased frequencies in the southwestern North Atlantic and a decrease in the northeast, south of Iceland. An increase is also seen in the South Atlantic, east of South America. Of course, all these signals spatially spread out considerably during the WCB ascent and particularly until their outflow reaches near-tropospheric levels. In boreal summer (JJA), the shifts in the Northern Hemisphere are weaker, and an additional signal occurs over the North American continent; in the Southern Hemisphere, the South Atlantic shift remains, and a band of enhanced WCB inflow frequencies spans to the east up to Australia. Only some of the climate change shifts in WCB frequencies can be explained by corresponding changes in cyclone frequencies. This indicates that the WCB changes cannot solely be attributed to cyclone frequency changes but that other dynamical and thermodynamical factors determining the WCB efficiency of extratropical cyclones must also be taken into account.
-
The globally averaged ascent behaviour of all WCBs remains rather similar in RCP8.5 compared to HIST, but significant differences in WCB characteristics emerge if regional WCB hotspots (North Atlantic, North Pacific, Mediterranean, South Atlantic) are considered. The inflow moisture for all these regions is considerably enhanced, which consistently also leads to enhanced 48 h accumulated precipitation integrated along the WCB. The enhanced precipitation, in turn, is associated with correspondingly enhanced diabatic heating rates (changes in potential temperature) in the mid-troposphere and – consistently – higher potential temperatures at the end of the WCB ascent, when the air parcels reach the UTLS. These climate-change-related effects are discernible in winter and (with partly larger amplitudes) also in summer. A statistically more refined analysis of the changes in the accumulated precipitation emphasizes that climate change in particular affects extreme values of WCB-related precipitation, consistently in all considered regions. A geographical analysis of changes in WCB-related precipitation shows that the percentage of precipitation associated with WCBs increases in large parts of the storm tracks where total precipitation also increases in a future climate, pointing towards an increased efficiency of WCBs in precipitation formation. However, in some regions the percentage of WCB-related precipitation is decreasing despite an increase in total precipitation. Whether the increase in WCB-related precipitation is caused by an increased occurrence frequency of WCBs or by the higher moister content or both cannot be disentangled in this study.
-
The more diabatic nature of WCBs in our RCP8.5 simulations leads to two important inferences. (i) The WCB outflow in RCP8.5 is shifted upward and closer to the tropopause in all considered regions. WCBs therefore have an increased potential to disturb the upper-level waveguide and the downstream flow evolution. (ii) The maximum in the diabatic heating rate is shifted slightly poleward and upward and increases in amplitude, which can have an impact on the restoration of baroclinicity and influence the jet location.
This study focuses on a weather-system-based perspective on climate change; i.e. WCBs were identified as a specific synoptic-scale weather system, and then, based on these distinct features, climatological aspects (WCB frequencies, characteristics, and impacts) were discussed. Such an approach, in comparison to more field-based approaches (e.g. by considering geopotential variability), has already successfully been applied for other weather systems, most prominently for extratropical cyclones and atmospheric blocks.
In several studies, the response of extratropical cyclones to climate change as well as the representation of cyclone structure in climate models has been investigated based on a weather-system perspective. To this aim, extratropical cyclones have been identified and tracked in global climate models or aquaplanet simulations and their structure has been evaluated. While the overall structure of extratropical cyclones is represented well in climate models (Catto et al., 2019), problems still exist, e.g. in the representation of precipitation (Hawcroft et al., 2016) and diabatic processes (Hawcroft et al., 2017); the link between cyclone dynamics and clouds (Govekar et al., 2014); and the relative humidity distribution in the WCB, which is linked to the isentropic ascent (Catto et al., 2010). Future climate simulations predict changes in the wind speed in the warm sector of cyclones (Priestley and Catto, 2022), whereas Dolores-Tesillos et al. (2022) link these changes to enhanced diabatic heating, which in turn leads to an amplified low-level PV anomaly and a change in the upper-level dipole PV anomaly. This is consistent with findings by Binder et al. (2023), who, in the same RCP8.5 simulations as used here, also detect a stronger diabatic PV production in WCBs that in turn leads to enhanced cyclone deepening rates and a stronger intensity of the strongest cyclones. For a detailed description of the response of extratropical cyclones to climate change, also from a weather-system perspective, the reader is referred to Catto et al. (2019).
Another important weather system in the extratropics comprises atmospheric blocks because they can be linked to extreme weather like cold spells (e.g. Sillmann et al., 2011; Bieli et al., 2015), heat waves (Quandt et al., 2019), and heavy-precipitation events (e.g. Martius et al., 2013; Kautz et al., 2022). However, so far, the confidence in projected changes in atmospheric blocking is low as different physical mechanisms determine the whole blocking life cycle (Woollings et al., 2018). As WCB outflows are associated with low PV values and can therefore modify the upper-level flow, they can play an important role in the initiation and/or maintenance of atmospheric blocks (Pfahl et al., 2015a; Steinfeld and Pfahl, 2019; Steinfeld et al., 2020). As WCBs become more diabatic in a future climate (see Fig. 8c) and their ascent is located at higher altitudes/isentropes in RCP8.5, it would be interesting to investigate in more detail the impact of WCBs on blocks in a future climate. Steinfeld et al. (2022) already showed that the frequency of WCBs in blocking anticyclones is expected to increase by 15 % in a RCP8.5 climate, but the detailed link between WCBs and blocking characteristics remains unclear. Thus a more detailed analysis of the interplay of WCBs and blocking could lead to an improved physical understanding of these phenomena. More generally, the weather-system perspective presented here would be an option to gain more insight into the underlying physical processes.
Furthermore, other weather features like the jet stream, Rossby waves, or Rossby-wave-breaking events are important for surface weather in the mid-latitudes. Extending the weather-system perspective and its connection to WCBs in present-day and future climate simulations could, therefore, also lead to an improved understanding of the underlying physical mechanisms and their change in a warmer climate.
The current study comes with some caveats, the most restrictive ones related to the use of only one climate model and to the small sample size (50 years) of the CESM simulations. This does not allow for a robust statistical analysis of the differences in WCB occurrence between the present-day and the future climate and – similarly – the corresponding comparison between the present-day climate and ERA-Interim data. For instance, we cannot ultimately determine whether a regional difference between ERA-Interim and HIST reflects a systematic bias between the two data sets or whether it only reflects natural variability. A robust statistical analysis would require about 1000 years (seasons) of CESM simulations to cover the full spectrum of seasonal WCB frequencies in the CESM climate. ERA-Interim, as one realization of nature, would then have to be placed in comparison to this CESM distribution. If the ERA-Interim realization, at a specific region, falls well within the CESM distribution, it (or the ERA-Interim realization) can be assumed to be physically consistent. On the other hand, if the ERA-Interim realization lies at the extreme borders of the CESM distribution, we would have to assume that CESM exhibits a systematic bias in the WCB frequencies due to deficiencies in capturing the essential WCB-related physics. An analogue statistical analysis would be required to assess the significance of differences between present-day and future WCB maps. Such a refined statistical analysis would be very welcome, but it is computationally still prohibitive because of the high cost of trajectory calculations. As an alternative and to overcome this limitation, one could try to identify WCBs in climate models based on their Eulerian fingerprints (Quinting and Grams, 2021; Wandel et al., 2021). This, however, comes with its own caveats, e.g. by not allowing the determination of several important WCB characteristics (latent heating, outflow height, etc.). Despite this limitation of the study, we think that all patterns found are physically plausible and thus should be taken as reasonable first estimates of how climate change impacts WCBs.
In summary, the current study points to potential changes in WCB frequencies, intensities, and characteristics in a warmer climate. In addition, some WCB impacts (precipitation, diabatic heating, WCB–jet interaction) have also been shown to be potentially affected by climate change in specific regions. In a forthcoming study, we intend to extend this WCB-impact aspect with an even broader and more systematic perspective, by following the methodology developed in Joos (2019). In particular, it will be rewarding to see how WCBs influence the surface energy balance. We trust that this weather-feature-based approach to understanding climate change and its impacts will become a fruitful and important contribution to climate science.
The WCB and cyclone data for CESM and ERA-Interim are available from the authors upon request.
The supplement related to this article is available online at: https://doi.org/10.5194/wcd-4-133-2023-supplement.
UB provided the CESM simulations, and MS calculated the basic WCB trajectory climatologies based on CESM. HJ, HB, and MS performed the global and regional WCB analysis of the study. MS, HJ, and HW conceptually developed the study. All authors contributed to the writing.
At least one of the (co-)authors is a member of the editorial board of Weather and Climate Dynamics. The peer-review process was guided by an independent editor, and the authors also have no other competing interests to declare.
Publisher's note: Copernicus Publications remains neutral with regard to jurisdictional claims in published maps and institutional affiliations.
We thank the reviewers for their constructive comments and MeteoSwiss for providing access to the ERA-Interim data set. We are grateful to Matthias Röthlisberger for help with the CESM data and for fruitful discussions on their statistical significance and to Katharina Heitmann for helping to improve the quality of the figures.
This research has been supported by the Schweizerischer Nationalfonds zur Förderung der Wissenschaftlichen Forschung (project 185049) and the H2020 European Research Council (INTEXseas, grant no. 787652).
This paper was edited by Juliane Schwendike and reviewed by two anonymous referees.
Bader, M. J., Forbes, G. S., Grant, J. R., Lilley, R. B. E., and Waters, A. J.: Images in weather forecasting. A practical guide for interpreting satellite and radar imagery, Cambridge University Press, Cambridge, ISBN 10:0521451116, ISBN 13:9780521451116, 1995. a
Bieli, M., Pfahl, S., and Wernli, H.: A Lagrangian investigation of hot and cold temperature extremes in Europe, Q. J. Roy. Meteorol. Soc., 141, 98–108, https://doi.org/10.1002/qj.2339, 2015. a
Binder, H., Boettcher, M., Joos, H., and Wernli, H.: The Role of Warm Conveyor Belts for the Intensification of Extratropical Cyclones in Northern Hemisphere Winter, J. Atmos. Sci., 73, 3997–4020, https://doi.org/10.1007/s00382-015-2863-z, 2016. a
Binder, H., Joos, H., Sprenger, M., and Wernli, H.: Warm conveyor belts in present-day and future climate simulations – Part 2: Role of potential vorticity production for cyclone intensification, Weather Clim. Dynam., 4, 19–37, https://doi.org/10.5194/wcd-4-19-2023, 2023. a, b
Bony, S., Stevens, B., Frierson, D., Shepherd, T. G., Sherwood, S. C., Siebesma, A. P., Sobel, A. H., Watanabe, M., and Webb, M. J.: Clouds, circulation and climate sensitivity, Nat. Geosci., 8, 75–96, https://doi.org/10.1007/s00703-001-0592-9, 2015. a, b, c
Browning, K. A. and Emanuel, K. A.: Organization and Internal Structure of Synoptic and Mesoscale Precipitation Systems in Midlatitudes, in: Radar in Meteorology, edited by: Atlas, D., American Meteorological Society, Boston, MA, https://doi.org/10.1007/978-1-935704-15-7_33, 1990. a, b
Browning, K. A., Hardman, M. E., Harrold, T. W., and Pardoe, C. W.: The structure of rainbands within a mid-latitude depression, Q. J. Roy. Meteorol. Soc., 99, 215–231, https://doi.org/10.1002/qj.49709942002, 1973. a
Catto, J. L., Shaffrey, L. C., and Hodges, K. I.: Can climate models capture the structure of extratropical cyclones?, J. Climate, 23, 1621–1635, https://doi.org/10.1175/2009JCLI3318.1, 2010. a
Catto, J. L., Ackerley, D., Booth, J. F., CHampion, A. J., Colle, B. A., Pfahl, S., Pinot, J. G., Quinting, J. F., and Seiler, C.: The future of midlatitude cyclones, Curr. Clim. Change. Rep., 5, 407–420, https://doi.org/10.1007/s40641-019-00149-4, 2019. a, b
Davies, H. C.: The quasigeostrophic omega equation: Reappraisal, refinements, and relevance, Mon. Weather Rev., 143, 3–25, https://doi.org/10.1175/MWR-D-14-00098.1, 2015. a
Dee, D. P., Uppala, S. M., Simmons, A. J., Berrisford, P., Poli, P., Kobayashi, S., Andrae, U., Balmaseda, M. A., Balsamo, G., Bauer, P., Bechtold, P., Beljaars, A. C. M., van de Berg, L., Bidlot, J., Bormann, N., Delsol, C., Dragani, R., Fuentes, M., Geer, A. J., Haimberger, L., Healy, S. B., Hersbach, H., Hólm, E. V., Isaksen, L., Kållberg, P., Köhler, M., Matricardi, M., McNally, A.P., Monge-Sanz, B. M., Morcrette, J.-J., Park, B.-K., Peubey, C., de Rosnay, P., Tavolato, C., Thépaut, J.-N., and Vitart, F.: The ERA-Interim reanalysis: Configuration and performance of the data assimilation system, Q. J. Roy. Meteorol. Soc., 137, 553–597, https://doi.org/10.1002/qj.828, 2011. a
Dolores-Tesillos, E., Teubler, F., and Pfahl, S.: Future changes in North Atlantic winter cyclones in CESM-LE – Part 1: Cyclone intensity, potential vorticity anomalies, and horizontal wind speed, Weather Clim. Dynam., 3, 429–448, https://doi.org/10.5194/wcd-3-429-2022, 2022. a
Giorgi, F., Raffaele, F., and Coppola, E.: The response of precipitation characteristics to global warming from climate projections, Earth Syst. Dynam., 10, 73–89, https://doi.org/10.5194/esd-10-73-2019, 2019. a
Govekar, P. D., Jakob, C., and Catto, J.: The relationship between clouds and dynamics in Southern Hemisphere extratropical cyclones in the real world and a climate model, J. Geophys. Res., 119, 6609–6628, https://doi.org/10.1002/2013JD020699, 2014. a
Grams, C. M., Wernli, H., Böttcher, M., Čampa, J., Corsmeier, U., Jones, S. C., Keller, J. H., Lenz, C.-J., and Wiegand, L.: The key role of diabatic processes in modifying the upper-tropospheric wave guide: a North Atlantic case-study, Q. J. Roy. Meteorol. Soc., 137, 2174–2193, https://doi.org/10.1002/qj.891, 2011. a, b, c
Grams, C. M., Magnusson, L., and Madonna, E.: An atmospheric dynamics perspective on the amplification and propagation of forecast error in numerical weather prediction models: A case study, Q. J. Roy. Meteorol. Soc., 144, 2577–2591, https://doi.org/10.1002/qj.3353, 2018. a, b
Hawcroft, M., Dacre, H., Forbes, R., Hodges, K., Shaffrey, L., and Stein, T.: Using satellite and reanalysis data to evaluate the representation of latent heating in extratropical cyclones in a climate model, Clim. Dynam., 48, 2255–2278, https://doi.org/10.1007/s00382-016-3204-6, 2017. a
Hawcroft, M. K., Shaffrey, L. C., Hodges, K. I., and Dacre, H. F.: Can climate models represent the precipitation associated with extratropical cyclones?, Clim. Dynam., 47, 679–695, https://doi.org/10.1007/s00382-015-2863-z, 2016. a
Hoskins, B. J., McIntyre, M. E., and Robertson, A. W.: On the use and significance of isentropic potential vorticity maps, Q. J. Roy. Meteorol. Soc., 111, 877–946, https://doi.org/10.1002/qj.49711147002, 1985. a, b
Hurrell, J. W., Holland, M. M., Gent, P. R., Ghan, S., Kay, J. E., Kushner, P. J., Lamarque, J.-F., Large, W. G., Lawrence, D., Lindsay, K., Lipscomb, W. H., Long, M. C., Mahowald, N., Marsh, D. R., Neale, R. B., Rasch, P., Vavrus, S., Vertenstein, M., Bader, D., Collins, W. D., Hack, J. J., Kiehl, J., and Marshall, S.: The Community Earth System Model: A Framework for Collaborative Research, B. Am. Meteorol. Soc., 94, 1339–1360, https://doi.org/10.1175/BAMS-D-12-00121.1, 2013. a
Joos, H.: Warm Conveyor Belts and Their Role for Cloud Radiative Forcing in the Extratropical Storm Tracks, J. Climate, 32, 5325–534, https://doi.org/10.1175/JCLI-D-18-0802.1, 2019. a, b, c
Joos, H. and Wernli, H.: Influence of microphysical processes on the potential vorticity development in a warm conveyor belt: a case-study with the limited-area model COSMO, Q. J. Roy. Meteorol. Soc., 138, 407–418, https://doi.org/10.1002/qj.934, 2012. a
Kautz, L.-A., Martius, O., Pfahl, S., Pinto, J. G., Ramos, A. M., Sousa, P. M., and Woollings, T.: Atmospheric blocking and weather extremes over the Euro-Atlantic sector – a review, Weather Clim. Dynam., 3, 305–336, https://doi.org/10.5194/wcd-3-305-2022, 2022. a
Kay, J. E., Deser, C., Phillips, A., Mai, A., Hannay, C., Strand, G., Arblaster, J. M., Bates, S. C., Danabasoglu, G., Edwards, J., Holland, M., Kushner, P., Lamarque, J.-F., Lawrence, D., Lindsay, K., Middleton, A., Munoz, E., Neale, R., Oleson, K., Polvani, L., and Vertenstein, M.: The Community Earth System Model (CESM) Large Ensemble Project: A Community Resource for Studying Climate Change in the Presence of Internal Climate Variability, B. Am. Meteorol. Soc., 96, 1333–1349, https://doi.org/10.1175/BAMS-D-13-00255.1, 2015. a, b
Knutti, R. and Sedlácek, J.: Robustness and uncertainties in the new CMIP5 climate model projections, Nat. Clim. Change, 3, 369–373, https://doi.org/10.1038/nclimate1716, 2012. a
Lachmy, O. and Kaspi, Y.: The Role of Diabatic Heating in Ferrel Cell Dynamics, Geophys. Res. Lett., 47, e2020GL090619, https://doi.org/10.1029/2020GL090619, 2020. a
Madonna, E., Wernli, H., Joos, H., and Martius, O.: Warm conveyor belts in the era-interim dataset (1979–2010). part I: climatology and potential vorticity evolution, J. Climate, 27, 3–26, https://doi.org/10.1175/JCLI-D-12-00720.1, 2014. a, b, c, d, e, f, g, h
Martius, O., Sodemann, H., Joos, H., Pfahl, S., Winschall, A., Croci-Maspoli, M., Graf, M., Madonna, E., Mueller, B., Schemm, S., Sed'aček, J., Sprenger, M., and Wernli, H.: The role of upper-level dynamics and surface processes for the Pakistan flood of July 2010, Q. J. Roy. Meteorol. Soc., 139, 1780–1797, https://doi.org/10.1002/qj.2082, 2013. a
Meehl, G. A., Washington, W. M., Arblaster, J. M., Hu, A., Teng, H., Kay, J. E., Gettelman, A., Lawrence, D. M., Sanderson, B. M., and Strand, W. G.: Climate Change Projections in CESM1 (CAM5) Compared to CCSM4, J. Climate, 26, 6287–6308, https://doi.org/10.1175/JCLI-D-12-00572.1, 2013. a
Oertel, A., Boettcher, M., Joos, H., Sprenger, M., Konow, H., Hagen, M., and Wernli, H.: Convective activity in an extratropical cyclone and its warm conveyor belt – a case-study combining observations and a convection-permitting model simulation, Q. J. Roy. Meteorol. Soc., 145, 1406–1426, https://doi.org/10.1002/qj.3500, 2019. a, b
Papritz, L. and Spengler, T.: Analysis of the slope of isentropic surfaces and its tendencies over the North Atlantic, Q. J. Roy. Meteorol. Soc., 141, 3226–3238, https://doi.org/10.1002/qj.2605, 2015. a
Pfahl, S., Madonna, E., Boettcher, M., Joos, H., and Wernli, H.: Warm conveyor belts in the ERA-Interim dataset (1979–2010). Part II: Moisture origin and relevance for precipitation, J. Climate, 27, 27–40, https://doi.org/10.1175/JCLI-D-13-00223.1, 2014. a, b
Pfahl, S., Schwierz, C., Croci-Maspoli, M., Grams, C., and Wernli, H.: Importance of latent heat release in ascending air streams for atmospheric blocking, Nat. Geosci., 8, 610–614, https://doi.org/10.1038/ngeo2487, 2015a. a
Pfahl, S., Schwierz, C., Croci-Maspoli, M., Grams, C. M., and Wernli, H.: Importance of latent heat release in ascending air streams for atmospheric blocking, Nat. Geosci., 8, 610–614, https://doi.org/10.1038/ngeo2487, 2015b. a
Pomroy, H. R. and Thorpe, A. J.: The Evolution and Dynamical Role of Reduced Upper-Tropospheric Potential Vorticity in Intensive Observing Period One of FASTEX, Mon. Weather Rev., 128, 1817–1834, https://doi.org/10.1175/1520-0493(2000)128<1817:TEADRO>2.0.CO;2, 2000. a
Priestley, M. D. K. and Catto, J. L.: Future changes in the extratropical storm tracks and cyclone intensity, wind speed, and structure, Weather Clim. Dynam., 3, 337–360, https://doi.org/10.5194/wcd-3-337-2022, 2022. a, b
Quandt, L.-A., Keller, J. H., Martius, O., Pinto, J. G., and Jones, S. C.: Ensemble Sensitivity Analysis of the Blocking System over Russia in Summer 2010, Mon. Weather Rev., 147, 657–675, https://doi.org/10.1175/MWR-D-18-0252.1, 2019. a
Quinting, J. F. and Grams, C. M.: Toward a Systematic Evaluation of Warm Conveyor Belts in Numerical Weather Prediction and Climate Models. Part I: Predictor Selection and Logistic Regression Model, J. Atmos. Sci., 78, 1465–1485, https://doi.org/10.1175/JAS-D-20-0139.1, 2021. a
Roberts, M., Camp, J., Seddon, J., Vidale, P., Hodges, K., Vannière, B., Mecking, J., Haarsma, R., Bellucci, A., Scoccimarro, E., Caron, L.-P., Chauvin, F., Terray, L., Valcke, S., Moine, M.-P., Putrasahan, D., Roberts, C., Senan, R., Zarzycki, C., Ullrich, P., Yamada, Y., Mizuta, R., Kodama, C., Fu, D., Zhang, Q., Danabasoglu, G., Rosenbloom, N., Wang, H., and Wu, L.: Projected Future Changes in Tropical Cyclones Using the CMIP6 HighResMIP Multimodel Ensemble, Geophys. Res. Lett., 47, e2020GL088662, https://doi.org/10.1029/2020GL088662, 2020. a
Rodwell, M., Forbes, R., and Wernli, H.: Why warm conveyor belts matter in NWP, ECMWF Newslett., 154, 21–28, https://doi.org/10.21957/mr20vg, 2018. a
Roethlisberger, M., Martius, O., and Wernli, H.: Northern Hemisphere Rossby wave initiation events on the extratropical jet – a climatological analysis, J. Climate, 31, 743–760, https://doi.org/10.1175/JCLI-D-17-0346.1, 2018. a
Schemm, S., Sprenger, M., and Wernli, H.: When during Their Life Cycle Are Extratropical Cyclones Attended by Fronts?, B. Am. Meteorol. Soc., 99, 149–165, https://doi.org/10.1175/BAMS-D-16-0261.1, 2018. a
Shaw, T. A., Baldwin, M., Barnes, E. A., Caballero, R., Garfinkel, C. I., Hwang, Y.-T., Li, C., O'Gorman, P. A., Rivière, G., Simpson, I. R., and Voigt, A.: Storm track processes and the opposing influences of climate change, Nat. Geosci., 9, 656–664, https://doi.org/10.1038/NGEO2783, 2016. a
Sillmann, J., Croci-Maspoli, M., Kallache, M., and Katz, R. W.: Extreme cold winter temperatures in Europe under the influence of North Atlantic blocking, J. Climate, 24, 5899–5913, https://doi.org/10.1175/2011JCLI4075.1, 2011. a
Škerlak, B., Sprenger, M., and Wernli, H.: A global climatology of stratosphere–troposphere exchange using the ERA-Interim data set from 1979 to 2011, Atm. Chem. Phys., 14, 913–937, https://doi.org/10.5194/acp-14-913-2014, 2014. a
Sprenger, M. and Wernli, H.: The Lagrangian analysis tool LAGRANTO – version 2.0, Geosci. Model Dev., 8, 2569–2586, https://doi.org/10.5194/gmd-8-2569-2015, 2015. a
Sprenger, M., Fragkoulidis, G., Binder, H., Croci-Maspoli, M., Graf, P., Grams, C. M., Knippertz, P., Madonna, E., Schemm, S., Škerlak, B., and Wernli, H.: Global climatologies of Eulerian and Lagrangian flow features based on ERA-Interim, B. Am. Meteorol. Soc., 98, 1739–1748, 2017. a, b
Steinfeld, D. and Pfahl, S.: The role of latent heating in atmospheric blocking dynamics: a global climatology, Clim. Dynam., 53, 6159–6180, https://doi.org/10.1007/s00382-019-04919-6, 2019. a
Steinfeld, D., Boettcher, M., Forbes, R., and Pfahl, S.: The sensitivity of atmospheric blocking to upstream latent heating – numerical experiments, Weather Clim. Dynam., 1, 405–426, https://doi.org/10.5194/wcd-1-405-2020, 2020. a
Steinfeld, D., Sprenger, M., Beyerle, U., and Pfahl, S.: Response of moist and dry processes in atmospheric blocking to climate change, Environ. Res. Lett., 17, 084020, https://doi.org/10.1088/1748-9326/ac81af, 2022. a
Stoelinga, M. T.: A Potential Vorticity-Based Study of the Role of Diabatic Heating and Friction in a Numerically Simulated Baroclinic cyclone, Mon. Weather Rev., 124, 849–874, https://doi.org/10.1175/1520-0493(1996)124<0849:APVBSO>2.0.CO;2, 1996. a
Tamarin-Brodsky, T. and Kaspi, Y.: Enhanced poleward propagation of storms under climate change, Nat. Geosci., 10, 908–913, https://doi.org/10.1038/s41561-017-0001-8, 2017. a
Wandel, J., Quinting, J. F., and Grams, C. M.: Toward a Systematic Evaluation of Warm Conveyor Belts in Numerical Weather Prediction and Climate Models. Part II: Verification of Operational Reforecasts, J. Atmos. Sci., 78, 3965–3982, https://doi.org/10.1175/JAS-D-20-0385.1, 2021. a
Wernli, H.: A Lagrangian-based analysis of extratropical cyclones. II: A detailed case-study, Q. J. Roy. Meteorol. Soc., 123, 1677–1706, https://doi.org/10.1256/smsqj.54210, 1997. a
Wernli, H. and Davies, H. C.: A Lagrangian-based analysis of extratropical cyclones. I: The method and some applications, Q. J. Roy. Meteorol. Soc., 123, 467–489, https://doi.org/10.1256/smsqj.53810, 1997. a, b, c
Wernli, H. and Schwierz, C.: Surface cyclones in the ERA-40 dataset (1958–2001). Part I: Novel identification method and global climatology, J. Atmos. Sci., 63, 2486–2507, https://doi.org/10.1175/JAS3766.1, 2006. a
Wernli, H., Boettcher, M., Joos, H., Miltenberger, A. K., and Spichtinger, P.: A trajectory-based classification of ERA-Interim ice clouds in the region of the North Atlantic storm track, Geophys. Res. Lett., 43, 6657–6664, https://doi.org/10.1002/2016GL068922, 2016. a
Woollings, T., Barriopedro, D., Methven, J., Son, S.-W., Martius, M., Harvey, B., Sillmann, J., Lupo, A. R., and Seneviratne, S.: Blocking and its Response to Climate Change, Curr. Clim. Change Rep., 4, 287–300, https://doi.org/10.1007/s40641-018-0108-z, 2018. a, b
The end of the WCB ascent is defined as the time when the WCB air parcels no longer gain altitude, i.e. when the pressure increases again. However, to allow for transient phases of descent at lower- to middle-troposphere levels, the criterion is only applied if the air parcels are at least 400 hPa above their starting pressure level. If air parcels continue their ascent until t=48 h, then the end of the ascent is set to 48 h.
- Abstract
- Introduction
- Data and methodology
- Representation of WCBs in CESM present-day climate
- WCBs in a future RCP8.5 climate
- Implications of changes in WCB characteristics in a future RCP8.5 climate
- Discussion and conclusion
- Code and data availability
- Author contributions
- Competing interests
- Disclaimer
- Acknowledgements
- Financial support
- Review statement
- References
- Supplement