the Creative Commons Attribution 4.0 License.
the Creative Commons Attribution 4.0 License.
 | 03 Jan 2023
Warm conveyor belts in present-day and future climate simulations – Part 2: Role of potential vorticity production for cyclone intensification
Hanna Joos
Michael Sprenger
Heini Wernli
Warm conveyor belts (WCBs) are strongly ascending, cloud- and precipitation-forming airstreams in extratropical cyclones. The intense cloud-diabatic processes produce low-level cyclonic potential vorticity (PV) along the ascending airstreams, which often contribute to the intensification of the associated cyclone. This study investigates how climate change affects the cyclones' WCB strength and the importance of WCB-related diabatic PV production for cyclone intensification, based on present-day (1990–1999) and future (2091–2100) climate simulations of the Community Earth System Model Large Ensemble (CESM-LE). In each period, a large number of cyclones and their associated WCB trajectories have been identified in both hemispheres during the winter season. WCB trajectories are identified as strongly ascending air parcels that rise at least 600 hPa in 48 h. Compared to ERA-Interim reanalyses, the present-day climate simulations are able to capture the cyclone structure and the associated WCBs reasonably well, which gives confidence in future projections with CESM-LE. However, the amplitude of the diabatically produced low-level PV anomaly in the cyclone centre is underestimated in the climate simulations, most likely because of reduced vertical resolution compared to ERA-Interim. The comparison of the simulations for the two climates reveals an increase in the WCB strength and the cyclone intensification rate in the Southern Hemisphere (SH) in the future climate. The WCB strength also increases in the Northern Hemisphere (NH) but to a smaller degree, and the cyclone intensification rate is not projected to change considerably. Hence, in the two hemispheres cyclone intensification responds differently to an increase in WCB strength. Cyclone deepening correlates positively with the intensity of the associated WCB, with a Spearman correlation coefficient of 0.68 (0.66) in the NH in the present-day (future) simulations and a coefficient of 0.51 (0.55) in the SH. The number of explosive cyclones with strong WCBs, referred to as C1 cyclones, is projected to increase in both hemispheres, while the number of explosive cyclones with weak WCBs (C3 cyclones) is projected to decrease. A composite analysis reveals that in the future climate C1 cyclones will be associated with even stronger WCBs, more WCB-related diabatic PV production, the formation of a more intense PV tower, and an increase in precipitation. They will become warmer, moister, and slightly more intense. The findings indicate that (i) latent heating associated with WCBs (as identified with our method) will increase, (ii) WCB-related PV production will be even more important for explosive cyclone intensification than in the present-day climate, and (iii) the interplay between dry and moist dynamics is crucial to understand how climate change affects cyclone intensification.
- Article
(10120 KB) - Full-text XML
- Companion paper
- BibTeX
- EndNote


In extratropical cyclones, most of the cloud and precipitation formation occurs in so-called warm conveyor belts (WCBs; e.g. Harrold, 1973; Browning, 1990; Wernli and Davies, 1997). WCBs are coherent airstreams that originate in the cyclone's warm sector and rapidly move poleward while ascending to the upper troposphere. They form elongated cloud bands with warm clouds in their inflow, mixed-phase clouds at mid-levels, and ice clouds in the upper troposphere (Joos and Wernli, 2012; Wernli et al., 2016; Binder et al., 2020). The intense cloud-diabatic processes within the ascending airstreams modify potential vorticity (PV) in the atmosphere (Wernli and Davies, 1997; Madonna et al., 2014). In the WCB outflow in the upper troposphere, diabatic PV reduction results in negative PV anomalies, which can influence the synoptic- and large-scale flow (Wernli, 1997; Pomroy and Thorpe, 2000; Grams et al., 2011) and contribute to the formation and amplification of forecast errors (e.g. Madonna et al., 2015; Martínez-Alvarado et al., 2016; Grams et al., 2018; Binder et al., 2021). In the lower troposphere, diabatic PV production generates positive PV anomalies that can contribute to the intensification of the associated cyclone (Davis and Emanuel, 1991; Stoelinga, 1996; Binder et al., 2016). In particular, diabatic PV production within the WCB is crucial for many explosively intensifying cyclones (Binder et al., 2016). So far, it is unclear how global warming affects the cyclones' WCB strength and the importance of WCB-related diabatic PV production for cyclone intensification.
The response of extratropical cyclones to global warming is uncertain and a topic of ongoing research (see, for example, the reviews by Ulbrich et al., 2009; Shaw et al., 2016; Catto et al., 2019). Multiple partly opposing mechanisms are considered to affect the intensity, frequency, and geographical distribution of cyclones in a future climate: (i) the atmospheric moisture content is expected to increase in a warmer climate as a consequence of the Clausius–Clapeyron relation (Held and Soden, 2006); (ii) the lower-troposphere baroclinicity is expected to decrease in the Northern Hemisphere (NH) because of the enhanced Arctic warming compared to lower latitudes, in particular during the winter season, whereas in the Southern Hemisphere (SH) it is expected to increase (Harvey et al., 2014); and (iii) the upper-troposphere baroclinicity is expected to increase in both hemispheres in response to a warming of the tropical upper troposphere and a cooling of the polar stratosphere (Collins et al., 2013). These different mechanisms can interact with and counteract each other in a complex way and make predictions of future changes in the characteristics of extratropical cyclones challenging. For instance, the increase in the atmospheric moisture content leads to an increase in the latent heating rate, which may produce more intense cyclones via an enhancement of the low-level cyclonic PV. However, the increased latent heating is also expected to lead to enhanced poleward and upward energy transport, which could in turn decrease the horizontal baroclinicity and the vertical stability of the atmosphere and thereby have a dampening effect on cyclone strength (Catto et al., 2019).
Projections of changes in cyclone properties in a warmer and moister climate depend on the choice of the model, the region, the season, and the variables examined (Ulbrich et al., 2009; Catto et al., 2019). Also, when considering climate change effects on simulated cyclones, it is important to first assess the reliability of the simulated cyclone structure and associated precipitation by comparison with climatological results based on reanalyses (e.g. Catto et al., 2010; Hawcroft et al., 2016; Booth et al., 2018). Regarding effects of global warming, idealized baroclinic lifecycle experiments by Booth et al. (2013) showed that increased atmospheric moisture enhances the cyclone's intensification rate, minimum central pressure, surface winds, and precipitation if the background baroclinicity is not changed. However, in the idealized simulations by Tierney et al. (2018), the cyclone intensities only increased up to a certain temperature threshold beyond which they decreased again. This response to increased temperature and moisture was also found when the baroclinicity was reduced or increased at the same time. Also Pfahl et al. (2015) and Büeler and Pfahl (2019) documented a non-monotonic response of the median cyclone intensity – measured in terms of minimum central pressure and relative vorticity – to temperature and moisture increases in idealized aquaplanet simulations, with the maximum values at temperatures slightly above the current climate. They explained this non-monotonic behaviour with partly compensating changes in diabatic PV generation, baroclinicity, vertical stability, and the tropopause height. In contrast to the moderately intense cyclones, the low-level relative vorticity of the most extreme ones continued to intensify with increasing temperature and moisture. These cyclones were associated with a considerably stronger enhancement of the latent heating and of the diabatically produced low-level PV anomaly than the moderate cyclones, which overcompensated for the reduction in baroclinicity. In the intense cyclones, both studies also reported an increase in cyclone-related precipitation in warmer climates and, in Büeler and Pfahl (2019), an increase in the near-surface wind speeds that could be related to the increase in the latent heating. Also based on aquaplanet simulations, Sinclair et al. (2020) found no future changes in the median intensity of the cyclones, as measured in terms of low-level vorticity, and a decrease in their number. The most intense cyclones, on the other hand, increased in number, and they were associated with stronger ascent, low-level PV production and precipitation, and a downstream shift in the diabatic PV anomaly relative to the cyclone centre. Similarly, Kirshbaum et al. (2018) and Rantanen et al. (2019) did not find any increases in cyclone intensity, measured in terms of eddy kinetic energy, with increasing temperature and enhanced diabatic heating. As in Sinclair et al. (2020), the diabatically produced warm-front PV anomaly shifted further downstream in a warmer climate, which led to an unfavourable phasing with the dry upper-level PV anomaly. Thus, in these simulations latent heating rather had a dampening effect on the cyclone evolution. The different studies show that even in idealized settings, the response of the cyclones to rising temperatures is not unambiguous and depends on the background state, the exact changes in temperature and moisture, and the complex interactions between dry and moist dynamics. It is therefore not surprising that an adequate prediction of future changes in cyclone dynamics is even more challenging in fully coupled climate models.
Climate models typically project a small reduction in the total number of cyclones in a future climate in both hemispheres (e.g. Bengtsson et al., 2009; Mizuta et al., 2011; Zappa et al., 2013; Grieger et al., 2014; Dolores-Tesillos et al., 2022; Priestley and Catto, 2022). The deepest cyclones, on the other hand, are projected to increase in number in the SH (Grieger et al., 2014; Chang, 2017; Priestley and Catto, 2022). In the NH, there is less consensus on how their number will change, with some studies indicating a decrease (Zappa et al., 2013; Seiler and Zwiers, 2016; Chang, 2018) and others an increase (Mizuta et al., 2011; Priestley and Catto, 2022). In terms of intensity, a recent analysis of Coupled Intercomparison Project 6 (CMIP6) models projects an increase for the cyclones with peak low-level vorticity in both hemispheres during the winter season (Priestley and Catto, 2022), in agreement with the findings from aquaplanet simulations (Pfahl et al., 2015; Büeler and Pfahl, 2019; Sinclair et al., 2020; Schemm et al., 2022). In extreme winter cyclones, climate models also project an increase in the wind speeds and in the area of strong winds in the cyclone's warm sector (Dolores-Tesillos et al., 2022; Priestley and Catto, 2022) and an amplification of the diabatically produced low-level PV anomaly (Dolores-Tesillos et al., 2022). Furthermore, it is widely agreed that cyclone-related precipitation will increase with global warming both in moderate and in intense cyclones as a result of the increased atmospheric water vapour (Bengtsson et al., 2009; Hawcroft et al., 2018; Raible et al., 2018). Finally, the storm track is expected to shift poleward in the North Pacific during winter and in the SH during both winter and summer (e.g. Yin, 2005; Bengtsson et al., 2009; Priestley and Catto, 2022), which can largely be explained by the increased latent heating and diabatic PV production (Tamarin-Brodsky and Kaspi, 2017).
The idealized simulations as well as the climate model studies demonstrate that the role of enhanced diabatic heating for cyclone development in a warming climate is not yet fully understood. As the strongest diabatic heating in extratropical cyclones occurs in WCBs, the question arises of how WCB-related diabatic PV production changes with global warming. In an accompanying study by Joos et al. (2022), a climatology of WCB trajectories has been calculated for the first time in climate model simulations with the Community Earth System Model Large Ensemble (CESM-LE; Kay et al., 2015), and their geographical distribution, seasonal frequency, and characteristics have been investigated in the present-day and end-of-century climate. It was shown that the present-day simulations are able to realistically capture the geographical distribution and frequency of occurrence of the WCBs in many regions. In the future simulations, overall the WCB frequency maxima are located in similar regions to in the present climate, but there are also some geographical shifts, and the total number of WCB trajectories increases. In regional WCB hotspots like the North and South Atlantic, North Pacific, and Mediterranean, there is an increase in the WCB inflow moisture and in the precipitation and the diabatic heating rate along the ascending trajectories, and the maximum in the diabatic heating rate shifts upward.
The projected overall increase in the number of WCB trajectories and in the diabatic heating rate along the trajectories in a warmer climate potentially influences the development of the associated cyclones. In this study, we use the same WCB climatology as in Joos et al. (2022) and combine it with a cyclone climatology to evaluate how WCBs and their associated diabatic PV production affect cyclone intensification in present-day and future CESM-LE simulations during NH and SH winter. In addition to a climatological analysis of all cyclones, we investigate potential future changes in the characteristics of a subset of cyclones with particularly strong WCBs and explosive deepening, referred to as C1 cyclones (see Binder et al., 2016). Specifically, the following research questions are addressed:
-
Is CESM-LE able to capture the properties and structure of extratropical cyclones and their associated WCBs when compared to reanalysis data?
-
How will the WCB strength and the cyclone-deepening rate change in a future climate according to the Representative Concentration Pathway 8.5 (RCP8.5) emission scenario, and how will the number of explosive cyclones in general and those with strong WCBs change in the two hemispheres?
-
How will climate change affect the importance of WCB-related diabatic PV production for cyclone intensification, and how will it affect the properties, structure, and intensity of C1 cyclones?
Section 2 describes the climate model and reanalyses used in the study, along with the methods to identify WCBs and cyclones and to combine the two data sets. In Sect. 3, CESM-LE is evaluated by comparing the present-day simulations with reanalysis data. Section 4 presents results of future changes in the WCB strength, cyclone-deepening rate, and cyclone number and of future changes in the characteristics of C1 cyclones. A summary and conclusions are provided in Sect. 5.
2.1 Climate simulations and reanalysis data
The study is based on output from an initial condition ensemble of the Community Earth System Model (CESM), version 1 (Hurrell et al., 2013). The ensemble data were created by rerunning the CESM Large Ensemble (CESM-LE; Kay et al., 2015) with restart files from the original simulations (see Röthlisberger et al., 2020, for a detailed description). The re-simulations were produced to obtain high-resolution three-dimensional model-level output, such as wind fields, which is required for the computation of WCB trajectories. The data are available every 6 h at a horizontal resolution of 1.25∘ longitude by latitude and on 30 vertical levels. Two time periods are simulated, 1990–1999 for the present-day climate (hereafter referred to as CESM-HIST), which is based on historical forcing (Lamarque et al., 2010), and 2091–2100 for the future climate (hereafter referred to as CESM-RCP85), based on the RCP8.5 emission scenario (Lamarque et al., 2011; Meinshausen et al., 2011). Both time periods are simulated with five ensemble members, which only differ by small perturbations in the initial atmospheric temperature field. In total, this yields 50 simulated years for each time period. The data of this 50 years are analysed collectively; i.e. the ensemble is used to enlarge the data sets for the considered 10-year periods. The analysis is confined to the winter season in both hemispheres, i.e. December–February for the NH and June–August for the SH.
To validate the ability of CESM-LE to represent extratropical cyclones and their associated WCBs, the present-day simulations are compared to the corresponding fields in ERA-Interim reanalyses of the European Centre for Medium-Range Weather Forecasts (Dee et al., 2011) for the period 1979-2014. The ERA-Interim data set is the same as in Binder et al. (2016). The variables are available every 6 h on 60 levels in the vertical, and they have been interpolated from a spectral resolution of T255 to a 1∘ by 1∘ horizontal grid. As for the CESM simulations, we restrict the analysis to the winter season in both hemispheres. We note that with our pragmatic approach of comparing several realizations of a 10-year period simulated with a coupled ocean–atmosphere model, which produces for instance its own El Niño–Southern Oscillation variability, with a longer time period in the reanalyses, we cannot expect a perfect agreement.
2.2 Cyclone and WCB identification
Extratropical cyclones are identified based on the algorithm of Wernli and Schwierz (2006) that has been refined in Sprenger et al. (2017). Cyclones are defined as two-dimensional features delimited by the outermost closed isobar that encompasses a local sea level pressure (SLP) minimum or several minima. In addition, a tracking algorithm determines for each SLP minimum the most probable continuation among the minima identified 6 h later and thereby follows the cyclones from genesis to maturity to lysis. The analysis is restricted to cyclones with a lifetime of at least 48 h, and to exclude tracks with unrealistic lifecycles, the pressure difference between the outermost closed SLP contour and the SLP minimum at the beginning of the track needs to be less than 5 hPa (see Binder et al., 2016, for details). Furthermore, we only consider cyclones located poleward of 25∘ N and S during at least a 24 h interval to exclude tropical cyclones.
The identification of WCB trajectories is the same in ERA-Interim and the CESM simulations and is described in detail in Madonna et al. (2014) and Joos et al. (2022), respectively. Using the Lagrangian analysis tool (LAGRANTO; Wernli and Davies, 1997; Sprenger and Wernli, 2015), 48 h forward trajectories are started every 6 h from a horizontally equidistant grid with Δx=80 km resolution and from vertically equidistant (Δp=20 hPa) levels in the lower troposphere (1050–790 hPa). To be selected as WCB air parcels, the trajectories must undergo an ascent of at least 600 hPa within 48 h. In addition, their horizontal position must coincide with the surface field of an extratropical cyclone at least once during the 48 h. Note that we decided to use the same threshold for ascent to identify WCB trajectories in both climate periods, despite the fact that the extratropical tropopause rises slightly in the warmer climate (Joos et al., 2022).
A technical problem occurs at the end of the years: in CESM, we treat each simulated year separately, such that the trajectories are not able to cross the year end. This implies that the last 4 d of each year is not included in the WCB climatology. However, we expect that this only has a negligible impact on the results.
2.3 Link between cyclone deepening and WCB strength
To study the link between cyclone deepening and WCB strength (as defined below), the WCB trajectories are assigned to cyclones. In ERA-Interim, each WCB trajectory is assigned to the first cyclone with which it overlaps during the 48 h ascent, as in Binder et al. (2016). In CESM-LE, WCB trajectories located close to each other are first clustered with a clustering algorithm similar to the one described in Catto et al. (2015b). All trajectories in the cluster are attributed to the same cyclone, namely the cyclone with which the highest number of WCB trajectories overlap when they are located between 850 and 500 hPa. Both in ERA-Interim and in CESM-LE this yields for every cyclone during the entire lifecycle the number of associated WCB trajectories and their properties. As has been tested, the slightly different procedures to link WCB trajectories with cyclones has only a negligible influence on the results (not shown). Indeed, the number of WCB trajectories per cyclone is very similar in ERA-Interim and the present-day simulations of CESM-LE, as will be discussed in Sect. 3.
Cyclone deepening is measured in bergeron units (Sanders and Gyakum, 1980). Over each 24 h interval during a cyclone lifecycle, the latitude-adjusted SLP deepening within 24 h is calculated as follows:
where ΔSLP is the change in the minimum SLP and ϕ represents the cyclone's average latitude during the 24 h time period. For each cyclone, ΔSLPB over the next 24 h is calculated every 6 h, and the deepening rate ΔSLPB,max is then determined as the largest value in ΔSLPB during the cyclone lifecycle. Sanders and Gyakum (1980) defined explosively intensifying cyclones (so-called “bombs”) as cyclones with a deepening rate of more than 1 bergeron, which corresponds to an SLP drop of more than 24 hPa in 24 h at 60∘ latitude.
As in Binder et al. (2016), the cyclone's WCB strength is quantified by the number of WCB trajectories assigned to that cyclone and located in the lower troposphere (p>500 hPa) at any time during the 24 h of strongest deepening. We regard this as a useful measure of WCB strength, as the number of trajectories is directly proportional to the Lagrangian mass transport that exceeds the 600 hPa threshold. The trajectories do not necessarily need to be located within the cyclone area during these 24 h, as they (or, for CESM-LE, part of their cluster) can overlap with the cyclone area at any time during their 2 d ascent. Since the WCB trajectories were started from an equidistant grid (see Sect. 2.2), each trajectory is associated with the same air mass; i.e. kg, with g=9.81 m s−2. Thus, multiplication of the number of WCB trajectories with Δm yields the WCB air mass.
To have confidence in CESM-LE's projections of extratropical cyclones and their associated WCBs in a warming climate, the model needs to be able to correctly represent them in the current climate. Joos et al. (2022) compared the WCB climatology in CESM-HIST with ERA-Interim. They showed that in most regions CESM-HIST is able to realistically simulate WCBs in terms of their geographical distribution, frequency of occurrence, and ascent behaviour. For the North Atlantic, Raible et al. (2018) and Dolores-Tesillos et al. (2022) showed that the model captures cyclone frequencies and lifetimes relatively well. In this section, we evaluate some further characteristics of WCBs, cyclones, and the link between them in CESM-HIST and ERA-Interim. In CESM-HIST, the results are based on the years 1990–1999. In ERA-Interim, they are based on the years 1979–2014 as in Binder et al. (2016), but the results are very similar when only considering the years 1990–1999 (not shown). Note that we do not expect an exact agreement between ERA-Interim and the climate simulations. The two data sets are based on two different models, with, for instance, different spatial resolution and different parameterization schemes for subgrid-scale processes. In addition, ERA-Interim only represents one possible realization of the present-day climate, whereas CESM-HIST represents an ensemble with equally likely realizations of the same decade.
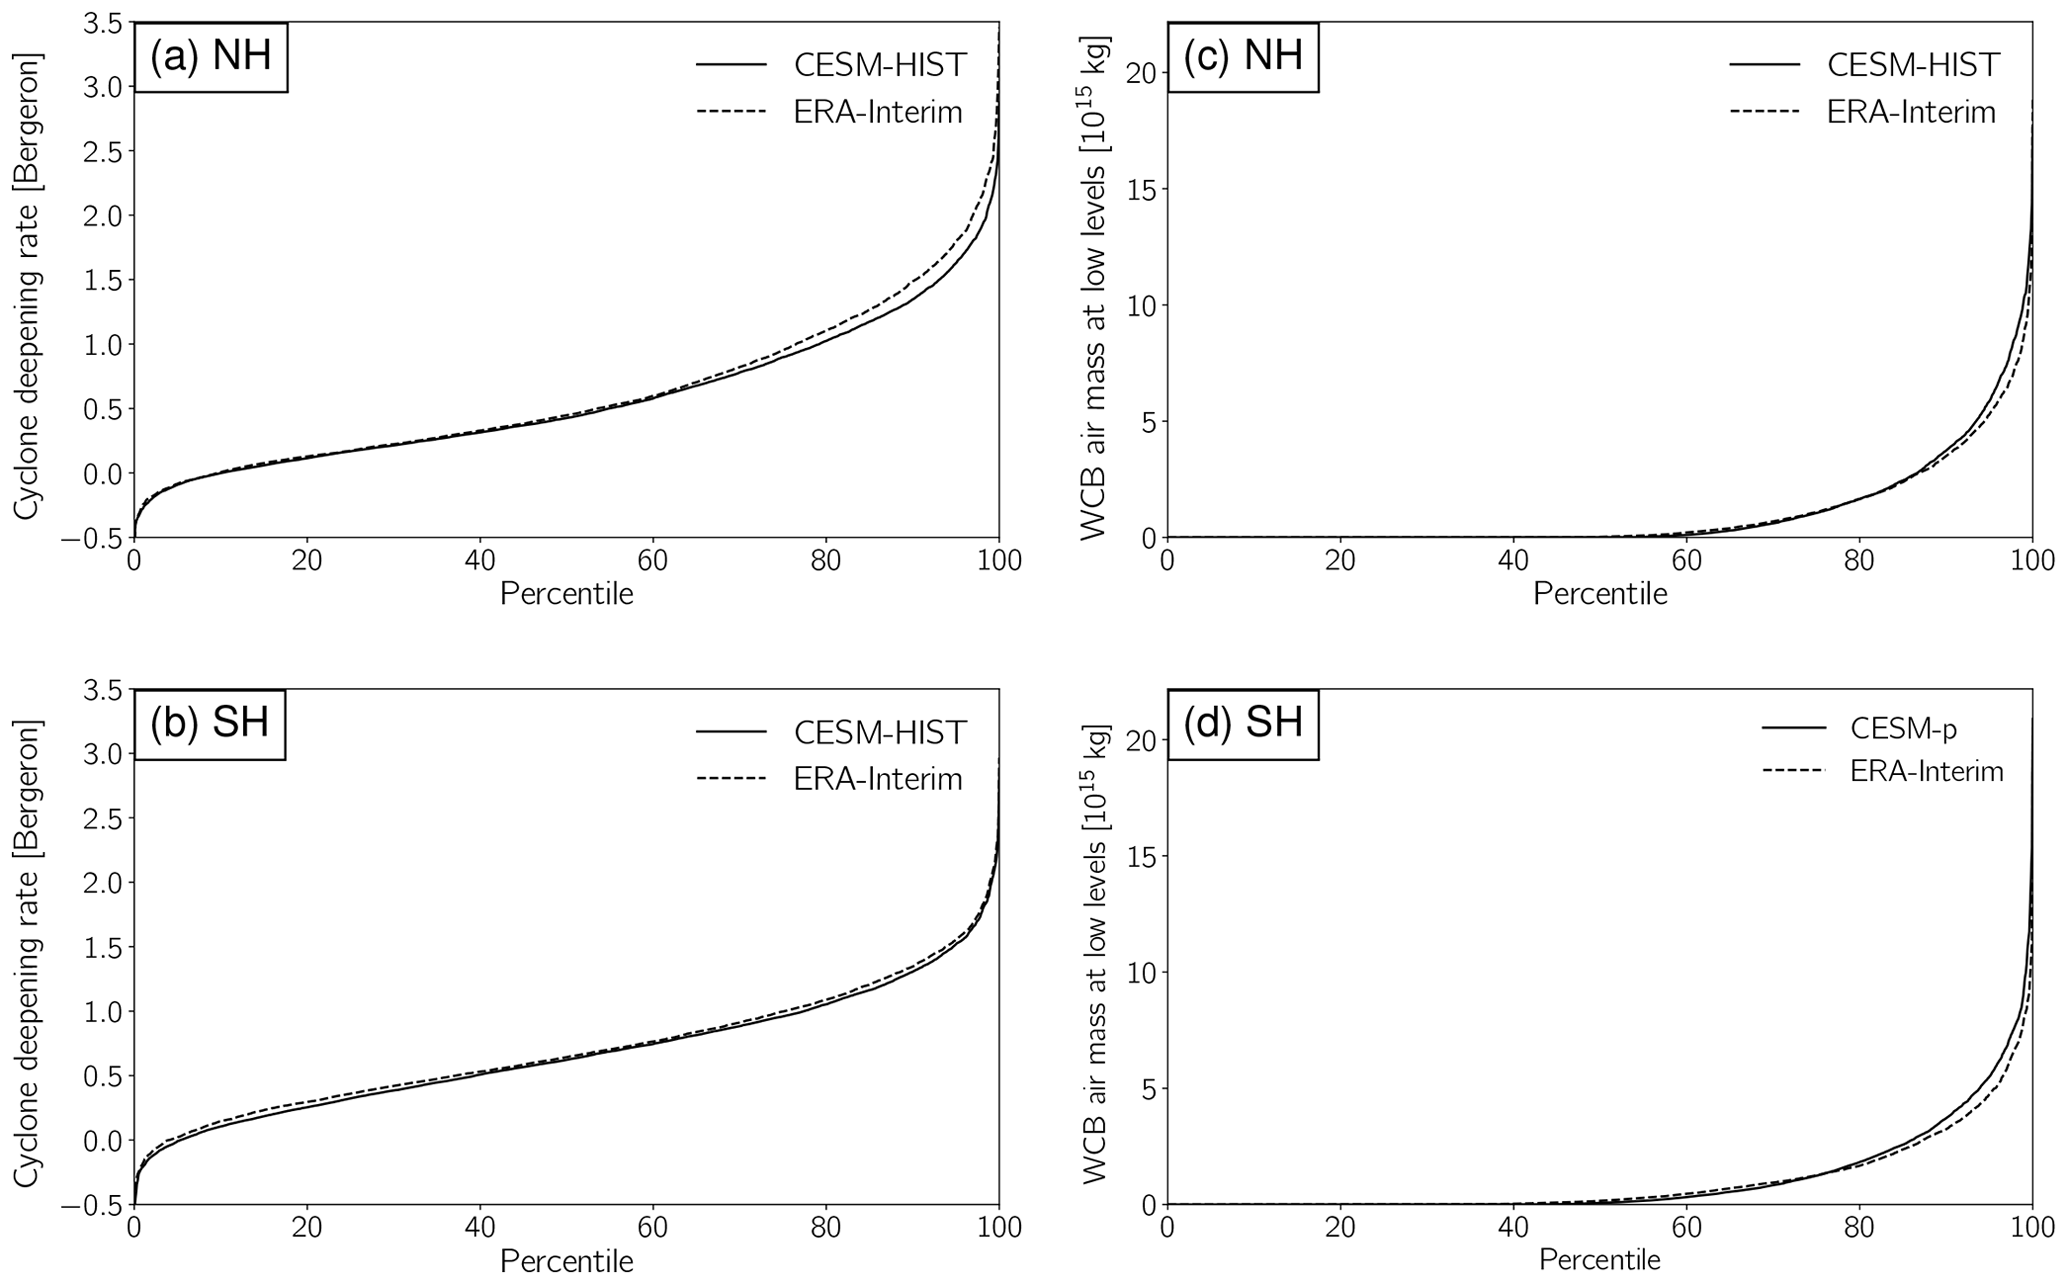
Figure 1Percentile curves of the (a, b) cyclone-deepening rates ΔSLPB,max (bergeron) and (c, d) WCB strength associated with the cyclones (measured by the WCB air mass at p>500 hPa during the cyclone's 24 h of strongest intensification, in 1015 kg) for all cyclones in (a, c) NH winter and (b, d) SH winter. The curves are shown in solid lines for CESM-HIST and dashed lines for ERA-Interim.
CESM-HIST slightly underestimates the number of extratropical cyclones per winter in the NH (132 cyclones per winter in CESM-HIST vs. 141 cyclones in ERA-Interim) but performs very well in the SH (136 cyclones in both data sets; Table 1). Figure 1a shows, for NH winter, percentile curves of the intensification rates of all cyclones (ΔSLPB,max), separately for CESM-HIST and ERA-Interim. Hereby, the curve indicates the percentage of cyclones (with respect to the total number as indicated in Table 1) with a specific intensification rate or lower. For instance, 90 % of the cyclones have a deepening rate ≤1.35 bergerons in CESM-HIST and ≤1.5 bergerons in ERA-Interim, while the remaining 10 %, i.e. the 10 % most strongly deepening cyclones, have bergeron values above this threshold. The agreement between CESM-HIST and ERA-Interim is very good up to approximately the 70th percentile; for higher percentiles CESM-HIST underestimates the intensification rates by about 0.1 to 0.3 bergerons. In the SH, the agreement is good for all percentiles, with discrepancies around 0.05 bergerons or less (Fig. 1b).
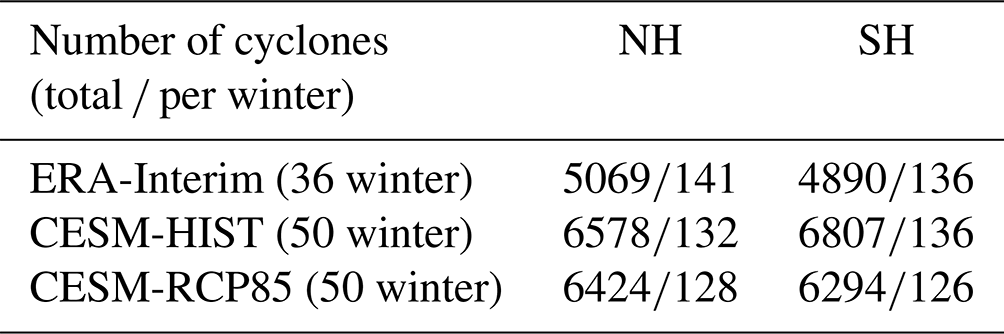
Table 1Number of wintertime extratropical cyclones in ERA-Interim, CESM-HIST, and CESM-RCP85.
In Fig. 1c and d, percentile curves of the WCB strength associated with the cyclones are displayed for NH and SH winter, respectively. In both hemispheres, about half of the cyclones do not have a WCB in ERA-Interim and CESM-HIST, according to the criteria used in this study. For cyclones with WCB trajectories, CESM-HIST slightly overestimates the WCB strength for the highest percentiles, but overall it performs remarkably well in reproducing the statistical distribution of WCB strength.
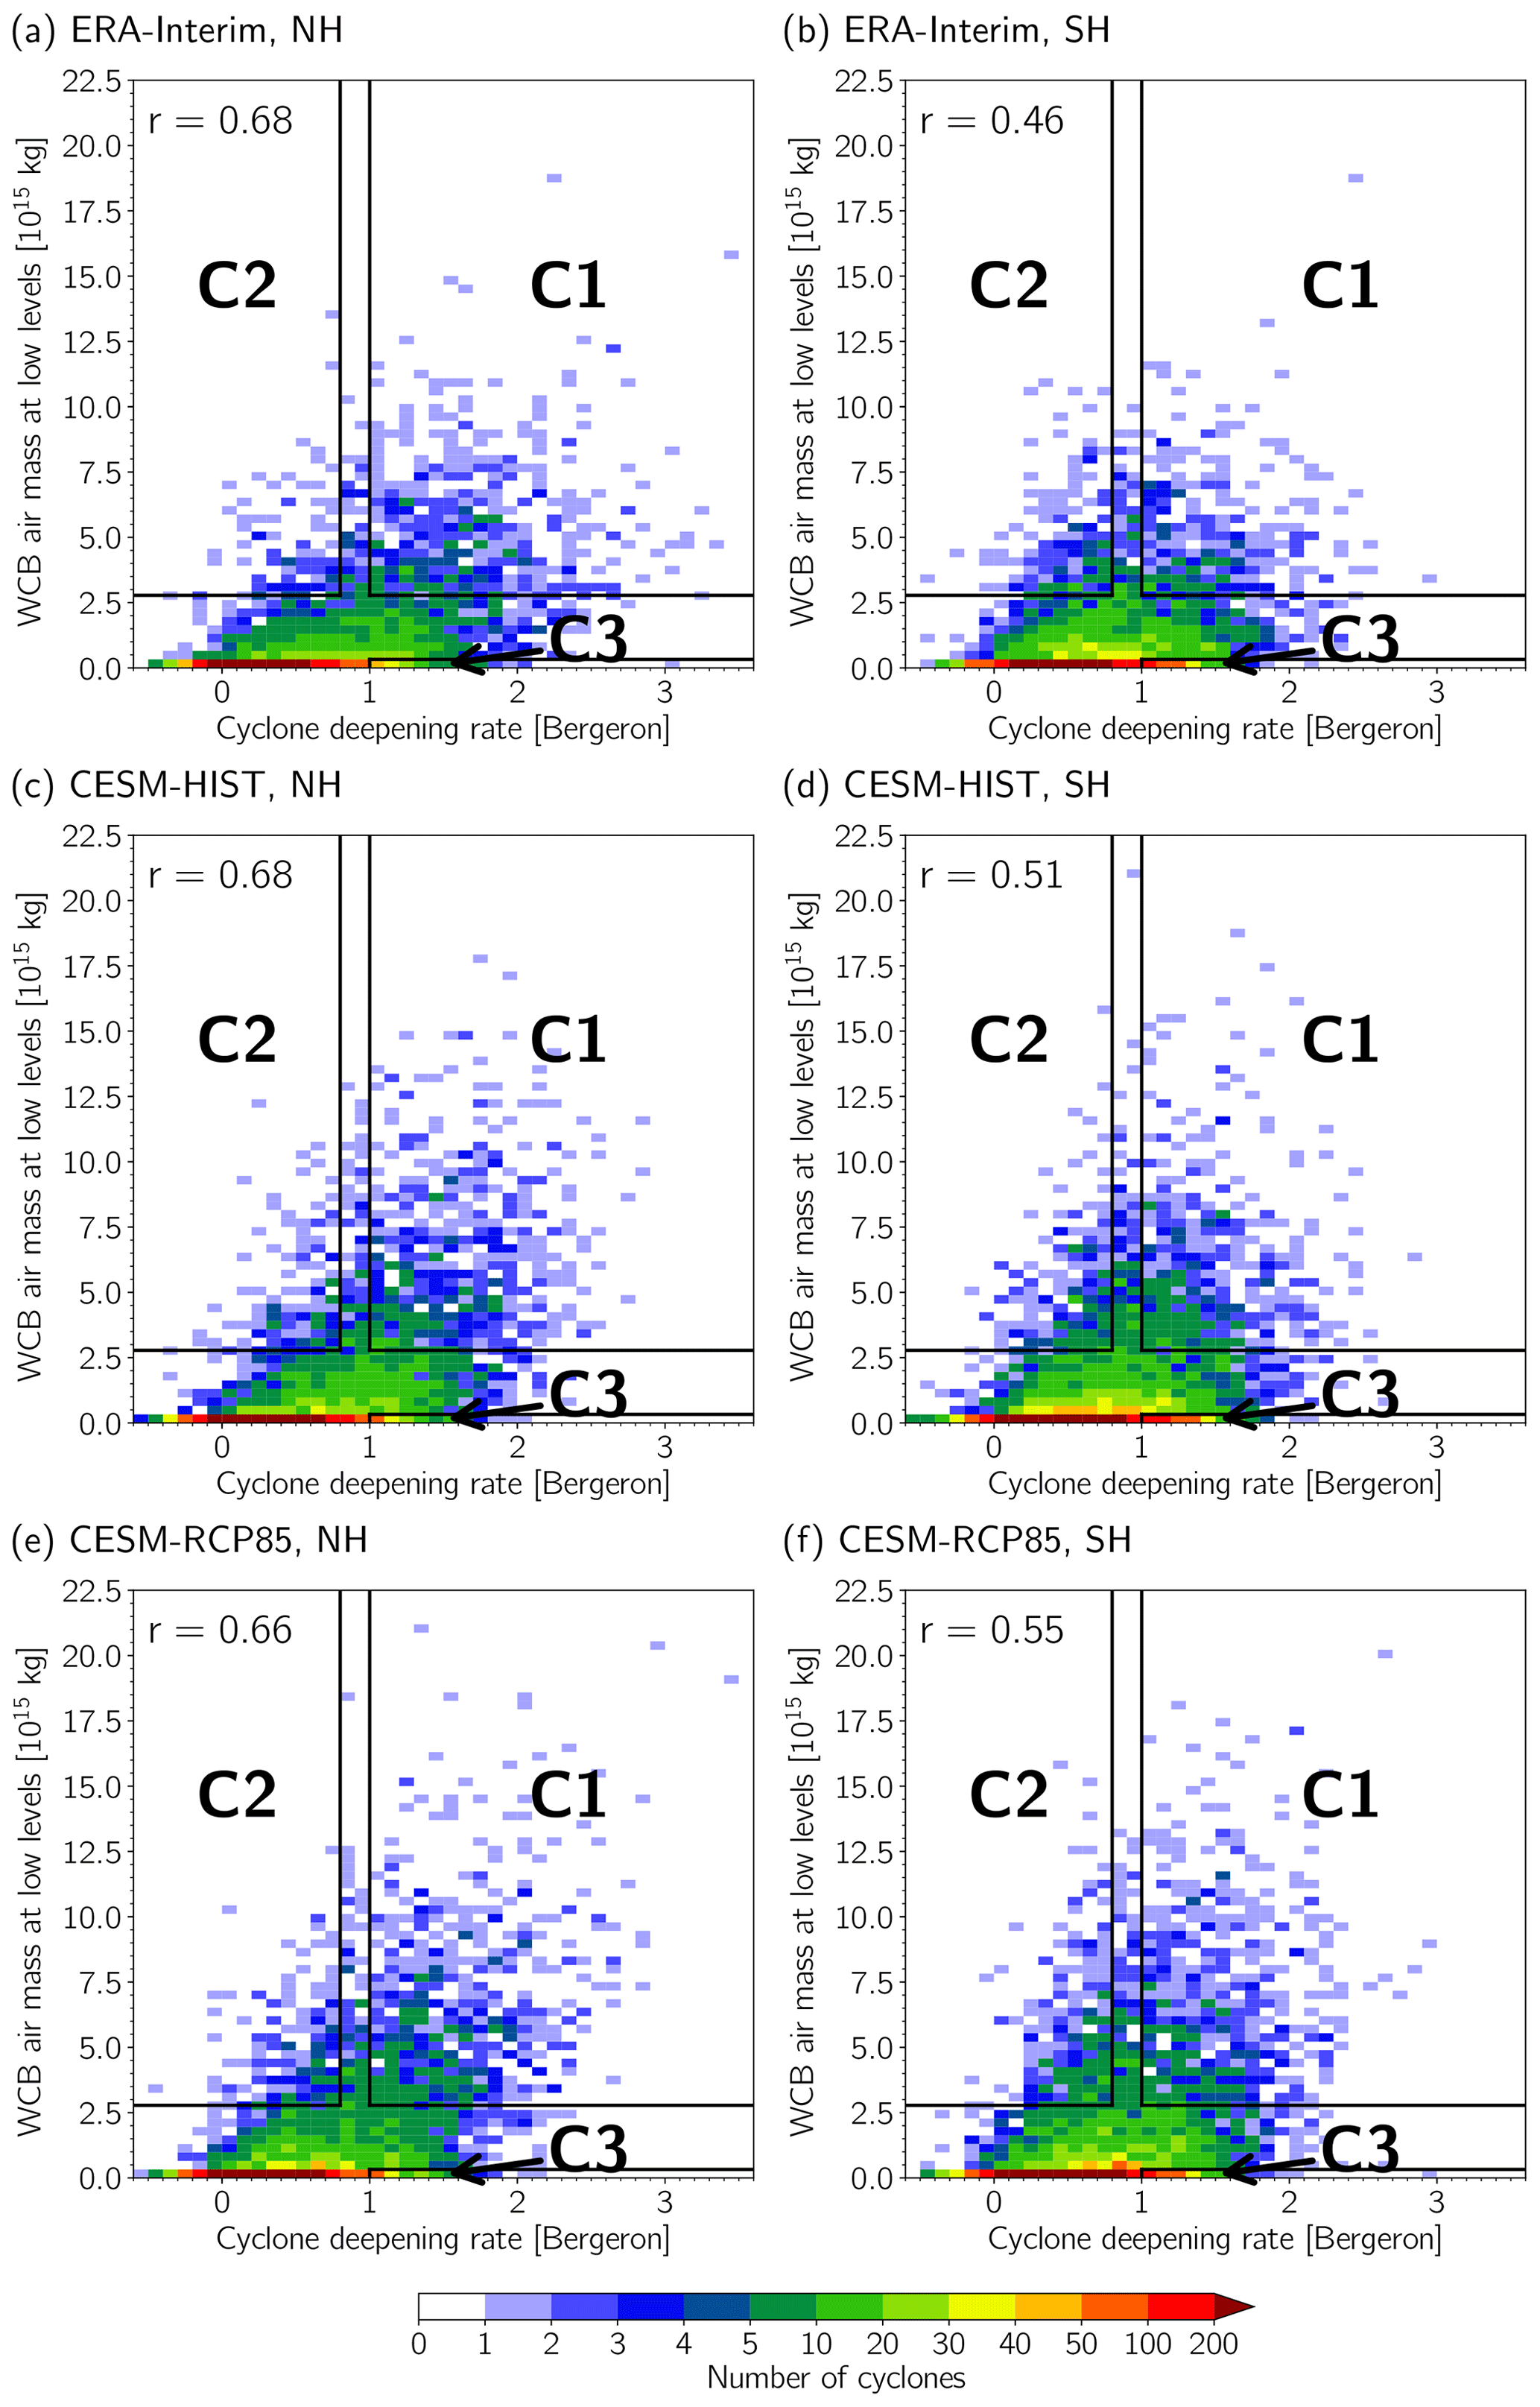
Figure 2Two-dimensional histograms showing for all (a, c, e) NH and (b, d, f) SH winter cyclones in (a, b) ERA-Interim, (c, d) CESM-HIST, and (e, f) CESM-RCP85 the cyclone intensification rate ΔSLPB,max (bin width = 0.1 bergerons) and the WCB strength (bin width kg, corresponding to 250 WCB trajectories). The colours specify the number of cyclones per bin. The black lines mark the borders of categories C1, C2, and C3.
Figure 2a shows for all NH winter cyclones in ERA-Interim a two-dimensional phase space of the link between WCB strength and the cyclone intensification rate, equivalent to Fig. 1 in Binder et al. (2016). In Fig. 2c, the same is shown for CESM-HIST. Consistently with Fig. 1, the deepening rates of the most explosive cyclones are higher in ERA-Interim. Otherwise, the cyclones are distributed fairly similarly in the phase spaces in the reanalyses and the climate model. In both plots, the red and light green colours reveal that most of the cyclones with no or few WCB trajectories also experience a weak deepening. Dark green and blue colours indicate that cyclones with a more intense WCB typically deepen more strongly. The Spearman rank correlation coefficient has the same value of 0.68 in ERA-Interim and CESM-HIST, which corresponds to a moderate to strong positive correlation between WCB strength and the cyclone intensification rate. In the SH, the Spearman correlation coefficients are lower (0.46 in ERA-Interim and 0.51 in CESM-HIST), but the distribution of the cyclones in the phase space is also well captured by the climate model (Fig. 2b, d).
To assess whether CESM-HIST is able to adequately represent the structure and properties of extratropical cyclones and the associated WCBs, we investigate the average fields of a subset of cyclones with a compositing method. We restrict our analysis to cyclones with particularly strong deepening and intense WCBs, referred to as C1 cyclones. The category borders of the C1 cyclones are displayed in Fig. 2. They are identical to those defined in Binder et al. (2016), i.e. explosively deepening cyclones (>1 bergeron) with a WCB intensity of at least 2.78×10¹⁵ kg (corresponding to 2130 WCB trajectories). In ERA-Interim, this yields 500 C1 cyclones in the NH, which corresponds to 9.9 % of the total cyclone number, and 330 C1 cyclones in the SH, corresponding to 6.7 %. In CESM-HIST, the larger number of simulated years results in more C1 cyclones (616 in the NH and 509 in the SH), but the fraction from the total cyclone number is with 9.4 % and 7.5 %, respectively, very similar to the one in ERA-Interim. The composites are created in the middle of the 24 h interval of strongest cyclone intensification and centred at the location of the SLP minimum.1 Note that here we are mainly interested in the differences between CESM-HIST and ERA-Interim; a detailed description of the structure and evolution of the C1 composite cyclone in ERA-Interim for NH winter can be found in Binder et al. (2016). Here we only show C1 composites for NH winter, but the findings are very similar for SH winter.
Figure 3a and b show SLP, PV at 250 hPa, and the WCB frequency of the composite cyclones for ERA-Interim and CESM-HIST, respectively. For ERA-Interim, the figure is almost identical to Fig. 7c in Binder et al. (2016). The minimum SLP has a value of about 988 hPa in ERA-Interim and 987 hPa in CESM-HIST. In both the reanalysis and the climate model, a cyclonically breaking upper-level disturbance is located to the west of the surface cyclone, with a PV gradient of very similar magnitude. Low-level (upper-level) WCB frequencies indicate the fraction of C1 cyclones that have at least one WCB trajectory located at p>500 hPa (p<500 hPa) at a specific position. The spatial distribution of the frequencies agrees well between the reanalysis and the climate model. In both cases, high low-level WCB frequencies occur in the warm sector and above the warm front of the composite cyclone, with maximum values of more than 80 % close to the cyclone centre. The highest upper-level WCB frequencies amount to about 60 % and are located slightly to the north of the peak low-level values. Additionally shown is the frequency of low-level WCB air parcels located between 900 and 700 hPa that reach high PV values above 1 pvu (HLPV WCB frequencies, green contours), which highlights the regions with the most pronounced WCB-related diabatic PV production. The HLPV trajectories are co-located with the cyclone centre, and their maximum frequencies amount to approximately 65 % in ERA-Interim and 55 % in CESM-HIST.

Figure 3Composites of C1 cyclones in NH winter in (a, c, e) ERA-Interim and (b, d, f) CESM-HIST in the middle of the 24 h period of strongest deepening. (a, b) Frequency of WCB air parcels with p>500 hPa (%; shading) and p<500 hPa (blue contours at 5 %, 10 %, 20 %, 30 %, …, 80 %) and WCB air parcels with PV >1 pvu and hPa (green contours at 10 %, 50 %, and 60 %), SLP (thin black contours every 3 hPa), and PV at 250 hPa (thick black contours at 2, 3, 4, and 6 pvu). (c, d) The 6 h accumulated precipitation (mm; shading), potential temperature at 850 hPa (black contours every 3 K), and wind speed at 250 hPa (green contours at 50 and 60 m s−1). (e, f) West–east-oriented cross section across the centre of the composite cyclone, showing PV (pvu; shading) and potential temperature (black contours every 5 K).
The potential temperature structure and the horizontal temperature gradient at 850 hPa are very similar in ERA-Interim and CESM-HIST (Fig. 3c, d). At upper levels in both data sets, a jet streak is located southwest of the cyclone centre. Also the precipitation pattern agrees well between ERA-Interim and CESM-HIST, with non-zero values in the entire warm sector (Fig. 3c, d). Maximum values near the cyclone centre amount to 17 mm (6 h)−1 in ERA-Interim and 16 mm (6 h)−1 in CESM-HIST. In both cases, they coincide with the region of the strongest WCB-related PV production (green contours in Fig. 3a, b). The higher maximum precipitation values and HLPV WCB frequencies in ERA-Interim are reflected in a deeper and more pronounced diabatically produced low-level PV anomaly, as evident in the cross section across the cyclone centre (Fig. 3e, f). The maximum PV values in the cyclone centre reach about 1.5 pvu in ERA-Interim and 1 pvu in CESM-HIST. This relatively strong underestimation in the climate model, which also occurs in the SH (not shown), could be associated with the lower spatial resolution, in particular in the vertical (30 vertical levels in CESM-LE compared to 60 in ERA-Interim), as well as differences in the representation of moist processes in the two parameterization schemes. At upper levels, CESM-HIST represents the PV structure well, with a deep trough upstream of the cyclone centre and a ridge downstream (Fig. 3e, f). During the subsequent hours, in both data sets continuous WCB-related PV formation and a cyclonic wrap-up of the disturbance at the tropopause contribute to the further intensification of the composite cyclone, until 12 h later, at the end of the strongest intensification phase, the positive low- and upper-level PV anomalies align vertically and form a troposphere-spanning PV tower (Hoskins, 1990; Rossa et al., 2000; Badger and Hoskins, 2001), which is associated with an intense cyclonic wind field (for ERA-Interim, see Fig. 7f in Binder et al., 2016). Still, the diabatically produced PV anomaly within the PV tower is about 0.5 pvu lower in CESM-HIST than in ERA-Interim (not shown).
In summary, this comparison between ERA-Interim and CESM-HIST showed that CESM-HIST is able to capture the properties and structure of extratropical cyclones and their associated WCBs reasonably well. However, there are also differences between climate model and reanalysis, like, for instance, a weaker deepening rate of the most explosive cyclones in CESM-HIST in the NH and a weaker intensity of the diabatically produced positive PV anomaly in the centre of the C1 cyclones. The overall very good representation of extratropical cyclones and WCBs in the climate model gives confidence in the model's ability to predict potential changes in a warming climate. In the following, we compare CESM-LE simulations of the present-day and the future climate to assess how climate change affects the cyclones' WCB strength and the importance of WCB-related diabatic PV production for cyclone intensification.
4.1 Future changes in cyclone number, cyclone intensification rate, and WCB strength
The number of cyclones per winter is projected to decrease in the future climate by 3 % in NH winter (from 132 to 128 cyclones) and 7 % in SH winter (from 136 to 126 cyclones; Table 1). (According to a t test, this reduction is statistically significant (with a p value < 0.01) in the SH but not in the NH.) This general decrease is consistent with the findings from many previous studies (e.g. Bengtsson et al., 2009; Grieger et al., 2014; Priestley and Catto, 2022). To evaluate potential changes in cyclone-deepening rates and WCB strengths in the future climate, we look at the differences in the percentile curves between the future and the present-day climate simulations (CESM-RCP85 minus CESM-HIST; Fig. 4). Positive differences for specific percentiles indicate an increase and negative differences a decrease in the deepening rates (Fig. 4a, b) and WCB strengths (Fig. 4c, d) in the future climate. To detect statistically significant differences, a confidence interval has been constructed by performing a bootstrap resampling. Hereby, our null hypothesis was that the cyclone intensification rates and the WCB strengths per cyclone, respectively, do not differ between the present-day and future climate simulations, i.e. that they belong to a common distribution. From this common distribution, 100 000 resamples have been created by randomly attributing half of the values to CESM-HIST and half of the values to CESM-RCP85 and then calculating the difference in the percentile curves. The 2.5th and the 97.5th percentiles of the ranked differences in the resampling distribution correspond to the lower and upper limits of the 95 % confidence interval. If the actual difference lies outside this interval, it is statistically significant with a probability of 95 %.
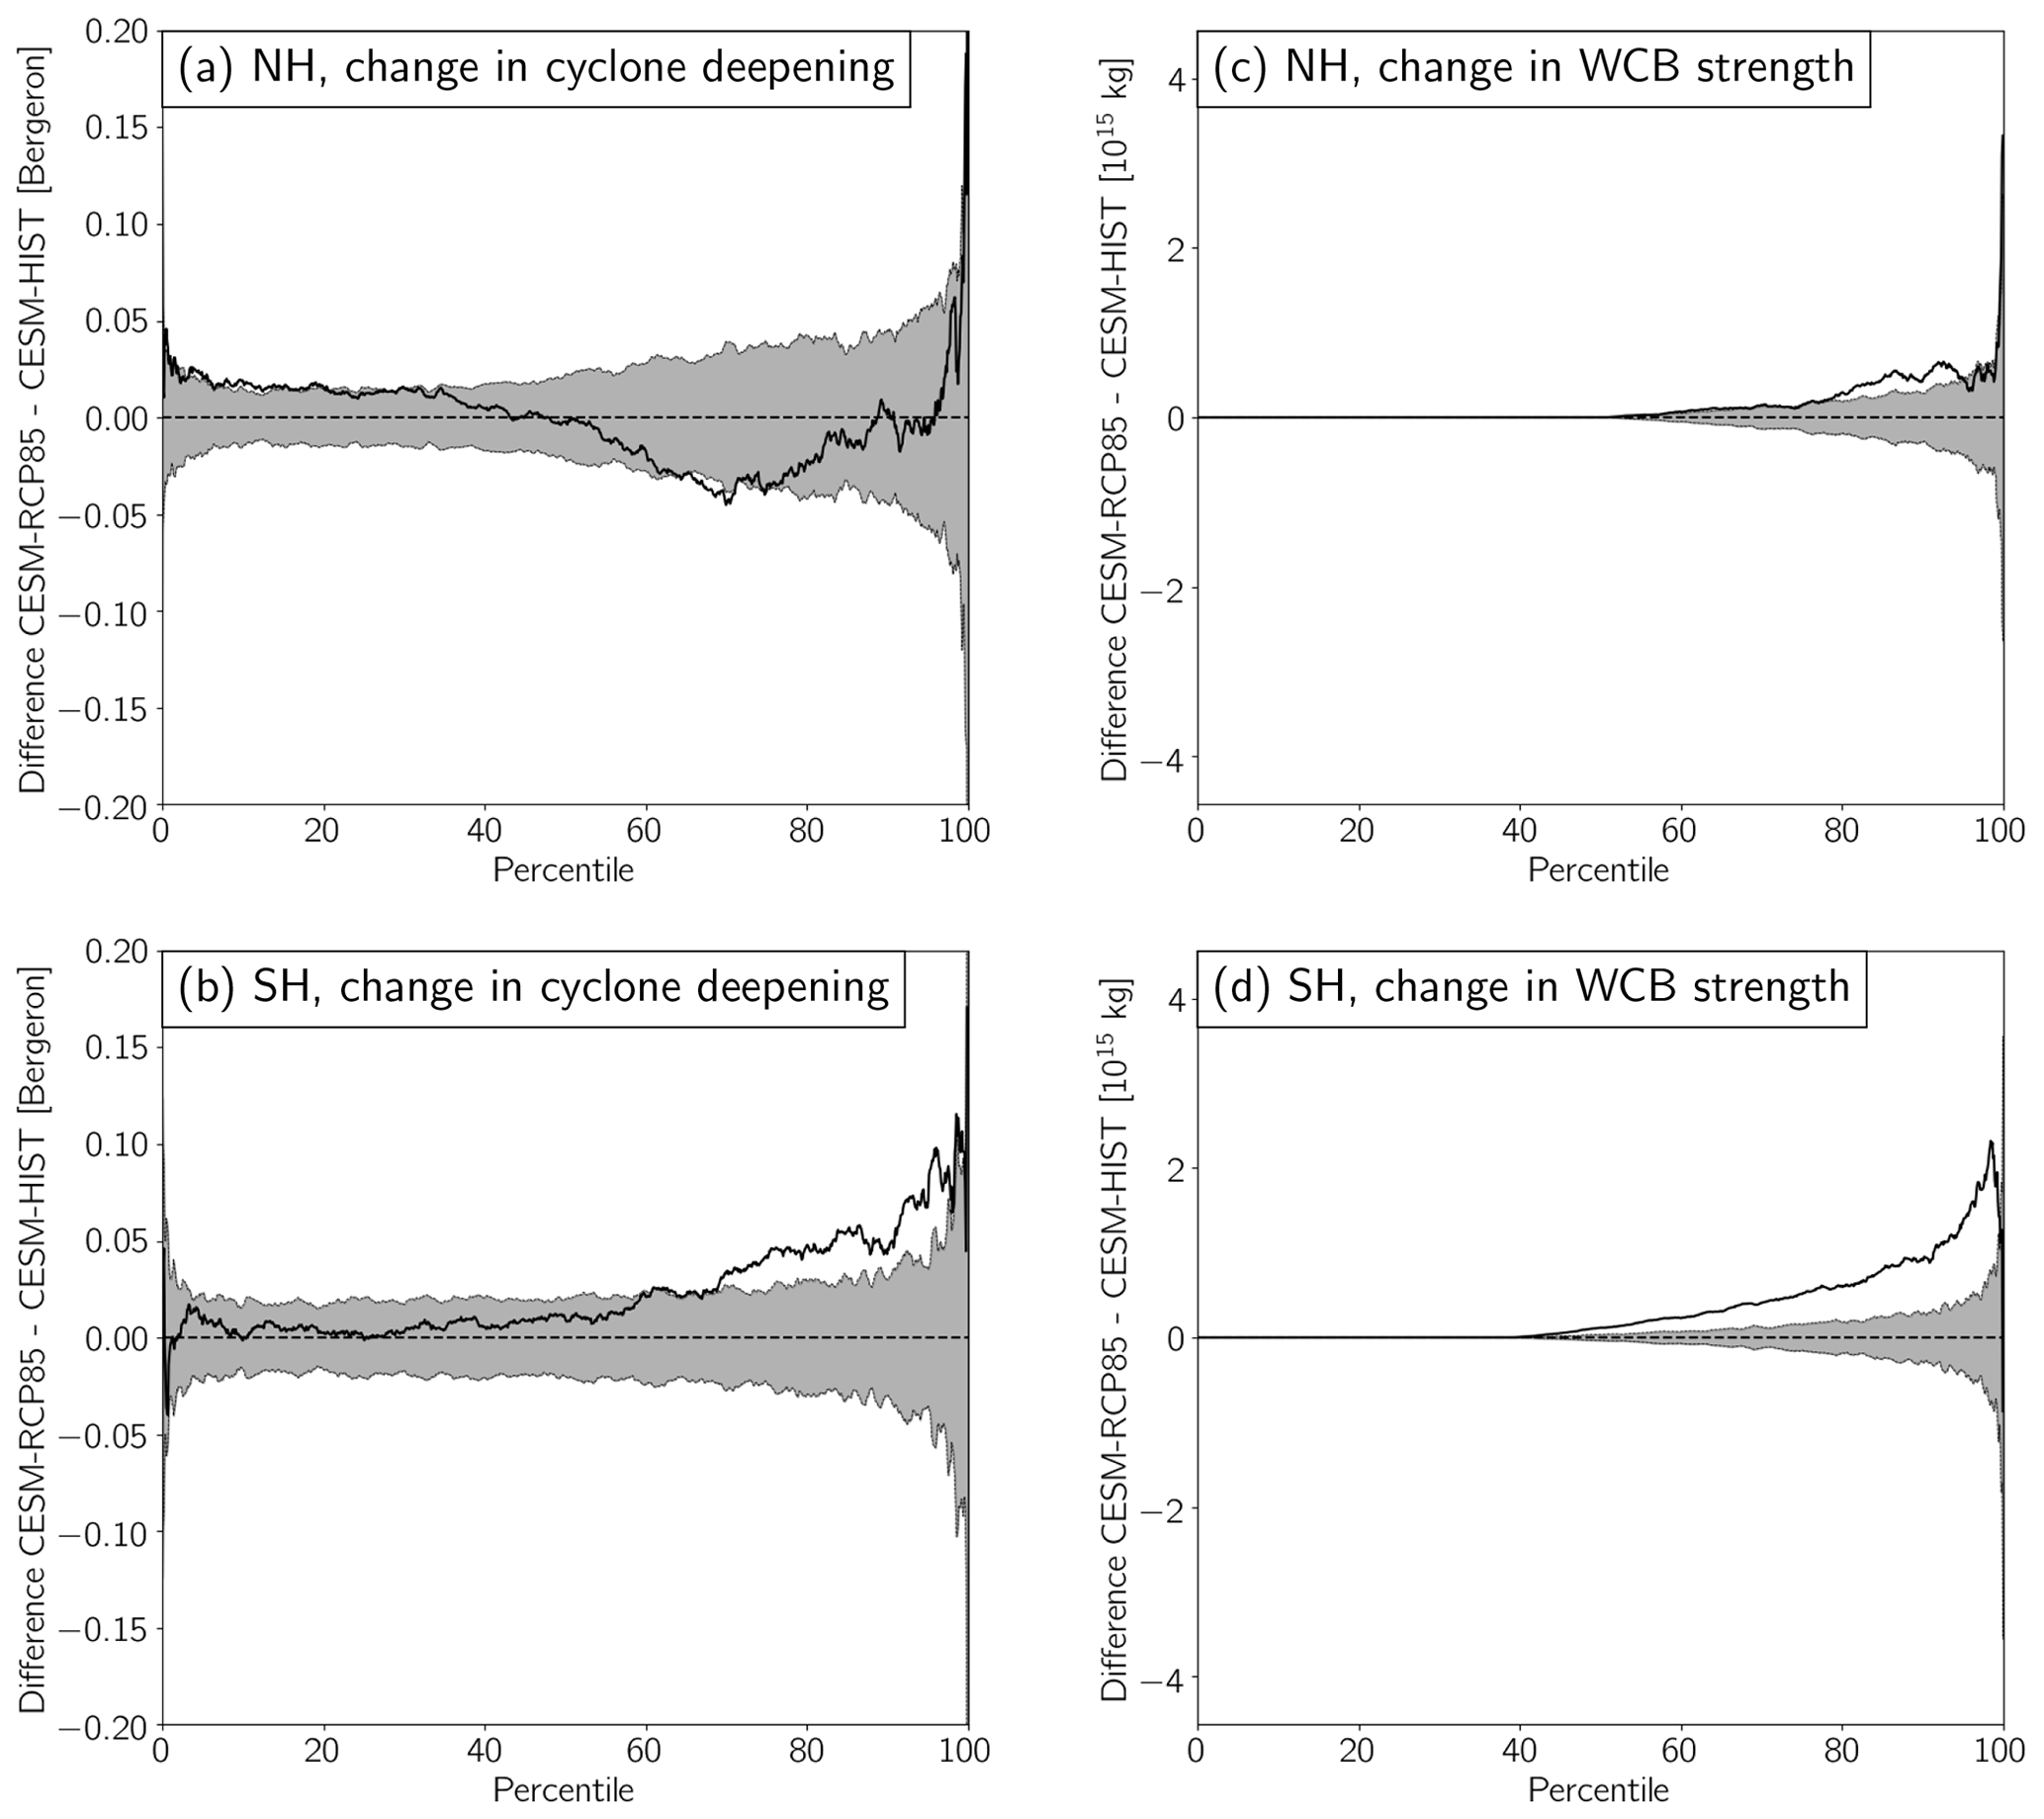
Figure 4The black line shows the difference in the percentile curves between the future and the present-day climate simulations (CESM-RCP85 minus CESM-HIST) of (a, b) cyclone-deepening rates ΔSLPB,max (bergeron) and (c, d) WCB strength associated with the cyclones (1015 kg) in (a, c) NH winter and (b, d) SH winter. The grey shading corresponds to the 95 % confidence interval of the differences under the null hypothesis that the values in CESM-HIST and CESM-RCP85 belong to a common distribution. It has been obtained by calculating 100 000 resamples of the difference in the percentile distribution from two randomly drawn equally sized samples (see text for details).
In NH winter, the cyclone intensification rate is projected to increase slightly in the future climate for the weakest as well as the most rapidly intensifying cyclones and to decrease for the 50th–90th percentile, but the changes are smaller than 0.05 bergerons and not statistically significant for almost all percentiles (Fig. 4a). In SH winter, there is a statistically significant increase in the intensification rates by about 0.03–0.05 bergerons for medium–strong cyclones (70th–90th percentile) and by about 0.05–0.1 bergerons for strongly intensifying cyclones above the 90th percentile (Fig. 4b). Intensification rates typically range from about −0.5 to 3 bergerons (Fig. 2), such that an increase by 0.05–0.1 bergerons for the most strongly intensifying cyclones corresponds to a future change by about 1.5 %–3 %. The small changes in the intensification rates in the NH and the increase for the most extreme cyclones in the SH are in line with previous studies that have assessed future changes in cyclone strength based on different measures (e.g. Catto et al., 2019; Priestley and Catto, 2022).
In both hemispheres, in cyclones that are associated with WCBs, the WCBs become stronger in the future climate (Fig. 4c, d), which is consistent with the findings from Joos et al. (2022) (their Table 1). In the SH, the changes are statistically significant for almost all percentiles (Fig. 4d). The largest increases amount to about 2×10¹⁵ kg, which corresponds to 1500 WCB trajectories per cyclone or 11 %. In the NH, the changes are much smaller and only statistically significant for the 80th–95th percentile (Fig. 4c). There, the increases amount to about 0.4–0.6×10¹⁵ kg, i.e. 300–460 WCB trajectories per cyclone or 2 %–3 %.
The significant increase in the cyclone intensification rate in the SH but not in the NH could in part be due to the much stronger increase in the WCB strength and accordingly the WCB-related latent heating in the SH. In addition, the differences in the intensification rates between the two hemispheres are consistent with the opposite changes in low-level baroclinicity expected with global warming (e.g. Harvey et al., 2014; Catto et al., 2019; see also Introduction): in the SH, low-level baroclinicity is expected to increase, which favourably interacts with the increased WCB strength and leads to stronger cyclones, whereas in the NH it is expected to decrease, which counteracts the effects of the increased WCB strength such that the cyclone intensity does not change considerably or even decreases.
The statistical correlation between the cyclone-deepening rate and the WCB strength is shown in the two-dimensional histograms in Fig. 2c–f. In both hemispheres, cyclone deepening correlates positively with the intensity of the associated WCB in the present-day and future climate simulations, indicating that WCBs continue to play an important role for cyclone intensification in a warming climate. In the NH, the Spearman correlation coefficient has a value of 0.68 in CESM-HIST (Fig. 2c) and 0.66 in CESM-RCP85 (Fig. 2e). In the SH, it increases from 0.51 in CESM-HIST (Fig. 2d) to 0.55 in CESM-RCP85 (Fig. 2f).
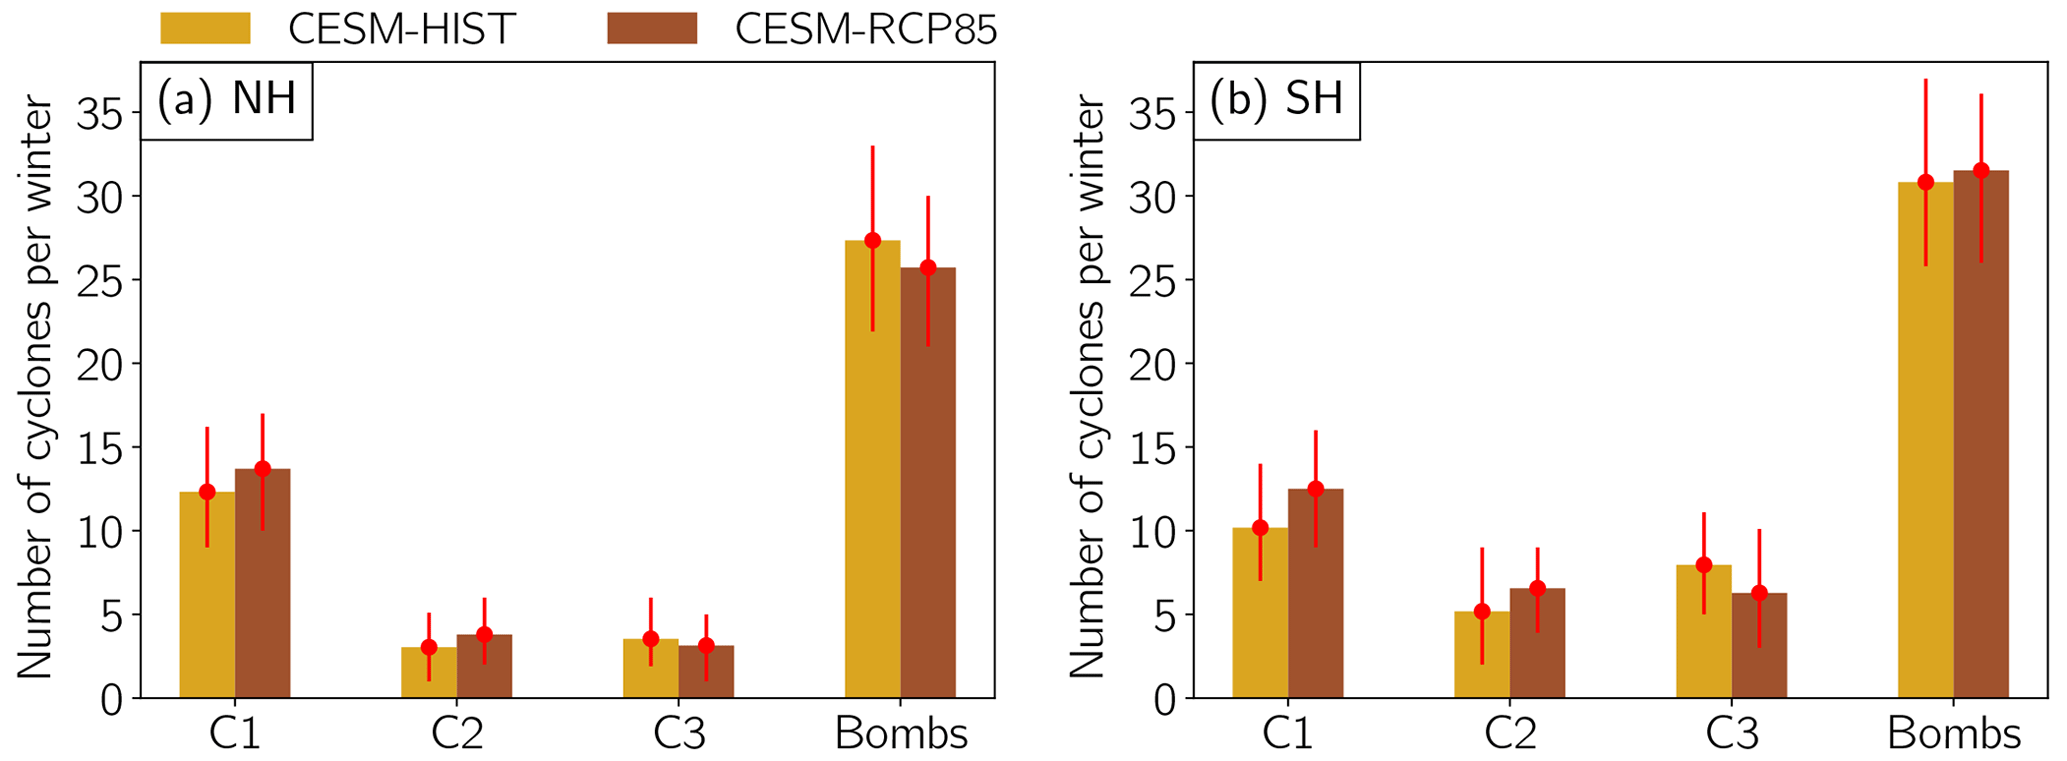
Figure 5Number of C1, C2, C3, and bomb cyclones per winter in CESM-HIST and CESM-RCP85 in the (a) NH and (b) SH. The red circles denote the mean number over the 50 simulated years, and the lower and upper ends of the red vertical lines denote the 10th and 90th percentiles, respectively.
Despite the overall decrease in the number of cyclones per winter in both hemispheres (Table 1), the number of C1 cyclones, i.e. explosively deepening cyclones with strong WCBs, is projected to increase (Fig. 5). In the NH, it increases by 11 % from 12.3 to 13.7 C1 cyclones per winter (Fig. 5a) and in the SH by 23 % from 10.2 to 12.5 cyclones (Fig. 5b). In both hemispheres, there is also a ∼ 25 % increase in the percentage of so-called C2 cyclones, which are defined as in Binder et al. (2016) to have a similar WCB strength to C1 cyclones (at least 2.78×10¹⁵ kg) but a weak deepening rate of less than 0.8 bergerons (see Fig. 2 for the category boundaries). At the same time, the percentage of C3 cyclones, i.e. explosively intensifying cyclones with weak WCBs of less than 0.33×10¹⁵ kg, decreases by 11 % in the NH and 21 % in the SH. The total number of explosive cyclones irrespective of the associated WCB strength (so-called bombs) decreases by 6 % in the NH and increases by 2 % in the SH. The changes in the phase-space diagram in Fig. 2, i.e. the increase in the number of C1 and C2 cyclones and the decrease in C3, are in line with the overall increase in the cyclone-related WCB strength observed in Fig. 4c and d and indicate that cyclones experience stronger latent heating associated with WCBs (as identified with our method) in a future climate.
To sum up, in the SH CESM-LE projects an increase in the WCB strength, the cyclone intensification rate, and the correlation between the two in the future climate winter. An increase is also projected in the total number of explosive cyclones and those with strong WCBs (C1) and in the number of weak cyclones with strong WCBs (C2), whereas the number of “dry bombs” with weak WCBs (C3) decreases. In the NH, the WCB strength is also projected to increase, albeit to a smaller extent than in the SH, and there are no significant changes in the cyclone intensification rates. While the number of C1 and C2 cyclones increases, there is a decrease in the total number of explosive cyclones and in the number of C3 cyclones. In the following, we investigate whether the C1 cyclones themselves will change with regard to spatial distribution, structure, and temporal evolution, in addition to their increase in number.
4.2 Future changes in the characteristics of C1 cyclones
At the beginning of their strongest intensification, both in the present-day and in the future climate simulations, most C1 cyclones are located in the western and central parts of the NH and SH oceans, where WCBs are particularly frequent (not shown). However, in the future simulations, the intensification starts about 1.5∘ farther poleward in the NH and 2∘ farther poleward in the SH (Table 2). In both hemispheres, the poleward shift is relatively small in the Atlantic and larger in the Pacific basin. The shift is in agreement with previous studies (e.g. Yin, 2005; Bengtsson et al., 2009; Priestley and Catto, 2022).
Table 2Mean latitude of C1 cyclones at the beginning of their strongest deepening in the Northern Hemisphere (NH), Southern Hemisphere (SH), North Atlantic (NATL), North Pacific (NPAC), South Atlantic (SATL), and South Pacific (SPAC).
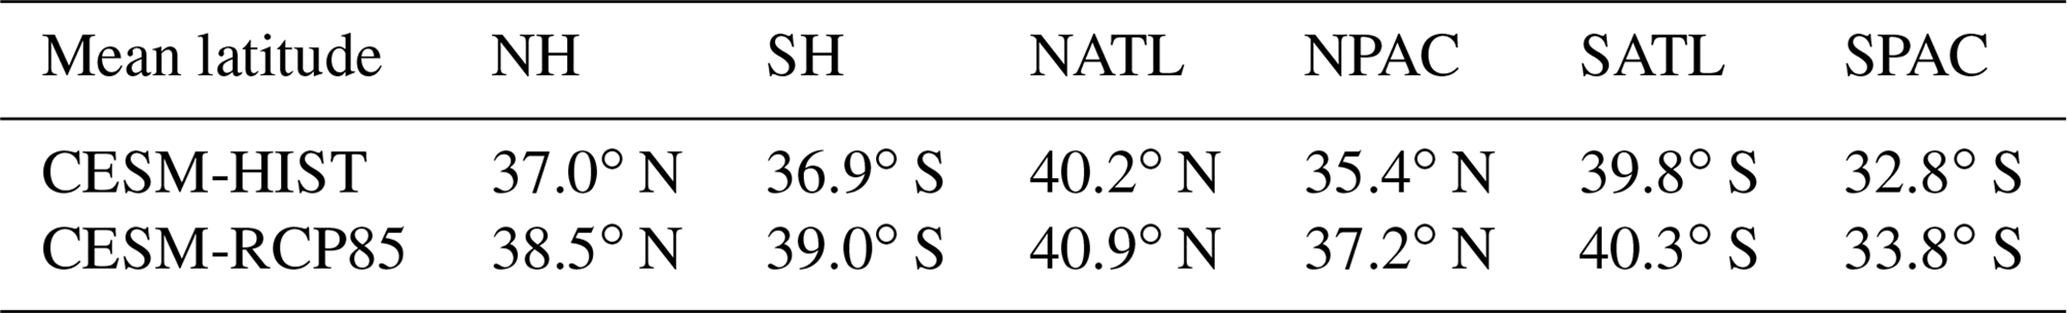
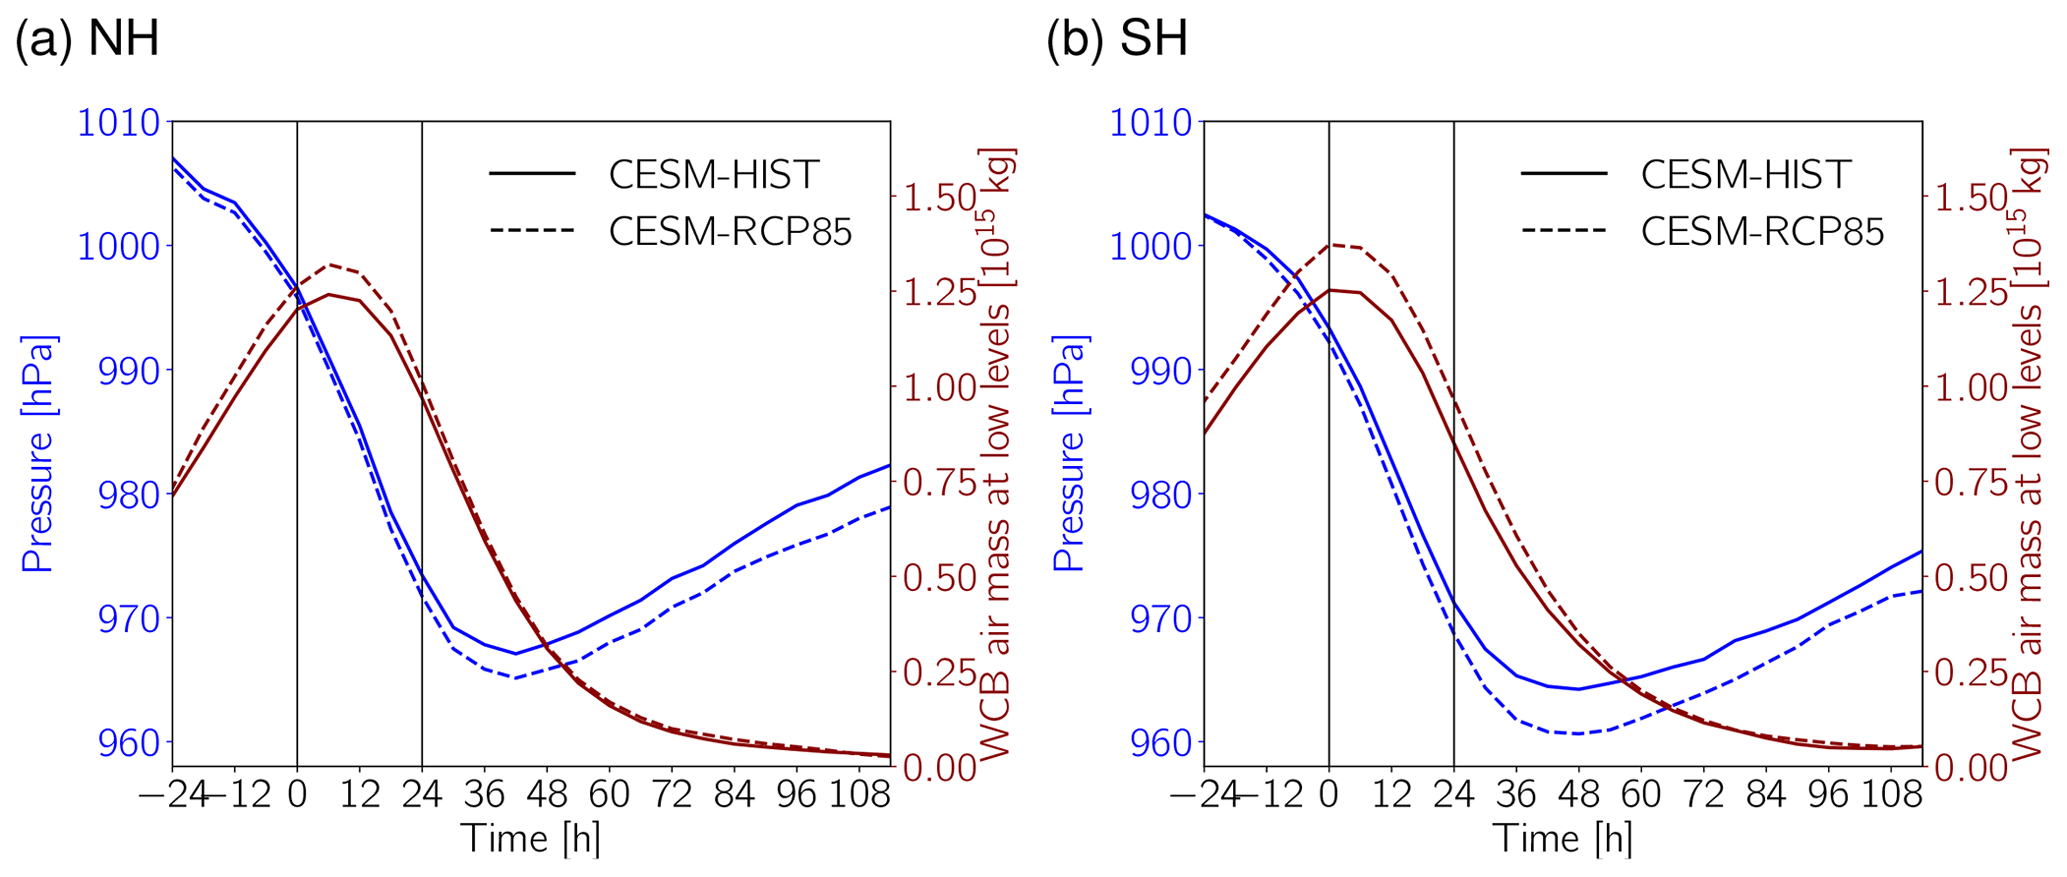
Figure 6Mean time evolution of minimum SLP (hPa; blue) and the WCB air mass at p>500 hPa (red; 1015 kg) along C1 cyclones in CESM-HIST (solid) and CESM-RCP85 (dashed) in the (a) NH and (b) SH. Times t=0 h and t=24 h correspond to the beginning and end of the 24 h period of the strongest cyclone deepening.
The time evolution of minimum SLP and the WCB air mass in the lower troposphere shows for both simulations the explosive deepening of the C1 cyclones and, concomitantly, a rapid increase in the WCB strength, which peaks during the strongest deepening phase (Fig. 6a, b). Consistent with Fig. 4c and d, in both hemispheres but especially in the SH the peak WCB intensity is larger in the future than in the present-day simulations. At the same time, in the future simulations the deepening rate of the C1 cyclones increases slightly and the minimum SLP at the time of the cyclone's strongest intensity is 2 hPa deeper in the NH and 4 hPa deeper in the SH. Thus, in addition to their increase in number (Fig. 5), C1 cyclones also become slightly more intense in a warmer climate.
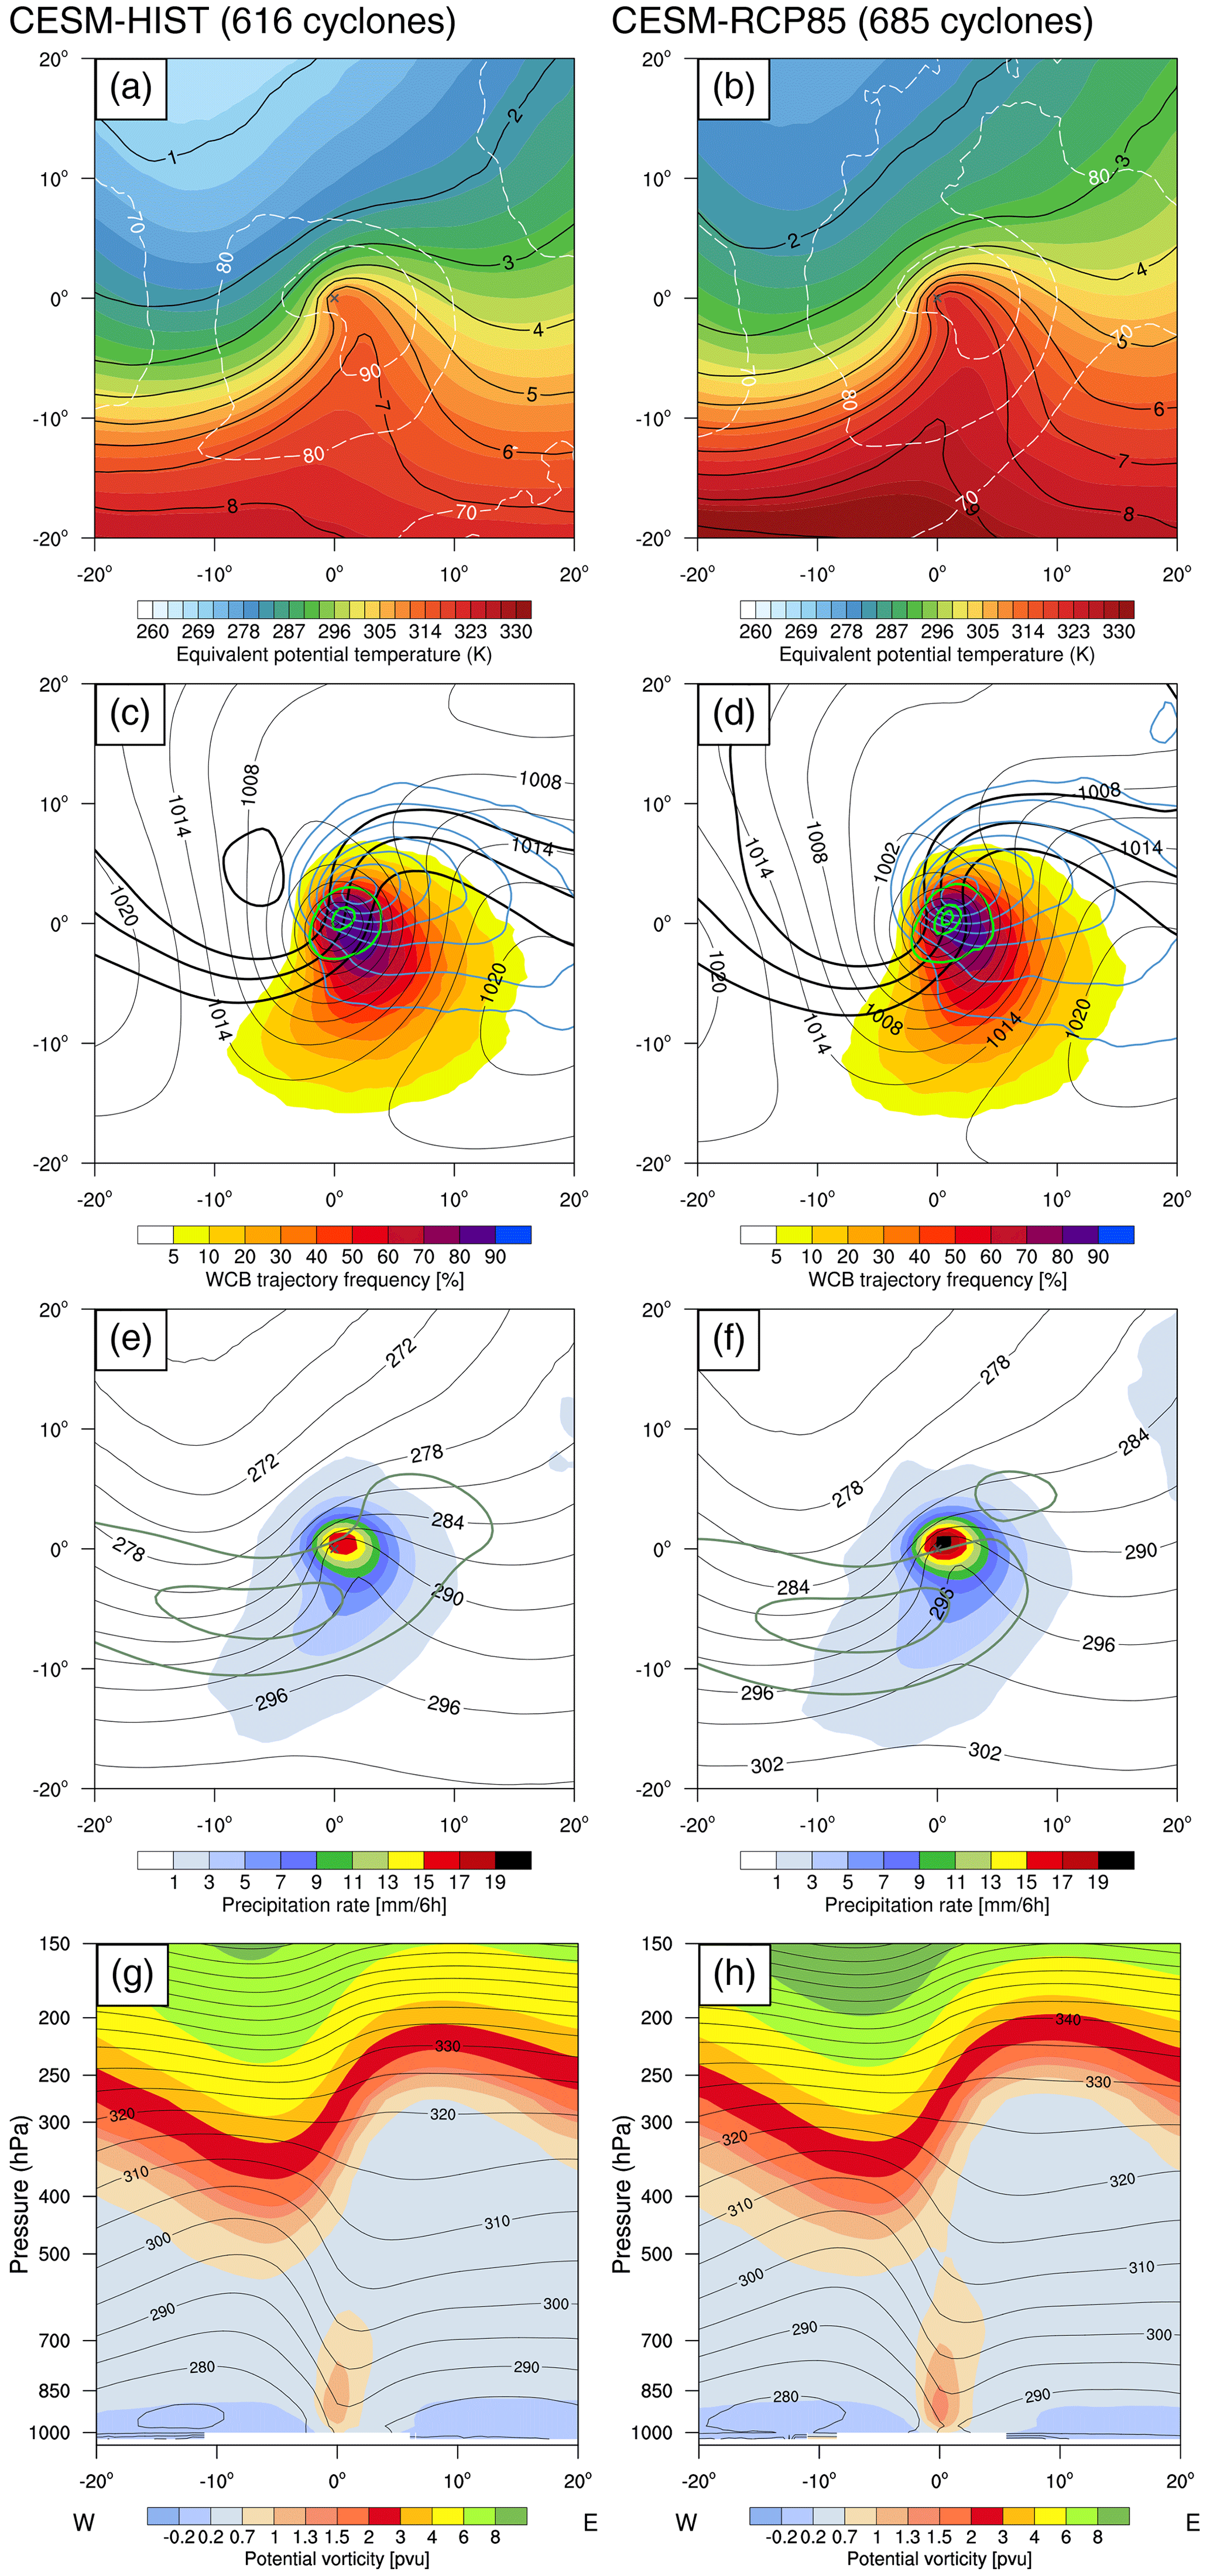
Figure 7Composites of C1 cyclones in NH winter in (a, c, e, g) CESM-HIST and (b, d, f, h) CESM-RCP85 in the middle of the 24 h period of strongest deepening. (a, b) Equivalent potential temperature (K; shading), specific humidity (black contours every g kg−1), and relative humidity (dashed white contours every 10 %) at 850 hPa. Fields in (c) and (d) are as in Fig. 3a and b; fields in (e) and (f) are as in Fig. 3c and d; fields in (g) and (h) are as in Fig. 3e and f.
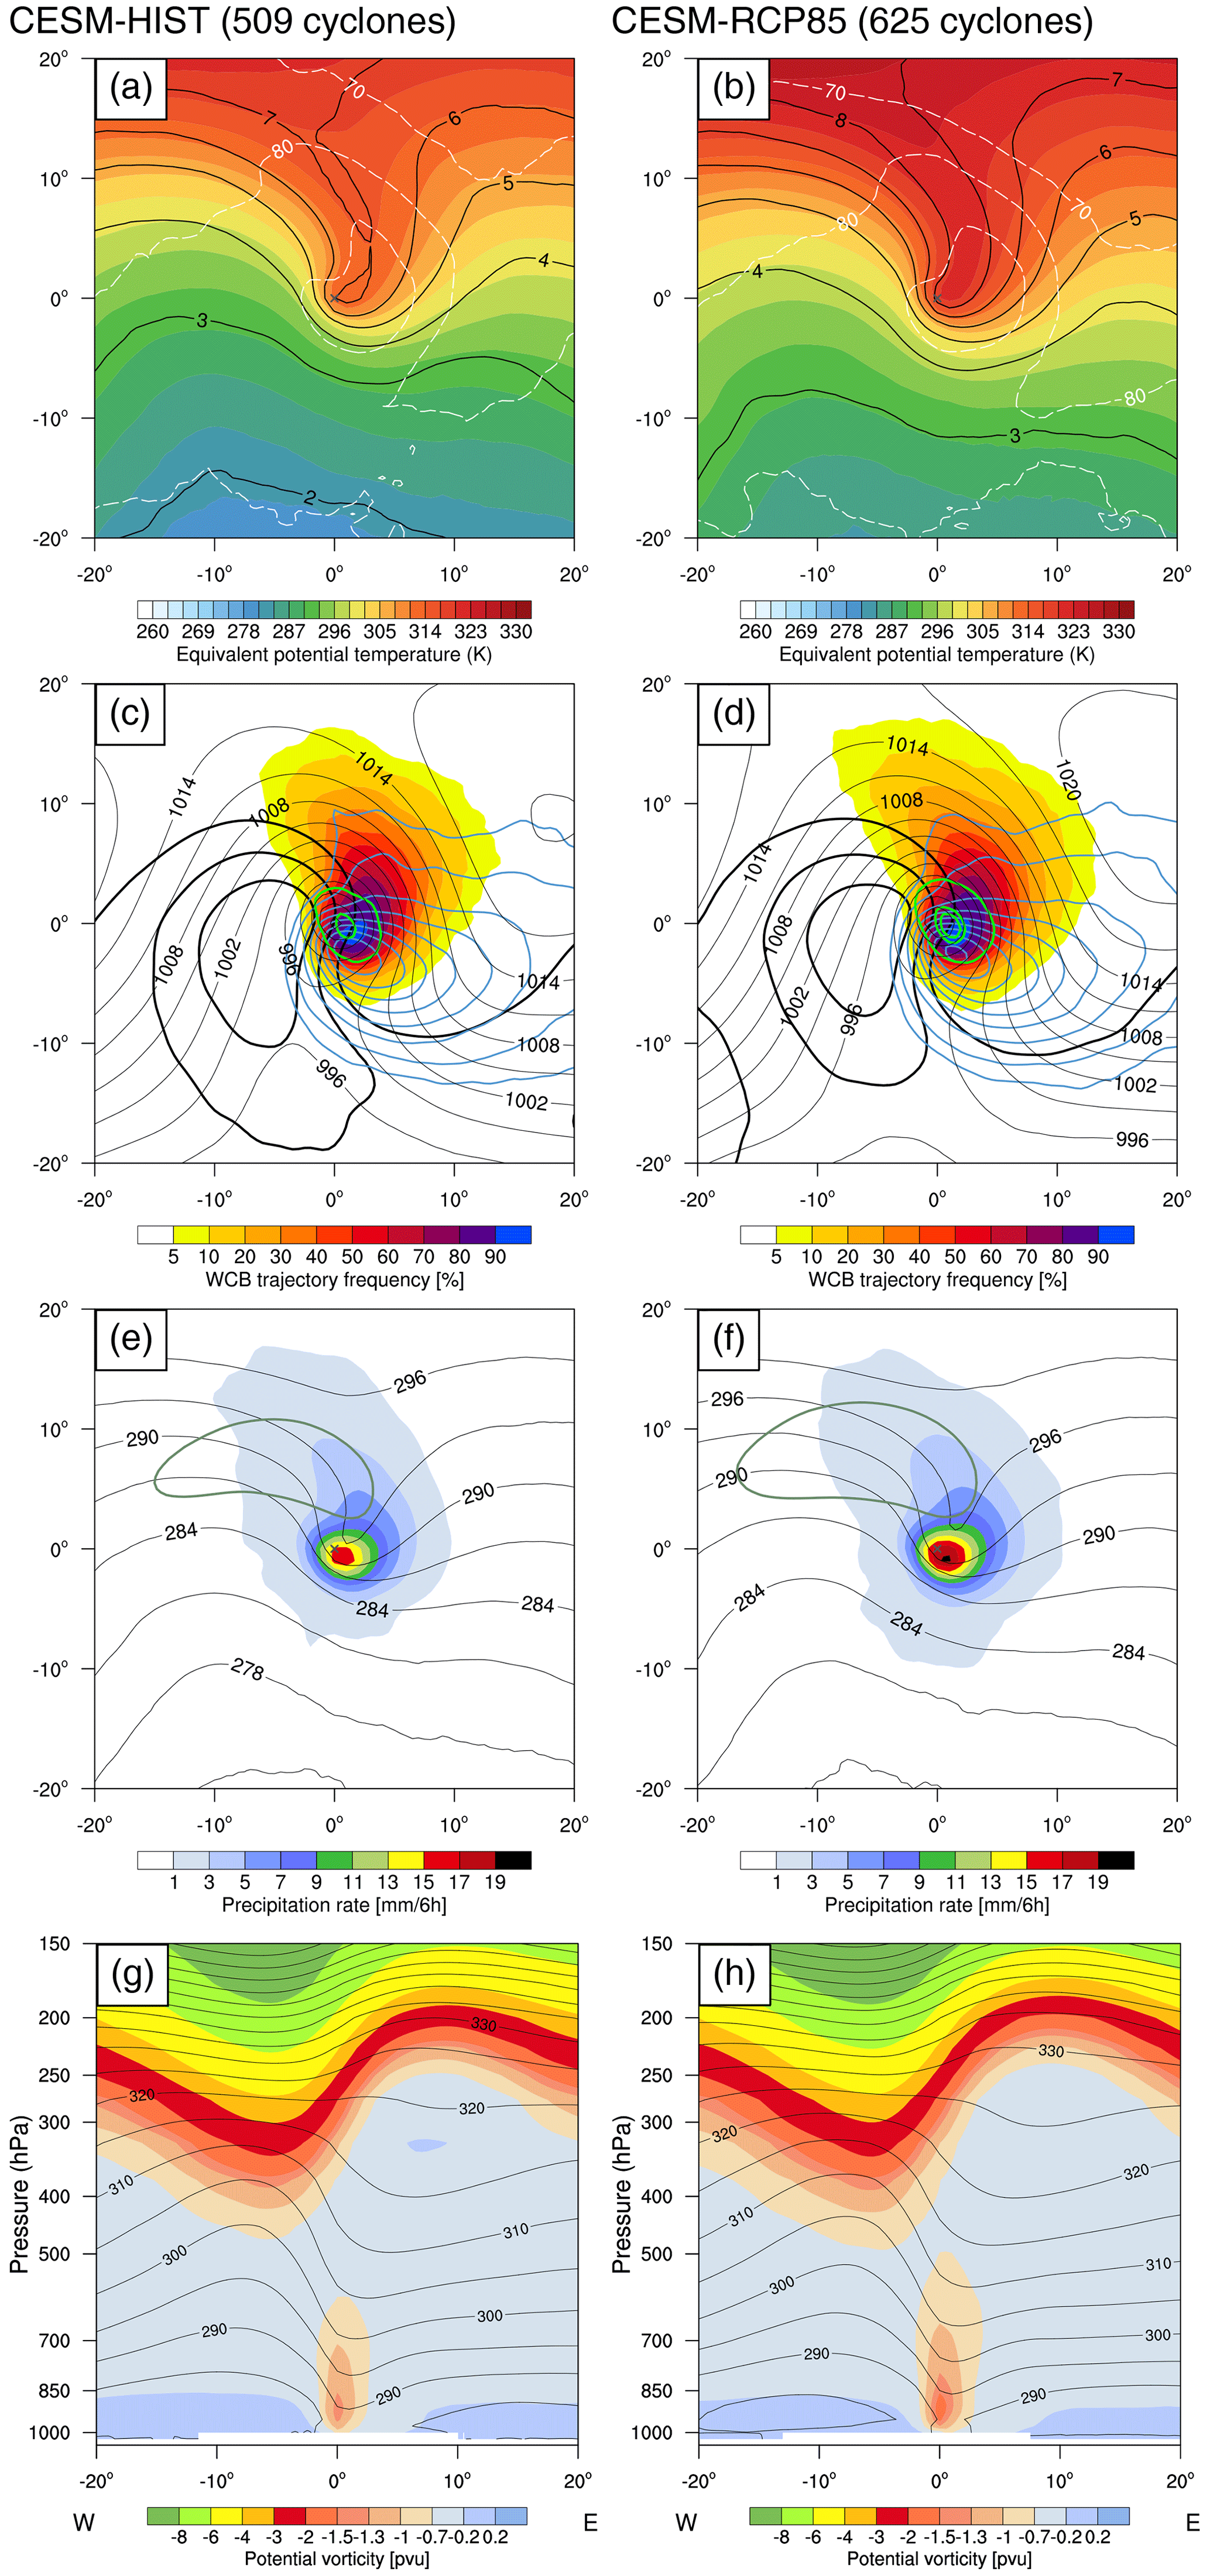
Figures 7 and 8 show the composite structure of the C1 cyclones in the NH and SH, respectively, in the middle of the 24 h period of strongest intensification, in the present-day and future climate simulations. The fields in Fig. 7c, e, and g for CESM-HIST are the same as those in the previously discussed Fig. 3. Comparison of the cyclones in the two hemispheres in the present-day simulations shows that they have a quite similar structure during the deepening phase. Both in the NH and in the SH, the composite cyclone is situated ahead of an intense upper-level trough in the left exit region of a jet maximum (Figs. 7c, e, g and 8c, e, g). However, in the NH the PV gradient along the trough is stronger and the jet more intense. Also the Equator-to-pole potential temperature gradient at 850 hPa is stronger than in the SH (cf. Figs. 7e and 8e). On the other hand, C1 cyclones in the SH are associated with higher low-level humidity, a larger WCB frequency, higher diabatically produced low-level PV, and deeper SLP (cf. Figs. 7a, c, g and 8a, c, g).
The composite cyclones' surroundings become significantly warmer and moister in the future climate. In the cyclone centre, potential temperature, equivalent potential temperature, and specific humidity at 850 hPa increase by about 3 K, 6 K, and 1.5–2 g kg−1 in both hemispheres (Figs. 7a, b, e, f and 8a, b, e, f). The relative humidity at 850 hPa, on the other hand, does not change considerably near the cyclone centre, as it is already close to saturation in CESM-HIST (Figs. 7a, b and 8a, b). The Equator-to-pole potential temperature gradient at 850 hPa in the environment of the C1 cyclones decreases slightly in the NH (Fig. 7e, f) and increases slightly in the SH (Fig. 8e, f).
The low- and upper-level WCB frequencies have very similar magnitudes in CESM-HIST and CESM-RCP85 (Fig. 7c, d and 8c, d). This is in apparent contradiction to the previously discussed increase in the WCB strength in the future climate (Figs. 4c, d and 6). However, the low- and upper-level frequencies in these composites only indicate the fraction of C1 cyclones with at least one WCB air parcel at a specific grid point in the lower or upper troposphere – if a cyclone is associated with many WCB air parcels at a grid point, it does not contribute to higher frequencies in the composite compared to if the cyclone only has one WCB air parcel at this grid point. In CESM-RCP85, close to the cyclone centre the number of low- and upper-level WCB air parcels is typically higher, particularly in the SH (not shown). The percentage of C1 cyclones with trajectories producing high values of low-level PV increases around the cyclone centre by about 5 % in the NH (Fig. 7c, d) and 10 % in the SH (Fig. 8c, d) in the future simulations, pointing to an increase in the WCB-related cyclonic PV formation. In the same area, the maximum precipitation increases by 3 mm (6 h)−1 in both hemispheres (Figs. 7e, f and 8e, f), and the diabatically produced low-level PV intensifies by 0.3 pvu in the NH and 0.2 pvu in the SH and extends toward higher levels (Figs. 7g, h and 8g, h). The intensification of the PV anomaly and the extension toward higher levels are consistent with the enhanced diabatic heating rate along the WCB trajectories and the increase in the altitude of the maximum diabatic heating found in Joos et al. (2022). At upper levels, the cyclonically breaking Rossby wave and the jet have similar intensities in the present-day and future climate simulations (Figs. 7c–f and 8c–f).
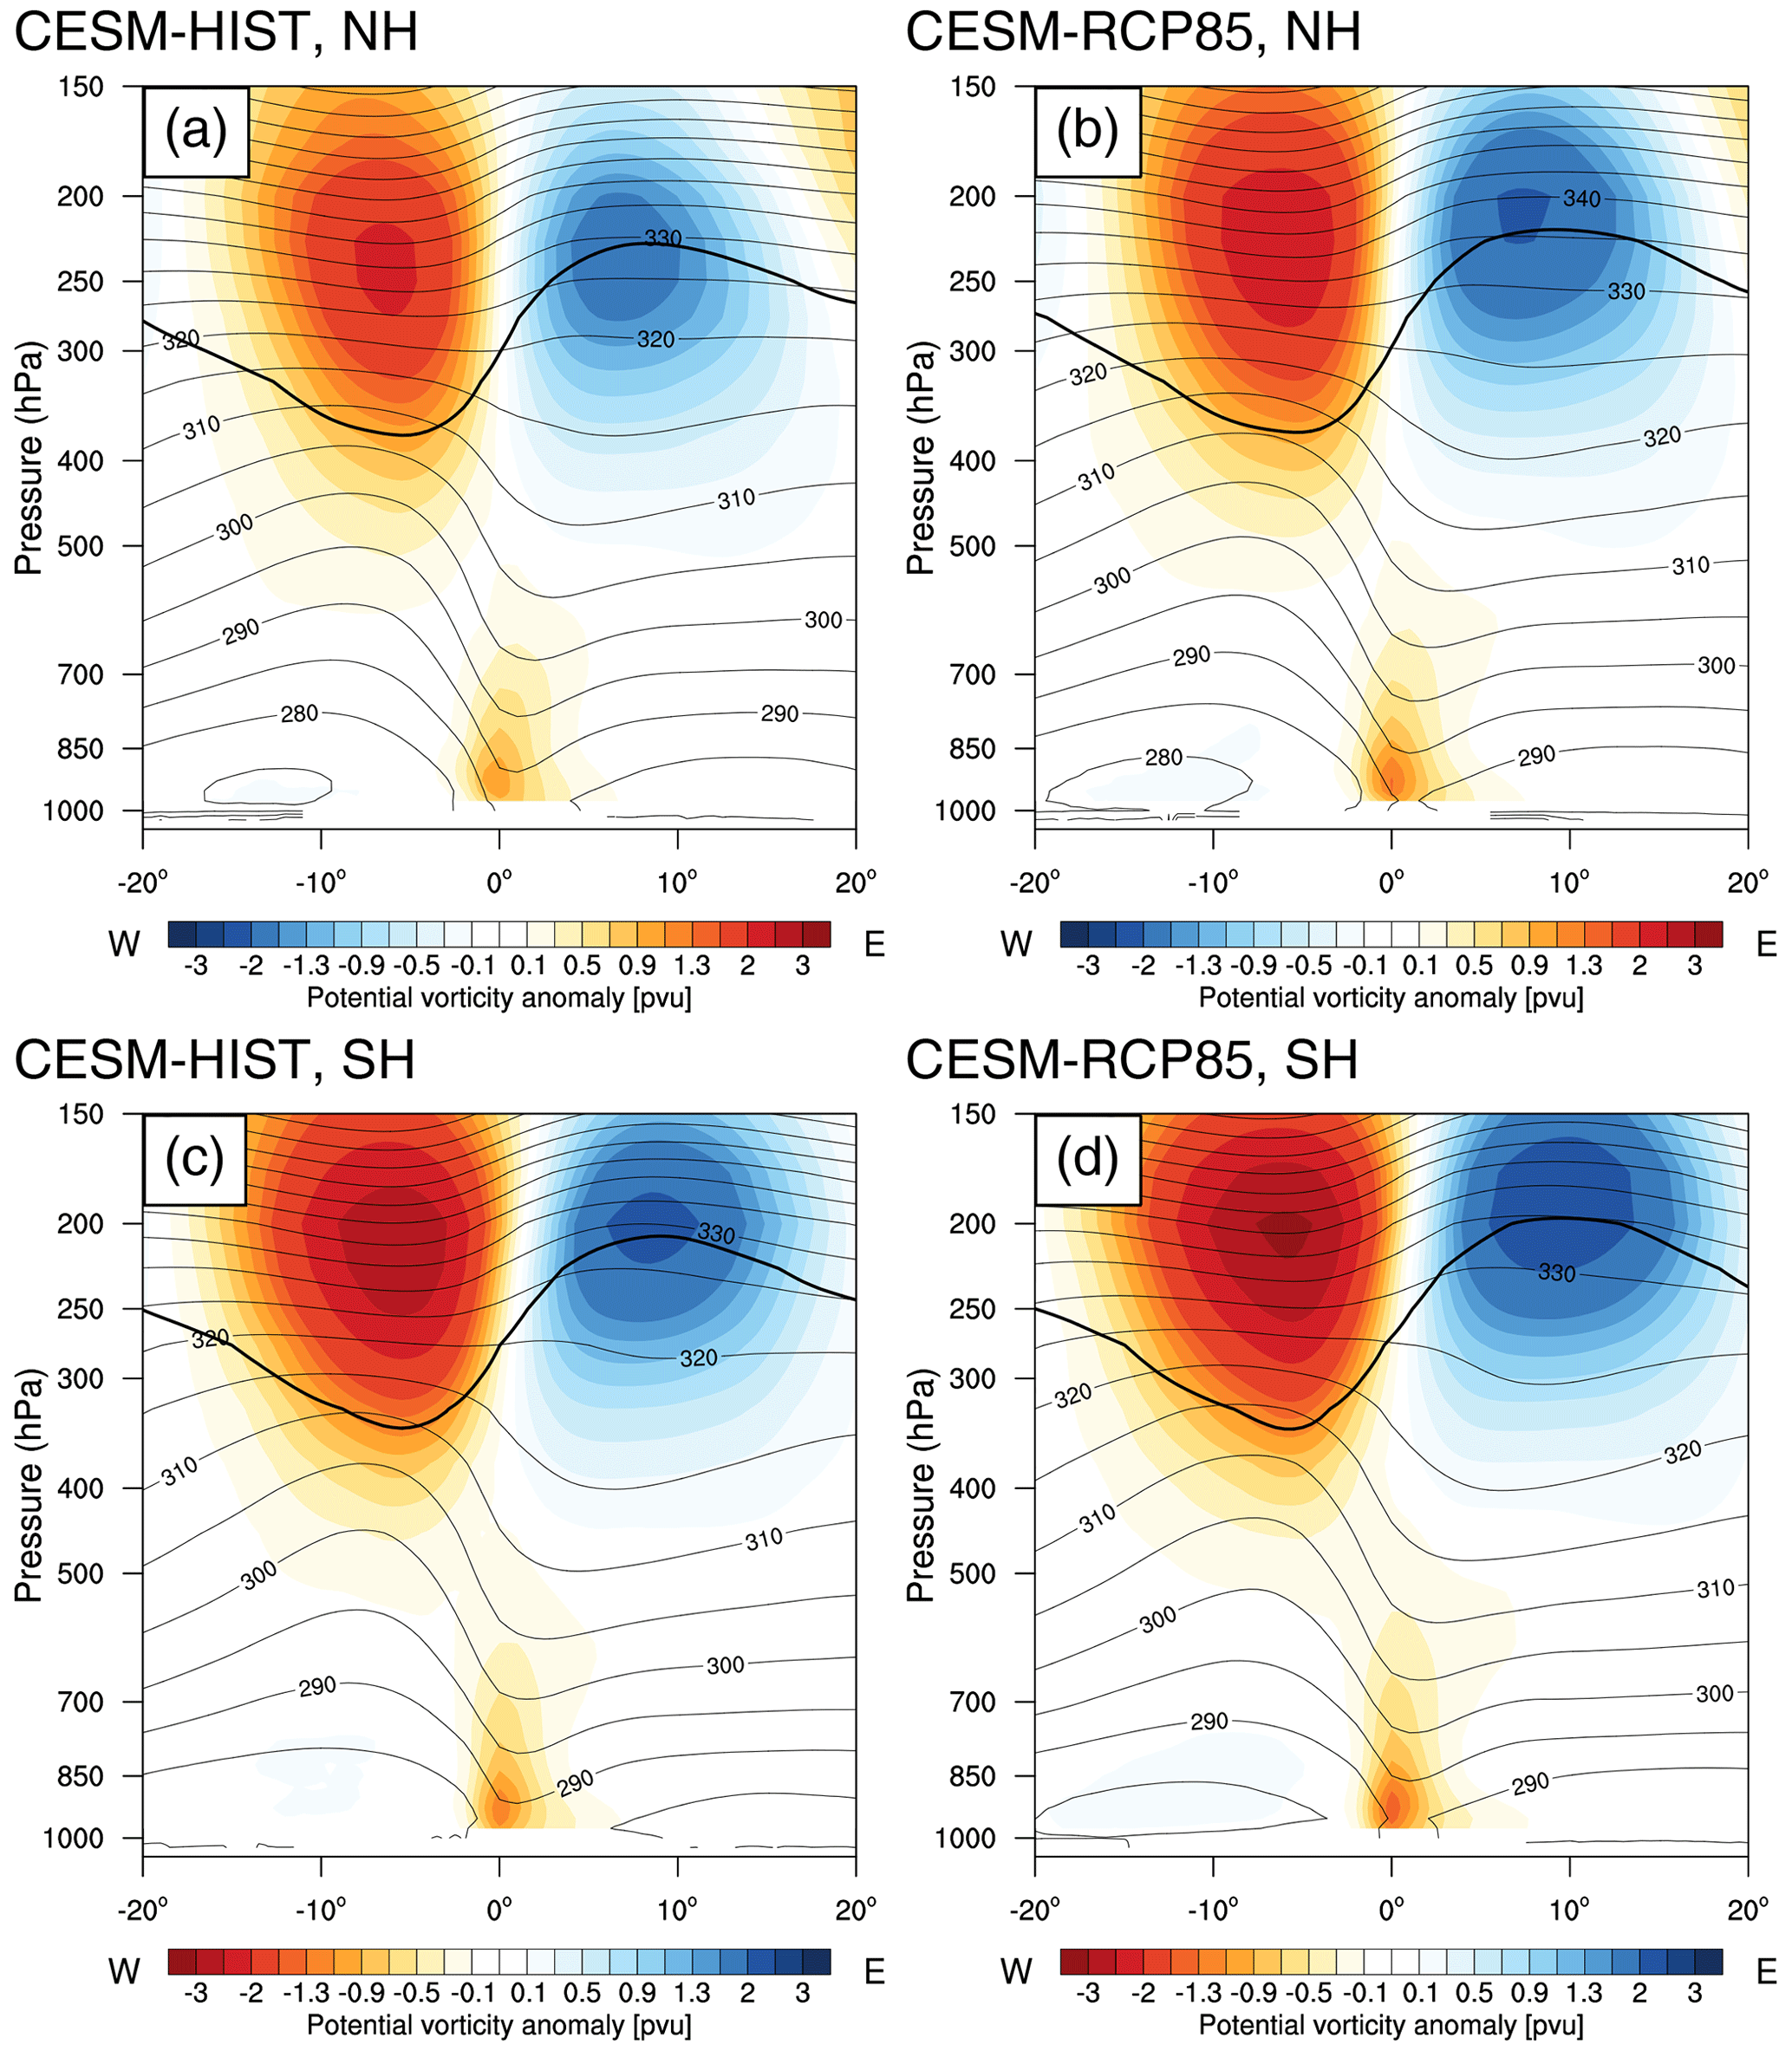
Figure 9West–east-oriented cross section across the centre of the composite cyclone, in the middle of the 24 h period of strongest deepening, showing the PV anomaly (pvu; shading), the 2 pvu contour (thick black contour), and potential temperature (thin black contours every 5 K). The fields are shown for (a, b) NH winter and (c, d) SH winter in (a, c) CESM-HIST and (b, d) CESM-RCP85.
Figure 9 shows the PV anomalies in a west–east vertical cross section through the centre of the composite cyclone. For each cyclone before the compositing, the PV anomalies have been calculated by subtracting the 50-year climatological mean PV value of the specific climate simulations from the actual PV value at this position. Consistently with the PV cross sections (Figs. 7g, h and 8g, h), in both hemispheres the diabatically produced cyclonic low-level PV anomaly is amplified in the future climate; i.e. it becomes more positive in the NH (Fig. 9a, b) and more negative in the SH (Fig. 9c, d). The upper-level disturbance to the west of the cyclone centre also corresponds to a cyclonic PV anomaly, and it intensifies as well in the future climate. However, the relative increase in the peak values is much larger for the cyclonic low-level PV anomaly than for the cyclonic upper-level PV anomaly (25.5 % vs. 11.1 % in the NH and 14 % vs. 7.2 % in the SH, Tables 3 and 4). This suggests that the enhanced deepening and stronger intensity of the C1 cyclones in the future simulations observed in Fig. 6 are mainly associated with the enhanced WCB-related diabatic PV production and in the SH additionally with the increased low-level baroclinicity in the cyclones' surroundings. Downstream of the cyclone centre, the elevated tropopause is associated with anticyclonic upper-level PV anomalies, which are also amplified in the future climate (Fig. 9 and Tables 3, 4). This amplification is consistent with the intensification of the WCB and the WCB-related latent heating, which results in a stronger transport of anticyclonic PV into the tropopause region (see Introduction).
Table 3Maximum values of the cyclonic low-level, cyclonic upper-level, and anticyclonic upper-level PV anomaly in C1 cyclones in NH winter in the middle (t=12 h) and at the end (t=24 h) of the 24 h period of strongest deepening in CESM-HIST and CESM-RCP85 and the relative change between the two simulation periods.
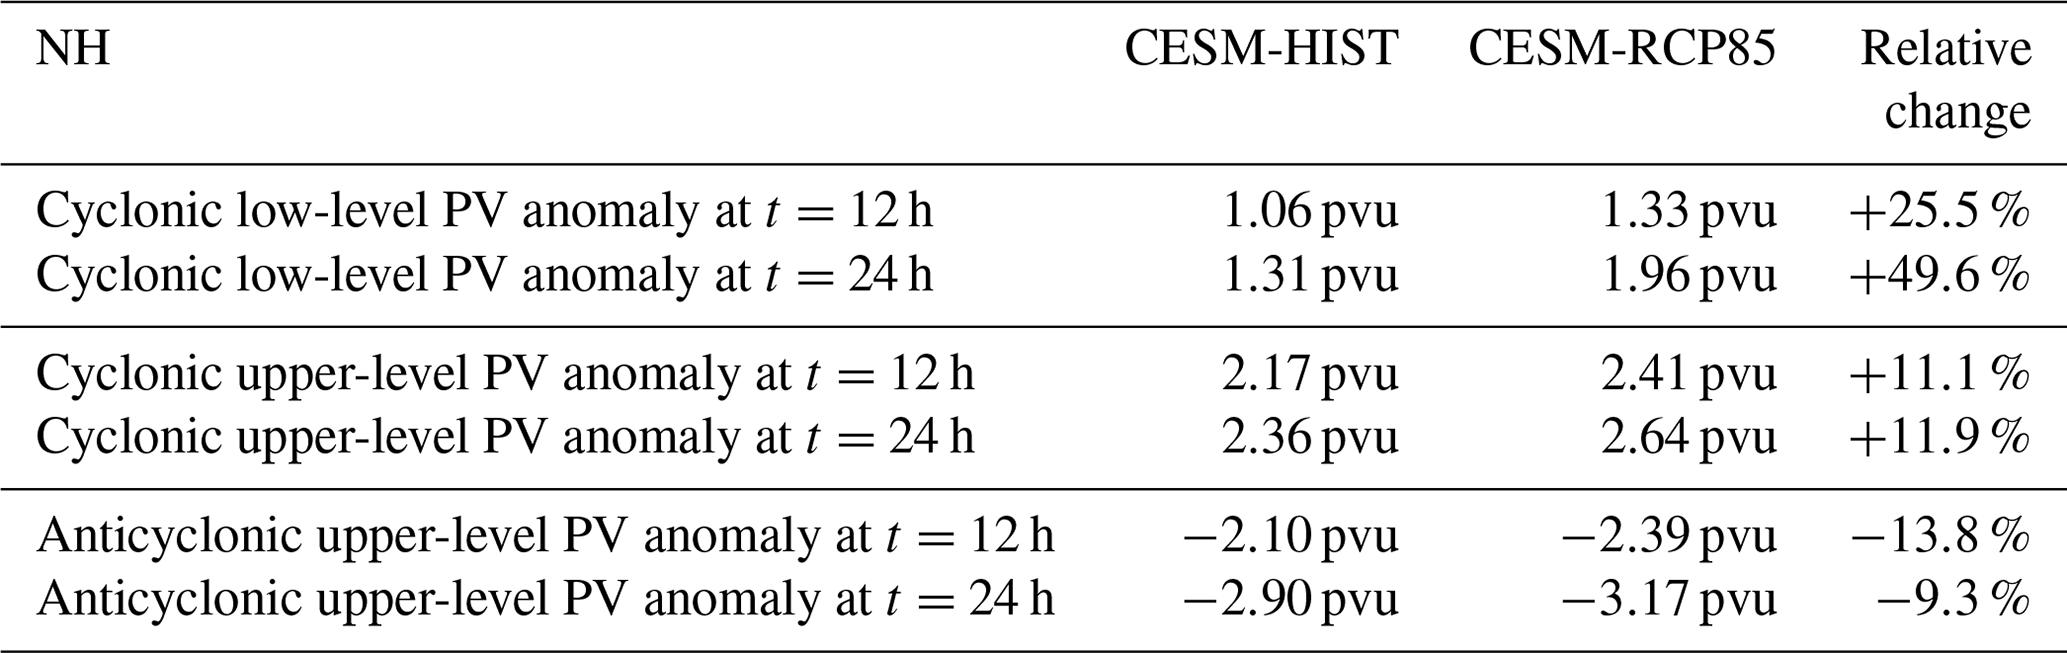
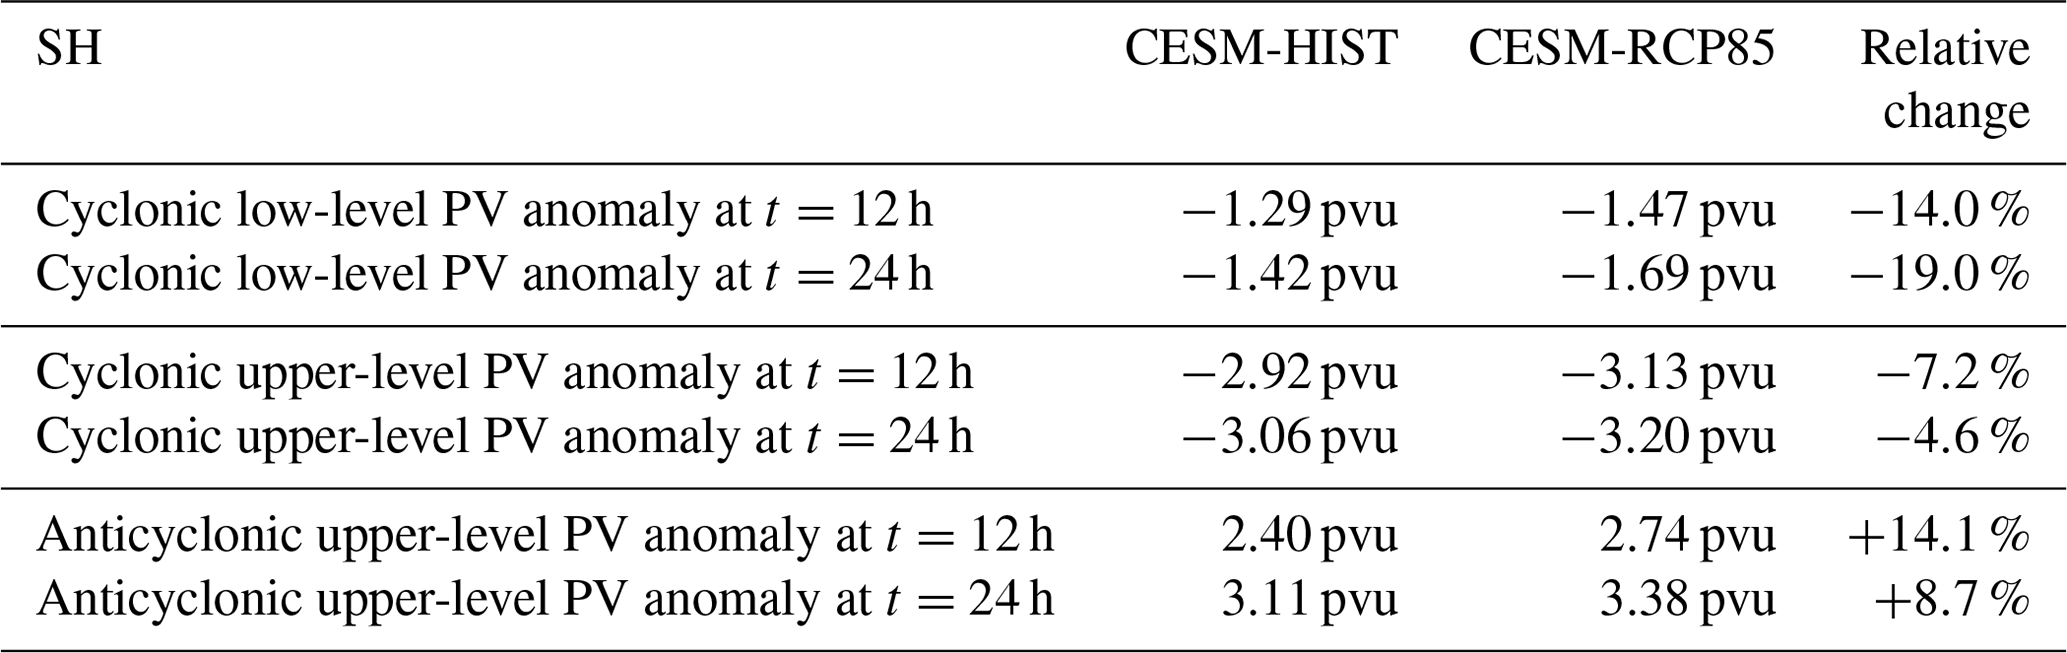
We also investigated the composite structure of the C1 cyclones 12 h later, at the end of the 24 h interval of explosive deepening (not shown). Also at this time step, the WCB-related diabatic PV production intensifies in the future climate (Fig. 6) and contributes to the formation of a stronger PV tower (not shown) and 1.7 hPa deeper minimum SLP in the NH and 2.5 hPa deeper minimum SLP in the SH, respectively (Fig. 6). The maximum values of the cyclonic low-level PV anomalies increase by almost 50 % in the NH and 19 % in the SH in the future climate, whereas the peak values of the cyclonic upper-level PV anomaly only increase by about 12 % and 5 %, respectively (Tables 3, 4). The anticyclonic upper-level PV anomalies downstream of the cyclone centre also increase (Tables 3, 4) and push the tropopause slightly further upward and toward the poles (not shown).
In summary, in both hemispheres it is projected that C1 cyclones will have even stronger WCBs, stronger WCB-related diabatic PV production, an extension of the diabatically produced PV toward higher levels, and an increased precipitation rate in the future climate. They will become warmer, moister, and slightly more intense.
In this study, we quantified the role of WCBs and their diabatically produced PV anomalies for cyclone intensification in present-day (1990–1999) and future (2091–2100) climate simulations of the Community Earth System Model Large Ensemble (CESM-LE). The present-day simulations (CESM-HIST) were based on historical climate forcing (Lamarque et al., 2010) and the future simulations (CESM-RCP85) on the Representative Concentration Pathway 8.5 (RCP8.5) emission scenario (Lamarque et al., 2011; Meinshausen et al., 2011). The aims were to (i) assess whether the climate model is able to adequately represent the cyclone properties and the associated WCBs by comparing the present-day simulations with ERA-Interim reanalyses and (ii) evaluate how climate change affects the importance of WCB-induced diabatic PV production for cyclone intensification in the winter season in both hemispheres. Such a detailed investigation of the role of WCBs for cyclone intensification in climate models is not straightforward and was only possible because CESM-LE has been rerun to obtain 6-hourly three-dimensional output of the wind fields. To address the aims, a large number of cyclones and their associated WCB trajectories have been identified in the climate simulations and in ERA-Interim during NH and SH winter. Cyclone deepening has been measured by the maximum 24 h SLP change during the cyclone lifecycle, adjusted by latitude (Sanders and Gyakum, 1980), and the WCB intensity has been measured by the WCB air mass located in the lower troposphere (p>500 hPa) during the 24 h interval of strongest intensification of the associated cyclone. Based on the questions posed in the Introduction, the key findings of the study can be summarized as follows:
-
Compared to ERA-Interim, the climate model is able to represent the properties and three-dimensional structure of extratropical cyclones, as well as the associated WCBs, reasonably well. Particularly in SH winter, there are very small differences between the present-day simulations and the reanalyses in terms of the cyclone-deepening rates, the WCB strength, and the statistical relationship between the two. In NH winter, the present-day simulations capture the deepening rates of the weak and medium–strong cyclones, but they underestimate them for the most explosive cyclones by 0.1–0.3 bergerons. The WCB strength and the link between WCB strength and the cyclone-deepening rate is also well captured in the NH. In the subgroup of explosive cyclones with intense WCBs (C1), in both hemispheres the model is able to reproduce the composite fields of the cyclones during the deepening phase in terms of upper-level PV and jet structure, low-level potential temperature, SLP, the precipitation pattern, and the position of the WCB trajectories, but it underestimates the diabatically produced low-level PV anomaly by about 0.5 pvu.
-
In the SH, comparison of the simulations reveals an increase in the WCB strength and – for the medium–strong and strongly intensifying cyclones – the cyclone intensification rate in the future climate. In the NH, the WCB strength is also projected to increase, albeit to a smaller extent than in the SH, and overall there are no significant changes in the cyclone-deepening rates. The enhanced cyclone-deepening rate of the medium–strong and strongly deepening cyclones in the SH but not in the NH could partly be associated with the stronger increase in the WCB strength and accordingly the WCB-related diabatic heating in the SH. Further analyses are required to quantify this effect of increased WCB strength on cyclone deepening compared to the role of a potentially modified baroclinicity or Eady growth rate in the two hemispheres.
-
In both hemispheres, the cyclone-deepening rate correlates positively with the strength of the associated WCB, with a Spearman rank correlation coefficient in the present-day simulation of 0.68 in the NH and 0.51 in the SH and in the future simulation of 0.66 in the NH and 0.55 in the SH. Thus, both in the present-day and in the future simulations, there is a distinct statistical signal that cyclones with a more intense WCB typically experience stronger deepening. While many cyclones do not have any WCB, the majority of the explosive cyclones have strong WCBs. The number of explosive cyclones with a strong WCB (C1) increases in the future simulations, whereas the number of explosive cyclones with a weak WCB (C3) decreases. In addition to the increase in number, the C1 cyclones themselves are projected to be associated with even stronger WCBs, more WCB-related diabatic PV production in the cyclone centre, an extension of the diabatically produced PV toward higher levels, the formation of a stronger PV tower at the end of the explosive deepening phase, higher precipitation rates, and becoming warmer and moister. Their deepening intensifies slightly, with an enhanced decrease in the minimum SLP by 2 hPa in the NH and 4 hPa in the SH at the time of the strongest intensity. Low-level baroclinicity in the cyclones' surroundings decreases slightly in the NH and increases slightly in the SH. The relative increase in the diabatically produced PV anomaly is much stronger than the relative increase in the cyclonic upper-level PV anomaly upstream of the cyclone centre. This indicates that the stronger diabatic PV production in the WCBs and, in the SH additionally, the increased baroclinicity in the cyclones' surroundings are essential for the enhanced deepening and stronger intensity of C1 cyclones in a warmer climate. As a note of caution we recall that diabatic PV production is underestimated in the climate model compared to reanalyses, and therefore the diagnosed link between WCB strength, diabatic PV production, and cyclone intensification might be affected by model uncertainties.
The overall good representation of the cyclone structure and key properties in CESM-HIST in comparison to ERA-Interim is in line with the findings from Bengtsson et al. (2009) and Catto et al. (2010) for other climate models. However, the underestimation of the diabatically produced low-level PV anomaly by 0.5 pvu is relatively strong. A possible reason for this underestimation could be the lower spatial resolution (30 vertical levels in CESM-LE vs. 60 in ERA-Interim and about 1.25∘ vs. 1∘ horizontal resolution). Furthermore, the two models are based on different parameterization schemes for subgrid-scale processes, and in particular a different treatment of cloud microphysical and convective processes could contribute to the discrepancies in the intensity of the diabatically produced PV anomaly. Problems in the representation of cloud-diabatic processes in extratropical cyclones have also been reported for other climate models (e.g. Govekar et al., 2014; Catto et al., 2015a; Hawcroft et al., 2016, 2017). However, ERA-Interim is also associated with biases in the representation of moist processes when compared to satellite data (Binder, 2017; Hawcroft et al., 2017). Aside from the fact that the two data sets are based on different models, an exact agreement cannot be expected because ERA-Interim only represents one possible realization of the present-day climate, whereas CESM-HIST comprises an ensemble with equally likely realizations of the same decade. Altogether, the similar structure and properties of the extratropical cyclones and WCBs in the climate model and the reanalyses give confidence in CESM-LE's projections for a warmer climate.
The increase in the WCB strength and in the number of C1 cyclones, as well as – for the C1 cyclones – the amplification of the WCB-related diabatic PV production; the increase in the precipitation rate; and the slightly stronger deepening all indicate that cyclones will become more diabatic in a warmer climate and that WCBs will be even more important for explosive cyclone intensification. The enhancement of the cyclone-related precipitation and the strengthening of the diabatically produced PV anomaly are in agreement with previous results based on climate models (Bengtsson et al., 2009; Hawcroft et al., 2018; Dolores-Tesillos et al., 2022) and idealized simulations (Pfahl et al., 2015; Büeler and Pfahl, 2019; Sinclair et al., 2020).
Another important question, which has not been addressed in this study, is whether future changes in convection will also have an impact on WCBs and cyclone intensification. Tierney et al. (2019) showed that stronger latent heating in a warmer climate leads to more intense updrafts and convection. According to Oertel et al. (2020), convective WCB ascent results in significantly stronger diabatically produced low-level PV anomalies compared to slantwise ascent. Thus, a potential future shift toward more frequent embedded convection in WCBs could further intensify the associated cyclone if the convection and associated PV production occur close to the cyclone centre. This should be investigated in future studies. However, models with parameterized convection strongly underestimate the ascent rates within the WCBs (see Fig. 5a in Oertel et al., 2019), which thus renders such an analysis difficult with currently available climate simulations.
In CMIP6 models, Priestley and Catto (2022) reported for both hemispheres a future increase in the intensity of the most extreme wintertime extratropical cyclones, as measured in terms of peak low-level vorticity. In our simulations, in the SH strongly deepening cyclones in general and in the NH those with intense WCBs also become slightly deeper. However, in the NH this enhancement of the deepening in C1 cyclones is relatively small, despite the concomitant increase in the WCB-related diabatic heating. This confirms the findings from previous studies (see, for example, the reviews by Shaw et al., 2016; Catto et al., 2019) that the impact of rising temperatures and enhanced cloud-diabatic processes on cyclone intensity is not straightforward, as the increase in the diabatic heating is embedded in various other partly compensating processes like changes in baroclinicity, vertical stability, and the tropopause height.
A limitation of this study is that the results are based on one single climate model and that the model has relatively coarse horizontal resolution (). Chemke et al. (2022) have shown that current climate models underestimate the recent intensification of extratropical cyclones in the SH (measured in terms of eddy kinetic energy), and they questioned the ability of these models to accurately predict the impacts of global warming on the SH storm track. This clearly calls for more model intercomparison and validation studies. Nevertheless, the availability of three-dimensional model-level output at high temporal resolution from CESM-LE enabled unprecedented insight into the Lagrangian evolution of cyclones and their three-dimensional PV structure in a climate model and thereby provided a better process understanding of cyclone intensification in future climate simulations.
The ERA-Interim reanalysis dataset (Dee et al., 2011) can be downloaded from the ECMWF web page (https://apps.ecmwf.int/datasets/data/interim-full-daily/, last access: 20 December 2022). The code of the CESM model (Hurrell et al., 2013) used for the CESM-LE simulations is available from https://www.cesm.ucar.edu/models/cesm1.0/ (last access: 20 December 2022). The model output of the CESM-LE reruns and the WCB and cyclone data used in this study are available from the authors upon request.
HB designed and performed this study, using WCB trajectories previously identified by MS and HJ. HB wrote the manuscript, with feedback about the results and text from all co-authors.
At least one of the (co-)authors is a member of the editorial board of Weather and Climate Dynamics. The peer-review process was guided by an independent editor, and the authors also have no other competing interests to declare.
Publisher’s note: Copernicus Publications remains neutral with regard to jurisdictional claims in published maps and institutional affiliations.
We thank Urs Beyerle (ETH Zurich) for performing the CESM-LE reruns and MeteoSwiss and ECMWF for granting access to the ERA-Interim reanalyses. We are grateful to Dominik Büeler (ETH Zurich), Derek Posselt (California Institute of Technology), Matthias Röthlisberger (ETH Zurich), and the two anonymous reviewers for valuable comments and discussions.
This research has been supported by the Schweizerischer Nationalfonds zur Förderung der Wissenschaftlichen Forschung (project 185049) and the H2020 European Research Council (INTEXseas, grant no. 787652).
This paper was edited by Helen Dacre and reviewed by Derek J. Posselt and two anonymous referees.
Badger, J. and Hoskins, B.: Simple initial value problems and mechanisms for baroclinic growth, J. Atmos. Sci., 58, 38–49, https://doi.org/10.1175/1520-0469(2001)058<0038:SIVPAM>2.0.CO;2, 2001. a
Bengtsson, L., Hodges, K. I., and Keenlyside, N.: Will extratropical storms intensify in a warmer climate?, J. Climate, 22, 2276–2301, https://doi.org/10.1175/2008JCLI2678.1, 2009. a, b, c, d, e, f, g
Binder, H.: Warm conveyor belts: cloud structure and role for cyclone dynamics and extreme events, PhD thesis, ETH Zürich, Nr. 24016, https://doi.org/10.3929/ethz-b-000164982, 2017. a
Binder, H., Boettcher, M., Joos, H., and Wernli, H.: The role of warm conveyor belts for the intensification of extratropical cyclones in Northern Hemisphere winter, J. Atmos. Sci., 73, 3997–4020, https://doi.org/10.1175/JAS-D-15-0302.1, 2016. a, b, c, d, e, f, g, h, i, j, k, l, m, n
Binder, H., Boettcher, M., Joos, H., Sprenger, M., and Wernli, H.: Vertical cloud structure of warm conveyor belts – a comparison and evaluation of ERA5 reanalysis, CloudSat and CALIPSO data, Weather Clim. Dynam., 1, 577–595, https://doi.org/10.5194/wcd-1-577-2020, 2020. a
Binder, H., Rivière, G., Arbogast, P., Maynard, K., Bosser, P., Joly, B., and Labadie, C.: Dynamics of forecast-error growth along cut-off Sanchez and its consequence for the prediction of a high-impact weather event over southern France, Q. J. Roy. Meteor. Soc., 147, 3263–3285, https://doi.org/10.1002/qj.4127, 2021. a
Booth, J. F., Wang, S., and Polvani, L.: Midlatitude storms in a moister world: Lessons from idealized baroclinic life cycle experiments, Clim. Dynam., 41, 787–802, https://doi.org/10.1007/s00382-012-1472-3, 2013. a
Booth, J. F., Naud, C. M., and Willison, J.: Evaluation of extratropical cyclone precipitation in the North Atlantic basin: An analysis of ERA-Interim, WRF, and two CMIP5 models, J. Climate, 31, 2345–2360, https://doi.org/10.1175/JCLI-D-17-0308.1, 2018. a
Browning, K. A.: Organization of clouds and precipitation in extratropical cyclones, in: Extratropical Cyclones: The Erik Palmén Memorial Volume, edited by: Newton, C. W. and Holopainen, E. O., Amer. Meteor. Soc., 129–153, https://doi.org/10.1007/978-1-944970-33-8_8, 1990. a
Büeler, D. and Pfahl, S.: Potential vorticity diagnostics to quantify effects of latent heating in extratropical cyclones. Part II: application to idealized climate change simulations, J. Atmos. Sci., 76, 1885–1902, https://doi.org/10.1175/JAS-D-18-0342.1, 2019. a, b, c, d
Catto, J., Jakob, C., and Nicholls, N.: Can the CMIP5 models represent winter frontal precipitation?, Geophys. Res. Lett., 42, 8596–8604, https://doi.org/10.1002/2015GL066015, 2015a. a
Catto, J. L., Shaffrey, L. C., and Hodges, K. I.: Can climate models capture the structure of extratropical cyclones?, J. Climate, 23, 1621–1635, https://doi.org/10.1175/2009JCLI3318.1, 2010. a, b
Catto, J. L., Madonna, E., Joos, H., Rudeva, I., and Simmonds, I.: Global relationship between fronts and warm conveyor belts and the impact on extreme precipitation, J. Climate, 28, 8411–8429, https://doi.org/10.1175/JCLI-D-15-0171.1, 2015b. a
Catto, J. L., Ackerley, D., Booth, J. F., Champion, A. J., Colle, B. A., Pfahl, S., Pinto, J. G., Quinting, J. F., and Seiler, C.: The future of midlatitude cyclones, Curr. Clim. Change Rep., 5, 407–420, https://doi.org/10.1007/s40641-019-00149-4, 2019. a, b, c, d, e, f
Chang, E. K.: Projected significant increase in the number of extreme extratropical cyclones in the Southern Hemisphere, J. Climate, 30, 4915–4935, https://doi.org/10.1175/JCLI-D-16-0553.1, 2017. a
Chang, E. K.: CMIP5 projected change in Northern Hemisphere winter cyclones with associated extreme winds, J. Climate, 31, 6527–6542, https://doi.org/10.1175/JCLI-D-17-0899.1, 2018. a
Chemke, R., Ming, Y., and Yuval, J.: The intensification of winter mid-latitude storm tracks in the Southern Hemisphere, Nat. Clim. Change, 12, 553–557, https://doi.org/10.1038/s41558-022-01368-8, 2022. a
Collins, M., Knutti, R., Arblaster, J., Dufresne, J.-L., Fichefet, T., Friedlingstein, P., Gao, X., Gutowski, W. J., Johns, T., Krinner, G., Shongwe, M., Tebaldi, C., Weaver, A. J., and Wehner, M.: Long-term climate change: projections, commitments and irreversibility, in: Climate change 2013: The physical science basis: Contribution of working group I to the fifth assessment report of the Intergovernmental Panel on Climate Change, edited by: Stocker, T. F., Qin, D., Plattner, G. K., Tignor, M., Allen, S. K., Boschung, J., Nauels, A., Xia, Y., Bex, V., and Midgley, P. M., Cambridge University Press, Cambridge, United Kingdom and New York, NY, USA, 1029–1136, https://doi.org/10.1017/CBO9781107415324.016, 2013. a
Davis, C. A. and Emanuel, K. A.: Potential vorticity diagnostics of cyclogenesis, Mon. Weather Rev., 119, 1929–1953, https://doi.org/10.1175/1520-0493(1991)119<1929:PVDOC>2.0.CO;2, 1991. a
Dee, D. P., Uppala, S. M., Simmons, A. J., Berrisford, P., Poli, P., Kobayashi, S., Andrae, U., Balmaseda, M. A., Balsamo, G., Bauer, P., Bechtold, P., Beljaars, A. C. M., van de Berg, L., Bidlot, J., Bormann, N., Delsol, C., Dragani, R., Fuentes, M., Geer, A. J., Haimberger, L., Healy, S. B., Hersbach, H., Hólm, E. V., Isaksen, L., Kållberg, P., Köhler, M., Matricardi, M., McNally, A. P., Monge-Sanz, B. M., Morcrette, J.-J., Park, B.-K., Peubey, C., de Rosnay, P., Tavolato, C., Thépaut, J.-N., and Vitart, F.: The ERA-Interim reanalysis: Configuration and performance of the data assimilation system, Q. J. Roy. Meteor. Soc., 137, 553–597, https://doi.org/10.1002/qj.828, data available at: https://apps.ecmwf.int/datasets/data/interim-full-daily/, 2011. a
Dolores-Tesillos, E., Teubler, F., and Pfahl, S.: Future changes in North Atlantic winter cyclones in CESM-LE – Part 1: Cyclone intensity, potential vorticity anomalies, and horizontal wind speed, Weather Clim. Dynam., 3, 429–448, https://doi.org/10.5194/wcd-3-429-2022, 2022. a, b, c, d, e
Govekar, P. D., Jakob, C., and Catto, J.: The relationship between clouds and dynamics in Southern Hemisphere extratropical cyclones in the real world and a climate model, J. Geophys. Res., 119, 6609–6628, https://doi.org/10.1002/2013JD020699, 2014. a
Grams, C. M., Wernli, H., Böttcher, M., Čampa, J., Corsmeier, U., Jones, S. C., Keller, J. H., Lenz, C.-J., and Wiegand, L.: The key role of diabatic processes in modifying the upper-tropospheric wave guide: a North Atlantic case-study, Q. J. Roy. Meteor. Soc., 137, 2174–2193, https://doi.org/10.1002/qj.891, 2011. a
Grams, C. M., Magnusson, L., and Madonna, E.: An atmospheric dynamics perspective on the amplification and propagation of forecast error in numerical weather prediction models: A case study, Q. J. Roy. Meteor. Soc., 144, 2577–2591, https://doi.org/10.1002/qj.3353, 2018. a
Grieger, J., Leckebusch, G., Donat, M., Schuster, M., and Ulbrich, U.: Southern Hemisphere winter cyclone activity under recent and future climate conditions in multi-model AOGCM simulations, Int. J. Climatol., 34, 3400–3416, https://doi.org/10.1002/joc.3917, 2014. a, b, c
Harrold, T. W.: Mechanisms influencing the distribution of precipitation within baroclinic disturbances, Q. J. Roy. Meteor. Soc., 99, 232–251, https://doi.org/10.1002/qj.49709942003, 1973. a
Harvey, B., Shaffrey, L., and Woollings, T.: Equator-to-pole temperature differences and the extra-tropical storm track responses of the CMIP5 climate models, Clim. Dynam., 43, 1171–1182, https://doi.org/10.1007/s00382-013-1883-9, 2014. a, b
Hawcroft, M., Dacre, H., Forbes, R., Hodges, K., Shaffrey, L., and Stein, T.: Using satellite and reanalysis data to evaluate the representation of latent heating in extratropical cyclones in a climate model, Clim. Dynam., 48, 2255–2278, https://doi.org/10.1007/s00382-016-3204-6, 2017. a, b
Hawcroft, M., Walsh, E., Hodges, K., and Zappa, G.: Significantly increased extreme precipitation expected in Europe and North America from extratropical cyclones, Environ. Res. Lett, 13, 124006, https://doi.org/10.1088/1748-9326/aaed59, 2018. a, b
Hawcroft, M. K., Shaffrey, L. C., Hodges, K. I., and Dacre, H. F.: Can climate models represent the precipitation associated with extratropical cyclones?, Clim. Dynam., 47, 679–695, https://doi.org/10.1007/s00382-015-2863-z, 2016. a, b
Held, I. M. and Soden, B. J.: Robust responses of the hydrological cycle to global warming, J. Climate, 19, 5686–5699, https://doi.org/10.1175/JCLI3990.1, 2006. a
Hoskins, B. J.: Theory of extratropical cyclones, in: Extratropical Cyclones: The Erik Palmén Memorial Volume, edited by: Newton, C. W. and Holopainen, E. O., Amer. Meteor. Soc., 63–80, https://doi.org/10.1007/978-1-944970-33-8_5, 1990. a
Hurrell, J. W., Holland, M. M., Gent, P. R., Ghan, S., Kay, J. E., Kushner, P. J., Lamarque, J.-F., Large, W. G., Lawrence, D., Lindsay, K., Lipscomb, W. H., Long, M. C., Mahowald, N., Marsh, D. R., Neale, R. B., Rasch, P., Vavrus, S., Vertenstein, M., Bader, D., Collins, W. D., Hack, J. J., Kiehl, J., and Marshall, S.: The Community Earth System Model: a framework for collaborative research, B. Am. Meteorol. Soc., 94, 1339–1360, https://doi.org/10.1175/BAMS-D-12-00121.1, code available at: https://www.cesm.ucar.edu/models/cesm1.0/, 2013. a
Joos, H. and Wernli, H.: Influence of microphysical processes on the potential vorticity development in a warm conveyor belt: a case-study with the limited-area model COSMO, Q. J. Roy. Meteor. Soc., 138, 407–418, https://doi.org/10.1002/qj.934, 2012. a
Joos, H., Sprenger, M., Binder, H., Beyerle, U., and Wernli, H.: Warm conveyor belts in present-day and future climate simulations. Part I: Climatology and impacts, Weather Clim. Dynam. Discuss. [preprint], https://doi.org/10.5194/wcd-2022-38, in review, 2022. a, b, c, d, e, f, g
Kay, J. E., Deser, C., Phillips, A., Mai, A., Hannay, C., Strand, G., Arblaster, J. M., Bates, S., Danabasoglu, G., Edwards, J., Holland, M., Kushner, P., Lamarque, J.-F., Lawrence, D., Lindsay, K., Middleton, A., Munoz, E., Neale, R., Oleson, K., Polvani, L., and Vertenstein, M.: The Community Earth System Model (CESM) large ensemble project: A community resource for studying climate change in the presence of internal climate variability, B. Am. Meteorol. Soc., 96, 1333–1349, https://doi.org/10.1175/BAMS-D-13-00255.1, 2015. a, b
Kirshbaum, D., Merlis, T., Gyakum, J., and McTaggart-Cowan, R.: Sensitivity of idealized moist baroclinic waves to environmental temperature and moisture content, J. Atmos. Sci., 75, 337–360, https://doi.org/10.1175/JAS-D-17-0188.1, 2018. a
Lamarque, J.-F., Bond, T. C., Eyring, V., Granier, C., Heil, A., Klimont, Z., Lee, D., Liousse, C., Mieville, A., Owen, B., Schultz, M. G., Shindell, D., Smith, S. J., Stehfest, E., Van Aardenne, J., Cooper, O. R., Kainuma, M., Mahowald, N., McConnell, J. R., Naik, V., Riahi, K., and van Vuuren, D. P.: Historical (1850–2000) gridded anthropogenic and biomass burning emissions of reactive gases and aerosols: methodology and application, Atmos. Chem. Phys., 10, 7017–7039, https://doi.org/10.5194/acp-10-7017-2010, 2010. a, b
Lamarque, J.-F., Kyle, G. P., Meinshausen, M., Riahi, K., Smith, S. J., van Vuuren, D. P., Conley, A. J., and Vitt, F.: Global and regional evolution of short-lived radiatively-active gases and aerosols in the Representative Concentration Pathways, Climatic Change, 109, 191–212, https://doi.org/10.1007/s10584-011-0155-0, 2011. a, b
Madonna, E., Wernli, H., Joos, H., and Martius, O.: Warm conveyor belts in the ERA-Interim dataset (1979–2010). Part I: Climatology and potential vorticity evolution, J. Climate, 27, 3–26, https://doi.org/10.1175/JCLI-D-12-00720.1, 2014. a, b
Madonna, E., Boettcher, M., Grams, C. M., Joos, H., Martius, O., and Wernli, H.: Verification of North Atlantic warm conveyor belt outflows in ECMWF forecasts, Q. J. Roy. Meteor. Soc., 141, 1333–1344, https://doi.org/10.1002/qj.2442, 2015. a
Martínez-Alvarado, O., Madonna, E., Gray, S. L., and Joos, H.: A route to systematic error in forecasts of Rossby waves, Q. J. Roy. Meteor. Soc., 142, 196–210, https://doi.org/10.1002/qj.2645, 2016. a
Meinshausen, M., Smith, S. J., Calvin, K., Daniel, J. S., Kainuma, M. L., Lamarque, J.-F., Matsumoto, K., Montzka, S. A., Raper, S. C., Riahi, K., Thomson, A., Velders, G. J. M., and van Vuuren, D. P.: The RCP greenhouse gas concentrations and their extensions from 1765 to 2300, Climatic Change, 109, 213–241, https://doi.org/10.1007/s10584-011-0156-z, 2011. a, b
Mizuta, R., Matsueda, M., Endo, H., and Yukimoto, S.: Future change in extratropical cyclones associated with change in the upper troposphere, J. Climate, 24, 6456–6470, 2011. a, b
Oertel, A., Boettcher, M., Joos, H., Sprenger, M., Konow, H., Hagen, M., and Wernli, H.: Convective activity in an extratropical cyclone and its warm conveyor belt – a case-study combining observations and a convection-permitting model simulation, Q. J. Roy. Meteor. Soc., 145, 1406–1426, https://doi.org/10.1002/qj.3500, 2019. a
Oertel, A., Boettcher, M., Joos, H., Sprenger, M., and Wernli, H.: Potential vorticity structure of embedded convection in a warm conveyor belt and its relevance for large-scale dynamics, Weather Clim. Dynam., 1, 127–153, https://doi.org/10.5194/wcd-1-127-2020, 2020. a
Pfahl, S., O'Gorman, P. A., and Singh, M. S.: Extratropical cyclones in idealized simulations of changed climates, J. Climate, 28, 9373–9392, https://doi.org/10.1175/JCLI-D-14-00816.1, 2015. a, b, c
Pomroy, H. R. and Thorpe, A. J.: The evolution and dynamical role of reduced upper-tropospheric potential vorticity in intensive observing period one of FASTEX, Mon. Weather Rev., 128, 1817–1834, https://doi.org/10.1175/1520-0493(2000)128<1817:TEADRO>2.0.CO;2, 2000. a
Priestley, M. D. K. and Catto, J. L.: Future changes in the extratropical storm tracks and cyclone intensity, wind speed, and structure, Weather Clim. Dynam., 3, 337–360, https://doi.org/10.5194/wcd-3-337-2022, 2022. a, b, c, d, e, f, g, h, i, j
Raible, C. C., Messmer, M., Lehner, F., Stocker, T. F., and Blender, R.: Extratropical cyclone statistics during the last millennium and the 21st century, Clim. Past, 14, 1499–1514, https://doi.org/10.5194/cp-14-1499-2018, 2018. a, b
Rantanen, M., Räisänen, J., Sinclair, V. A., and Järvinen, H.: Sensitivity of idealised baroclinic waves to mean atmospheric temperature and meridional temperature gradient changes, Clim. Dynam., 52, 2703–2719, https://doi.org/10.1007/s00382-018-4283-3, 2019. a
Rossa, A. M., Wernli, H., and Davies, H. C.: Growth and decay of an extra-tropical cyclone's PV-tower, Meteorol. Atmos. Phys., 73, 139–156, https://doi.org/10.1007/s007030050070, 2000. a
Röthlisberger, M., Sprenger, M., Flaounas, E., Beyerle, U., and Wernli, H.: The substructure of extremely hot summers in the Northern Hemisphere, Weather Clim. Dynam., 1, 45–62, https://doi.org/10.5194/wcd-1-45-2020, 2020. a
Sanders, F. and Gyakum, J. R.: Synoptic-dynamic climatology of the “bomb”, Mon. Weather Rev., 108, 1589–1606, https://doi.org/10.1175/1520-0493(1980)108<1589:SDCOT>2.0.CO;2, 1980. a, b, c
Schemm, S., Papritz, L., and Rivière, G.: Storm track response to uniform global warming downstream of an idealized sea surface temperature front, Weather Clim. Dynam., 3, 601–623, https://doi.org/10.5194/wcd-3-601-2022, 2022. a
Seiler, C. and Zwiers, F. W.: How will climate change affect explosive cyclones in the extratropics of the Northern Hemisphere?, Clim. Dynam., 46, 3633–3644, https://doi.org/10.1007/s00382-015-2791-y, 2016. a
Shaw, T. A., Baldwin, M., Barnes, E. A., Caballero, R., Garfinkel, C. I., Hwang, Y.-T., Li, C., O'Gorman, P. A., Rivière, G., Simpson, I. R., and Voigt, A.: Storm track processes and the opposing influences of climate change, Nat. Geosci., 9, 656–664, https://doi.org/10.1038/NGEO2783, 2016. a, b
Sinclair, V. A., Rantanen, M., Haapanala, P., Räisänen, J., and Järvinen, H.: The characteristics and structure of extra-tropical cyclones in a warmer climate, Weather Clim. Dynam., 1, 1–25, https://doi.org/10.5194/wcd-1-1-2020, 2020. a, b, c, d
Sprenger, M. and Wernli, H.: The LAGRANTO Lagrangian analysis tool – version 2.0, Geosci. Model Dev., 8, 2569–2586, https://doi.org/10.5194/gmd-8-2569-2015, 2015. a
Sprenger, M., Fragkoulidis, G., Binder, H., Croci-Maspoli, M., Graf, P., Grams, C. M., Knippertz, P., Madonna, E., Schemm, S., Škerlak, B., and Wernli, H.: Global climatologies of Eulerian and Lagrangian flow features based on ERA-Interim, B. Am. Meteorol. Soc., 98, 1739–1748, https://doi.org/10.1175/BAMS-D-15-00299.1, 2017. a
Stoelinga, M. T.: A potential vorticity-based study of the role of diabatic heating and friction in a numerically simulated baroclinic cyclone, Mon. Weather Rev., 124, 849–874, https://doi.org/10.1175/1520-0493(1996)124<0849:APVBSO>2.0.CO;2, 1996. a
Tamarin-Brodsky, T. and Kaspi, Y.: Enhanced poleward propagation of storms under climate change, Nat. Geosci., 10, 908–913, https://doi.org/10.1038/s41561-017-0001-8, 2017. a
Tierney, G., Posselt, D. J., and Booth, J. F.: An examination of extratropical cyclone response to changes in baroclinicity and temperature in an idealized environment, Clim. Dynam., 51, 3829–3846, https://doi.org/10.1007/s00382-018-4115-5, 2018. a
Tierney, G., Posselt, D. J., and Booth, J. F.: The impact of Coriolis approximations on the environmental sensitivity of idealized extratropical cyclones, Clim. Dynam., 53, 7065–7080, https://doi.org/10.1007/s00382-019-04976-x, 2019. a
Ulbrich, U., Leckebusch, G. C., and Pinto, J. G.: Extra-tropical cyclones in the present and future climate: a review, Theor. Appl. Climatol., 96, 117–131, https://doi.org/10.1007/s00704-008-0083-8, 2009. a, b
Wernli, H.: A Lagrangian-based analysis of extratropical cyclones. II: A detailed case-study, Q. J. Roy. Meteor. Soc., 123, 1677–1706, https://doi.org/10.1002/qj.49712354211, 1997. a
Wernli, H. and Davies, H. C.: A Lagrangian-based analysis of extratropical cyclones. I: The method and some applications, Q. J. Roy. Meteor. Soc., 123, 467–489, https://doi.org/10.1002/qj.49712353811, 1997. a, b, c
Wernli, H. and Schwierz, C.: Surface cyclones in the ERA-40 dataset (1958–2001). Part I: Novel identification method and global climatology, J. Atmos. Sci., 63, 2486–2507, https://doi.org/10.1175/JAS3766.1, 2006. a
Wernli, H., Boettcher, M., Joos, H., Miltenberger, A. K., and Spichtinger, P.: A trajectory-based classification of ERA-Interim ice clouds in the region of the North Atlantic storm track, Geophys. Res. Lett., 43, 6657–6664, https://doi.org/10.1002/2016GL068922, 2016. a
Yin, J. H.: A consistent poleward shift of the storm tracks in simulations of 21st century climate, Geophys. Res. Lett., 32, L18701, https://doi.org/10.1029/2005GL023684, 2005. a, b
Zappa, G., Shaffrey, L. C., Hodges, K. I., Sansom, P. G., and Stephenson, D. B.: A multimodel assessment of future projections of North Atlantic and European extratropical cyclones in the CMIP5 climate models, J. Climate, 26, 5846–5862, https://doi.org/10.1175/JCLI-D-12-00573.1, 2013. a, b
To ensure that all grid points are associated with a similar area, prior to the compositing a coordinate transformation is performed, whereby the cyclone centres are shifted to the Equator and 0∘ longitude and then the mean fields are calculated at these positions.