the Creative Commons Attribution 4.0 License.
the Creative Commons Attribution 4.0 License.
 | 22 Mar 2023
Effects on early monsoon rainfall in West Africa due to recent deforestation in a convection-permitting ensemble
Cornelia Klein
Sonja Folwell
Christopher M. Taylor
Douglas J. Parker
Adama Bamba
Kouakou Kouadio
Tropical deforestation can have a significant effect on climate, but research attention has been directed mostly towards Amazonian deforestation. The southern part of West Africa (a region dependent on rain-fed agriculture and vulnerable to droughts and flooding) has seen significant deforestation since the 1950s. Many previous tropical deforestation studies have used idealized and exaggerated deforestation scenarios and parameterized convection models. In this study we estimate for the first time realistic historical deforestation from the Land-Use Harmonization dataset in West Africa and simulate the impacts in a 5 d ensemble forecast in June using a convection-permitting regional climate model. We find that sensible heat flux increases at the expense of latent heat flux in most deforested regions, and rainfall increases by an average of 8.4 % over deforested pixels from 18:00–06:00 UTC, whereas changes are much less pronounced during the day. Over large areas of deforestation approx. 300 km inland (e.g. west Guinea) the roughness-length and thermally enhanced convergence during the afternoon and evening occurs over the deforested areas resulting in increases in rainfall with little impact from reduced daytime humidity. In areas of coastal deforestation (e.g. Côte d'Ivoire), increased winds drive the sea breeze convection inland, resulting in evening rainfall reductions over the deforested area but increases further inland, in line with observations. We suggest our results would not be replicated in parameterized convection models, which are known to struggle with capturing peak convective activity in the late afternoon and long-lived nocturnal rainfall and with reproducing observed surface–rainfall feedbacks.
- Article
(4486 KB) - Full-text XML
-
Supplement
(1123 KB) - BibTeX
- EndNote


The impact of tropical deforestation on climate has been a research area since the early 1990s, but there has been particular emphasis on studying Amazonian deforestation due to the Amazon's large size (Lawrence and Vandecar, 2014; Spracklen et al., 2018). In contrast, there has been much less emphasis on West African deforestation. The impact of deforestation on rainfall is dependent on the spatial scale of land-cover change, the surface flux characteristics of the replacement land cover, the nature of the rain-bearing systems, and the potential role of topographic and sea breeze circulations, which makes it difficult to extrapolate what would happen in one region from what happens in another (Lawrence and Vandecar, 2014). There has been considerable deforestation during the 20th century in the southern part of West Africa (Aleman et al., 2018), with pockets of deforestation driven by the rapidly growing population (Brandt et al., 2017). West Africa has experienced prolonged drought since the late 1960s, but more recently rainfall has somewhat recovered. It is likely that large-scale patterns of sea surface temperatures have caused these droughts, while it has been suggested that land-use change may have also had some impact (Wang et al., 2004).
Although there is consensus that tropical deforestation causes local (near-surface) warming, the impact on rainfall is much more dependent on the spatial scale, extent, and location of the deforestation. Impacts on temperature have been determined from models and observations (Duveiller et al., 2018; Alkama and Cescatti, 2016; Perugini et al., 2017). Deforestation causes increases in albedo, which cause cooling, but across the tropics this effect is more than offset by a shift in surface fluxes from latent to sensible heat, resulting in net warming of the atmosphere. The shift from latent to sensible heat flux is due to the lower leaf area index and shallower rooting; the reduction in surface roughness reduces turbulent exchange of heat from the surface, also contributing to a warmer land surface (Spracklen et al., 2018). These modifications to energy fluxes can affect rainfall, but changes to rainfall due to deforestation have largely only been studied in models (Perugini et al., 2017). Studies of continental-scale deforestation using global climate models have shown reductions in rainfall over the deforested areas, especially during drier seasons (e.g. for complete deforestation of tropical African rainforests see Werth and Avissar, 2005; Semazzi and Song, 2001). However, when more realistic deforestation scenarios were applied to the Amazon, reductions in rainfall were found to be lower, and patterns of rainfall shifted, with some regions having increased rainfall (Medvigy et al., 2011). Abiodun et al. (2008) investigated two idealized but reasonably large-scale deforestation scenarios over West Africa and showed that both could have a significant impact outside the deforested area as well as locally, enhancing the monsoon flow either by changes in meridional temperature gradient (desertification scenario) or by surface roughness changes (deforestation scenario). Overall, they found a reduction in rainfall due to enhanced moisture transport out of the area. Boone et al. (2016) analysed the impact of estimated land-use and land-cover change since the 1950s in West Africa in several models. Their somewhat idealized prescribed land-cover change represents a worst-case degradation scenario, and they find a reduction in rainfall across the Sahel in all models and a shift in rainfall to the south in some models. Satellite observations of Rondônian (Amazonia) rainfall over deforested areas suggest an increasing rainfall trend in the dry season over the 20th century but a decreasing trend in the wet season (Chagnon and Bras, 2005). A new observational study for southern West Africa (Taylor et al., 2022) has identified that mesoscale deforestation locally enhances the frequency of daytime convective activity, an effect which is particularly pronounced where coastal deforestation enhances storms triggered by sea breezes. A positive correlation between forest minus non-forest differences in sensible heat (from flux tower measurements) and cloud cover (from satellite observations) has been found globally (Xu et al., 2022), with tropical regions typically showing increased sensible heat and cloud due to the small-scale deforestation.
Differences in surface heat fluxes between clearing and adjacent forest induce mesoscale circulations similar to land–sea breezes, bringing moisture-rich air from over the forest to over the clearing and, if these circulations are strong enough, resulting in enhanced rainfall (Souza et al., 2000; Garcia-Carreras et al., 2011; Hartley et al., 2016). Feedbacks on the atmosphere from land surface heterogeneity have been shown to be improved for high-resolution convection-permitting models (CPMs) compared to parameterized convection models (PMs) (Taylor et al., 2013), and therefore high-resolution PMs may fail to produce the observed enhanced convective rainfall at vegetation boundaries. Many of the deforestation-scenario modelling studies have used low-resolution global climate models. However, mesoscale models can reproduce the deforestation-induced mesoscale circulations which have also been observed in Amazonia (D'Almeida et al., 2007). Khanna et al. (2017) used an 8 km scale model to simulate Rondônian rainfall over deforested areas using 1980s and 2006 land cover. Although their 8 km model can explicitly represent some of the larger-scale convection, their cumulus parameterization was used for smaller-scale convection. Consequently, they looked at the top of boundary layer humidity as well as rainfall changes. They found that the enhanced rainfall over the deforested area in the 1980s was due to thermally driven enhanced mesoscale circulations, whereas the more recent larger scale of deforestation caused enhanced rainfall/humidity only on the downwind side, with roughness length changes inducing dynamically driven mesoscale circulations. CPM simulations should provide added value to representing the climate impacts of land-use change (Vanden Broucke and Van Lipzig, 2017), because they better represent the differences in diurnal cycles of surface fluxes over different vegetation types. This is partly due to the higher resolution but largely due to representing the diurnal cycle of convection better than PMs.
In this study we evaluate the changes in rainfall in a 5 d ensemble due to realistic historical deforestation (since 1950) in West Africa using a CPM and analyse the causes of the changes. We use a 5 d ensemble rather than a longer-term simulation so that we can look at how local physical processes respond to deforestation in a statistical way without diverging synoptic conditions. To our knowledge, no other studies have used a CPM or such a methodical way to determine the historical deforestation scenario to estimate effects of tropical deforestation on rainfall in this region. We analyse the diurnal cycle of various diagnostics to understand the causes of rainfall changes. We look in detail at two subregions, one where the rainfall changes are primarily thermally driven and one where the rainfall changes are primarily dynamically driven. The model and simulations are described in Sect. 2, the effect of deforestation on the different diagnostics are presented in Sect. 3, a comparison with other West African studies is presented in Sect. 4, and conclusions are presented in Sect. 5.
2.1 Modelling strategy
We use the Met Office Unified Model (UM v8.2) with atmosphere and land surface components, run at 4 km resolution over West Africa (20∘ W–20∘ E, 0–25∘ N), as described in Crook et al. (2019). The model includes a convection parameterization (Gregory and Rowntree, 1990) with closure based on the convective available potential energy. However, this parameterization is severely restricted by adjusting the relaxation time, and a sub-grid Smagorinsky-type turbulent mixing scheme is employed, allowing explicit convection. While a 4 km model is at the edge between the grey zone and truly convection-permitting resolution (Prein et al., 2015), this model has been shown to represent the diurnal cycle, the intermittency of convective rainfall, the propagation of convection, and the location and the lifetimes of deep convective storms in West Africa more accurately than the equivalent 12 km parameterized model when compared to CMORPH rainfall, TRMM radar (2A25), and SEVIRI brightness temperature (Crook et al., 2019, simulation V_CP4 therein). It does, however, have storms that are often too intense and never reach the size of the largest observed storms, and the small storms produce too much of the total rainfall. It has also been shown to capture the observed relationships between surface flux patterns and convective triggering, unlike the 12 km parameterized model (Taylor et al., 2013). Although our simulations are not set up as a forecast and we would not expect a perfect match to observations, we find that the ensemble mean rainfall over the 1–5 June 2014 period is, like CMORPH, mostly confined to south of 12∘ N and with the most intense rain near the south coast. However, the ensemble mean has a wet bias across the domain around 10∘ N and over the Cameroon mountains and a dry bias near the coast in Côte d'Ivoire and Ghana, and these biases are significant compared to the 1–5 June standard deviations found from 9 years of CMORPH (Fig. S1 in the Supplement). Despite this, systematic regional biases that affect both our forested and deforested simulations equally will not affect the rainfall change signal linked to deforestation that we are interested in. Given that this is a process study, it is the model skill in correctly capturing rainfall timing within the diurnal cycle and in representing the characteristics of convective storms (as demonstrated in Crook et al., 2019) that is most important for this work. The realistic representation of timing, storm lifetimes, and storm precipitation intensities provides confidence in our model results on convection responses when surface roughness and flux patterns change locally due to deforestation.
To assess the impact of recent West African deforestation on rainfall, we produced two 10-member 5 d ensembles, the first using current land cover and the second using an estimate of 1950s land cover. Both current and 1950s vegetation ensembles were run at 4 km resolution for 5 d from 1 June 2014 conditions over West Africa. We chose early June because at this time of year there is some rain in the region up to about 15∘ N while still being early in the monsoon season when it is expected that sensitivity to deforestation is high – i.e. soils are still relatively dry – and the evaporative advantage of forests compared to shallow-rooted vegetation is expected to be high. Although earlier in the year the soil would have been drier near the coast, there were fewer rain events, making detection of impacts on rainfall challenging. The ensemble approach with 10 paired members allows us to evaluate the uncertainty in the modelled response to forest cover change that is linked to internal variability. At the same time, by simulating only 5 d time slices in “forecast mode”, temporal divergence of the synoptic conditions between the ensemble members is minimized. Differences between the two ensembles can therefore be attributed to the imposed deforestation in the absence of large-scale circulation feedbacks.
Sea surface temperatures and boundary conditions were prescribed from ERA-Interim data (Dee et al., 2011) every 6 h. The ensembles were generated by starting each ensemble member from the previous current land-cover ensemble member dump file at the end of the first day with the time reset to 1 June 00:00 but resetting the soil moisture to the climatology. Climatologies for soil moisture were produced as in Crook et al. (2019) from 14-year offline land surface model (JULES) runs using either the current or 1950s vegetation.
JULES (Best et al., 2011) is a modular land surface model, handling exchange of heat, moisture, and momentum with the atmosphere; soil moisture hydrology split into four soil layers of thicknesses 0.1, 0.25, 0.65, and 2.0 m; surface and sub-surface runoff parameterizations; and a vegetation model representing five different plant functional types (PFTs): broadleaf trees (BTs), needleleaf trees, C3 grass, C4 grass, and shrub. Plant and soil properties (e.g. albedo, roughness length, leaf area index (LAI), soil conductivity, and soil thermal capacity) and fractions of each PFT as well as urban, ice, and water (each modelled as a tile within a grid box) per grid box are specified through ancillary files and model configuration. The amount of moisture in each soil layer available to each PFT depends on soil properties and on the root density of each PFT in each soil layer, whereas water available for evaporation from bare soil only comes from the uppermost soil layer. Due to a lack of suitable in situ flux measurements in the study region, JULES' translation of deforestation into changes in net radiation and surface flux partitioning cannot be directly validated. However, based on known effects of tropical deforestation in better-studied regions (e.g. Silvério et al., 2015, Amazon; Peng et al., 2014, China), the flux differences between forested and deforested areas in the default JULES configuration did not appear sufficiently realistic, as detailed below. Such unrealistic responses to land-cover change in “out-of-the-box” land surface schemes are not unusual (Pitman et al., 2009; Boone et al., 2016), and even in the most recent earth system models there is a large difference in behaviour (Boysen et al., 2020). We therefore implemented the following modifications in JULES to simulate a more plausible depiction of deforestation.
2.1.1 Changes to leaf area index
Firstly, we found that the monthly climatology of LAI used in standard JULES MetUM simulations produces an unrealistic seasonal cycle over southern West Africa. This problem was traced to the treatment of missing data in the creation of the LAI field whereby cloudy pixels were erroneously assigned LAI of zero. Given that during boreal summer cloud cover is extensive, the effect was to introduce a marked minimum in LAI across the region. Instead, we used an alternative LAI field (Semeena et al., 2021) based on the Global LAnd Surface Satellite (GLASS) LAI product (Xiao et al., 2016), which exhibits a broad maximum in LAI during these months (see Fig. S2).
2.1.2 Changes to root water extraction for broadleaf trees
The JULES model expresses the impact of soil water stress on transpiration via a dimensionless stress factor (FSMC), based on soil moisture relative to texture-dependent critical (θc) and wilting (θw) points (Best et al., 2011; see their Eq. 52). A value of 1 means there is no water stress at all and a value of 0 means the plant is totally water stressed. For each plant functional type, this is computed by weighting FSMC at each soil layer by its assumed vertical root profile, where the root density in each layer follows an exponential distribution with depth as given by Eq. (50) in Best et al. (2011).
For the BT type of key interest in our study, the root weighting for the lowest soil layer (1–3 m) is substantial, corresponding to 0.55. We found in offline simulations that throughout the first few months of the rainy season, this lowest soil level remained strongly water stressed, suppressing the root-weighted FSMC (and hence transpiration) from trees. By contrast, shallower-rooted grasses exploit the wetter soil closer to the surface and produce much larger transpiration than the trees. We consider that, in reality, trees are well adapted in terms of where they take their water from, and we hence modified JULES for BT so that FSMC is taken from the maximum value of the four levels, rather than its root-weighted mean.
2.1.3 Under-canopy evaporation switched off
In JULES, direct moisture evaporation from the upper soil layer occurs primarily from the soil tile. However, for the vegetated tiles, total evapotranspiration is made up of transpiration from the leaves plus a contribution from soil evaporation based on the fraction of bare soil visible through the vegetation canopy. Under some circumstances, this bare soil contribution in vegetated tiles is known to be too large (Van Den Hoof et al., 2013). We found that this source could (counter-intuitively) enhance evapotranspiration following deforestation and we therefore switched the bare soil contribution off for all plant tiles.
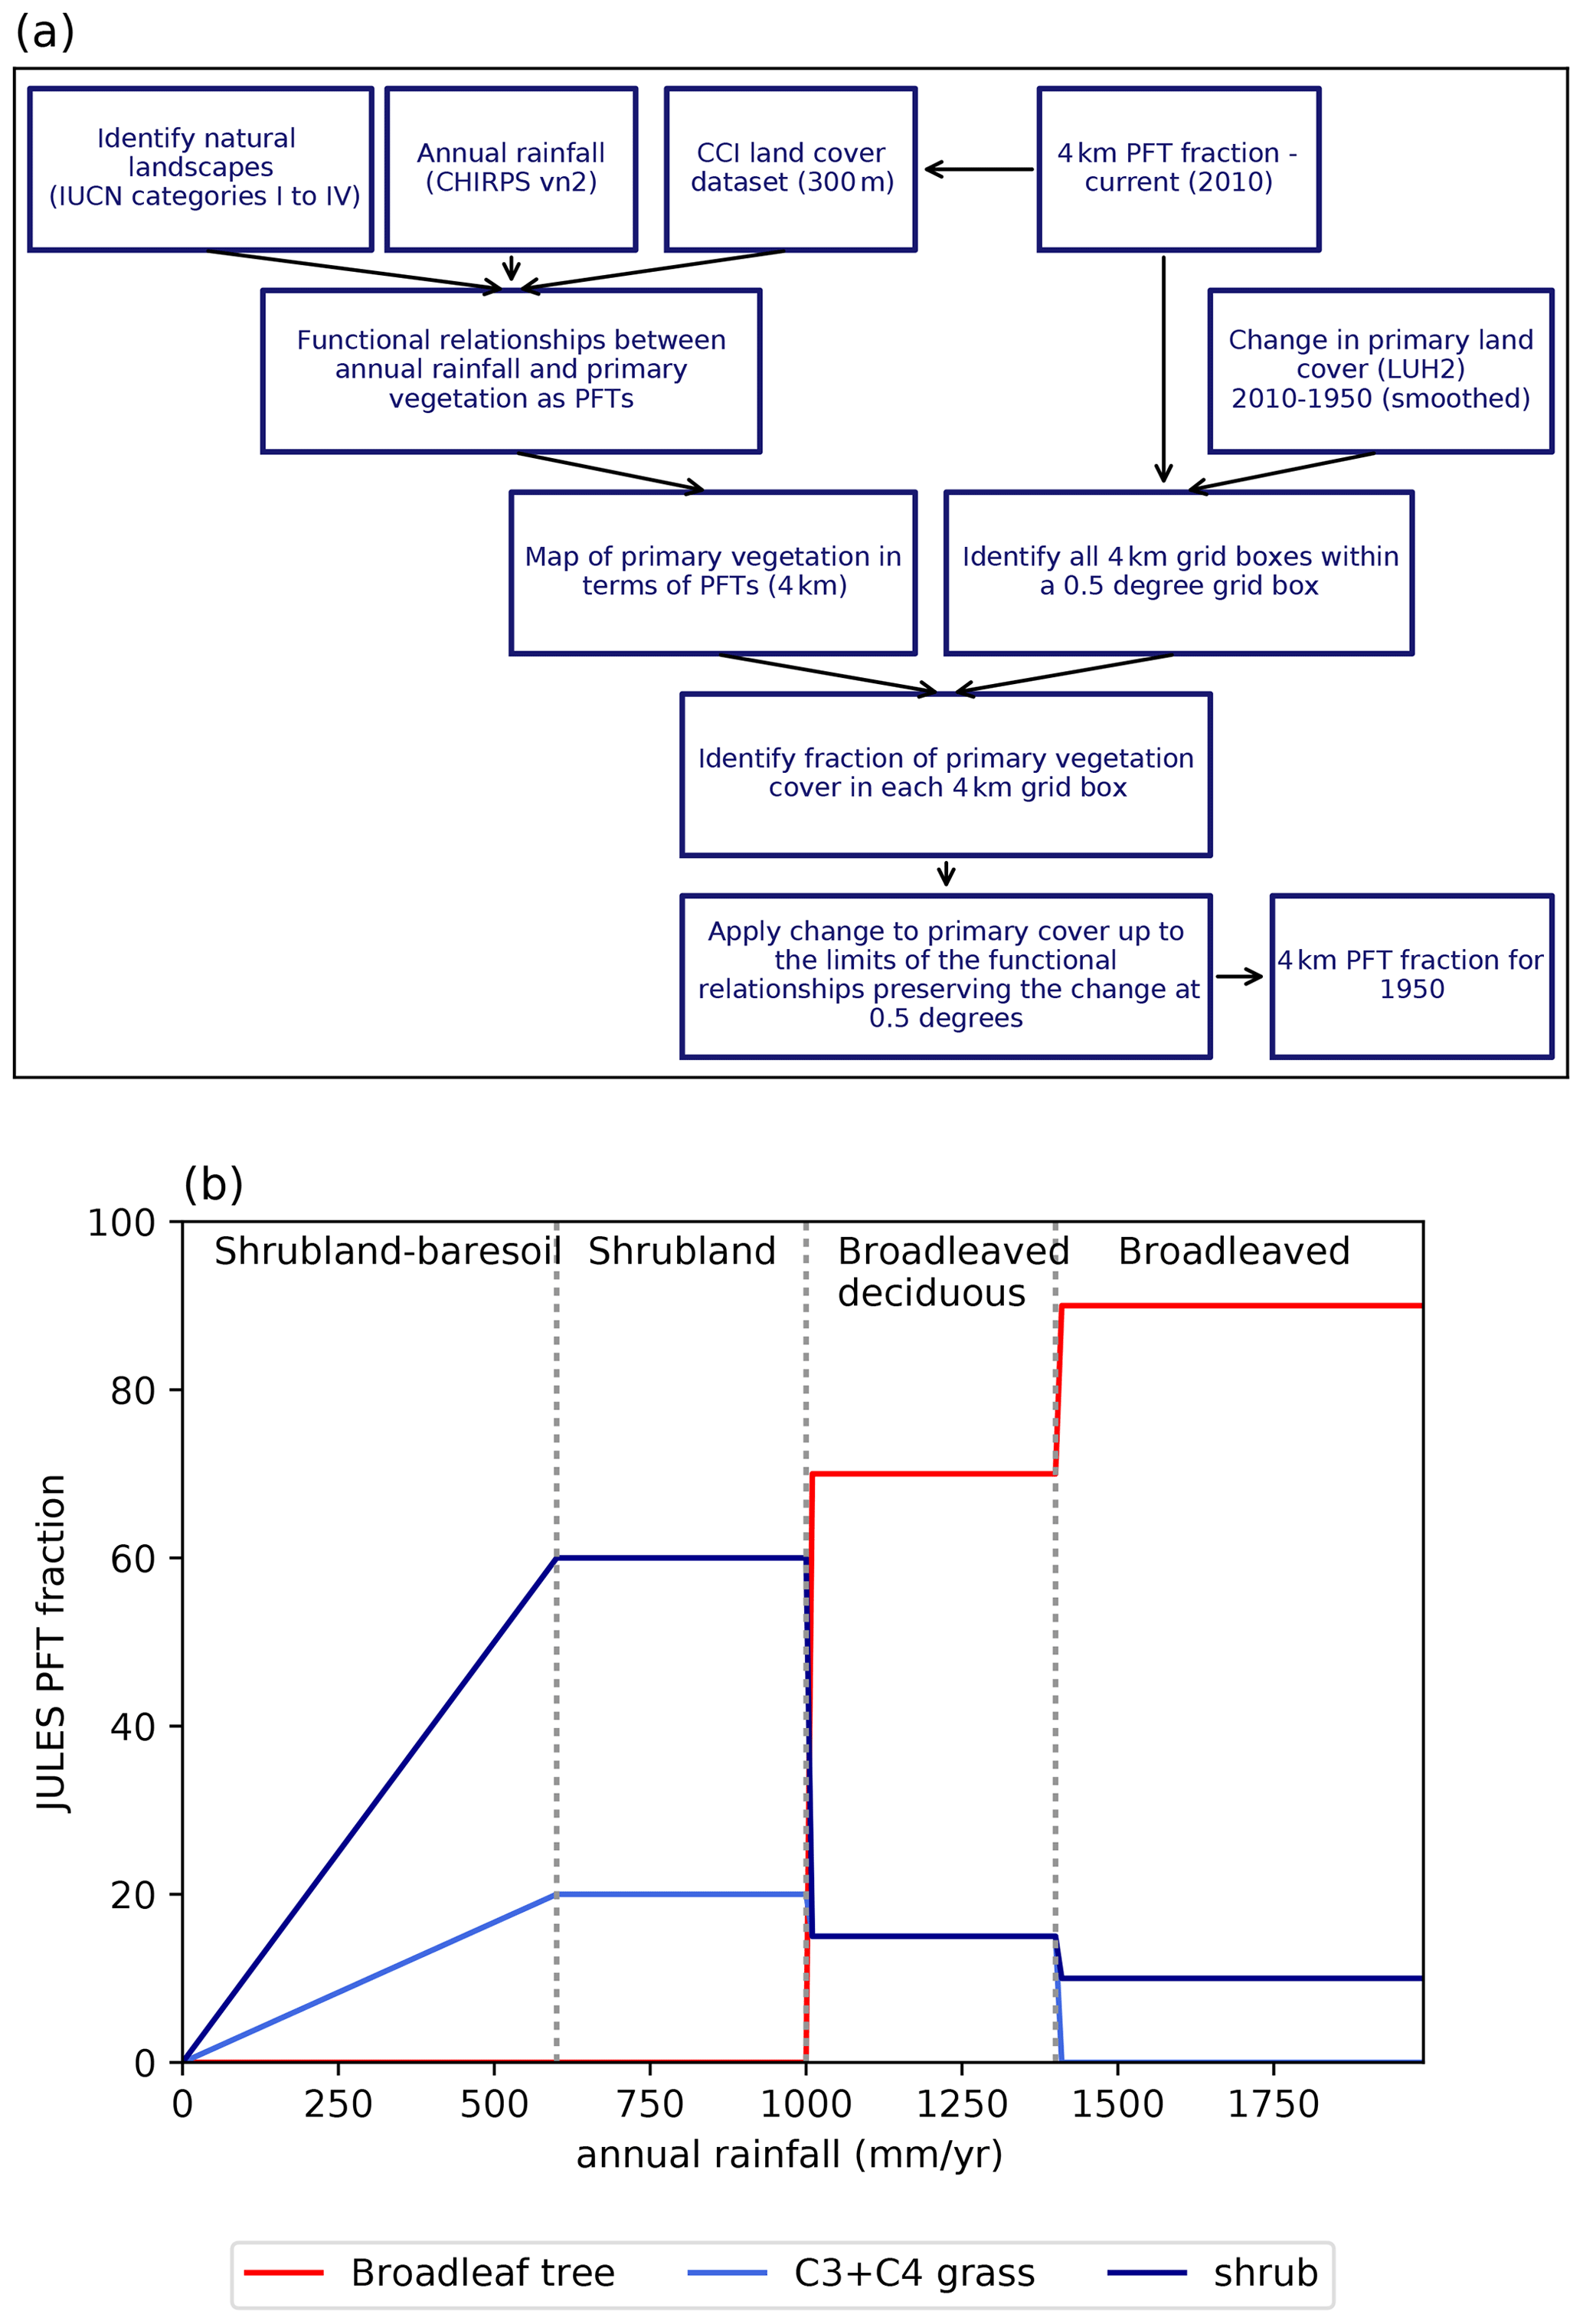
Figure 1(a) Schematic showing datasets and processing steps to produce the 1950s PFT fractions. (b) Rainfall (CHIRPS) thresholds and the dominant “natural” UNLCCS classes identified in the CCI land-cover dataset and corresponding PFT fractions identified for the West African domain.
2.2 Creation of the deforestation scenario
The key aim of this study is to explore atmospheric and rainfall responses to a deforestation scenario that plausibly captures historical forest change. This crucially requires a realistic and consistent estimate of past and current forest cover, necessitating an informed merging of diverse land-cover and land-use information sources for use in JULES. The major steps for this novel approach are described in the following. The current land cover is based on the European Space Agency's Land Cover Climate Change Initiative (CCI) land-cover dataset, version 1.4, for the 2008–2012 epoch (Poulter et al., 2015), which classifies each 300 m pixel as one of 23 United Nations Land Cover Classification System (UNLCCS) classes. These are mapped to the model PFTs according to Poulter et al. (2015). Creating a plausible map of vegetation in 1950 consistent with the JULES model is more challenging, and we summarize the process in Fig. 1a. Firstly, we use estimates of land-use change from 1950 to the present from the Land-Use Harmonization (LUHv2) dataset developed for use by earth system models (Hurtt et al., 2011). This describes the landscape in terms of fractions of different land-use types, rather than the PFTs which JULES requires. We therefore developed a mapping procedure specific to West Africa to translate land-use types into fractional coverages of PFTs plus the non-vegetation functional types of inland water and bare soil fractions. For this we identified areas of primary land from the World Database on Protected Areas (UNEP-WCMC and IUCN, 2014). Considering only the nature reserves with the highest level of conservation (IUCN categories I to VI), we extracted the 300 m CCI pixels within each protected area. Recognizing that even within these zones there will be some degree of human disturbance, we identified the UNLCCS class with the highest fractions of BT and shrub within each protected area. Mean annual rainfall across West Africa provides a dominant control on the composition of natural vegetation. Using the JULES composition of natural vegetation, as sampled within protected areas, we devised a simple threshold-based mapping of natural vegetation as a function of mean annual rainfall. For rainfall, we used version 2 of the CHIRPS dataset (Funk et al., 2015), downscaled to the 4 km model grid for years 1981 to 2015. The rainfall thresholds and dominant natural land-cover classes (shrub land to bare soil, shrub land, broadleaved deciduous, and broadleaved) and how they relate to model PFTs are summarized in Fig. 1b. To create a map of primary vegetation cover in terms of JULES PFTs, we applied the relationships in Fig. 1b to the mean annual rainfall map.
In step 2 we apply the change in primary land to produce a map of 1950s land cover, selecting all 4 km model pixels within a 0.5∘ grid box in turn. To avoid introducing artificial 0.5∘ structure into the high-resolution land-cover map, a Gaussian smoother is first applied to the LUHv2 map of primary land-cover change. For each 4 km pixel we compare ratios of existing land and primary vegetation to identify the proportion of current primary land and then apply the change to that 4 km grid box fraction. In cases where the 4 km values are already at or close to the primary land fractions, we iteratively apply changes to the remaining pixels so that overall the 0.5∘ change is applied. For the remaining non-primary land fraction, we adjust the remaining proportions of C3, C4, shrub, and bare soil accordingly. Grid box urban and water fractions are kept at their 2010 values, e.g. no account taken of the construction of the Akosombo dam of the Volta River in 1965 or changes in urbanization.
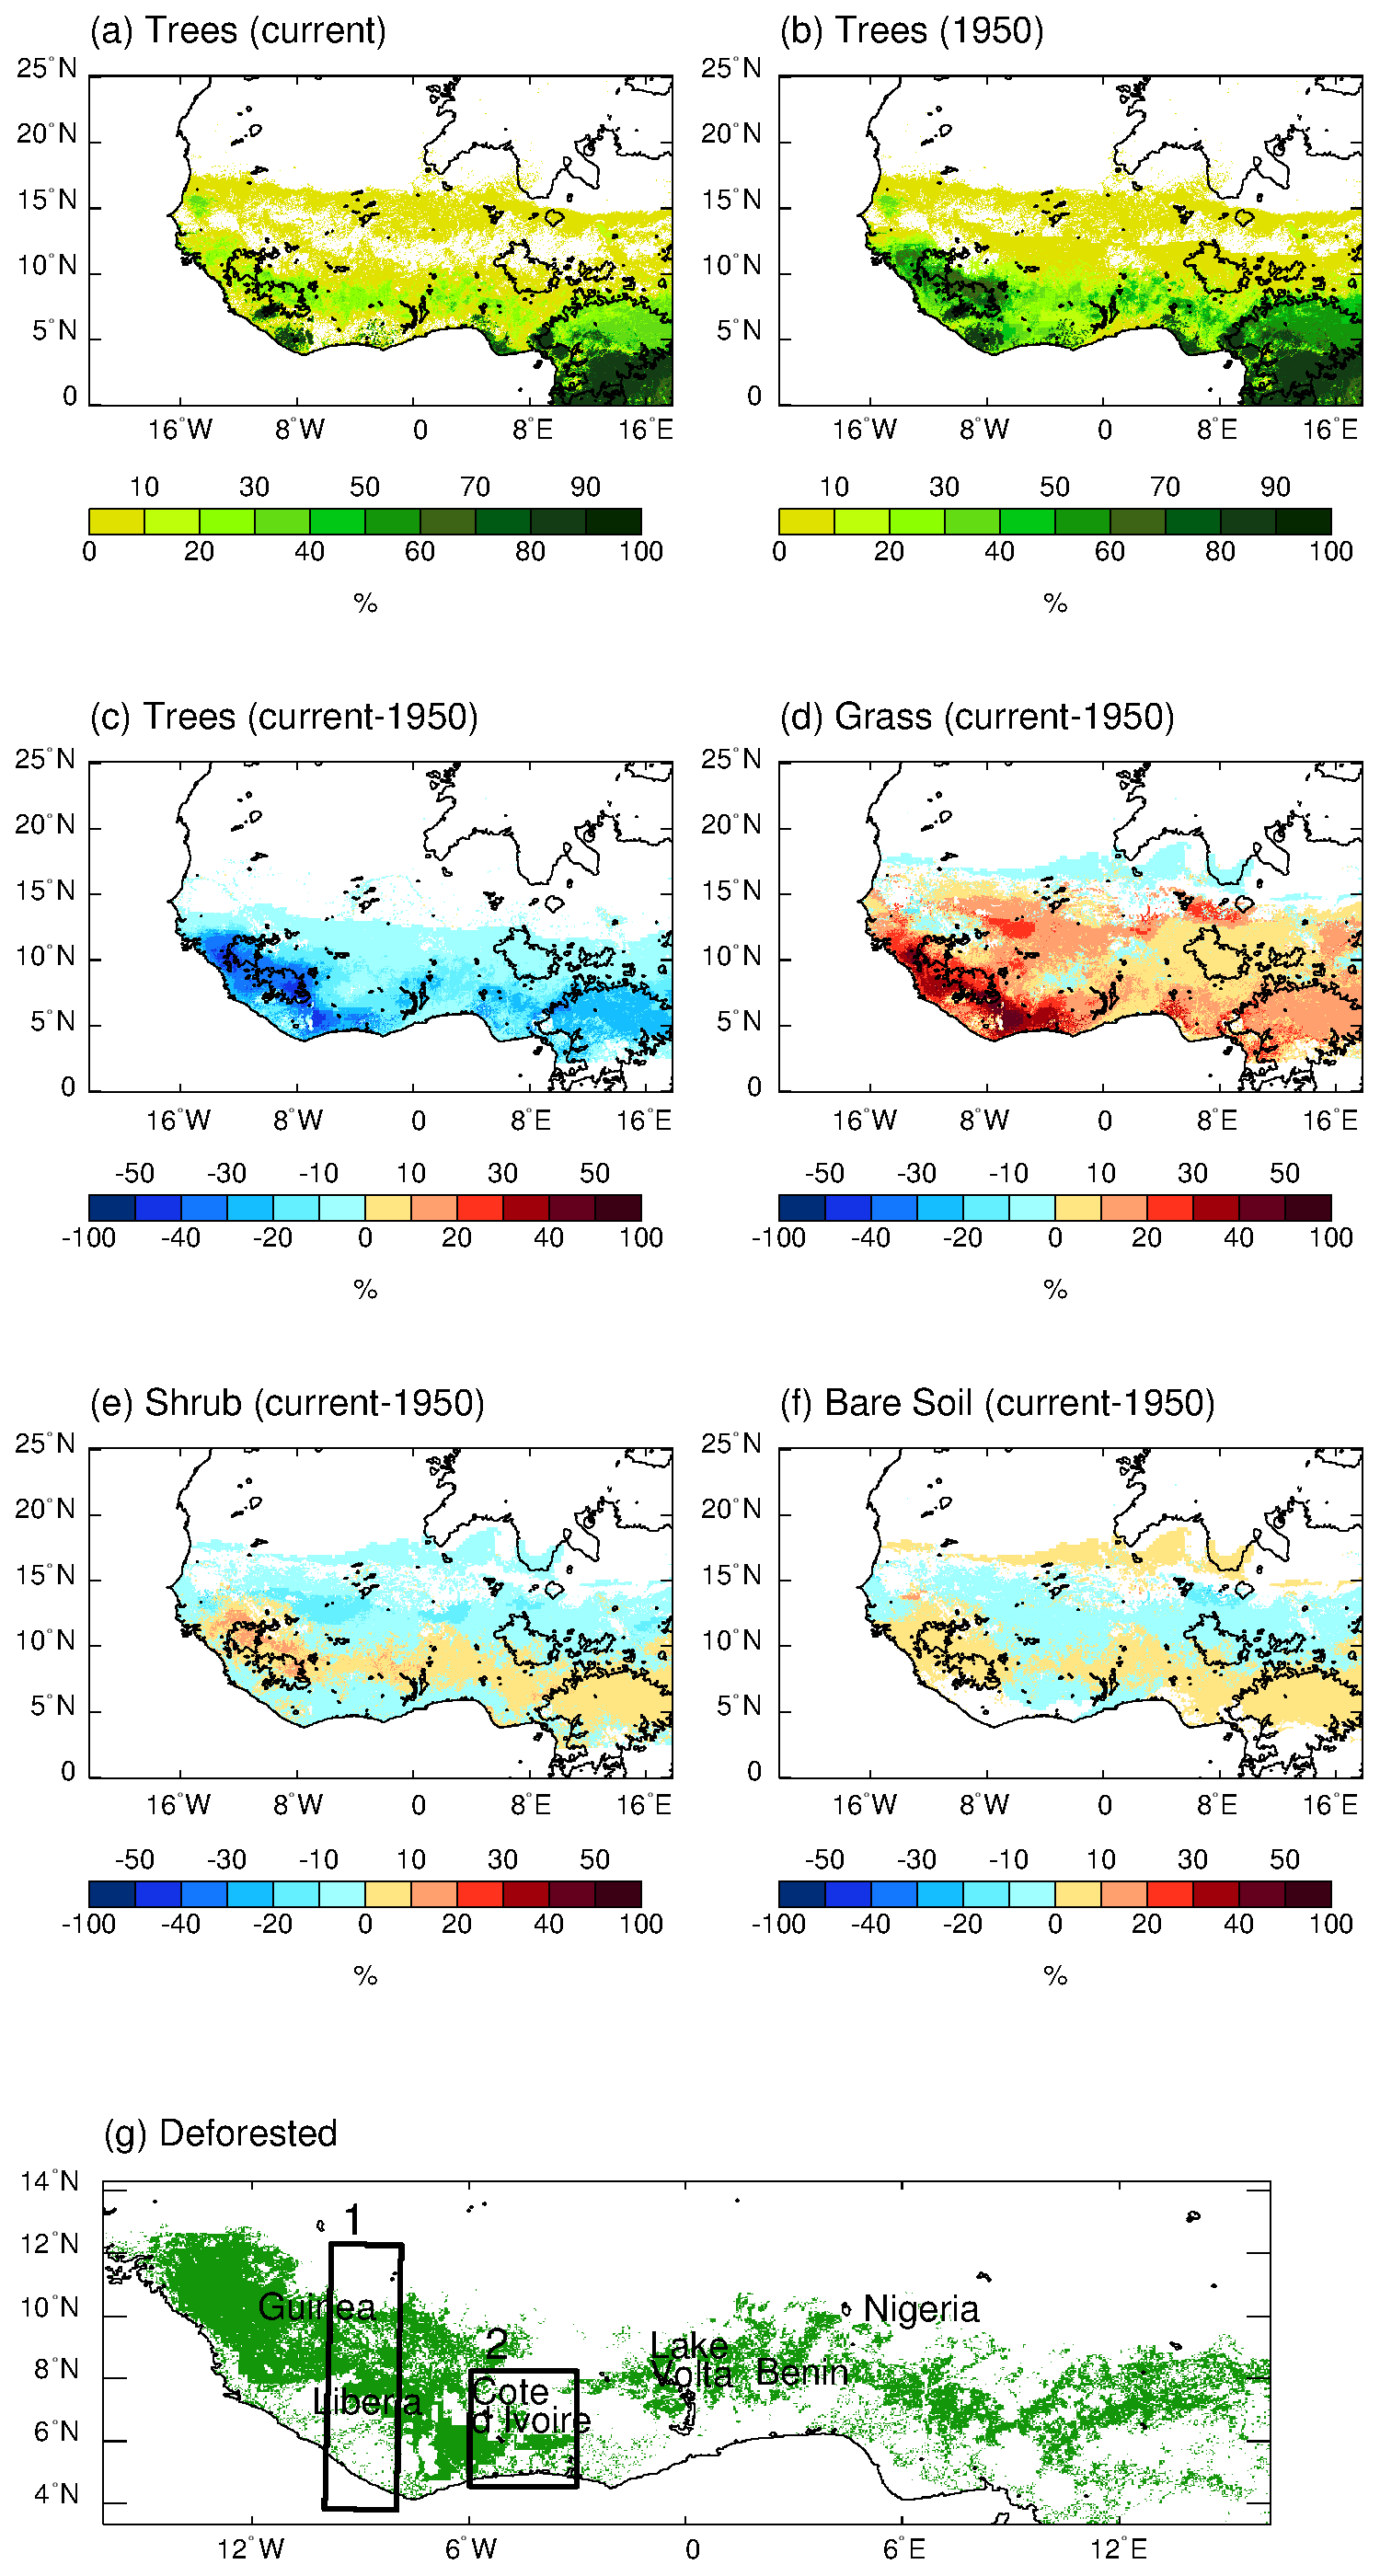
Figure 2Tree cover for (a) current and (b) 1950s; differences in cover of (c) trees, (d) grass, (e) shrubs, and (f) bare soil (land higher than 500 m shown by black contour); and (g) deforestation mask with two sub-regions analysed highlighted with black rectangles. Deforestation is defined as where 1950s tree cover > 30 %, current tree cover < 30 %, and change in tree cover > 10 %.
Figure 2 shows maps of the changes in trees, grass, shrubs, and bare soil from 1950 to current day in the target region. Trees have largely been replaced with grass, although there have been some changes to shrubs and bare soil. We define deforestation as where 1950s tree cover > 30 %, current tree cover < 30 %, and change (current − 1950) in tree cover > 10 % (Fig. 2g). We use 30 % tree cover as separating forest from non-forest, as there appears to be a changeover in behaviour of turbulent fluxes around this level (Fig. S3). This threshold was also used by Hartley et al. (2016).
2.3 Statistical significance tests
Paired Student's t tests of the 5 d means of the current and 1950s vegetation ensemble members are used to determine significant changes at the pixel level. In the case of rainfall, the natural logarithm of rainfall is taken first before performing the t test because rainfall is not normally distributed. We determine the significance of changes at the 95 % confidence interval (p < 0.05) for all variables except rainfall, where we relax the significance to the 90 % confidence interval (p < 0.1) due to the patchy nature of rainfall over the short duration of our simulations. When showing field significance over the region we need to consider the fact that some false rejections of the null hypothesis will be made, and this increases with the number of individual tests. To overcome this, we use the method of Wilks (2016) to control the false discovery rate (FDR). We use a Benjamini–Hochberg correction (Wilks, 2016, Eq. 3) with αFDR = 2α (i.e. αFDR = 0.1 for α = 0.05) to find a new threshold for rejecting the null hypothesis. However, the fact that we have a large number of pixels due to the high resolution of the data imposes a very strict limit on the p values. Also, we do not expect all variables to have changes everywhere in the region, in which case we would not expect field significance to be applicable. In the case of variables which have very patchy patterns of change, we, therefore, just show the significance at the individual pixel level. We highlight where this is the case.
We first show the impact of the deforestation on surface characteristics of albedo, roughness length, and initial soil moisture. We then compare the 5 d means (current vegetation simulations vs. 1950s vegetation simulations) of turbulent and radiative heat fluxes, 1.5 m temperature, conditional instability, 10 m winds, and rainfall. Finally, we look at two focus regions (east Guinea 10–8∘ W and Côte d'Ivoire 6–3∘ W) that exhibit different 1950s winds and deforestation patterns and where we detect large changes in rainfall caused by locally different thermal and dynamical responses to deforestation.
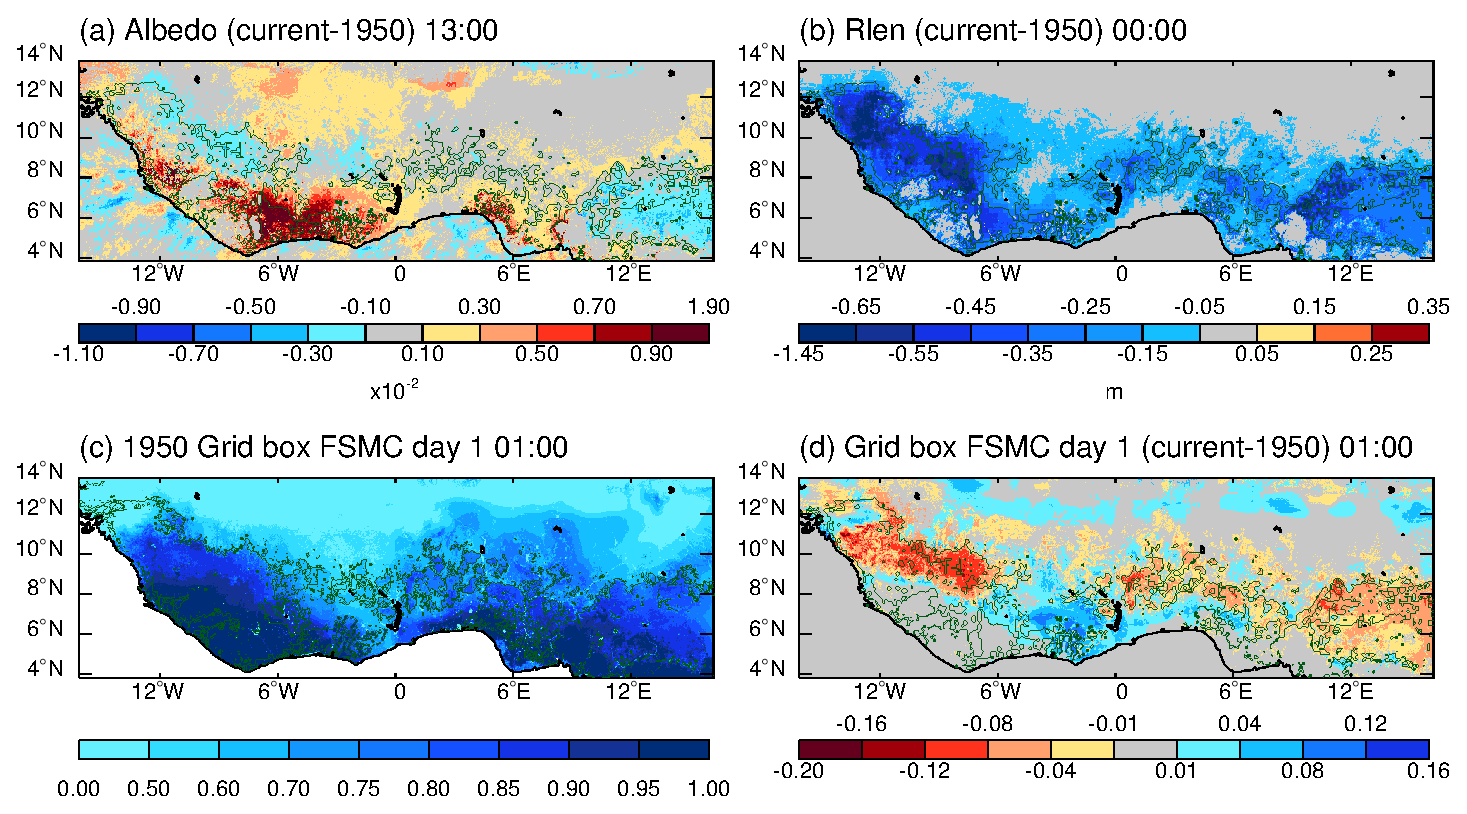
Figure 3(a) Changes in albedo, (b) changes in roughness length, (c) 1950s initial FSMC, and (d) changes in initial FSMC. Green contours show where there has been deforestation in (a), (b), and (d) and the 1950s forested region in (c). Small changes either side of zero are shown in grey.
3.1 Albedo, roughness length, and initial soil moisture
The changes in vegetation result in changes in albedo and roughness length as shown in Fig. 3a and b, respectively. Albedo mostly increases over the deforested areas by up to 0.02 from around 0.15 (i.e. by up to approx. 12 %), although there are some areas with small decreases coinciding with where shrubs have replaced forest. Roughness length decreases over the deforested area by around 0.5 m compared to the 1950s, where roughness length is typically 1–3 m over the forested area. In June, the monsoon has reached the southern part of the region and the soil moisture is high enough that soil moisture control on transpiration is weak (tile-weighted soil moisture stress factor (FSMC) > 0.8), whereas further north it is stronger (Fig. 3c). Trees are able to transpire throughout the dry season due to their deep roots, depleting soil moisture particularly in the deeper soil layers, whereas grasses cannot reach these layers. In the 14-year offline spin-up of soil moisture, this decreased dry season soil moisture depletion for grass cover produces an increase in initial soil moisture at all four levels under current vegetation compared to 1950s vegetation over the deforested areas. As a result, FSMC is increased (less water stress) by up to 0.1 in some areas. In areas with greater deforestation, even though soil moisture has increased, the trees were able to access more water than the grass that now replaces them, so deforestation causes FSMC to decrease by −0.14 (Fig. 3d). In southern areas with coastal deforestation, changes are very small because it has already been raining in this region for 1–2 months, resulting in a high FSMC (low water stress for trees and grass).
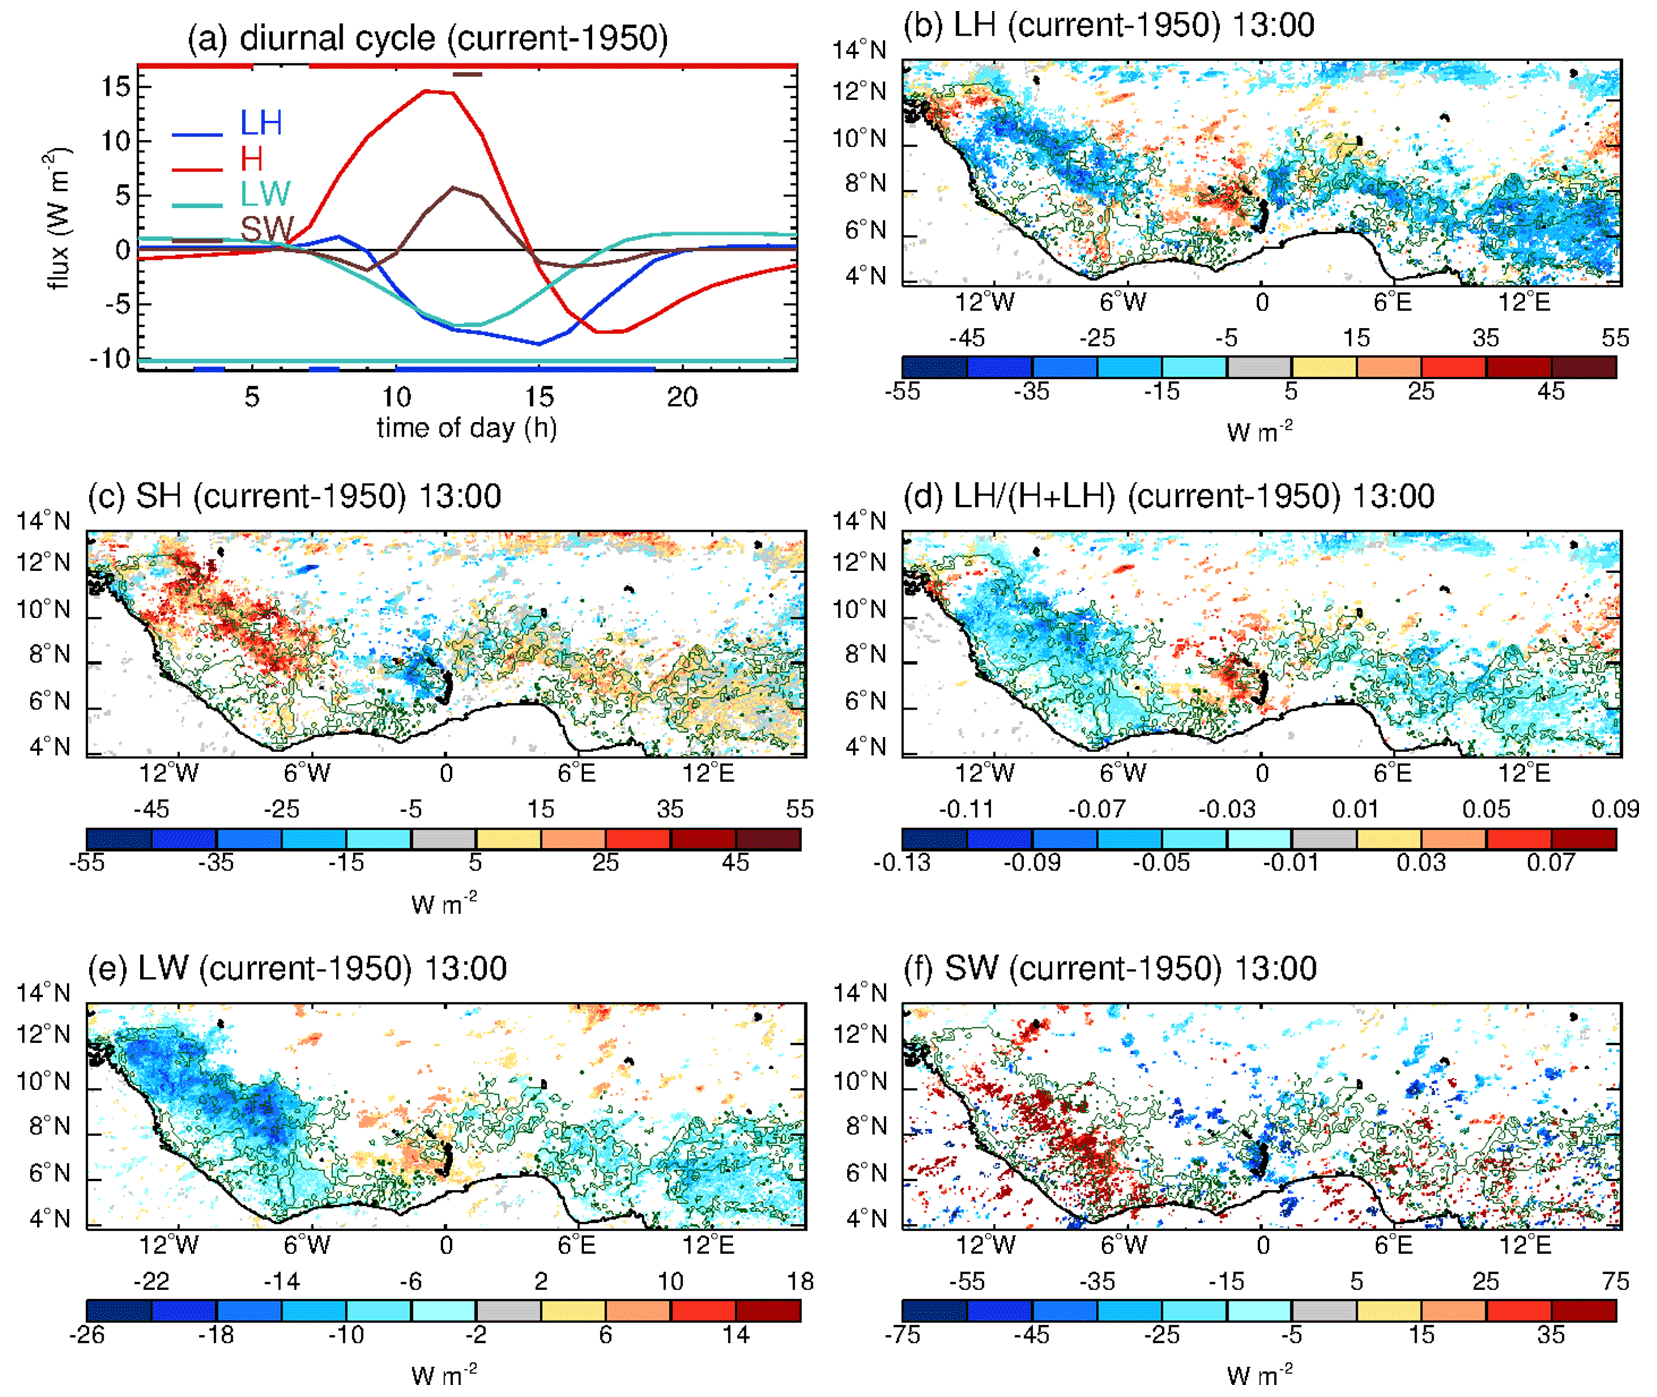
Figure 4(a) Diurnal cycle of changes in turbulent and radiative heat fluxes averaged over all deforested pixels, with times when differences are significant indicated by coloured bars at the top and bottom. Differences in fluxes during the day (13:00 UTC): (b) latent heat, (c) sensible heat, (d) evaporative fraction, (e) net down surface longwave, and (f) net down surface shortwave. Insignificant changes are shown in white (for SW this is the individual pixel significance, whereas for other variables FDR correction has been applied), whereas small but significant changes either side of zero are shown in grey. Green contours show where there has been deforestation.
3.2 Turbulent and radiative fluxes
Diurnal cycles of the change in turbulent and net downward surface radiative fluxes over deforested areas are shown in Fig. 4a. Peak differences in radiative and turbulent fluxes occur between 11:00–14:00 UTC. Deforested areas show decreased latent heat flux (LH) throughout the day, while sensible heat flux (SH), associated with higher surface temperatures, is increased only until 15:00 UTC. The canopy heat capacity for trees is larger than for grass (areal heat capacities in JULES are 320 000, 12 000, and 8000 for BT, C4, and C3 grasses, respectively). This means that, during the morning, more heat is absorbed to warm the tree canopy than the grass, whereas later in the day, the heat stored in the tree canopy is released. Therefore, deforestation causes increases in combined SH + LH in the morning (up to 13:00 UTC) but decreases in the afternoon when also the maximum in cloudiness and convective activity occurs. In the following, we hence consider spatial patterns of pre-convective conditions at 13:00 UTC, when daytime heating is strong, radiative flux differences are maximized, and perturbations from active convection are still limited.
At 13:00 UTC, deforested regions predominantly have lower LH (Fig. 4b) by up to 30 W m−2, higher SH (Fig. 4c) by up to approx. 40 W m−2, and a lower evaporative fraction (Fig. 4d). There are several areas (e.g. around 14∘ W, 11∘ N and 3∘ W, 8∘ N) where deforestation is accompanied by an increase (rather the expected decrease) in evaporative fraction. This can occur where dry-season soil moisture depletion decreased after deforestation, as discussed in Sect. 3.1.
The daytime net downward longwave radiative flux (LW) decreases by up to approx. 18 W m−2 (i.e. increased emission). Reduced roughness length suppresses turbulent fluxes (i.e. reduced heat from surface to atmosphere, but particularly LH due to the shift in flux partitioning to greater SH) and therefore increases land surface temperature, which increases upward longwave radiative flux (LWu) and decreases LW with no change in downward longwave radiative flux (LWd). Reduced cloud cover decreases LWd, enhancing the decrease in LW although this is a smaller effect (Fig. 4e). The net downward shortwave radiative flux (SW) is affected by both albedo increases (causes decreases in SW) and reductions in cloud cover (causes increases in SW) resulting in a patchy overall increase in daytime SW (Fig. 4f) by up to approx. 40 W m−2. When averaged over the deforested pixels, the changes in LW outweigh the changes in SW, resulting in a decrease in net radiative flux. However, for individual pixels, SW changes may dominate, and the total radiative flux changes (not shown) are similar in pattern but smaller in magnitude to SW changes.
In summary, averaged across all deforested pixels during the day, the simulations indicate that deforestation increases sensible heat, decreases latent heat, and increases longwave emission from the surface. We do not have multi-site long-term flux observations in this region with which to compare the model, but this behaviour is consistent with pan-tropical analyses of increased air temperature responses to deforestation (Alkama and Cescatti, 2016; Duveiller et al., 2020). However, we note that there are deforested regions within the domain where these flux responses are muted (where 1950s soils are wet) or even reversed. Under both these circumstances, the dynamical (roughness) effect is expected to dominate over a negligible thermal effect, as in the simulations of Khanna et al. (2017).

Figure 5Changes in diagnostics for (a) diurnal cycle of temperature profile averaged over all deforested pixels and for night (01:00 UTC) (left) and day (13:00 UTC) (right): (b) and (c) near-surface temperature and (d) and (e) Δθ defined as θe at 925 hPa minus θes at 700 hPa. Insignificant changes are shown in white (for Δθ this is the individual pixel significance, whereas for T 1.5 m, FDR correction has been applied), whereas small but significant changes either side of zero are shown in grey. Green contours show where there has been deforestation.
3.3 Near-surface temperature and conditional instability
Trees shade the surface from the sun during the day, have higher heat capacity and roughness length than grass, and transpire more than grass causing evaporative cooling. Therefore, we expect land to be cooler in forest regions than grass regions and a warming due to deforestation. At night, the enhanced aerodynamic coupling with the atmosphere that forests exert (compared to smoother surfaces), along with the release of heat absorbed by trees in JULES, means that we expect the land to be warmer in forest regions than grass regions and a cooling due to deforestation. In line with that, Fig. 5a shows tropospheric temperature increases during the day up to about 800 hPa and tropospheric temperature decreases during the night up to 900 hPa (with the largest temperature decreases confined to below 950 hPa) when averaged over deforested pixels. Figure 5b and c show warmer near-surface temperature during the day (up to 1 K) and cooler near-surface temperature at night (approx. −0.5 K) in the deforested areas, resulting in a net warming over the whole day. Temperature changes are more pronounced where the areal extent of deforestation is larger. Differences also occur outside the deforested areas, e.g. nighttime cooling north of the deforestation in Côte d'Ivoire, likely linked to changes in near-surface winds (discussed later), and daytime cooling to the west of Lake Volta due to decreased daytime sensible heat in that location (cf. Fig. 4c).
There are significant surface pressure differences (up to 0.3 hPa, not shown) that largely follow the near-surface temperature differences consistent with localized heat-low effects, as discussed by Taylor et al. (2005), but these are more homogeneous across the deforested areas during the day and patchier at night.
The equivalent potential temperature (θe) in the boundary layer is a measure of convective available potential energy (CAPE), whereas the saturated equivalent potential temperature (θes) above the lifting condensation level is a measure of convective inhibition (CIN). A parcel in the boundary layer is buoyant if θe > θes. Therefore, the difference between the two gives a measure of conditional instability (Garcia-Carreras et al., 2011). We use θe at 925 hPa minus θes at 700 hPa, hereafter called Δθ, as our two-level conditional instability measure. Figure 5d and e show changes in Δθ. Where lower tropospheric temperature increases during the day, which would increase buoyancy, is typically coincident with humidity decreases, making the atmosphere less buoyant and resulting in overall decreases in Δθ (by up to 1.1 K). In fact, Δθ changes are more related to changes in humidity than changes in temperature (compare Fig. 5d and c with Fig. S4). The magnitude of changes in Δθ is greater during the day than the night when temperature and humidity changes are smaller.
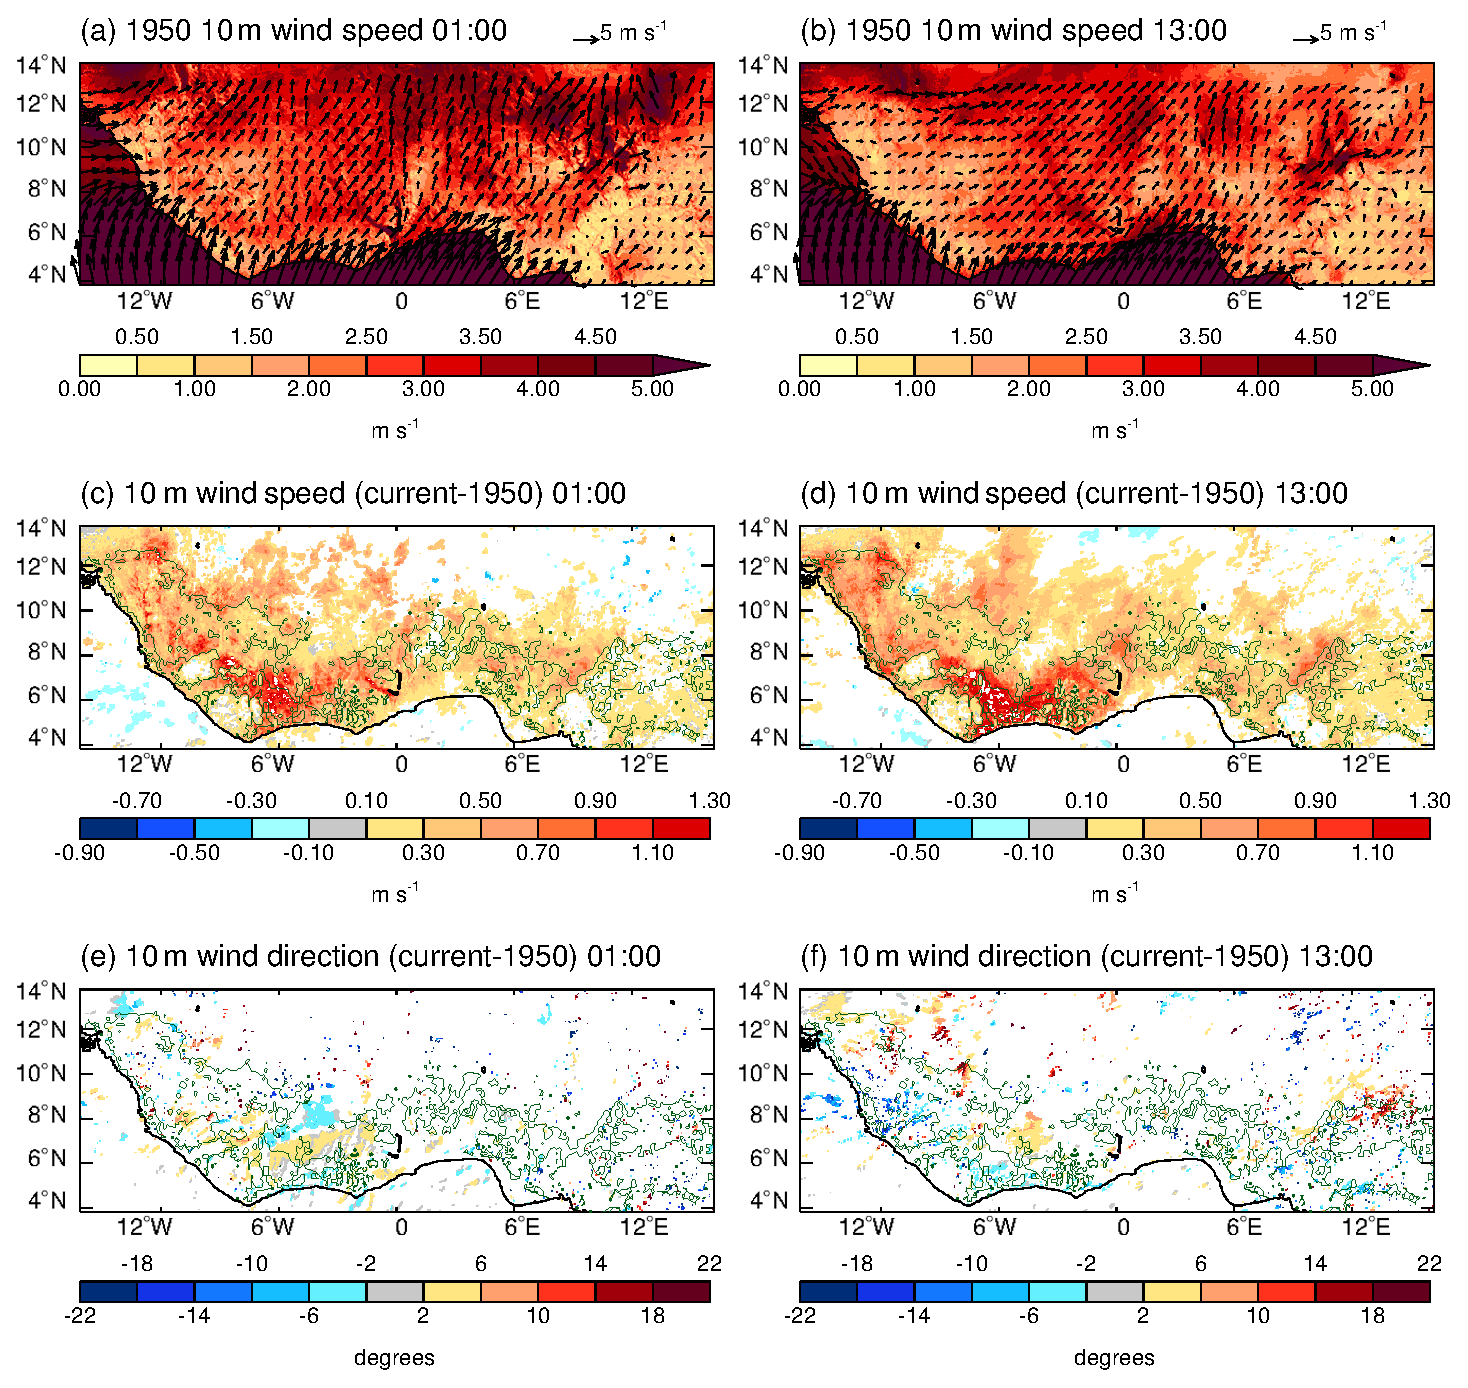
Figure 6Winds of 10 m for 01:00 UTC (left) and 13:00 UTC (right). The 1950 10 m wind (speed in shading, direction show by vectors) at (a) 01:00 UTC and (b) 13:00 UTC. Changes in (c) and (d) 10 m wind speed and (e) and (f) 10 m wind direction. Insignificant changes are shown in white (for wind direction this is the individual pixel significance, whereas for wind speed, FDR correction has been applied), whereas small but significant changes either side of zero are shown in grey. Green contours show where there has been deforestation.
3.4 10 m winds
The 1950s 10 m winds during night and day are largely south to south-westerly over the region (Fig. 6a and b). The differences in 10 m wind speeds show increases during both night and day over the deforested area (Fig. 6c and d) as expected due to roughness length decreasing, and the increases are greatest where the 1950s winds are high. There are only small changes in 10 m wind direction (Fig. 6e and f). The changes in 10 m winds depend strongly on location and extend into regions where there have been small amounts of vegetation change but are not marked as “deforested” based on our forest change thresholds (see Fig. 3b for changes in roughness length). In addition, increases also occur just downwind of deforestation boundaries.
Changes in pressure gradients can also modify the winds by increasing the wind into (deforested) low-pressure regions and out of high-pressure regions, although this appears to be a weaker effect compared to the roughness length changes. As pressure changes are less pronounced at night (mostly insignificant and less than 0.3 hPa), the changes in winds are largely due to the reduced roughness length (nighttime changes in winds strongly correlate with expected roughness length scaling; see Fig. S5). Increases in 10 m wind speeds are likely to cause convergence on the downwind side and divergence on the upwind side of deforestation as changes are greater within the deforested area than outside.
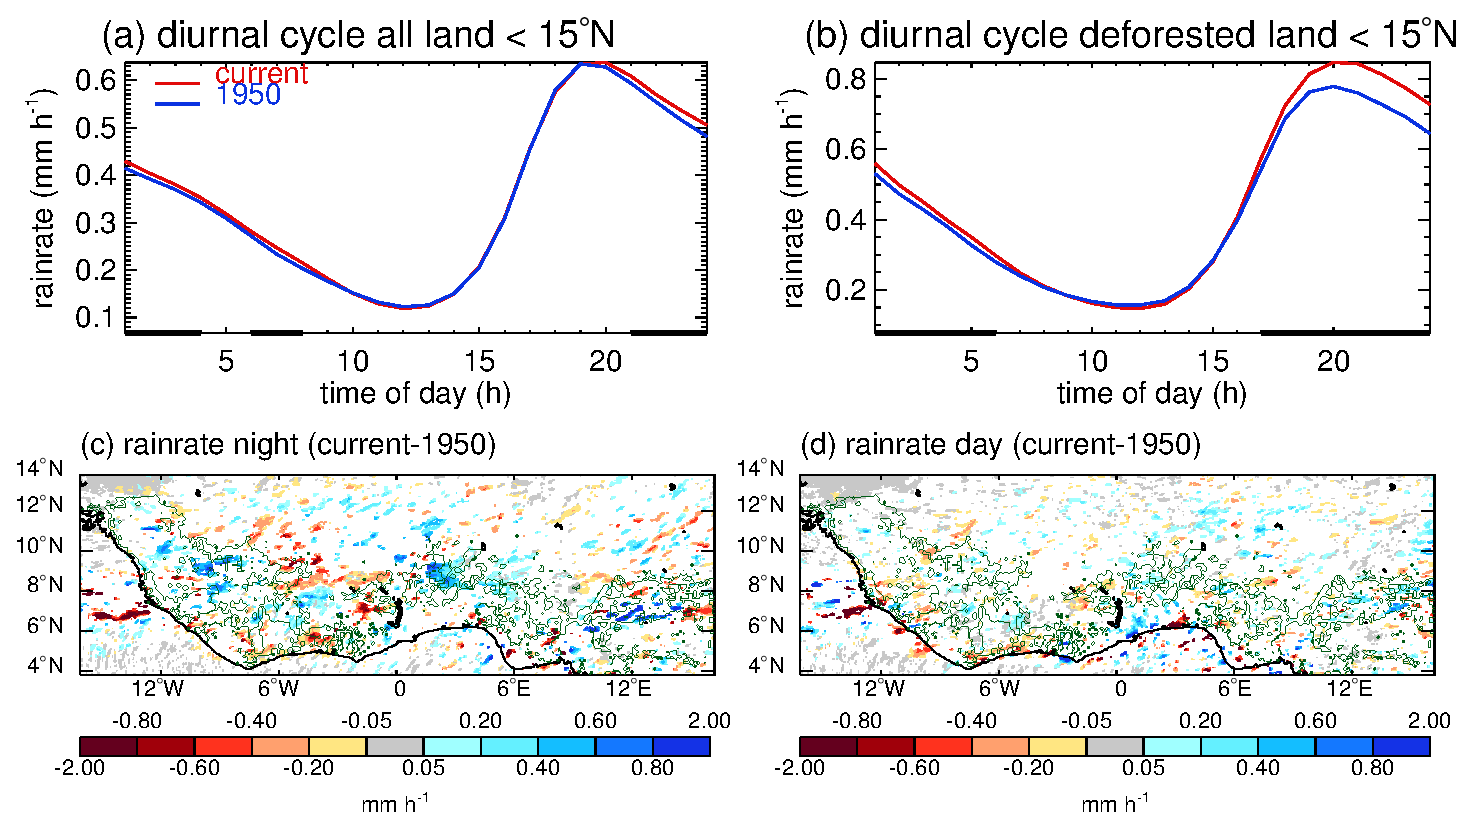
Figure 7Diurnal cycle of rainfall with times where differences are significant at p = 0.1 indicated by black bar for (a) all land points below 15∘ N and (b) deforested pixels only. Maps of rainfall differences for (c) 19:00–06:00 UTC and (d) 07:00–18:00 UTC. Insignificant changes at the individual pixel level are shown in white, whereas small but significant changes either side of zero are shown in grey. Green contours show where there has been deforestation.
3.5 Rainfall
The ensemble mean daily rainfall accumulation averaged over all land points south of 15∘ N shows a small but significant increase of +2 % (+0.17 mm) in the current vegetation simulations compared to 1950s vegetation simulations (1950 is 8.35 mm), and this increases to +6 % (+0.64 mm) for deforested pixels (1950 is 10.18 mm) (Fig. 7a and b). This behaviour is maximized between the hours of 18:00 and 06:00 UTC with an average of +8.4 % and a maximum of +12.8 % at 00:00 UTC.
Maps of the change in ensemble mean rain rate averaged over the nighttime and daytime are presented in Fig. 7c and d, respectively. They confirm larger and more significant changes at night, with rainfall increases over many deforested areas, though scattered decreases in rainfall and changes in non-deforested regions do occur (e.g. north Côte d'Ivoire). This illustrates that, from this short set of simulations, small-scale rainfall changes are too noisy to draw robust conclusions about the nature of the rainfall response to deforestation locally. Aggregated over all deforested pixels, however, an increase in rainfall with deforestation clearly emerges (Fig. 7b), consistent with observations for this region (Taylor et al., 2022, hereafter T22). T22 analysed changes in frequency of convective cores over a 30-year period as a function of land surface temperature trends (a proxy for deforestation). They found maximum increases around the late afternoon to early evening convective peak, with enhanced convection persisting downstream for several hours (see their Fig. 2) in line with our own results. We used the data of T22 to determine the relative change in core frequency per amount of deforestation and scaled for significant deforestation, thus removing changes unrelated to deforestation. This results in an estimate of 25 % increase in relative core frequency, somewhat higher than our 9 % relative rainfall change. We would not expect an exact match given the different nature of the data and that the observations span the entire rainy period in southern West Africa for a period of 30 years whilst our simulation represents conditions from a single year in early June.
3.6 Drivers of rainfall change in specific regions
Processes governing rainfall changes are dependent on the proximity of the deforestation to the coast, location of 1950s rainfall, strength of the sea breeze, soil wetness, and extent of deforestation (larger areas of deforestation and drier areas have greater temperature differences). To demonstrate this, we now assess in detail the changes in two specific focus regions (shown in Fig. 2g), chosen for their contrasting soil wetness, extent of deforestation, and proximity to the coast. In the first case (east Guinea, 10–8∘ W, Fig. 2g box 1), the extensive deforestation is up to 400 km from the coast. The recent start of rainfall after the dry season means that evapotranspiration is still limited by soil moisture approx. 200 km or more inland (i.e. FSMC < 1) such that deforestation induces a decrease in evaporative fraction and atmospheric warming. This decrease in evaporative fraction with deforestation is also true for the Sierra Leone and west Guinea (around 13∘ W) region. We thus consider our chosen east Guinea box as representative of the deforested latitudinal band across these regions. The second region (Côte d'Ivoire, 6–3∘ W), with marked deforestation 40–200 km from the south coast, was chosen for its earlier start to the rainy season, meaning that soil moisture is not limited and consequently has only a weak control on the evaporative fraction during the simulation. Moreover, rainfall in this second case is strongly influenced by the daytime penetration of the sea breeze. Whether the rainfall changes in these regions are predominantly dynamically or thermally driven depends on the local characteristics, which will we investigate in the following.
Between 56 %–70 % of rainfall in these sub-Sahelian regions is produced by mesoscale convective systems (MCSs) (Maranan et al., 2018). These storms tend to be initiated in the afternoon to early evening and last for many hours. We use an MCS tracking algorithm on 15 min rain rate fields to find storms where rain rate exceeds 1 mm h−1 and where the storm reaches at least 1000 km2 in area at some point in its lifetime. The algorithm is described in Crook et al. (2019). For both focus regions (Fig. 2g boxes), we determine frequency and properties of storms over land at each time of the day in both 1950s simulations and current simulations to understand the changes in rainfall. Mostly, the significant changes in rainfall occur in the evening, sometimes reaching into the early hours of the morning.
For both regions, we find that LH decreases for deforested areas but is mostly limited to the afternoon between 12:00–18:00 UTC. Although this reduced LH would result in less moisture availability during the afternoon, it did not affect rainfall amounts significantly, potentially because rainfall frequency peaks between 15:00 UTC and the early morning hours (see Fig. 7b) when oceanic moisture may be advected inland from the coast due to increased onshore winds over night. We assess diurnal cycles of Δθ, specific humidity changes, 1.5 m temperature changes, pressure changes, and changes in 10 m convergence caused by the changes in pressure (see Sect. 3.3) and 10 m winds (see Sect. 3.4) to show that to understand rainfall changes it is crucial to analyse how deforestation affects the dynamics and thermodynamics.
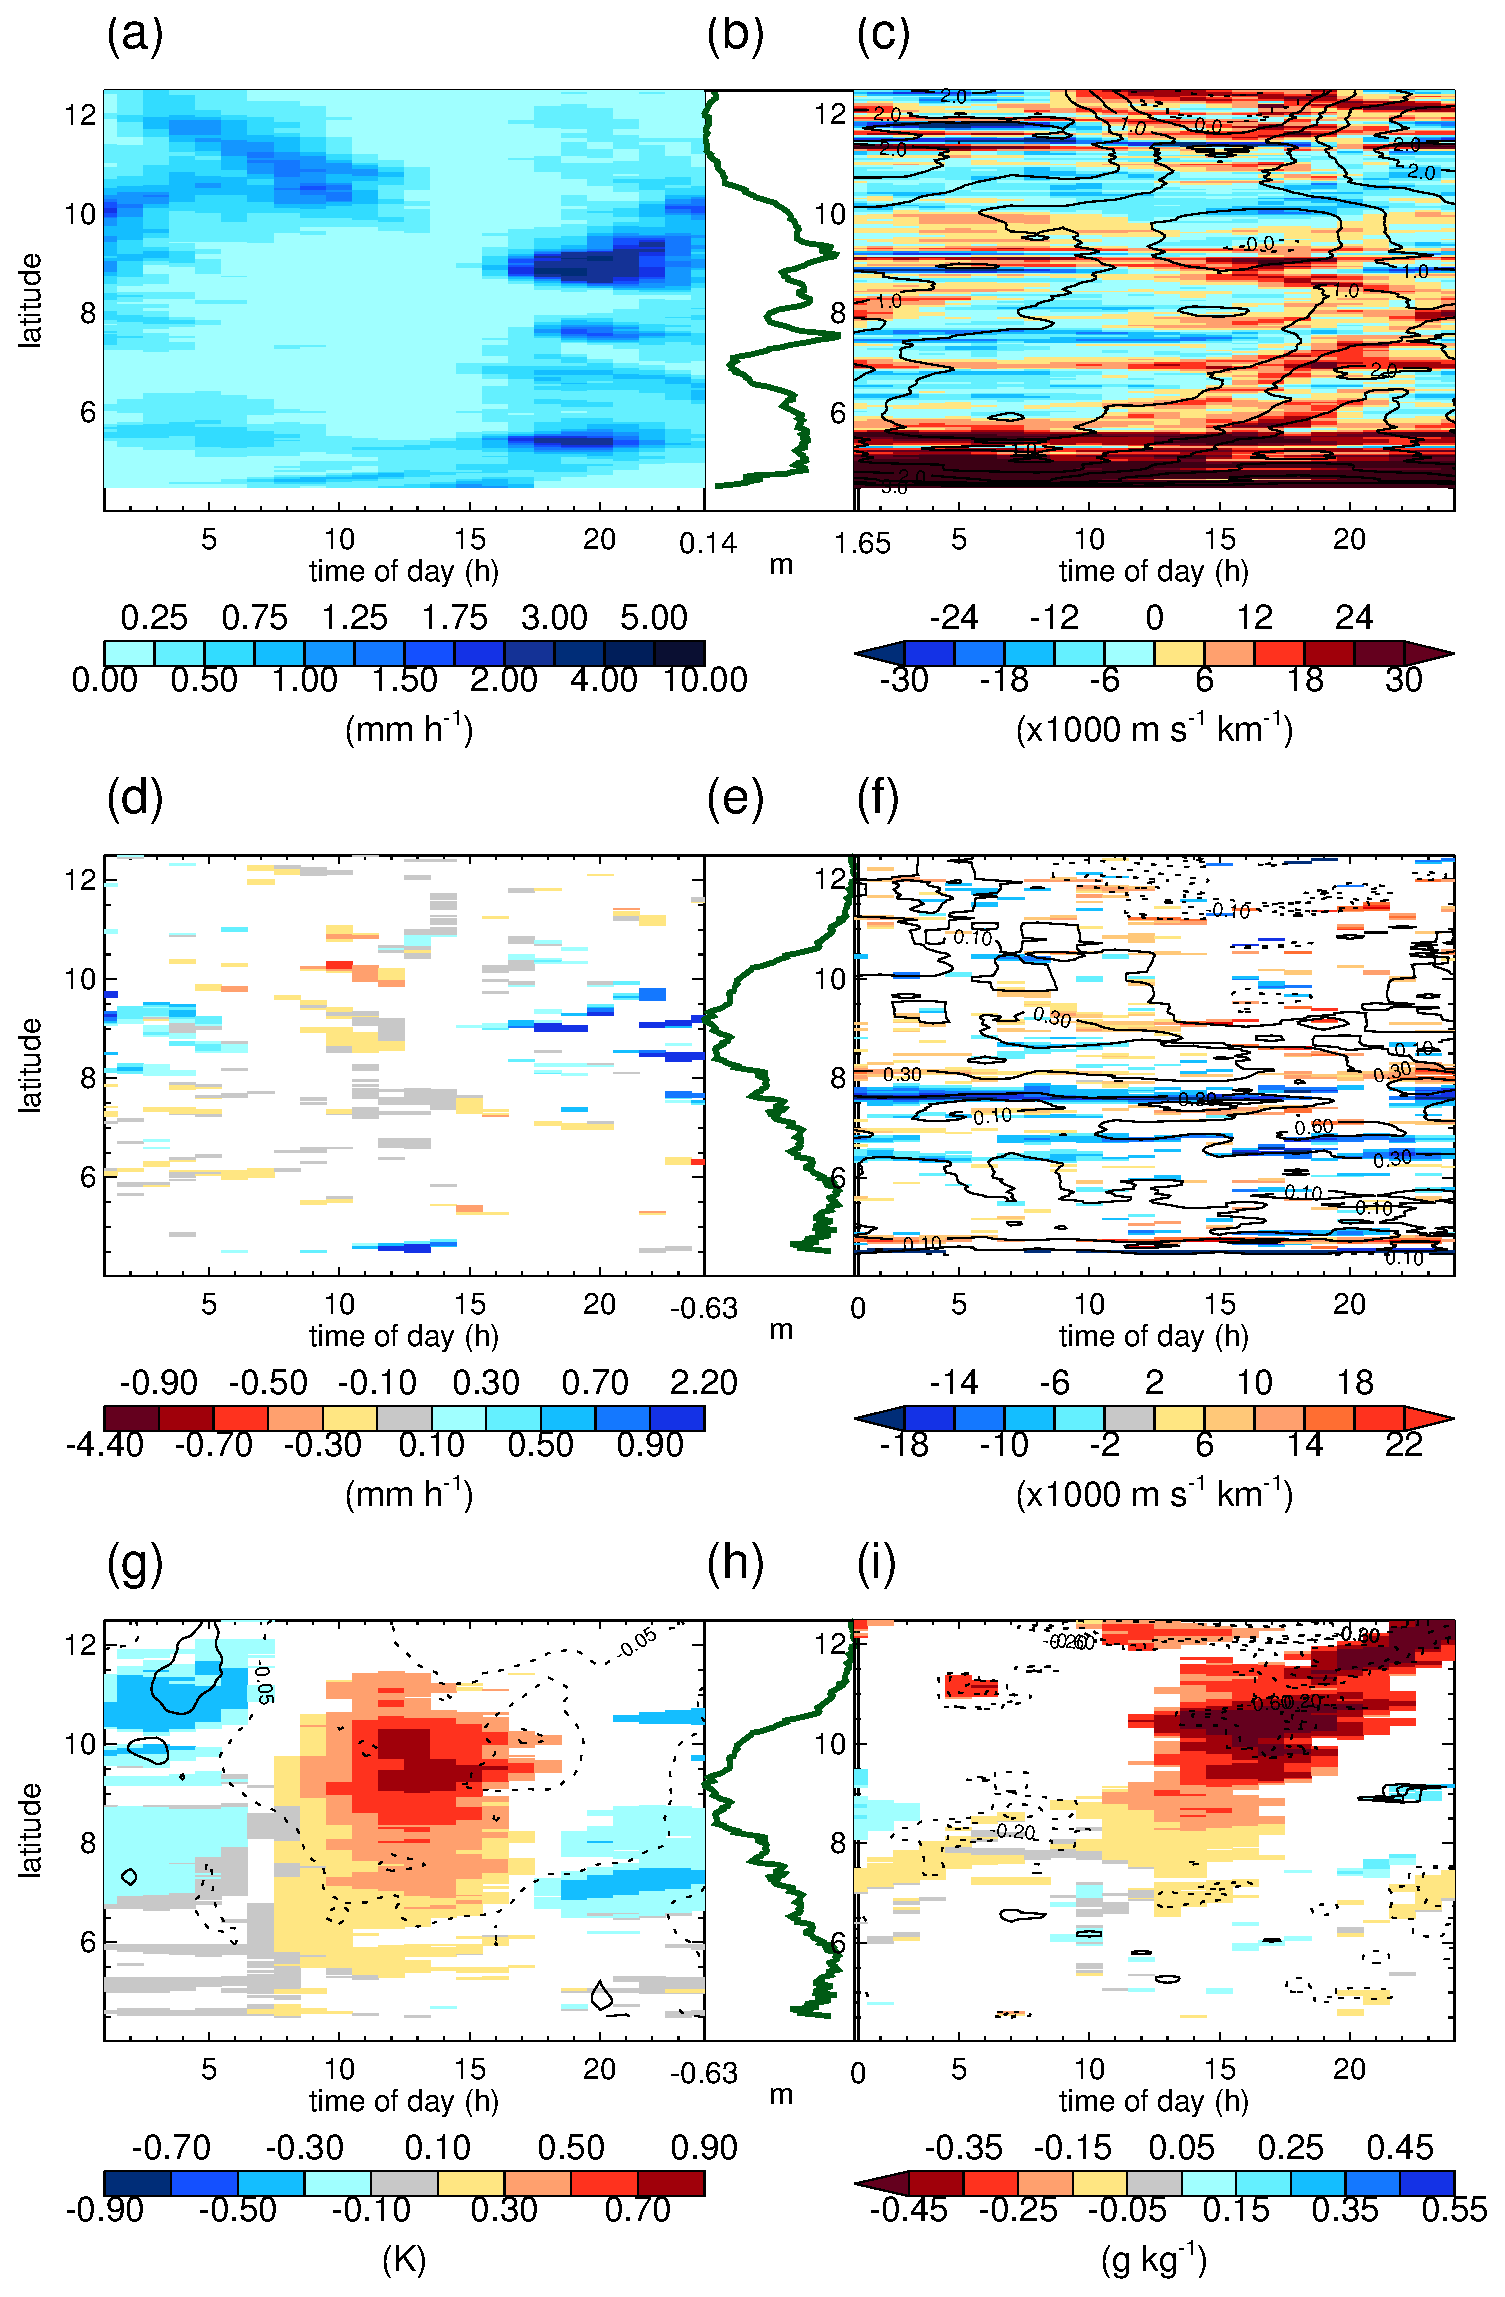
Figure 8North–south cross sections averaged over 10–8∘ W over land. Diurnal cycles of (a) 1950s rain rate, (b) 1950s roughness length indicating 1950s forest, and (c) 1950s convergence of 10 m winds (shading) and 1950s 10 m meridional wind (black contours every 0.5 m s−1); changes in (d) rain rate, (e) roughness length indicating the extent of deforestation, (f) convergence of 10 m winds (shading) with 10 m meridional wind (black contours every 0.2 m s−1), (g) 1.5 m temperature (shading) and surface pressure (black contours every 0.1 hPa), (h) roughness length (repeat of e), and (i) specific humidity (shading) with Δθ (black contours every 0.4 K). Insignificant changes are shown in white, whereas small but significant changes either side of zero are shown in grey.
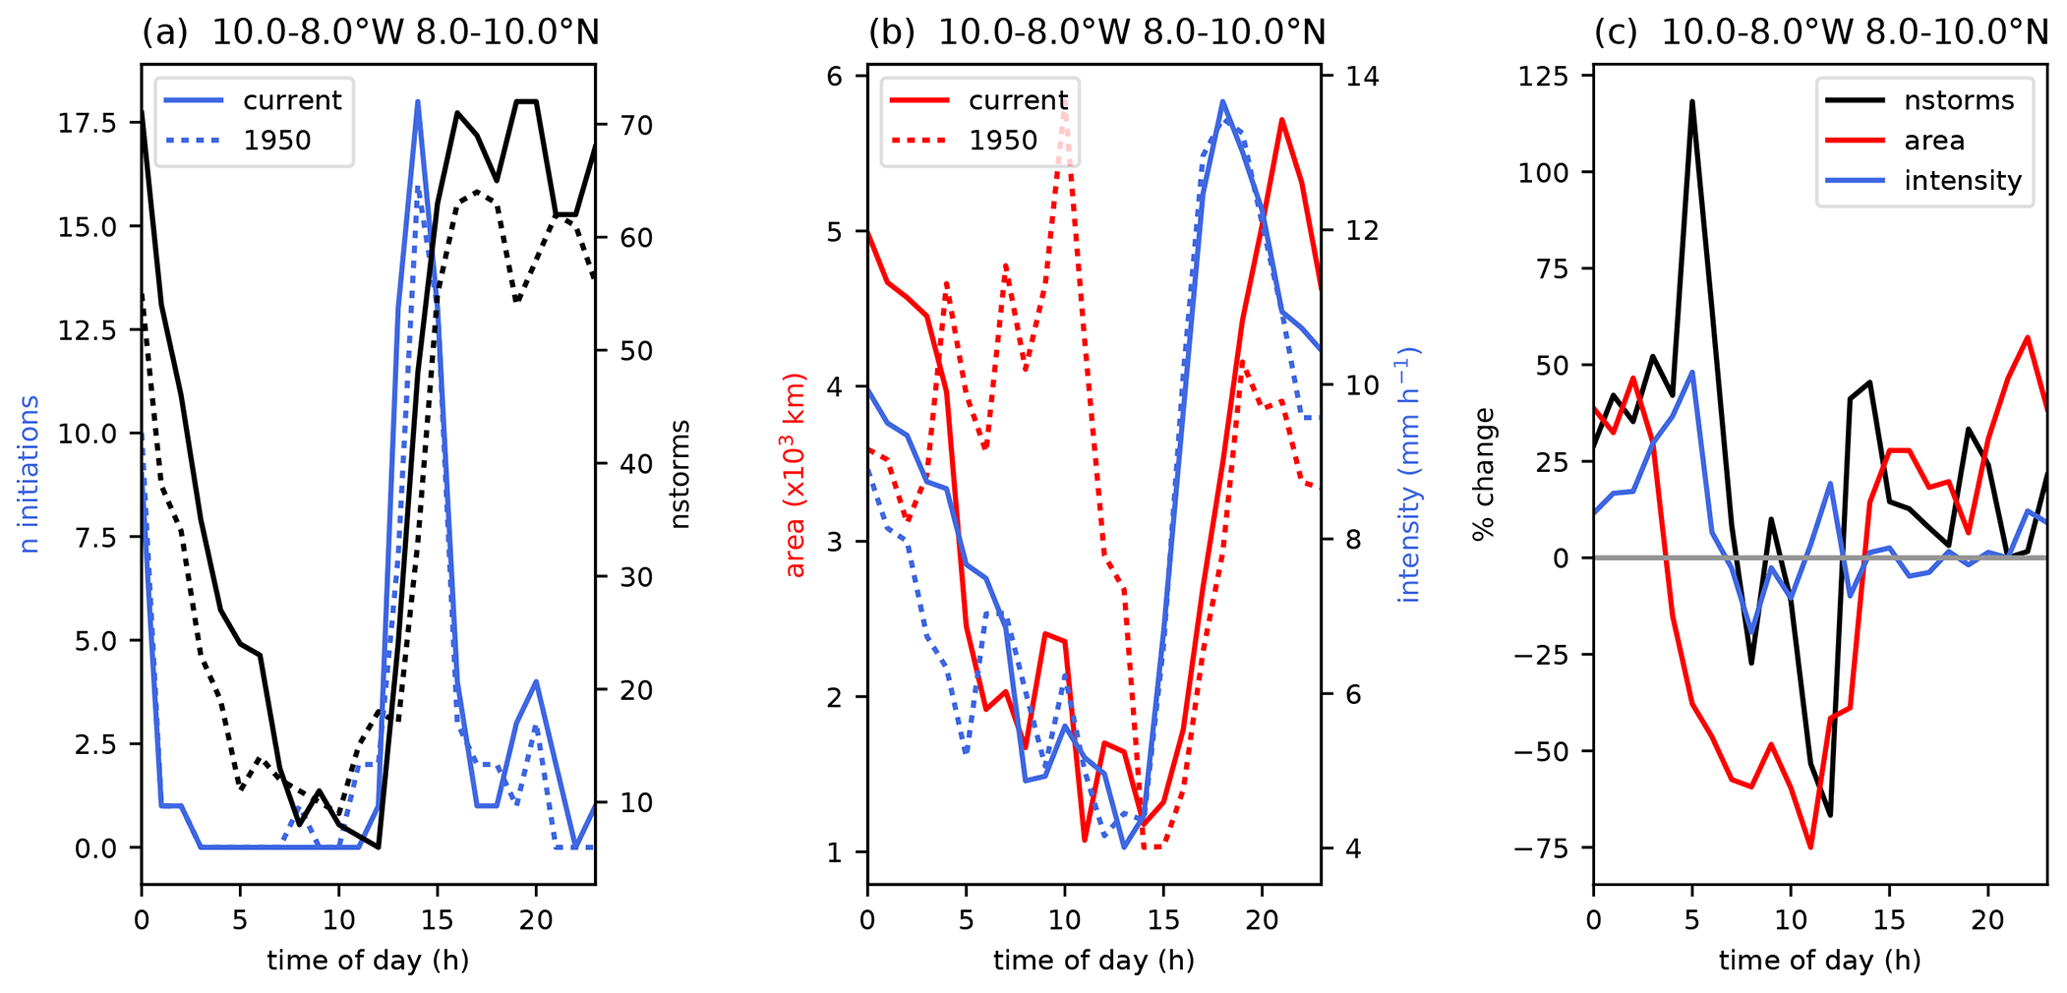
Figure 9Diurnal cycles in the region 10–8∘ W, 8–10∘ N of (a) number of spontaneous initiations (light blue) and number of storms present (black); (b) mean area (red) and mean intensity (light blue) of storms; and (c) the percent change in number of storms (black), mean area (red), and mean intensity (light blue).
3.6.1 Inland deforestation with soil moisture stress
In this region (east Guinea, 10–8∘ W), 1950s rainfall totals are highest for the northern half of the 1950s forest (8–10∘ N) during the afternoon and evening (Fig. 8a). Convergence in the 1950s (Fig. 8c) is greatest at the coast and positive in locations where the gradient in roughness length (Fig. 8b) becomes positive (grass to forest boundaries, at approx. 7, 8.2, and 9∘ N). The effect of the sea breeze front, visible as a region of positive convergence moving inland over the evening from approx. 6–7∘ N, is also apparent in Fig. 8c. The regions of positive convergence coincide with the high rainfall patterns. This is a region with extensive deforestation 300–400 km inland (deforestation is patchy from 5.5–7.5∘ N and more extensive from 8–10.5∘ N) (Fig. 8e and h) where the daytime temperature (Fig. 8g) and turbulent flux changes are large. There is a significant increase in rain from 16:00 UTC to the early morning hours and a significant decrease from 10:00–13:00 UTC at 8–10∘ N (Fig. 8d). There is also a general indication of slightly reduced rainfall south of 8∘ N. Although the convergence field is noisy, positive rainfall changes at 8–10∘ N tend to occur where convergence increased after deforestation (Fig. 8f). Conversely, negative rainfall changes occur where convergence (south of 8∘ N) or specific humidity (e.g. 8–11∘ N during the day) decreased. Increased convergence (Fig. 8f) is aligned with areas of decreased roughness length (Fig. 8e and h) and surface pressure (Fig. 8g). There is no impact on the sea breeze front because there is very little deforestation and no significant temperature change near the coast. From 7–8∘ N on the upwind edge of the main deforestation, there are less convergent conditions over much of the day due to roughness length changes to the north. From 10:00–18:00 UTC, lower pressure to the north further reduces convergence over that area. From 9–11∘ N we would expect more convergent conditions throughout the day due to roughness length changes. Pressure reductions also have an effect north of 8∘ N from 07:00–23:00 UTC and particularly from 9–11∘ N between 16:00–20:00 UTC due to the large temperature changes. North of 8∘ N there are mostly more convergent conditions throughout the whole day. Although LH and therefore low-level specific humidity decrease from 8–11∘ N during the day and are partly responsible for reduced rainfall at this time, the specific humidity increases around 7–10∘ N in the evening (Fig. 8i). The drier air is advected north through the evening with moist air being drawn in from the coast, also resulting in increases in Δθ around 9∘ N after 20:00 UTC (Fig. 8i) (see also Fig. S6).
Focusing on the area of strongest deforestation between 8–10∘ N, we find small increases in the number of afternoon initiations in this region compared to the 1950s and increases in the number of storms of 15 % throughout the afternoon and evening, which increases to approx. 40 % for the early morning hours (Fig. 9a and c). An increase in local afternoon storm frequency after deforestation is consistent with observational results for the region (Taylor et al., 2022). During the evening the mean storm area increases by approx. 20 %, and into the early hours of the morning before 05:00 UTC, mean storm area and intensity increase by approx. 30 % with increases in area preceding increases in intensity (Fig. 9b and c). These all result in higher rainfall. The lower rainfall seen between 08:00–12:00 UTC is due partly to a smaller number of storms (approx. 25 % lower between 08:00–13:00 UTC) but mainly due to the mean storm area being considerably smaller (30 %–70 % between 05:00–14:00 UTC). Note a similar balance of processes is responsible for the enhanced precipitation over a deforested area further west in Guinea (Fig. 7c).
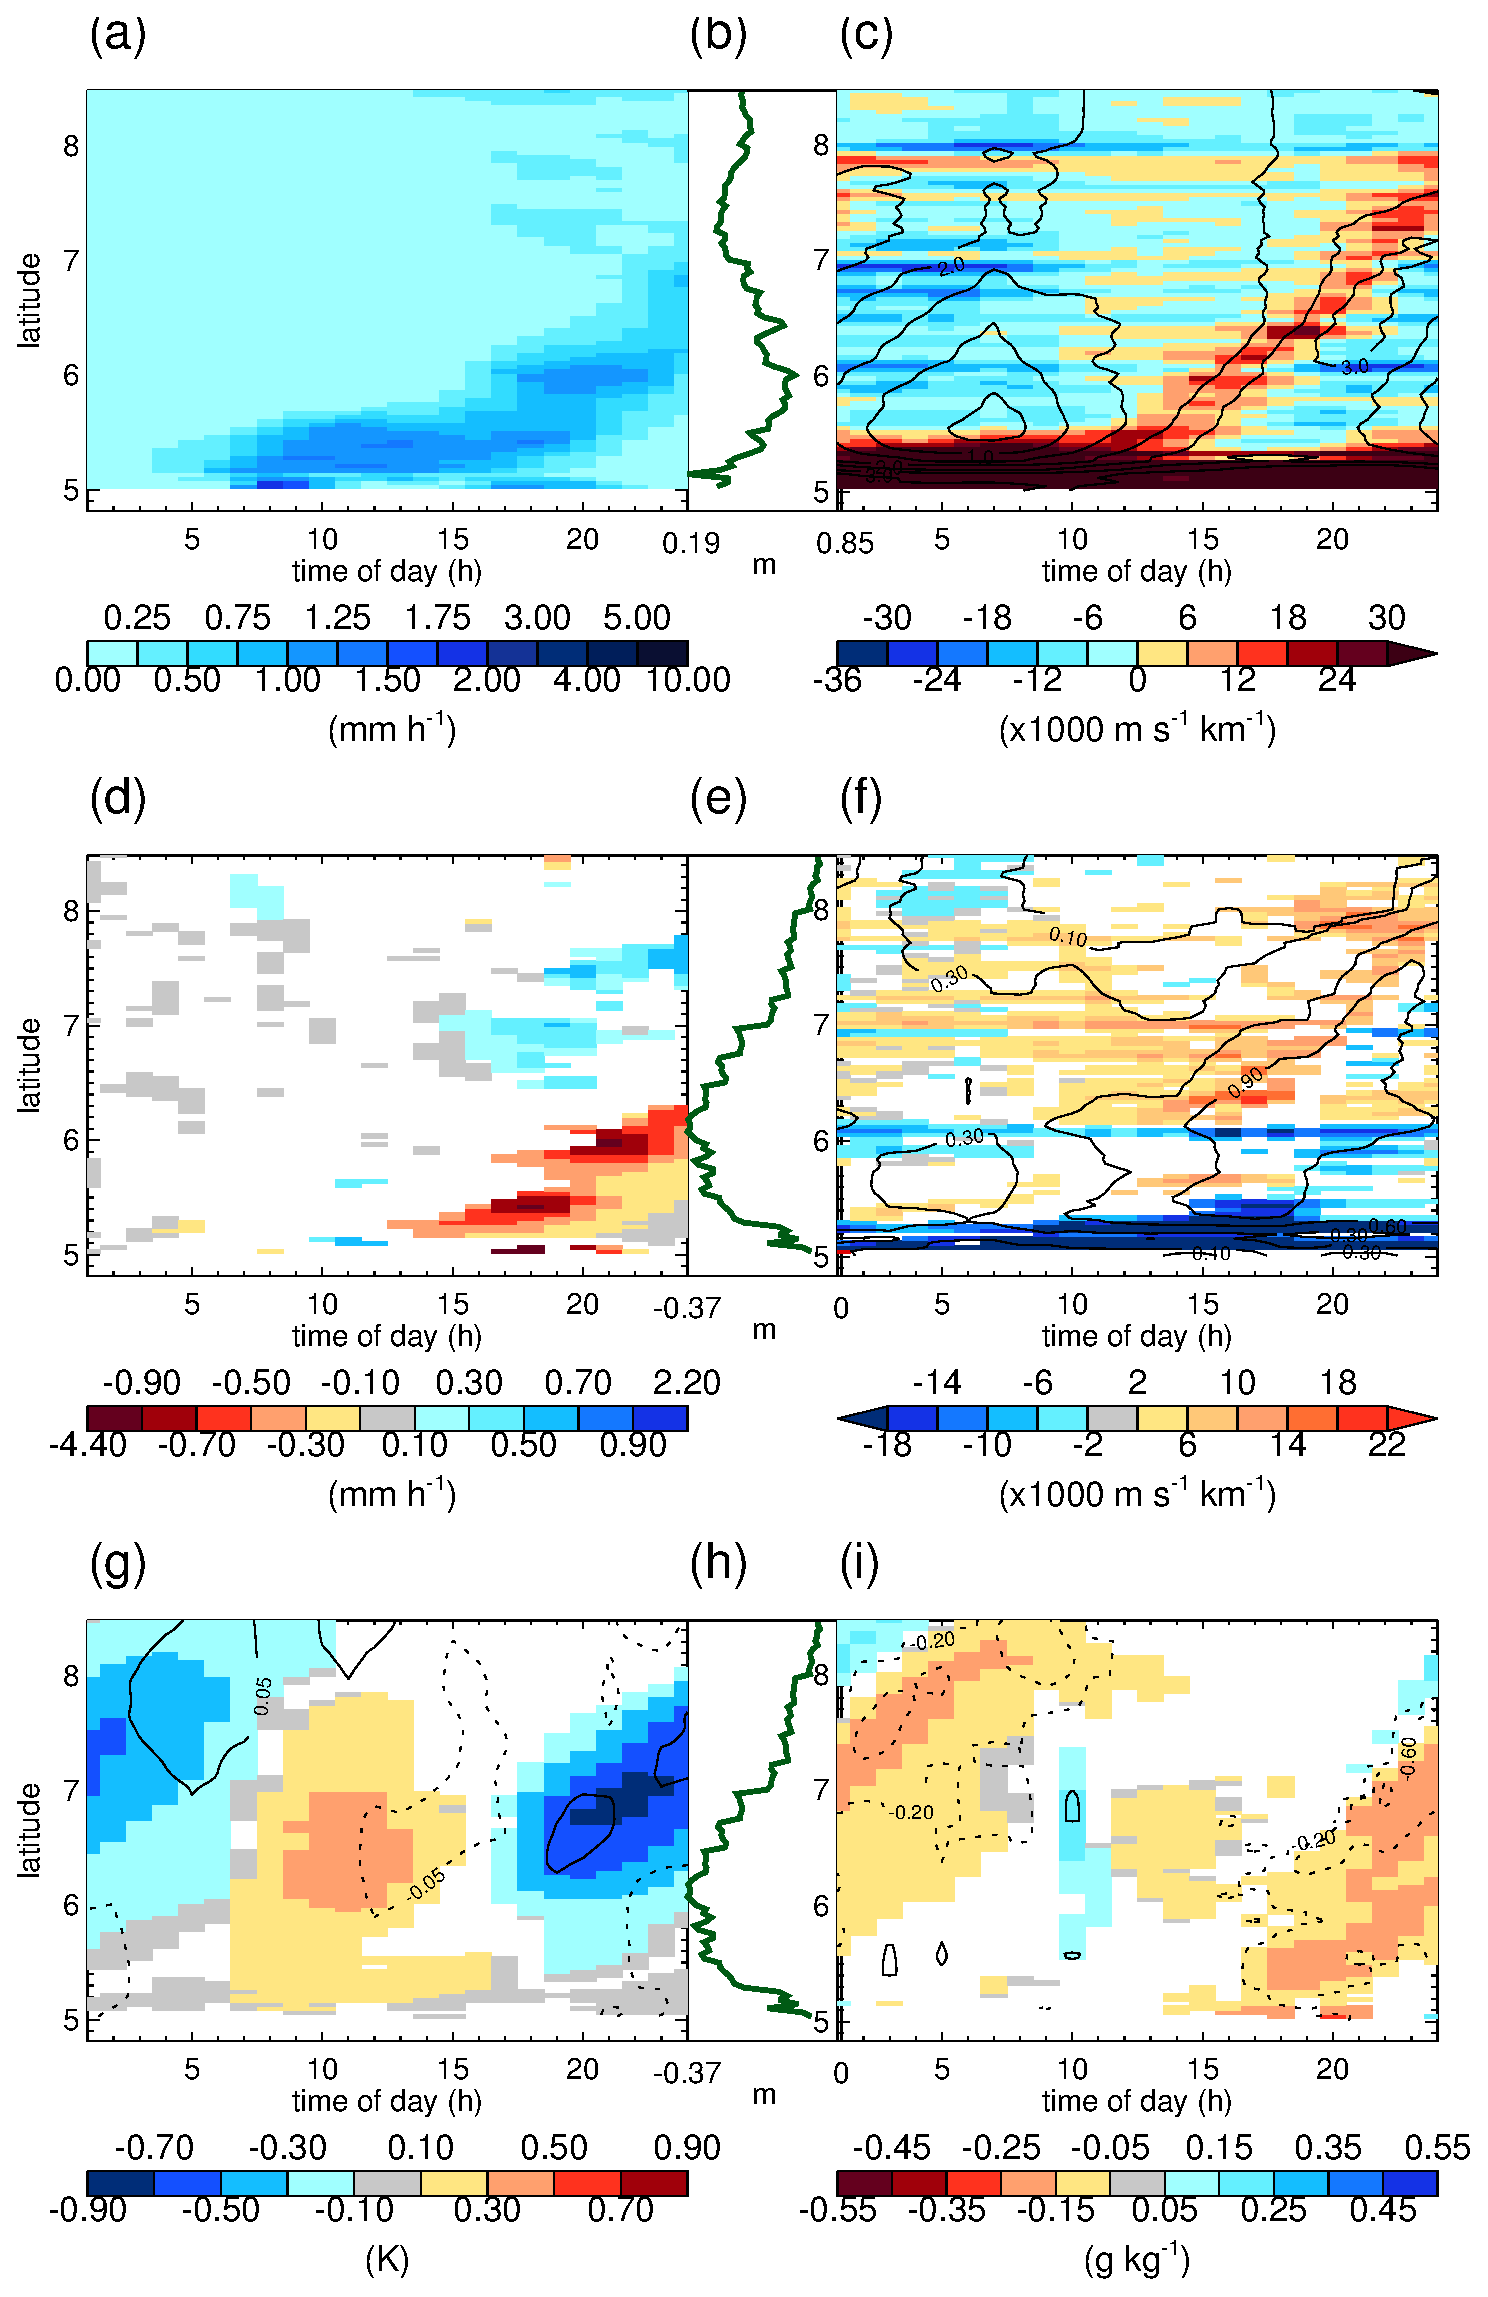
Figure 10As for Fig. 8 but for cross sections 6–3∘ W.
3.6.2 Coastal deforestation
In this region (Côte d'Ivoire, 6–3∘ W), 1950s rainfall (Fig. 10a) is greatest near the coast over much of the day and driven by the sea breeze. The strong 1950s onshore winds and the sea breeze convergence are dominant features (Fig. 10c), causing the coastal rain to move inland to 7∘ N during the evening.
This is an area of near-coastal deforestation (Fig. 10e) where the turbulent flux and daytime temperature changes (Fig. 10g) are smaller than in the previous region. This region shows two distinct sub-regions regarding rainfall responses to deforestation (Fig. 10d), caused by a northward shift in rainfall. The rainfall changes follow the changes in convergence (Fig. 10f); i.e. stronger convergence results in more rainfall. There are only small changes in surface pressure (Fig. 10g), showing that the changes in convergence (mesoscale circulation changes) are mostly due to roughness length changes, i.e. a dynamical rather than thermal response. Latent heat decreases mostly between 13:00–18:00 UTC from 6–7∘ N (not shown), resulting in a decrease in low-level (925 hPa) specific humidity (Fig. 10i), yet this has no evident effect on coincident rainfall. See also Fig. S7 for specific humidity and wind profiles.
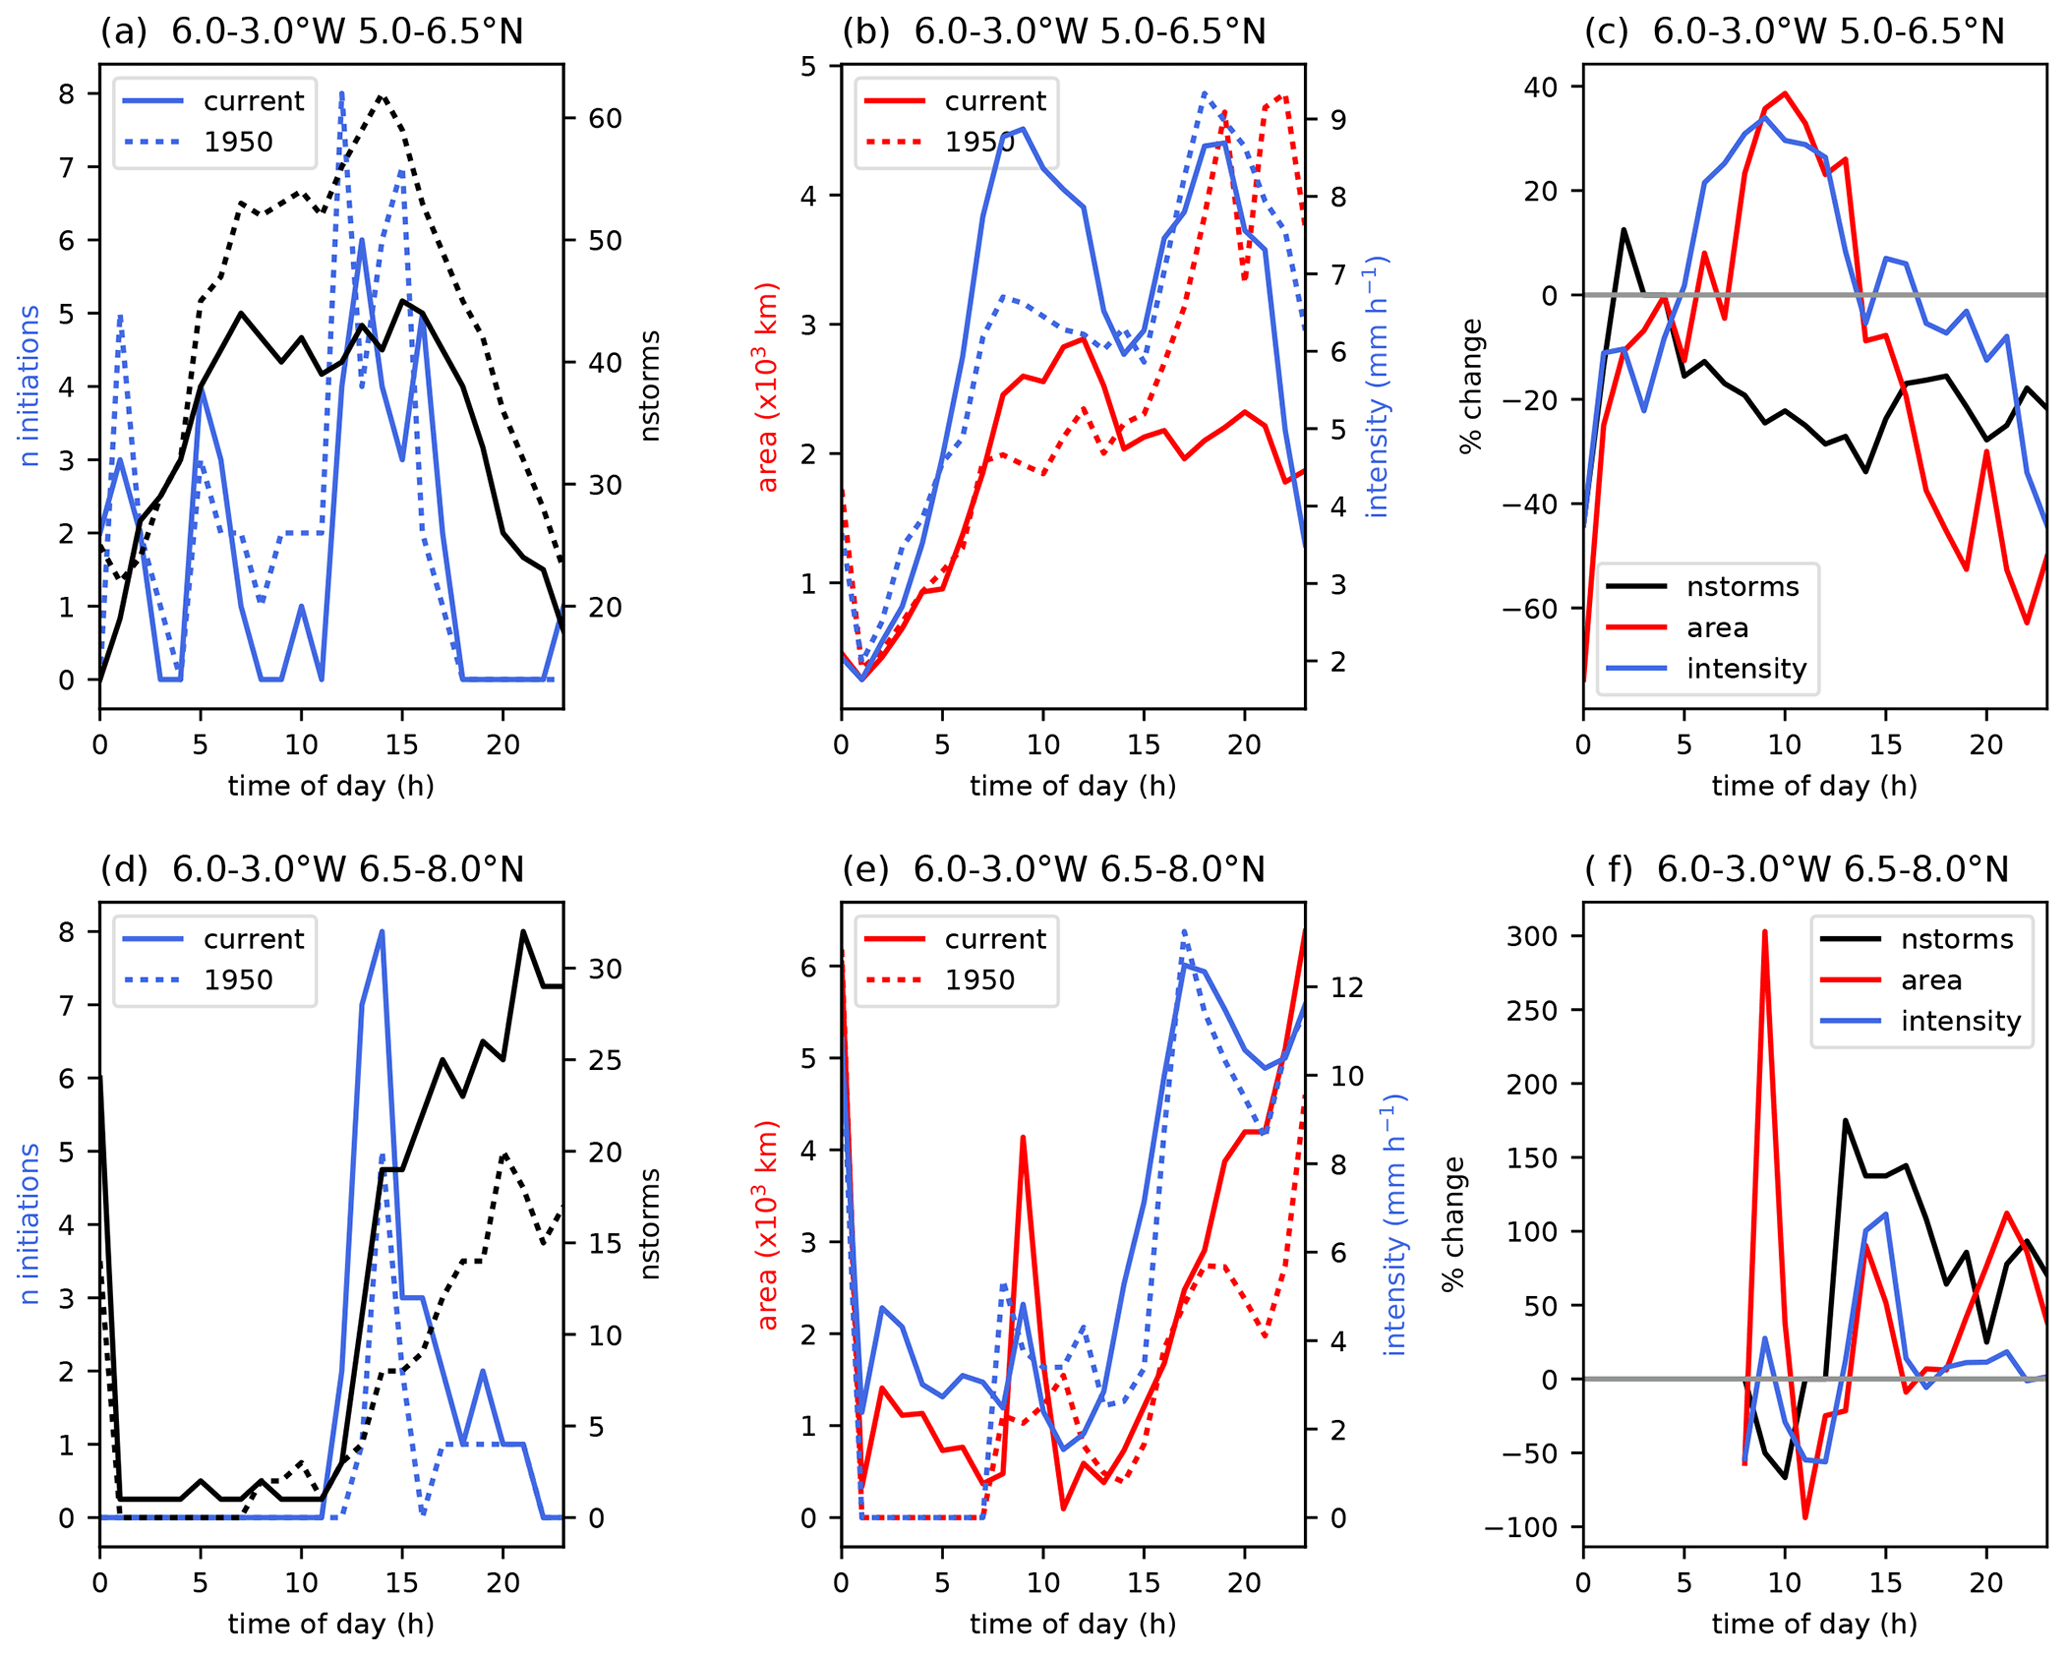
On the other hand, from 5–6.5∘ N there has been a decrease in rainfall between 14:00–00:00 UTC, coincident with a decrease in convergence over the southern part of the deforestation. In this area, we accordingly find a reduction in the number of spontaneous initiations in the early afternoon and a reduction in the number of storms (approx. 20 %) throughout the day (Fig. 11a and c) as well as a reduction in the mean area (approx. 35 %) and intensity (approx. 15 %) of storms in the evening (Fig. 11b and c). The increase in mean area and intensity of approx. 15 % between 08:00–13:00 UTC does not result in increased rain due to the simultaneous reduction in the number of storms.
Looking further north at 6.5–8.0∘ N, we find an increase in rainfall between 15:00–00:00 UTC in the area of the northern edge of deforestation linked to more convergent conditions (Fig. 10f). Low-level specific humidity around 7∘ N increases from approx. 18:00 UTC, with the band of wetter air moving northward during the evening until it reaches 8∘ N at 00:00 UTC (Fig. 10i), trailed by drier more stable (lower Δθ) air. We find more initiations from 12:00–15:00 UTC and more storms (approx. 80 % increase) from 13:00–00:00 UTC (Fig. 11d and f) with larger mean area (approx. 60 % increase) from 17:00–00:00 UTC and an increase in mean rainfall intensity (approx. 20 %) from 17:00–22:00 UTC (Fig. 11e and f), explaining the increase in total rainfall.
In this region, where thermal effects of deforestation are minor, changes in convergence caused by reduced surface roughness drive the sea breeze further inland in the afternoon and evening (see Parker et al., 2017, their Fig. 4.18), suppressing convection in the subsiding air behind the sea breeze front and resulting in a shift in rainfall from 5–6.5 to 6.5–8∘ N.
Table 1Comparison of whole-day mean variables over 16∘ W–16∘ E, 0–15∘ N (deforested land unless specified otherwise), estimated from figures in A08, B16, and C20 if not given as region means.
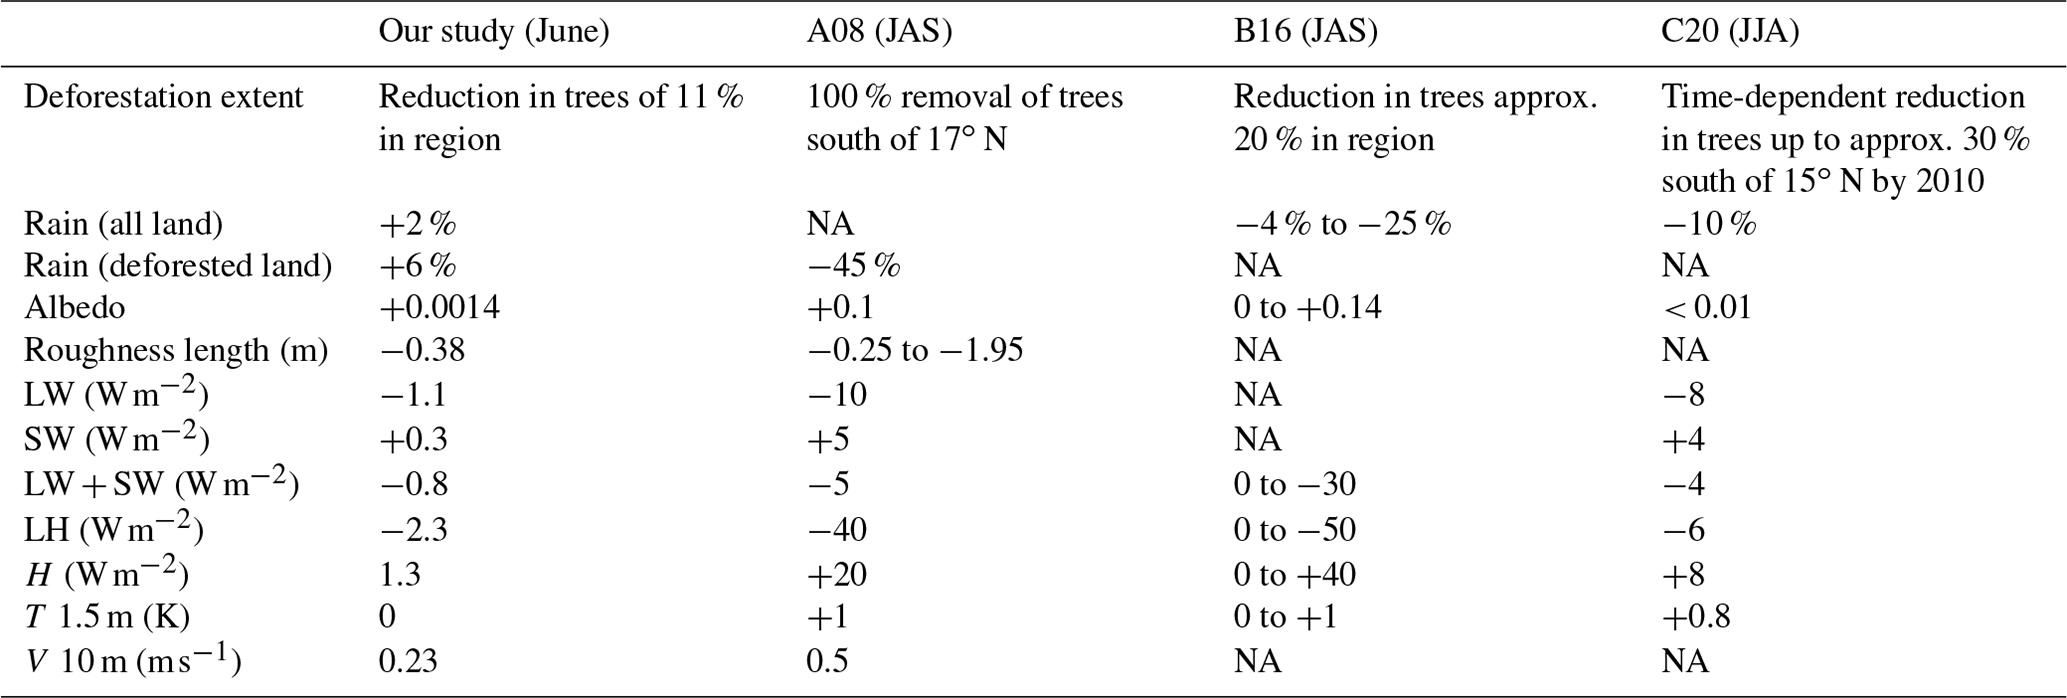
NA means not available (i.e. the variable was not examined in the study).
We now compare our daily mean results over land in the region 16∘ W–16∘ E, 0–15∘ N to three studies which look at the summer season in West Africa with deforestation scenarios of increasing realism, described in Table 1 – Abiodun et al. (2008) (A08), Boone et al. (2016) (B16), and Chilukoti and Xue (2020) (C20). It should be noted that our simulations only ran for 5 d in June, whereas these studies look at multi-year seasonal changes and therefore are not directly comparable. However, a comparison considering the sign of the changes is justifiable. We would expect the magnitude of our changes to be less than that seen in other studies due to the less extreme deforestation. Our results suggest that much of the deforested area now has enhanced rainfall, with an average increase of 6 % over the whole day over deforested pixels. A08 found decreases over the deforested area of 45 %, and B16 and C20 found decreases in rainfall over all land of 4 %–25 %, although in B16 half the models showed the rainfall shifting south.
Our imposed deforestation scenario (approx. 11 % reduction in trees) translates into local albedo increases of up to 0.02, with a mean of 0.0014 and a mean roughness length decrease of 0.38 m. The increases in albedo for some models in B16 are an order of magnitude larger than our albedo increases, although some models had similar albedo changes; in A08 the albedo increased by approx. 0.1 (45 %); in C20 the albedo increase is similar to ours. In A08, roughness length decreased by between 0.25 and 1.95 m (based on disturbed forest or tropical forest changing to short grass; see their Table 1). The reduced roughness over grass compared to trees has a significant effect on the 10 m winds over deforested areas. As generally over West Africa the 10 m winds are south-westerly, this means both 10 m U and 10 m V increase. Over the whole day we find V increased by 0.23 m s−1, a similar magnitude to that seen in A08.
We find the net downward LW radiative flux decreases during the day by 3 W m−2 over the deforested area (due to enhanced surface emission) and net downward SW radiative flux changes were more variable but mostly positive. Our whole-day mean values (LW = −1.1 W m−2, SW = +0.3 W m−2) are the same sign as, albeit an order of magnitude smaller than, A08 and C20. Compared to our simulations, the net downward radiative flux decrease was much greater in some models in B16 due to albedo changes being more dominant in those models than reductions in cloud cover.
We find latent heat flux is generally reduced during the day by 4 W m−2 over deforested areas, as is expected, with whole-day values of −2.3 W m−2. We find sensible heat increases during the day by 5 W m−2 with whole-day values of +1.3 W m−2. These are the same sign albeit somewhat smaller than in A08 and C20 and fall within the large range from different models in B16.
Deforested areas are mostly warmer during the day (up to 1 K, deforested mean 0.2 K) and cooler during the night (down to −0.5 K, deforested mean −0.2 K). Effects are constrained to the lower troposphere (lower than 700 hPa). Temperature changes are usually larger when the extent of the deforestation is larger such as in the west of this region of study. Over the whole day, we found no significant change, whereas A08, B16, and C20 found up to 1 K warming.
Our deforestation scenario is not as extreme in extent or intensity as many previously assessed deforestation scenarios (e.g. A08, B16, C20), and therefore we might not expect the large reductions in rainfall seen previously. A more extreme deforestation scenario may well have a greater effect on atmospheric moisture. However, the changes in a number of atmospheric diagnostics are of the same sign and not dissimilar in magnitude to previous studies, yet in contrast, we find increases in rainfall.
We have assessed the impact of recent deforestation in West Africa on rainfall in early June using an ensemble of 5 d simulations with a CPM. Our deforestation scenario is more realistic and less extreme than previous studies, and we assessed the changes over the diurnal cycle. We also assessed the statistics of MCSs. Whilst our simulations examine only a brief period within the full annual cycle, the analysis draws out key processes driving the rainfall response. Our results show much of the deforested area now has enhanced rainfall (mostly due to more storms but also bigger storms and to a lesser degree more intense storms) between 18:00–06:00 UTC, with an average increase of 8.4 % across all deforested pixels and whole-day increases of 2 % (6 %) over all land (deforested land) up to 15∘ N, unlike previous studies. The changes are more significant during the night than the day, and how the rainfall changes is strongly dependent on both soil moisture status and the proximity to the coast of the deforestation due to sea breeze interactions. We also find that changes are quite localized, and we did not see significant changes in any variable north of 15∘ N. The African easterly jet also did not change position in our model, although this has been found to occur in other studies (B16). However, our simulations only cover a short time period. Had we performed longer simulations allowing large-scale circulation changes to occur, we may have seen shifts in rainfall on top of the changes presented here. However, it is unlikely that the overall rainfall change would have a reversed sign given the relatively small extent of deforestation in our study compared to those studies showing large-scale circulation shifts and the fact that tropical deforestation has a much smaller effect on the Intertropical Convergence Zone than deforestation at higher latitudes (e.g. Devaraju et al., 2015). Our simulations were run with a climatological soil moisture consistent with the vegetation in order to reduce transient changes due to soil moisture not matching the evaporative properties of the underlying vegetation. It is not possible to extrapolate our results to other months as we have shown thermal responses are dependent on soil wetness and location of the 1950s rain, which differ through the seasons. However, the different mechanisms presented here would still apply, albeit producing a different pattern of rainfall change. Future studies in different months and for longer periods of time would thus be beneficial.
For process evaluation, we considered two contrasting deforestation regions in detail. In the first region, where the deforested zone is well inland, we found that soil moisture limitation ensures enhanced sensible heat, which creates thermally driven convergence over the deforested zone. Roughness-length-induced reductions in convergence to the south and increases in convergence in the north of the deforested zone also occur, and rainfall increases locally within the deforested zone. However, in the second region, where wetter soils mean there is little impact of deforestation on boundary layer temperatures, reduced roughness lengths are responsible for changes in rainfall: the deforestation maximum lies approx. 100 km from the coastline, and weaker surface drag allows the sea breeze to penetrate faster and further into the interior. The associated changes in convergence and advection of moist oceanic air effectively reduce rainfall near the coast whilst enhancing it inland. Our results show that deforestation near the coast, where the sea breeze impacts convection, results in very different patterns of rainfall changes compared to deforestation further inland. A similar conclusion was drawn in the observational study by Taylor et al. (2022). Focusing on deforestation within a coastal strip of 50 km, they found enhanced convective activity maximized within that strip, embedded within the sea breeze. The two analyses differ in both the proximity of the deforestation to the coastline and also the likely role of thermal effects. Considering the location in the current study, the deforestation is further inland, which draws sea breeze convection away from the coastal strip. Secondly, whilst the model analysis focuses on a location and time of year when soil moisture effects are less important, the observational analysis draws from a broader range of conditions in space and time, and thermal effects are expected to be more important.
We have shown that changes in low-level winds over deforested areas can cause more convergent conditions into the evening when MCSs are numerous. Although humidity (and conditional instability) does decrease over deforested areas in the day, it recovers in the evening and can increase in some areas due to enhanced advection inland due to increased winds. However, the changes in convergence in our model were found to be the dominant control on rainfall, with little impact from changes in the moisture budget, in line with observed rainfall changes in the region (Taylor et al., 2022), and with observed increases in cloud cover over deforested regions in general in the tropics (Xu et al., 2022). Our model adds strong support to the observationally based link between deforestation and increased rainfall in the coastal zone (Taylor et al., 2022). Our results illuminate the mechanisms responsible and demonstrate that the processes at work differ from region to region according to the precise geographic environment (i.e. distance from coast) and seasonally (according to overall water stress).
In contrast to PMs, CPMs show enhanced rainfall in areas where there is mesoscale convergence (Birch et al., 2014), for example along soil moisture boundaries, in line with observed mechanisms (Taylor et al., 2013), rather than being controlled by the moisture budget. It has also been found that CPMs better capture the rainfall response to sea breeze changes (Finney et al., 2020). PMs simulate the convective peak too early in the day (approx. 13:00 UTC) compared to observations and CPMs. Such models would be more affected by the reduced evaporation caused by deforestation during the early afternoon, as rainfall is strongly controlled by the vertical profile of temperature and moisture, which could explain why previous deforestation studies show a tendency to reductions in rainfall over deforested areas. Therefore, we suggest that the mesoscale convergence produced by deforestation is likely to affect rainfall more than previously found in studies using PMs. It is imperative that further studies using CPMs over extended periods are undertaken to understand whether our findings are representative of all CPMs. We have demonstrated that a CPM can capture the effects of enhanced convergence due to deforestation and in principle could be used to make future projections of changes due to deforestation. However, substantial time was taken initially to improve the land surface model and the surface conditions, and we would not expect such projections yet to be reliable without a comparable effort to ensure that the model setup is good enough (out-of-the-box models have very different representations of land cover and bio-geophysical responses, e.g. Pitman et al., 2009; Boone et al., 2016; Boysen et al., 2020). We therefore suggest that both CPM ensembles of short simulations at different times of the year and ensembles of longer simulations are performed. But beforehand it is essential to consider
-
how well the land surface model being used represents observed behaviour of the different vegetation types in terms of differences in albedo, leaf area index, and ability to access soil moisture and partition surface fluxes accurately under different water stress conditions and
-
how to create the vegetation fraction maps to be used for historical deforestation scenarios.
With sustained effort, further improvements could be made to JULES over the simple modifications we made specifically for this study.
Model output is available at Crook (2021) (https://catalogue.ceda.ac.uk/uuid/db259fd2bad64b6da9af884121a160a6).
The supplement related to this article is available online at: https://doi.org/10.5194/wcd-4-229-2023-supplement.
JC performed the model simulations, analysed the simulation outputs, wrote the paper, and curated the data. CK contributed to reviewing and editing the paper. SF developed the 1950s vegetation map, produced the ancillaries required for the simulations, made the modifications required to JULES, and contributed to writing the paper. CMT and DJP acquired funding, performed project administration, and contributed to reviewing and editing the paper. CMT also had significant input into understanding issues with the standard UM model setup. AB and KK helped in the analysis of the sea breeze impacts in the Côte d'Ivoire region.
The contact author has declared that none of the authors has any competing interests.
Publisher's note: Copernicus Publications remains neutral with regard to jurisdictional claims in published maps and institutional affiliations.
This work used the ARCHER UK National Supercomputing Service (http://www.archer.ac.uk, last access: 14 March 2023) to run the simulations. We thank Willie McGinty (National Centre for Atmospheric Science) for help in setting up the simulations. Douglas J. Parker was supported by a Royal Society Wolfson Research Merit Award (2014–2018). We thank the two anonymous reviewers and Raphael Portmann who completed the review process for their helpful comments in the production of this paper.
This research has been supported by the Natural Environment Research Council (grant nos. NE/M003574/1 and NE/M020126/1).
This paper was edited by Sebastian Schemm and reviewed by Raphael Portmann and two anonymous referees.
Abiodun, B., Pal, J. S., Afiesimama, E., Gutowski, W., and Adedoyin, A.: Simulation of West African monsoon using RegCM3 Part II: impacts of deforestation and desertification, Theor. Appl. Climatol., 93, 245–261, 2008.
Aleman J. C., Jarzyna M. A., and Staver A. C.: Forest extent and deforestation in tropical Africa since 1900, Nature Ecology and Evolution, 2, 26–33, 2018.
Alkama, R. and Cescatti, A.: Biophysical climate impacts of recent changes in global forest cover, Science, 351 6273, 600–604, 2016.
Best, M. J., Pryor, M., Clark, D. B., Rooney, G. G., Essery, R. L. H., Ménard, C. B., Edwards, J. M., Hendry, M. A., Porson, A., Gedney, N., Mercado, L. M., Sitch, S., Blyth, E., Boucher, O., Cox, P. M., Grimmond, C. S. B., and Harding, R. J.: The Joint UK Land Environment Simulator (JULES), model description – Part 1: Energy and water fluxes, Geosci. Model Dev., 4, 677–699, https://doi.org/10.5194/gmd-4-677-2011, 2011.
Birch, C. E., Marsham, J. H., Parker, D. J., and Taylor, C. M.: The scale dependence and structure of convergence fields preceding the initiation of deep convection, Geophys. Res. Lett., 41, 4769–4776, https://doi.org/10.1002/2014GL060493, 2014.
Boone, A. A., Xue, Y., De Sales, F., Comer, R. E., Hagos, S., Mahanama, S., Schiro, K., Song, G., Wang, G., Li, S., and Mechoso, C. R.: The regional impact of Land-Use Land-cover Change (LULCC) over West Africa from an ensemble of global climate models under the auspices of the WAMME2 project, Clim. Dynam., 47, 3547–3573, https://doi.org/10.1007/s00382-016-3252-y, 2016.
Boysen, L. R., Brovkin, V., Pongratz, J., Lawrence, D. M., Lawrence, P., Vuichard, N., Peylin, P., Liddicoat, S., Hajima, T., Zhang, Y., Rocher, M., Delire, C., Séférian, R., Arora, V. K., Nieradzik, L., Anthoni, P., Thiery, W., Laguë, M. M., Lawrence, D., and Lo, M.-H.: Global climate response to idealized deforestation in CMIP6 models, Biogeosciences, 17, 5615–5638, https://doi.org/10.5194/bg-17-5615-2020, 2020.
Brandt M., Rasmussen, K., Peñuelas, J., Tian, F., Schurgers, G., Verger, A., Mertz, O., Palmer, J. R. B., and Fensholt, R.: Human population growth offsets climate-driven increase in woody vegetation in sub-Saharan Africa, Nature Ecology and Evolution, 1, 0081, https://doi.org/10.1038/s41559-017-0081, 2017.
Chagnon, F. J. F. and Bras, R. L.: Contemporary climate change in the Amazon, Geophys. Res. Lett., 32, L13703, https://doi.org/10.1029/2005GL022722, 2005.
Chilukoti, N and Xue, Y.: An assessment of potential climate impact during 1948–2010 using historical land use land cover change maps, Int. J. Climatol., 41, 295–315, https://doi.org/10.1002/joc.6621, 2020.
Crook, J.: VERA: West Africa current vegetation and 1950 vegetation scenario ensemble mean data for June 2014, Centre for Environmental Data Analysis [data set], https://catalogue.ceda.ac.uk/uuid/db259fd2bad64b6da9af884121a160a6 (last access: 14 March 2023), 2021.
Crook, J., Klein, C., Folwell, S., Taylor, C. M., Parker, D. J., Stratton, R., and Stein, T.: Assessment of the representation of West African storm lifecycles in convection-permitting simulations, Earth Space Sci., 6, 818–835, https://doi.org/10.1029/2018EA000491, 2019.
D'Almeida, C., Vörösmarty, C. J., Hurtt, G. C., Marengo, J. A., Dingman, S. L., and Keim, B. D.: The effects of deforestation on the hydrological cycle in Amazonia: a review on scale and resolution, Int. J. Climatol., 27, 633–647, https://doi.org/10.1002/joc.1475, 2007.
Dee, D. P., Uppala, S. M., Simmons, A. J., Berrisford, P., Poli, P., Kobayashi, S., Andrae, U., Balmaseda, M. A., Balsamo, G., Bauer, P., Bechtold, P., Beljaars, A. C. M., van de Berg, L., Bidlot, J., Bormann, N., Delsol, C., Dragani, R., Fuentes, M., Geer, A. J., Haimberger, L., Healy, S. B., Hersbach, H., Hólm, E. V., Isaksen, L., Kållberg, P., Köhler, M., Matricardi, M., McNally, A. P., Monge-Sanz, B. M., Morcrette, J.-J., Park, B.-K., Peubey, C., de Rosnay, P., Tavolato, C., Thépaut, J.-N., and Vitart, F.: The ERA-Interim reanalysis: configuration and performance of the data assimilation system, Q. J. Roy. Meteor. Soc., 137, 553–597, https://doi.org/10.1002/qj.828, 2011.
Devaraju, N., Bala, G., and Modak, A.: Effects of large-scale deforestation on precipitation in the monsoon regions: Remote versus local effects, P. Natl. Acad. Sci. USA, 112, 3257–3262, https://doi.org/10.1073/pnas.1423439112, 2015.
Duveiller, G., Hooker, J., and Cescatti, A.: The mark of vegetation change on Earth's surface energy balance, Nat. Commun., 9, 679, https://doi.org/10.1038/s41467-017-02810-8, 2018.
Duveiller, G., Caporaso, L., Abad-Viñas, R., Perugini, L., Grassi, G., Arneth, A., and Cescatti, A.: Local biophysical effects of land use and land cover change: towards an assessment tool for policy makers, Land Use Policy, 91, https://doi.org/10.1016/j.landusepol.2019.104382, 2020.
Finney, D. L., Marsham, J. H., Rowell, D. P., Kendon, E. J., Tucker, S. O., Stratton, R. A., and Jackson, L. S.: Effects of Explicit Convection on Future Projections of Mesoscale Circulations, Rainfall, and Rainfall Extremes over Eastern Africa, J. Climate, 33, 2701–2718, https://doi.org/10.1175/JCLI-D-19-0328.1, 2020.
Funk, C., Peterson, P., Landsfeld, M., Pedreros, D., Verdin, J., Shukla, S., Husak, G., Rowland, J., Harrison, L., Hoell, A., and Michaelsen, J.: The climate hazards infrared precipitation with stations-a new environmental record for monitoring extremes, Scientific Data, 2, 150066, https://doi.org/10.1038/Sdata.2015.66, 2015.
Garcia-Carreras, L., Parker, D. J., and Marsham, J.: What is the mechanism for the modification of convective cloud distributions by land surface-induced flows?, J. Atmos. Sci., 68, 619–634, 2011.
Gregory, D. and Rowntree, P. R.: A mass-flux convection scheme with representation of cloud ensemble characteristics and stability dependent closure, Mon. Weather Rev., 118, 1483–1506, https://doi.org/10.1175/1520-0493(1990)118<1483:AMFCSW>2.0.CO;2, 1990.
Hartley, A. J., Parker, D. J., Garcia-Carreras, L., Webster, S.: Simulation of vegetation feedbacks on local and regional scale precipitation in West Africa, Agr. Forest Meteorol., 222, 59–70, https://doi.org/10.1016/j.agrformet.2016.03.001, 2016.
Hurtt, G. C., Chini, L. P., Frolking, S., Betts, R. A., Feddema, J., Fischer, G., and Wang, Y. P.: Harmonization of land-use scenarios for the period 1500-2100: 600 years of global gridded annual land-use transitions, wood harvest, and resulting secondary lands, Climatic Change, 109, 117–161, 2011.
Khanna, J., Medivgy, D., Fueglistaler, S., and Walko, R.: Regional dry-season climate changes due to three decades of Amazonian deforestation, Nat. Clim. Change, 7, 200–204, https://doi.org/10.1038/nclimate3226, 2017.
Lawrence, D. and Vandecar, K.: Effects of tropical deforestation on climate and agriculture, Nat. Clim. Change, 5, 27–36, https://doi.org/10.1038/nclimate2430, 2014.
Maranan, M. Fink, A. H., and Knippertz, P.: Rainfall Types over Southern West Africa: Objective Identification, Climatology and Synoptic Environment, Q. J. Roy. Meteor. Soc., 144, 1628–1648, https://doi.org/10.1002/qj.3345, 2018.
Medvigy, D., Walko, R. L., and Avissar, R.: Effects of Deforestation on Spatiotemporal Distributions of Precipitation in South America, J. Climate, 24, 2147–2163, https://doi.org/10.1175/2010JCLI3882.1, 2011.
Parker, D. J., Kassimou, A., Orji, B. N., Osika, D. P., Hamza, I., Diop-Kane, M., Fink, A., Galvin, J., Guichard, F., Lamptey, B. L., Hamidou, H., van der Linden, R., Redl, R., and Lebel, T.: Local Weather, in: Meteorology of Tropical West Africa: The Forecasters' Handbook, edited by: Parker, D. J. and Diop-Kane, M., John Wiley & Sons Ltd, Chichester, UK, 130–174, https://doi.org/10.1002/9781118391297.ch4, 2017.
Peng, S., Piaoa, S., Zenga, Z., Ciaisc, P., Zhoud, L., Lie, L., Mynenif, R., Yina, Y., and Zengg, H.: Afforestation in China cools local land surface temperature, P. Natl. Acad. Sci. USA, 111, 2915–2919, https://doi.org/10.1073/pnas.1315126111, 2014.
Perugini, L., Caporaso, L, Marconi, S., Cescatti, A., Quesada, B., de Noblet-Ducoudré, N,. House, J., and Arneth, A.: Biophysical effects on temperature and precipitation due to land cover change, Environ. Res. Lett., 12, 053002, https://doi.org/10.1088/1748-9326/aa6b3f, 2017.
Pitman, A. J., de Noblet-Ducoudré, N., Cruz, F. T., Davin, E. L., Bonan, G. B., Brovkin, V., Claussen, M., Delire, C., Ganzeveld, L., Gayler, V., van den Hurk, B. J. J. M., Lawrence, P. J., van der Molen, M. K., Müller, C., Reick, C. H., Seneviratne, S. I., Strengers, B. J., and Voldoire, A.: Uncertainties in climate responses to past land cover change: First results from the LUCID intercomparison study, Geophys. Res. Lett., 36, L14814, https://doi.org/10.1029/2009GL039076, 2009.
Poulter, B., MacBean, N., Hartley, A., Khlystova, I., Arino, O., Betts, R., Bontemps, S., Boettcher, M., Brockmann, C., Defourny, P., Hagemann, S., Herold, M., Kirches, G., Lamarche, C., Lederer, D., Ottlé, C., Peters, M., and Peylin, P.: Plant functional type classification for earth system models: results from the European Space Agency's Land Cover Climate Change Initiative, Geosci. Model Dev., 8, 2315–2328, https://doi.org/10.5194/gmd-8-2315-2015, 2015.
Prein, A. F., Foss, G., Ferrone, A., Ban, N., Goergen, K., Keller, M., Tölle, M., Gutjahr, O., Feser, F., Brisson, E., Kollet, S., Schmidli, J., van Lipzig, N. P. M., and Leung, R.: A review on regional convection-permitting climate modeling: Demonstrations, prospects, and challenges, Rev. Geophys., 53, 323–361, https://doi.org/10.1002/2014RG000475, 2015.
Semazzi, F. H. M. and Song, Y.: A GCM study of climate change induced by deforestation in Africa, Clim. Res., 17, 169–182, 2001.
Semeena, V. S., Taylor, C. M., Folwell, S. S., and Hartley, A.: Global gridded monthly mean Leaf Area Index (LAI) for five Plant Functional Types (PFTs) derived from the Global LAnd Surface Satellite (GLASS) products for the period 2000-2014, NERC Environmental Information Data Centre, https://doi.org/10.5285/6d07d60a-4cb9-44e4-be39-89ea40365236, 2021.
Silvério, D., Brando, P., Macedo, M., Beck, P., Bustamante, M., and Coe, M.: Agricultural expansion dominates climate changes in southeastern Amazonia: the overlooked non-GHG forcing, Environ. Res. Lett., 10, 104015, https://doi.org/10.1088/1748-9326/10/10/104015, 2015.
Souza, E. P., Renno, N. O., and Silva Dias, M. A. F.: Convective circulations induced by surface heterogeneities, J. Atmos. Sci., 57, 2915–2922, 2000.
Spracklen, D. V., Baker, J. C. A., Garcia-Carreras, L., and Marsham, J. H.: The Effects of Tropical Vegetation On Rainfall, Annu. Rev. Env. Resour., 43, 193–218, https://doi.org/10.1146/annurev-environ-102017-030136, 2018.
Taylor, C. M., Parker, D. J., Lloyd, C. R., and Thorncroft, C. D.: Observations of synoptic-scale land surface variability and its coupling with the atmosphere, Q. J. Roy. Meteor. Soc., 131, 913–937, 2005.
Taylor, C. M., Birch, C. E., Parker, D. J., Dixon, N., Guichard, F., Nikulin, G., and Lister, G. M. S.: Modeling soil moisture-precipitation feedback in the Sahel: Importance of spatial scale versus convective parameterization, Geophys. Res. Lett., 40, 6213–6218, https://doi.org/10.1002/2013GL058511, 2013.
Taylor, C. M., Klein, C., Parker, D. J., Gerard, F., Semeena, V. S., Barton, E. J., and Harris, B. L.: “Late-stage” deforestation enhances storm trends in coastal West Africa, P. Natl. Acad. Sci. USA, 119, e2109285119, https://doi.org/10.1073/pnas.2109285119, 2022.
UNEP-WCMC and IUCN: Protected Planet: The World Database on Protected Areas (WDPA)/OECM Database [On-line], https://www.protectedplanet.net (last access: October 2014), UNEP-WCMC and IUCN, Cambridge, UK, 2014.
Vanden Broucke, S. and Van Lipzig, N.: Do convection-permitting models improve the representation of the impact of LUC?, Clim. Dynam., 49, 2749–2763, https://doi.org/10.1007/s00382-016-3489-5, 2017.
Van den Hoof, C., Vidale, P. L., Verhoef, A., and Vincke, C.: Improved evaporative flux partitioning and carbon flux in the land surface model JULES: Impact on the simulation of land surface processes in temperate Europe, Agr. Forest Meteorol., 181, 108-124, 2013.
Wang, G., Eltahir, E. A. B., Foley, J. A., Pollard, D., and Levis, S.: Decadal variability of rainfall in the Sahel: results from the coupled GENESIS-IBIS atmosphere-biosphere model, Clim. Dynam., 22, 625–637, https://doi.org/10.1007/s00382-004-0411-3, 2004.
Werth, D. and Avissar, R.: The local and global effects of African deforestation, Geophys. Res. Lett., 32, L12704, https://doi.org/10.1029/2005GL022969, 2005.
Wilks, D. S.: “The Stippling Shows Statistically Significant Grid Points” How Research Results are Routinely Overstated and Overinterpreted and What to Do about It, B. Am. Meteorol. Soc., 97, 2263–2273, https://doi.org/10.1175/BAMS-D-15-00267.1, 2016.
Xiao, Z. Q., Liang, S. L., Wang, J. D., Xiang, Y., Zhao, X., and Song, J. L.: Long-Time-Series Global Land Surface Satellite Leaf Area Index Product Derived From MODIS and AVHRR Surface Reflectance, IEEE T. Geosci. Remote, 54, 5301–5318, 2016.
Xu, R., Li, Y., Teuling, A. J., Zhao, L., Spracklen, D. V., Garcia-Carreras, L., Meier, R., Chen, L., Zheng, Y., Lin, H., and Fu, B.: Contrasting impacts of forests on cloud cover based on satellite observations, Nat. Commun., 13, 670, https://doi.org/10.1038/s41467-022-28161-7, 2022.