the Creative Commons Attribution 4.0 License.
the Creative Commons Attribution 4.0 License.
 | 06 Sep 2023
Classification of large-scale environments that drive the formation of mesoscale convective systems over southern West Africa
Francis Nkrumah
Cornelia Klein
Kwesi Akumenyi Quagraine
Rebecca Berkoh-Oforiwaa
Nana Ama Browne Klutse
Patrick Essien
Gandomè Mayeul Leger Davy Quenum
Hubert Azoda Koffi
Mesoscale convective systems (MCSs) are frequently observed over southern West Africa (SWA) throughout most of the year. These MCS events are the dominant rain-bearing systems, contributing over 50 % of annual rainfall over SWA. However, it has not yet been identified what variations in typical large-scale environments of the seasonal cycle of the West African monsoon may favour MCS occurrence in this region. Here, nine distinct synoptic states are identified and are further associated with being a synoptic-circulation type of either a dry, transition, or monsoon season using self-organizing maps (SOMs) with inputs from reanalysis data. We identified a pronounced annual cycle of MCS numbers with frequency peaks in April and October that can be associated with the start of rainfall during the major rainy season and the maximum rainfall for the minor rainy season across SWA, respectively. Comparing daily MCS frequencies, MCSs are most likely to develop during transition conditions featuring a northward-displaced moisture anomaly (2.8 MCSs per day), which can be linked to strengthened low-level westerlies. Considering that these transition conditions occur predominantly during the pre- and post-monsoon period, these patterns may in some cases be representative of monsoon onset conditions or a delayed monsoon retreat. On the other hand, under monsoon conditions, we observe weakened low-level south-westerlies during MCS days, which reduce moisture content over the Sahel but introduce more moisture over the coast. Finally, we find a majority of MCS-day synoptic states exhibiting positive zonal wind shear anomalies. Seasons with the strongest zonal wind shear anomalies are associated with the strongest low-level temperature anomalies to the north of SWA, highlighting that a warmer Sahel can promote MCS-favourable conditions in SWA. Overall, the SOM-identified synoptic states converge towards high-moisture and high-shear conditions on MCS days in SWA, where the frequency at which these conditions occur depends on the synoptic state.
- Article
(11484 KB) - Full-text XML
-
Supplement
(2850 KB) - BibTeX
- EndNote


The region of West Africa is subject to variability in rainfall on both spatial and temporal scales. Fundamentally, the rainfall pattern in West Africa is modulated by the annual change in the position of the intertropical convergence zone (ITCZ) and the West African monsoon (WAM). Due to endemic poverty, lack of infrastructure and technology, rapid population increase, and significant fluctuation in the WAM, West Africa has been deemed one of the world's regions most susceptible to climate change (IPCC, 2014). The climate of southern West Africa (SWA) can be categorized into four seasonal stages: a dry season from December to February, two wet seasons lasting from April to June and September to November, and the so-called little dry season in August (e.g. Thorncroft et al., 2011). Between March and June, when low-level winds are more westerly and the intertropical convergence zone (ITCZ) starts to move northward, precipitable water peaks over SWA (Klein et al., 2021). The ITCZ retreats southward in September, creating the second rainy season, followed by a dry season from November to January.
One major atmospheric disturbance that contributes to the WAM is the presence of mesoscale convective systems (MCSs), which supply around 30 %–80 % of the total rainfall during the WAM (Klein et al., 2018). MCSs are organized thunderstorm clusters, often defined to have a minimum horizontal extent of the precipitating area of 100 km in at least one direction (Guo et al., 2022; Chen et al., 2022; Houze, 2004). Maranan et al. (2018) note that diverse MCS sub-groups such as squall or disturbance lines, structured convective systems, and mesoscale convective complexes impact the hydro-climate of West Africa. In both the tropics and mid-latitudes, an MCS also contributes significantly to rainfall extremes, rendering them a substantial contributor to the hydrologic cycle (Feng et al., 2021; Li et al., 2020). More studies have been motivated in recent decades by evaluating drivers that affect rainfall variability and intensity associated with MCSs (Baidu et al., 2022; Augustin et al., 2023). MCSs, for instance, supply essential precipitation and, as a result, supply water to agriculturally productive regions in the tropics, particularly in semi-arid regions such as the Sahel (Nesbitt et al., 2006).
However, relative to our understanding of MCS drivers in the Sahel, SWA has received less attention. The connections of MCSs to larger-scale atmospheric motion and states are both important and not fully understood for the southern region; hence, a better understanding of large-scale MCS drivers is important for improving precipitation prediction over SWA. Earlier research has suggested an increasing role of other types of less-organized rainfall in place of MCSs over the Guinea coast (e.g. Acheampong, 1982; Fink et al., 2006; Kamara, 1986; Omotosho, 1985), with MCS contribution to annual rainfall decreasing from 71 % in the Soudanian to 56 % in the coastal zone (Maranan et al., 2018), emphasizing MCS importance across the SWA region. Maranan et al. (2018) also concluded that precipitable water and convective available potential energy (CAPE) determine where MCSs may occur in SWA, while zonal wind shear is a stronger predictor for distinguishing between small scattered convection and MCS-type development. Indeed, zonal wind shear intensification was found to be a major driver of increasing frequencies of the most intense Sahelian MCSs over the last 3 decades (Taylor et al., 2017), a mechanism that was similarly found to play a role in early-season MCS intensification in SWA (Klein et al., 2021). Zonal wind shear, which is thought to modulate the storm-available supply of moist buoyant air, is also seen to be very critical to the organization of convective systems (e.g. Alfaro, 2017; Mohr and Thorncroft, 2006). Accordingly, propagating storms with longer-lasting organized precipitation systems were consistently found to be associated with strong vertical wind shear and higher values of CAPE in the Sahel (Hodges and Thorncroft, 1997; Laing et al., 2008; Mohr and Thorncroft, 2006).
Previous studies address the large-scale settings for WAM-related rainfall throughout the seasons (Sultan and Janicot, 2003), with less attention given to the importance of large-scale WAM modes and their effect on regional MCS frequencies in SWA. The role of regional MCS-centred environments in the initiation and development of MCSs in West Africa has been well studied (e.g. Klein et al., 2021; Vizy and Cook, 2018; Schrage et al., 2006; Maranan et al., 2018). Vizy and Cook (2018) observed that the extension of vertical mixing to the level of free convection, as a result of surface heating, tends to initiate MCSs in an environment where the mid-tropospheric African easterly wave disturbance is located in the east. The vertical wind shear is enhanced as a result of the synoptic disturbance. Klein et al. (2021) suggested that heavy rainfall, due to cold MCSs during both dry and rainy seasons, occurs in an environment with stronger vertical wind shear, increased low-level humidity, and drier mid-levels. Unlike vertical wind shear, Maranan et al. (2018) suggested that thermodynamic conditions such as CAPE and convective inhibition (CIN) are of lesser importance for the horizontal growth of convective systems, although they indicate the potential of the initial vertical development of convective systems. Janiga and Thorncroft (2016) also suggested that CAPE, vertical wind shear, and column relative humidity are the decisive large-scale environmental parameters that control the characteristics of convective systems. Based on radar and sounding observations aligned around 15∘ N, Guy et al. (2011) analysed MCSs and their respective environmental conditions over three different regimes of West Africa (maritime, coastal, and continental). They concluded that MCSs tend to occur ahead of the African easterly wave (AEW) trough during the maritime and the continental regime, while they are mostly found behind the trough in the coastal regime.
It is not clear to what extent different large-scale patterns of atmospheric drivers such as temperature, wind, humidity, and CAPE at different stages of the WAM drive the formation of MCSs over SWA. The SWA region differs from its Sahelian counterpart in its closer proximity to the ocean and a distinct bimodal rainfall seasonality. The WAM stages can broadly be classified into a dry season when north-easterly Harmattan winds prevail over most of West Africa during December–February when rainfall mostly occurs off the southern coast of the continent (Thorncroft et al., 2011) and the monsoon season from July–September, which is initiated by a striking jump of the monsoonal rainfall band from coastal regions to the Sahel (Hagos and Cook, 2007). The monsoon months thus represent the unimodal Sahelian rainfall season. In SWA, however, the majority of rainfall occurs between the dry months and monsoon months, when the monsoon rainband first passes northward over southern regions from March to June, and subsequently moves southward again when the monsoon retreats in October (e.g. Maranan et al., 2018; Klein et al., 2021). Here, we define these months when SWA receives most of its rainfall as a transition season.
From this SWA perspective, our study systematically classifies the different large-scale patterns across the WAM region and how they are associated with MCSs over SWA. For this purpose, a classification using a self-organizing map (SOM; Kohonen, 2001) analysis was carried out to characterize large-scale WAM patterns during the 1981–2020 period, which we subsequently grouped into days with MCS occurrence over SWA. The SOM is a clustering technique that is topologically sensitive and uses an unsupervised training method to cluster the training data (Lennard and Hegerl, 2014; Quagraine et al., 2019). This methodology thus allows us to identify favourable types of large-scale environments driving the formation of MCSs within different WAM stages.
The paper is organized as follows: Sect. 2 details the study area and data sources and how they were processed. In Sect. 3, the SOM methodology and other needed statistics used to investigate the relationship between large-scale environment patterns and particular MCSs are presented. Section 4 discusses the main results, which include the common features and different types of large-scale patterns associated with MCSs. Section 5 provides the summarized conclusions of the study.
ERA5 reanalysis data and MCS data
The ECMWF fifth-generation atmospheric reanalysis (Hersbach et al., 2020), ERA5, was used as the main data source in this work. The dataset is generated using 41r2 of the Integrated Forecasting System (IFS) model, based on a four-dimensional variational data assimilation scheme, and takes advantage of 137 vertical model levels and a horizontal resolution of 0.28125∘ (31 km). The data provide hourly estimates of model integration. In this study, hourly zonal and meridional winds (650 and 925 hPa), specific humidity (925 hPa), temperature (925 hPa), and convective available potential energy (CAPE) in ERA5 during 1981–2020 were used to explore suitable large-scale environments for the development of MCSs in SWA (5–9∘ N, 10∘ W–10∘ E). The zonal and meridional winds at 925 hPa are used to understand the penetration of monsoon flow inland. The zonal wind difference between 925 and 650 hPa is used as a zonal wind shear change indicator, while the temperature at 925 hPa is used to visualize Saharan heat low (SHL) differences. Due to the main direction in which MCSs propagate (east to west), enhanced easterly zonal wind shear is presented as a positive anomaly, as it is positively related to storm development. Specific humidity (q) at 925 hPa was used to explore whether CAPE changes are controlled by low-level q. We consider also the total column water vapour (TCWV) due to its ability to represent the total gaseous water in the vertical column of the atmosphere, which is influenced by the evolution of the humidity field. The Meteosat Second Generation (MSG) cloud-top temperature data, which are available every 15 min from the EUMETSAT archives online (https://navigator.eumetsat.int/product/EO:EUM:DAT:MSG:HRSEVIRI, last access: 25 August 2021), were used in this study. Data from 12 years of MCS snapshots (2004–2015) detected from Meteosat Second Generation 10.8 µm band brightness temperatures (Schmetz et al., 2002; EUMETSAT, 2021) are used to define MCS days in this study. Following Klein et al. (2021), an MCS is defined here as a −50 ∘C contiguous cloud area larger than 5000 km2. We consider the MCS images every half hour, for which they are matched up with the half-hourly Integrated Multi-satellitE Retrievals for GPM (Global Precipitation Measurement) (IMERG; Huffman et al., 2019) dataset, using the merged microwave–infrared (“precipitationCal”) rainfall product. An “MCS day” is then defined as a day with at least 1 h containing five simultaneously existing MCSs between 16:00 and 19:00 UTC with maximum rainfall > 5 mm within the SWA domain. Here, only land-based MCSs are considered because MCSs over land are fundamentally more intense and deeper than their counterparts over the ocean (Mohr and Zipser, 1996).
3.1 Self-organizing map (SOM) analysis
The study uses the self-organizing map (SOM; Kohonen, 1982, 2001) from SOM_PAK 3.1 software. The technique is used to identify archetype synoptic-circulation patterns over the southern West Africa region by training a nine-node SOM with ERA5 daily mean 925 hPa geopotential height fields to produce nine characteristic circulation patterns for the period 1981 to 2020. The geopotential height circulation pattern is used here mainly based on its physically realistic output spanning a range of circulation features found in the atmosphere (Hewitson and Crane, 2002) and its ability to detect the West African heat low (WAHL), which is a key element of the West African monsoon system (Lavaysse et al., 2009; Biasutti et al., 2009). The SOM is mostly the preferred choice over other clustering methods such as principal component analysis (PCA) or k-means clustering because the data are not discretized and orthogonality is not forced or does not require subjective rotations to produce interpretable patterns. The main advantage of the SOM technique is its ability to deal with non-linear data (such as the continuum of atmospheric conditions) and can easily be visualized and interpreted (Reusch et al., 2005; Lennard and Hegerl, 2015). The steps within the technique can be broadly grouped into two stages, namely the training stage and the mapping stage. Earlier studies (e.g. Hewitson and Crane, 2002; Kim and Seo, 2016; Lee, 2017; Rousi et al., 2015; Sheridan and Lee, 2012) have successfully used this technique in synoptic climatology to effectively preserve relationships between weather states while presenting outputs that are readily understood and can be easily visualized as an array of classified patterns. These classified patterns help in interpreting relationships between large-scale regional circulation patterns and local weather expressions and rainfall extremes (Hewitson and Crane, 1996; Cassano et al., 2015; Wolski et al., 2018). In this study, the SOM is randomly initialized, allowing for hidden patterns and structures in the geopotential height at 925 hPa to be discovered, while the algorithm iteratively updates the weights of the nodes to better represent the data. The strength of initializing the SOM this way lies also in its robustness to noise and outliers as a result of the algorithm applying a competitive learning structure to the data, which then allows for the formation of distinct clusters. The SOM_PAK algorithm allows the SOM process to minimize quantization and topological errors at the mapping stage when choosing the best SOM as outlined in Lennard and Hegerl (2015). However, there is a trade-off when choosing the size of the SOM, as this is dependent on the need to generalize circulation states for analysis or the need to capture predominant spatial characteristics that affect the local climate. The choice of how many SOM nodes is a trade-off between distinctiveness and robustness. Based on SOM_PAK, we tested node sizes of 2×3, 3×3, and 3×4, using the quantization error (QE) as an indicator of the quality and robustness of the respective node size. We find a minimized QE for 3×3 (cf. Fig. S1 in the Supplement), which, from visual inspection, also shows a larger number of distinct circulation features than 2×3 while producing fewer redundancies than 3×4. Thus, all the following analyses are based on the 3×3 node matrix.
3.2 Large-scale WAM patterns on southern West Africa MCS days
Based on the nine different large-scale node patterns, we explore within-node large-scale conditions that characterize MCS days in SWA. For examination of environmental conditions suitable for SWA MCS activity, large-scale conditions were taken from hourly ERA5 reanalysis data sampled at 12:00 UTC, when the daily convective activity is more representative of pre-convective atmospheric conditions (Klein et al., 2021). Pre-convective conditions are considered in the study to reduce the effects of feedback from the MCSs on environmental conditions (Song et al., 2019). Composites of ERA5 large-scale environmental variables (temperature, wind, specific humidity, and CAPE) are created for all node days and for MCS days within each SOM node. Finally, the anomaly in large-scale patterns between MCS days and node mean conditions is computed to determine MCS-favourable adjustments in large-scale patterns within each node. A two-sided Student's t test is used to determine significant differences between node climatologies and MCS-day sub-samples.
In addition to large-scale condition composites, we also sample pre-convective (12:00 UTC) local atmospheric conditions (ERA5) for each 18:00 UTC MCS at the location of minimum cloud-top temperature. We only consider 18:00 UTC MCSs for local condition sampling to avoid oversampling similar atmospheric states from several MCS time steps. These conditions are compared to the node climatology conditions at the same locations, allowing us to explore the difference in node climatology versus MCS-day conditions at the specific locations where MCSs occurred on respective days. Here we only focus on the afternoon peak of convection when it is triggered and is in early stages of organization. It should be noted that driver importance may shift for nocturnal MCSs in later hours, when CAPE is reduced over night and shear may increase further in importance for MCS maintenance (Vizy and Cook, 2018).
4.1 Node seasonality and mean conditions
A nine-node SOM (Fig. 1) with distinct synoptic states was identified, with the nodes hereafter being referred to as nodes 1 to 9. Considering the SOM node frequency distributions in Fig. 1, it is noticeable that the nodes separate different stages of the monsoon circulation seasonality, although certain nodes evidently cover a wider range of months that cannot be represented by the typical monthly grouping of the seasonal cycle (e.g. 2, 3, 5, 8). Circulation patterns in nodes 1, 4, and 7 can be attributed to cases primarily observed in the first 3 months (January, February, and March) and the last 2 months (November and December), hence a pattern most representative of the dry-season months. On the other hand, nodes 2, 5, and 8 depict an environment that is prominent during the pre-monsoon and the post-monsoon periods, with node 2 presenting a clearer seasonal exclusivity during the pre-monsoon period, while nodes 5 and 8 show frequent occurrences during the post-monsoon period. These nodes (nodes 2, 5, and 8) are hence in the following referred to as transition-season nodes, a period that connects the dry and monsoon season. The right-hand side of SOM nodes 3, 6, and 9 represents patterns that cover monsoon-season months but can similarly feature high frequencies outside of the monsoon season (e.g. node 3 with the highest frequency in May).
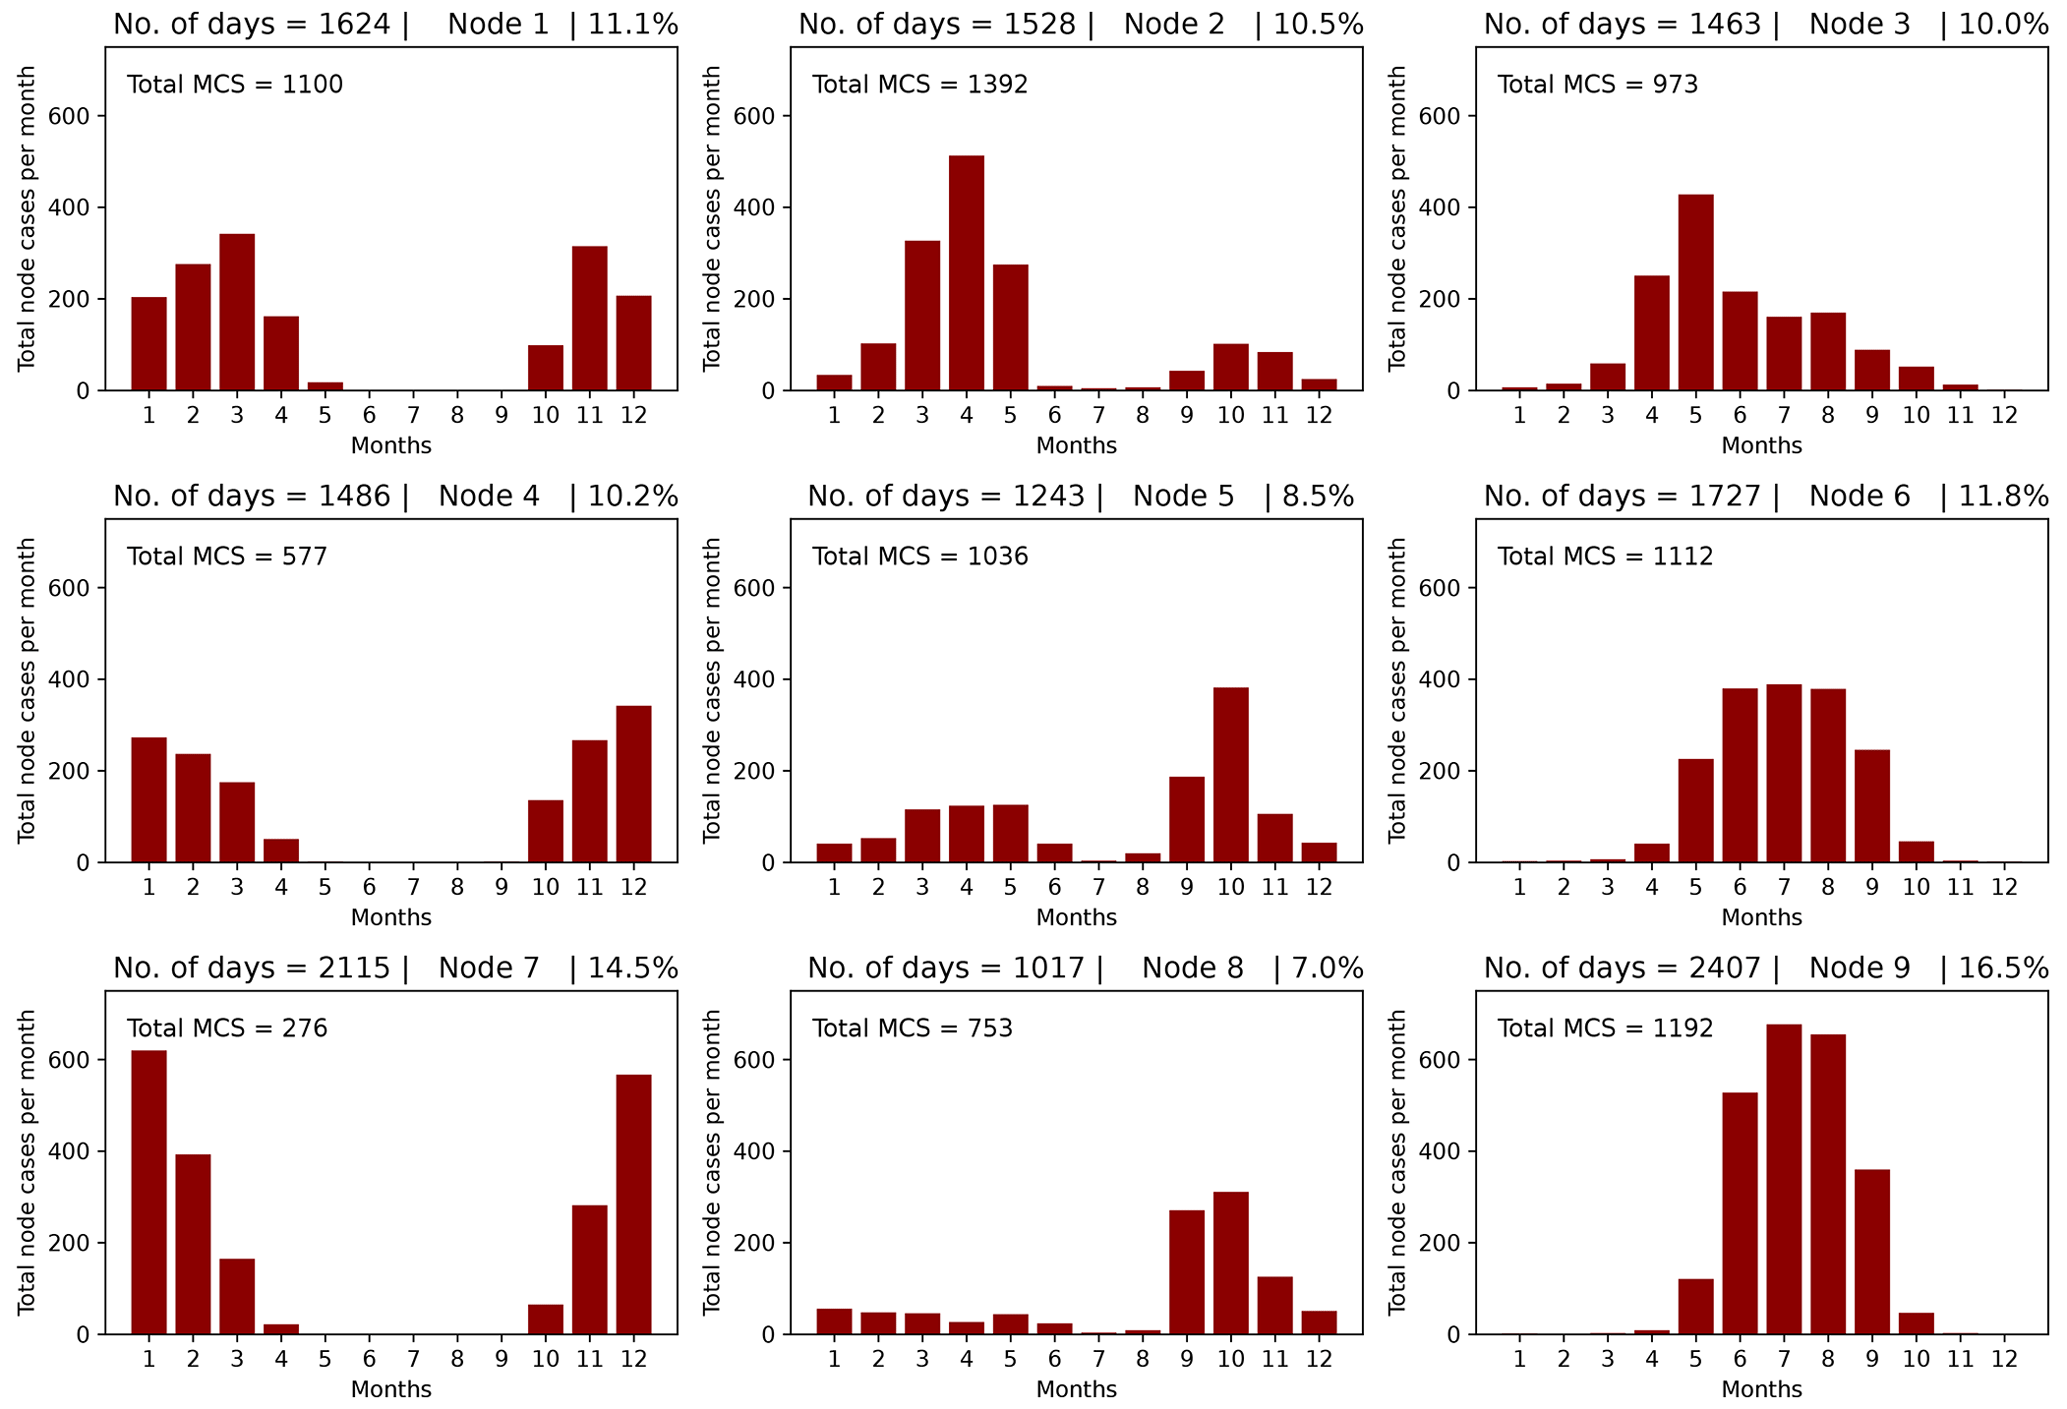
Figure 1Monthly distribution of node cases based on SOM analysis. Bar values indicate the total number of MCSs per month from 2004 to 2015. The total number of MCSs per node from 2004 to 2015 is displayed in node panels. The title shows the total number of days in each node (left) and the contribution of each node to the total node days (right).
To investigate the relationship between nodes across our 3×3 SOM matrix, we now consider the frequencies at which node states are preceded or followed by other nodes in Fig. 2. The resulting frequency distributions reinforce a classification of the matrix columns into nodes for the dry (1, 4, 7), transition (2, 5, 8), and monsoon (3, 6, 9) seasons, with the top row (1, 2, 3) representing nodes that are preceded or followed by nodes of a different season (column) 20 %–30 % of the time. The bottom-row nodes (7, 8, 9) on the other hand are distinct within-season states that are almost never connected to first row nodes (1, 2, 3) but are reached via intermediate middle-row nodes (4, 5, 6). The node matrix separates different season states along rows, while columns seem to represent within-season states where upper and lower rows are separate states temporally connected by conditions captured by middle-row nodes. Finally, the persistence of nodes presented in Fig. 3 reflects the discussed matrix structure, with connecting middle-row nodes (4, 5, 6) featuring the shortest periods with on average 1.7–1.9 d, suggesting more transient states. Nodes 2, 7, and 9 on the other hand show the smallest number of single-day occurrences (consecutive node days = 1), pointing towards more stable, persistent conditions with an average period length of 3.8–4.3 d. Regarding node characteristics, it is striking that each seasonal node group features nodes of differing persistence (cf. node season order for consecutive node days = 1), rendering node persistence a key difference between same-season nodes in the SOM matrix columns.
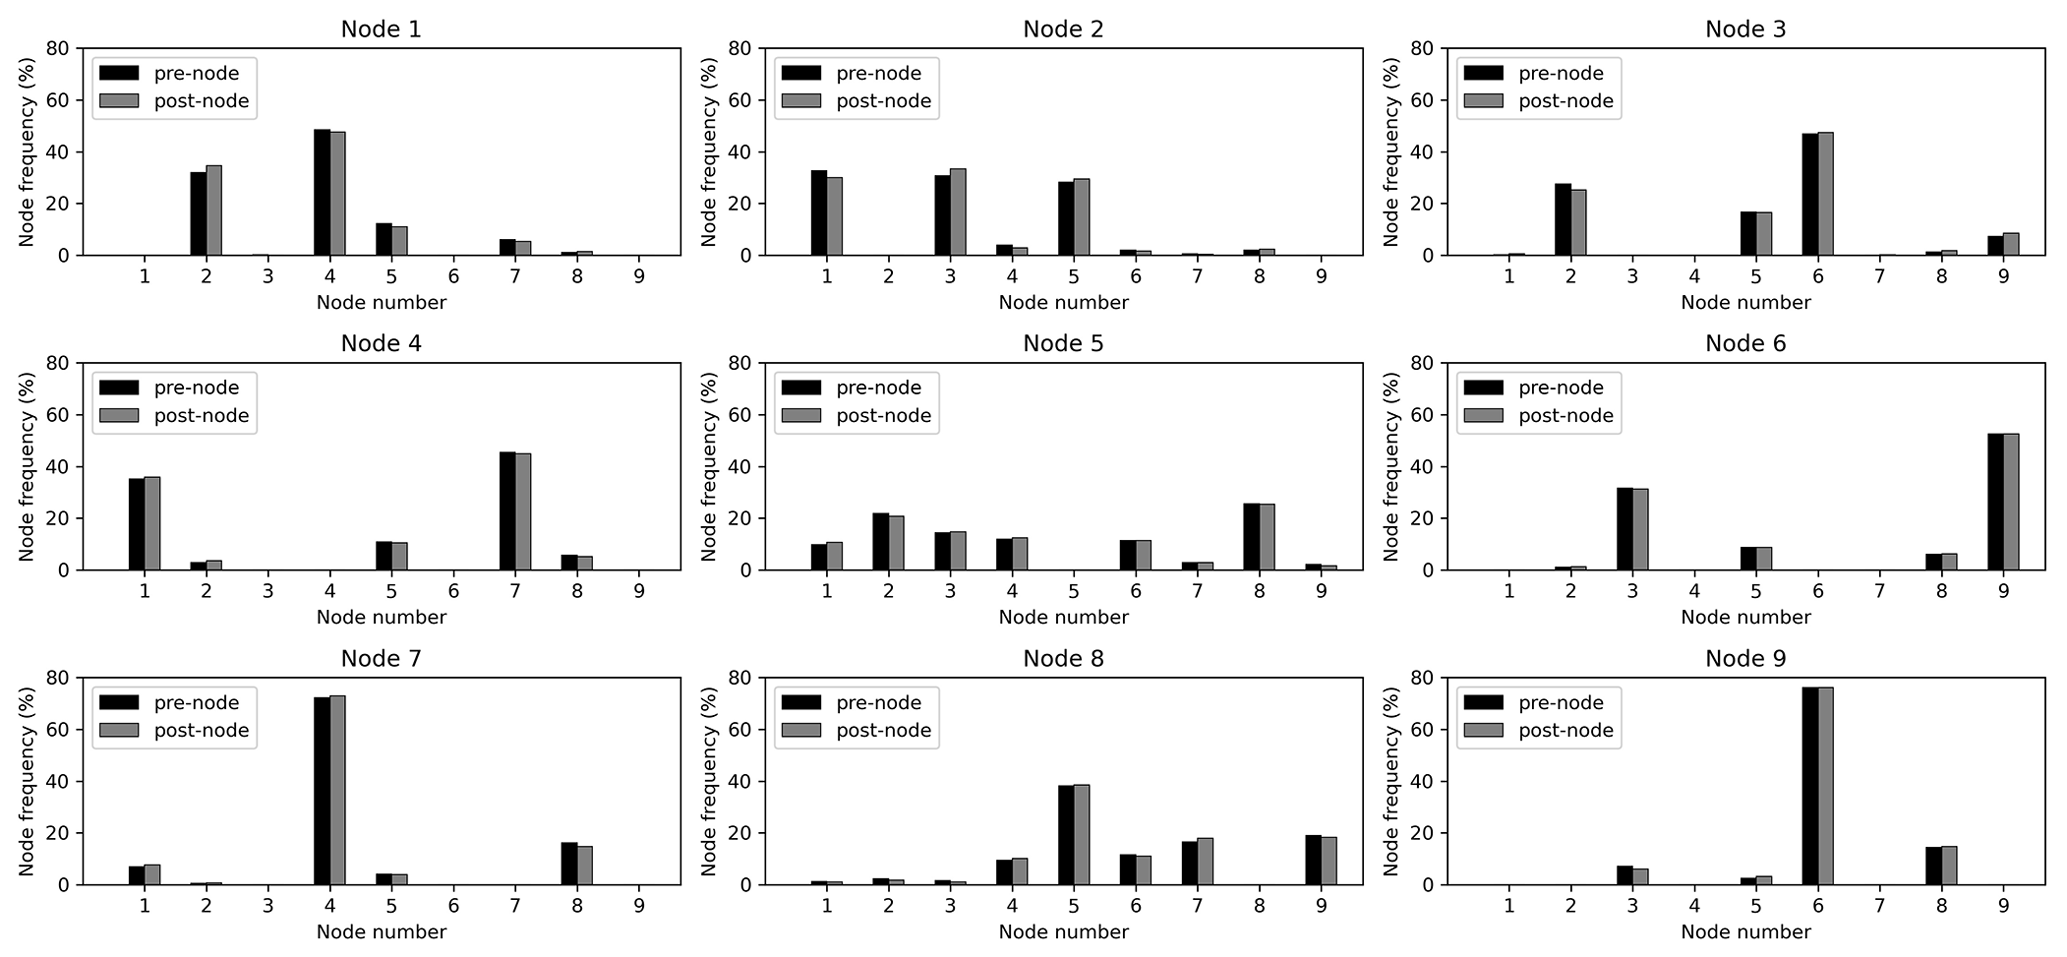
Figure 2Frequency of nodes (%) preceding (pre-node) or following (post-node) each of the nine nodes.
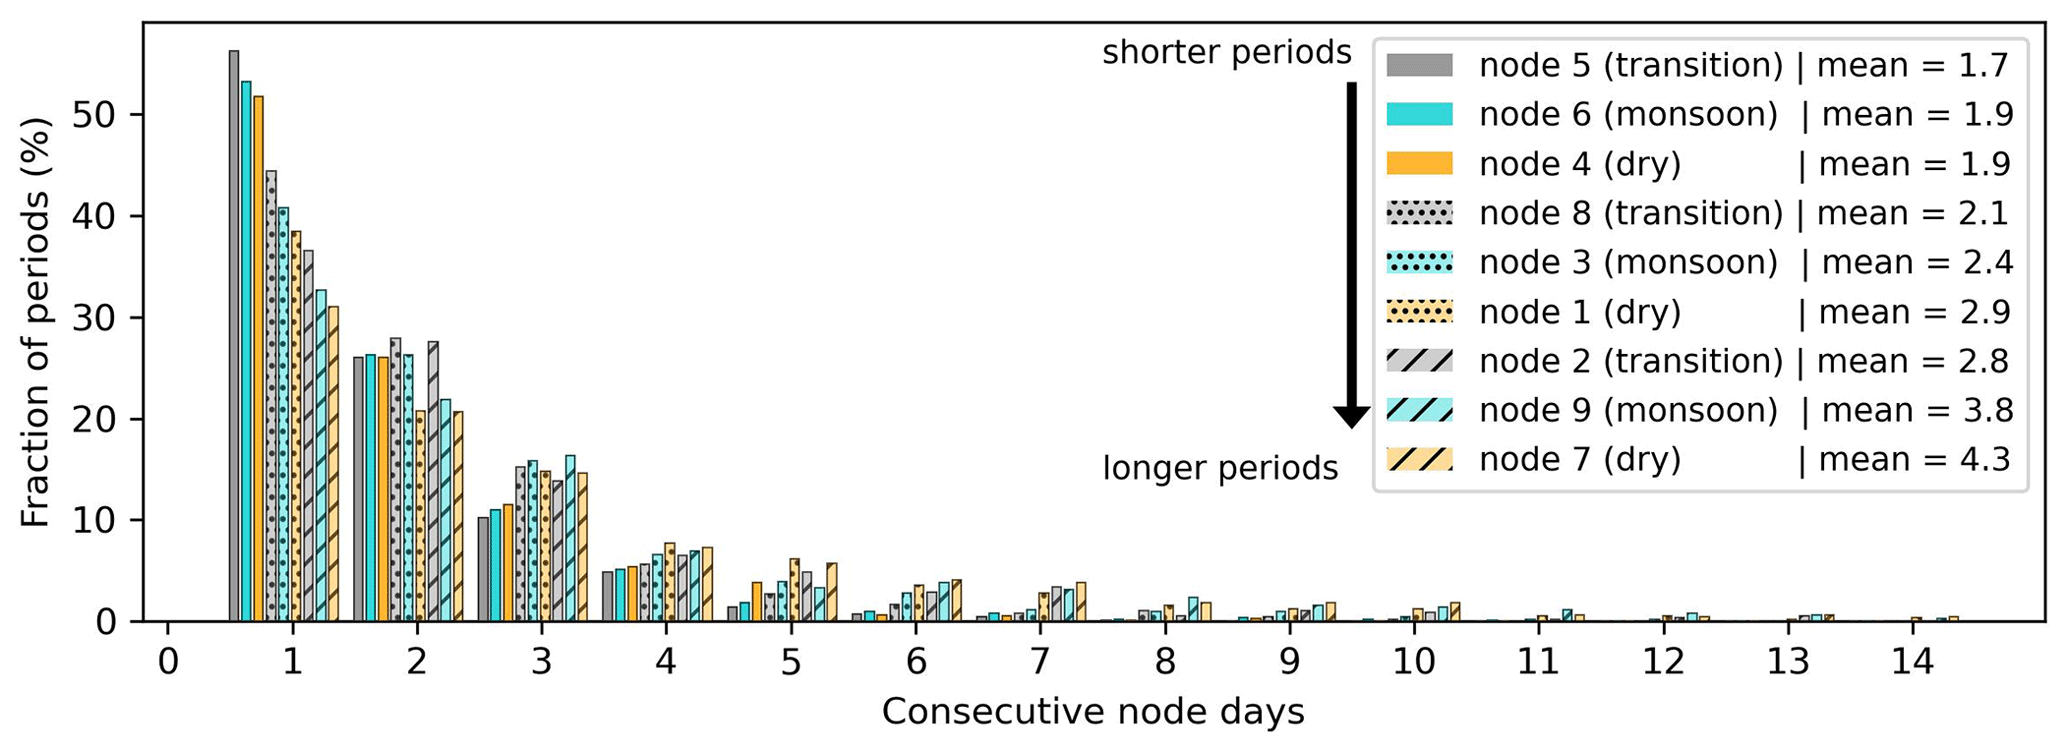
Figure 3Fraction of periods covering consecutive days of different lengths per node, with the total percentage for 1–14 consecutive node days adding up to 100 % per node. The node bars are ordered according to the period fraction for “consecutive node days = 1”, revealing the node order going from shorter to longer temporal node persistence, as shown in the legend.
In the following, we inspect the average atmospheric conditions associated with the identified nodes. The SOM classification of different synoptic states was based on 925 hPa geopotential heights, with resulting patterns shown in Fig. 4. The patterns clearly show the signature of the well-known West African heat low (e.g. Lavaysse et al., 2009) moving northwards, strengthening over the course of the annual WAM cycle (from nodes 1, 2, and 3), and peaking in August, evident as an area of low pressure over the Sahara in nodes 3, 6, and 9. Nodes 4, 7, and 8 show stages of the weakening of the heat low coinciding with a southward movement of the 925 hPa low-pressure area. The overlaid 650 hPa wind field reveals mean easterly wind conditions at MCS steering levels across all nodes, suggesting that the dominant propagation direction for MCSs remains east to west for all identified synoptic states. As was shown in Fig. 3, the discussed node states have an average duration on the order of days, indicating frequent transitions. Notably, mid-level westerlies are strengthened or shifted southwards for all top-row nodes in Fig. 4, which is associated with increased probability for MCS occurrence compared to other nodes, as we will outline later (cf. Fig. 8). Potential synoptic factors that may drive the frequent node transitions and hence affect MCS frequency include extratropical waves, as well as the WAHL, which is most pronounced for top-row nodes. WAHL variations were shown to take place on the order of days, in some cases modified by dust concentration (Lavaysse et al., 2011), while its southward expansion on a sub-seasonal timescale has been associated with higher shear and more intense MCSs in SWA (e.g. Talib et al., 2022).
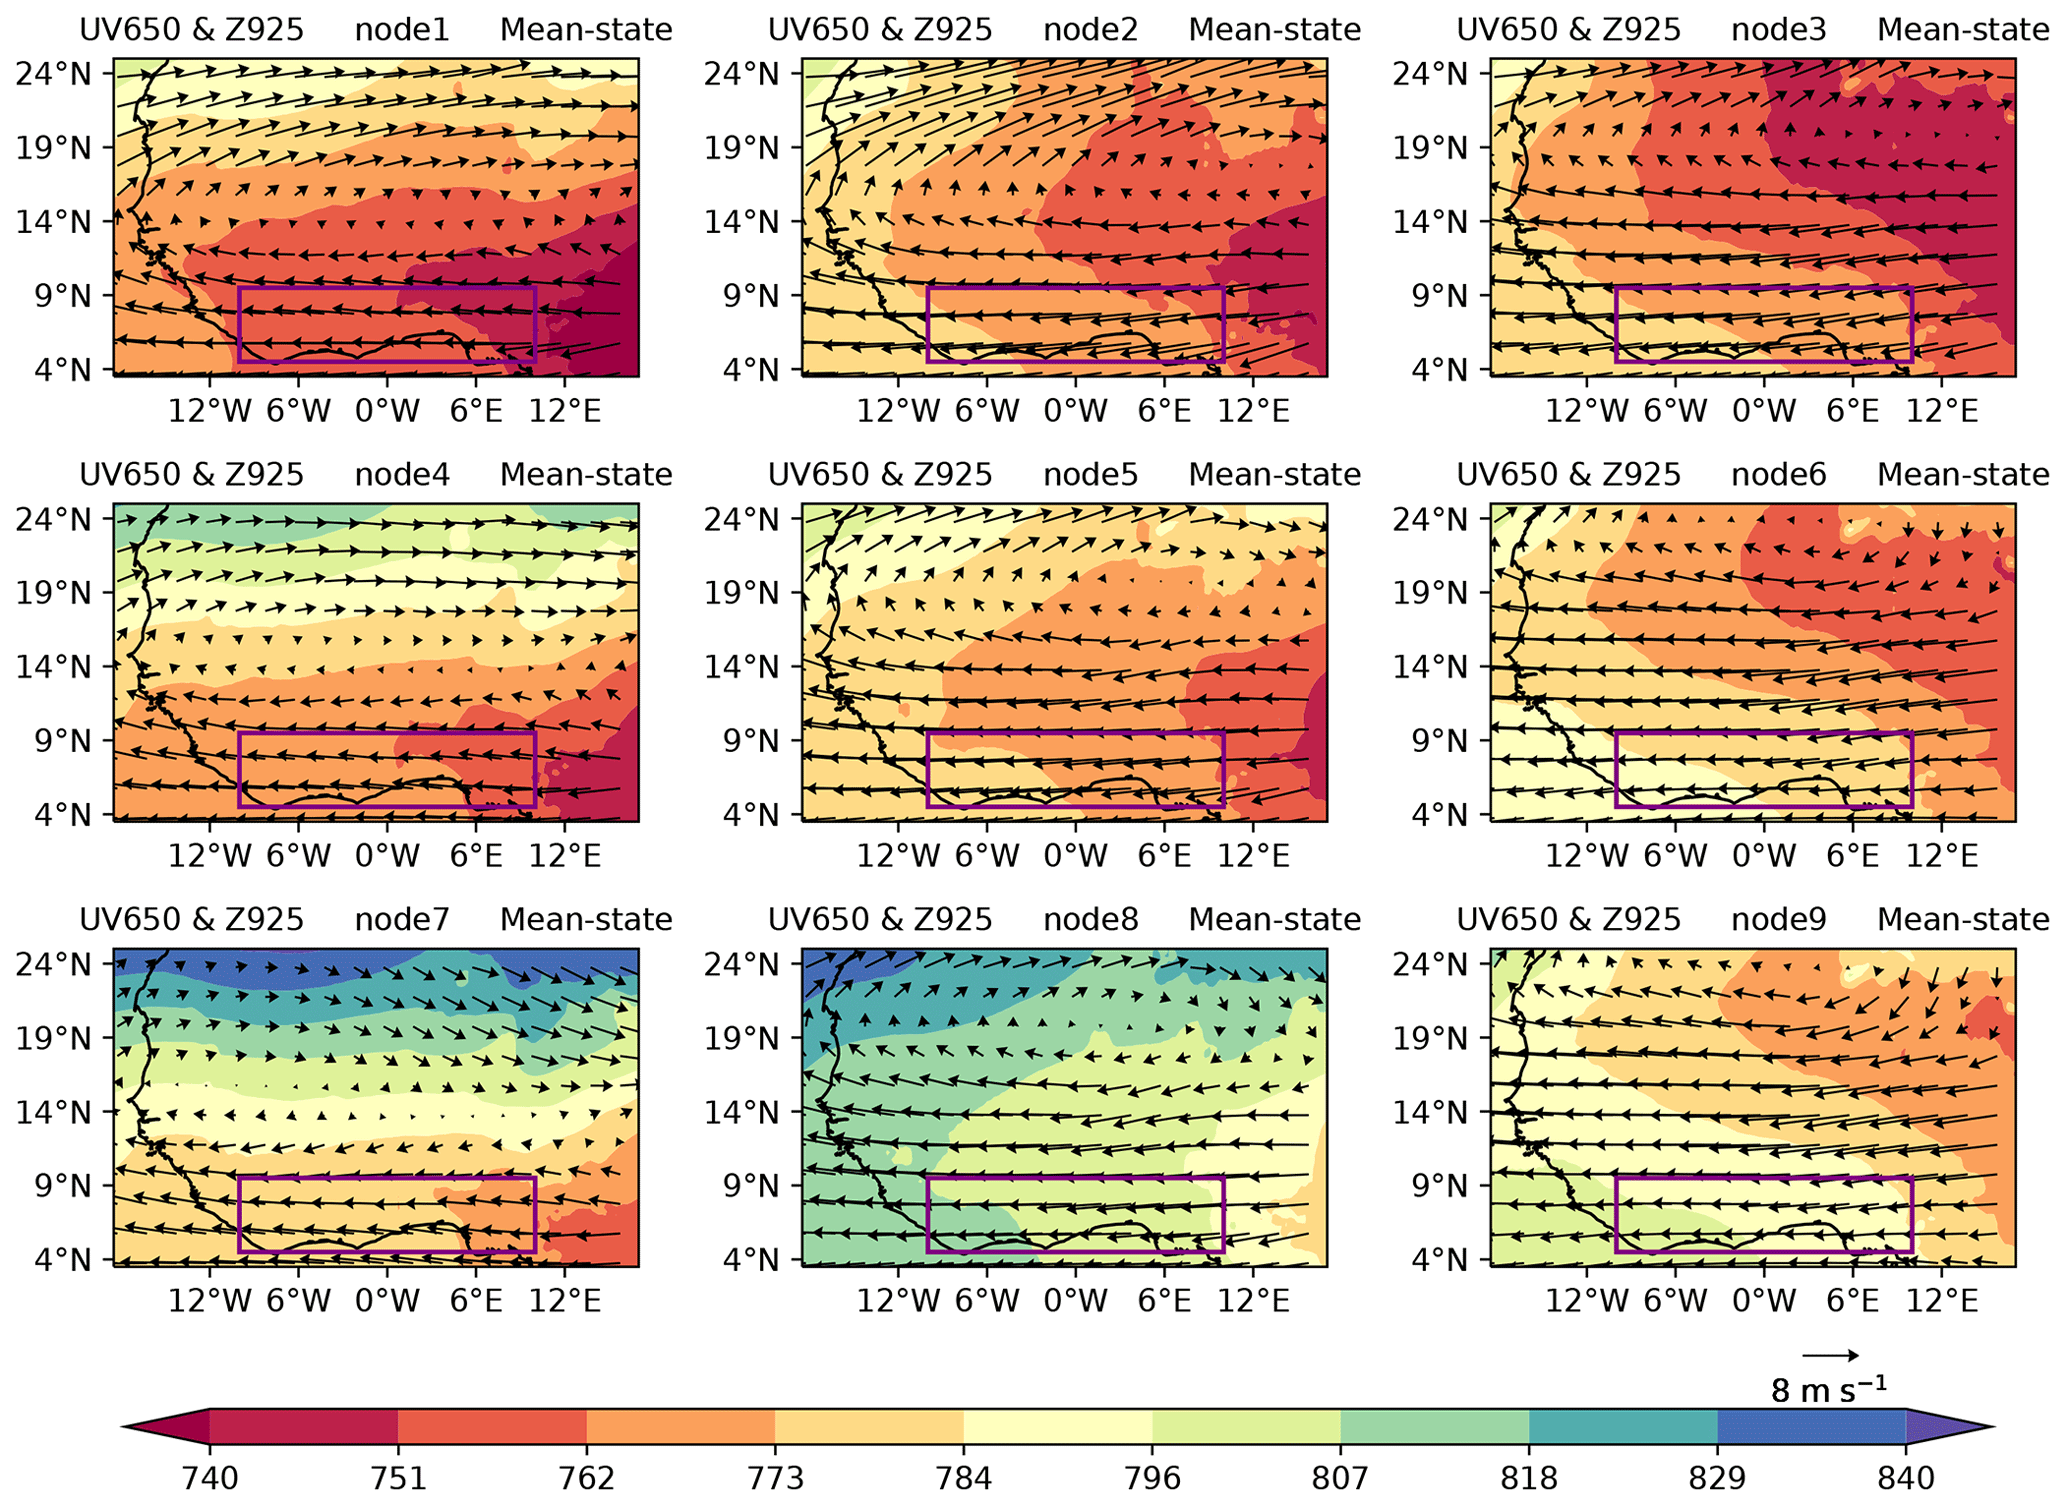
Figure 4The 12:00 UTC composites of 925 hPa geopotential height (Z925; Z: geopotential height) (shading; gpm, geopotential metre) and 650 hPa winds (UV650; U: zonal, V: meridional) (vectors; m s−1) in nine nodes based on SOM analysis. The purple box depicts the SWA region (5–9∘ N, 10∘ W–10∘ E).
We now examine winds and moisture flows at 925 hPa to explore their behaviour under the nine distinct circulation types identified (Fig. 5). In nodes 1, 4, and 7, the north-easterly winds dominate most of West Africa, with weak southerlies over SWA. This pattern in moisture distribution is evident in the dry season over West Africa, signalling a low moisture presence. The enhanced moisture observed in coastal areas of SWA can be attributed to the penetration of southerly winds. In transition-season node 2, the southerly winds strengthen and move inland, causing the north-easterly winds to retreat. A similar effect is observed in nodes 5 and 8, where the north-easterlies become weaker. In nodes 3, 6, and 9, the south-westerlies are intensified and move inland, further enhancing moisture flow from the South Atlantic towards the land, representative of monsoon flow. Wind patterns for mid-levels and low levels (Figs. 4 and 5) illustrate vertically sheared conditions coinciding with regions of high low-level specific humidity in all nodes (purple in Fig. 5), thus marking regions where atmospheric conditions may allow for MCS development.
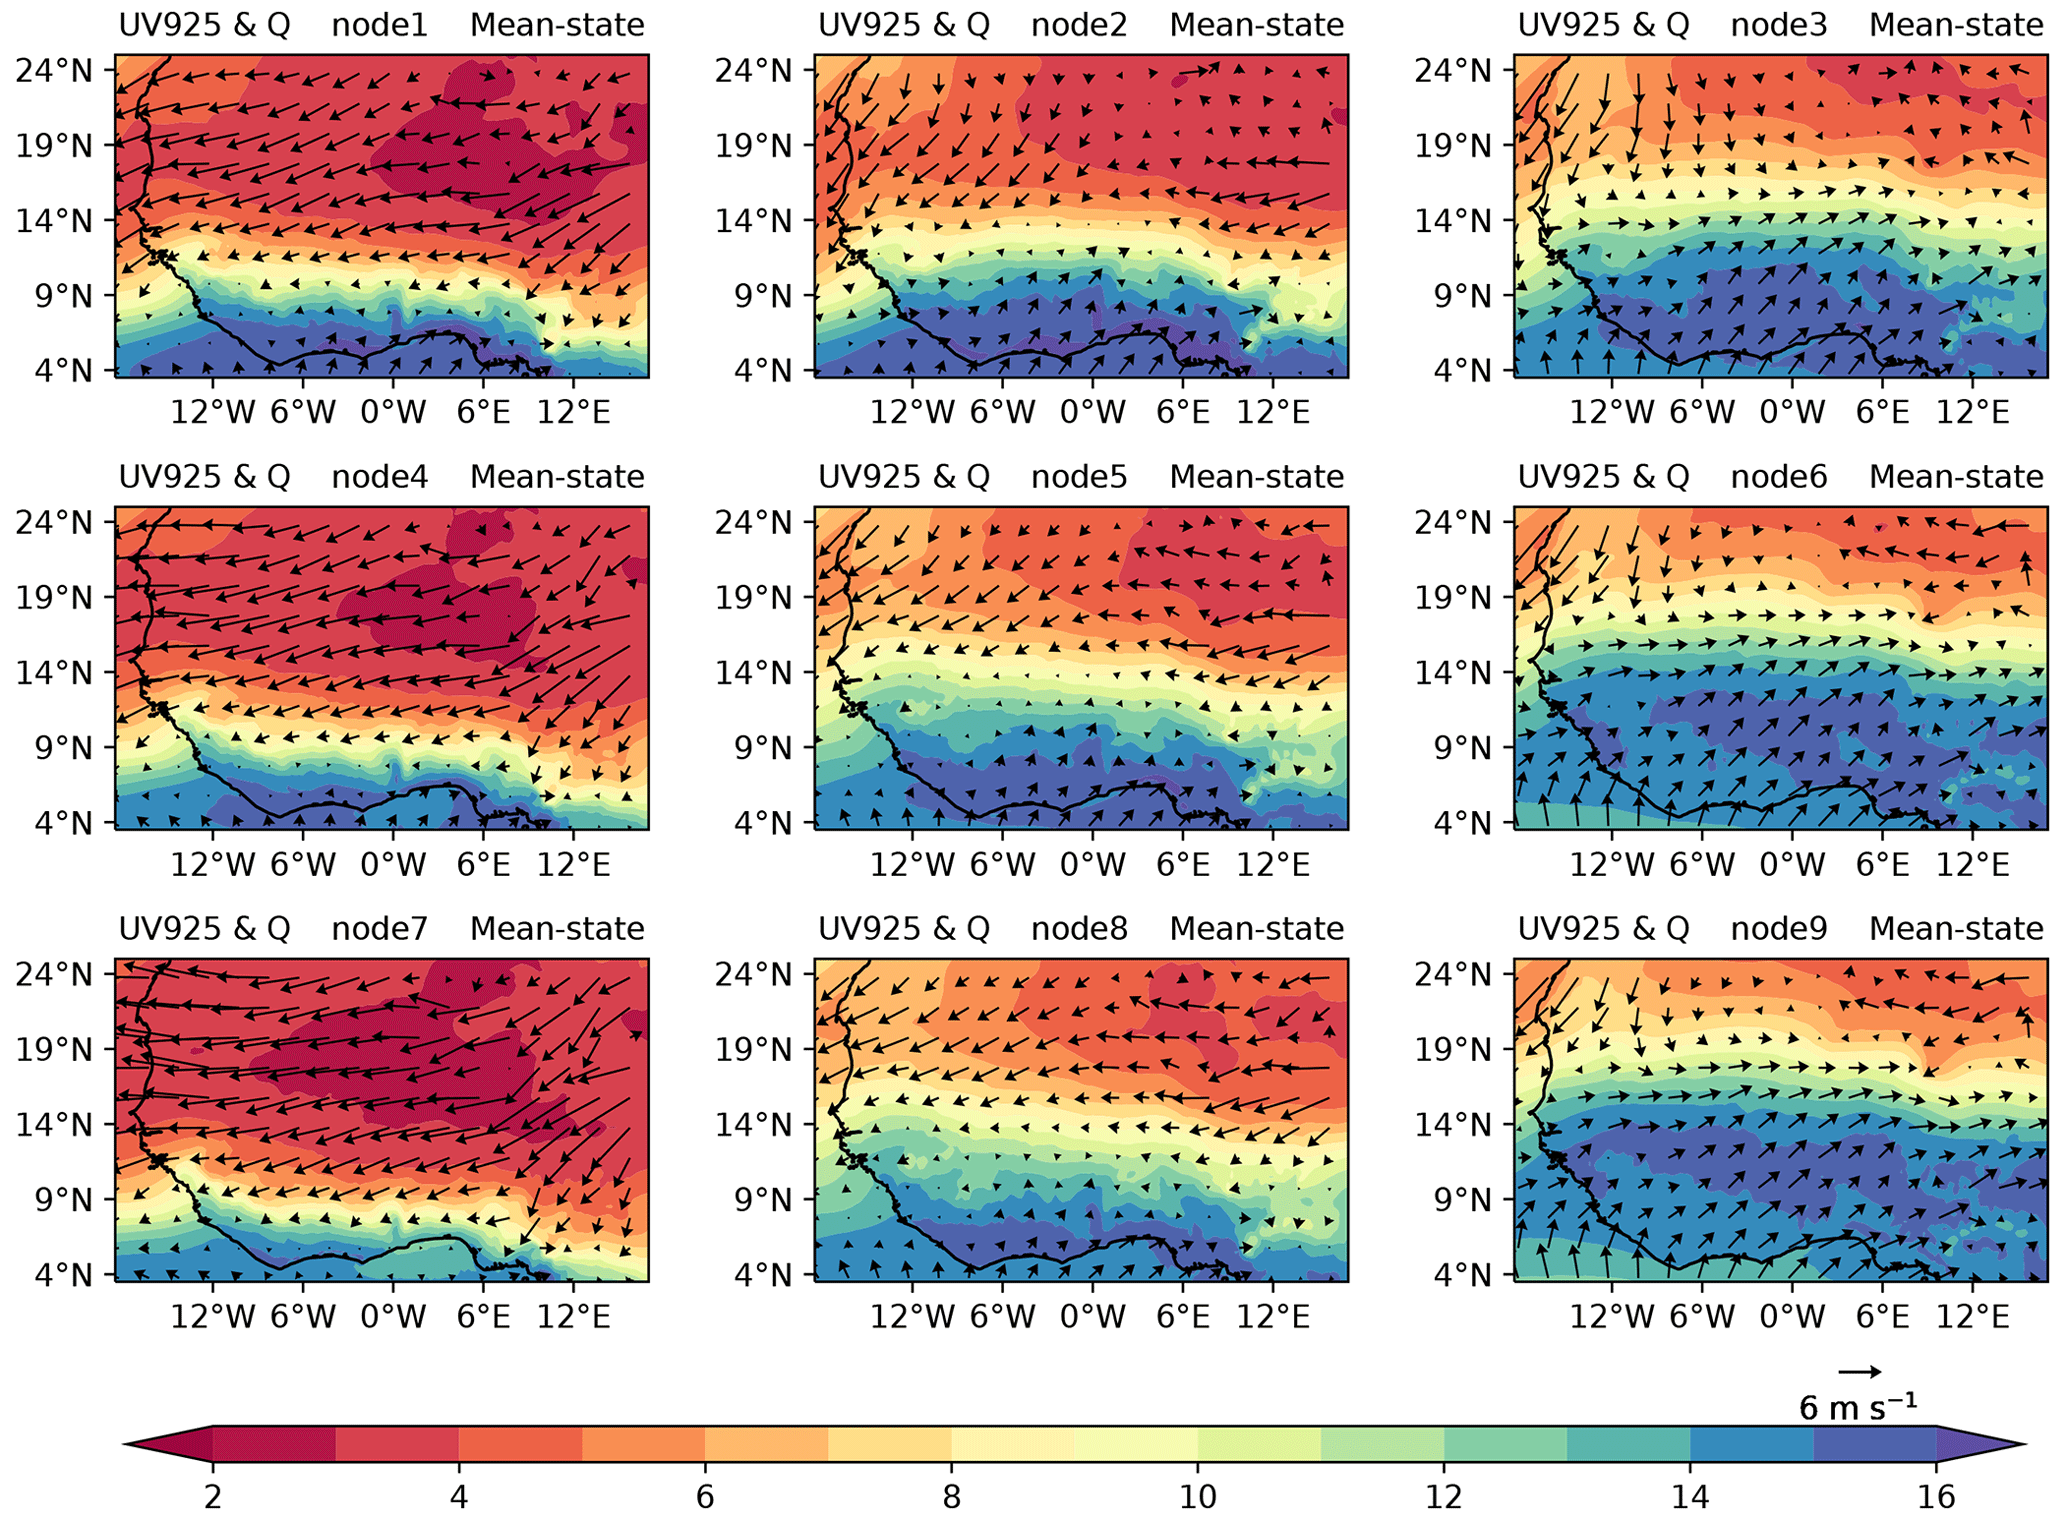
Figure 5The 12:00 UTC composites of specific humidity (Q) (shading; g kg−1) and 925 hPa winds (UV925) (vectors; m s−1) in nine nodes based on SOM analysis.
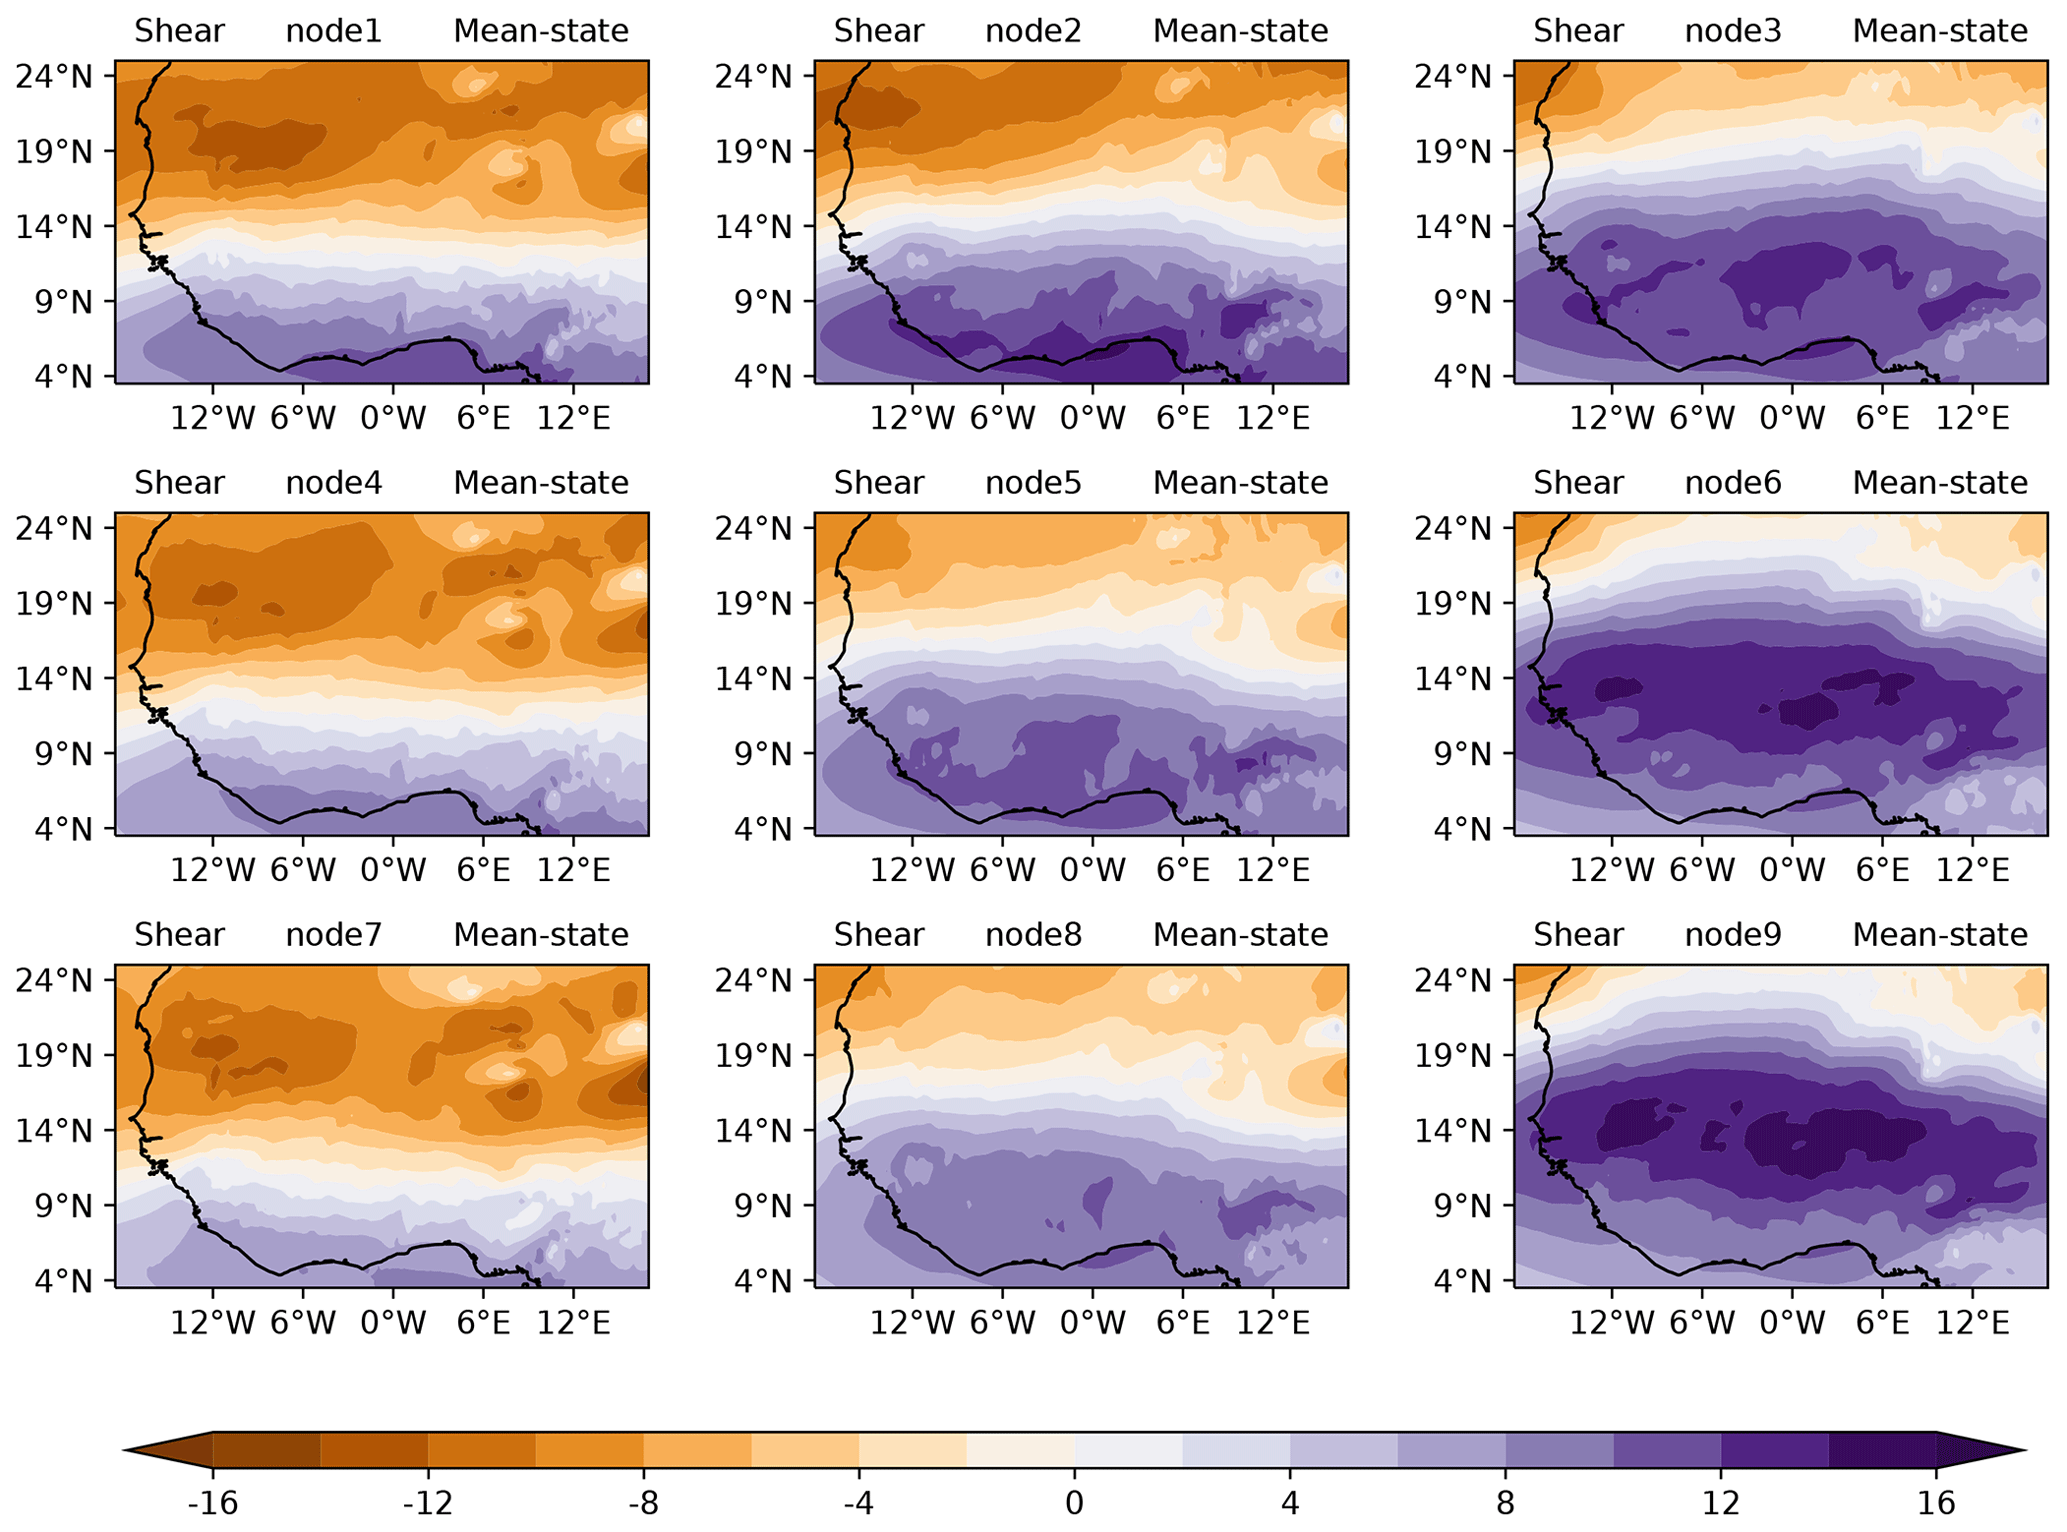
Figure 6The 12:00 UTC composites of zonal wind shear in nine nodes based on SOM analysis.
A further investigation was conducted to ascertain the spatial distribution of mean zonal wind shear over SWA (Fig. 6), where easterly shear is represented with a positive sign in this study, as it is easterly shear that contributes to MCS development in this region. The patterns in zonal wind shear demonstrate northward transport during the propagation of the WAM cycle, and a wider spread of zonal wind shear from the first- to third-column nodes illustrates a strong link of high-shear areas in the propagation of the WAM cycle, with these areas widening as the zonal wind shear band moves further inland. High-shear areas also closely follow the northern boundary of increased low-level humidity, marking the areas where humidity and shear conditions may allow for MCS development. For nodes with high frequency in the monsoon season (nodes 6 and 9), zonal wind shear peaks clearly to the north of the SWA domain. A southward retreat of zonal wind shear is observed during the post-monsoon period (nodes 2, 5, and 8).
4.2 Large-scale conditions favouring MCS days
The environmental conditions that are associated with MCS occurrence are described in this section. Firstly, the monthly climatology of MCS frequency as captured by our MCS snapshots (average number of MCSs at 18:00 UTC across SWA domain) is considered with a focus on rainfall months in Fig. 7, which shows a pronounced annual cycle of MCS numbers with frequency peaks in April and October. These peak months are associated with the start of rainfall during the major rainy season and the maximum rainfall for the minor rainy season across SWA, respectively. The monthly climatology of MCS frequency decreases from April to August, with August being the local minimum. This local minimum corresponds to the so-called “little dry season” (Le Barbé et al., 2002; Vollmert et al., 2003) that exists before the southward retreat of the rain belt.
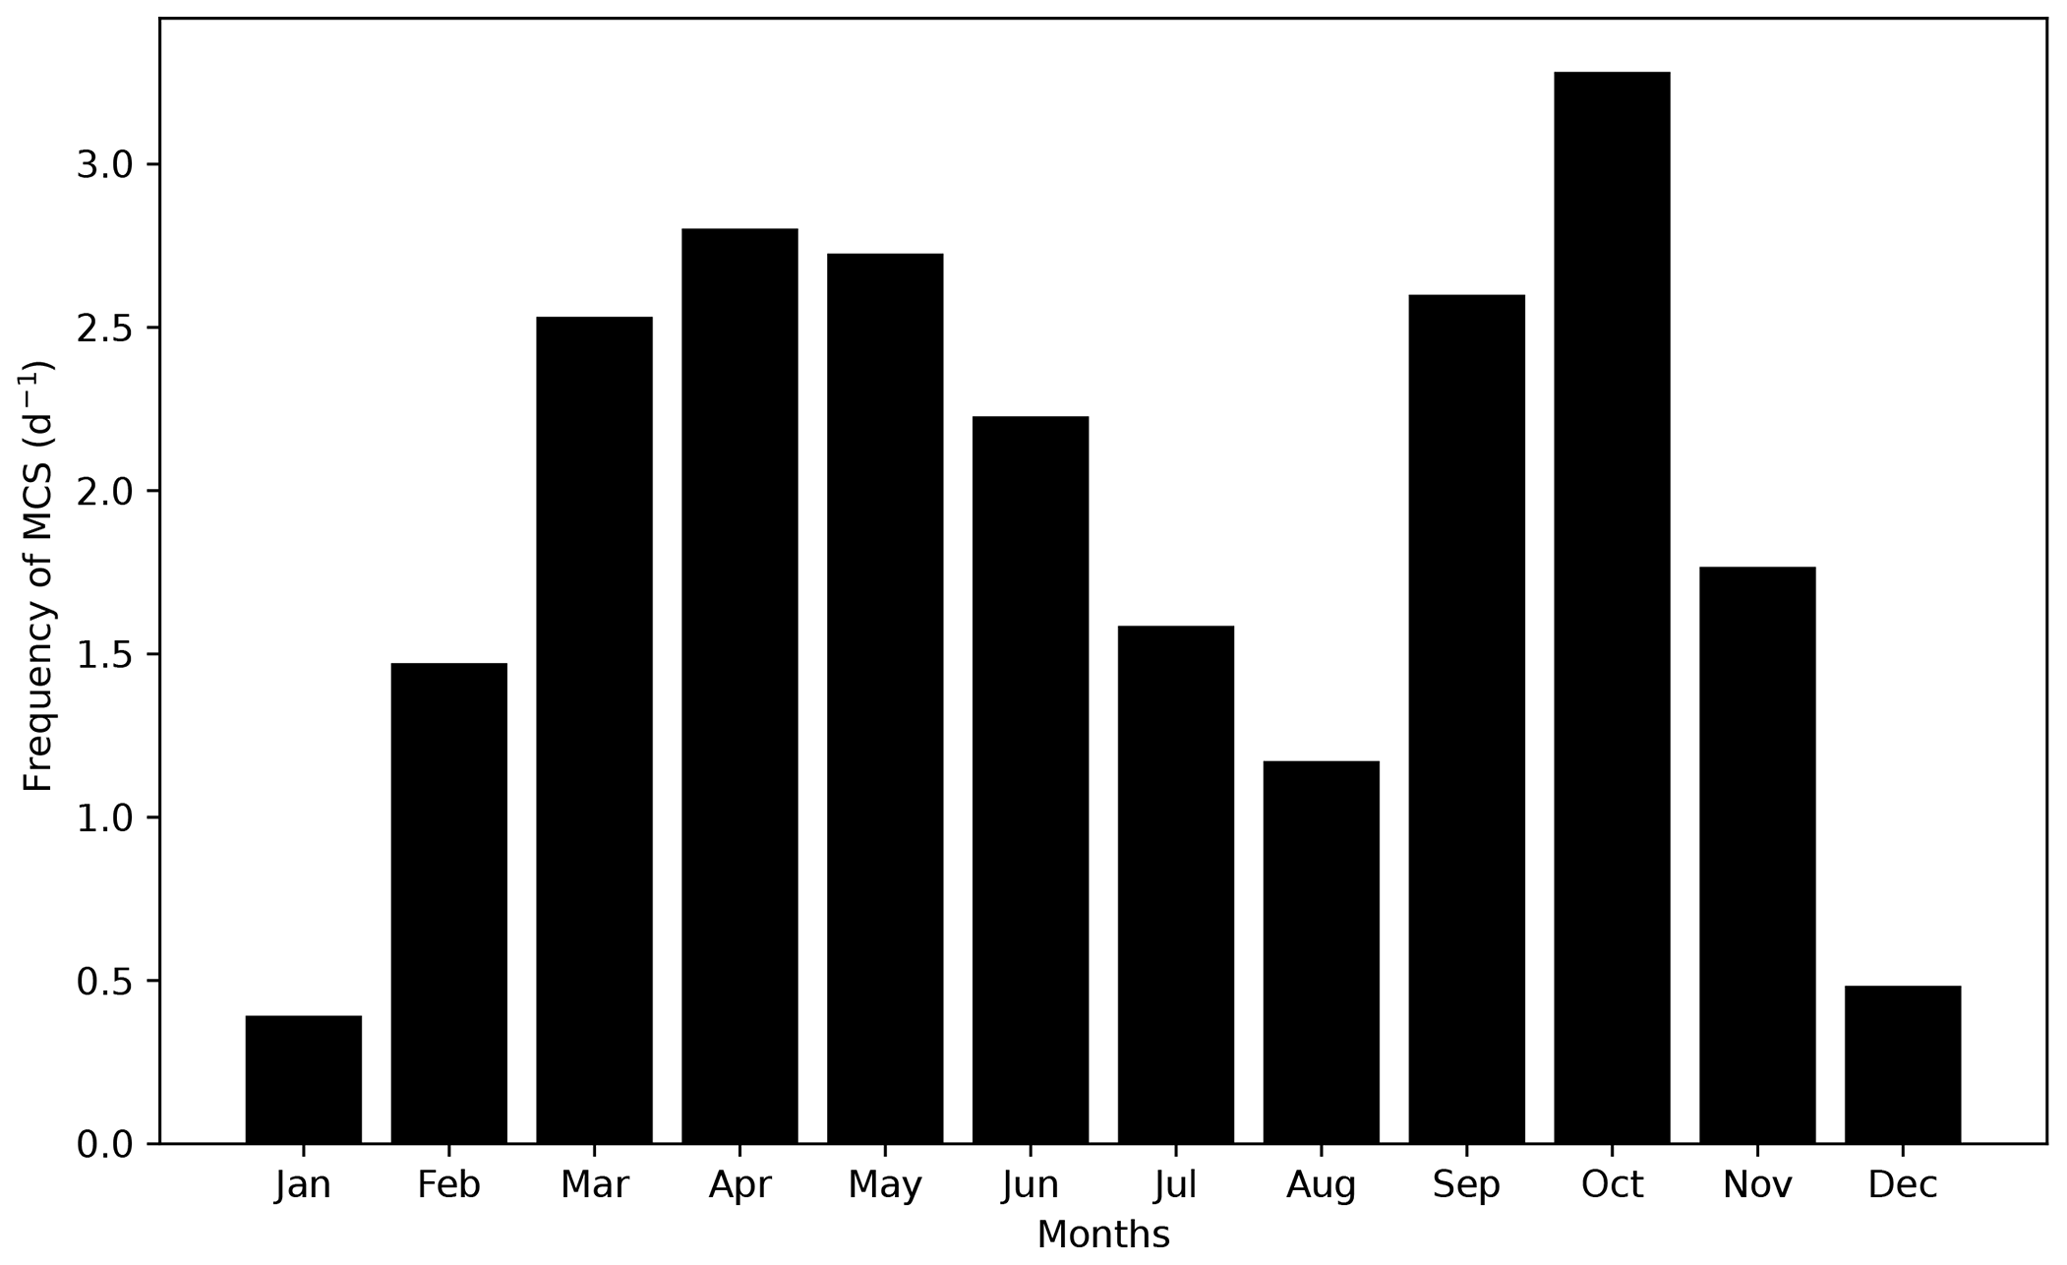
Figure 7Average annual cycle of MCSs at 18:00 UTC within the SWA box showing the monthly average of MCS number per day.
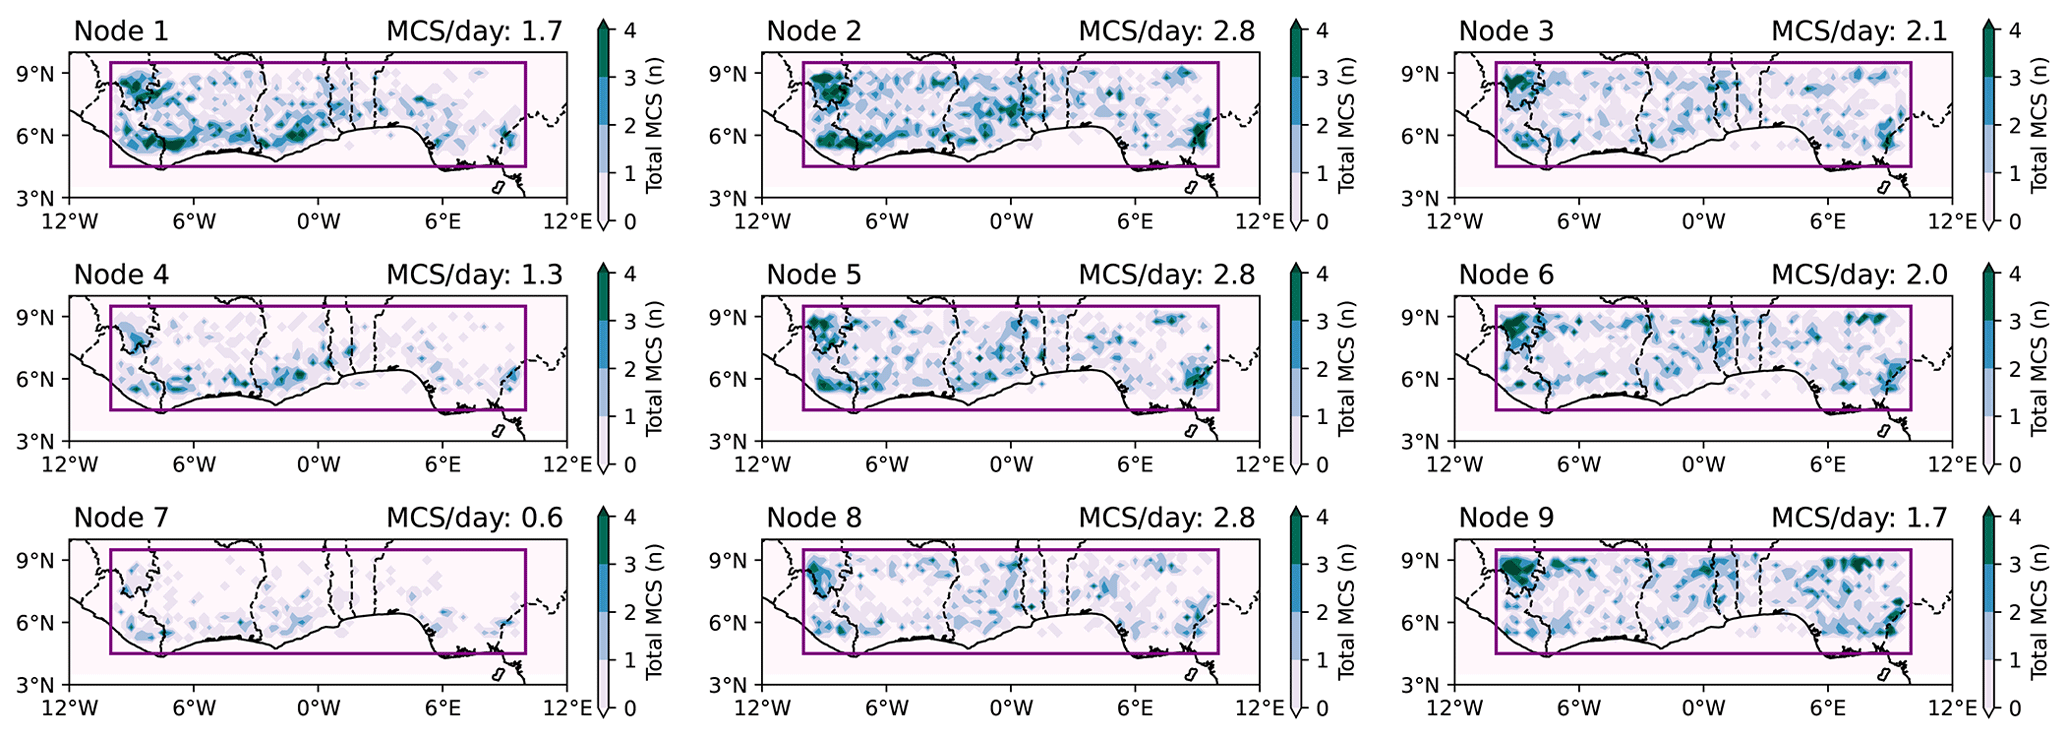
Figure 8The SWA region indicating the spatial distribution of MCSs during node days. The purple box depicts the main study region of southern West Africa (SWA; 10∘ W–10∘ E, 5–9∘ N), and titles show the frequency of MCSs per day per node within the SWA box.
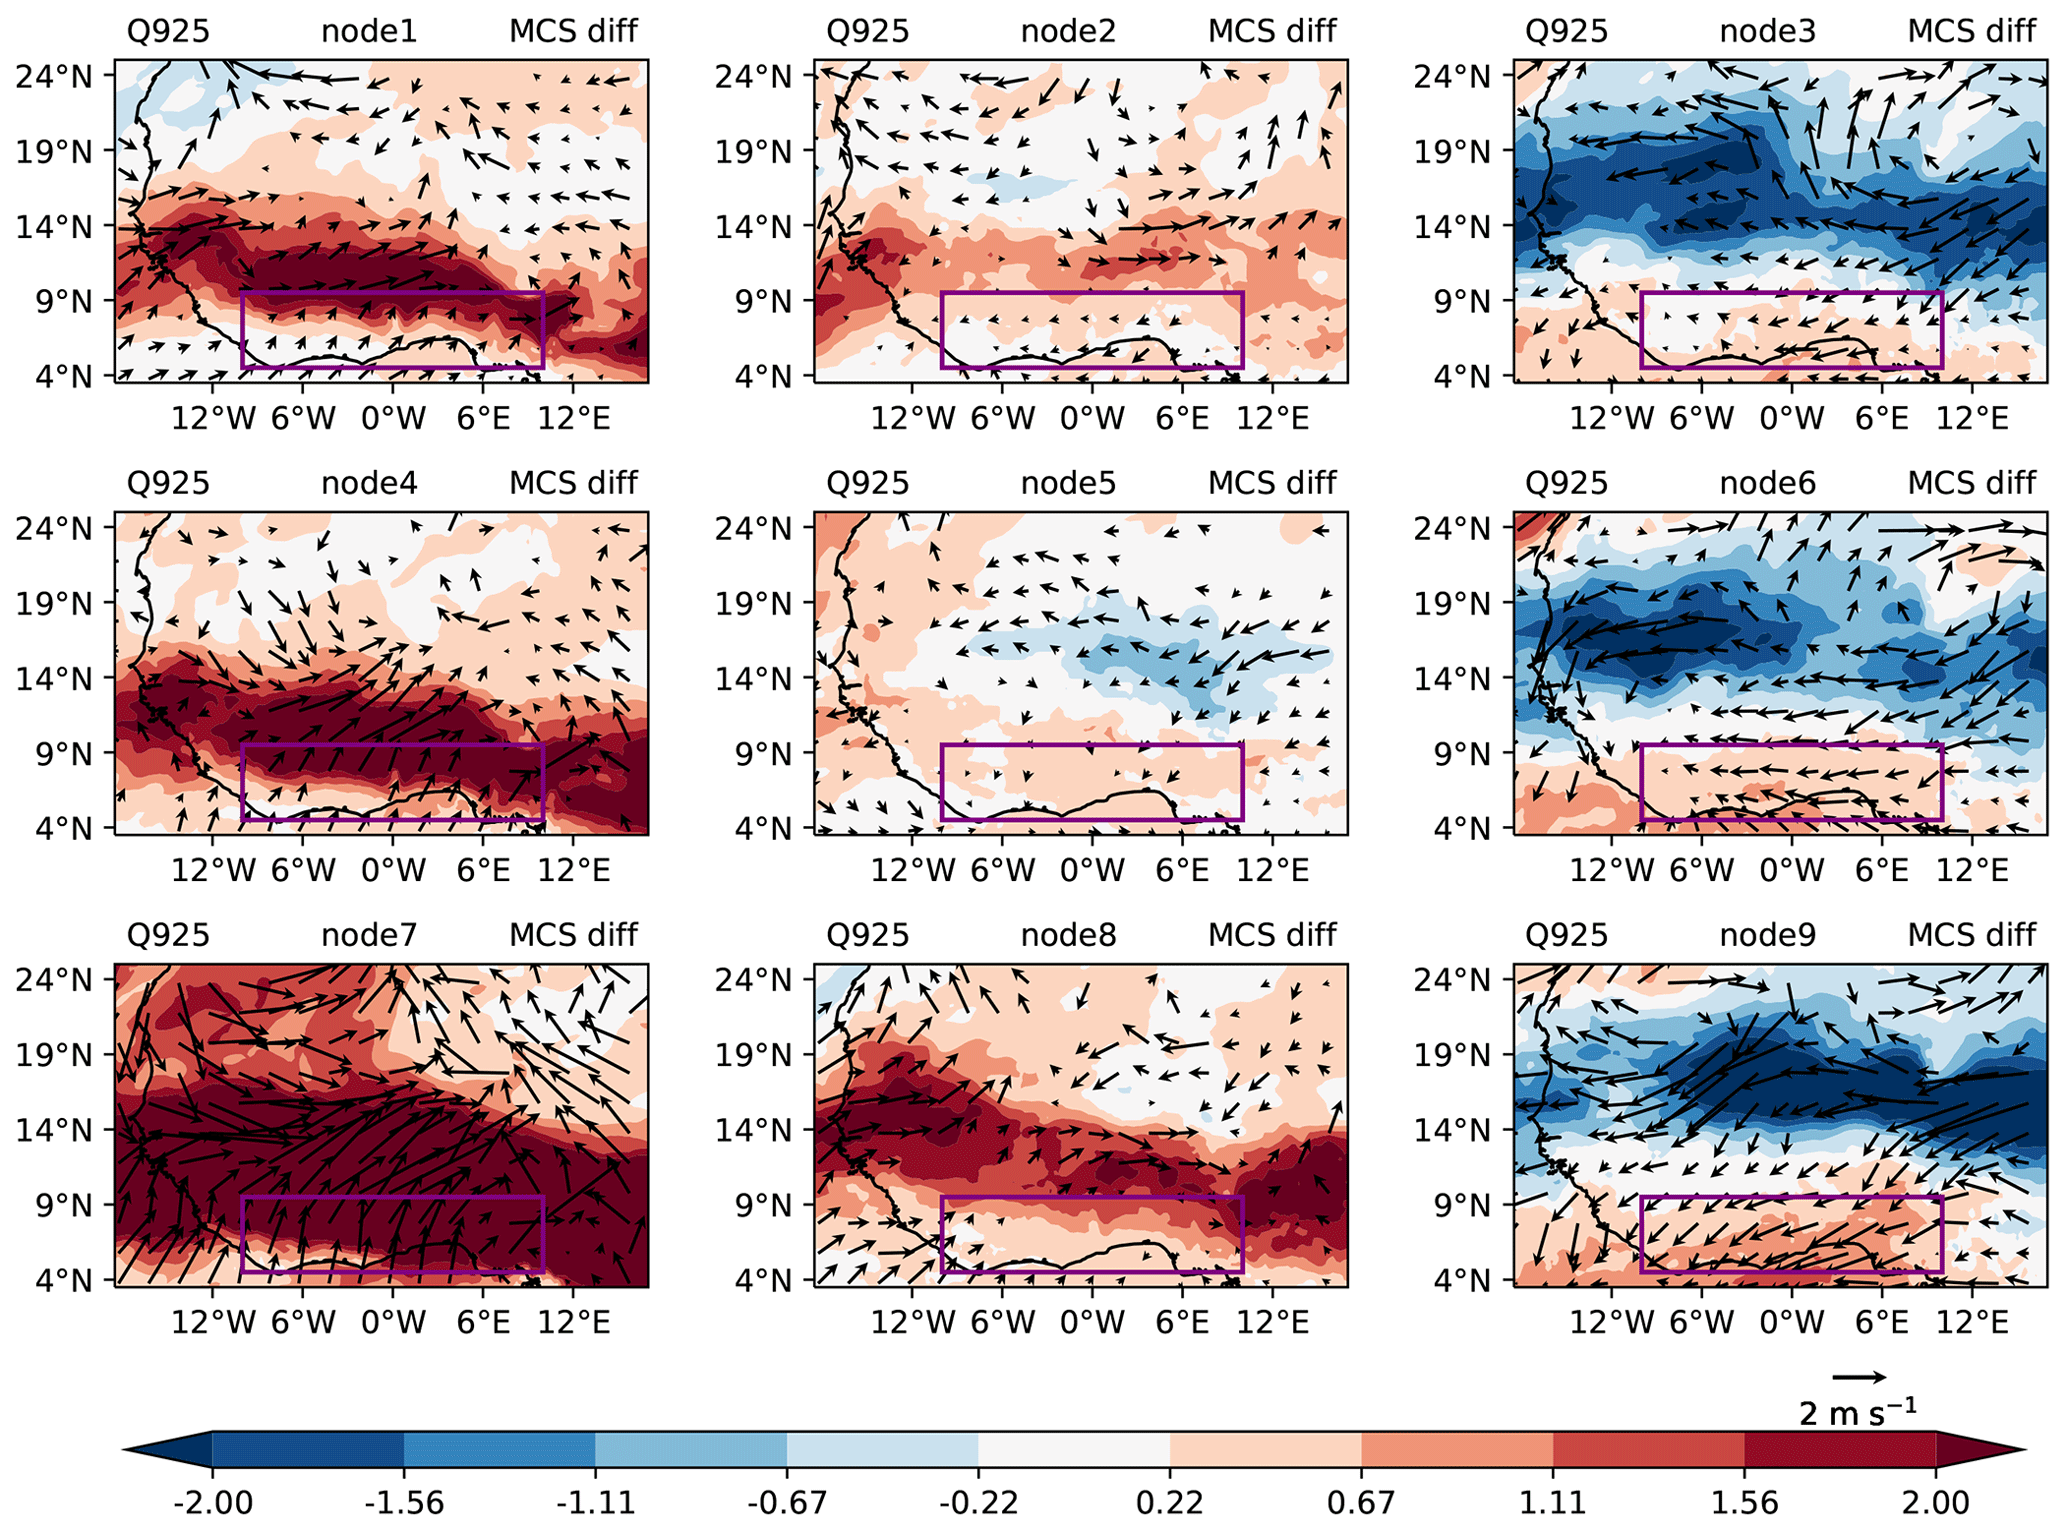
Figure 9The 12:00 UTC MCS-day composite anomalies of specific humidity (shading; g kg−1) and 925 hPa winds (vectors; m s−1) in nine nodes based on SOM analysis. Specific humidity anomalies are shown when they are significant at the 5 % level; wind vectors are shown when either the zonal or meridional wind anomalies are significant at the 5 % level.
The spatial distribution of MCS frequencies during node days is depicted in Fig. 8. Comparing daily MCS frequencies, we find that MCSs are most likely to develop under transition-season node (2, 5, 8) conditions (2.8 MCSs per day) featuring a northward-displaced moisture anomaly (Fig. 9). Given that transition-season nodes occur predominantly during the pre-monsoon (late March to June) and post-monsoon period (from September to November) – the major and the minor rainy season, respectively, in SWA (cf. Fig. 1) – these patterns may in some cases be representative of early monsoon onset and a delayed monsoon retreat, respectively. MCSs rarely develop under dry-season node (1, 4, 7) conditions, with frequencies as low as 0.6 MCSs per day. Frequency signals in node 1 are dominated by land–sea breeze convection along the coast, which are gradually suppressed in nodes 4 and 7. Large-scale settings, therefore, seemingly facilitate such rather local-scale developments. Nodes 1 and 9 feature the same overall MCS frequency, where node 1 however shows coastal MCS frequency peaks as is representative of dry-season characteristics, while MCS frequency peaks are shifted towards the Sahel during node 9 monsoon conditions.
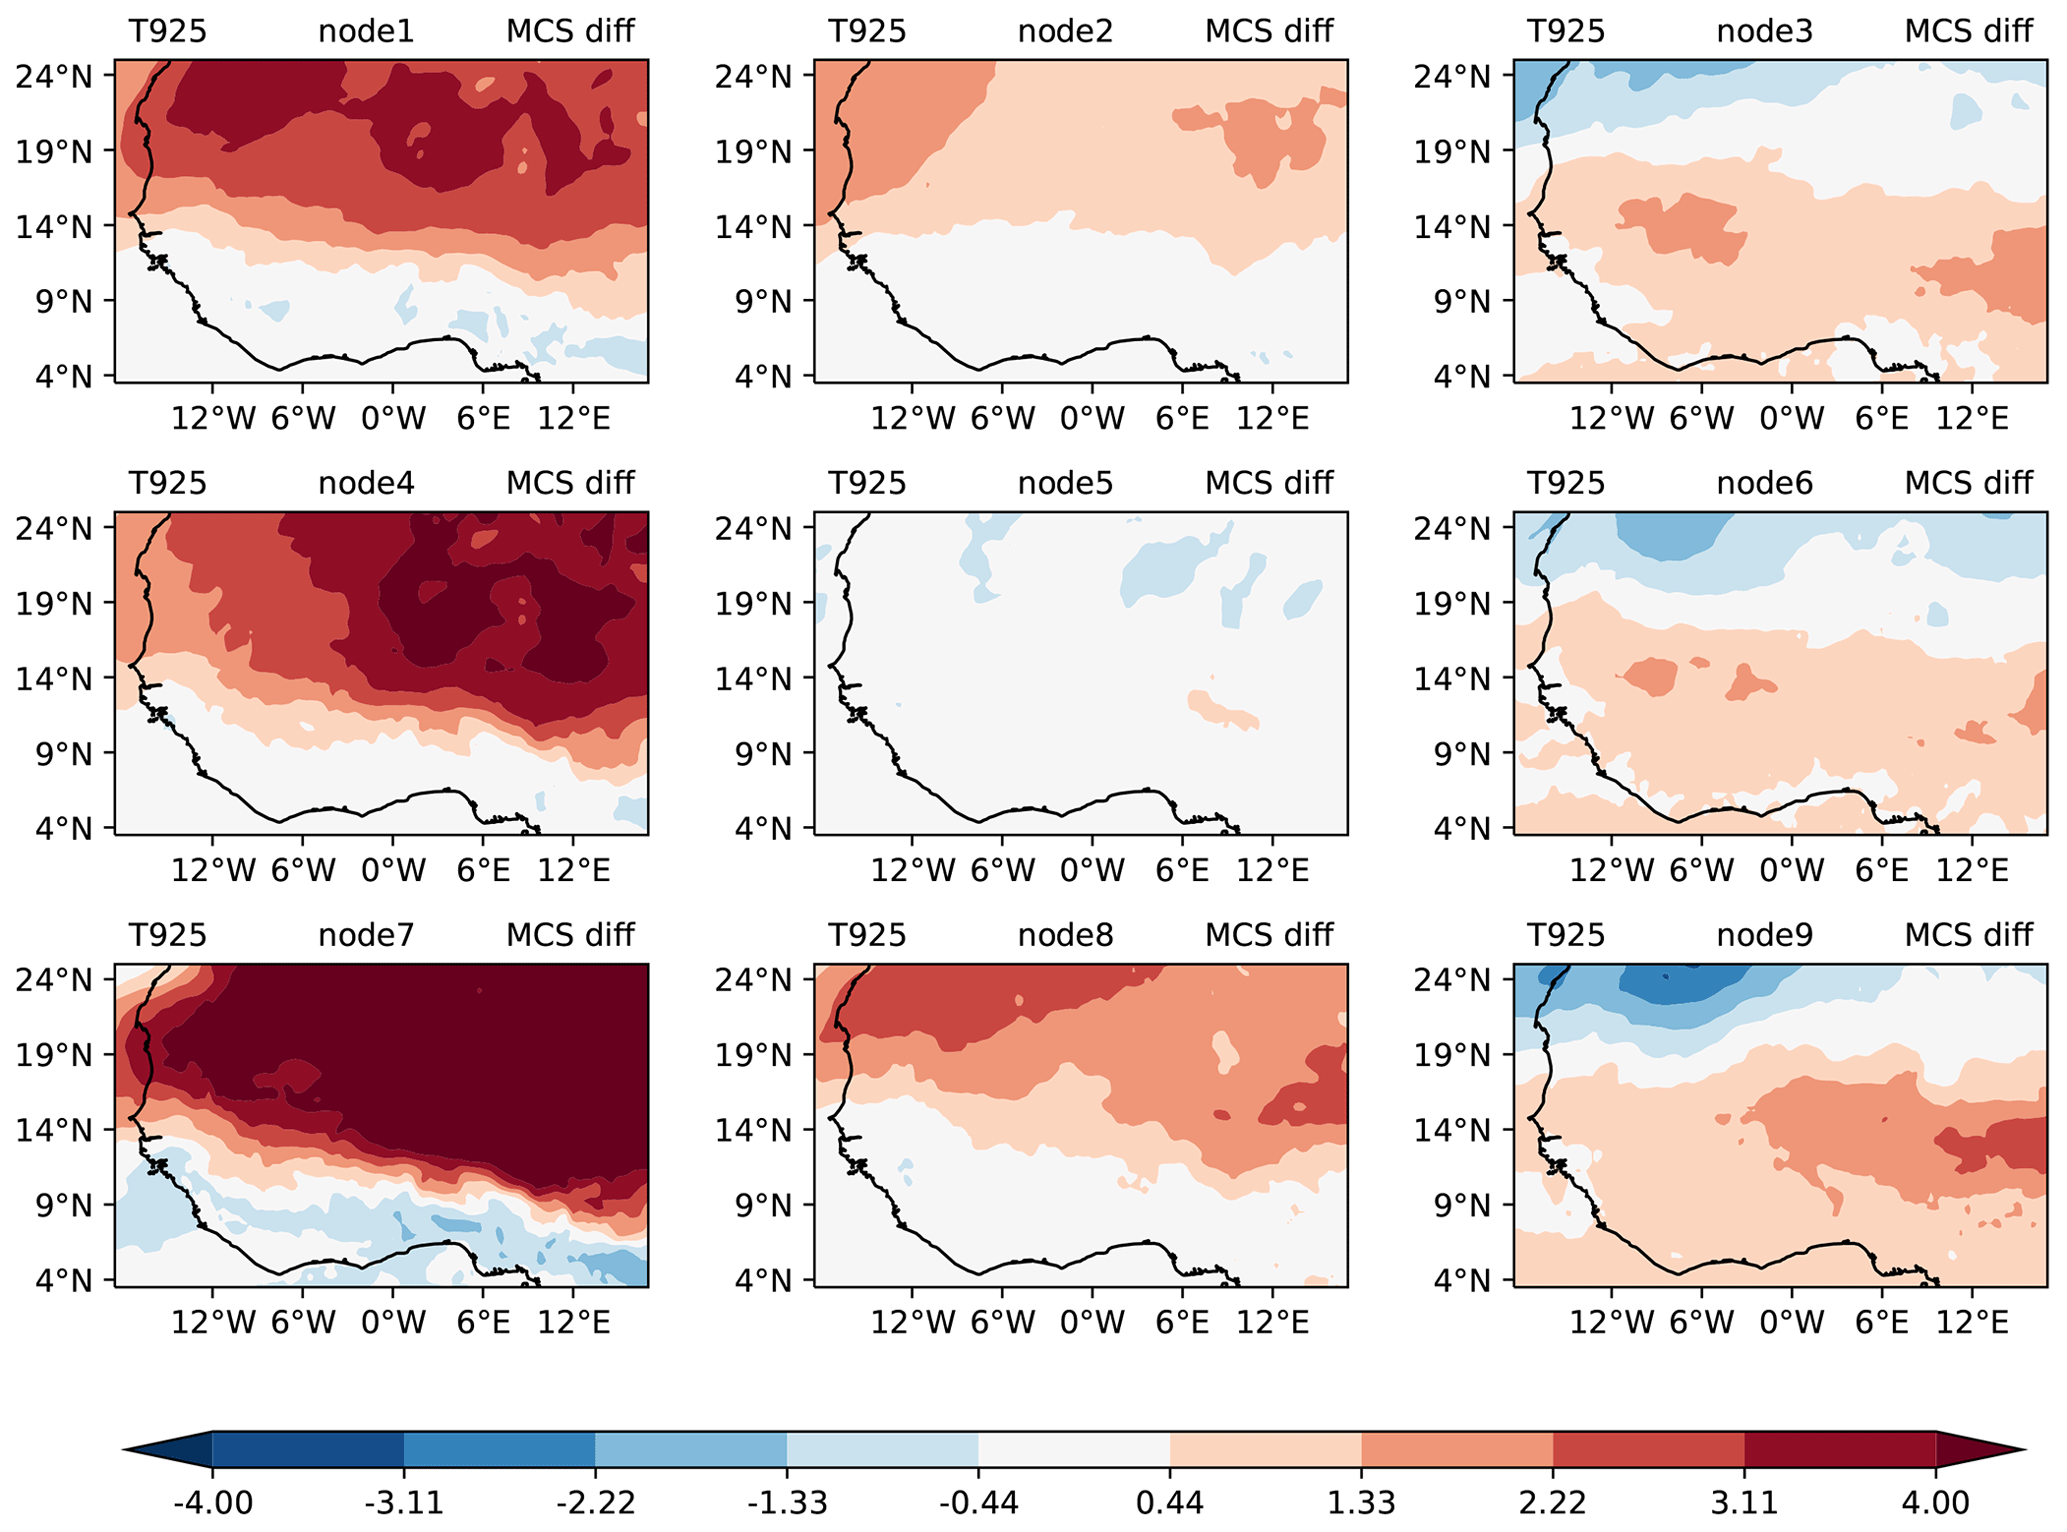
Figure 10The 12:00 UTC composite anomalies of 925 hPa temperatures (T925; T: temperature) (∘C) in nine nodes based on SOM analysis. Temperature anomalies are shown when they are significant at the 5 % level.
During the dry-season nodes (1, 4, 7), a positive widespread moisture anomaly maximum is observed with anomalous south-westerly winds over SWA (Fig. 9). This depicts a substantial enhancement in the low-level moisture transport as a result of the few days with convective activities during the dry season. In the transition-season nodes (2, 5, 8), low-level moisture anomalies during days with convective activity show weak and mostly insignificant behaviour along the SWA coast based on the two-sided Student's t test. In node 8, a positive moisture anomaly is located over the northern part of SWA. During monsoon-season nodes (3, 6, 9), a notable region of anomalous low-level easterly wind is observed over the Sahel, indicating a weakening of the south-westerly monsoon winds and of the low-level westerly jet, which reduces moisture transport towards the Sahel. This is evident in the negative moisture anomalies over the Sahel and the increase in moisture over the coastal regions during MCS days, which can result in less convective activities over the Sahel region and more convective activities over coastal areas.
We now consider low-level temperature anomalies to detect potential changes in temperature gradients and SHL strength on MCS days. Figure 10 shows a widespread increase in temperature north of SWA during days with active convection in the dry- (1, 4, 7) and transition-season (2, 8) nodes, which may explain strengthened south-westerly wind anomalies in some of these nodes (cf. Fig. 9). The SWA region in the dry- and transition-season nodes, on the other hand, reveals a negative and/or insignificant change in temperature during MCS days when compared with the mean climatology. In monsoon-season nodes 3, 6, and 9, temperatures are enhanced in most parts of West Africa including SWA during days with active convection.
Figure 11 shows the spatial distribution of the zonal wind shear anomaly between days with convective MCSs over SWA and the climatological zonal wind shear mean for the nine different nodes across West Africa. Generally, all dry- and transition-season nodes except node 5 reveal a widespread increase in easterly zonal wind shear anomaly over West Africa, with the dry-season nodes depicting stronger events. Zonal wind shear anomalies tend to be stronger and easterly during the dry season with their peak partly over SWA but reside to the north of SWA during the transition seasons (nodes 2 and 8). The positive shear anomaly patterns align with patterns of strengthened temperature gradients for respective dry- and transition-season nodes (cf. Fig. 10): only node 5 shows no large-scale temperature anomalies and consequently patchy changes in shear, while the strongest shear increases occur for node 7 alongside the highest temperature gradient increase. Nodes 2 and 8 experience an appreciably significant increase in easterly zonal wind shear over SWA for MCS days during the transition seasons. The monsoon-season nodes (3, 6, 9), on the other hand, exhibit a significant increase in easterly zonal wind shear mainly confined to the south with a pronounced signal in node 9 associated with a peak in eastern Sahel warming (Fig. 10). In line with the expected zonal wind shear response to an increased large-scale meridional temperature gradient, we thus find the strongest easterly zonal wind shear anomalies for nodes with the strongest positive low-level temperature anomalies to the north of SWA (nodes 1, 4, 7; followed by nodes 2, 8), highlighting that a warmer Sahel can promote MCS-favourable shear conditions in SWA.
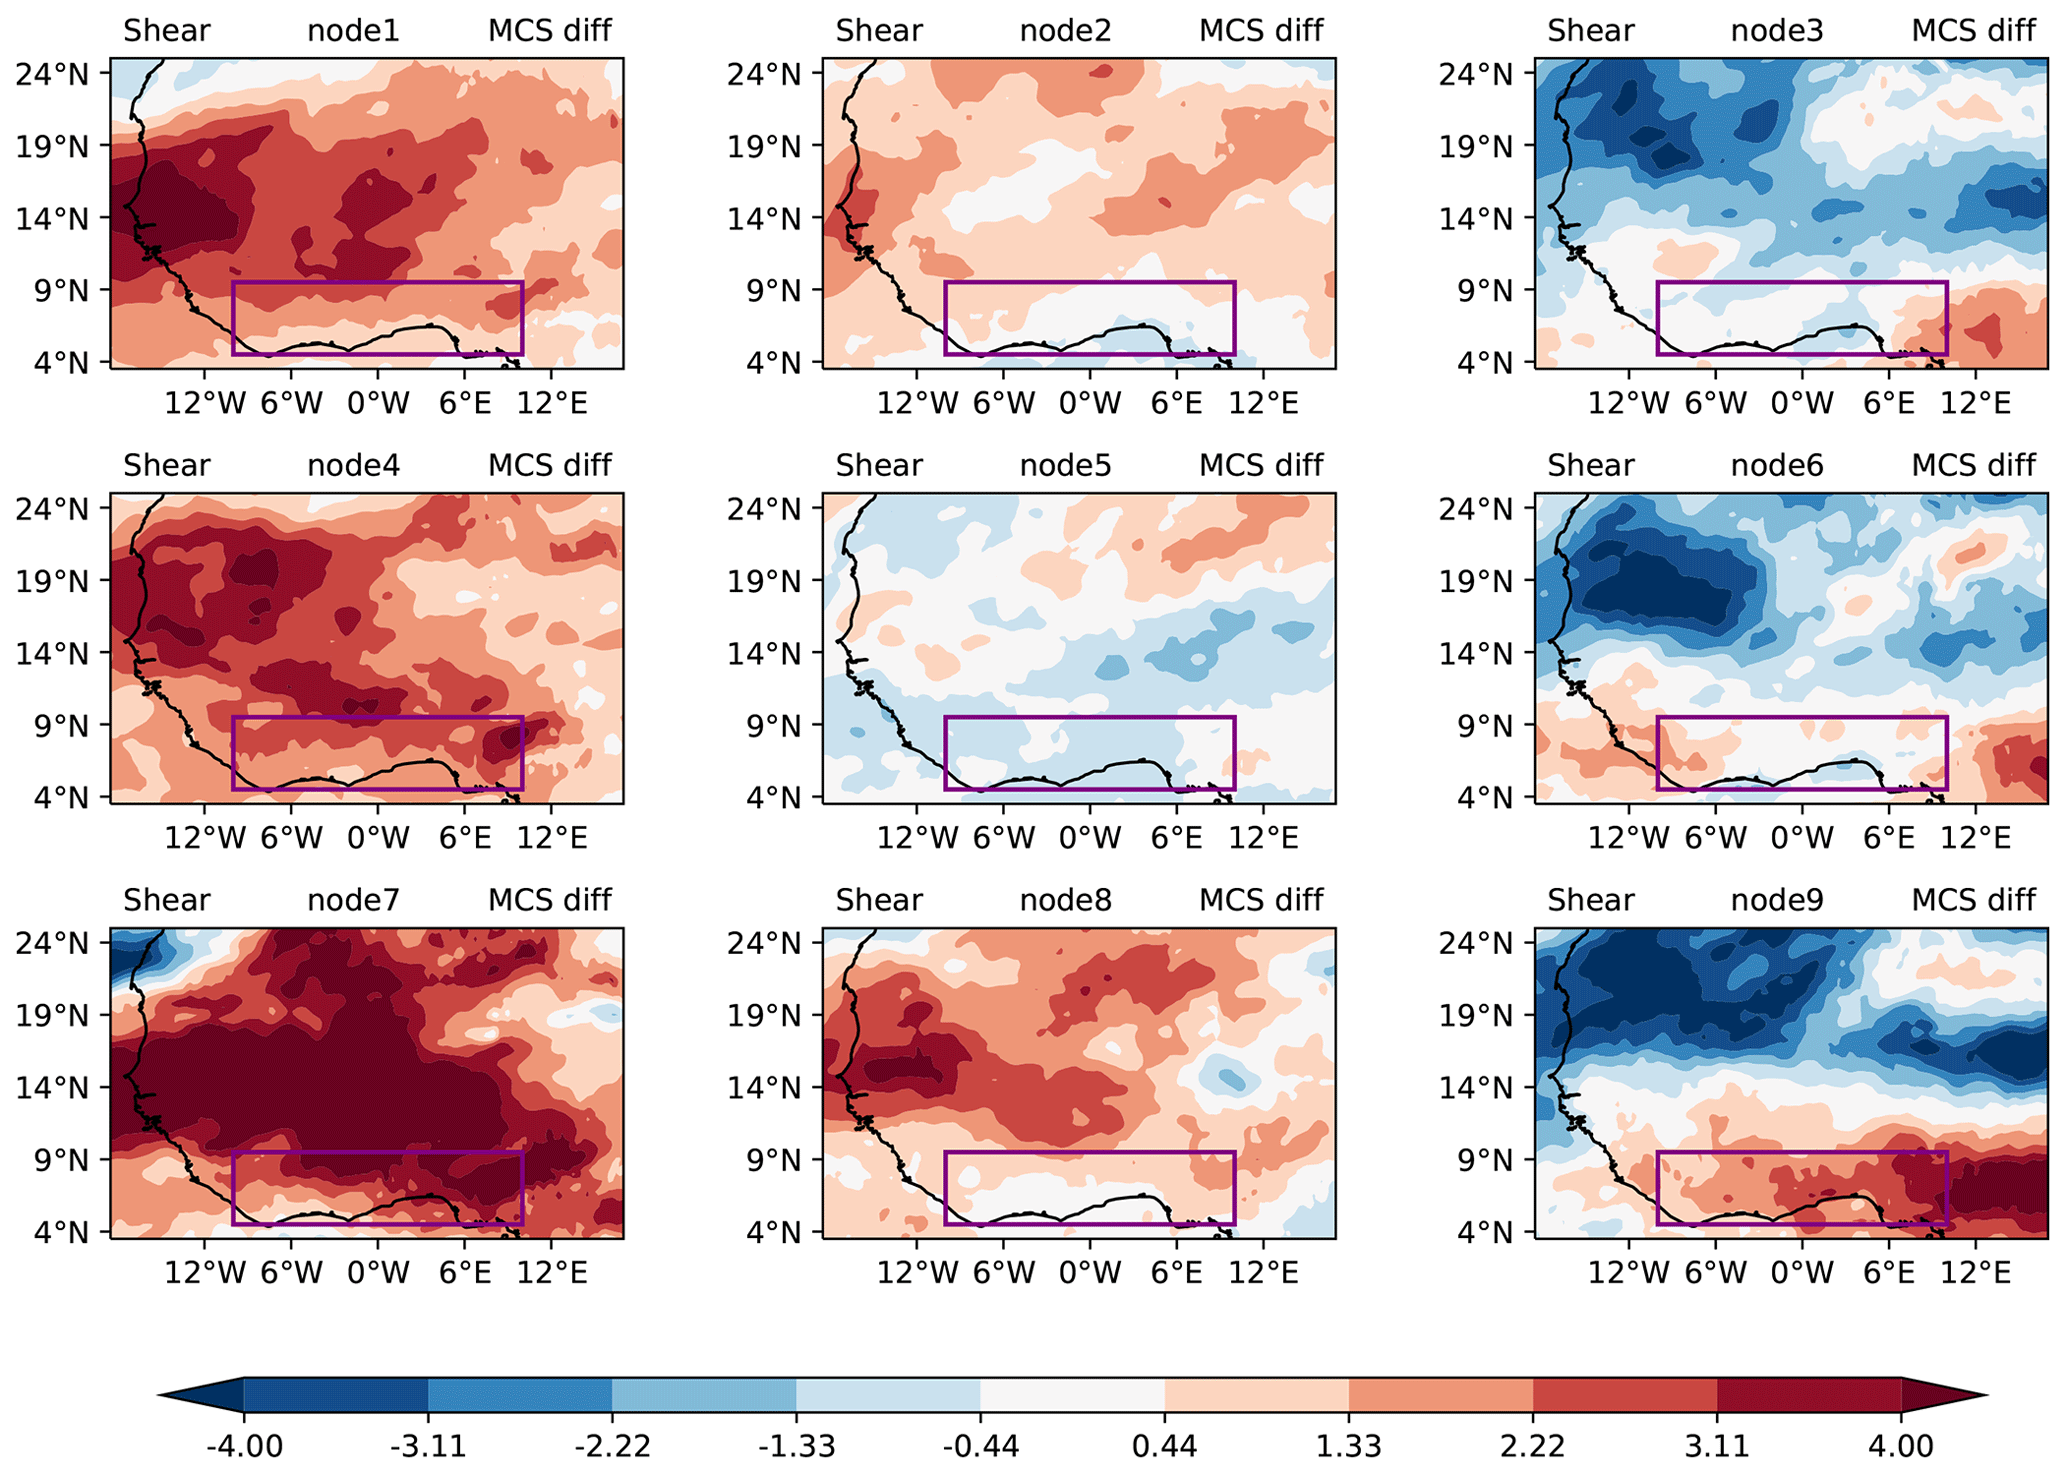
Figure 11The 12:00 UTC composite anomalies of zonal wind shear (m s−1) in nine nodes based on SOM analysis. Zonal wind shear anomalies are shown when they are significant at the 5 % level.
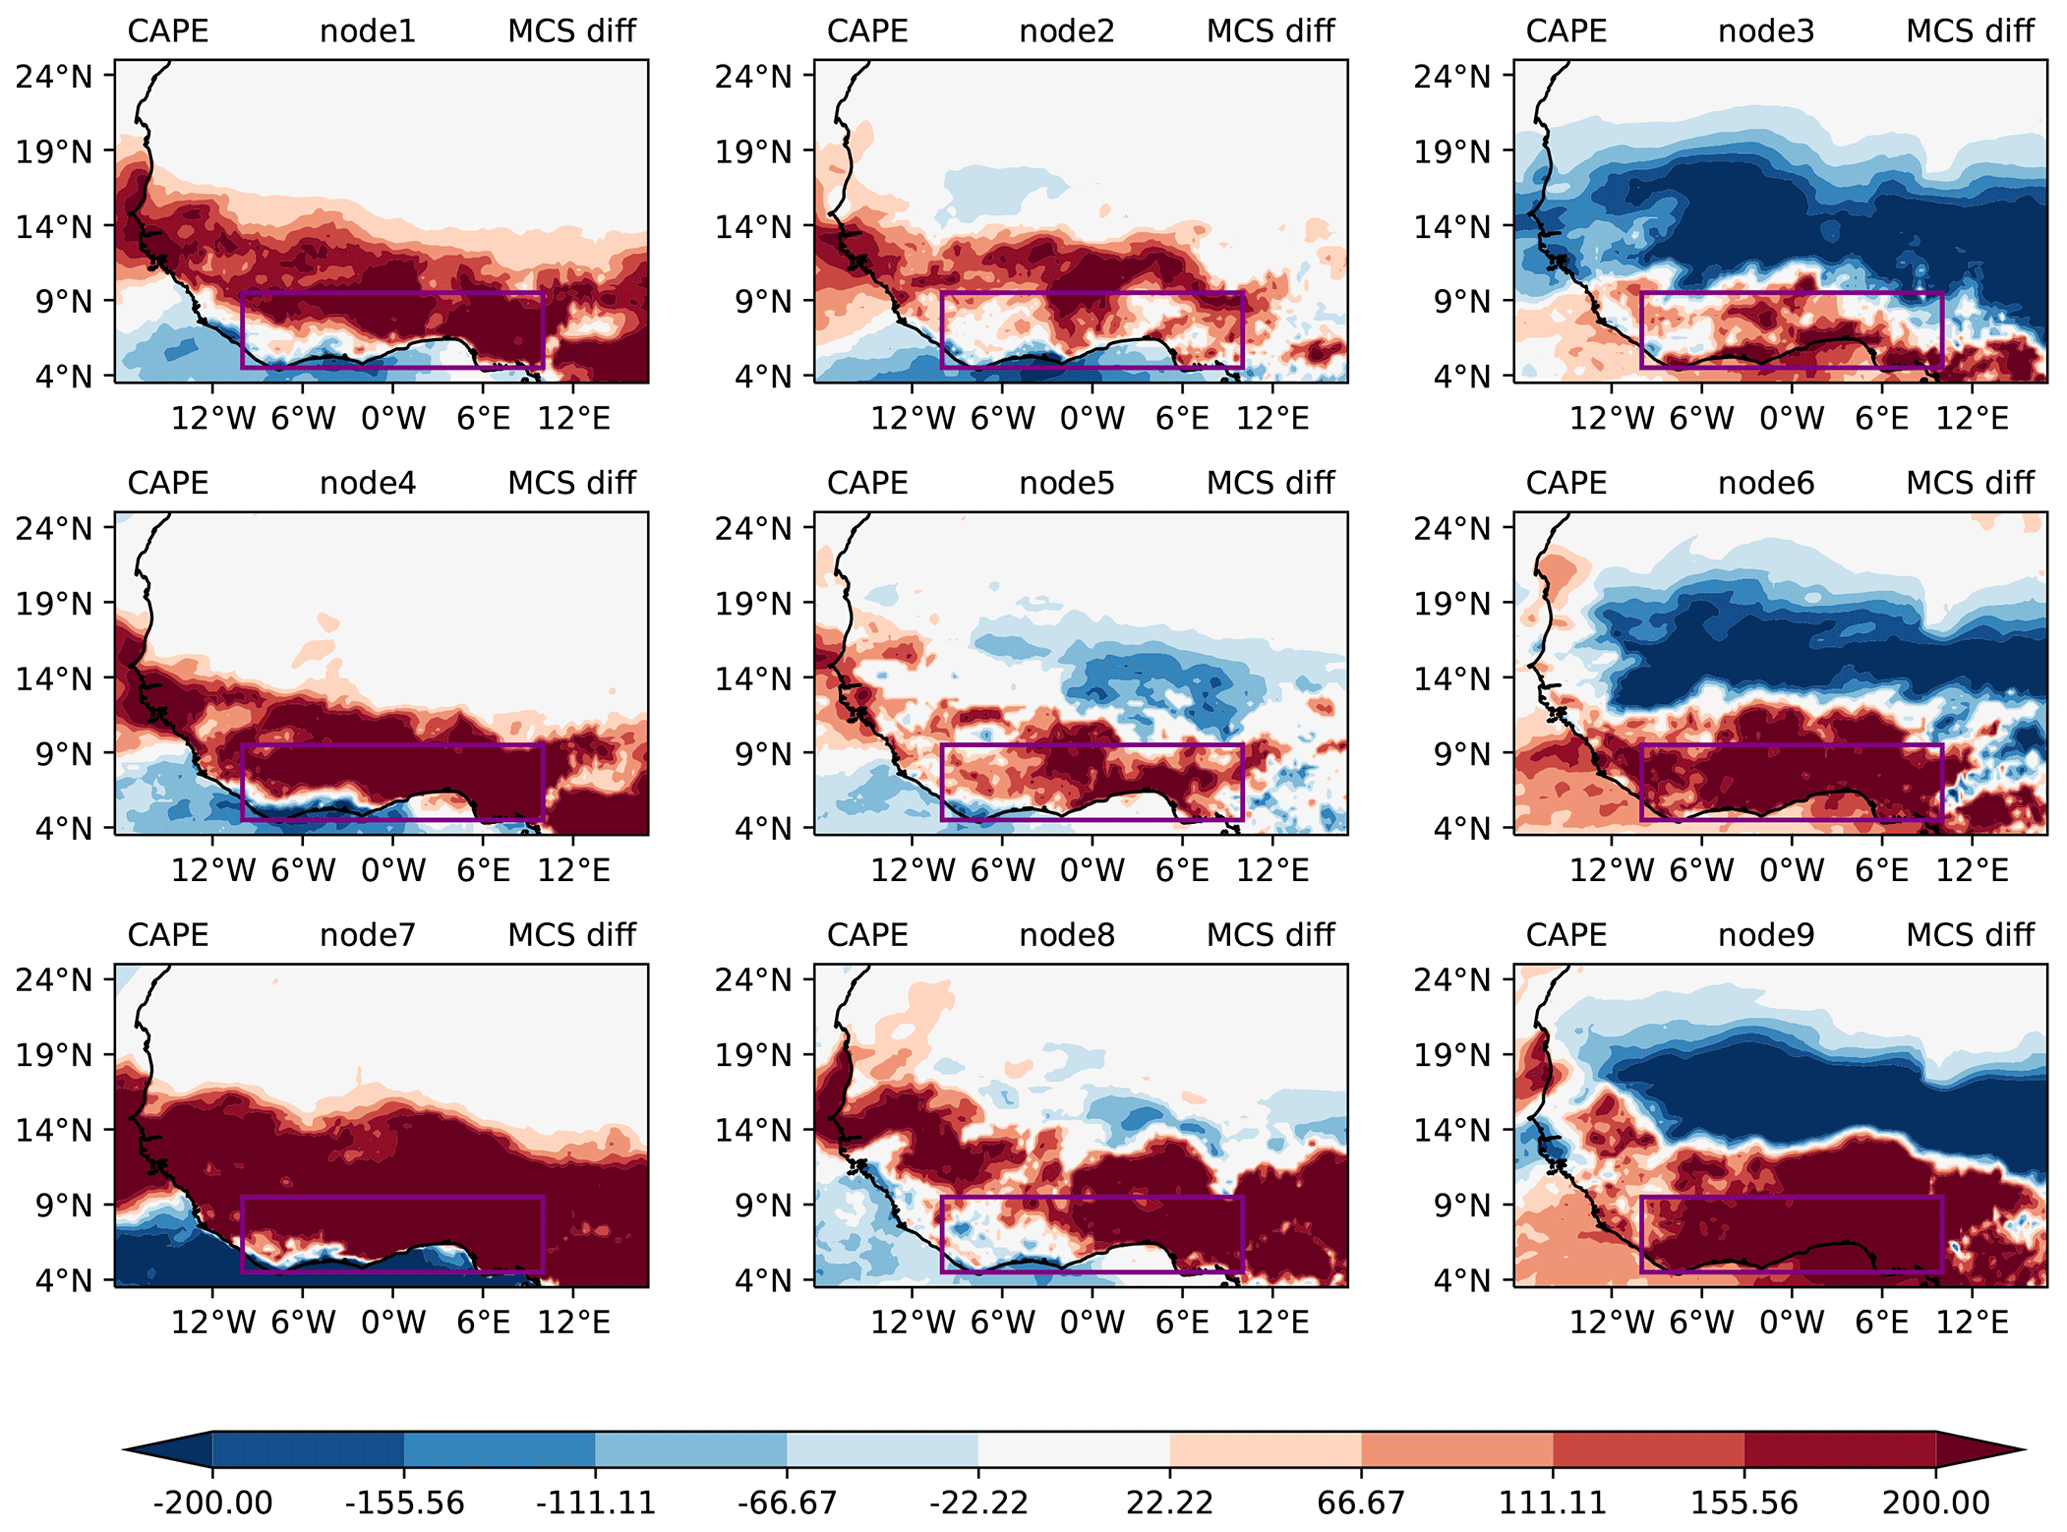
Figure 12The 12:00 UTC composite anomalies of CAPE (J kg−1) for MCSs occurring in each large-scale environment type determined by the SOM analysis over SWA. CAPE anomalies are shown when they are significant at the 5 % level.
Investigating the first-order condition for convection development, we also evaluate CAPE for a parcel at 925 hPa to ascertain the level of increased MCS-day instability in various nodes over SWA (Fig. 12). A large strip of higher CAPE values extending over the entire region of SWA and the southern Sahel from 5–15∘ N is observed (dry- and transition-season nodes). This large strip of higher CAPE is situated mainly in central SWA and east of it, while part of the western coast tends to depict patterns of lower CAPE values, suggesting increased MCS likelihood only for the central and eastern parts of the domain. During monsoon-season nodes, node 3 shows a broad strip of high CAPE values in particular at the coast and in some instances extending to the entire SWA domain (node 6) and north of SWA (node 9). Higher CAPE conditions over SWA are to differing degrees significantly associated with decreased CAPE in the Sahelian region, creating a dipole pattern that can occur during transition and monsoon periods according to node frequencies (cf. Fig. 1). Overall, all nodes show positive CAPE and negative convective inhibition (cf. Fig. S4) anomalies for MCS days in parts of SWA, creating an environment sufficiently unstable for supporting the development of convection. The close alignment with regions of increased low-level humidity (Fig. 9) suggests increased low-level moisture advection as the main driver for these instability changes.
4.3 MCS driver variability within nodes
The drivers of MCSs within different nodes are considered to examine their relative importance within the different large-scale states (Fig. 13), concentrating on total column water vapour (TCWV) and zonal wind shear. TCWV instead of single-level specific humidity is used here to capture the changes in total moisture available to MCSs under the different regimes. For this analysis, both atmospheric drivers were sampled locally under pre-convective conditions at 12:00 UTC at the location where MCSs occurred subsequently at 18:00 UTC. Dry-season nodes (1, 4, 7) exhibit the lowest climatological conditions in both wind shear and TCWV. This illustrates the relatively hostile conditions for storms in the mean for these nodes, predominantly representing dry-season conditions and explaining the low storm frequency of only 0.6–1.7 MCSs per day (cf. Fig. 9). All monsoon-season nodes (3, 6, 9) show on average slightly higher TCWV than transition-season nodes (2, 5, 8), but they cover a similar range of shear conditions. Considering MCS-day conditions, most nodes feature significantly higher TCWV and shear conditions relative to the climatological-mean node states. Solely for monsoon-season nodes (3, 6, 9), TCWV shows no significant change, while shear still increases for nodes 6 and 9. Note that while monsoon months feature higher TCWV and similar shear conditions compared to transition-season nodes for MCS location climatologies in Fig. 13, a larger domain area is affected by MCS-favourable conditions for transition-season nodes (cf. Figs. 5 and 6). As a consequence, transition-season nodes exhibit higher overall MCS frequencies. Interestingly, for MCS days, dry-season node conditions even move into the ranges of climatological conditions identified for transition-season nodes, though they still exhibit the lowest values in TCWV and zonal wind shear compared to MCS-day conditions of transition- and monsoon-season nodes.
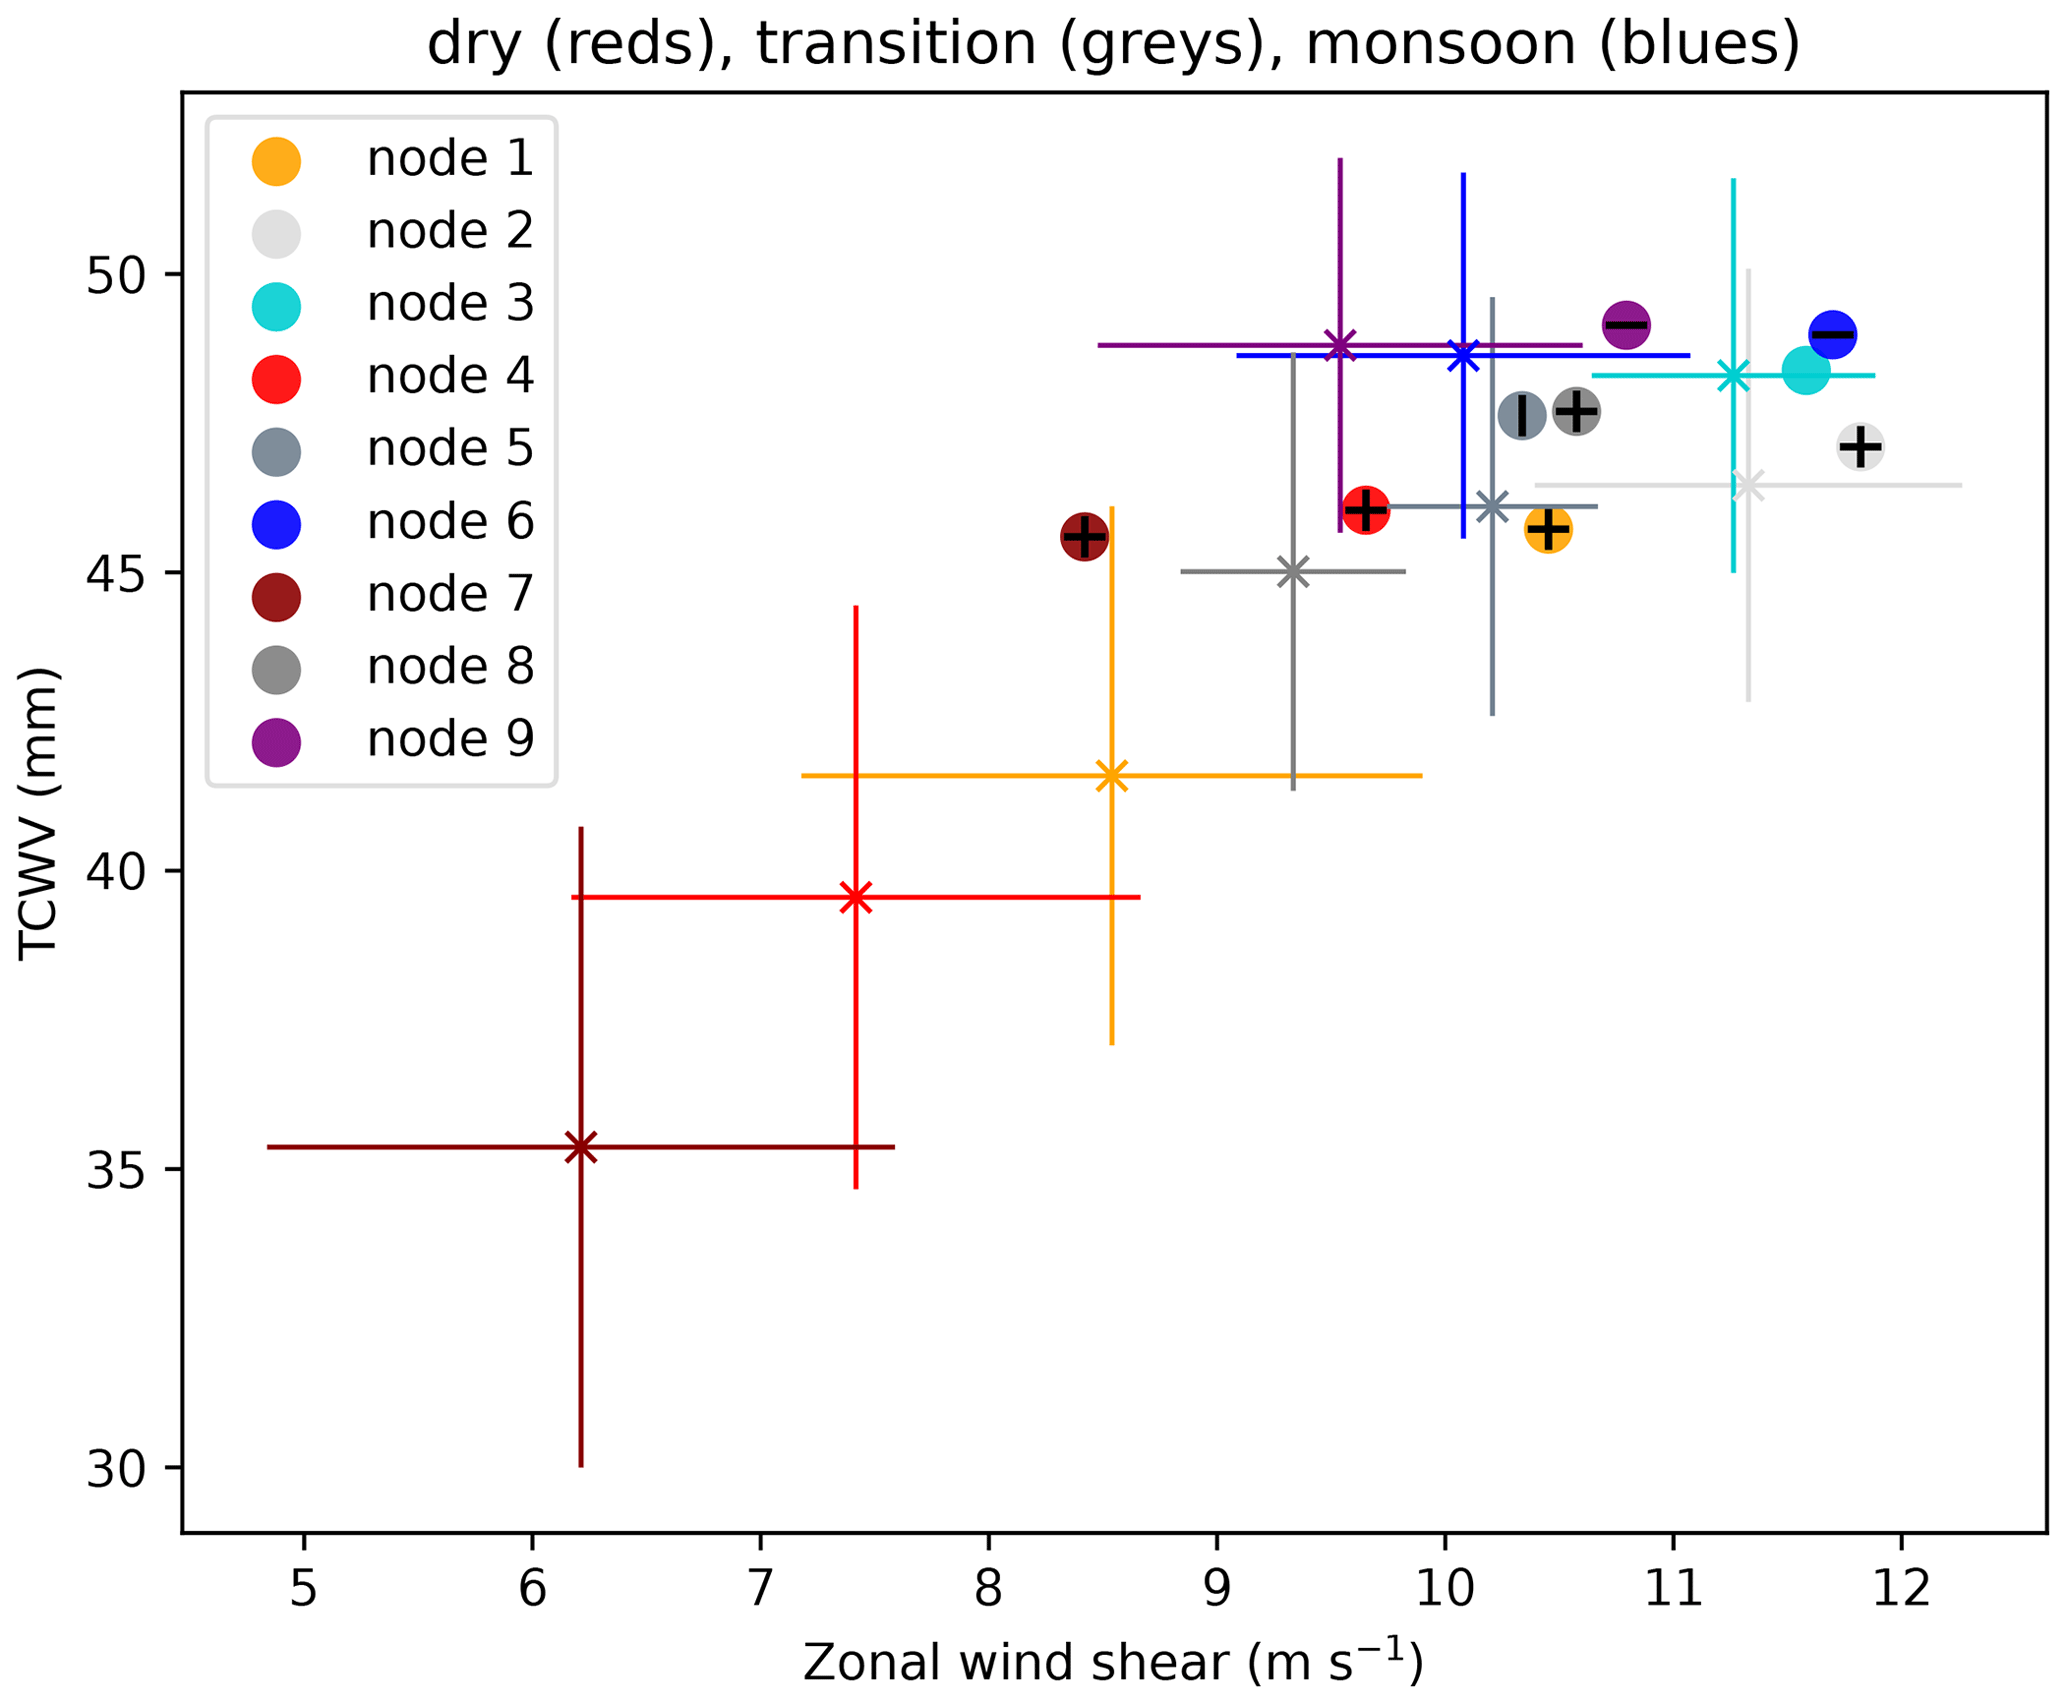
Figure 13Mean node climatologies and MCS-day conditions over SWA. The node climatologies are depicted as × with whiskers extending 1 standard deviation. Circles denote corresponding mean MCS-day conditions. Horizontal black lines in the circles indicate significant differences in the shear mean, while a vertical black line marks a significant difference in the TCWV mean against node climatologies based on Welch's t tests (p<0.05).
Generally, it can be noted that all nodes show increased TCWV on MCS days compared to their climatology. The smallest changes for both TCWV and zonal wind shear between climatology and MCS days occur for node 3, which has its highest frequency for the pre-monsoon transition month of May but is still common throughout the monsoon season (cf. Fig. 1). Together with node 5, it is also the only node for which zonal wind shear conditions remain approximately similar but with climatological zonal wind shear strengths already reaching >10 m s−1 at the MCS location. Overall, mean node environmental conditions become more similar for MCS days relative to the climatologies, illustrating that favourable MCS conditions converge towards environments of high TCWV and high zonal wind shear irrespective of the large-scale situation.
In this study, we identified nine synoptic states over West Africa and examined what changes are associated with favourable MCS environments in southern West Africa under these states. For the definition of synoptic states and MCS days, we used self-organizing maps (SOMs) based on ERA5 925 hPa geopotential height data and 12 years of MCS imagery using Meteosat Second Generation (MSG) 10.8 µm band brightness temperature data (2004–2015), respectively. To investigate how the distinct synoptic states change to support MCS development in SWA, we compared mean climatological node states to node sub-samples of MCS days in SWA.
We found the identified synoptic states, based on a 3×3 SOM matrix, to exhibit frequency distributions that are linked to different phases of the West African seasonal rainfall cycle, which we classified as the dry (nodes 1, 4, 7), transition (nodes 2, 5, 8), and monsoon (nodes 3, 6, 9) seasons, although most nodes are not strictly confined to one season. We found that different nodes identified within one season exhibit key differences in persistence (consecutive node days) and node succession. Specifically, each season (dry, transition, monsoon) contains a node that is frequently preceded or followed by a node of another season (nodes 1, 2, 3), as well as a node that predominantly shows within-season succession (nodes 7, 8, 9). The shortest node persistence of 1.7–1.9 d was found for nodes 4, 5, and 6. These nodes at the same time represent intermediate synoptic states that develop from or into a different node of the same season. The SOM methodology thus seems to be a promising approach to identify states of variability beyond the established West African monsoon phases (e.g. Thorncroft et al., 2011).
In spite of these clear differences in node persistence and succession, large-scale differences in node climatologies of atmospheric MCS drivers (low-level wind field, 925 hPa humidity, temperature, CAPE) are most pronounced between nodes of different seasons, while same-season nodes show strong pattern similarities. Notably, however, MCS-day node anomalies, as compared to full node climatologies, all show clear increases in low-level humidity and/or wind shear over the SWA region, which are important ingredients for MCS development (Klein et al., 2021). For dry-season nodes, these changes are associated with higher temperatures in the Sahel and Sahara, driving stronger south-westerly humid winds inland while increasing shear due to an enhanced meridional temperature gradient on land. Monsoon-season nodes on the other hand show the opposite, where a weakening of the south-westerlies and of the Sahelian low-level westerly jet indicates a southward shift in the monsoon circulation. This results in more moisture, and for nodes 6 and 9 also in higher shear, over SWA, where the latter is linked to a warmer and drier Sahel during monsoonal southward shifts, creating a dipole pattern. Generally, we find the strongest MCS-day zonal wind shear anomalies over SWA for nodes with the strongest low-level temperature anomalies to the north of SWA, representative of favourable MCS conditions in SWA during periods of a warmer Sahel. Strengthened wind shear due to a warmer Sahara was previously also identified as driving MCS intensification in the Sahel (Taylor et al., 2017).
Thus, meridional displacements of the extent to which south-westerly winds from the Atlantic penetrate inland and the associated positioning of the meridional temperature gradient seem to be key mechanisms by which MCS days in SWA are created for both dry- and monsoon-season node synoptic states. Such meridional displacements have previously been identified as important drivers of monsoon variability on inter-annual (e.g. Nicholson and Webster, 2007) and intra-seasonal (e.g. Janicot et al., 2011; Talib et al., 2022) timescales. Here, we are looking at higher-frequency changes with average node persistence between 1.7–4.3 d. Transition-season nodes show weaker signals and a mixture of a southward- (node 5) or northward-displaced (node 8) circulation, which may be linked to the fact that these nodes predominantly occur in months when the monsoon circulation and its rainfall band are positioned over SWA (Maranan et al., 2018). Indeed, we find MCSs to be most likely to develop under transition-season node conditions (2.8 MCSs per day across the SWA domain). There is strong potential for further exploration of the synoptic differences between transition-season nodes and their meridional shifts on MCS days, as these may in some cases be representative of monsoon onset conditions or a delayed monsoon retreat.
Pre-convective atmospheric anomalies at locations where afternoon development of MCSs took place were found to be weakest for transition-season node 5, lacking significant changes in wind shear, and for monsoon-season nodes 3, 6, and 9, for which none showed significant changes in total column moisture, although increased moisture at low-levels contributes to elevated CAPE. Here it should be noted that weak anomalies signify nodes whose mean climatological conditions already tend to be more favourable for MCS development with respect to that variable such that MCS days differ little from the node mean, which, perhaps expectedly, is the case for certain transition and monsoon rather than dry-season nodes.
Generally, however, we find node environmental conditions to become more similar for MCS days relative to their node climatologies, illustrating that favourable MCS conditions converge towards states of high TCWV and high zonal wind shear. Overall, our results show that MCSs develop on average in environments of high moisture and high zonal wind shear local under all large-scale situations throughout the year. The large-scale situation however defines the frequency at which favourable MCS environments can occur.
Codes for the findings of this study are available upon reasonable request from the authors. Processing of ERA5 data was enabled via direct access to the primary data archive held at ECMWF, available from the Copernicus Data Store (https://doi.org/10.24381/cds.bd0915c6, Hersbach et al., 2023), and the MSG data are available at https://navigator.eumetsat.int/product/EO:EUM:DAT:0156 (EUMETSAT, 2021). Processed ERA-Interim data and MSG data used for the analyses of the mesoscale convective system are available at https://doi.org/10.5281/zenodo.8192395 (Nkrumah, 2023).
The supplement related to this article is available online at: https://doi.org/10.5194/wcd-4-773-2023-supplement.
FN, NABK, and CK conceptualized the study, with input from KAQ. All authors contributed to and discussed the methodological design, and analyses were conducted by FN and CK. FN, ROB, and KAQ wrote the manuscript draft. CK, NABK, PE, GMLDQ, and HAK reviewed and edited the manuscript.
The contact author has declared that none of the authors has any competing interests.
Publisher's note: Copernicus Publications remains neutral with regard to jurisdictional claims in published maps and institutional affiliations.
We would like to thank Yonatan Givon and the anonymous reviewer for their insightful and supportive comments.
This work is supported by a grant from the government of Canada, provided through Global Affairs Canada (https://www.international.gc.ca/, last access: 1 January 2021) and the International Development Research Centre (https://idrc-crdi.ca/en, last access: 1 June 2022) to the Next Einstein Initiative of the African Institute for Mathematical Sciences (AIMS-NEI) (grant no. 108246-001). Cornelia Klein received funding from the NERC-funded (Natural Environment Research Council) Land Impacts on Mesoscale Convective Systems (LMCS) project (no. NE/W001888/1). Kwesi Akumenyi Quagraine also received funding from the National Research Foundation (NRF), South Africa.
This paper was edited by Shira Raveh-Rubin and reviewed by Yonatan Givon and one anonymous referee.
Alfaro, D. A.: Low-Tropospheric Shear in the Structure of Squall Lines: Impacts on Latent Heating under Layer-Lifting Ascent, J. Atmos. Sci., 74, 229–248, https://doi.org/10.1175/JAS-D-16-0168.1, 2017.
Acheampong, P. K.: Rainfall anomaly along the coast of Ghana – Its nature and causes, Geogr. Ann. A, 64, 199–211, https://doi.org/10.1080/04353676.1982.11880066, 1982.
Augustin, D., Pascal, I. M., Jores, T. K., Elisabeth, F. D., Cesar, M. B., Michael, T. F., Roméo-Ledoux, D. T., Marceline, M., Gladys, K. N. F., and Firmin, B. A.: Impact Assessment of the West African Monsoon on Convective Precipitations over the Far North Region of Cameroon, Adv. Space Res., 72, 666–676, https://doi.org/10.1016/j.asr.2022.04.044, 2023.
Baidu, M., Schwendike, J., Marsham, J. H., and Bain, C.: Effects of Vertical Wind Shear on Intensities of Mesoscale Convective Systems over West and Central Africa, Atmos. Sci. Lett., 23, e1094, https://doi.org/10.1002/asl.1094, 2022.
Bayo Omotosho, J.: The separate contributions of line squalls, thunderstorms and the monsoon to the total rainfall in Nigeria, J. Climatol., 5, 543–552, https://doi.org/10.1002/joc.3370050507, 1985.
Biasutti, M., Sobel, A. H., and Camargo, S. J.: The role of the Sahara low in summertime Sahel rainfall variability and change in the CMIP3 models, J. Climate, 22, 5755–5771, https://doi.org/10.1175/2009JCLI2969.1, 2009.
Cassano, E. N., Glisan, J. M., Cassano, J. J., Gutowski Jr., W. J., and Seefeldt, M. W.: Self-Organizing Map Analysis of Widespread Temperature Extremes in Alaska and Canada, Clim. Res., 62, 199–218, https://doi.org/10.3354/cr01274, 2015.
Chen, Y., Luo, Y., and Liu, B.: General Features and Synoptic-Scale Environments of Mesoscale Convective Systems over South China during the 2013–2017 Pre-Summer Rainy Seasons, Atmos. Res., 266, 105954, https://doi.org/10.1016/j.atmosres.2021.105954, 2022.
EUMETSAT: High Rate SEVIRI Level 1.5 Image Data – MSG – 0 degree, EUMETSAT [data set], https://navigator.eumetsat.int/product/EO:EUM:DAT:MSG:HRSEVIRI (last access: 25 August 2021), 2021.
Feng, Z., Leung, L. R., Liu, N., Wang, J., Houze Jr., R. A., Li, J., Hardin, J. C., Chen, D., and Guo, J. A.: Global High-Resolution Mesoscale Convective System Database Using Satellite-Derived Cloud Tops, Surface Precipitation, and Tracking, J. Geophys. Res.-Atmos. 126, e2020JD034202, https://doi.org/10.1029/2020JD034202, 2021.
Fink, A. H., Vincent, D. G., and Ermert, V.: Rainfall types in the West African Sudanian zone during the summer monsoon 2002, Mon. Weather Rev., 134, 2143–2164, https://doi.org/10.1175/MWR3182.1, 2006.
Guo, Y., Du, Y., Lu, R., Feng, X., Li, J., Zhang, Y., and Mai, Z.: The characteristics of mesoscale convective systems generated over the Yunnan-Guizhou Plateau during the warm seasons. Int. J. Climatol., 42, 7321–7341, https://doi.org/10.1002/joc.7647, 2022.
Guy, N., Rutledge, S. A., and Cifelli, R.: Radar Characteristics of Continental, Coastal, and Maritime Convection Observed during AMMA/NAMMA, Q. J. Roy. Meteorol. Soc., 137, 1241–1256, https://doi.org/10.1002/qj.839, 2011.
Hagos, S. M. and Cook, K. H.: Dynamics of the West African Monsoon Jump, J. Climate, 20, 5264–5284, https://doi.org/10.1175/2007JCLI1533.1, 2007.
Hersbach, H., Bell, B., Berrisford, P., Biavati, G., Horányi, A., Muñoz Sabater, J., Nicolas, J., Peubey, C., Radu, R., Rozum, I., Schepers, D., Simmons, A., Soci, C., Dee, D., and Thépaut, J.-N.: ERA5 hourly data on pressure levels from 1940 to present, Copernicus Climate Change Service (C3S) Climate Data Store (CDS) [data set], https://doi.org/10.24381/cds.bd0915c6, 2023.
Hersbach, H., Bell, B., Berrisford, P., Hirahara, S., Horányi, A., Muñoz‐Sabater, J., and Thépaut, J. N.: The ERA5 global reanalysis, Q. J. Roy. Meteor. Soc., 146, 1999–2049, https://doi.org/10.1002/qj.3803, 2020.
Hewitson, B. C. and Crane, R. G.: Climate Downscaling: Techniques and Application, Clim. Res., 7, 85–95, https://doi.org/10.3354/cr007085, 1996.
Hewitson, B. C. and Crane, R. G.: Self-Organizing Maps: Applications to Synoptic Climatology, Clim. Res., 22, 13–26, https://doi.org/10.3354/cr022013, 2002.
Hodges, K. I. and Thorncroft, C. D.: Distribution and Statistics of African Mesoscale Convective Weather Systems Based on the ISCCP Meteosat Imagery, Mon. Weather Rev., 125, 2821–2837, https://doi.org/10.1175/1520-0493(1997)125<2821:DASOAM>2.0.CO;2, 1997.
Houze Jr., R. A.: Mesoscale Convective Systems, Rev. Geophys., 42, RG4003, https://doi.org/10.1029/2004RG000150, 2004.
Huffman, G. J., Stocker, E. F., Bolvin, D. T., Nelkin, E. J., and Tan, J.: GPM IMERG Final Precipitation L3 Half Hourly 0.1 degree x 0.1 degree V06, Greenbelt, MD, GES DISC [data set], https://doi.org/10.5067/GPM/IMERG/3B-HH/06, 2019.
IPCC: Climate Change, 2014: Synthesis Report, in: Contribution of Working groups I, II, and III to the Fifth Assessment Report of the Intergovernmental Panel on Climate Change, edited by: Core Working Team, Pachauri, R. K., and Meyer, L. A., IPCC, Geneva, Switzerland, 151 pp. https://doi.org/10013/epic.45156.d001, 2014.
Janicot, S., Caniaux, G., Chauvin, F., De Coëtlogon, G., Fontaine, B., Hall, N., Kiladis, G., Lafore, J.-P., Lavaysse, C., Lavender, S. L., Leroux, S., Marteau, R., Mounier, F., Philippon, N., Roehrig, R., Sultan, B., and Taylor, C. M.: Intraseasonal variability of the West African monsoon, Atmos. Sci. Lett., 12, 58–66, https://doi.org/10.1002/asl.280, 2011.
Janiga, M. A. and Thorncroft, C. D.: The Influence of African Easterly Waves on Convection over Tropical Africa and the East Atlantic, Mon. Weather Rev., 144, 171–192, https://doi.org/10.1175/MWR-D-14-00419.1, 2016.
Kamara, S. I.: The Origins and Types of Rainfall in West Africa, Weather, 41, 48–56, https://doi.org/10.1002/j.1477-8696.1986.tb03787.x, 1986.
Kim, H. K. and Seo, K. H.: Cluster Analysis of Tropical Cyclone Tracks over the Western North Pacific Using a Self-Organizing Map, J. Climate, 29, 3731–3751, https://doi.org/10.1175/JCLI-D-15-0380.1, 2016.
Klein, C., Belušić, D., and Taylor, C. M.: Wavelet scale analysis of mesoscale convective systems for detecting deep convection from infrared imagery, J. Geophys. Res.-Atmos., 123, 3035–3050, https://doi.org/10.1002/2017JD027432, 2018.
Klein, C., Nkrumah, F., Taylor, C. M., and Adefisan, E. A.: Seasonality and Trends of Drivers of Mesoscale Convective Systems in Southern West Africa, J. Climate, 34, 71–87, https://doi.org/10.1175/JCLI-D-20-0194.1, 2021.
Kohonen, T.: Self-organized formation of topologically correct feature maps, Biol. Cybern., 43, 59–69, https://doi.org/10.1007/BF00337288, 1982.
Kohonen, T.: Self-Organizing Maps.-Springer Series in Information Sciences, in: V. 30, Springer Sci. Rev., https://doi.org/10.1007/978-3-642-56927-2, 2001.
Laing, A. G., Carbone, R., Levizzani, V., and Tuttle, J.: The Propagation and Diurnal Cycles of Deep Convection in Northern Tropical Africa, Q. J. Roy. Meteorol. Soc., 134, 93–109, https://doi.org/10.1002/qj.194, 2008.
Lavaysse, C., Flamant, C., Janicot, S., Parker, D. J., Lafore, J. P., Sultan, B., and Pelon, J.: Seasonal Evolution of the West African Heat Low: A Climatological Perspective, Clim. Dynam., 33, 313–330, https://doi.org/10.1007/s00382-009-0553-4, 2009.
Lavaysse, C., Chaboureau, J.-P., and Flamant, C.: Dust impact on the West African heat low in summertime, Q. J. Roy. Meteorol. Soc., 137, 1227–1240, https://doi.org/10.1002/qj.844, 2011.
Le Barbé, L., Lebel, T., and Tapsoba, D.: Rainfall variability in West Africa during the years 1950–90, J. Climate, 15, 187–202, https://doi.org/10.1175/1520-0442(2002)015<0187:RVIWAD>2.0.CO;2, 2002.
Lee, C. C.: Reanalysing the impacts of atmospheric teleconnections on cold‐season weather using multivariate surface weather types and self‐organizing maps, Int. J. Climatol., 37, 3714–3730, https://doi.org/10.1016/j.scitotenv.2018.02.163, 2017.
Lennard, C. and Hegerl, G.: Relating changes in synoptic circulation to the surface rainfall response using self-organising maps, Clim. Dynam., 44, 861–879, https://doi.org/10.1007/s00382-014-2169-6, 2015.
Li, P., Moseley, C., Prein, A. F., Chen, H., Li, J., Furtado, K., and Zhou, T.: Mesoscale Convective System Precipitation Characteristics over East Asia. Part I: Regional Differences and Seasonal Variations, J. Climate, 33, 9271–9286, https://doi.org/10.1175/JCLI-D-20-0072.1, 2020.
Maranan, M., Fink, A. H., and Knippertz, P.: Rainfall Types over Southern West Africa: Objective Identification, Climatology and Synoptic Environment, Q. J. Roy. Meteorol. Soc., 144, 1628–1648, https://doi.org/10.1002/qj.3345, 2018.
Mohr, K. I. and Thorncroft, C. D.: Intense Convective Systems in West Africa and Their Relationship to the African Easterly Jet, Q. J. Roy. Meteorol. Soc., 132, 163–176, https://doi.org/10.1256/qj.05.55, 2006.
Mohr, K. I. and Zipser, E. J.: Mesoscale convective systems defined by their 85-GHz ice scattering signature: Size and intensity comparison over tropical oceans and continents, Mon. Weather Rev., 124, 2417–2437, https://doi.org/10.1175/1520-0493(1996)124<2417:MCSDBT>2.0.CO;2, 1996.
Nesbitt, S. W., Cifelli, R., and Rutledge, S. A.: Storm Morphology and Rainfall Characteristics of TRMM Precipitation Features, Mon. Weather Rev., 134, 2702–2721, https://doi.org/10.1175/MWR3200.1, 2006.
Nkrumah, F.: Materials for Nkrumah et al. 2023 “Classification of large-scale environments that drive the formation of mesoscale convective systems over southern West Africa”, Zenodo [data set], https://doi.org/10.5281/zenodo.8192395, 2023.
Nicholson, S. E. and Webster, P. J.: A physical basis for the interannual variability of rainfall in the Sahel, Q. J. Roy. Meteorol. Soc., 133, 2065–2084, https://doi.org/10.1002/qj.104.
Quagraine, K. A., Hewitson, B., Jack, C., Pinto, I., and Lennard, C.: A methodological approach to assess the co-behavior of climate processes over southern Africa, J. Clim., 32, 2483–2495, https://doi.org/10.1175/JCLI-D-18-0689.1, 2019.
Reusch, D. B., Alley, R. B., and Hewitson, B. C.: Relative performance of self-organizing maps and principal component analysis in pattern extraction from synthetic climatological data, Polar Geography, 29, 188–212, https://doi.org/10.1080/789610199, 2005.
Rousi, E., Anagnostopoulou, C., Tolika, K., and Maheras, P.: Representing teleconnection patterns over Europe: A comparison of SOM and PCA methods, Atmos. Res., 152, 123–137, https://doi.org/10.1016/j.atmosres.2013.11.010, 2015.
Schmetz, J., Pili, P., Tjemkes, S., Just, D., Kerkmann, J., Rota, S., and Ratier, A.: An Introduction to Meteosat Second Generation (MSG), B. Am. Meteorol. Soc., 83, 977–992, https://doi.org/10.1175/1520-0477(2002)083<0977:AITMSG>2.3.CO;2, 2002.
Schrage, J. M., Fink, A. H., Ermert, V., and Ahlonsou, E. D.: Three MCS Cases Occurring in Different Synoptic Environments in the Sub-Sahelian Wet Zone during the 2002 West African Monsoon, J. Atmos. Sci., 63, 2369–2382, https://doi.org/10.1175/JAS3757.1, 2006.
Sheridan, S. and Lee, C. C.: Synoptic Climatology and the Analysis of Atmospheric Teleconnections, Prog. Phys. Geogr., 36, 548–557, https://doi.org/10.1177/0309133312447935, 2012.
Song, F., Feng, Z., Leung, L. R., Houze Jr., R. A., Wang, J., Hardin, J., and Homeyer, C. R.: Contrasting spring and summer large-scale environments associated with mesoscale convective systems over the US Great Plains, J. Climate, 32, 6749–6767, https://doi.org/10.1175/JCLI-D-18-0839.1, 2019.
Sultan, B., and Janicot, S.: The West African monsoon dynamics. Part II: The “preonset” and “onset” of the summer monsoon, J. Climate, 16, 3407–3427, https://doi.org/10.1175/1520-0442(2003)016<3407:TWAMDP>2.0.CO;2, 2003.
Talib, J., Taylor, C. M., Klein, C., Harris, B. L., Anderson, S. R., and Semeena, V. S.: The sensitivity of the West African monsoon circulation to intraseasonal soil moisture feedbacks, Q. J. Roy. Meteorol. Soc., 148, 1709–1730, https://doi.org/10.1002/qj.4274, 2022.
Taylor, C. M., Belušić, D., Guichard, F., Parker, D. J., Vischel, T., Bock, O., Harris, P. P., Janicot, S., Klein, C., and Panthou, G.: Frequency of Extreme Sahelian Storms Tripled since 1982 in Satellite Observations, Nature, 544, 475–478, https://doi.org/10.1038/nature22069, 2017.
Thorncroft, C. D., Nguyen, H., Zhang, C., and Peyrille, P.: Annual cycle of the West African monsoon: Regional circulations and associated water vapour transport, Q. J. Roy. Meteorol. Soc., 137, 129–147, https://doi.org/10.1002/qj.728, 2011.
Vizy, E. K. and Cook, K. H.: Mesoscale Convective Systems and Nocturnal Rainfall over the West African Sahel: Role of the Inter-Tropical Front, Clim. Dynam., 50, 587–614, https://doi.org/10.1007/s00382-009-0553-4, 2018.
Vollmert, P., Fink, A. H., and Besler, H.: “Ghana Dry Zone” und “Dahomey Gap”: Ursachen für eine Niederschlagsanomalie im tropischen Westafrika, Erde, 134, 375–393, 2003.
Wolski, P., Jack, C., Tadross, M., van Aardenne, L., and Lennard, C.: Interannual Rainfall Variability and SOM-Based Circulation Classification, Clim. Dynam., 50, 479–492, https://doi.org/10.1007/s00382-017-3621-1, 2018.