the Creative Commons Attribution 4.0 License.
the Creative Commons Attribution 4.0 License.
 | 16 Jan 2023
Increased vertical resolution in the stratosphere reveals role of gravity waves after sudden stratospheric warmings
Inna Polichtchouk
Daniela I. V. Domeisen
Sudden stratospheric warmings (SSWs) have a long-lasting effect within the stratosphere as well as impacts on the underlying troposphere. However, sub-seasonal forecasts of the winter polar stratosphere fail to use their full potential for predictability as they tend to underestimate the magnitude and persistence of these events already within the stratosphere. The origin of this underestimation is unknown. Here, we demonstrate that the associated polar stratospheric cold bias following SSW events in sub-seasonal hindcasts can be halved by increasing vertical model resolution, suggesting a potential sensitivity to gravity wave forcing. While the predictability of the planetary Rossby wave flux into the stratosphere at lead times longer than a week is limited, the existence of a critical layer for gravity waves with a low zonal phase speed caused by the disturbed polar vortex provides predictability to the upper stratosphere. Gravity wave breaking near that critical layer can, therefore, decelerate the zonal flow consistently with anomalous subsidence over the polar cap leading to warmer temperatures in the middle polar stratosphere. Since the spectrum of gravity waves involves vertical wavelengths of less than 4000 m, as estimated by wavelet analysis, a high vertical model resolution is needed to resolve the positive feedback between gravity wave forcing and the state of the polar vortex. Specifically, we find that at a spectral resolution of TCo639 (approximate horizontal grid spacing of 18 km) at least 198 levels are needed to correctly resolve the spectrum of gravity waves in the ECMWF Integrated Forecasting System. Increasing vertical resolution in operational forecasts will help to mitigate stratospheric temperature biases and improve sub-seasonal predictions of the stratospheric polar vortex.
- Article
(8651 KB) - Full-text XML
- BibTeX
- EndNote


Atmospheric waves entering the extra-tropical stratosphere from below comprise a wide range of spatial scales. The large-scale part of the spectrum is occupied by Rossby waves with zonal wavenumbers 1–3, often termed planetary waves. Depending on their phase speed and the zonal-mean zonal background wind, planetary waves can propagate from the troposphere into the stratosphere where they break, deposit easterly momentum, and slow down the polar vortex (e.g., Charney and Drazin, 1961; Domeisen et al., 2018). A particularly strong and sustained planetary wave flux can lead to a complete breakdown of the polar vortex, a reversal of the zonal-mean westerlies, and a rapid warming of the polar stratosphere which is termed a sudden stratospheric warming (SSW) (Matsuno, 1971; Baldwin et al., 2021). While some SSWs are associated with Rossby wave reflection and have no long-term impact (Kodera et al., 2016), the majority of events decay slowly over the course of a month or longer (Limpasuvan et al., 2004).
Gravity waves with horizontal wavelengths from ∼10 to ∼1000 km and frequencies between the Brunt–Väisälä frequency N and the inertial frequency f form the small-scale part of the spectrum (e.g., Fritts and Alexander, 2003). Typically, extra-tropical gravity waves are excited near the surface by flow over orography or in the upper troposphere by jet/front imbalances. These waves commonly propagate via the stratosphere into the mesosphere, where their amplitudes grow until the waves break. Depending on the phase speed of the waves and the velocity of the background wind, one can define a critical layer where the intrinsic frequency of the waves would approach the inertial frequency f and the vertical wavelength would approach zero (e.g., Fritts and Alexander, 2003). If such a critical layer is present, gravity waves will break somewhere below that level and deposit more momentum already in the stratosphere. Compared to planetary waves, gravity waves receive less attention in extra-tropical stratosphere studies. However, both observational and modeling studies document increased gravity wave amplitudes at the edge of the polar vortex during minor stratospheric warmings concurrently with the peak of the planetary wave flux (e.g., Duck et al., 1998; Venkat Ratnam et al., 2004; Wang and Alexander, 2009; Yamashita et al., 2010; Dörnbrack et al., 2018; Polichtchouk and Scott, 2020). During major warmings, the polar vortex breaks down and the downward propagation of the zero-wind line prevents the propagation of stationary gravity waves into the upper stratosphere and mesosphere (e.g., Wang and Alexander, 2009; Hindley et al., 2020). The absence of gravity wave breaking in the mesosphere explains the mesospheric cooling during an SSW by a relaxation to radiative equilibrium (Holton, 1983). Moreover, during Southern Hemisphere springtime polar vortex breakdown, gravity waves are found to contribute significantly to the polar vortex deceleration in the ERA5 reanalysis (Gupta et al., 2021). While recent studies consider the role of gravity waves in pre-conditioning the vortex for planetary waves before the onset of vortex split events (Albers and Birner, 2014; Song et al., 2020; Kuchar et al., 2022), the present study focuses on the effect of gravity waves on the zonal-mean zonal momentum after the central date of an SSW.
Due to their downward response (Baldwin and Dunkerton, 2001), SSWs hold great potential for sub-seasonal to seasonal prediction (Domeisen et al., 2020b), and an accurate simulation and representation of the winter stratosphere in weather and climate models is important for understanding and predicting tropospheric impacts of stratospheric variability. While SSWs can be skillfully predicted up to 2 weeks ahead (e.g., Tripathi et al., 2015a; Domeisen et al., 2020a), their magnitude is generally underestimated in sub-seasonal prediction models (e.g., Karpechko et al., 2018; Lawrence et al., 2022). This is probably at least in part due to an underestimation of the upward planetary wave flux (Wu et al., 2022). On the other hand, a connection to misrepresented gravity wave momentum fluxes is plausible as well. One potential model adjustment to improve sub-seasonal prediction is therefore an increase in vertical resolution.
Generally, vertical resolution receives less attention than horizontal resolution in atmospheric modeling studies, but it is well established that vertical resolution needs to be set in consideration of its horizontal counterpart (e.g., Lindzen and Fox-Rabinovitz, 1989; Roeckner et al., 2006; Skamarock et al., 2019). The representation of Rossby waves requires a consistent aspect ratio of the vertical and horizontal grid spacing determined by the ratio of the scale height H to the radius of deformation LR (Lindzen and Fox-Rabinovitz, 1989):
To resolve the regime of stratified turbulence at small horizontal scales, the vertical grid spacing depends primarily on the stratification and can be set following the ratio of
of the horizontal velocity scale U to the buoyancy frequency N (Waite, 2016; Cullen, 2017). For the undisturbed polar vortex, this gives a vertical grid spacing of 𝒪(1 km) in the stratosphere. For a disrupted vortex with U=0 m s−1, on the other hand, this relation would require infinite vertical resolution. The vertical wavelength of a gravity wave approaching its critical layer reduces to zero. According to Lindzen and Fox-Rabinovitz (1989), a requirement for infinite vertical resolution is only prevented by the presence of a complex phase speed, i.e., damping. Approximating the imaginary part of the phase speed using a linear damping rate σi, they postulate an aspect ratio of the vertical to the horizontal grid spacing of
However, the damping rate σi can be very difficult to infer, and dedicated model experiments are required to determine the correct settings of vertical resolution at a given horizontal resolution, as we do in the present study. Given the strong constraint for vertical resolution near a critical layer and the widely different horizontal scales (Lindzen and Fox-Rabinovitz, 1989), higher sensitivity can be expected for processes involving gravity waves than for planetary waves.
A detailed description of the model experiments is given in Sect. 2. In Sect. 3 we quantify the vortex state-dependent temperature bias, i.e., the underestimated SSW amplitude, in hindcasts from the S2S (sub-seasonal to seasonal) database and demonstrate how this bias can be mitigated by increasing vertical model resolution. The benefit of vertical resolution for gravity wave drag and potential energy is presented in Sect. 4. A discussion of these results follows in Sect. 5.
For this study, we conduct model experiments with the ECMWF Integrated Forecasting System (IFS CY47R1) with different vertical resolutions. The subject of these experiments is the simulation of the major SSW in boreal winter 2017/18 and its downward influence on the tropospheric circulation on sub-seasonal timescales. Most of these hindcasts are initialized on 8 February and run for 46 d. For robustness analysis, additional simulations are initialized on 17 January 2006 and 5 February 2010 that confirm our findings for a vortex displacement and another split SSW event as discussed in Appendix A. For each start date and each model configuration, we initialize an ensemble of 51 realizations. The output of individual realizations is used whenever we compute quadratic quantities such as variance, eddy heat, or eddy momentum fluxes. Ensemble-mean anomalies from climatology are regarded as the predictable signal in the sense of probabilistic predictability as is commonly done for sub-seasonal prediction. Initial conditions are taken from the ERA5 reanalysis dataset (Hersbach et al., 2020), which is also the reference against which we evaluate the model experiments.
The bulk of our simulations are run at a spectral horizontal resolution of TCo639, which corresponds approximately to 18 km grid spacing, and a vertical resolution of either 91 or 198 levels in hybrid η coordinates with a sponge layer starting at 1 hPa. The vertical grid spacing for the different model configurations is illustrated in Fig. 1, depicting high vertical resolution near the surface and a gradually coarsening vertical grid in the stratosphere. Sensitivity tests for a comparison with operational forecasts at ECMWF reveal that while 137 vertical levels seem sufficient at a spectral resolution of TCo319 (36 km grid spacing), at least 198 vertical levels are required at TCo639 (see Sect. 5 and Appendix B).
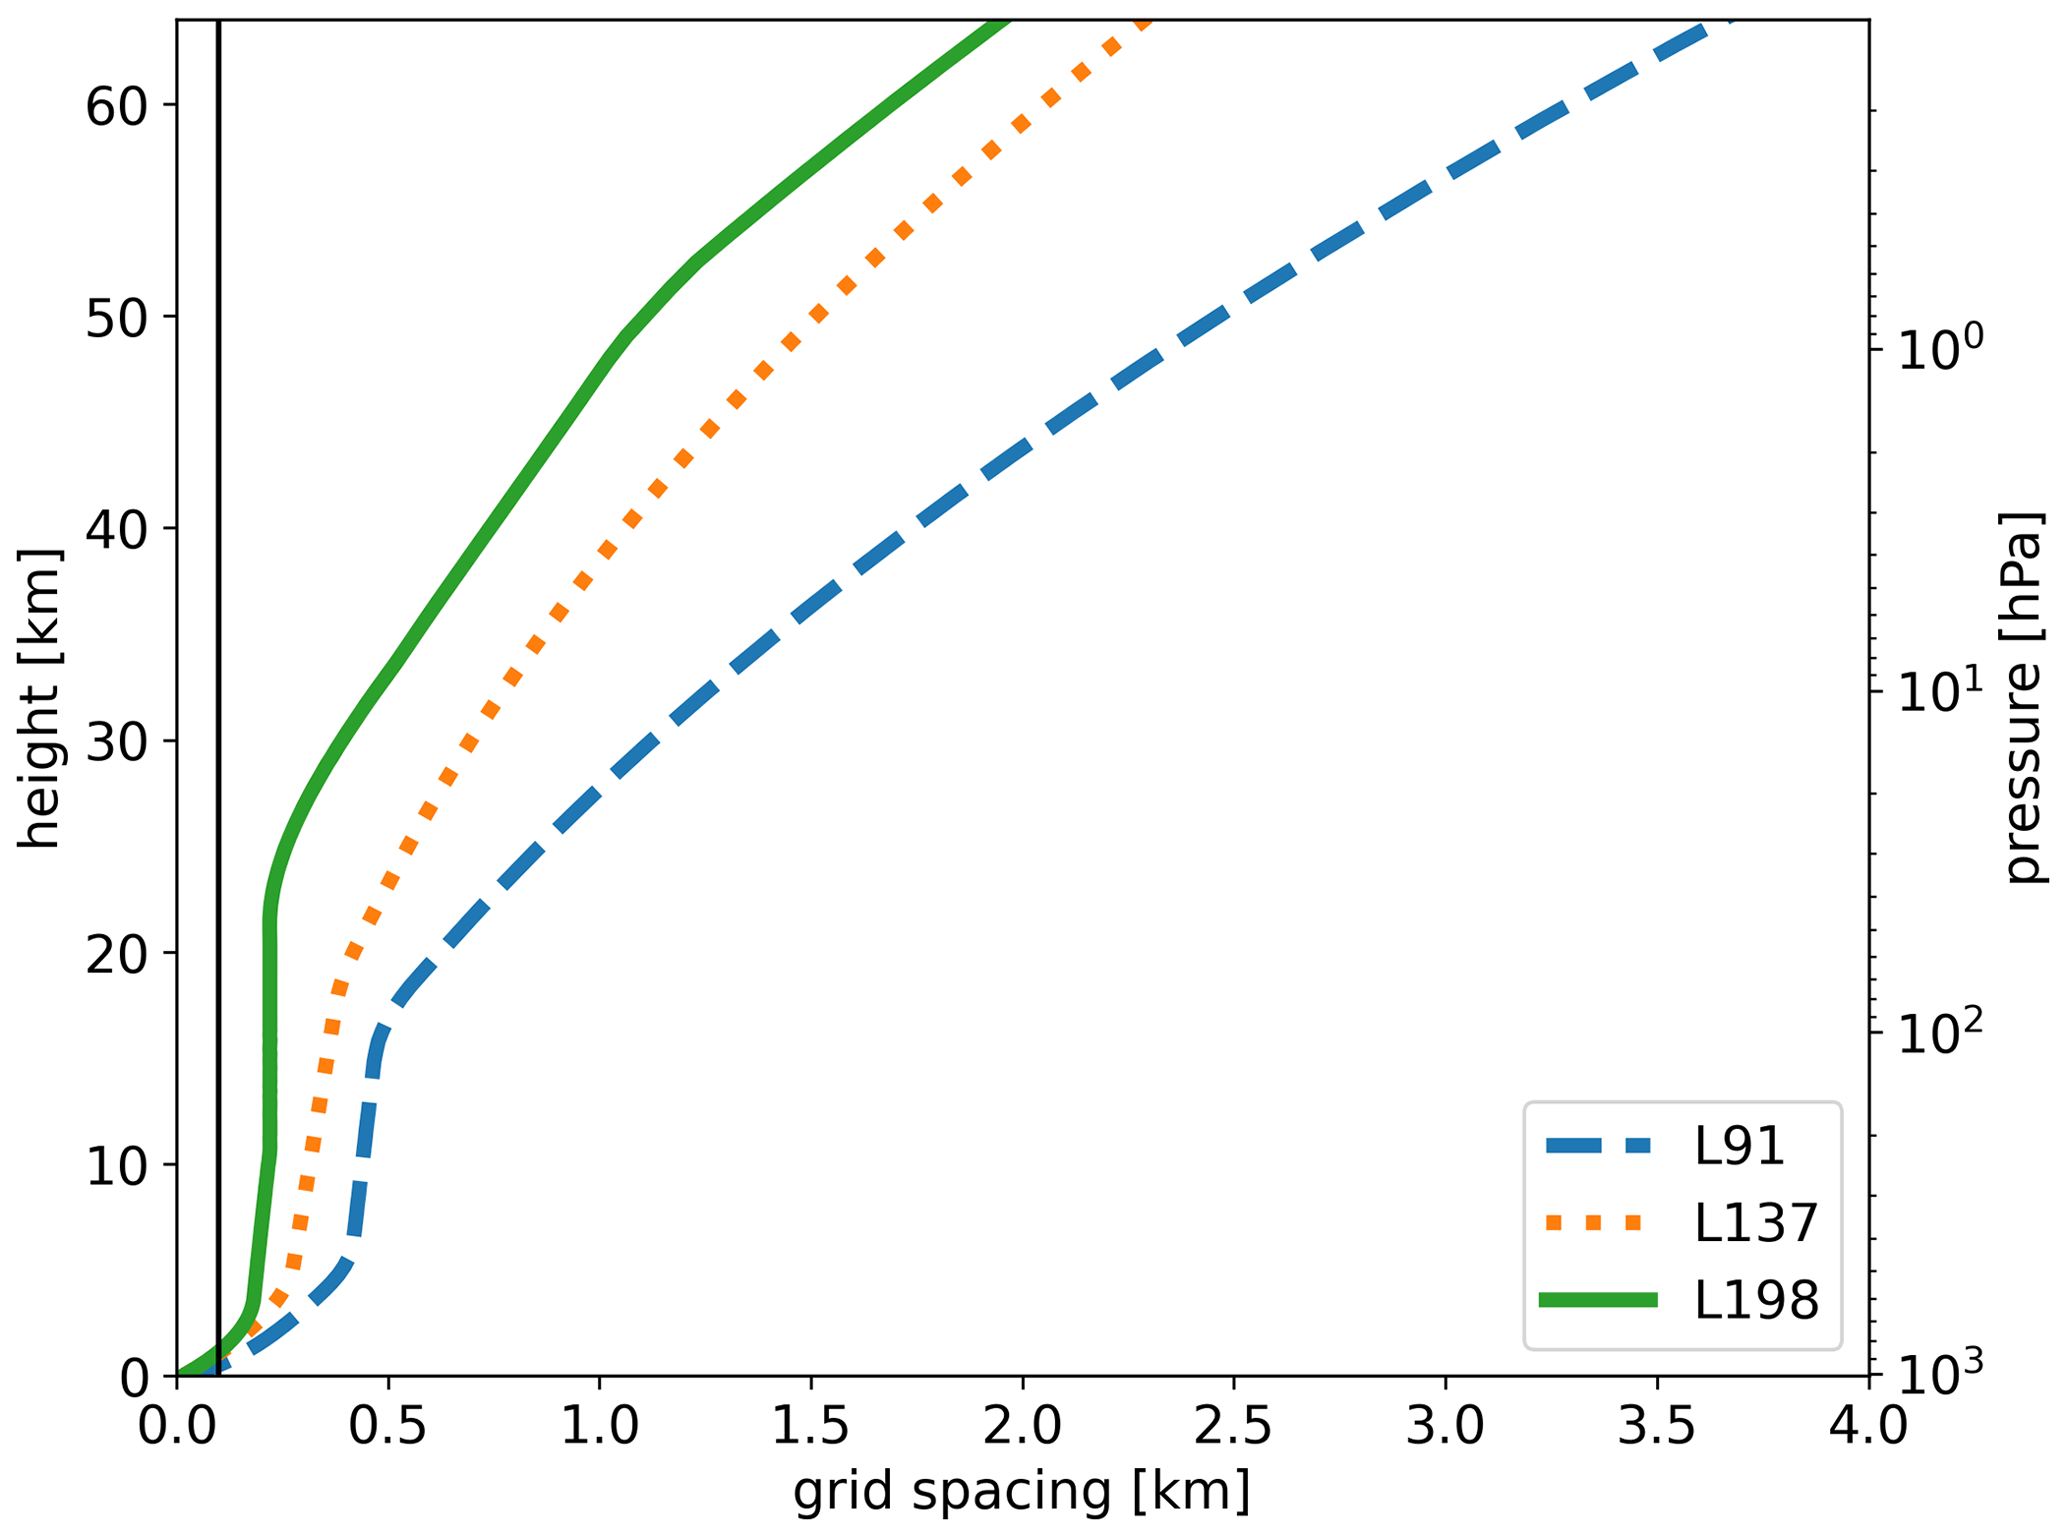
Figure 1Vertical grid spacing in log-pressure coordinates with a scale height of 7000 m for three vertical grid configurations with standard surface pressure. The vertical line marks a constant grid spacing of 100 m.
Changing the resolution will presumably affect the magnitude of resolved gravity wave drag. However, at a horizontal resolution of approximately 18 km the stratospheric gravity wave spectrum is only partly resolved and sub-grid-scale gravity waves need to be parameterized. Note that an intercomparison of various ECMWF IFS simulations suggests that the gravity wave spectrum is not fully resolved even at a 4 km horizontal grid spacing (Polichtchouk et al., 2022a, b). The settings for parameterized gravity wave drag are unchanged between the different vertical-resolution configurations. To verify whether changes in gravity wave drag are caused directly by changes in the vertical resolution as opposed to changes in the stratospheric zonal-mean basic state, we performed nudged simulations following the SNAPSI protocol (Hitchcock et al., 2022). Specifically, zonal-mean temperature, vorticity, and divergence above 90 hPa are relaxed towards the “observed” time series of ERA5 on a timescale of 6 h. Consequently, there are no significant differences in the zonal-mean zonal wind and polar-cap temperature anomaly between the different model configurations in the nudged simulations.
The vertical eddy momentum flux convergence on pressure levels , where u and ω are zonal and vertical (pressure) velocities and p is pressure, is used as the diagnostic for the zonal resolved gravity wave forcing. We follow the methodology of Polichtchouk et al. (2022b) and represent primes as all spherical harmonics with total wavenumbers between 21 and the truncation limit. Selecting only these harmonics explicitly eliminates the contributions by planetary and synoptic-scale waves. The very same horizontal filtering is used when diagnosing the vertical power spectra of potential temperature anomalies as is explained in the following. The bar denotes an average over the largest resolved wavelength.
In order to estimate vertical wavenumbers m and vertical wavelengths , we use log-pressure coordinates where the following wave ansatz can be made (Fritts and Alexander, 2003):
where the scale height H is set to 7000 m, θ is potential temperature, and is the amplitude of a wave mode at a point in . To fully use the vertical resolution of the model, we interpolate potential temperature data from native model levels to a constant grid spacing of 100 m (marked by the vertical line in Fig. 1) instead of using standard pressure level output. Then we apply a wavelet analysis; i.e., we convolve profiles of normalized anomalies with a Morlet wavelet (e.g., Torrence and Compo, 1998) to compute spectral power and estimate the dominant vertical wavenumber at each altitude. The spectral power of is proportional to potential energy per unit volume. To remove artifacts introduced by the lower boundary of the model domain, we apply a Hanning window tapering to the vertical column of normalized perturbations.
To confirm the state dependence of stratospheric temperature biases on the strength of the polar vortex and to demonstrate the relevance of our simulations, we analyze the extended winter (November–March) IFS hindcasts provided by ECMWF to the S2S database (Vitart et al., 2017). Specifically, we estimate composites of polar-cap temperature biases at 50 hPa using zonal-mean zonal wind at 10 hPa and 60∘ N in the reanalysis during initialization as the criterion to select initialization dates and construct the composites (Tripathi et al., 2015b). The thresholds of 40 m s−1 for a strong vortex state and 5 m s−1 for a weak vortex state are chosen following Domeisen et al. (2020b) to ensure sufficiently large sample sizes. This sample of S2S hindcasts comprises more than 21 000 ensembles members for the winters 1999–2020 including 4191 members initialized during strong vortex states and 2761 members during weak vortex states. The significance of selecting the composite based on the strength of the vortex during initialization is tested using a Monte Carlo technique by comparing the observed difference with the distribution of hindcast biases for randomly selected start dates.
On average, the ECMWF S2S hindcasts develop a mid- to lower-stratospheric polar-cap cold bias of more than 2 K at 50 hPa with increasing lead time (dashed gray line in Fig. 2a), which is in line with the findings of Lawrence et al. (2022) for high-top models. Hindcasts with weak vortex initial conditions develop a stronger-than-average cold bias (dotted blue line in Fig. 2a). Specifically, the difference between the weak vortex composite mean and the climatological bias reaches its maximum of about −0.5 K after 20 d into the forecast before the influence of the initial conditions becomes less important and an increasing number of composite members reach a neutral or strong vortex state (Fig. 2b). This aggravated cold bias corresponds to an underestimated magnitude of weak vortex events. Similarly, Lawrence et al. (2022) find that at a lead time of 1 week, the wind change associated with an SSW is underestimated by approximately 5 m s−1. In contrast to weak vortex events, the strong vortex composite mean is not significantly different from the climatological bias for the first 2 weeks of the hindcast until the horizontal model resolution is reduced and the temperature bias diminishes by 0.25 K compared to the average (Fig. 2; see Appendix B for a discussion of the model resolution in S2S hindcasts). A comparison with the Monte Carlo distribution in Fig. 2b shows that the observed difference lies outside of the 99.9 % significance, which confirms that the null hypothesis can be rejected and that the cold bias is significantly aggravated following weak vortex conditions. The existence of a critical layer in the upper stratosphere during weak vortex states and underestimated resolved gravity wave forcing due to insufficient vertical resolution offer one potential explanation for the vortex state dependent bias in the S2S hindcasts.
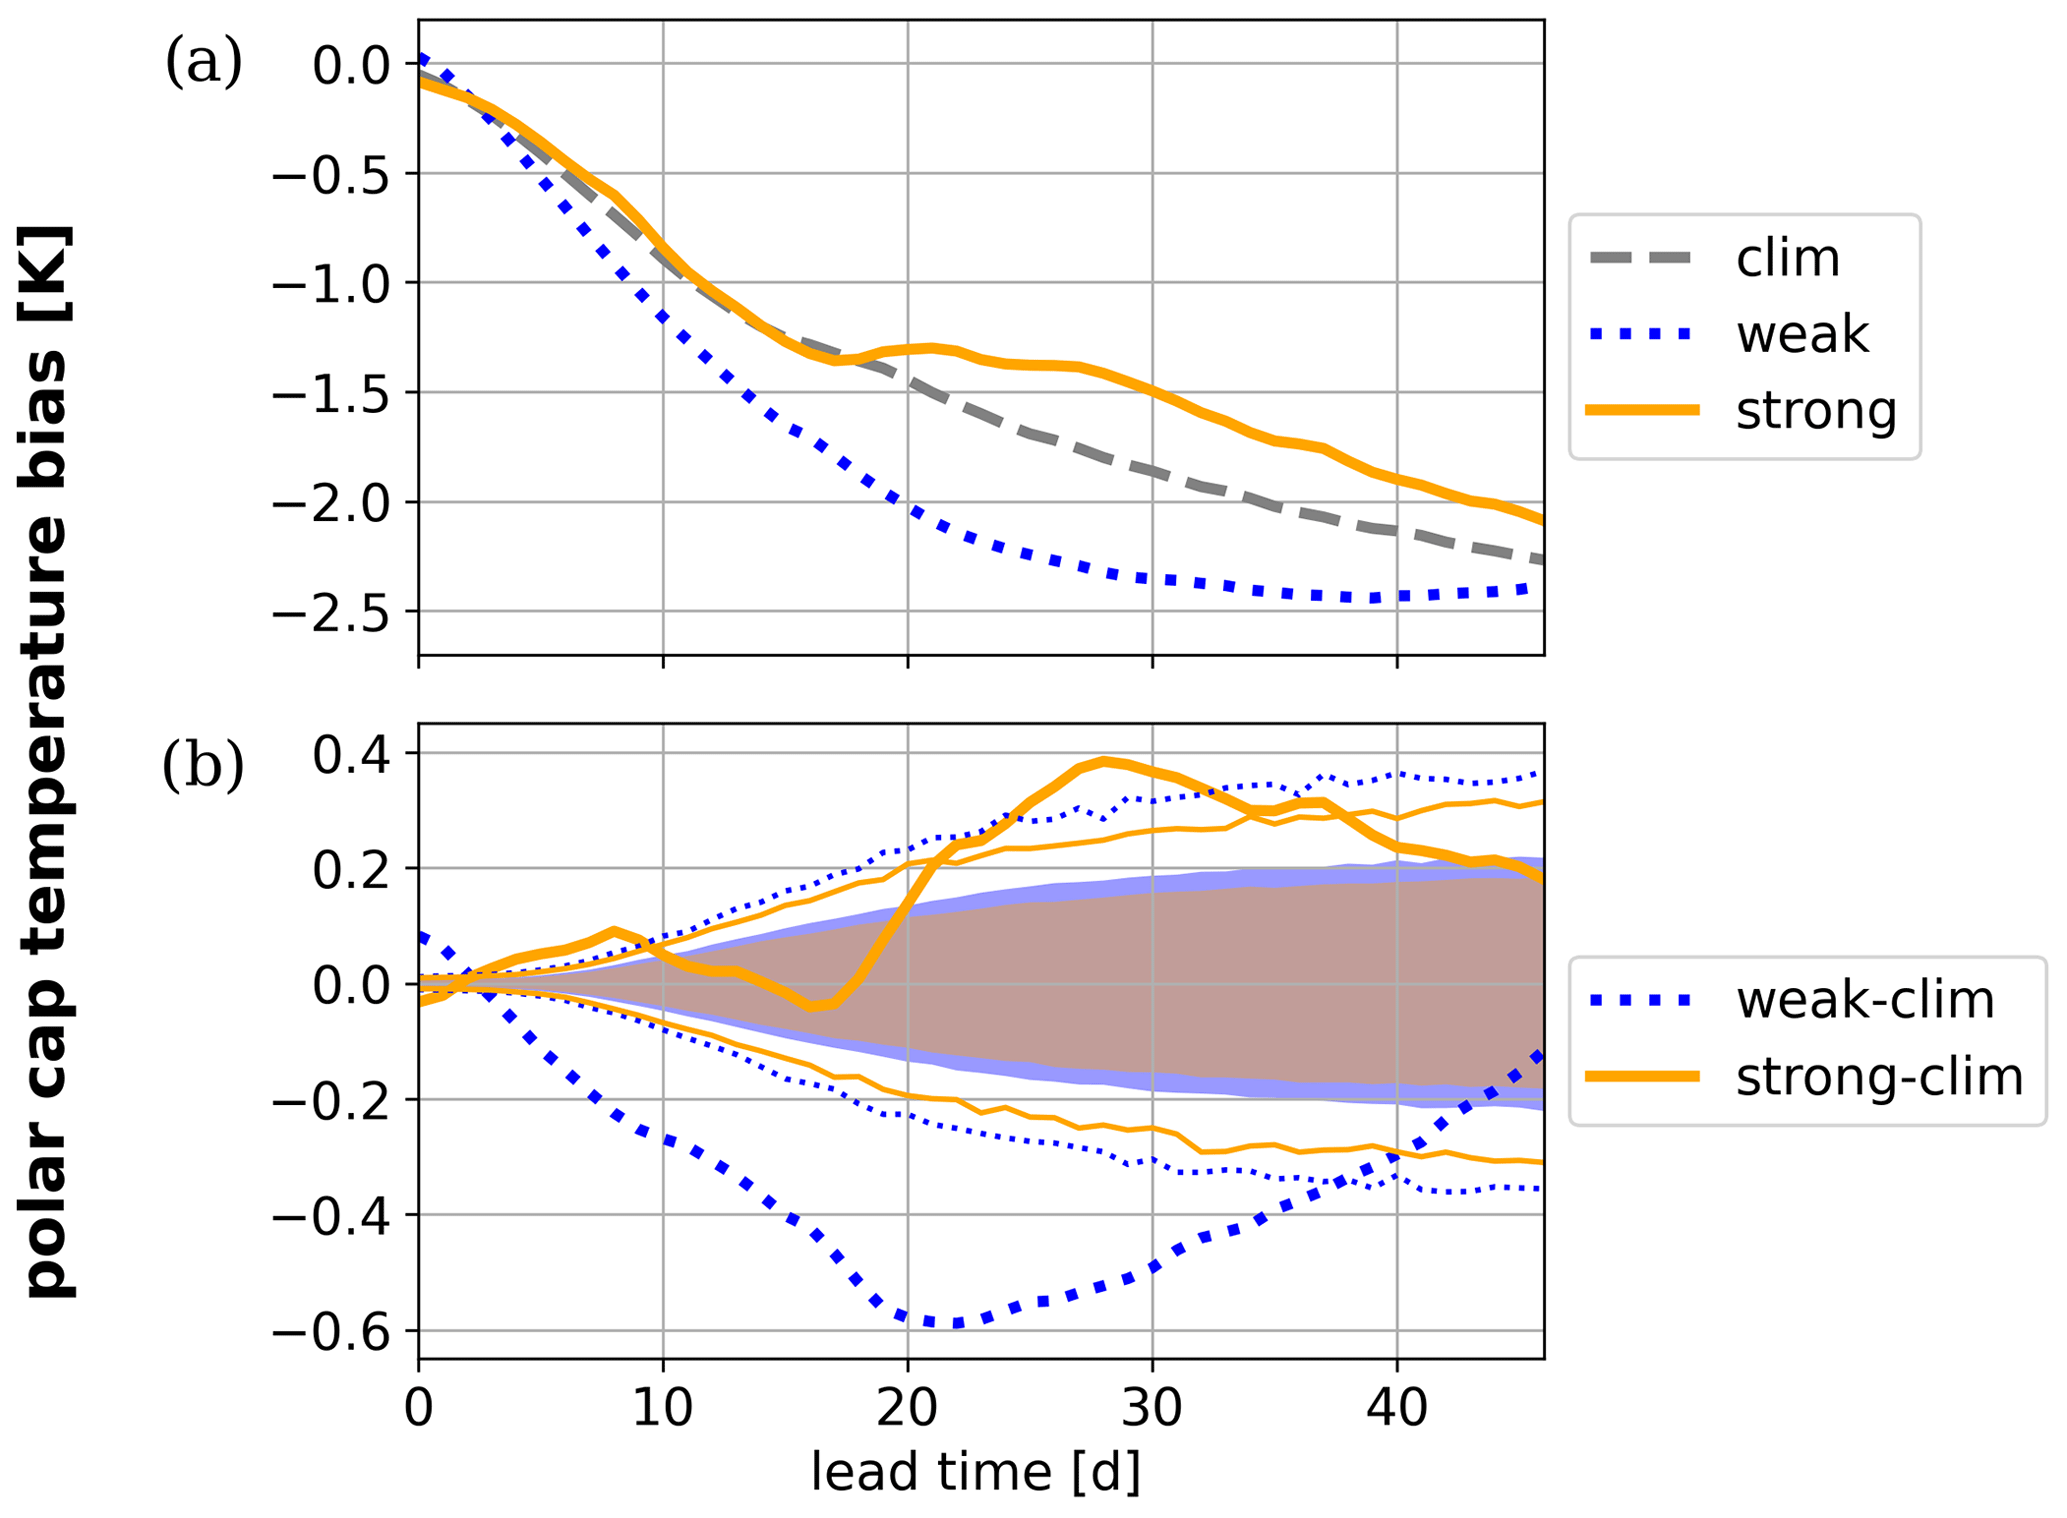
Figure 2Polar-cap temperature bias (hindcasts − reanalysis) at 50 hPa horizontally averaged between 60 and 90∘ N of ECMWF S2S hindcasts plotted against lead time. Panel (a) shows as a dashed gray line the average over all hindcasts (“clim”), as a dotted blue line the composite mean of hindcasts initialized during a weak vortex state (“weak”), and as a solid orange line the composite mean of hindcasts initialized during a strong vortex state (“strong”). Panel (b) compares the difference between the weak composite bias (thick dashed blue) or the strong composite bias (thick solid orange) and the climatological bias with the 2.5th and 97.5th (shading) and the 0.05th and 99.95th (thin lines) percentiles of the Monte Carlo distribution of randomly selected composite means. The percentiles depend on the size of random samples and are shown in blue and orange for the weak and strong composites, respectively.
The analysis of a case study for the 2018 boreal winter SSW can be fruitful for a better understanding of the mechanisms that might cause biases in the large ensemble of hindcasts. The central date of an SSW in reanalysis is typically preceded and followed by a downward propagation of positive polar-cap temperature anomalies on the order of 15 to 20 K from the stratopause to the lower stratosphere, as shown in Fig. 3a for the 2018 event. The recovery of the polar vortex is marked by the downward propagation of negative temperature anomalies from the mesosphere to the mid-stratosphere in the weeks following the event. In the lower stratosphere, on the other hand, positive anomalies of about 5 K are sustained for at least 6 weeks after the 2018 event. While the general development of the SSW is reproduced in sub-seasonal hindcasts, the magnitude of sustained positive temperature anomalies is underestimated by 2 to 4 K (Fig. 3b). Increasing the vertical resolution from 91 levels to 198 levels reduces this negative bias significantly and prolongs the stratospheric warm temperature anomalies in the ensemble mean (Fig. 3c). By comparing these results with simulations of SSW events in 2006 and 2010 (Figs. A1 and A2), it is confirmed that the strengthening and the extension of the stratospheric warming signal in time by increased vertical resolution is robust amongst different SSW events. While the stratospheric signal shows a strong resemblance between different SSW events, the timing and character of the downward response can be very different. So, despite the importance of the stratospheric signal for tropospheric predictability following an SSW (e.g., Domeisen et al., 2020b; Kautz et al., 2020), no robust improvement in surface predictability by increased vertical resolution can be inferred from the simulation of these three SSW events.
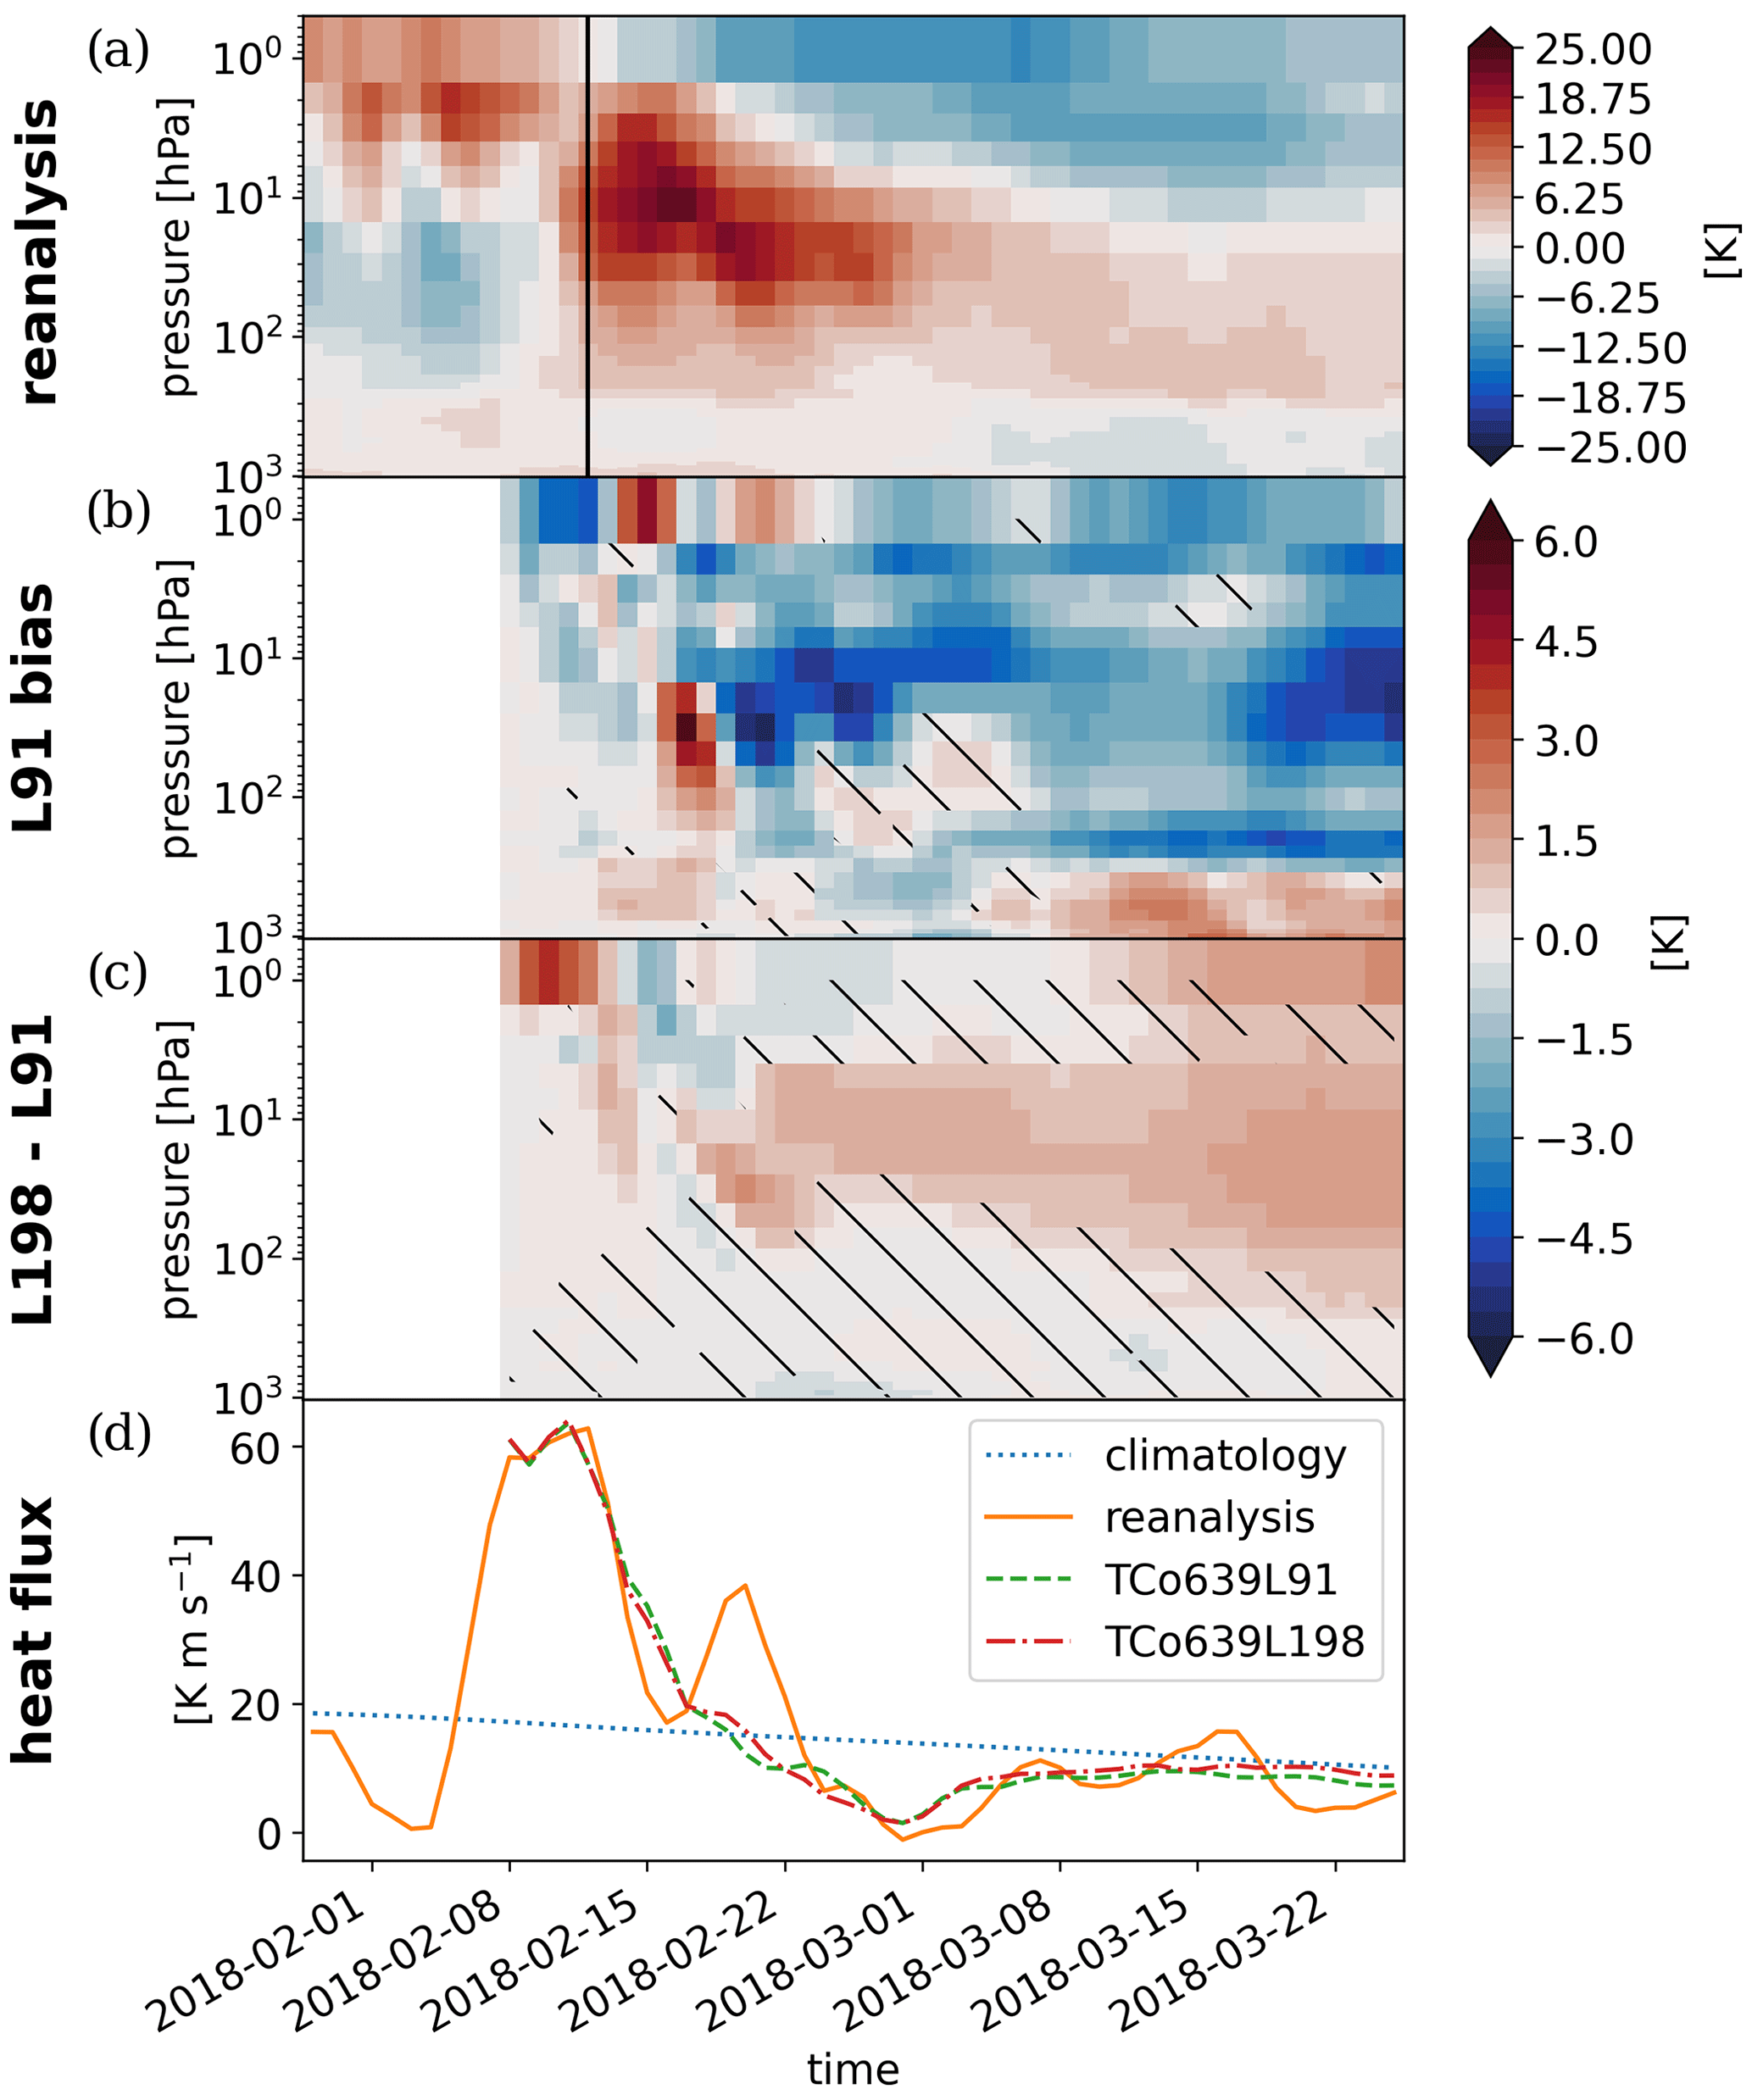
Figure 3Polar-cap temperature anomalies averaged between 60 and 90∘ N during the 2018 SSW event. The central date of the event is marked by the reversal of zonal-mean westerlies at 10 hPa and 60∘ N indicated by the vertical line. (a) The development of temperature anomalies [K] in the reanalysis, (b) the ensemble-mean bias of TCo639L91 hindcasts initialized on 8 February compared to the reanalysis, and (c) the improvement in the TCo639L198 hindcast ensemble mean compared to the TCo639L91 hindcasts. Hatching indicates areas where ensemble-mean differences are not significantly different from zero at a 95 % confidence level estimated by a one-sample (b) or two-sample t test (c). Panel (d) shows the ensemble-mean meridional eddy heat flux by zonal wavenumbers 1 to 3 at 100 hPa averaged between 45 and 70∘ N as a measure of the planetary wave flux in the lower stratosphere for climatology (dashed blue), the event in the reanalysis (orange), and the two model configurations (green and red).
An evident hypothesis to explain the reduction in the cold bias might be that the planetary wave flux into the stratosphere is improved by increased vertical resolution. The meridional eddy heat flux at 100 hPa shown in Fig. 3d is used as a proxy for the vertical Rossby wave propagation in the lower stratosphere. Between 8 and 12 February, shortly after initialization of the hindcast, both the reanalysis and the ensemble simulations exhibit a pronounced peak that is 3 times larger than the climatological average. Capturing this peak is crucial for predicting the onset of an SSW. Around 20 February, the reanalysis shows a second peak in planetary wave flux, which both hindcasts fail to predict and which likely contributes to the forecast error in the stratosphere. After the initial peak, the ensemble-mean eddy heat flux shows little difference from the climatological average (Fig. 3d), indicating limited predictability. In particular, there is no significant difference in heat flux between the model configurations with high and low vertical resolution. Therefore, we conclude that planetary waves do not play the predominant role in maintaining positive temperature anomalies in the later stage of the SSW and explaining the ensemble-mean temperature difference between the different model configurations. This leads to the hypothesis that the improvement in the temperature bias is due to the sensitivity of gravity waves to the vertical resolution. Hence, the remainder of this study focuses on the representation of gravity wave forcing in the model hindcasts.
Having established a sensitivity of the large-scale flow measured in terms of polar-cap temperature anomalies to changing vertical model resolution, we are now looking for a mechanism to explain this sensitivity. Small-scale gravity waves can affect the large-scale flow via non-linear processes such as wave breaking. The force on the zonal-mean flow exerted by the resolved part of the gravity wave spectrum can be diagnosed from the velocity output of the model in the form of the vertical eddy momentum flux convergence (see Sect. 2). The force exerted by sub-grid-scale gravity waves is output separately as accumulated momentum tendencies for orographic and non-orographic waves. The sum of those three respective forces is shown in Fig. 4a, where positive values mean an eastward acceleration of the zonal-mean wind.
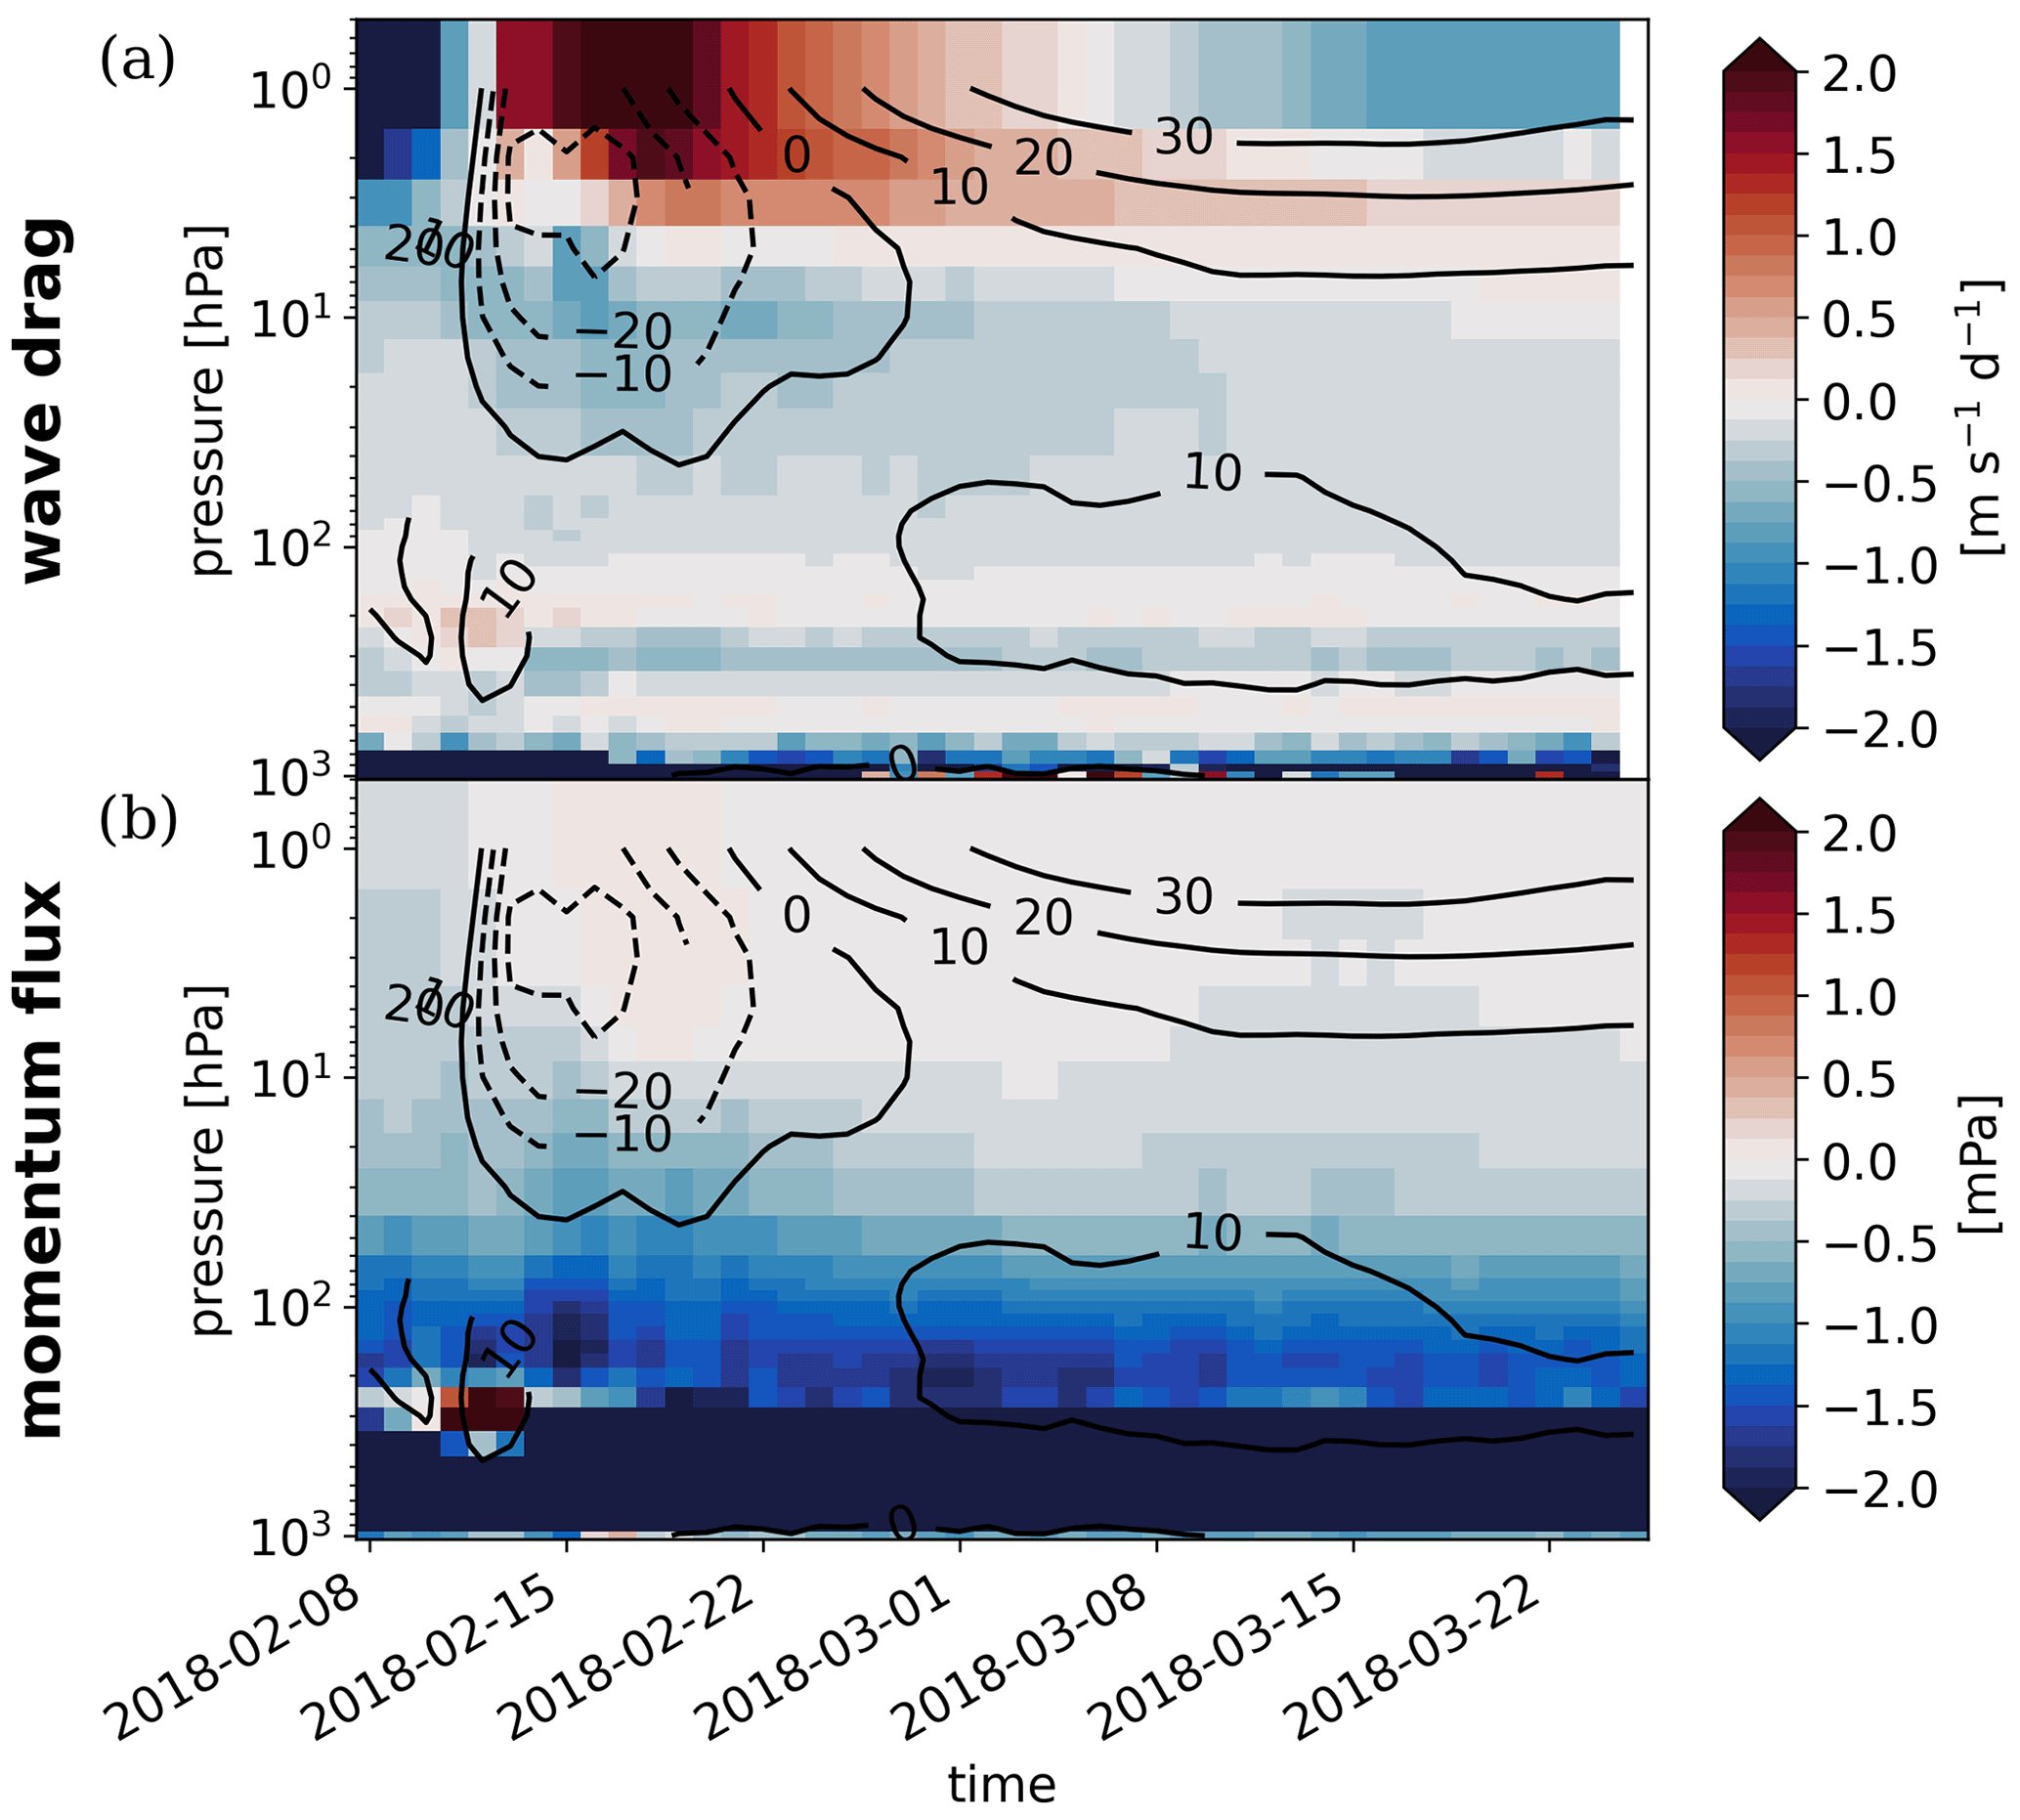
Figure 4TCo639L198 ensemble mean of (a) full gravity wave drag (resolved + orographic (parameterized) + non-orographic (parameterized)) and (b) resolved gravity wave momentum flux horizontally averaged between 45 and 70∘ N with contours of zonal-mean zonal wind [m s−1] at 60∘ N.
For an undisturbed vortex, gravity waves propagate into the mesosphere before they dissipate due to the reduced density (not shown). The disrupted vortex during the SSW, on the other hand, is further decelerated by gravity waves that dissipate in the mid-stratosphere below 5 hPa (Fig. 4a). Above the center of upper-stratospheric easterlies during the major warming, the momentum tendency has positive values of more than 2 , which corresponds to an acceleration of the disrupted vortex in the lower mesosphere. After the decay of upper-stratospheric easterlies around 28 February, the mesosphere slowly returns to values of about −1 , indicative of gravity waves with low negative phase speed reaching the mesosphere again (the vertical profile of the resolved gravity wave momentum flux is shown in Fig. 4b, where g denotes the gravitational acceleration and negative values indicate an upward flux of easterly momentum). As noted in Sect. 1, the existence of a breaking layer near the zero-wind line during SSWs has been reported in observational and modeling studies (e.g., Wang and Alexander, 2009; Yamashita et al., 2010). In the present hindcasts, however, westward drag in the mid-stratosphere is sustained after the return of the vortex from easterly to weak westerly winds.
As explained in Sect. 1 gravity waves can be expected to be sensitive to vertical resolution. To quantify this sensitivity, we investigate the difference in ensemble-mean gravity wave drag between the model configurations with high and low vertical resolution (Fig. 5). To verify that the expected change in resolved gravity wave drag with higher resolution is not compensated for by a change in parameterized momentum tendencies, the wave drag difference is split into its three components. The deceleration of the upper-stratospheric flow by resolved gravity wave drag in the simulations with higher resolution is continuously stronger than with low resolution by up to 0.2 , which is consistent with increased temperature anomalies in the mid-stratosphere compared to the configuration with low resolution (Fig. 5a). This difference in resolved gravity wave drag is not offset by parameterized waves. On the contrary, parameterized non-orographic gravity wave drag adds to the enhanced deceleration of the zonal-mean flow in the upper stratosphere (Fig. 5b), while the parameterized orographic gravity wave drag shows a difference only in the lower stratosphere (Fig. 5c). The combined difference in Fig. 5a–c represents almost 100 % of full gravity wave drag at 10 hPa in the hindcasts with 198 vertical levels seen in Fig. 4a. Note that given the noisy nature of the troposphere, no statistically significant difference in resolved gravity wave momentum flux is found below 70 hPa. Hence, we conclude that the sensitivity in wave drag is caused by the gravity wave propagation characteristics in the stratosphere and not by source processes in the troposphere. Also note that these results for the SSW in February 2018 are confirmed by an analysis of additional SSW events, which show a very similar behavior in terms of absolute values and the difference between model configurations (Fig. A3). Sensitivity tests with a different set of horizontal and vertical resolutions are presented in Appendix B.
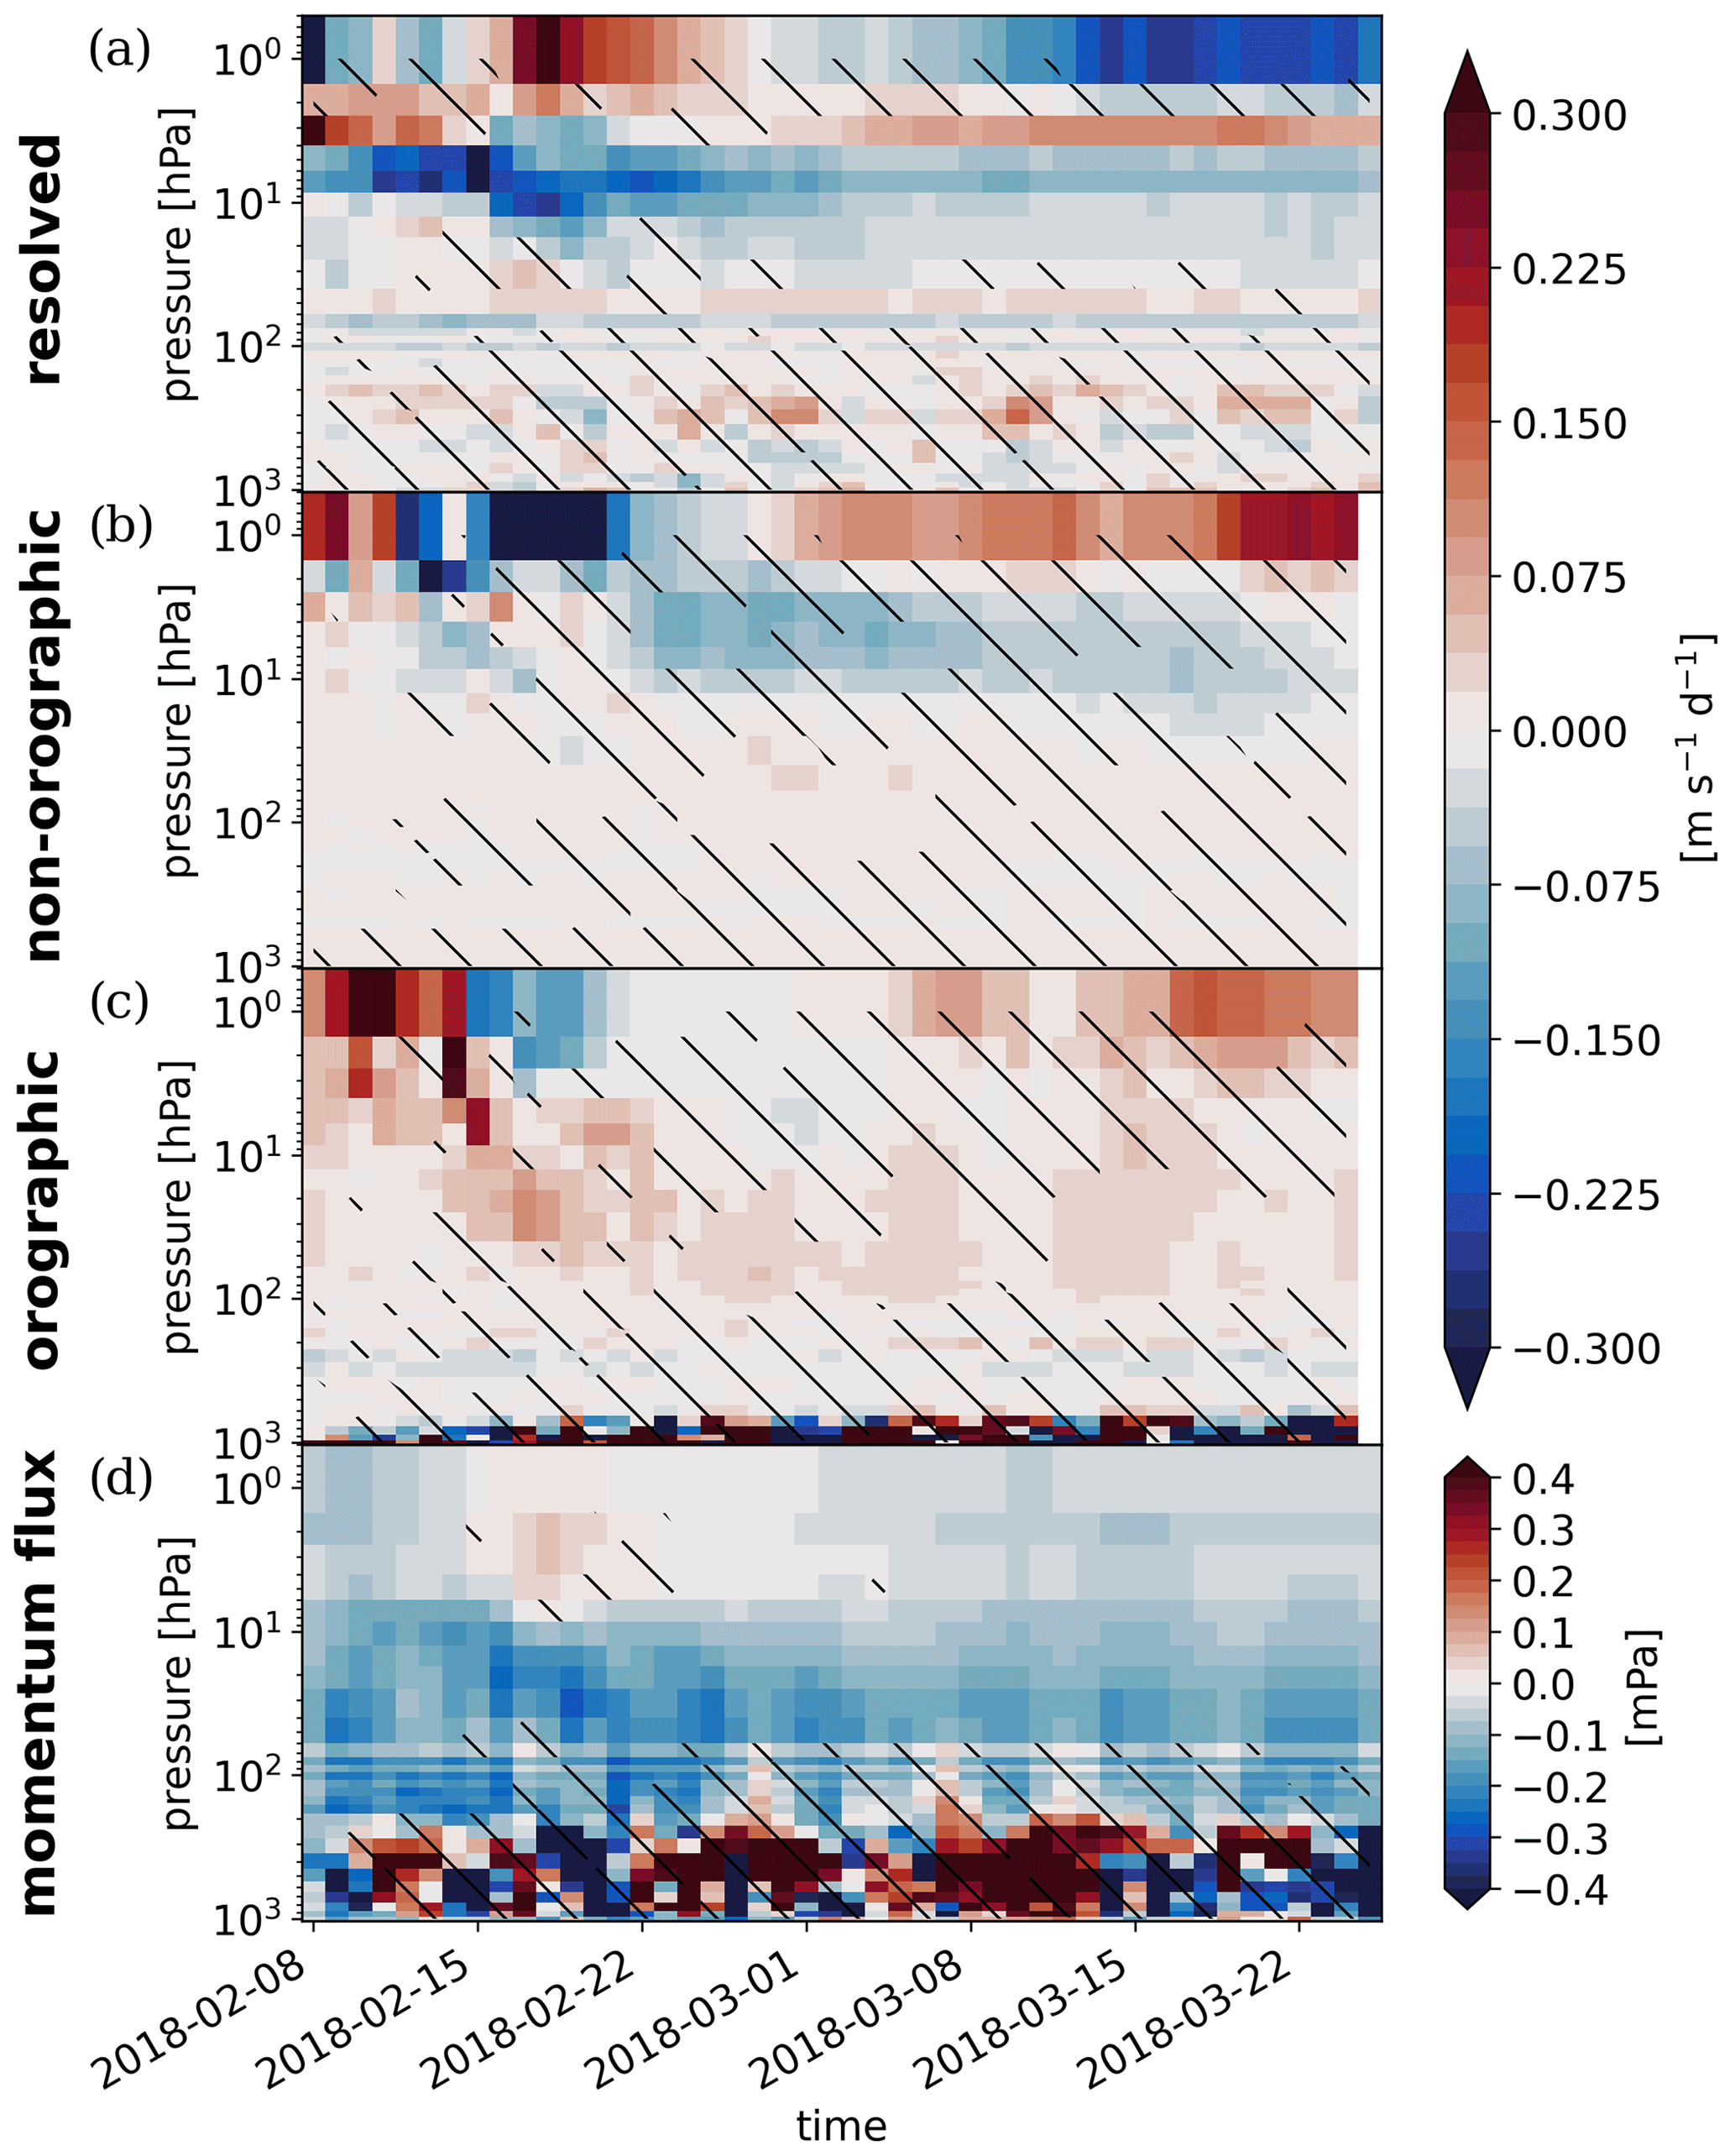
Figure 5Difference in ensemble-mean gravity wave drag between the TCo639L198 and TCo639L91 free-running hindcasts split into the (a) resolved, (b) parameterized non-orographic, (c) parameterized orographic components, and (d) the difference in ensemble-mean resolved gravity wave momentum flux between the two sets of hindcasts. Wave drag and momentum flux are horizontally averaged between 45 and 70∘ N. Hatching indicates areas where the improvement with higher vertical resolution is not significantly different from zero at a 95 % confidence level estimated by a two-sample t test.
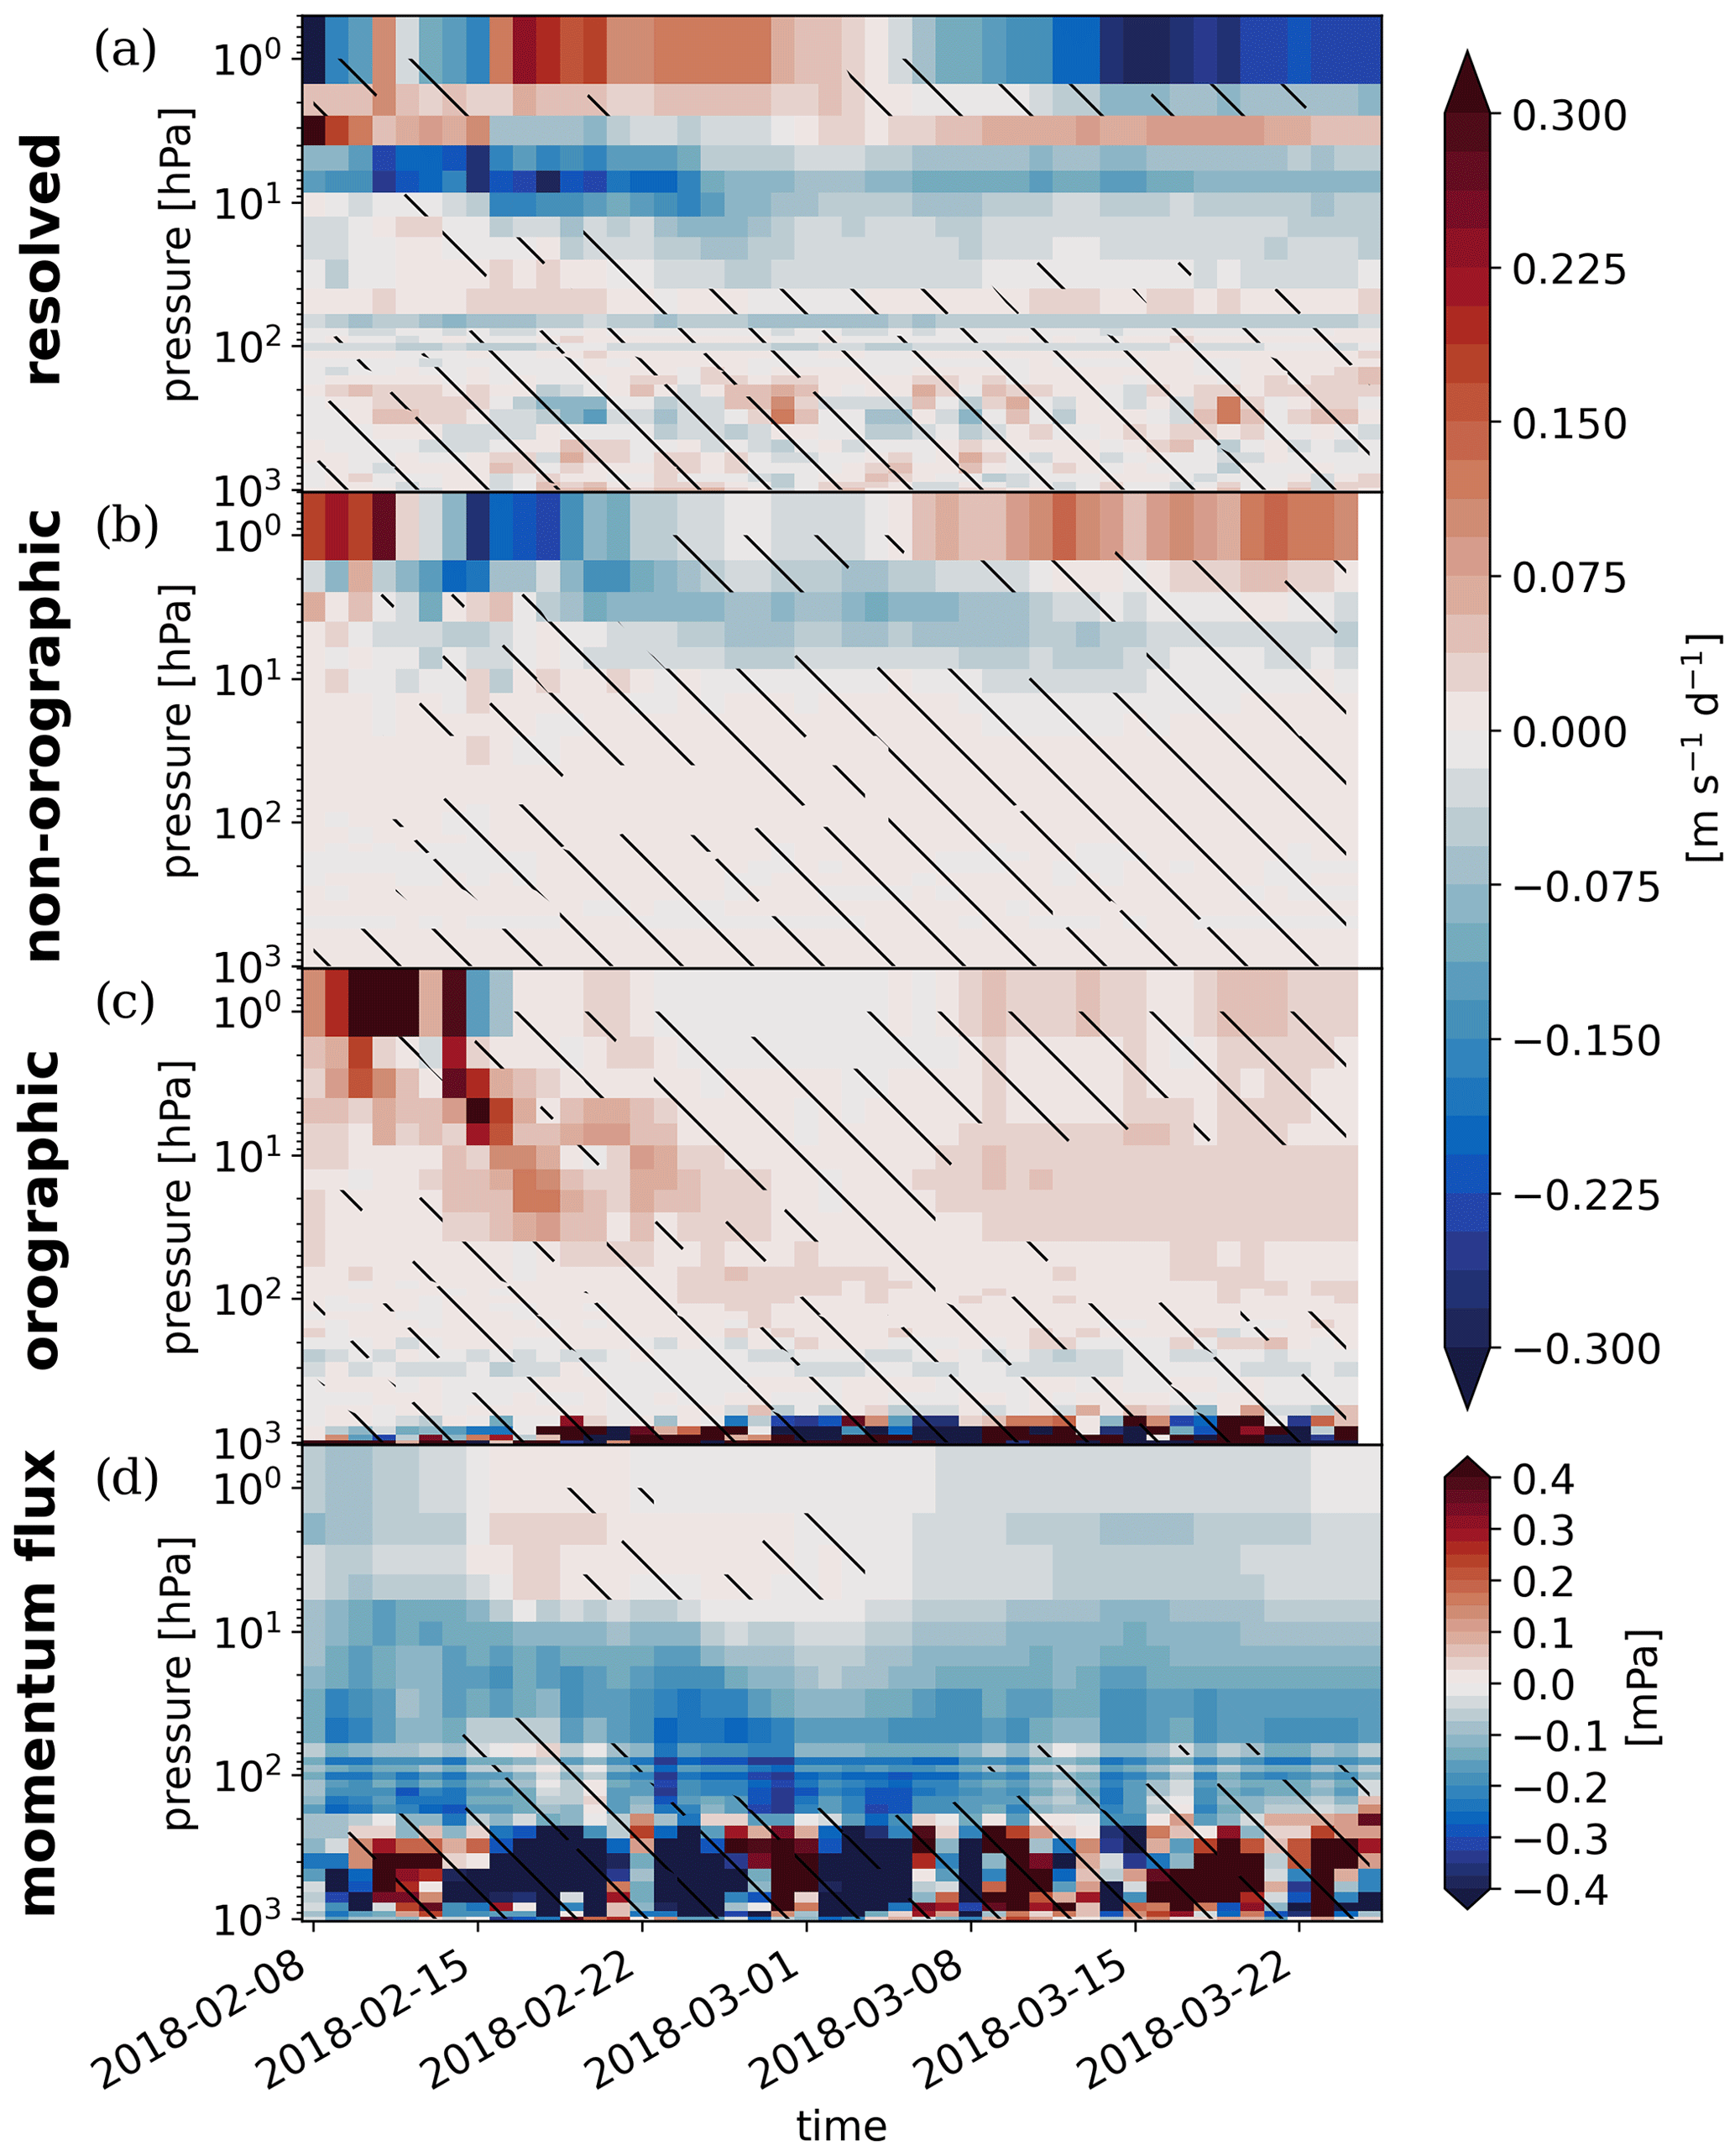
An important question when inferring whether gravity waves are responsible for the reduced temperature bias with increased vertical resolution is whether changes in gravity wave drag result directly from changes in resolution or whether they are a consequence of a modified background state. To assess this question, the diagnostics of Fig. 5 have been repeated for the simulations where the mid- and upper-stratospheric zonal-mean state is nudged to the reanalysis (Fig. 6). In these nudged simulations, the differences between the two model configurations inevitably result from increased vertical resolution since the stratospheric background state is unchanged. It is found that the sensitivity of resolved and parameterized wave drag does not depend on a difference in the zonal-mean background state, which supports the above hypothesis.
To better understand how the resolved gravity wave momentum flux depends on vertical resolution, we aim to estimate the dominant vertical length scale resolved by the model. Therefore, we compute wavelet spectra of gravity wave potential energy from filtered temperature data as explained in Sect. 2. Note that gravity wave potential energy Epot is connected to the absolute value of the vertical flux of horizontal momentum F according to the following identity (Ern et al., 2004):
where kh and m are the total horizontal and the vertical wavenumber. The model configuration with 198 vertical levels shows peak potential energy at a height of approximately 40 hPa for vertical wavelengths of about 6000 m, while the energy in the model version with 91 vertical levels peaks already at 150 hPa and 8000 m wavelength (Fig. 7a and b). The overall scale of vertical wavelengths is roughly in line with observational estimates (e.g., Sato, 1994; Preusse et al., 2002). The global minimum of spectral power in the mesosphere above 40 km height can readily be explained by the gradually increasing vertical grid spacing as we go higher up into the middle atmosphere (Fig. 1), the influence of the sponge layer at the model top, and the existence of a critical layer in the stratosphere. In the lower stratosphere there is a sign of a local minimum, potentially indicative of a reflecting or refracting layer directly above the tropopause. A similar minimum can be observed in the gravity wave drag at around 100 hPa (Fig. 4a). However, the informative value of spectral power below 100 hPa in Fig. 7 is reduced for two reasons. First, there are boundary effects caused by the convolution of the vertical column with a Morlet wavelet marked by the cone of influence (hatched area). Second, the potential temperature anomalies are tapered by multiplication with a Hanning window prior to the wavelet transform to reduce spectral leakage at the boundaries which marks a trade-off between removing artifacts and damping the signal. These limitations induced by the computation of the wavelet analysis are not easily overcome.
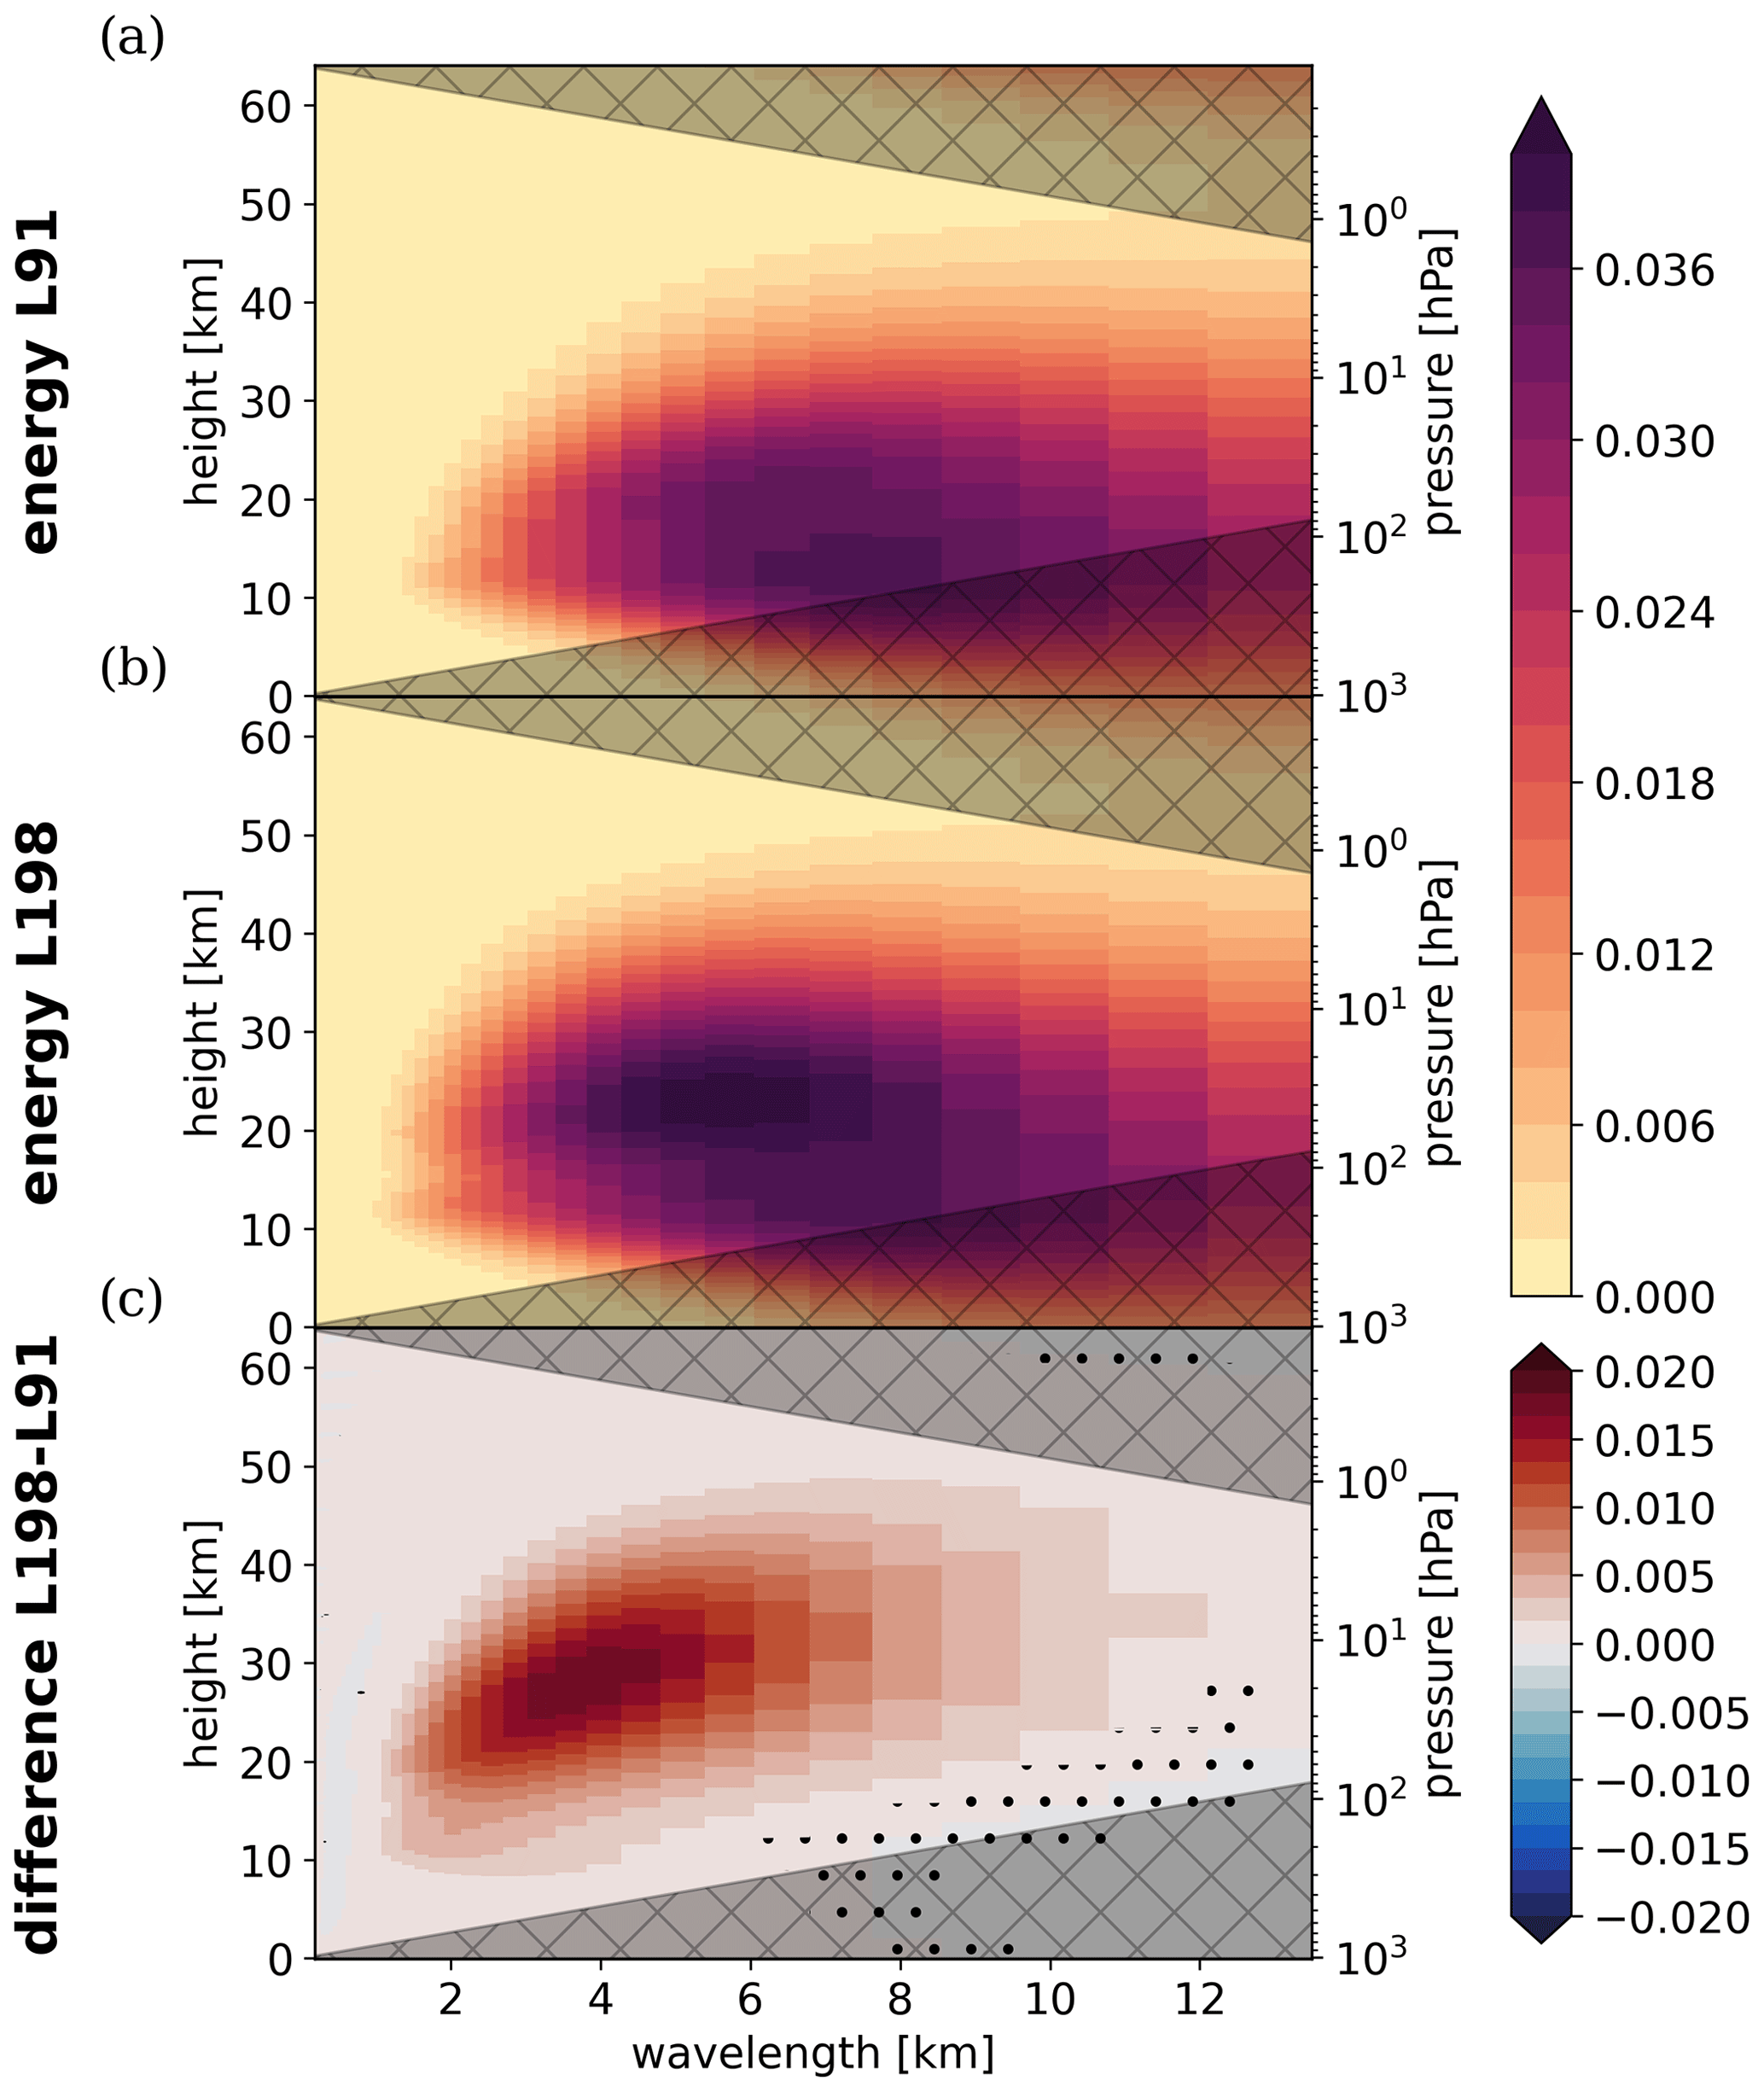
Figure 7Ensemble-mean non-dimensional potential energy wavelet spectrum horizontally averaged between 45 and 70∘ N for the period 22 February to 22 March 2018 in the (a) TCo639L91 and (b) TCo639L198 nudged simulations and (c) the ensemble-mean difference TCo639L198−TCo639L91. The hatched area indicates the theoretical cone of influence and stippling in the lower panel indicates where ensemble-mean energies are not significantly different estimated by a parametric bootstrap.
The difference of potential energy spectra between model configurations with high and low vertical resolution (Fig. 7c) shows a substantial increase in power with high resolution for vertical wavelengths of 4000 m and less in the mid-stratosphere to upper stratosphere. The magnitude of this increase corresponds to more than 50 % of the peak spectral energy in the configuration with 91 model levels. Given the small spread between individual ensemble members of the same model configuration, the difference in potential energy spectra is highly significant almost everywhere. The wavelength for the strongest increase in power corresponds nicely to the difference in vertical grid spacing (Fig. 1), indicating that the difference in gravity wave drag seen in Figs. 5 and 6 does indeed result from gravity waves with small vertical wavelengths.
Previous studies (e.g., Karpechko et al., 2018; Lawrence et al., 2022) and a composite analysis in Sect. 3 reveal that the magnitude of stratospheric polar-cap temperature anomalies following an SSW is commonly underestimated in sub-seasonal prediction models. In order to better understand this underestimation, this study investigates the means of improving the prediction by increasing vertical model resolution. At a vertical resolution of 91 levels, the ensemble-mean error in targeted simulations of the SSW in 2018 reaches up to 4 K compared to reanalysis. By increasing vertical resolution from 91 to 198 vertical levels, the error is reduced by 50 %, prolonging positive temperature anomalies in the polar stratosphere following SSW events. We show that the most likely explanation for the strengthened and more persistent stratospheric warming signal is an improved representation of gravity wave dynamics with a higher number of vertical levels.
The present simulations are initialized 4 d prior to the onset of the SSW on 12 February 2018. The model accurately predicts the strong flux of planetary waves into the stratosphere that caused the reversal of the prevalent westerlies. The associated peak in planetary wave drag is 1 to 2 orders of magnitude larger than the persistent deceleration of the zonal-mean flow that is induced by resolved and parameterized gravity waves. However, the planetary wave flux in the weeks following the SSW has limited predictability only, and no significant difference between the model configurations with different vertical resolution was found. In comparison to planetary waves, the ensemble spread of small-scale gravity waves is considerably smaller. The small variance in time and across ensemble members suggests that the sub-seasonal prediction skill is not significantly hampered by a deterministic limit for predicting gravity wave source processes (e.g., Fritts and Alexander, 2003). The existence of a critical layer for near-stationary gravity waves is thus a good predictor for upper-stratospheric wave drag on sub-seasonal timescales. Gravity wave breaking near the critical layer constitutes a positive feedback between wave drag and the zonal-mean state of the vortex. To make full use of the critical layer as a predictor and to benefit from the aforementioned positive feedback, increased vertical resolution is necessary to allow for resolved gravity waves to effectively decelerate the zonal-mean zonal wind. Specifically, it is found that a significant part of gravity wave potential energy corresponds to waves with a small vertical wavelength. At a low vertical resolution these waves will dissipate at lower altitudes than in a perfect model, whereas a high vertical resolution enables the propagation of resolved gravity waves closer to the respective critical layer, which leads to the deposition of easterly momentum at higher altitudes with lower mean density exerting a stronger drag on the mean flow.
The need for a high vertical resolution to resolve gravity wave dynamics agrees well with previous modeling studies. Waite (2016) and Skamarock et al. (2019) find model convergence for a vertical grid spacing of 200 m at a horizontal resolution of 11.8 and 15 km, respectively, which corresponds roughly to an aspect ratio of . A similar conclusion is drawn in a study about the sensitivity of the Integrated Forecasting System (IFS) to vertical resolution (Polichtchouk et al., 2019). While a vertical resolution set in accordance with the theoretical requirements to resolve stratified turbulence (see Sect. 1) performs well in the free troposphere, a correct representation of gravity wave breaking in the stratosphere requires a higher resolution than estimated for stratified turbulence (Cullen, 2017). Hence, stratospheric temperature biases in our model with a spectral resolution of TCo639 might benefit from an even further increase in vertical resolution compared to L198 (see Appendix B).
An open question that remains is how to quantify the exact contribution of gravity wave drag to the observed reduction in the cold bias. There are two factors that complicate such an estimate. First, the exact amount of wave drag required to maintain long-lasting positive temperature anomalies in the polar stratosphere against dissipation depends on the radiative damping timescale and the “depth” of the warming (Hitchcock and Shepherd, 2013; Hitchcock et al., 2013). Second, the stationarity assumption inherent to the downward control principle (Haynes et al., 1991), which relates wave drag to adiabatic warming, is violated by the transient nature of the experiments. Consequently, the sensitivity of polar-cap temperature anomalies to vertical resolution might result from a reduced numerical error instead of adiabatic warming. While this study is concerned with the polar stratosphere during weak vortex conditions, the climatological cold bias in the absence of a critical layer is shown to be sensitive to vertical resolution, especially in the tropical stratosphere (Polichtchouk et al., 2019). That sensitivity is associated with discretization errors in vertical advection and an unphysical 2Δz mode in the temperature equation. But even though some details of the mechanism remain unclear, the improvement in the stratospheric forecast with increased vertical resolution is evident.
This study presents results based on simulations of the SSW event in February 2018. The findings are robust and translate well to a greater number of SSW events as demonstrated by repeating the diagnostics for simulations of the events in January 2006 and February 2010. Figures A1 and A2 show the development of a polar-cap temperature anomaly for the reanalysis and the hindcast ensemble mean as well as the ensemble-mean eddy heat flux at 100 hPa as a proxy for stratospheric planetary waves. The strong resemblance amongst different events in terms of gravity waves is shown by the ensemble-mean gravity wave drag in Fig. A3a and b. The difference in resolved and parameterized wave drag between the model configurations with low and high vertical resolution is likewise comparable (Fig. A3c–h).
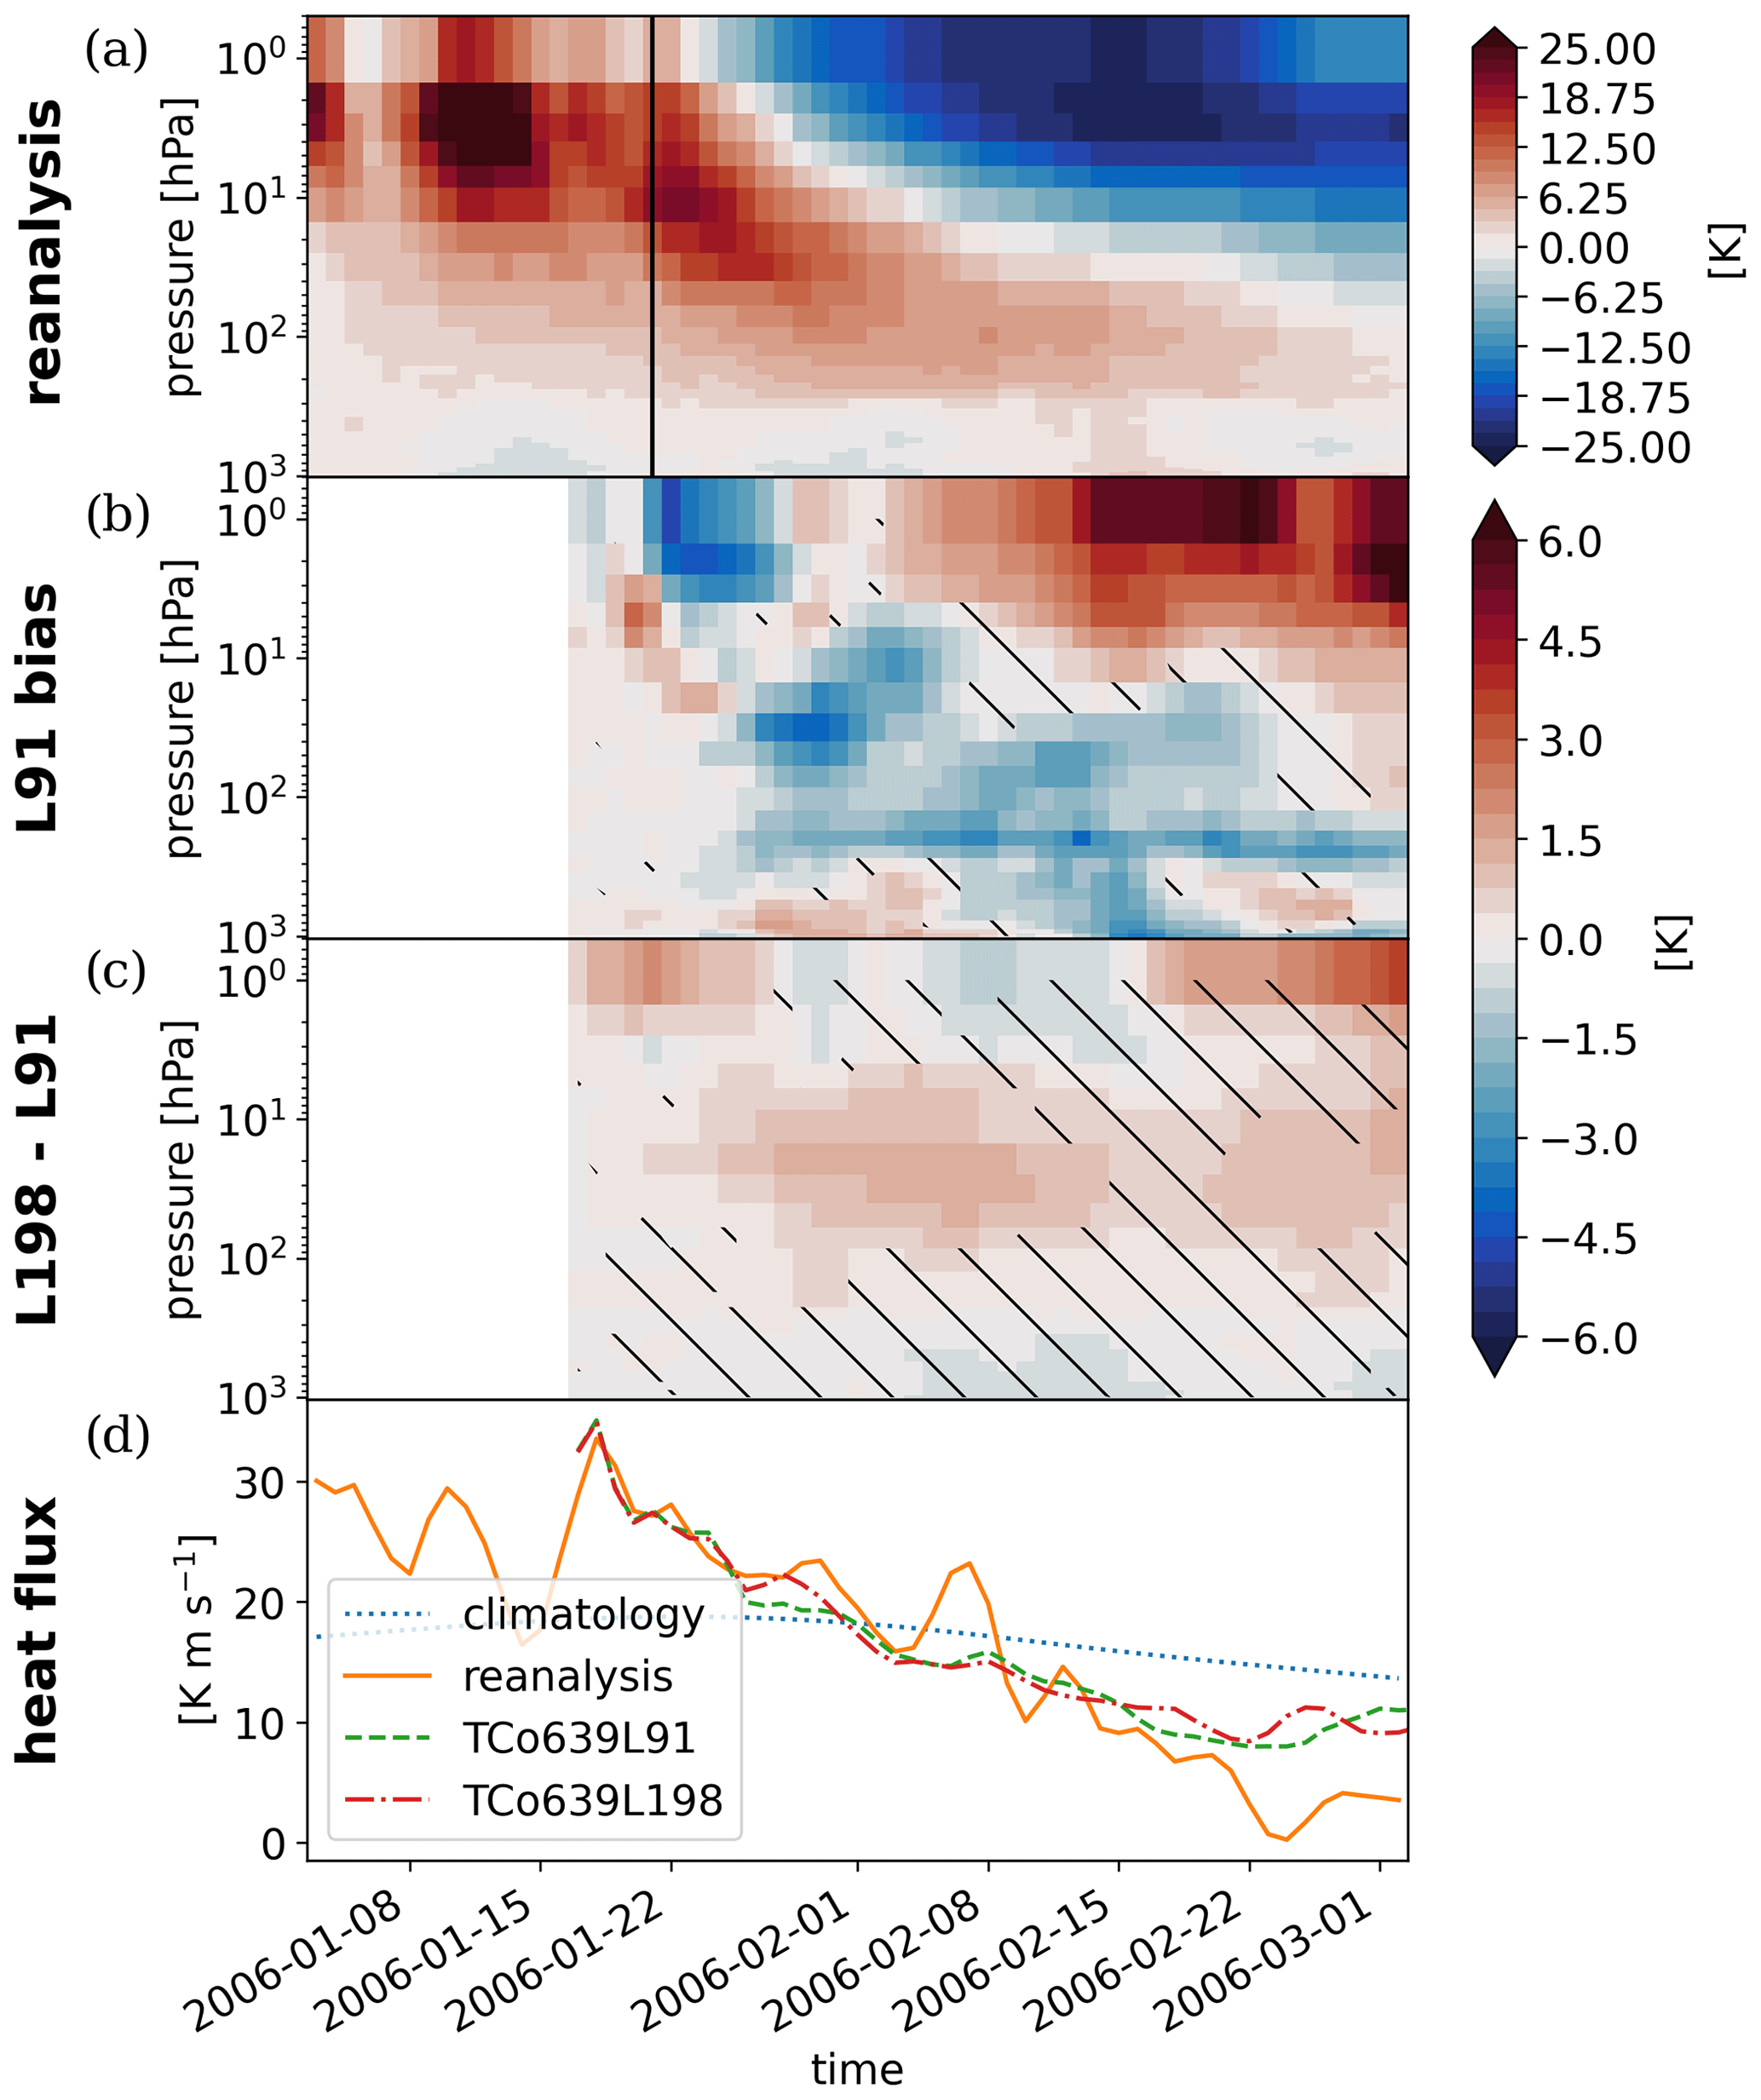
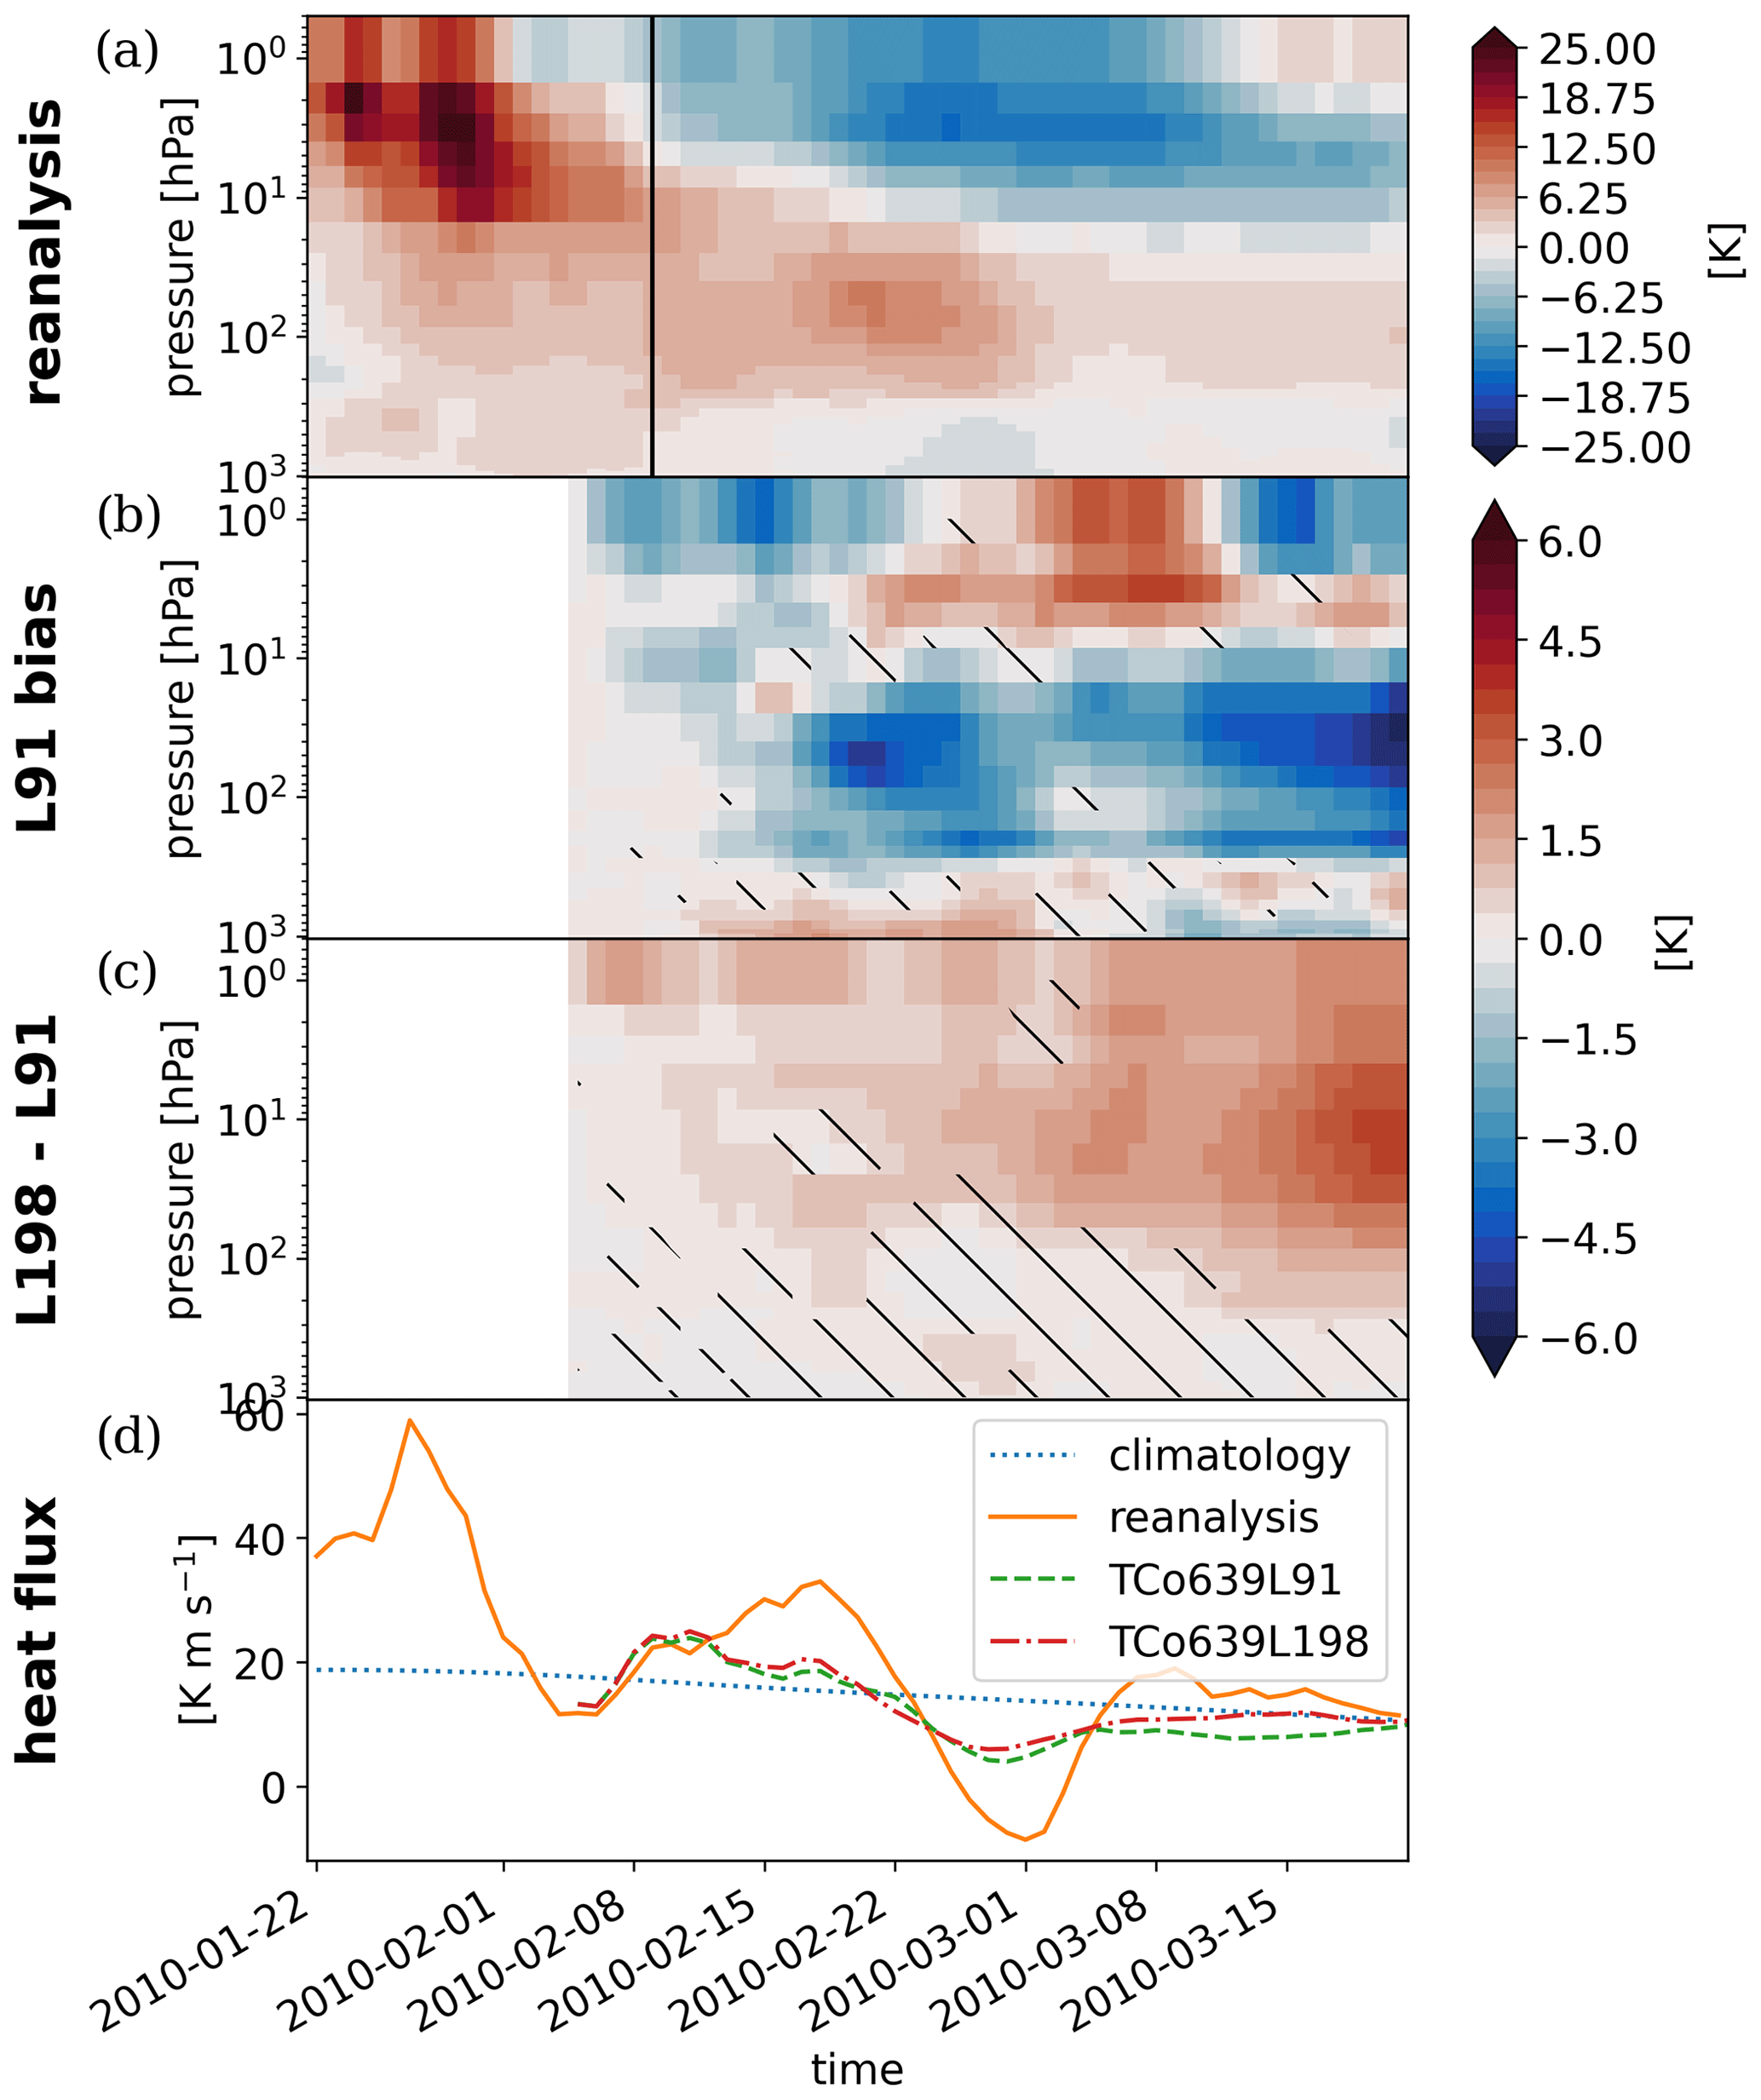

Figure A3Ensemble-mean full gravity wave drag and zonal-mean zonal wind as in Fig. 4a for the (a) 2006 and (b) 2010 SSW events. Differences in ensemble-mean gravity wave drag between the TCo639L198 and TCo639L91 free-running hindcasts as in Fig. 5 for the (c, e, g) 2006 and (d, f, h) 2010 SSW events.
Operational sub-seasonal to seasonal forecasts issued by ECMWF use 137 vertical levels and a horizontal resolution of TCo639 up to day 15 and a reduced horizontal resolution of TCo319 for the remainder of the forecast (ECMWF, 2022a). The present study reveals an improved representation of stratospheric gravity waves and a reduction in the polar-cap temperature bias in the TCo639L198 hindcasts compared to a model configuration with the same horizontal resolution but only 91 vertical levels. To compare these results with the resolution of operational forecasts, we conducted sensitivity tests with a horizontal resolution of TCo319 and 137 vertical levels, respectively. They show that at lower-horizontal-resolution resolved gravity wave drag is reduced by 50 % depending on altitude (Fig. B1). Furthermore, with TCo319 the improvement compared to 91 vertical levels is achieved to large degree already with 137 instead of 198 levels (Fig. B1). This is in contrast to the TCo639 simulations where increasing vertical resolution from L137 to L198 makes a significant difference (Fig. B2) especially in the upper stratosphere.

Figure B1Ensemble-mean resolved gravity wave drag horizontally averaged between 45 and 70∘ N for different model configurations initialized on 8 February 2018.
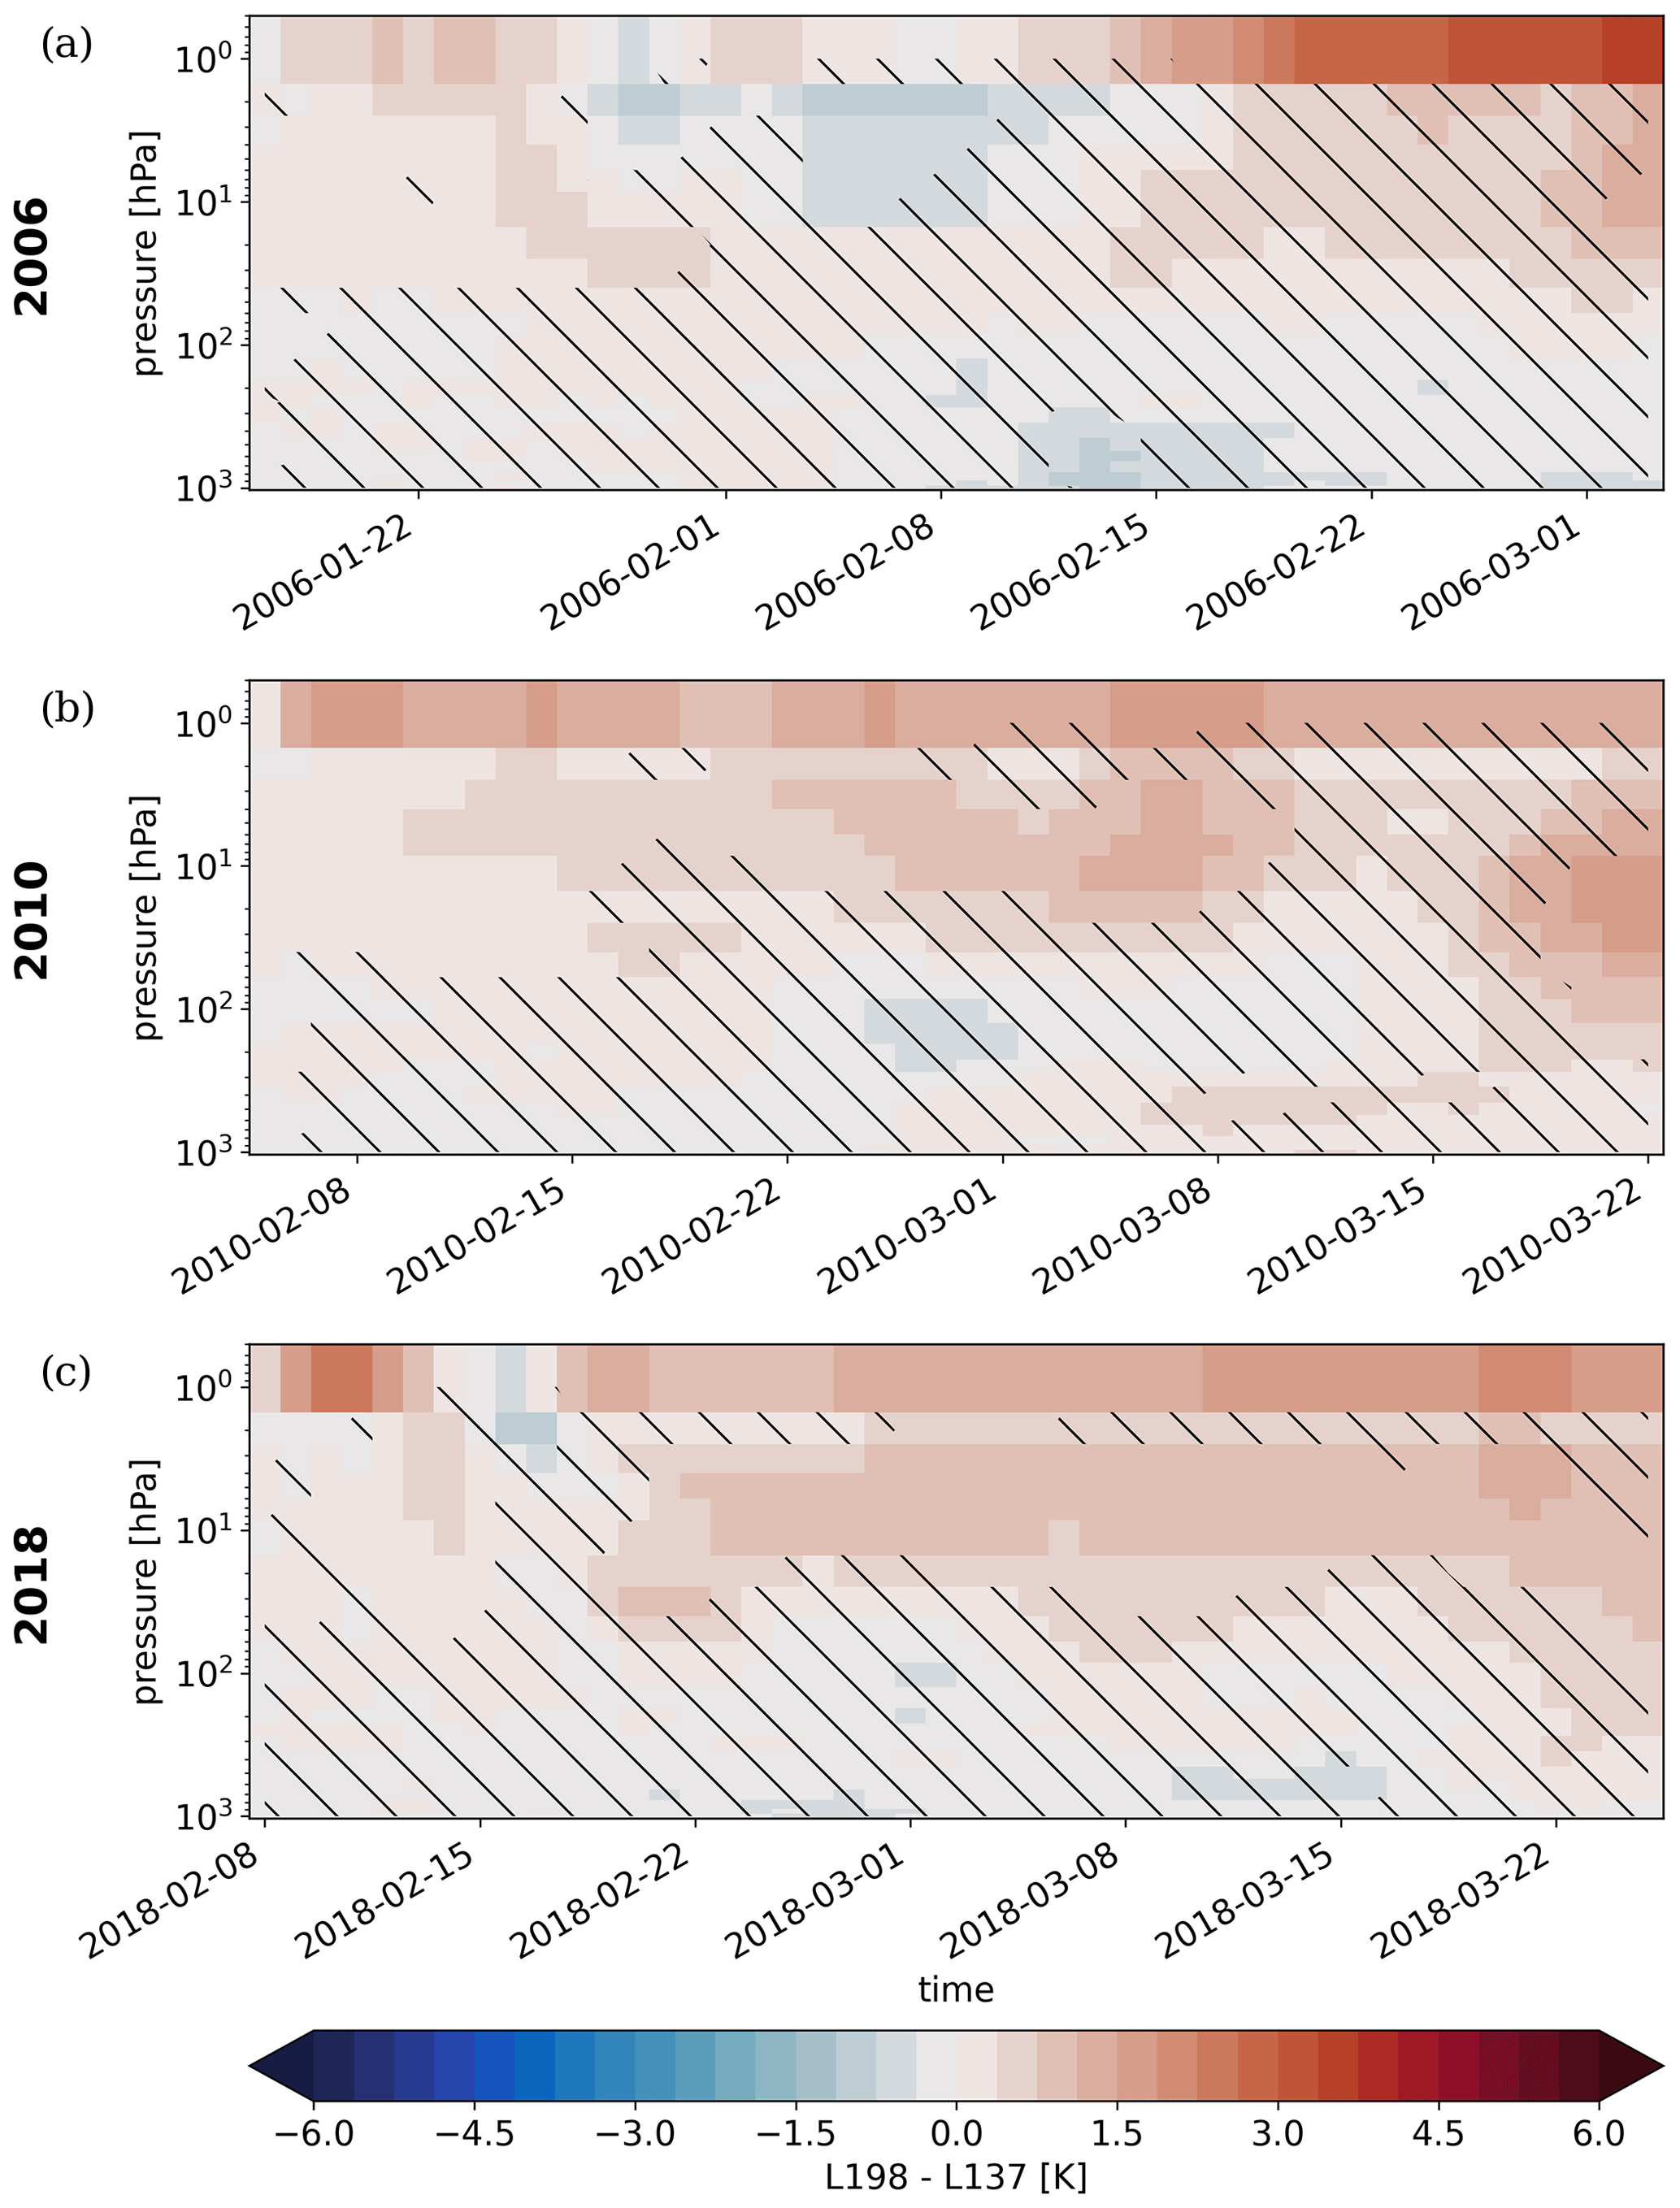
Figure B2Differences in the TCo639L198 hindcast ensemble-mean polar-cap temperature anomalies during the 2006, the 2010, and the 2018 SSW events compared to the TCo639L137 hindcasts.
The code to reproduce this analysis is available from https://doi.org/10.5281/zenodo.7529461 (Wicker, 2023).
The ERA5 reanalysis and the S2S hindcast data used in this study can be downloaded from the Copernicus Climate Data Store (https://doi.org/10.24381/cds.bd0915c6, Hersbach et al., 2018) and the S2S archive (https://confluence.ecmwf.int/display/S2S/S2S+archive, ECMWF, 2022b). The IFS simulation output is available from ECMWF upon request.
All authors jointly designed the study. IP performed the model runs and resolved gravity wave flux calculation. WW performed the data analysis, made the figures, and wrote the manuscript. All authors contributed to interpreting the results and editing the manuscript.
At least one of the (co-)authors is a member of the editorial board of Weather and Climate Dynamics. The peer-review process was guided by an independent editor, and the authors also have no other competing interests to declare.
Publisher's note: Copernicus Publications remains neutral with regard to jurisdictional claims in published maps and institutional affiliations.
We would like to thank an anonymous reviewer and M. Joan Alexander for their constructive comments which have greatly improved the paper. We also thank Richard J. Greatbatch for insightful discussions and Tim Stockdale for providing the zonal-mean nudging code and the 198L vertical resolution configuration. This project has received funding from the European Research Council (ERC) under the European Union's Horizon 2020 research and innovation program (grant agreement no. 847456). Support from the Swiss National Science Foundation (project no. PP00P2_198896) to Daniela I. V. Domeisen is gratefully acknowledged.
This research has been supported by the European Research Council through the Horizon 2020 research and innovation program (HEATforecast, grant no. 847456) and the Schweizerischer Nationalfonds zur Förderung der wissenschaftlichen Forschung (grant no. PP00P2_198896).
This paper was edited by Pedram Hassanzadeh and reviewed by M. Joan Alexander and one anonymous referee.
Albers, J. R. and Birner, T.: Vortex preconditioning due to planetary and gravity waves prior to sudden stratospheric warmings, J. Atmos. Sci., 71, 4028–4054, 2014. a
Baldwin, M. P. and Dunkerton, T. J.: Stratospheric harbingers of anomalous weather regimes, Science, 294, 581–584, 2001. a
Baldwin, M. P., Ayarzagüena, B., Birner, T., Butchart, N., Butler, A. H., Charlton-Perez, A. J., Domeisen, D. I., Garfinkel, C. I., Garny, H., Gerber, E. P., Hegglin, M. I., Langematz, U., and Pedatella, N. M.: Sudden stratospheric warmings, Rev. Geophys., 59, e2020RG000708, https://doi.org/10.1029/2020RG000708, 2021. a
Charney, J. and Drazin, P.: Propagation of planetary-scale disturbances from the lower into the upper atmosphere, J. Geophys. Res, 66, 83–109, 1961. a
Cullen, M.: The impact of high vertical resolution in the Met Office Unified Model, Q. J. Roy. Meteor. Soc., 143, 278–287, 2017. a, b
Domeisen, D. I., Martius, O., and Jiménez-Esteve, B.: Rossby wave propagation into the Northern Hemisphere stratosphere: The role of zonal phase speed, Geophys. Res. Lett., 45, 2064–2071, 2018. a
Domeisen, D. I., Butler, A. H., Charlton-Perez, A. J., Ayarzagüena, B., Baldwin, M. P., Dunn-Sigouin, E., Furtado, J. C., Garfinkel, C. I., Hitchcock, P., Karpechko, A. Y., Kim, H., Knight, J., Lang, A. L., Lim, E.-P., Marshall, A., Roff, G., Schwartz, C., Simpson, I. R., Son, S.-W., and Taguchi, M.: The Role of the Stratosphere in Subseasonal to Seasonal Prediction: 1. Predictability of the Stratosphere, J. Geophys. Res.-Atmos., 125, e2019JD030920, https://doi.org/10.1029/2019JD030920, 2020a. a
Domeisen, D. I., Butler, A. H., Charlton-Perez, A. J., Ayarzagüena, B., Baldwin, M. P., Dunn-Sigouin, E., Furtado, J. C., Garfinkel, C. I., Hitchcock, P., Karpechko, A. Y., Kim, H., Knight, J., Lang, A. L., Lim, E.-P., Marshall, A., Roff, G., Schwartz, C., Simpson, I. R., Son, S.-W., and Taguchi, M.: The Role of the Stratosphere in Subseasonal to Seasonal Prediction: 2. Predictability arising from Stratosphere-Troposphere Coupling, J. Geophys. Res.-Atmos., 125, e2019JD030923, https://doi.org/10.1029/2019JD030923, 2020b. a, b, c
Dörnbrack, A., Gisinger, S., Kaifler, N., Portele, T. C., Bramberger, M., Rapp, M., Gerding, M., Söder, J., Žagar, N., and Jelić, D.: Gravity waves excited during a minor sudden stratospheric warming, Atmos. Chem. Phys., 18, 12915–12931, https://doi.org/10.5194/acp-18-12915-2018, 2018. a
Duck, T. J., Whiteway, J. A., and Carswell, A. I.: Lidar observations of gravity wave activity and Arctic stratospheric vortex core warming, Geophys. Res. Lett., 25, 2813–2816, 1998. a
ECMWF: ECMWF Confluence Wiki, https://confluence.ecmwf.int/display/S2S/Models, last access: 9 May 2022a. a
ECMWF: S2S archive, https://confluence.ecmwf.int/display/S2S/S2S+archive, last access: 9 November 2022b. a
Ern, M., Preusse, P., Alexander, M. J., and Warner, C. D.: Absolute values of gravity wave momentum flux derived from satellite data, J. Geophys. Res.-Atmos., 109, D20103, https://doi.org/10.1029/2004JD004752, 2004. a
Fritts, D. C. and Alexander, M. J.: Gravity wave dynamics and effects in the middle atmosphere, Rev. Geophys., 41, 1003, https://doi.org/10.1029/2001RG000106, 2003. a, b, c, d
Gupta, A., Birner, T., Dörnbrack, A., and Polichtchouk, I.: Importance of gravity wave forcing for springtime southern polar vortex breakdown as revealed by ERA5, Geophys. Res. Lett., 48, e2021GL092762, https://doi.org/10.1029/2021GL092762, 2021. a
Haynes, P., McIntyre, M., Shepherd, T., Marks, C., and Shine, K. P.: On the “downward control” of extratropical diabatic circulations by eddy-induced mean zonal forces, J. Atmos. Sci., 48, 651–678, 1991. a
Hersbach, H., Bell, B., Berrisford, P., Biavati, G., Horányi, A., Muñoz Sabater, J., Nicolas, J., Peubey, C., Radu, R., Rozum, I., Schepers, D., Simmons, A., Soci, C., Dee, D., and Thépaut, J-N.: ERA5 hourly data on pressure levels from 1959 to present, Copernicus Climate Change Service (C3S) Climate Data Store (CDS), https://doi.org/10.24381/cds.bd0915c6, 2018. a
Hersbach, H., Bell, B., Berrisford, P., Hirahara, S., Horányi, A., Muñoz-Sabater, J., Nicolas, J., Peubey, C., Radu, R., Schepers, D., Simmons, A., Soci, C., Abdalla, S., Abellan, X., Balsamo, G., Bechtold, P., Biavati, G., Bidlot, J., Bonavita, M., De Chiara, G., Dahlgren, P., Dee, D., Diamantakis, M., Dragani, R., Flemming, J., Forbes, R., Fuentes, M., Geer, A., Haimberger, L., Healy, S., Hogan, R. J., Hólm, E., Janisková, M., Keeley, S., Laloyeaux, P., Lopez, P., Lupu, C., Radnoti, G., de Rosnay, P., Rozum, I., Vamborg, F., Villaume, S., and Thépaut, J.-N.: The ERA5 global reanalysis, Q. J. Roy. Meteor. Soc., 146, 1999–2049, 2020. a
Hindley, N., Wright, C., Hoffmann, L., Moffat-Griffin, T., and Mitchell, N.: An 18 year climatology of directional stratospheric gravity wave momentum flux from 3-D satellite observations, Geophys. Res. Lett., 47, https://doi.org/10.1029/2020GL089557, e2020GL089557, 2020. a
Hitchcock, P. and Shepherd, T. G.: Zonal-mean dynamics of extended recoveries from stratospheric sudden warmings, J. Atmos. Sci., 70, 688–707, 2013. a
Hitchcock, P., Shepherd, T. G., Taguchi, M., Yoden, S., and Noguchi, S.: Lower-stratospheric radiative damping and polar-night jet oscillation events, J. Atmos. Sci., 70, 1391–1408, 2013. a
Hitchcock, P., Butler, A., Charlton-Perez, A., Garfinkel, C. I., Stockdale, T., Anstey, J., Mitchell, D., Domeisen, D. I. V., Wu, T., Lu, Y., Mastrangelo, D., Malguzzi, P., Lin, H., Muncaster, R., Merryfield, B., Sigmond, M., Xiang, B., Jia, L., Hyun, Y.-K., Oh, J., Specq, D., Simpson, I. R., Richter, J. H., Barton, C., Knight, J., Lim, E.-P., and Hendon, H.: Stratospheric Nudging And Predictable Surface Impacts (SNAPSI): a protocol for investigating the role of stratospheric polar vortex disturbances in subseasonal to seasonal forecasts, Geosci. Model Dev., 15, 5073–5092, https://doi.org/10.5194/gmd-15-5073-2022, 2022. a
Holton, J. R.: The influence of gravity wave breaking on the general circulation of the middle atmosphere, J. Atmos. Sci., 40, 2497–2507, 1983. a
Karpechko, A. Y., Charlton-Perez, A., Balmaseda, M., Tyrrell, N., and Vitart, F.: Predicting sudden stratospheric warming 2018 and its climate impacts with a multimodel ensemble, Geophys. Res. Lett., 45, 13538–13546, 2018. a, b
Kautz, L.-A., Polichtchouk, I., Birner, T., Garny, H., and Pinto, J. G.: Enhanced extended-range predictability of the 2018 late-winter Eurasian cold spell due to the stratosphere, Q. J. Roy. Meteor. Soc., 146, 1040–1055, 2020. a
Kodera, K., Mukougawa, H., Maury, P., Ueda, M., and Claud, C.: Absorbing and reflecting sudden stratospheric warming events and their relationship with tropospheric circulation, J. Geophys. Res.-Atmos., 121, 80–94, 2016. a
Kuchar, A., Sacha, P., Eichinger, R., Jacobi, C., Pisoft, P., and Rieder, H.: On the impact of Himalaya-induced gravity waves on the polar vortex, Rossby wave activity and ozone, EGUsphere [preprint], https://doi.org/10.5194/egusphere-2022-474, 2022. a
Lawrence, Z. D., Abalos, M., Ayarzagüena, B., Barriopedro, D., Butler, A. H., Calvo, N., de la Cámara, A., Charlton-Perez, A., Domeisen, D. I. V., Dunn-Sigouin, E., García-Serrano, J., Garfinkel, C. I., Hindley, N. P., Jia, L., Jucker, M., Karpechko, A. Y., Kim, H., Lang, A. L., Lee, S. H., Lin, P., Osman, M., Palmeiro, F. M., Perlwitz, J., Polichtchouk, I., Richter, J. H., Schwartz, C., Son, S.-W., Statnaia, I., Taguchi, M., Tyrrell, N. L., Wright, C. J., and Wu, R. W.-Y.: Quantifying stratospheric biases and identifying their potential sources in subseasonal forecast systems, Weather Clim. Dynam., 3, 977–1001, https://doi.org/10.5194/wcd-3-977-2022, 2022. a, b, c, d
Limpasuvan, V., Thompson, D. W., and Hartmann, D. L.: The life cycle of the Northern Hemisphere sudden stratospheric warmings, J. Climate, 17, 2584–2596, 2004. a
Lindzen, R. S. and Fox-Rabinovitz, M.: Consistent vertical and horizontal resolution, Mon. Weather Rev., 117, 2575–2583, 1989. a, b, c, d
Matsuno, T.: A dynamical model of the stratospheric sudden warming, J. Atmos. Sci., 28, 1479–1494, 1971. a
Polichtchouk, I. and Scott, R. K.: Spontaneous inertia-gravity wave emission from a nonlinear critical layer in the stratosphere, Q. J. Roy. Meteor. Soc., 146, 1516–1528, https://doi.org/10.1002/qj.3750, 2020. a
Polichtchouk, I., Stockdale, T., Bechtold, P., Diamantakis, M., Malardel, S., Sandu, I., Vana, F., and Wedi, N.: Control on stratospheric temperature in IFS: resolution and vertical advection, European Centre for Medium-Range Weather Forecasts, Technical Memorandum No. 847, 2019. a, b
Polichtchouk, I., van Niekerk, A., and Wedi, N.: Resolved gravity waves in the extra-tropical stratosphere: Effect of horizontal resolution increase from O (10 km) to O (1 km), J. Atmos. Sci., 1, https://doi.org/10.1175/JAS-D-22-0138.1, 2022a. a
Polichtchouk, I., Wedi, N., and Kim, Y.-H.: Resolved gravity waves in the tropical stratosphere: Impact of horizontal resolution and deep convection parametrization, Q. J. Roy. Meteor. Soc., 148, 233–251, 2022b. a, b
Preusse, P., Dörnbrack, A., Eckermann, S. D., Riese, M., Schaeler, B., Bacmeister, J. T., Broutman, D., and Grossmann, K. U.: Space-based measurements of stratospheric mountain waves by CRISTA 1. Sensitivity, analysis method, and a case study, J. Geophys. Res.-Atmos., 107, CRI 6-1–CRI 6-23, https://doi.org/10.1029/2001JD000699, 2002. a
Roeckner, E., Brokopf, R., Esch, M., Giorgetta, M., Hagemann, S., Kornblueh, L., Manzini, E., Schlese, U., and Schulzweida, U.: Sensitivity of simulated climate to horizontal and vertical resolution in the ECHAM5 atmosphere model, J. Climate, 19, 3771–3791, 2006. a
Sato, K.: A statistical study of the structure, saturation and sources of inertio-gravity waves in the lower stratosphere observed with the MU radar, J. Atmos. Terr. Phys., 56, 755–774, 1994. a
Skamarock, W. C., Snyder, C., Klemp, J. B., and Park, S.-H.: Vertical resolution requirements in atmospheric simulation, Mon. Weather Rev., 147, 2641–2656, 2019. a, b
Song, B.-G., Chun, H.-Y., and Song, I.-S.: Role of gravity waves in a vortex-split sudden stratospheric warming in January 2009, J. Atmos. Sci., 77, 3321–3342, 2020. a
Torrence, C. and Compo, G. P.: A practical guide to wavelet analysis, B. Am. Meteorol. Soc., 79, 61–78, 1998. a
Tripathi, O. P., Baldwin, M., Charlton-Perez, A., Charron, M., Eckermann, S. D., Gerber, E., Harrison, R. G., Jackson, D. R., Kim, B.-M., Kuroda, Y., Lang, A., Mahmood, S., Mizuta, R., Roff, G., Sigmond, M., Son, S.-W.: The predictability of the extratropical stratosphere on monthly time-scales and its impact on the skill of tropospheric forecasts, Q. J. Roy. Meteor. Soc., 141, 987–1003, 2015a. a
Tripathi, O. P., Charlton-Perez, A., Sigmond, M., and Vitart, F.: Enhanced long-range forecast skill in boreal winter following stratospheric strong vortex conditions, Environ. Res. Lett., 10, 104007, https://doi.org/10.1088/1748-9326/10/10/104007, 2015b. a
Venkat Ratnam, M., Tsuda, T., Jacobi, C., and Aoyama, Y.: Enhancement of gravity wave activity observed during a major Southern Hemisphere stratospheric warming by CHAMP/GPS measurements, Geophys. Res. Lett., 31, L16101, https://doi.org/10.1029/2004GL019789, 2004. a
Vitart, F., Ardilouze, C., Bonet, A., Brookshaw, A., Chen, M., Codorean, C., Déqué, M., Ferranti, L., Fucile, E., Fuentes, M., Hendon, H., Hodgson, J., Kang, H.-S., Kumar, A., Lin, H., Liu, G., Liu, X., Malguzzi, P., Mallas, I., Manoussakis, M., Mastrangelo, D., MacLachlan, C., McLean, P., Minami, A., Mladek, R., Nakazawa, T., Najm, S., Nie, Y., Rixen, M., Robertson, A. W., Ruti, P., Sun, C., Takaya, Y., Tolstykh, M., Venuti, F., Waliser, D., Woolnough, S., Wu, T., Won, D.-J., Xiao, H., Zaripov, R., and Zhang, L.: The subseasonal to seasonal (S2S) prediction project database, B. Am. Meteorol. Soc., 98, 163–173, 2017. a
Waite, M. L.: Dependence of model energy spectra on vertical resolution, Mon. Weather Rev., 144, 1407–1421, 2016. a, b
Wang, L. and Alexander, M. J.: Gravity wave activity during stratospheric sudden warmings in the 2007–2008 Northern Hemisphere winter, J. Geophys. Res.-Atmos., 114, D18108, https://doi.org/10.1029/2009JD011867, 2009. a, b, c
Wicker, W.: wwicker/IFS_GW_SSW: Original release (v1.0.0), Zenodo [code], https://doi.org/10.5281/zenodo.7529461, 2023. a
Wu, R. W.-Y., Wu, Z., and Domeisen, D. I. V.: Differences in the sub-seasonal predictability of extreme stratospheric events, Weather Clim. Dynam., 3, 755–776, https://doi.org/10.5194/wcd-3-755-2022, 2022. a
Yamashita, C., Liu, H.-L., and Chu, X.: Gravity wave variations during the 2009 stratospheric sudden warming as revealed by ECMWF-T799 and observations, Geophys. Res. Lett., 37, 2010. a, b
- Abstract
- Introduction
- Data and methods
- Increased vertical resolution strengthens SSW temperature anomaly in the polar stratosphere
- Stratospheric drag by gravity waves with small vertical wavelengths
- Conclusions
- Appendix A
- Appendix B
- Code availability
- Data availability
- Author contributions
- Competing interests
- Disclaimer
- Acknowledgements
- Financial support
- Review statement
- References