the Creative Commons Attribution 4.0 License.
the Creative Commons Attribution 4.0 License.
 | 07 Oct 2024
Impact of stochastic physics on the representation of atmospheric blocking in EC-Earth3
Michele Filippucci
Simona Bordoni
Paolo Davini
Atmospheric blocking is a synoptic-scale phenomenon that consists in an obstruction of the normal easterly progression of weather patterns in the midlatitudes, leading to persistent atmospheric conditions sometimes associated with extreme weather. State-of-the-art climate models systematically underestimate winter atmospheric-blocking frequency, especially over Europe. This is often attributed to a poor representation of small-scale processes that are fundamental for the onset and maintenance of blocking events. Here, we explore how the implementation of two stochastic parameterizations, namely the stochastically perturbed parameterization tendencies (SPPTs) and the stochastic kinetic energy backscatter (SKEB) schemes, influences the representation of Northern Hemisphere winter blocking in EC-Earth3.
We show that the activation of the two stochastic schemes has moderate detrimental effects on blocking representation, when assessed through a gradient reversal index. Using a zonal–blocked flow linear decomposition, we attribute such modification to changes in the mean winter atmospheric circulation, primarily manifested in a strengthening of the midlatitude jet stream and an intensification of the Hadley cell. Ultimately, an analysis of the meridional transport of zonal momentum by stationary and transient eddies reveals that these circulation differences arise from changes in tropical stationary-eddy activity. Our findings reconnect with earlier literature on similar experiments and suggest that the activation of stochastic parameterizations may require a retuning of the model to account for the resulting significant changes in the mean atmospheric circulation.
- Article
(8192 KB) - Full-text XML
-
Supplement
(2578 KB) - BibTeX
- EndNote


Atmospheric blocking is a synoptic-scale weather phenomenon characterized by a quasi-stationary high-pressure low-vorticity system, which disrupts the usual eastward progression of weather patterns (Charney and DeVore, 1979; Hoskins et al., 1985). Blocking is observed in both hemispheres and in all seasons, although it is most frequent in the Northern Hemisphere (NH) in boreal winter and spring. The anomalous circulation induced by blocking can last from several days up to a few weeks, with significant impacts on regional weather conditions. Atmospheric blocking can arise from different weather configurations. A unique theory on its formation, development and decay, as well as a unique definition, remains elusive (Masato et al., 2012; Barnes et al., 2012; Woollings et al., 2018). Yet blocking events share some common characteristics, like a deflection of the normal midlatitude westerly flow, which can result in a reversal of the climatological winds in the southern flank of the blocked region. Depending on the season, atmospheric blocking can cause a temperature anomaly dipole on its upstream and downstream flanks, sometimes leading to heat waves, drought or exceptional snowfall conditions (Rex, 1950; Buehler et al., 2011; Sousa et al., 2018).
Another peculiar feature of blocking is related to its numerical simulation: current state-of-the-art general circulation models (GCMs) struggle to correctly represent important features of atmospheric blocking, systematically underestimating its frequency especially over the European region. Additionally, only moderate progress has been made in recent years compared to other aspects of climate modeling (Masato et al., 2013; Davini and d’Andrea, 2020). The inadequate representation of atmospheric blocking by GCMs is likely due to its inherent nature, which involves highly nonlinear dry and moist processes, where scale interactions are of key importance (Charney and DeVore, 1979; Reinhold and Pierrehumbert, 1982; Faranda et al., 2016; Steinfeld and Pfahl, 2019). These nonlinear interactions are difficult to capture both analytically and numerically, as models cannot explicitly resolve the wide range of scales of atmospheric motions due to limitations in computing resources. As a result, GCMs feature biases in atmospheric-blocking frequency, especially over Europe (Masato et al., 2013; Woollings et al., 2018; Davini and d’Andrea, 2020). Numerical weather prediction (NWP) models also have similar struggles with representing atmospheric-blocking onset, systematically overestimating the propagation distance of Rossby wave packets (Quinting and Vitart, 2019).
There is evidence that increasing GCMs' resolution is beneficial for better representing atmospheric-blocking frequency (Berckmans et al., 2013; Schiemann et al., 2017; Davini et al., 2017a). Yet there are numerous other elements of numerical modeling that compete for the same resources: the need to produce large enough simulation ensembles, to integrate over longer time windows and to model other Earth system components (Dawson and Palmer, 2015). It has, therefore, been necessary to find a trade-off between explicitly representing small spatial scales and making use of expensive computational resources that may be required for other purposes.
The stochastically perturbed parameterization tendency (SPPT) and the stochastic kinetic energy backscatter (SKEB) schemes, developed at the European Center for Medium-Range Weather Forecasts (ECMWF) and implemented in their Integrated Forecasting System (IFS) (Buizza et al., 1999), were designed to address model uncertainty by introducing perturbations that represent the effect of unresolved subgrid-scale variability. This is done by accounting for the propagation of errors from small to macroscopic scales and the turbulent cascade characteristic of turbulent motion through stochastic perturbations within the parameterizations of the climate model physics.
At first, stochastic parameterizations were adopted for numerical weather forecasts and have enhanced the reliability of medium-range and seasonal ensemble forecasts by improving the probabilistic representation of atmospheric variability (Buizza et al., 1999; Palmer, 2001). Later on, several studies demonstrated how the same parameterizations can also be beneficial at climate scales (e.g., Lin and Neelin, 2003; Arnold et al., 2013), by reducing model biases in a number of atmospheric circulation features (Weisheimer et al., 2014; Yang et al., 2019). Interestingly, such improvements appear to be similar to those due to increased horizontal resolution (Berner et al., 2012). In fact, by representing the atmospheric variability that arises from unresolved scales of the atmospheric flow, stochastic parameterizations can be thought of as an alternative to increasing model resolution at a fraction of the computational cost.
Among other aspects, the SPPT scheme has been shown to have a strong influence on tropical precipitation. Vidale et al. (2021) showed how SPPT is ameliorating the representation of tropical cyclones by both improving the number of cyclone seeds and providing more suitable conditions for their transition into tropical cyclones. Pickl et al. (2022) showed that SPPT increases the frequency of strong upward motions and modifies tropical precipitation rates. Strommen et al. (2019a) found that the SPPT scheme alters the cloud liquid water content in tropical clouds and evaporation from the Earth's surface, slightly modifying the atmosphere radiative budget and the overall tropical climate (Strommen et al., 2019b, a). Both Strommen et al. (2019a) and Pickl et al. (2022) attribute the systematic changes in tropical climate to the fact that a symmetric zero-mean perturbation can lead to a unidirectional response when applied to a nonlinear system. Such an effect is more evident in the tropics, as the magnitude of the SPPT perturbations on average scales with the magnitude of the deterministic tendency, which is larger in the tropics than in the extratropics (Leutbecher et al., 2017).
Impacts of stochastic parameterizations are, however, not limited to the tropical climate. Focusing on midlatitudes, Dawson and Palmer (2015) investigated the impact of SPPT on the representation of North Atlantic weather regimes, which are recurring and quasi-stable patterns of regional weather conditions that characterize the North Atlantic midlatitude climate. In their study, they showed that the SPPT scheme is able to improve the representation of weather regimes similarly to what is seen when model resolution is increased. A similar result was obtained by Christensen et al. (2015) in an idealized experimental setup. Atmospheric blocking is highly correlated with some of the North Atlantic winter weather regimes, suggesting that the representation of atmospheric blocking may likewise benefit from stochastic parameterizations. Moreover, a systematic review of the representation of atmospheric blocking in the IFS seasonal forecasts has shown how SPPT is able to modify the distribution and frequency of blocking events (Davini et al., 2021), slightly increasing blocking activity in low latitudes and decreasing it in midlatitudes. However, both Dawson and Palmer (2015) and Davini et al. (2021) only reported on the impact of SPPT without exploring the dynamical reasons leading to such changes.
Building on this existing body of work, in this paper we explore the extent to which the implementation of the SPPT and SKEB schemes improves the representation of atmospheric blocking in a state-of-the-art GCM, namely EC-Earth, which has IFS as its atmospheric component. More specifically, we aim at shedding light on the dynamical mechanisms affecting the representation of atmospheric blocking when stochastic schemes are implemented, hence reconciling our results with earlier literature. This is done by making use of the Climate SPHINX (Stochastic Physics HIgh resolutioN eXperiments) experiment dataset (Davini et al., 2017b), a set of simulations where EC-Earth was run at multiple horizontal resolutions with and without stochastic parameterizations. While the experiment dates back to 2017, it still represents an outstanding set of simulations and a so-far unexplored opportunity to delve into the representation of atmospheric blocking in this context. Moreover, the extensive number of studies that used the same dataset (e.g., Yang et al., 2019; Strommen et al., 2019b; Vidale et al., 2021) enables us to compare and connect our results with earlier findings on different aspects of the atmospheric circulation.
With these goals in mind, the paper is structured as follows: first, in Sect. 2, we describe the Climate SPHINX experiment (Sect. 2.1), the stochastic parameterizations (Sect. 2.2), the diagnostic tools employed in our analyses (Sect. 2.3) and the physical quantities used in this study (Sect. 2.4). Then, in Sect. 3 we move to the description of how the activation of the stochastic parameterizations impacts the atmospheric-blocking frequency (Sect. 3.1) and the NH winter mean state (Sect. 3.2). More process-oriented insight into these observed changes is provided in Sect. 4, through a novel linear blocked–zonal flow decomposition (Sect. 4.1) and an analysis of the zonal momentum balance (Sect. 4.2). Lastly, in Sect. 5, we summarize and discuss our results.
2.1 Data
The dataset we use in this work is the Climate SPHINX experiment dataset, which is composed of multiple ensemble members categorized per resolution and per parameterization (Davini et al., 2017b). The experiment has been carried out using EC-Earth v3.1, which is based on IFS cy36r4 (Donners et al., 2012; Döscher et al., 2022), in atmosphere-only configuration at five different horizontal resolutions: TL159 (∼ 125 km), TL255 (∼ 80 km), TL511 (∼ 40 km), TL799 (∼ 25 km) and TL1279 (∼ 16 km). The abbreviation “TL-x” stands for linear truncation: IFS is a spectral model and “x” indicates the spectral harmonic at which the truncation occurs. All the simulations have 91 vertical levels. The Climate SPHINX simulations considered here cover the historical period from 1979 to 2008. Further details on the boundary and initial conditions can be found in Davini et al. (2017b).
Simulations have been produced using two different model configurations: the “baseline” version of EC-Earth 3.1 and the “stochastic” version of the same model, in which both the SPPT (Buizza et al., 1999; Palmer et al., 2009) and the SKEB (Berner et al., 2009; Shutts, 2015) schemes are used. For each of the two model setups, with and without the stochastic parameterizations, simulations have been run with different resolutions ranging from 125 to 16 km, with decreasing ensemble size for increasing resolution. Available simulations are summarized in Table 1. As a reference observational dataset, we use the ECMWF ERA5 reanalysis (Hersbach et al., 2020). Both datasets have been regridded to a resolution of 2.5°×2.5°, which represents a good trade-off between resolution and a computationally lightweight analysis.
The analysis presented in this article focuses on the extended winter period from December through March (DJFM). This choice is motivated by the fact that the winter period corresponds to the transient activity maximum, an aspect of the atmospheric circulation that is expected to be better represented through the adoption of stochastic parameterizations (Berner et al., 2012; Dawson and Palmer, 2015; Davini et al., 2017b). Indeed, most models struggle with representing wave-breaking atmospheric-blocking events in the European sector (Masato et al., 2013; Davini and d’Andrea, 2020), which are most frequent in boreal winter and spring and whose frequency is influenced by transient eddy activity in the North Atlantic (Shutts, 1983; Nakamura and Huang, 2018).
The model tuning has been performed at TL255 resolution (the default EC-Earth3 configuration) in the deterministic configuration, and the parameters are kept constant for all other simulations. This choice allows for a direct comparison between the various runs, with resolution and stochastic parameterizations being the only possible reasons for observed changes in simulated climate. A downside of this tuning strategy is that untuned resolutions can produce unrealistic behavior, as some of the parameterizations, even if mostly scale-aware in IFS, might operate differently when smaller scales are dynamically resolved. For this reason, we exclude from our analysis the TL1279 resolution, for which, additionally, only a single ensemble member is available.
For the purpose of this analysis we performed an arithmetic non-weighted average over all ensemble members, which considers all members of equal importance regardless of resolution. It is important to note how this procedure gives a larger weight to the lower-resolution experiments than to the higher-resolution ones, as the former's ensembles are larger in size. The averaging is performed only after nonlinear computations – such as atmospheric-blocking frequency and other nonlinear variables – are performed. The choice to ignore the ensemble member resolution may seem counterintuitive, since it could be expected that the impact of the stochastic parameterization would decrease as resolution increases. Both the SPPT and SKEB parameterizations have been developed within a seamless prediction framework so that their impact on model physics is planned to decrease as resolution increases, making the parameterization suitable for both NWP resolutions and coarser GCM resolutions (Palmer et al., 2009). That said, our choice is motivated by the fact that an analysis of the differences between baseline and stochastic simulations grouped by resolution did not reveal significant differences, highlighting a systematic effect of the parameterizations that is almost independent of resolution (see Figs. S1–S4 in the Supplement). Additionally, averaging all available ensembles – composed of 29 members – allows us to obtain results that are statistically more robust. Statistical significance has been assessed through a Student t test. The variance of each variable has been calculated as the statistical variance among the ensemble members. The significance of the anomalies has been computed using the following formula:
where Ts is the Student T value, x1 and x2 are the ensemble means of the analyzed fields, and and are their standard deviations. The Ts value has been therefore compared with a reference value for the 98 % confidence interval chosen considering the size of the ensemble. Given the large number of ensemble members and simulated years, in all figures anomalies shown are significant at this confidence level.
Table 1Number of ensemble members per resolution and experimental setup. Rows refer to the two experimental setups, the baseline and stochastic experiments, respectively, as described in Sect. 2.1. Columns refer to the available resolutions defined by their linear spectral truncation.

2.2 SPPT and SKEB schemes
The SKEB and SPPT schemes have been developed at ECMWF specifically for the IFS model, which is the atmospheric component of EC-Earth. The SKEB scheme has been developed in order to represent the effect of the turbulent kinetic energy cascade (Berner et al., 2009; Shutts, 2015): the energy that is dissipated at smaller scales is not lost by the system but is randomly distributed at larger scales through a perturbation of the deterministic streamfunction tendency. With as the streamfunction tendency, the deterministic tendency and a random perturbation of the streamfunction, the stochastic scheme operates so that
Even though the SKEB scheme accounts for variability that is not represented in the deterministic version of the model, its impact on the simulated climate is negligible (Davini et al., 2017b).
The major impact on the representation of atmospheric variability comes from the SPPT scheme, which has been developed in order to represent the influence of subgrid variability on the large-scale dynamics (Buizza et al., 1999; Palmer et al., 2009). SPPT introduces variability by perturbing the deterministic parameterization tendencies of the temperature, specific humidity and wind fields as follows:
where X is the total tendency of each of the physical quantities above, D is the dynamical tendency, K the horizontal diffusion and Pi is the tendency coming from the ith parameterization scheme (radiation, turbulence and gravity wave drag, non-orographic gravity wave drag, convection, and large-scale water processes). The term in parentheses e is a zero-mean perturbation, and μ is a parameter that sets the perturbation to zero at the surface and top atmospheric boundary. The perturbation e is generated as the sum of three independent patterns that are spatially correlated at 500, 1000 and 2000 km and have a temporal decorrelation of 6 h, 3 d and 30 d, representing the different scales of subgrid variability that can be influenced by subgrid-scale processes.
2.3 Atmospheric-blocking detection method
A plethora of blocking detection methods exist, and both the pattern and the magnitude of the resulting atmospheric-blocking frequency can vary considerably depending on the chosen method (Woollings et al., 2018). These methods can be classified into two broad classes: absolute indices, which look for a specific wind pattern in the synoptic flow, and anomaly indices, which look for field departures from the time mean. In the following, we adopt a two-dimensional absolute index based on the geopotential height gradient reversal, first developed by Tibaldi and Molteni (1990) for a single latitudinal coordinate (60° N) and then extended to other latitudes (from 30 to 75° N) by Scherrer et al. (2006) and Davini et al. (2012). We also tested a simple implementation of an anomaly-based index similar to the one adopted by Woollings et al. (2018), and we found that our results slightly change depending on the index used, even though our main conclusions remain unchanged. In particular, the anomaly index shows less sensitivity to the implementation of stochastic parameterizations compared to the gradient reversal one.
We opted for the gradient reversal index as absolute indices are suited for detecting atmospheric blocking originating from a Rossby wave-breaking event (Woollings et al., 2018). This is convenient as they look for a particular synoptic pattern rather than a geopotential height anomaly, which may be caused by a number of concurrent phenomena, making a process-based understanding more difficult to achieve. In addition to this, Rossby-wave-breaking blocking is a crucial area of study as it impacts the midlatitudes during winter, and its frequency is systematically underestimated by current state-of-the-art GCMs, especially over Europe (Masato et al., 2013; Davini and d’Andrea, 2020). The additional analysis carried out with the anomaly index can be found in the Supplement (Fig. S8).
The gradient reversal method operates as follows. For each grid point we evaluate the northward (GHGN) and southward gradient (GHGS) of the geopotential height at 500 hPa, z500:
in which λ0 and ϕ0 represent the grid point longitude and latitude, respectively; ϕ0 ranges from 30 to 75° N and λ0 ranges from 0 to 360°; ϕs=ϕ0–15° latitude and ° latitude. For a grid point of coordinates (λ0,ϕ0), an instantaneous blocking is identified if
We hence obtain a diagnostic matrix with temporal, latitudinal and longitudinal dimensions, where a Boolean value indicates the occurrence of instantaneous blocking.
It is important to note that, albeit widely used in literature, gradient reversal indices as the one adopted here tend to occasionally identify polar intrusions and tropical air masses as blocks, leading to an overestimation of blocking at high and low latitudes (Barriopedro et al., 2010). More stringent criteria have therefore been introduced for the low-latitude region (Davini et al., 2012), for instance, requiring that the meridional gradient of the geopotential height between 15 and 30° south of the blocked grid point be negative. Yet in this study we opt not to apply such a filter as the lower latitudes are significantly affected by the stochastic parameterizations, and the associated anomalies can inform us on systematic mean circulation biases.
On top of the instantaneous blocking detection, we implemented a tracking algorithm that can detect blocking events through a connected component analysis of the diagnostic matrix. Reconstructing the blocking trajectories can bring several advantages and helpful metrics, such as the atmospheric-blocking event duration, area and center-of-mass displacement. However, in the context of the present analyses, the event detection has been exploited exclusively to apply persistence and area filters to blocking events. Atmospheric-blocking events whose duration is shorter than 5 d have been rejected, as well as those events whose area is smaller than 500 000 km2. By applying these filters we select blocking events that interest the synoptic scale and are quasi-persistent, coherently with usual blocking definitions. More details on the tracking algorithm can be found in the Appendix.
In Sect. 3.1 atmospheric-blocking frequency is calculated as the fraction of days (in percentage) for which a grid point is identified as blocked. In Sect. 4.1 we compute the frequency of blocking for a given area by selecting those days when at least 10 % of the selected area is affected by blocking. The 10 % threshold has been selected in order to have a blocking frequency magnitude of the same order of the grid point blocking frequency computed in Sect. 3.1. Our results, however, show little sensitivity to the chosen threshold (not shown).
2.4 Mean-state analysis
To characterize the mean atmospheric circulation we calculate the transient kinetic energy (TKE) and the Eady growth rate (EGR). TKE is obtained by applying a fast Fourier transform temporal filter to the 250 hPa daily zonal and meridional velocity that selects wave activity on timescales shorter than 6 d. The high-pass filter is hence equivalent to a 2–6 d band pass. We then computed kinetic energy as
where the subscript hp denotes high-pass-filtered data. The Eady growth rate at 850 hPa, a commonly used measure of baroclinic instability (Lindzen and Farrell, 1980; Paciorek et al., 2002; Novak et al., 2015) and, hence, of transient eddy activity, is computed as
where f is the Coriolis parameter, N is the Brunt–Väisälä frequency, representing the stability of a parcel of air to vertical displacements, and z is the vertical coordinate.
3.1 Blocking representation
We start by assessing wintertime atmospheric-blocking frequency in EC-Earth3, both in its baseline configuration and with stochastic parameterizations, compared against ERA5 (Fig. 1).
In its default baseline configuration (Fig. 1a), the model overestimates blocking at low latitudes, particularly in the equatorial central Pacific region, while it underestimates it in the midlatitudes over Europe, as commonly seen in several other GCMs (Davini and d’Andrea, 2020). On top of this, the model significantly underestimates blocking at high latitudes in the Bering Strait region. Depending on the specific focus region, relative biases in blocking frequency can be as high as 20 %–30 %.

Figure 1Ensemble mean DJFM climatology (1979–2008) of atmospheric-blocking frequency given as a percentage of blocked days: (a) difference between the baseline version of the model and ERA5, (b) difference between the stochastic version of the model and ERA5, and (c) difference between the stochastic and baseline versions of the model. In panels (a) and (b), shading shows differences in atmospheric-blocking frequency, while black contours indicate blocking frequency in ERA5. In (c), shading shows the difference in blocking frequency between the two model versions, while the black contours show blocking frequency from the baseline ensemble. The thick contour refers to a frequency of 3 % of days, and contours are plotted every 3 %.
Moving to the stochastic configuration, Fig. 1b shows how the SPPT and SKEB parameterizations do not improve the represented atmospheric-blocking frequency. If anything, blocking representation moderately deteriorates over Europe. The only area where some improvements can be seen is over Greenland and in the northernmost regions of the American continent, presumably because of less frequent intrusions of polar cold air masses.
The influence of the implementation of the stochastic parameterizations on atmospheric blocking is more clearly highlighted in Fig. 1c, which shows the difference between the stochastic and baseline model versions. The most evident changes are an increased and decreased frequency at low and higher latitudes, respectively, particularly evident over the Euro-Atlantic region. This will therefore be the main focus area for the remainder of this paper. While a zonally oriented dipole is also evident over the Pacific, in this region the response to the stochastic parameterizations is weaker. The fact that the anomaly is larger at low latitudes and that the impact of stochastic parameterizations is independent of resolution (see Sect. 2.1 and Figs. S1–S4) suggests that the two stochastic schemes introduce a systematic change in the model mean state that is particularly evident at lower latitudes. Yet to identify the origin of such differences, a careful analysis of the entire NH winter mean circulation is necessary.
3.2 Mean winter climate and transient eddy activity
To investigate the reasons behind the deterioration of the Euro-Atlantic wintertime atmospheric blocking when stochastic parameterizations are implemented in EC-Earth, we proceed by analyzing the NH winter mean climate and the transient eddy activity as represented by the stochastic and deterministic versions of the model.
Basic features of the mean atmospheric circulation are shown in Fig. 2, whose panel (a) shows the zonally and seasonally (DJFM) averaged zonal wind on the meridional plane. The stochastic parameterizations result in a strengthening of the upper-tropospheric winds. This is evident for both the Northern Hemisphere and Southern Hemisphere, even though they are in different solsticial conditions. The observed increase in zonal wind primarily affects the northernmost segments of the jet streams and goes together with the wind speed: the stronger the wind intensity, the larger the increase. Similar plots have been produced for the Euro-Atlantic sector only (see Fig. S5), where it is easier to discern a split-jet structure with a clear separation between the eddy-driven and the thermally driven jets. It appears that both jet components are reinforced, even though the eddy-driven jet features a slightly larger increase.
Figure 2b shows the DJFM zonally averaged streamfunction, which identifies the mean meridional circulation. Focusing on the tropics, the Hadley cell extent remains relatively unchanged, in agreement with an earlier study by Strommen et al. (2019a) using the same model and parameterization. However, the streamfunction features positive anomalies, indicative of a strengthening, in the stochastic simulation in the ascending and the descending branches of the NH winter cell. The strengthening is more pronounced in the ascending branch, revealing how the stochastic parameterization preferentially enhances upward motions, leading to a relative change of 5 %–10 % of the climatological streamfunction and a consequently enhanced meridional gradient.

Figure 2(a) DJFM zonally averaged zonal winds (m s−1). (b) DJFM mass overturning streamfunction in the meridional plane (1010 kg s−1). In each plot, the black contours represent the baseline version of the model, while shading shows the difference between the stochastic and baseline versions.
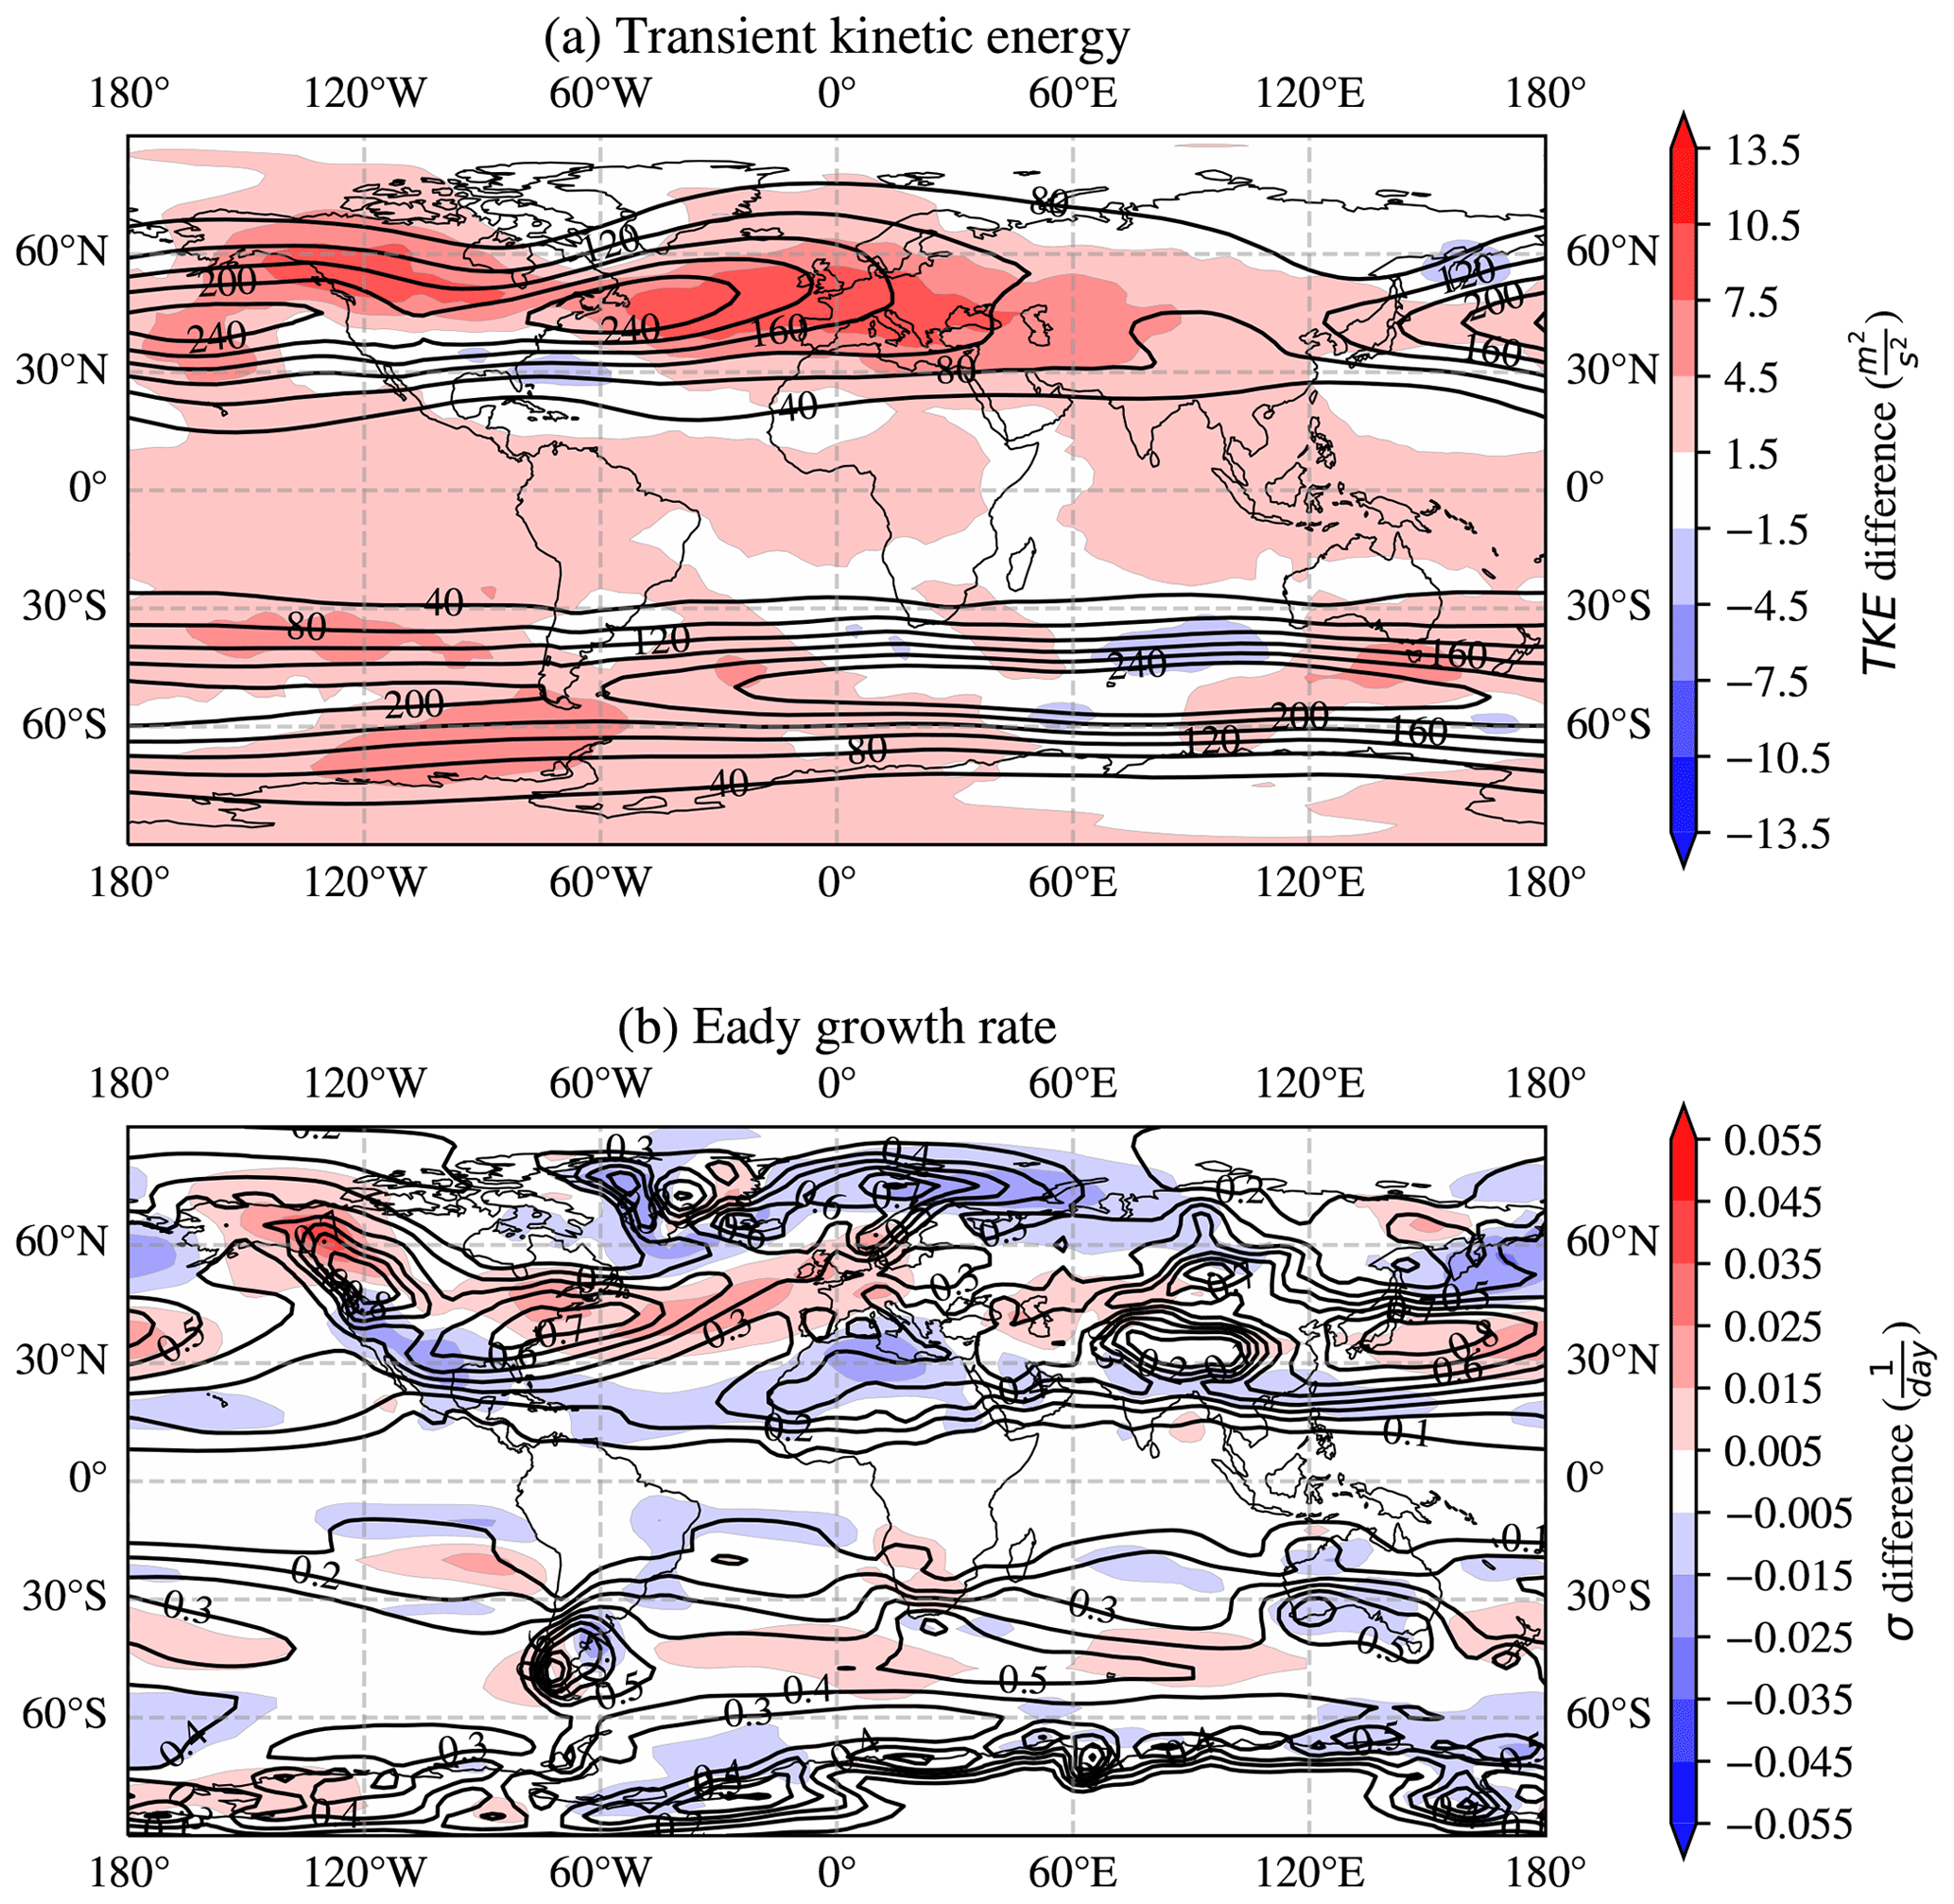
Figure 3(a) DJFM transient kinetic energy (TKE, m2 s−2) at 250 hPa and (b) DJFM Eady growth rate (EGR, d−1) at 850 hPa computed for the baseline and stochastic versions of EC-Earth model. In each plot, the black contours represent the baseline version of the model, while shading shows the difference between the stochastic and baseline versions.
In addition to changes in the climatological winds, we investigate the impact of the stochastic parameterization on the high-frequency atmospheric variability by analyzing two mean-state diagnostics. First, we analyze the NH transient eddy activity in DJFM by computing the 250 hPa TKE. Figure 3a reveals that the stochastic parameterization significantly increases TKE in both hemispheres. While the increase is more pronounced in the winter hemisphere, noteworthy changes are also present in the summer hemisphere. Differences peak at 5 %–10 % in the regions of maximum mean TKE values, i.e., in the storm-track regions. An increase in TKE might be associated with multiple changes: an increase in the number of transient eddies, an increase in their spatial scale and/or an increase in their intensity (e.g., vorticity anomaly). In the midlatitudes, an increase in TKE might be due to an increase in the overall atmospheric baroclinicity, by which baroclinic instability and transient eddy formation are promoted in the storm tracks. However, note how TKE is observed to increase also in the tropics.
To explore the possible connection between TKE and baroclinic eddy activity, in Fig. 3b we show the influence of the stochastic parameterization on the Eady growth rate (EGR). It is evident how EGR increases in regions where EGR itself is maximum, indicating larger instability for areas of high baroclinicity (again, the storm tracks). Such a finding supports the hypothesis of an increased number of transient eddies but does not provide information on the possibility of stronger vorticity anomalies or larger eddy length scale.
Overall, the picture that emerges from the mean-state analysis (Figs. 2 and 3) is one of a more vigorous Hadley circulation that results in an enhanced meridional transport of zonal momentum and a strengthened thermally driven jet. The enhanced wind shear and the resulting thermal-wind balanced meridional temperature gradient are in turn coherent with increased EGR and TKE (Figs. 2a and 3a) in the midlatitudes and a strengthened eddy-driven jet. The TKE increase in the tropics is compatible with the study of Vidale et al. (2021), who highlighted how stochastic parameterizations are increasing the number of tropical cyclone seeds, but other sources of tropical transient eddies may also be implicated in the observed changes. While pointing to an influence of the tropical atmospheric circulation on the midlatitude winds in the chain of contributing causes highlighted above, our analyses are not sufficient to attribute to causal relationships. In particular, the direction of causality between the strengthened zonal winds and the decreased blocking frequency cannot be unambiguously assessed. On the one hand, a strengthened jet stream leads to midlatitude dynamics in which nonlinear processes, such as blocking, occur less frequently (Nakamura and Huang, 2018; Woollings et al., 2018). On the other hand, an increased blocking frequency can lead to a more frequent wind reversal that ultimately results in a weakening of the climatological wind speed. The nontrivial causal relationship between the two will be the subject of the next section.
4.1 Blocked–zonal flow decomposition
Atmospheric-blocking onset and maintenance are highly dependent on the mean atmospheric state and transient variability, both of which have been shown to be affected by the stochastic parameterizations. Mean-state biases in models have been argued to be an important source of bias in the representation of atmospheric blocking (Scaife et al., 2010, 2011), and transient eddies have been linked to atmospheric-blocking onset (Nakamura and Huang, 2018) and its maintenance (Shutts, 1983). In turn, the frequency of atmospheric blocking clearly influences the mean state, causing long-lasting geopotential height, zonal wind and temperature anomalies.
Therefore, it is not clear to what extent changes in atmospheric-blocking frequency can be attributed to systematic changes in the mean atmospheric circulation or, conversely, whether the atmospheric circulation is modified by a different atmospheric-blocking representation primarily in lower latitudes. In other words, is it the mean atmospheric circulation that shapes the atmospheric-blocking frequency or vice versa?
In order to shed light on this causal relationship, here we propose a linear blocked–zonal flow decomposition. The linear decomposition is applied to a specific area, here chosen to be the portion of the northern Euro-Atlantic sector that spans from 60° W to 60° E and from 40 to 70° N, corresponding both to the midlatitude maximum of atmospheric-blocking frequency as represented by the baseline version of the model (see Fig. 1) and to one of the regions where larger differences are observed when the stochastic parameterizations are activated. Specifically, the area in question features a lower blocking frequency in the stochastic simulations. We first express the climatological geopotential height as the sum of the climatological values during blocked and non-blocked days (the method used to identify the chosen area as blocked or non-blocked is described in Sect. 2.3). The difference in the climatological geopotential height in the stochastic version relative to baseline can hence be expressed as
where z is the climatological geopotential height, f is the blocking frequency, and subscripts b and z refer to the average over “blocked” and “zonal” days, respectively, over the chosen area. Moreover, the hat symbol denotes fields from the baseline model version, whereas symbols without the hat denote fields from the stochastic version. After some simple algebra, Eq. (9) becomes
where the stochastic–baseline height anomaly is partitioned into three contributions arising from differences between the two model versions in (i) blocking frequency, (ii) blocking pattern during blocked days and (iii) mean state during non-blocked days.
Height anomalies and the three terms contributing to the linear decomposition described above are shown in Fig. 4. Figure 4a – reporting the left-hand side of Eq. (10) – illustrates how the stochastic parameterization modifies the mean geopotential height within the considered region. Notably, the spatial patterns of these differences resemble the pattern found in Fig. 1c, depicting the atmospheric-blocking frequency differences between the stochastic and baseline runs: a dipole structure, with positive (negative) anomaly in the lower (higher) latitudes over the Atlantic. This is not surprising, as atmospheric blocking is highly dependent on mean-state biases and is expected to occur in regions where stationary anticyclonic zonal anomalies are found (the stationary waves crests, Woollings et al., 2018). That said, an increased atmospheric-blocking frequency can also influence the mean geopotential height field. In the latter case, we would expect the geopotential height anomaly to be present only in days when blocking occurs.
By examining the other three panels (Fig. 4b, c, d), which correspond to the various terms of the decomposition, it becomes clear that the geopotential height differences arise primarily from changes during days when atmospheric blocking is not occurring. Since changes in the geopotential height field are not linked to alterations in blocking frequency or atmospheric-blocking patterns, then it is the mean-state change that influences the overall positioning of stationary waves and the locations of blocking events. To answer the question posed at the beginning of this section (Is it the mean atmospheric circulation that shapes the atmospheric-blocking frequency or vice versa?), it is thus likely that the stochastic parameterization has little effect on the representation of blocking dynamics so that we cannot distinguish any improvement in the represented frequency due to the background change caused by the modified atmospheric circulation.
Moreover, the geopotential height differences depicted in the top right panel and in the bottom left panel reveal that the changed atmospheric circulation produces less frequent but stronger blocking, i.e., associated with larger geopotential height anomalies. The same result was obtained producing atmospheric-blocking composites over the Scandinavian and Greenland regions (not shown). Yet we do not interpret these features as a direct effect of the stochastic parameterizations on atmospheric blocking but rather as an indirect effect due to the changed atmospheric circulation.

Figure 4Linear blocked–zonal flow decomposition in the focus area highlighted by the green rectangle. (a) Geopotential height (m) climatological difference between the stochastic and baseline model versions and contributions to this anomaly arising from (b) differences in blocking frequency, (c) differences in blocking patterns and (d) differences in the mean state during the non-blocked days. See the text for more details.
4.2 Mean meridional momentum transport
Our analyses so far have shown how the use of the SPPT and SKEB stochastic parameterizations causes changes in the winter mean atmospheric circulation that deteriorate the representation of the frequency of atmospheric blocking. Here we attempt to explain differences in the wintertime mean circulation and to reconcile our results with existing literature on the same stochastic parameterizations.
To this aim, we analyze the winter zonally averaged meridional transport of westerly momentum in the midlatitudes and in the tropics, in order to understand why in the stochastic model version the upper-level zonally averaged zonal winds are strengthened. We further decompose this term into contributions by the mean meridional circulation and contributions by transient and stationary eddies (e.g., Dima et al., 2005) as
with angular momentum about the Earth's spin axis , Earth's rotation rate Ω and Earth's radius a. Using standard notation, square brackets denote a zonal mean, overlines denote a temporal mean, and ′ and * denote deviations from the temporal and zonal mean, respectively. With this decomposition, the three terms on the right-hand side represent contributions by (i) the mean meridional circulation, (ii) the transient eddies and (iii) the stationary eddies.
Figure 5 shows these terms for DJFM, with the baseline run confirming the well-known fact that in the midlatitudes westerly momentum transport is primarily accomplished by transient eddies, with some contributions from stationary waves in the NH, while in the tropics transport is primarily affected by the mean meridional circulation and the stationary eddies (Hartmann, 2015).
Moving to the differences between the stochastic and deterministic runs, we find that the activation of the stochastic parameterizations causes an increased southward momentum transfer at low latitudes and an increased northward momentum transport in the NH midlatitudes (Fig. 5a). Changes are primarily confined to the higher troposphere, except for a latitudinal band at ∼50° N, coinciding with the winter storm-track region, where anomalies in momentum transport reach the lower levels. When looking at contributions by the different components, we find that the main difference is in the stationary-eddy term in the equatorial region (Fig. 5d). The stationary eddies in the tropics transport more zonal momentum southward in the stochastic runs than in the baseline runs. Conversely, the stationary eddies in the midlatitudes transport more momentum northward. Yet the differences in the midlatitudes are small compared to the equatorial region, the latter being twice as big as the former. The mean meridional circulation, namely the Hadley circulation, contributes to the strengthening of zonal winds in the midlatitudes by transporting more zonal momentum northward in the stochastic runs (Fig. 5b), confirming results from Fig. 2. The transient eddy momentum transport differences are modest, especially in the tropical regions, where their change is 50 % smaller than the change in stationary wave transport (Fig. 5c). Still, that changes in these two terms have similar patterns suggests a common mechanism altering both the stationary and transient eddy transport.

Figure 5DJFM meridional transport of zonal momentum. Blue contours represent the baseline runs, red contours the stochastic runs and the shading the difference between the two (stochastic − baseline). (a) Total transport, (b) meridional transport of mean zonal momentum by the mean meridional circulation, (c) contribution by transient eddies and (d) contribution by stationary eddies. The contours are plotted with a spacing of 0.4×10⁸ m2 s−2 from 0.2×10⁸ and m2 s−2. Thick contours are positive, and dashed contours are negative. Units for the shadings color bar are m2 s−2 ×10⁶. Please see text for additional information.
To address our initial question, the modified NH winter circulation, which is causing a different winter atmospheric-blocking frequency, is likely to arise from modified stationary waves in the tropics, whose momentum transport is the most affected by the stochastic parameterizations. A possible explanation to such differences is the development of stronger Gill–Matsuno waves that originate from enhanced diabatic heating in the warm-pool region, involving equatorial Rossby and Kelvin waves (Matsuno, 1966; Gill, 1980). Rossby waves converge westerly momentum in their source region, producing the equatorward zonal momentum flux evident in the large modifications in the equatorial zonal momentum transport. At the same time, the enhanced diabatic heating, as well as the associated upper-tropospheric divergence, acts as a wave source for extratropical Rossby waves, altering the midlatitude wave activity and stationary wave pattern (Hoskins and Karoly, 1981; Simmons, 1982; Jin and Hoskins, 1995). Given the magnitude of the tropical anomalies compared to those in the midlatitudes, it is plausible that differences in the midlatitudes emerge mainly as a response to changes in the tropics. Moreover, the mean meridional circulation adjusts to the modified tropical stationary-eddy activity in a way similar to what is described in the study of Dima et al. (2005). In particular, the Hadley cell intensifies to balance the increased stationary-eddy meridional momentum transport (Fig. 2), and the associated meridional transport of westerly momentum further intensifies the jet stream. In a chain of contributing causes, the strengthened jet stream and the modified midlatitude stationary waves reduce blocking activity along the midlatitudes, particularly over the North Atlantic (Fig. 1)
The modified diabatic heating in the tropical region may originate from altered condensation and precipitation processes, as discussed previously in the literature on the SPPT scheme (Pickl et al., 2022; Vidale et al., 2021; Strommen et al., 2019a). This mechanism will be further discussed in the Sect. 5 with concluding remarks.
In Fig. 6 we report on the geopotential height contours in the tropical region, comparing the stochastic simulations with the baseline simulations. It is possible to identify the Gill–Matsuno pattern over the western Pacific, with Rossby wave spreading to the west of the warm pool and the Kelvin wave to the east, for both the stochastic and baseline ensembles. It is clear how anomalies in the geopotential height field at 250 hPa are small in midlatitudes, while those in the tropics considerably modify the tropical circulation.
In order to further confirm the relationship between the large-scale mean circulation changes and a modified tropical circulation, we compute the top-of-atmosphere (TOA) energy balance. We find differences that peak at ∼ 4 W m−2 at tropical latitudes (Fig. S6). These changes are not found in clear-sky conditions, indicating a role of clouds and convection in perturbing the TOA energy balance and further reconciling our work with previous findings from Pickl et al. (2022), Strommen et al. (2019a, b) and Vidale et al. (2021). Determining the underlying mechanisms would require further analyses that are beyond the scope of this paper, but additional details can be found in earlier studies that delved into this particular subject mentioned above.

Figure 6DJFM geopotential field at 250 hPa (m) for baseline (stochastic) simulations in blue (red) line contours and difference between the two in shading. Contours are plotted every 10 m (200 m) for levels higher (lower) than 10 900 m (thick contour). Note that a Lambert cylindrical projection has been used, highlighting the equatorial region. The displayed vectors represent the climatological wind at 250 hPa averaged for all the baseline simulations.
In the present work we show how the activation of the SPPT and SKEB stochastic parameterizations in EC-Earth results in a deterioration of the representation of boreal winter atmospheric blocking assessed through a gradient reversal index. Particularly, focusing on the European region, stochastic parameterizations not only do not improve the common underestimation of blocking frequency by climate models, but also, in fact, lead to larger biases in blocking frequency, with an increase in low latitude and a decrease in midlatitude blocking.
To pinpoint mechanisms responsible for these changes in atmospheric-blocking frequency, we analyze changes in NH winter mean circulation and transient eddy activity. Our analyses show how jet streams in both hemispheres, especially in their northern flanks, intensify, as does the ascending branch of the NH winter Hadley cell. These mean-state changes are accompanied by an increase in the energy associated with transient eddy activity consistent with both enhanced baroclinicity in the storm-track regions and the strengthened jet stream.
To investigate the causal relationship between changes in the NH winter mean circulation and changes in atmospheric blocking, we perform a decomposition of the 500 hPa geopotential height difference between the stochastic and deterministic simulations over the northern Euro-Atlantic sector. We find that the mean geopotential height is not significantly affected by a change in atmospheric-blocking patterns or frequency. Rather, the changed blocking frequency reflects a changed mean state, with a modification coherent with a jet stream strengthening. To further highlight involved mechanisms, we perform a decomposition of the meridional transport of westerly momentum, and we show that changes in the mean circulation can be attributed to modified stationary wave momentum fluxes in the tropics. Building on previous work using the same modeling framework, we speculate that such a modification arises from the tropical stationary wave response to enhanced diabatic heating due to modified condensation and precipitation processes in the tropics.
Therefore, our study gives rise to two distinct outcomes. The first one concerns the implemented stochastic parameterizations, in particular SPPT, which has the largest impact on the atmospheric circulation (Davini et al., 2017b). Even though the SPPT scheme has been originally developed to better represent subgrid variability and achieve a nondeterministic representation of climate, we show that it has a systematic impact on the mean atmospheric circulation, regardless of model resolution. In particular, Strommen et al. (2019a) found that cloud liquid water content in tropical clouds is increasing when SPPT is implemented. The difference was attributed to an asymmetrical process of water condensation: while a stochastic perturbation of humidity in an air parcel can lead to condensation, the evaporation of condensed water into water vapor is not directly affected by the parameterization. It is important to note that, in order to overcome this imbalance, a fix to the SPPT scheme has been implemented (Palmer, 2012), namely a “super-saturation limiter”, which sets the perturbation to zero when it would lead to condensation. However, a stochastic perturbation may still bring an air parcel closer to condensation, whereby the model dynamics trigger the process at the successive temporal step. The condensation process therefore remains asymmetric through the combined effect of the model dynamics and the stochastic physics. Similar asymmetric responses to zero-mean perturbations following the activation of SPPT are described by Pickl et al. (2022), who found that the stochastic scheme increases the occurrence frequency of rapid ascending motions in the tropical region. The authors argue that such modifications affect ascending motions and not descending motions because of the dynamical characteristics of the system; while ascending motions can become unstable, the same argument does not hold for descending motions. In this sense, zero-mean stochastic perturbations can lead to an asymmetric circulation response. The same mechanism has been observed by Deinhard and Grams (2024) for a new stochastic scheme, the stochastically perturbed parameterization (SPP), which directly represents parameter uncertainty in parameterizations within the IFS model. Such phenomena are coherent with what was found by Vidale et al. (2021) while studying the impact of SPPT on tropical cyclones; the authors found that when SPPT is implemented, the ascending motions associated with the cyclone onset, the “cyclone seeds”, are more frequent.
As made evident by the study of Vidale et al. (2021), such modifications do not necessarily lead to biases in the representation of the tropical climate. Indeed, the cyclone seed number found by Vidale et al. (2021) for stochastic simulations is actually closer to observations than that obtained with the deterministic model. Moreover, the asymmetric response to a zero-mean perturbation described by Pickl et al. (2022) is a common feature of dynamical systems applicable to several natural processes. Yet it is necessary to underline that these modifications lead to changes to the model mean state. Specifically, in light of the significant atmospheric circulation changes, a retuning of the model when the SPPT scheme is activated seems necessary.
Once a retuning of the model is performed, it would then be possible to assess whether stochastic parameterizations lead to improvements in atmospheric-blocking representation that are now offset by significant mean-state modifications. If these improvements were to be present, however, they would likely be small compared to the EC-Earth bias. Otherwise they should have been observable despite the impact of the stochastic parameterizations on the mean state, which itself is small compared to the model bias (see Fig. 1).
The second outcome directly concerns the representation of atmospheric blocking in GCMs. The blocked–zonal flow decomposition highlights how the modified blocking frequency has little impact on the mean circulation, while modifications of atmospheric-blocking frequency closely resemble mean circulation differences. The emergence of atmospheric-blocking frequency biases from mean circulation biases is a well-established concept in the existing literature. Indeed, Scaife et al. (2010) already showed how absolute indices used for blocking detection are sensitive to mean-state modifications. More specifically, even a slight alteration in the zonal wind climatological pattern can lead to significant changes in atmospheric-blocking behavior, a finding that was corroborated by a later study (Scaife et al., 2011). Along the same lines, Davini et al. (2022) show how increased model resolution can affect blocking representation by better resolving land orography and enhancing the representation of midlatitudes stationary waves. Similarly, here we show how remote changes in the tropical wave activity have a greater impact on the dynamics of blocking than the local impact of the stochastic parameterizations, strongly modifying atmospheric-blocking frequency through modifications of the overall meridional zonal momentum transfer. This is particularly evident when an absolute index is adopted, as in our main analysis, but we found similar modifications of blocking climatological frequency through an anomaly-based index (see Supplement, Fig. S8).
This result implies that, when studying blocking in climate models, great attention should be given to the underlying mean state, as its representation can have a strong impact on blocking onset region and frequency. Even though our findings do not pinpoint the cause for the underestimation of blocking frequency over the European region by EC-Earth, they highlight how improved understanding of sources of biases in atmospheric blocking requires consideration of different features of the atmospheric circulation and their interactions. Our results stress once again how a wide-perspective approach is necessary to understand the long-standing deficit of climate models in the representation of blocking.
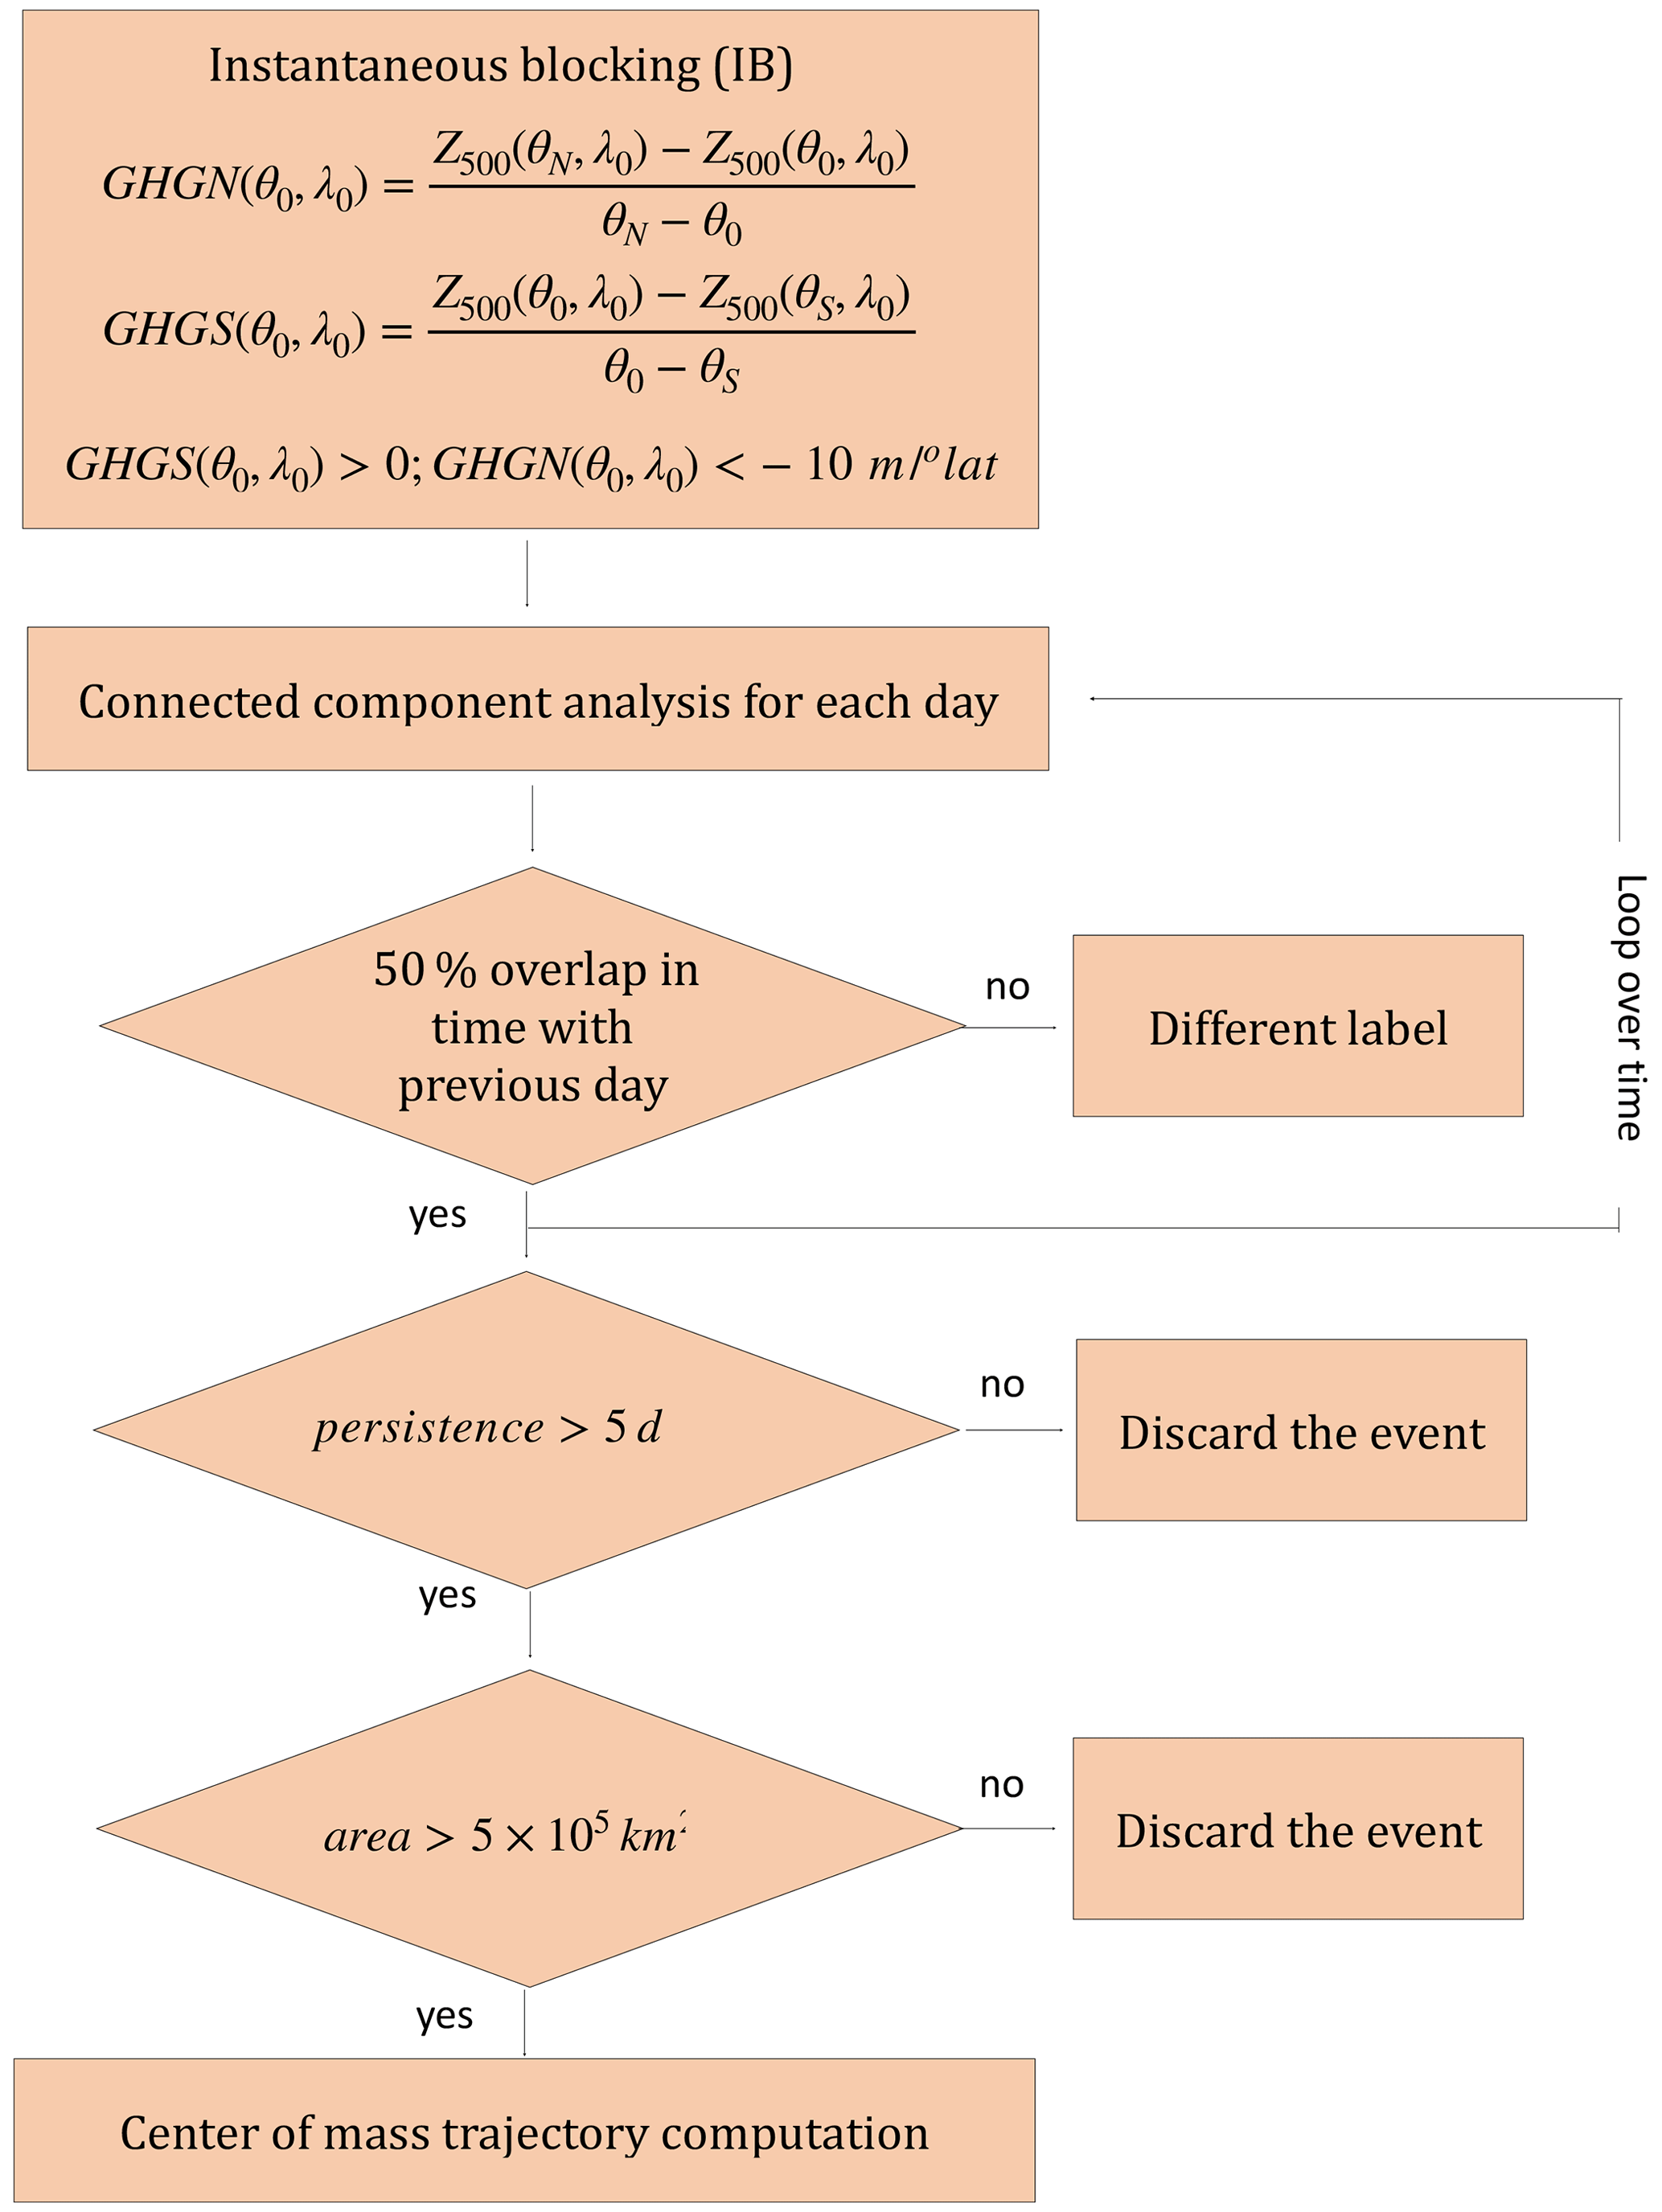
In this study we adopt an atmospheric-blocking detection method based on the 2D index of the geopotential height gradient reversal first introduced by Scherrer et al. (2006) and later described and further developed by Davini et al. (2012). The gradient reversal criterion described in Sect. 2.3 is used to identify instantaneous blocking. On top of it, it is expedient to apply a series of filters to assure that the detected events share common blocking characteristics.
Davini et al. (2012) apply filtering from an Eulerian perspective: each grid point is analyzed to investigate whether the instantaneous blocking condition is satisfied for more than 5 consecutive days. Moreover, a spatial filtering that selects only blocked areas larger than 500 000 km2 is applied.
In this study we adopt a different perspective by performing a Lagrangian tracking: we identify each blocking event as a set of blocked areas corresponding to different days, and we inspect its characteristics, computing the area, the duration, the center of mass and its displacement. Only the events that satisfy a specified set of conditions are retained, namely a minimum area for each blocked day, minimum persistence and a day-by-day overlap criterion. The latter defines the fraction of the grid cells that a blocked area must share with the blocked area of the following day to be assigned to the same blocking event. Threshold values for the three criteria are coherent with those identified by Davini et al. (2012): 500 000 km2 area, 5 d persistence and 50 % overlap. A flowchart of the algorithm is shown in Fig. A1.
Identifying blocking events rather than blocked grid points brings several advantages. As an example, it is possible to study the trajectory of the blocking center of mass by analyzing the path of blocking events that interest a certain area and achieving a better understanding of blocking behavior. Moreover, inspection of the blocking characteristics such as average area, displacement and duration is made rather simple, both for individual events and for specified regions and time periods.
In this article we do not exploit the full potential of the algorithm, as a Lagrangian investigation is not necessary for the narrative of the paper. The full characteristics and features of the algorithm will be exploited and shown in more detail in future studies. However, for completeness, blocking climatology plots showing the impact of the applied thresholds can be found in the Supplement (Fig. S7). The full code of the Lagrangian tracking algorithm (named “blocktrack”) can be found on the GitHub repository: https://github.com/michele-filippucci/blocktrack (last access: 3 July 2024).
The tracking algorithm for the detection of atmospheric blocking adopted in this study is available on GitHub at https://github.com/michele-filippucci/blocktrack (last access: 3 July 2024; https://doi.org/10.5281/zenodo.13837897, Filippucci, 2024).
Details on the data accessibility and on the Climate SPHINX project itself are available on the website of the project (http://wilma.to.isac.cnr.it/sphinx/, Davini et al., 2017b).
The supplement related to this article is available online at: https://doi.org/10.5194/wcd-5-1207-2024-supplement.
MF and PD conceived the study, while SB helped with interpretation of the role of equatorial waves in modifying the atmospheric momentum transport. MF conducted the analysis and wrote the first draft of this paper, which was revised by both PD and SB.
The contact author has declared that none of the authors has any competing interests.
Publisher’s note: Copernicus Publications remains neutral with regard to jurisdictional claims made in the text, published maps, institutional affiliations, or any other geographical representation in this paper. While Copernicus Publications makes every effort to include appropriate place names, the final responsibility lies with the authors.
We thank the Climate SPHINX team for their effort in making the Climate SPHINX experiment available for our analysis. We thank CINECA for storing about 150 Tb of post-processed data and making them freely accessible.
This research has been supported by the National Recovery and Resilience Plan (NRRP), Mission 4 Component 2 Investment 1.4 – call for tender no. 1031 of 17/06/2022 of the Italian Ministry for University and Research funded by the European Union – NextGenerationEU (project no. CN_00000013).
This paper was edited by Christian Grams and reviewed by two anonymous referees.
Arnold, H., Moroz, I., and Palmer, T.: Stochastic parametrizations and model uncertainty in the Lorenz’96 system, Philos. T. R. Soc. A, 371, 20110479, https://doi.org/10.1098/rsta.2011.0479, 2013. a
Barnes, E. A., Slingo, J., and Woollings, T.: A methodology for the comparison of blocking climatologies across indices, models and climate scenarios, Clim. Dynam., 38, 2467–2481, 2012. a
Barriopedro, D., García-Herrera, R., and Trigo, R. M.: Application of blocking diagnosis methods to general circulation models. Part I: A novel detection scheme, Clim. Dynam., 35, 1373–1391, 2010. a
Berckmans, J., Woollings, T., Demory, M.-E., Vidale, P.-L., and Roberts, M.: Atmospheric blocking in a high resolution climate model: influences of mean state, orography and eddy forcing, Atmos. Sci. Lett., 14, 34–40, 2013. a
Berner, J., Shutts, G., Leutbecher, M., and Palmer, T.: A spectral stochastic kinetic energy backscatter scheme and its impact on flow-dependent predictability in the ECMWF ensemble prediction system, J. Atmos. Sci., 66, 603–626, 2009. a, b
Berner, J., Jung, T., and Palmer, T.: Systematic model error: The impact of increased horizontal resolution versus improved stochastic and deterministic parameterizations, J. Climate, 25, 4946–4962, 2012. a, b
Buehler, T., Raible, C. C., and Stocker, T. F.: The relationship of winter season North Atlantic blocking frequencies to extreme cold or dry spells in the ERA-40, Tellus A, 63, 174–187, 2011. a
Buizza, R., Milleer, M., and Palmer, T. N.: Stochastic representation of model uncertainties in the ECMWF ensemble prediction system, Q. J. Roy. Meteor. Soc., 125, 2887–2908, 1999. a, b, c, d
Charney, J. G. and DeVore, J. G.: Multiple flow equilibria in the atmosphere and blocking, J. Atmos. Sci., 36, 1205–1216, 1979. a, b
Christensen, H., Moroz, I., and Palmer, T.: Simulating weather regimes: Impact of stochastic and perturbed parameter schemes in a simple atmospheric model, Clim. Dynam. 44, 2195–2214, 2015. a
Davini, P. and d’Andrea, F.: From CMIP3 to CMIP6: Northern Hemisphere atmospheric blocking simulation in present and future climate, J. Climate, 33, 10021–10038, 2020. a, b, c, d, e
Davini, P., Cagnazzo, C., Gualdi, S., and Navarra, A.: Bidimensional diagnostics, variability, and trends of Northern Hemisphere blocking, J. Climate, 25, 6496–6509, 2012. a, b, c, d, e
Davini, P., Corti, S., D'Andrea, F., Rivière, G., and von Hardenberg, J.: Improved winter European atmospheric blocking frequencies in high-resolution global climate simulations, J. Adv. Model. Earth Sy., 9, 2615–2634, 2017a. a
Davini, P., von Hardenberg, J., Corti, S., Christensen, H. M., Juricke, S., Subramanian, A., Watson, P. A. G., Weisheimer, A., and Palmer, T. N.: Climate SPHINX: evaluating the impact of resolution and stochastic physics parameterisations in the EC-Earth global climate model, Geosci. Model Dev., 10, 1383–1402, https://doi.org/10.5194/gmd-10-1383-2017, 2017b (data available at: http://wilma.to.isac.cnr.it/sphinx/, last access: 1 October 2024). a, b, c, d, e, f, g
Davini, P., Weisheimer, A., Balmaseda, M., Johnson, S. J., Molteni, F., Roberts, C. D., Senan, R., and Stockdale, T. N.: The representation of winter Northern Hemisphere atmospheric blocking in ECMWF seasonal prediction systems, Q. J. Roy. Meteor. Soc., 147, 1344–1363, 2021. a, b
Davini, P., Fabiano, F., and Sandu, I.: Orographic resolution driving the improvements associated with horizontal resolution increase in the Northern Hemisphere winter mid-latitudes, Weather Clim. Dynam., 3, 535–553, https://doi.org/10.5194/wcd-3-535-2022, 2022. a
Dawson, A. and Palmer, T.: Simulating weather regimes: Impact of model resolution and stochastic parameterization, Clim. Dynam., 44, 2177–2193, 2015. a, b, c, d
Deinhard, M. and Grams, C. M.: Towards a process-oriented understanding of the impact of stochastic perturbations on the model climate, Weather Clim. Dynam., 5, 927–942, https://doi.org/10.5194/wcd-5-927-2024, 2024. a
Dima, I. M., Wallace, J. M., and Kraucunas, I.: Tropical zonal momentum balance in the NCEP reanalyses, J. Atmos. Sci., 62, 2499–2513, 2005. a, b
Donners, J., Basu, C., McKinstry, A., Asif, M., Porter, A., Maisonnave, E., Valcke, S., and Fladrich, U.: Performance analysis of EC-EARTH 3.1, Partnership for Advanced Computing in Europe White Paper, 26 pp., https://www.researchgate.net/publication/301863672_Performance_Analysis_of_EC-EARTH_31 (last access: 25 September 2024), 2012. a
Döscher, R., Acosta, M., Alessandri, A., Anthoni, P., Arsouze, T., Bergman, T., Bernardello, R., Boussetta, S., Caron, L.-P., Carver, G., Castrillo, M., Catalano, F., Cvijanovic, I., Davini, P., Dekker, E., Doblas-Reyes, F. J., Docquier, D., Echevarria, P., Fladrich, U., Fuentes-Franco, R., Gröger, M., v. Hardenberg, J., Hieronymus, J., Karami, M. P., Keskinen, J.-P., Koenigk, T., Makkonen, R., Massonnet, F., Ménégoz, M., Miller, P. A., Moreno-Chamarro, E., Nieradzik, L., van Noije, T., Nolan, P., O'Donnell, D., Ollinaho, P., van den Oord, G., Ortega, P., Prims, O. T., Ramos, A., Reerink, T., Rousset, C., Ruprich-Robert, Y., Le Sager, P., Schmith, T., Schrödner, R., Serva, F., Sicardi, V., Sloth Madsen, M., Smith, B., Tian, T., Tourigny, E., Uotila, P., Vancoppenolle, M., Wang, S., Wårlind, D., Willén, U., Wyser, K., Yang, S., Yepes-Arbós, X., and Zhang, Q.: The EC-Earth3 Earth system model for the Coupled Model Intercomparison Project 6, Geosci. Model Dev., 15, 2973–3020, https://doi.org/10.5194/gmd-15-2973-2022, 2022. a
Faranda, D., Masato, G., Moloney, N., Sato, Y., Daviaud, F., Dubrulle, B., and Yiou, P.: The switching between zonal and blocked mid-latitude atmospheric circulation: a dynamical system perspective, Clim. Dynam., 47, 1587–1599, 2016. a
Filippucci, M.: michele-filippucci/blocktrack: blocktrack (v1.1), Zenodo [code], https://doi.org/10.5281/zenodo.13837897, 2024. a
Gill, A. E.: Some simple solutions for heat-induced tropical circulation, Q. J. Roy. Meteor. Soc., 106, 447–462, 1980. a
Hartmann, D. L.: Global physical climatology, vol. 103, Newnes, ISBN 008091862X, 9780080918624 2015. a
Hersbach, H., Bell, B., Berrisford, P., Hirahara, S., Horányi, A., Muñoz-Sabater, J., Nicolas, J., Peubey, C., Radu, R., Schepers, D., et al.: The ERA5 global reanalysis, Q. J. Roy. Meteor. Soc., 146, 1999–2049, 2020. a
Hoskins, B. J. and Karoly, D. J.: The steady linear response of a spherical atmosphere to thermal and orographic forcing, J. Atmos. Sci., 38, 1179–1196, 1981. a
Hoskins, B. J., McIntyre, M. E., and Robertson, A. W.: On the use and significance of isentropic potential vorticity maps, Q. J. Roy. Meteor. Soc., 111, 877–946, 1985. a
Jin, F. and Hoskins, B. J.: The direct response to tropical heating in a baroclinic atmosphere, J. Atmos. Sci., 52, 307–319, 1995. a
Leutbecher, M., Lock, S.-J., Ollinaho, P., Lang, S. T., Balsamo, G., Bechtold, P., Bonavita, M., Christensen, H. M., Diamantakis, M., Dutra, E., et al.: Stochastic representations of model uncertainties at ECMWF: State of the art and future vision, Q. J. Roy. Meteor. Soc., 143, 2315–2339, 2017. a
Lin, J. W.-B. and Neelin, J. D.: Toward stochastic deep convective parameterization in general circulation models, Geophys. Res. Lett., 30, 1162, https://doi.org/10.1029/2002GL016203, 2003. a
Lindzen, R. and Farrell, B.: A simple approximate result for the maximum growth rate of baroclinic instabilities, J. Atmos. Sci., 37, 1648–1654, 1980. a
Masato, G., Hoskins, B., and Woollings, T. J.: Wave-breaking characteristics of midlatitude blocking, Q. J. Roy. Meteor. Soc., 138, 1285–1296, 2012. a
Masato, G., Hoskins, B. J., and Woollings, T.: Winter and summer Northern Hemisphere blocking in CMIP5 models, J. Climate, 26, 7044–7059, 2013. a, b, c, d
Matsuno, T.: Quasi-geostrophic motions in the equatorial area, J. Meteorol. Soc. Jpn. Ser. II, 44, 25–43, 1966. a
Nakamura, N. and Huang, C. S.: Atmospheric blocking as a traffic jam in the jet stream, Science, 361, 42–47, 2018. a, b, c
Novak, L., Ambaum, M. H., and Tailleux, R.: The life cycle of the North Atlantic storm track, J. Atmos. Sci., 72, 821–833, 2015. a
Paciorek, C. J., Risbey, J. S., Ventura, V., and Rosen, R. D.: Multiple indices of Northern Hemisphere cyclone activity, winters 1949–99, J. Climate, 15, 1573–1590, 2002. a
Palmer, T.: Towards the probabilistic Earth-system simulator: A vision for the future of climate and weather prediction, Q. J. Roy. Meteor. Soc., 138, 841–861, 2012. a
Palmer, T. N.: A nonlinear dynamical perspective on model error: A proposal for non-local stochastic-dynamic parametrization in weather and climate prediction models, Q. J. Roy. Meteor. Soc., 127, 279–304, 2001. a
Palmer, T. N., Buizza, R., Doblas-Reyes, F., Jung, T., Leutbecher, M., Shutts, G. J., Steinheimer, M., and Weisheimer, A.: Stochastic parametrization and model uncertainty, ECMWF Reading, UK, https://www2.physics.ox.ac.uk/sites/default/files/2011-08-15/techmemo598_stochphys_2009_pdf_50419.pdf (last access: 25 September 2024), 2009. a, b, c
Pickl, M., Lang, S. T., Leutbecher, M., and Grams, C. M.: The effect of stochastically perturbed parametrisation tendencies (SPPT) on rapidly ascending air streams, Q. J. Roy. Meteor. Soc., 148, 1242–1261, 2022. a, b, c, d, e, f
Quinting, J. and Vitart, F.: Representation of Synoptic-Scale Rossby Wave Packets and Blocking in the S2S Prediction Project Database, Geophys. Res. Lett., 46, 1070–1078, 2019. https://doi.org/10.1002/qj.4257 a
Reinhold, B. B. and Pierrehumbert, R. T.: Dynamics of weather regimes: Quasi-stationary waves and blocking, Mon. Weather Rev., 110, 1105–1145, 1982. a
Rex, D. F.: Blocking action in the middle troposphere and its effect upon regional climate, Tellus, 2, 275–301, 1950. a
Scaife, A. A., Woollings, T., Knight, J., Martin, G., and Hinton, T.: Atmospheric blocking and mean biases in climate models, J. Climate, 23, 6143–6152, 2010. a, b
Scaife, A. A., Copsey, D., Gordon, C., Harris, C., Hinton, T., Keeley, S., O'Neill, A., Roberts, M., and Williams, K.: Improved Atlantic winter blocking in a climate model, Geophys. Res. Lett., 38, L23703, https://doi.org/10.1029/2011GL049573, 2011. a, b
Scherrer, S. C., Croci-Maspoli, M., Schwierz, C., and Appenzeller, C.: Two-dimensional indices of atmospheric blocking and their statistical relationship with winter climate patterns in the Euro-Atlantic region, Int. J. Climatol., 26, 233–249, 2006. a, b
Schiemann, R., Demory, M.-E., Shaffrey, L. C., Strachan, J., Vidale, P. L., Mizielinski, M. S., Roberts, M. J., Matsueda, M., Wehner, M. F., and Jung, T.: The resolution sensitivity of Northern Hemisphere blocking in four 25-km atmospheric global circulation models, J. Climate, 30, 337–358, 2017. a
Shutts, G.: The propagation of eddies in diffluent jetstreams: Eddy vorticity forcing of “blocking” flow fields, Q. J. Roy. Meteor. Soc., 109, 737–761, 1983. a, b
Shutts, G.: A stochastic convective backscatter scheme for use in ensemble prediction systems, Q. J. Roy. Meteor. Soc., 141, 2602–2616, 2015. a, b
Simmons, A. J.: Tropical influences on stationary wave motion in middle and high latitudes, Roy. Neth. Meteorol. Inst. On the Theory and Appl. of Simple Climate Models to the Probl. of Long Range Weather Prediction, 31-47 (SEE N 83-18175 08-47), https://www.ecmwf.int/sites/default/files/elibrary/1981/12247-tropical-influences-stationary-wave-motion-middle-and-high-latitudes.pdf (last access: 25 September 2024), 1982. a
Sousa, P. M., Trigo, R. M., Barriopedro, D., Soares, P. M., and Santos, J. A.: European temperature responses to blocking and ridge regional patterns, Clim. Dynam., 50, 457–477, 2018. a
Steinfeld, D. and Pfahl, S.: The role of latent heating in atmospheric blocking dynamics: a global climatology, Clim. Dynam., 53, 6159–6180, 2019. a
Strommen, K., Christensen, H. M., MacLeod, D., Juricke, S., and Palmer, T. N.: Progress towards a probabilistic Earth system model: examining the impact of stochasticity in the atmosphere and land component of EC-Earth v3.2, Geosci. Model Dev., 12, 3099–3118, https://doi.org/10.5194/gmd-12-3099-2019, 2019a. a, b, c, d, e, f, g
Strommen, K., Watson, P. A., and Palmer, T.: The impact of a stochastic parameterization scheme on climate sensitivity in EC-Earth, J. Geophys. Res.-Atmos., 124, 12726–12740, 2019b. a, b, c
Tibaldi, S. and Molteni, F.: On the operational predictability of blocking, Tellus A, 42, 343–365, 1990. a
Vidale, P. L., Hodges, K., Vannière, B., Davini, P., Roberts, M. J., Strommen, K., Weisheimer, A., Plesca, E., and Corti, S.: Impact of stochastic physics and model resolution on the simulation of tropical cyclones in climate GCMs, J. Climate, 34, 4315–4341, 2021. a, b, c, d, e, f, g, h
Weisheimer, A., Corti, S., Palmer, T., and Vitart, F.: Addressing model error through atmospheric stochastic physical parametrizations: Impact on the coupled ECMWF seasonal forecasting system, Philos. T. R. Soc. A, 372, 20130290, https://doi.org/10.1098/rsta.2013.0290, 2014. a
Woollings, T., Barriopedro, D., Methven, J., Son, S.-W., Martius, O., Harvey, B., Sillmann, J., Lupo, A. R., and Seneviratne, S.: Blocking and its response to climate change, Current Climate Change Reports, 4, 287–300, 2018. a, b, c, d, e, f, g
Yang, C., Christensen, H. M., Corti, S., von Hardenberg, J., and Davini, P.: The impact of stochastic physics on the El Niño Southern Oscillation in the EC-Earth coupled model, Clim. Dynam., 53, 2843–2859, 2019. a, b
- Abstract
- Introduction
- Methods
- Impact of stochastic parameterizations
- Mechanisms of observed changes
- Conclusions
- Appendix A: Lagrangian tracking algorithm
- Code availability
- Data availability
- Author contributions
- Competing interests
- Disclaimer
- Acknowledgements
- Financial support
- Review statement
- References
- Supplement