the Creative Commons Attribution 4.0 License.
the Creative Commons Attribution 4.0 License.
 | 08 Feb 2024
Future changes in North Atlantic winter cyclones in CESM-LE – Part 2: A Lagrangian analysis
Edgar Dolores-Tesillos
Stephan Pfahl
Future changes in extratropical cyclone structure and dynamics may lead to important impacts but are not yet fully understood. In the first part of this study, we have applied a composite approach together with potential vorticity (PV) inversion to study such changes in the dynamics of North Atlantic cyclones. Here, this is complemented with the help of a Lagrangian perspective, making use of air parcel trajectories to investigate the causes of altered PV anomalies as well as the role that cyclone airstreams play in shaping these changes. Intense cyclones in the extended winter seasons of two periods, 1990–2000 and 2091–2100, are studied in Community Earth System Model Large Ensemble (CESM-LE) simulations, and backward trajectories are calculated from the cyclone area as a basis to construct cyclone-centered composites of Lagrangian tendencies and their projected future changes. Our results show that diabatic processes on a timescale of 24 h shape the cyclones' low-level PV distribution and corroborate that the increasing moisture content along with enhanced ascent in warm conveyor belts leads to amplified latent heat release and larger low- and mid-level PV anomalies near the cyclone center in a warmer climate. In contrast, projected upper-level PV changes are due to a combination of several processes. These processes include cloud diabatic PV changes, anomalous PV advection, and likely also radiative PV generation in the lower stratosphere above the cyclone center. For instance, enhanced poleward advection is the primary reason for a projected decrease in upper-level PV anomalies south of the cyclone center. Warm conveyor belt outflow regions are projected to shift upward, but there is not robust change in the associated upper-level PV anomalies due to compensation between enhanced low-level PV generation and upper-level PV destruction. In summary, our two-part study points to future changes in the relative importance of different processes for the dynamics of intense North Atlantic cyclones in a warming climate, with important consequences for the near-surface wind pattern. In particular, a larger role of cloud diabatic processes is projected, affecting the cyclones through PV production in the lower troposphere. The role of other mechanisms, in particular radiative changes near the tropopause, should be investigated in more detail in future studies.
- Article
(8802 KB) - Full-text XML
-
Supplement
(2142 KB) - BibTeX
- EndNote


European windstorms are typically associated with extratropical cyclones traveling over the North Atlantic towards Europe, with higher cyclone frequencies and intensities in the winter compared to the summer half-year (Leckebusch et al., 2006; Laurila et al., 2021; Ulbrich et al., 2009). The strong winds associated with these storms can result in large societal impacts and economic losses (Klawa and Ulbrich, 2003; Roberts et al., 2014). For instance, the death of 65 people across Europe has been attributed to the extratropical cyclone Xynthia (Kolen et al., 2010). Cyclones, through damaging winds, also cause 53 % of all damages to European forests (Schelhaas et al., 2003). To be able to adapt to potential future changes in European windstorm intensities, it is thus crucial to understand and predict changes in extratropical cyclone dynamics (cf. Shaw et al., 2016; Catto et al., 2019).
In part 1 of this study (Dolores-Tesillos et al., 2022, in the following simply referred to as part 1), we have analyzed such changes in cyclone dynamics based on Community Earth System Model Large Ensemble (CESM-LE) simulations for the RCP8.5 scenario and found an intensification of near-surface wind speed and an extended wind footprint in the warm sector southeast of the cyclone center during the mature cyclone stage. Such an extended footprint has also been found for several CMIP6 models and other climate scenarios (Priestley and Catto, 2022). Furthermore, based on the analysis of potential vorticity (PV) anomalies and PV inversion, we have demonstrated that both enhanced diabatic heating and changes in upper-level dynamics (represented by lower- and upper-level PV anomalies, respectively) contribute to the near-surface wind changes. In part 2, we go one step further by investigating the processes leading to changes in these PV anomalies through a Lagrangian analysis of cyclone airstreams.
Several studies have used the concept of cyclone-relative airstreams to describe the cloud organization in extratropical cyclones (Harrold, 1973; Carlson, 1980; Browning, 1990). By analyzing the system-relative flow on isentropic surfaces around midlatitude cyclones, the presence of three distinct airstreams has been demonstrated: the warm conveyor belt (WCB), the dry intrusion (DI), and the cold conveyor belt (CCB) (Harrold, 1973; Carlson, 1980; Browning, 1986; Madonna et al., 2014). Figure 1 shows the region and typical trajectory of the three airstreams. A detailed perspective on these airstreams and their climatological characteristics can be obtained from air parcel trajectory calculations (e.g., Wernli and Davies, 1997; Wernli, 1997; Madonna et al., 2014; Raveh-Rubin, 2017).
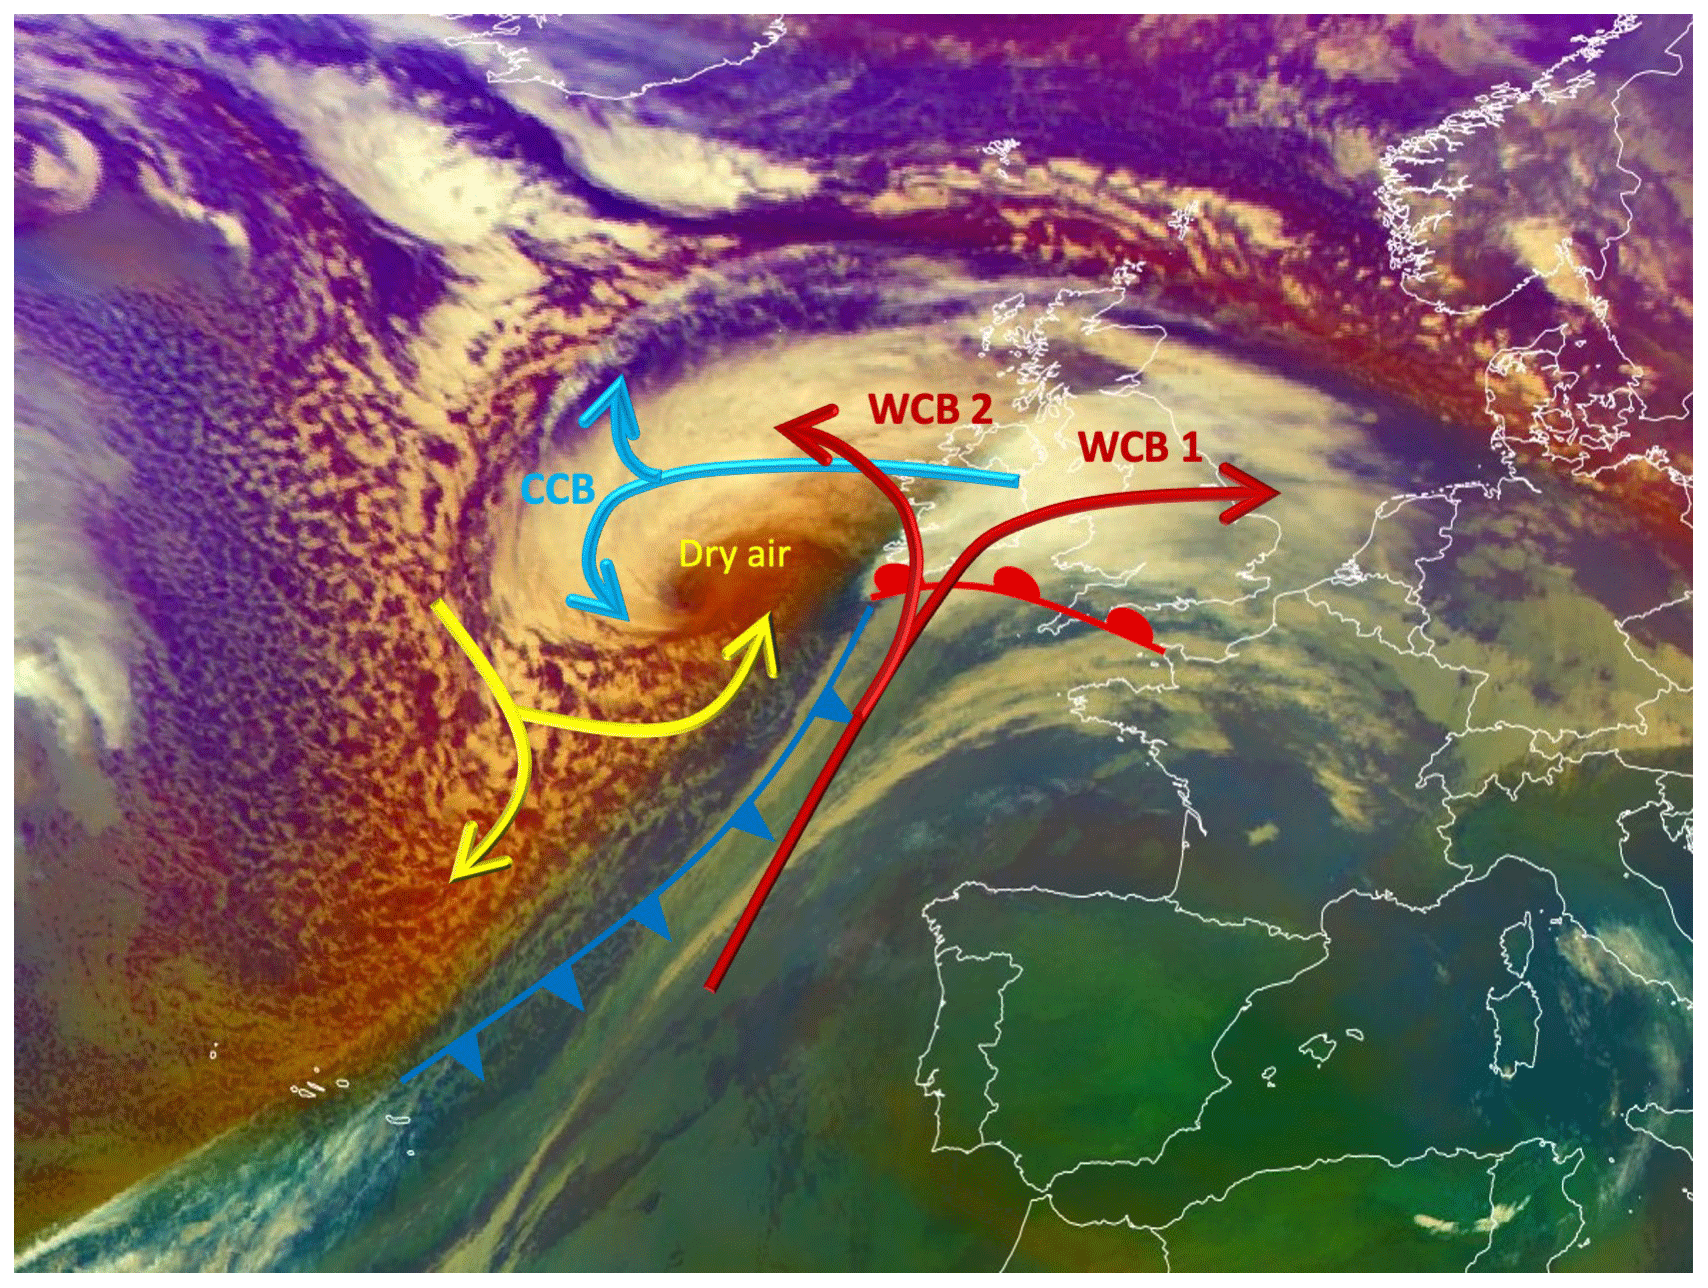
Figure 1Satellite image of the extratropical cyclone Eunice (18 February 2022) with the three airstreams WCB, DI, and CCB indicated by colored arrows. The red and blue lines show the cyclone's warm and cold front, respectively. Modified from EUMETSAT EUMETView (https://view.eumetsat.int/productviewer, last access: 18 November 2023). © EUMETSAT 2022.
WCBs are moist airstreams originating from near the surface ahead of cold fronts and experiencing rapid slantwise ascent with latent heat release. In this way, they provide a major contribution to cloud and precipitation formation in extratropical cyclones (Madonna et al., 2014). Furthermore, they play a crucial role in extreme precipitation events in the mid-to-high latitudes (Pfahl et al., 2014). Embedded convection in the WCB may contribute to such high precipitation rates (Oertel et al., 2020). Joos (2019) demonstrates the relevance of WCBs for modulating the radiative budget in midlatitudes. For instance, they contribute around 10 W m−2 to the net cloud radiative forcing over the central North Atlantic in winter. In the Northern Hemisphere, WCBs are more frequent in winter than in summer, with two preferential regions of ascent in the western North Atlantic and western North Pacific (Madonna et al., 2014), typically fueled by moisture from nearby ocean evaporation (Pfahl et al., 2014).
WCBs influence the tropospheric PV distribution in different ways. Before the ascent, the airstreams, on average, have relatively low PV, followed by a steep PV increase during the first part of the ascent and a decrease in the second part (Madonna et al., 2014). These PV changes are due to the latent heating during various microphysical processes, such as condensation of water vapor at low levels and depositional growth of snow at upper levels (Binder et al., 2016; Joos and Wernli, 2012). WCB-related cloud diabatic processes thus produce positive PV anomalies in the lower and middle troposphere, which can reinforce the cyclone's intensification (Dacre and Gray, 2013; Binder et al., 2016) and also affect other dynamical features, such as the low-level jet ahead of the cold front (Lackmann, 2002). At upper levels, diabatic PV destruction leads to negative PV anomalies in the WCB outflow near the tropopause level, which can interact with the extratropical waveguide and thereby substantially influence the downstream flow (Binder et al., 2016; Grams et al., 2011). Additionally, this process may also influence the formation of atmospheric blocking downstream (Steinfeld and Pfahl, 2019; Steinfeld et al., 2020).
The CCB is characterized by a westward flow relative to the cyclone propagation at low levels parallel to and on the cold side of the warm front (Catto et al., 2010; Schemm and Wernli, 2014). It often consists of two branches. The main branch slopes cyclonically at low levels around the cyclone center (Schultz, 2001) and is often related to strong winds along the bent-back front, forming a low-level jet (Schemm and Wernli, 2014; Slater et al., 2017). A second branch turns anticyclonically and ascends into the cloud head. Schultz (2001) mentioned that this branch represents a transition airstream between the WCB and the cyclonic branch of the CCB. Similar to the WCB, cloud diabatic processes in the CCB can produce positive PV anomalies in the lower and middle troposphere (Schemm and Wernli, 2014).
DIs are cold, dry airstreams descending behind the cyclone from near the tropopause to middle and low levels (Browning, 1997; Catto et al., 2010; Raveh-Rubin, 2017). At lower levels, DIs tend to fan out cyclonically or anticyclonically. A cloud-free region is generated due to the low moisture content in DIs (Catto et al., 2010; Raveh-Rubin, 2017), which can be identified in satellite images as a “dry slot” with a hammerhead shape (Fig. 1). The cyclonically descending air parcels might travel along the cold front and produce instability and potential for severe weather (Browning, 1997). Convection associated with the DIs is found in regions where they overrun moist air and potential instability is released, favoring strong winds, precipitation, and thunderstorms (e.g., Raveh-Rubin and Wernli, 2016). However, DIs can also weaken the WCB rain band if they underrun the northern part of the WCB, leading to evaporation of precipitation from the cloud head (Raveh-Rubin, 2017). DIs influence the PV distribution mainly through advection of air masses with relatively high PV from upper layers downwards (Raveh-Rubin, 2017).
Only very recently have the first studies started to investigate changes of cyclone-related airstreams, in particular the WCB, in a warmer climate from a Lagrangian perspective. Based on the same CESM-LE simulations as applied here (see Sect. 2), Joos et al. (2023) and Binder et al. (2023) studied projected future changes in WCB airstreams as well as their role in cyclone intensification. Joos et al. (2023) concluded that projected shifts in the spatial distribution of WCBs are mostly consistent with shifts in the storm tracks and that the larger atmospheric moisture content in a warmer climate causes a systematic increase in WCB-related precipitation, latent heat release, and outflow level. According to Binder et al. (2023), this enhanced latent heating and the associated increase in diabatic PV production leads to an increased relative importance of diabatic processes for rapid cyclone intensification in a warmer climate. However, at least in the Northern Hemisphere, this is not associated with a general intensification of cyclones compared to present-day climate, most probably due to compensating changes in dry-dynamical processes. These results are consistent with previous findings based on idealized models (Pfahl et al., 2015; Büeler and Pfahl, 2019; Sinclair et al., 2020) and our results from part 1.
In this part 2, we extend the analysis of future changes in cyclone airstreams by combining Lagrangian trajectory calculations with the Eulerian composite perspective applied in part 1. The main goal is to explicitly identify the processes contributing to the composite PV anomaly changes identified in part 1 and link them to the properties of airstreams, in particular the WCB and DI. In this way, we test the hypothesis (also formulated in part 1) that cloud diabatic processes are mainly responsible for low-level PV changes, but additional factors have to be considered for explaining the upper-level changes. The CCB is not evident in our Lagrangian composites and thus not further discussed in the paper. In Sects. 2 and 3 below, we describe the CESM-LE dataset as well as the trajectory calculations and generation of Lagrangian composites, respectively. The results are presented and discussed in Sect. 4, and conclusions are provided in Sect. 5.
We have selected 10 members from the CESM-LE-ETH ensemble, which were restarted from CESM-LE simulations (Kay et al., 2015) providing 6-hourly output fields on model levels that are required for our trajectory calculations (see Sect. 3). The periods 1990–2000 (present-day climate) and 2091–2100 (future climate, under the RCP8.5 scenario) are analyzed. This fully coupled model has a horizontal resolution close to 1∘ (∼ 0.94∘ in latitude and 1.25∘ in longitude). More details are provided in Sect. 2 of part 1.
We study Lagrangian airstreams in the strongest 1 % of cyclones in the 10-member CESM-LE dataset for the extended winter season (from October to March). This cyclone dataset is described in detail in part 1. Based on the sea-level pressure (SLP) contouring method (Wernli and Schwierz, 2006), we identify and track storms over the North Atlantic region (30 to 90∘ latitude, −100 to 40∘ longitude). The cyclone intensity and, thus, the extreme cyclone selection (strongest 1 % of cyclones) are obtained by computing the relative vorticity at 850 hPa at the cyclone center. The number of extreme cyclones is 358 in the present-day climate and 308 in the future climate. In present-day climate, the cyclones typically travel towards the northeast, with the peak cyclone frequency south of Greenland. At the end of the century, the storm track is projected to shift eastward, implying a higher impact in the north of the United Kingdom and at the west coast of Scandinavia.
For the calculation of air parcel trajectories, we apply the Lagrangian analysis tool (LAGRANTO; Wernli and Davies, 1997; Sprenger and Wernli, 2015), which uses the three-dimensional CESM-LE wind field for kinematic forward and backward calculations of air parcel trajectories. Seven-day backward trajectories are initialized on a horizontal equidistant grid (Δx= 200 km) centered at the cyclone center (sea-level pressure (SLP) minimum) and covering the storm area with a fixed radius of 1500 km at the time of maximum intensity of each selected extreme cyclone. They are initialized at eight vertical levels: 850, 800, 700, 600, 500, 400, 300, and 250 hPa. Along the trajectories, several variables are traced, together with the trajectory position (longitude, latitude) and pressure. These physical parameters include specific humidity q, potential temperature θ, and potential vorticity PV. The time axis is defined such that the initialization time (time of maximum cyclone intensity) is t=0, and negative times correspond to periods before the trajectories reach the cyclone.
Composites of Lagrangian tendencies of air mass properties are computed as outlined in the following. The Lagrangian tendency is defined as the change in magnitude of any variable between the initialization time and a previous time step along the backward trajectory for each grid point at a given pressure level and each selected cyclone. These Lagrangian tendencies are projected on the initialization time step and interpolated on a radial grid centered on the cyclone center, as described for other cyclone-centered composites in Sect. 3.1 of part 1. Finally, the Lagrangian tendencies are averaged over all extreme cyclones to construct the Lagrangian tendency composites.
The results of this study are presented in three subsections. In order to obtain a general idea of the evolution of key parameters along the backward trajectories and the relevant timescales, in the first subsection time series are presented pooling all trajectories from specific pressure levels. Subsequently, in the second subsection, the Lagrangian composites on two selected pressure levels are discussed, supplemented by time series of trajectories from individual locations that facilitate linking the composites to the classical airstream concept. Finally, in the third subsection, Lagrangian composite cross sections are presented to provide a more comprehensive view on the spatial structure of the Lagrangian transport patterns.
4.1 Time series of parameters along trajectories
In this section, we analyze the temporal evolution of different key parameters along the backward trajectories, providing insights into the times during which the parameters experience a significant change, which eventually determines the cyclone intensity and structure. The temporal change of PV and θ along the trajectories can be associated with diabatic processes due to their conservation for adiabatic and frictionless motion (Hoskins et al., 1985; Madonna et al., 2014, e.g.,). A comparison between the temporal evolution of the present-day and future trajectories may provide insights into the influence of diabatic and advective processes that shape the cyclone structure in the simulated future climate.
As the first step, we evaluate various parameters averaged over all trajectories initialized in the cyclone area, in a radius of 10∘ around the SLP minimum, at the time of maximum cyclone intensity. In the following, the temporal evolution of (a) pressure, latitude, and longitude; (b) specific humidity; (c) θ; and (d) PV is discussed for trajectories from two pressure levels, 700 and 250 hPa.
- a.
Pressure, latitude, and longitude.
Figure 2a and b show the temporal evolution of pressure along backward trajectories initialized at 700 and 250 hPa, respectively. Trajectories from both levels indicate ascent in the 24 h before the air parcels reach the cyclones at the time of maximum intensity. At low levels, the mean ascent is about 30 hPa, while at upper levels, it is larger, around 50 hPa. This ascent is associated with specific airstreams such as the WCB (Binder et al., 2016; Madonna et al., 2014), as will be discussed in the following subsections. The relatively moderate pressure changes in the mean are due to the fact that, in Fig. 2, data are averaged over the entire cyclone area, leading to partial cancellation between ascending and descending airstreams. Note that this cancellation effect refers mainly to the 700 hPa level.
On average, the trajectories experience an equatorward displacement before the ascent and a poleward movement during the ascent phase (Fig. 2c, d). The temporal evolution of longitude (Fig. 2e, f) shows that the trajectories move eastward. Furthermore, trajectories ending at upper levels travel larger distances, which is due to the typically larger wind velocities at higher altitudes.
In the simulated future climate, the trajectories initialized at 700 hPa are projected to follow a similar zonal, meridional, and vertical displacement as in the present-day reference period (Fig. 2a, c, e). In particular, the ascent in the last 24 h is very similar, while the mean descent in the phase before these last 24 h is slightly more pronounced in the future. Trajectories initialized at 250 hPa also follow a similar zonal and meridional path in present-day and future climate (Fig. 2d, f) but originate at lower levels in the future, associated with a larger ascent in the last 24 h (Fig. 2b).
- b.
Specific humidity.
Figure 2g and h show the temporal evolution of specific humidity along the backward trajectories. There are marked differences between the moisture evolution along trajectories reaching the 700 and 250 hPa levels. During the 6 d pre-ascent phase, trajectories reaching the 700 hPa level typically gain moisture. In present-day climate the average specific humidity increases from 1.5 to more than 2 g kg−1. During the ascent phase, water vapor condenses, and the specific humidity decreases to 1.5 g kg−1. In contrast, trajectories reaching the upper levels experience a constant decrease in moisture with values only slightly above 0 g kg−1 at 250 hPa.
In the future climate, the moisture content increases for both trajectories initialized at upper and lower levels. The moisture increase for trajectories reaching the cyclones at 700 hPa is constant over time (0.5 g kg−1 in the mean). However, trajectories initialized at 250 hPa converge towards 0 g kg−1 when they reach the cyclones, similar to the present day. Accordingly, the moisture decrease in the ascent phase is larger in future than in present-day climate for the upper-level trajectories.
- c.
Potential temperature.
Figure 2i and j show an increase in the air parcels' potential temperature during the ascent period ( to t=0) for trajectories reaching both the 700 and 250 hPa levels. This diabatic heating is linked to the latent heat release associated with the phase changes of moisture during ascent (condensation, vapor deposition, freezing), in accordance with the decrease in water vapor specific humidity discussed before. The trajectories reach the level of 700 hPa with a potential temperature of 285 K in the mean, while the mean θ is 321 K for trajectories reaching 250. However, there is a large spread of around 20 K, which is related to the fact that we have averaged the trajectories arriving in the cold and warm sectors.
In the future, the potential temperature along backward trajectories generally increases in the 7 d before maximum cyclone intensity. An increase of around 5 K is projected for both trajectories ending at 700 and at 250 hPa. Note that this increase corresponds to the global mean warming of 5 K. In line with the specific humidity changes, the heating during the ascent phase in the last 24 h is similar in future and present-day climate for lower-level trajectories, but there is an amplified heating in the future (corresponding to the amplified moisture loss) along the 250 hPa trajectories. This is examined in more detail in the following subsection.
- d.
Potential vorticity.
Figure 2k and l show the temporal evolution of PV along the backward trajectories. There are again structural differences between trajectories initialized at 700 and 250 hPa. Trajectories reaching the cyclones at 700 hPa experience a clear PV increase in the 24 h before the maximum intensity. Such an increase due to diabatic processes is expected for trajectories below the level of maximum diabatic heating (Binder et al., 2016; Madonna et al., 2014). The mean PV along the 250 hPa trajectories, in contrast, stays relatively constant. Most likely, these small mean changes are related to opposing PV tendencies along individual trajectories, with some of them experiencing PV destruction due to their location above the region of maximum diabatic heating. In addition, radiative cooling and heating may affect the upper-level PV tendencies (Chagnon et al., 2013; Cavallo and Hakim, 2013).
In the simulated future climate, the PV increase along the 700 hPa trajectories is more pronounced than for the present day. Although there is no indication of an amplified heating in these air parcels (see again Fig. 2i), the heating is likely enhanced at higher altitudes (see Sect. 4.2 below), as indicated also by an increase in surface precipitation (not shown). The more pronounced PV increase is thus likely related to a larger vertical gradient in diabatic heating in the future. On the contrary, the trajectories ending at 250 hPa are projected to have an almost constant mean PV, similar to the present-day trajectories. Nevertheless, the PV of the future trajectories remains lower than for the present day during the entire 7 d period. This can be explained by a decrease in the climatological PV at upper levels (see Fig. S1 in the Supplement). The impact of this PV decrease on the upper PV anomalies differs between cyclone subregions, as demonstrated in more detail in the following.
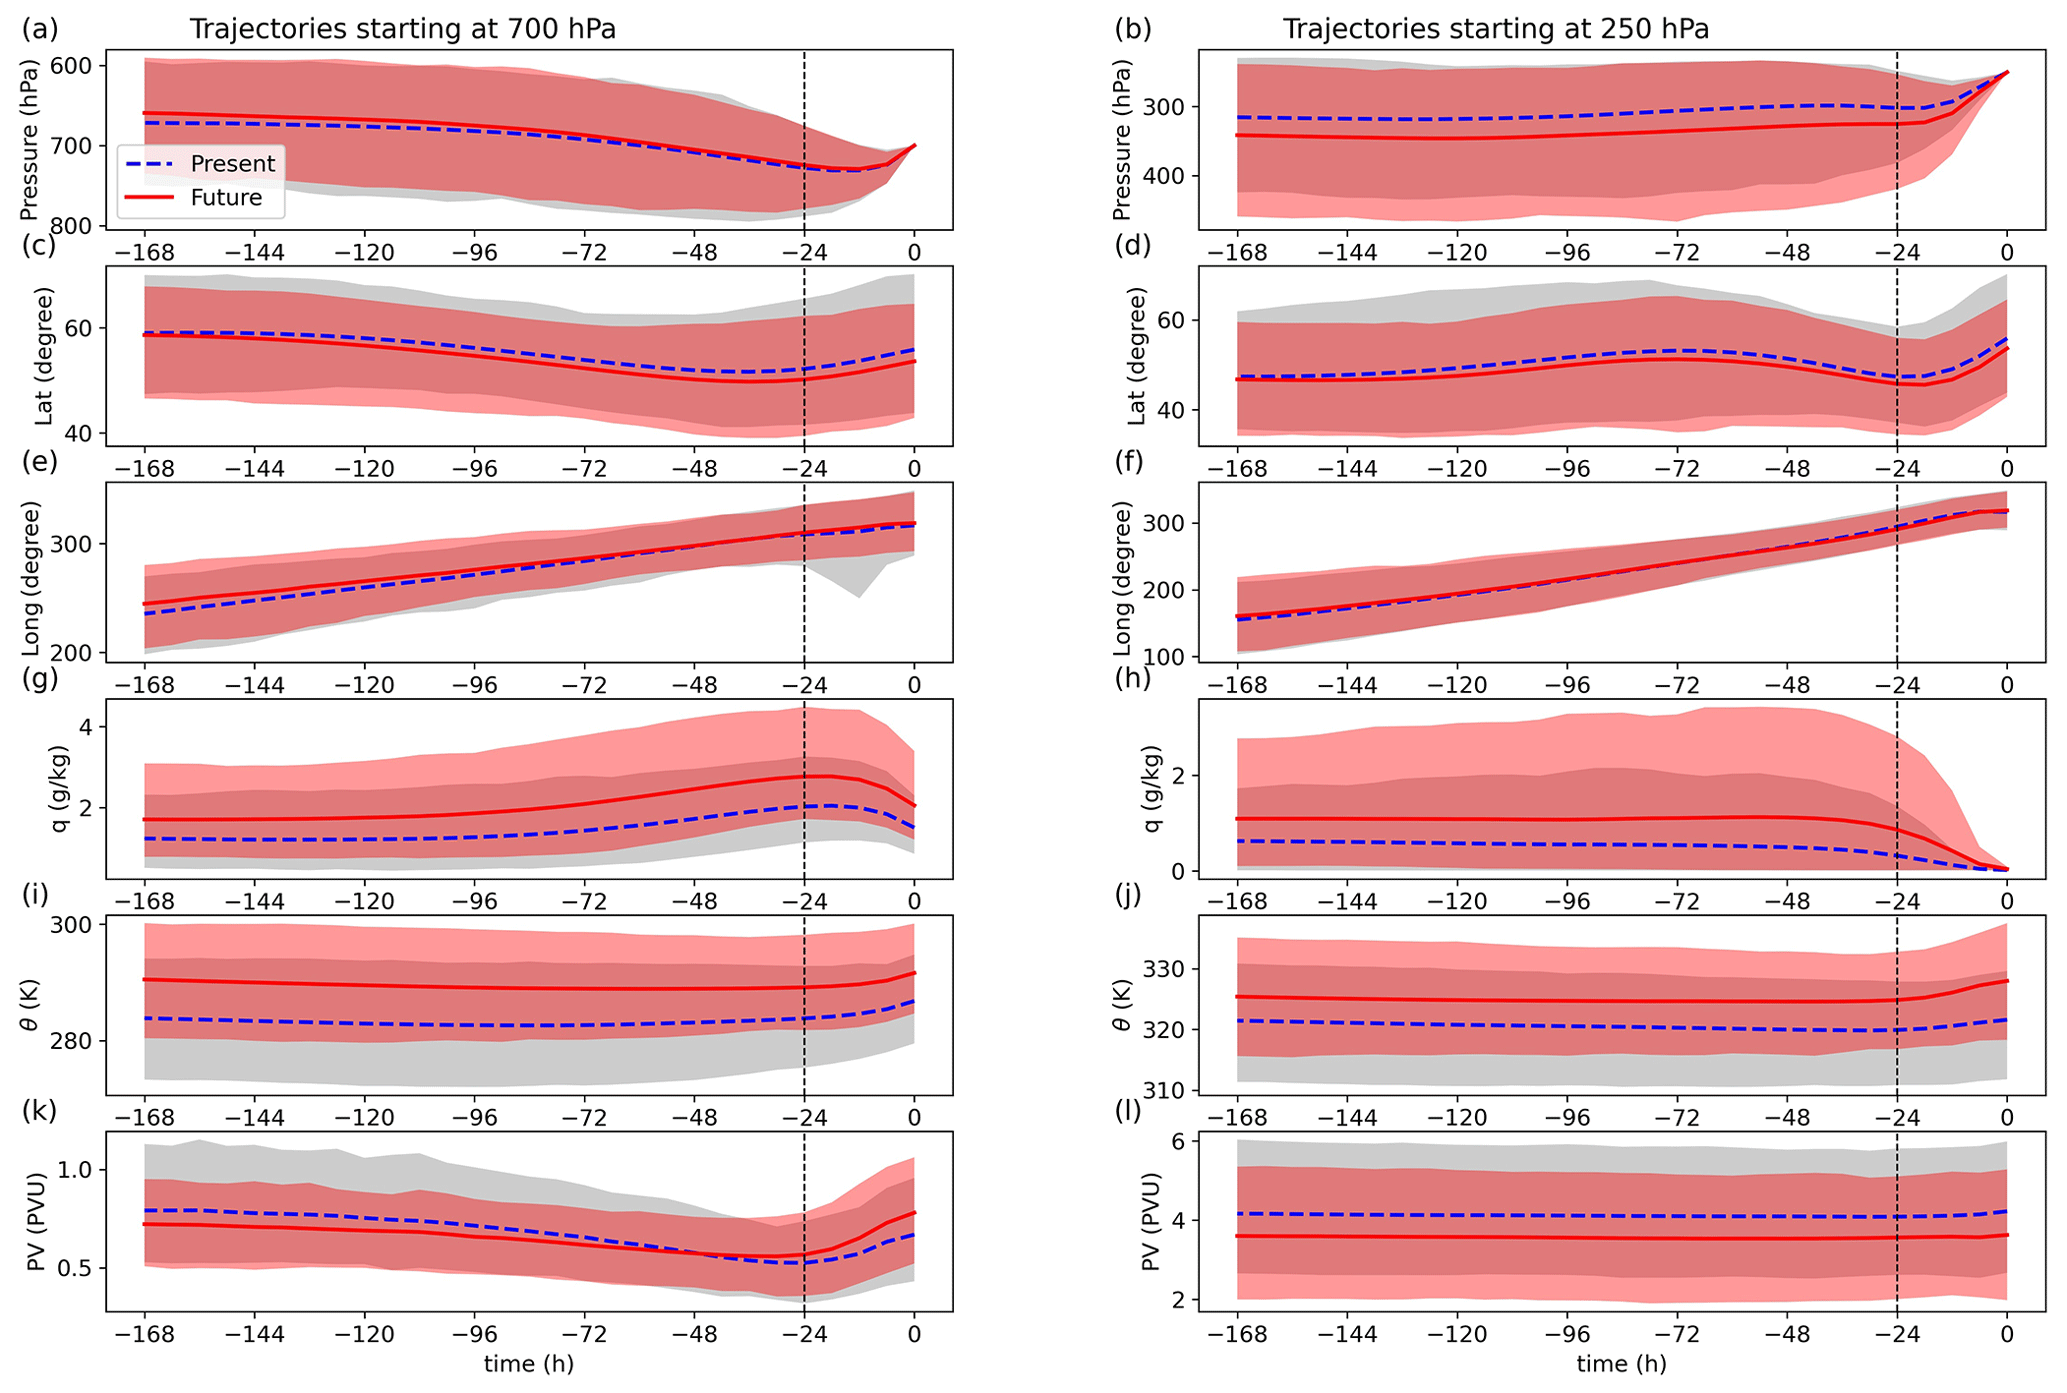
Figure 2Temporal evolution of (a, b) pressure, (c, d) latitude, (e, f) longitude, (g, h) specific humidity, (i, j) potential temperature, and (k, l) PV averaged over all trajectories initialized within a 10∘ radius around the cyclone center of all selected cyclones and at (a, c, e, g, i, k) 700 hPa and (b, d, f, h, j, l) 250 hPa. The average for present-day climate is shown as a dashed blue line and the average over the future time slice as a red line. The 5th and 95th percentiles are shown in gray shading for present-day climate and red shading for future climate.
4.2 Lagrangian tendency composites
In the previous section, we have identified that the last 24 h before the air parcels arrive in the cyclone area at the time of maximum cyclone intensity is a period of particular changes in the physical parameters along the backward trajectories. During this period, both air parcels arriving at 700 and 250 hPa typically ascend, accompanied by latent heat release and, for the lower-level trajectories, a PV increase. However, as demonstrated in part 1, the spatial distribution of PV anomalies and its projected future changes vary across the cyclone area, with important consequences for cyclone dynamics and winds. To link such local PV anomalies to the Lagrangian tendencies outlined above, we analyze Lagrangian tendency composites showing the spatial distributions of changes in physical parameters along the backward trajectories in the last 24 h (see Sect. 3). In the following, we examine such composites of Lagrangian tendencies in latitude, longitude, pressure, θ, and PV.
To facilitate the interpretation of these Lagrangian composites, we also show time series averaged over trajectories that arrive at specific locations in the cyclone composite, namely at the cyclone center as well as 8∘ to the north and 5∘ south of the center. Note that these locations correspond to strongly positive (center and northward point) and strongly negative (southward point) projected future changes in the upper-level PV anomaly (see Fig. 8c in part 1). The time series thus also help in understanding the complex projected upper-level PV anomaly changes in more detail.
4.2.1 Lower levels (700 hPa)
Figure 3a shows the composite of latitude tendencies along trajectories reaching the cyclone area at 700 hPa during the 24 h before the cyclone maximum intensity. For latitude (as well for longitude) composite, we subtracted the 24 h latitude changes of the cyclone center to obtain composites relative to the movement of the cyclone (i.e., the cyclones' propagation is removed). The contours indicate the present-day meridional displacement, and color shading shows the projected future change in this displacement. Positive values indicate trajectories originating from the south, and negative values indicate trajectories originating from the north. Trajectories from the south dominate the region downstream of the cyclone, with the maximum northward transport near the mean position of the warm front. Trajectories from the north are found upstream of the cyclone center, with a stronger absolute meridional displacements compared to the southerly flow downstream. The composite of longitude tendencies (Fig. 3b) shows that most trajectories move eastward (positive longitude tendency). The largest eastward displacement is found in the warm sector to the south and southeast of the cyclone center. A region of westward displacement is located northwest of the cyclone center, in the area of the occlusion, indicative of cyclonic wrap-up of the air around the cyclone center. In Fig. 3c, a clear zone of ascent is identified in the warm sector and particularly around the cyclone center. A maximum rate of ascent of 250 hPa in 24 h, averaged over all trajectories, is found at the cyclone center, whereas a wedge-shaped region of descent is located to the southwest of the cyclone center. We suggest that the northward, ascending flow in the cyclones' warm sector can be linked to WCB activity. The absence of spatial alignment of the regions of maximum ascent and maximum poleward transport in the composites at 700 hPa is related to the fact that different locations in the composites are associated with different air masses. The air parcels near the cyclone center appear to have ascended most before arriving at 700 hPa, while the air parcels in the warm sector east of the center have experienced a stronger northward displacement but slightly less ascent. Nevertheless, these air parcels in the warm sector are embedded in a vertically extended region with strong ascent (maximum 24 h ascent at upper levels; see Sect. 4.3.2 below), which is most likely a signature of the warm conveyor belt. The descending branch from northwest towards the south of the cyclone center is related to the dry intrusion, as also shown exemplarily in the time series along backward trajectories initialized south of the cyclone center shown in Fig. 4 (left column). These trajectories show the southward transport and descent (particularly in the last 24 h) of relatively dry air masses from mid-levels. Note that there is no indication of an anticyclonic DI branch in our composites. This could be associated with case-to-case variability in the occurrence and location of this airstream, which leads to cancellation effects in the composites. For instance, previous studies have shown that the anticyclonic branch can be located relatively far away from the sea-level pressure minimum (e.g., Catto et al., 2010; Fluck and Raveh-Rubin, 2023). The linkages to the classical airstream concept will be further discussed in Sect. 4.3.
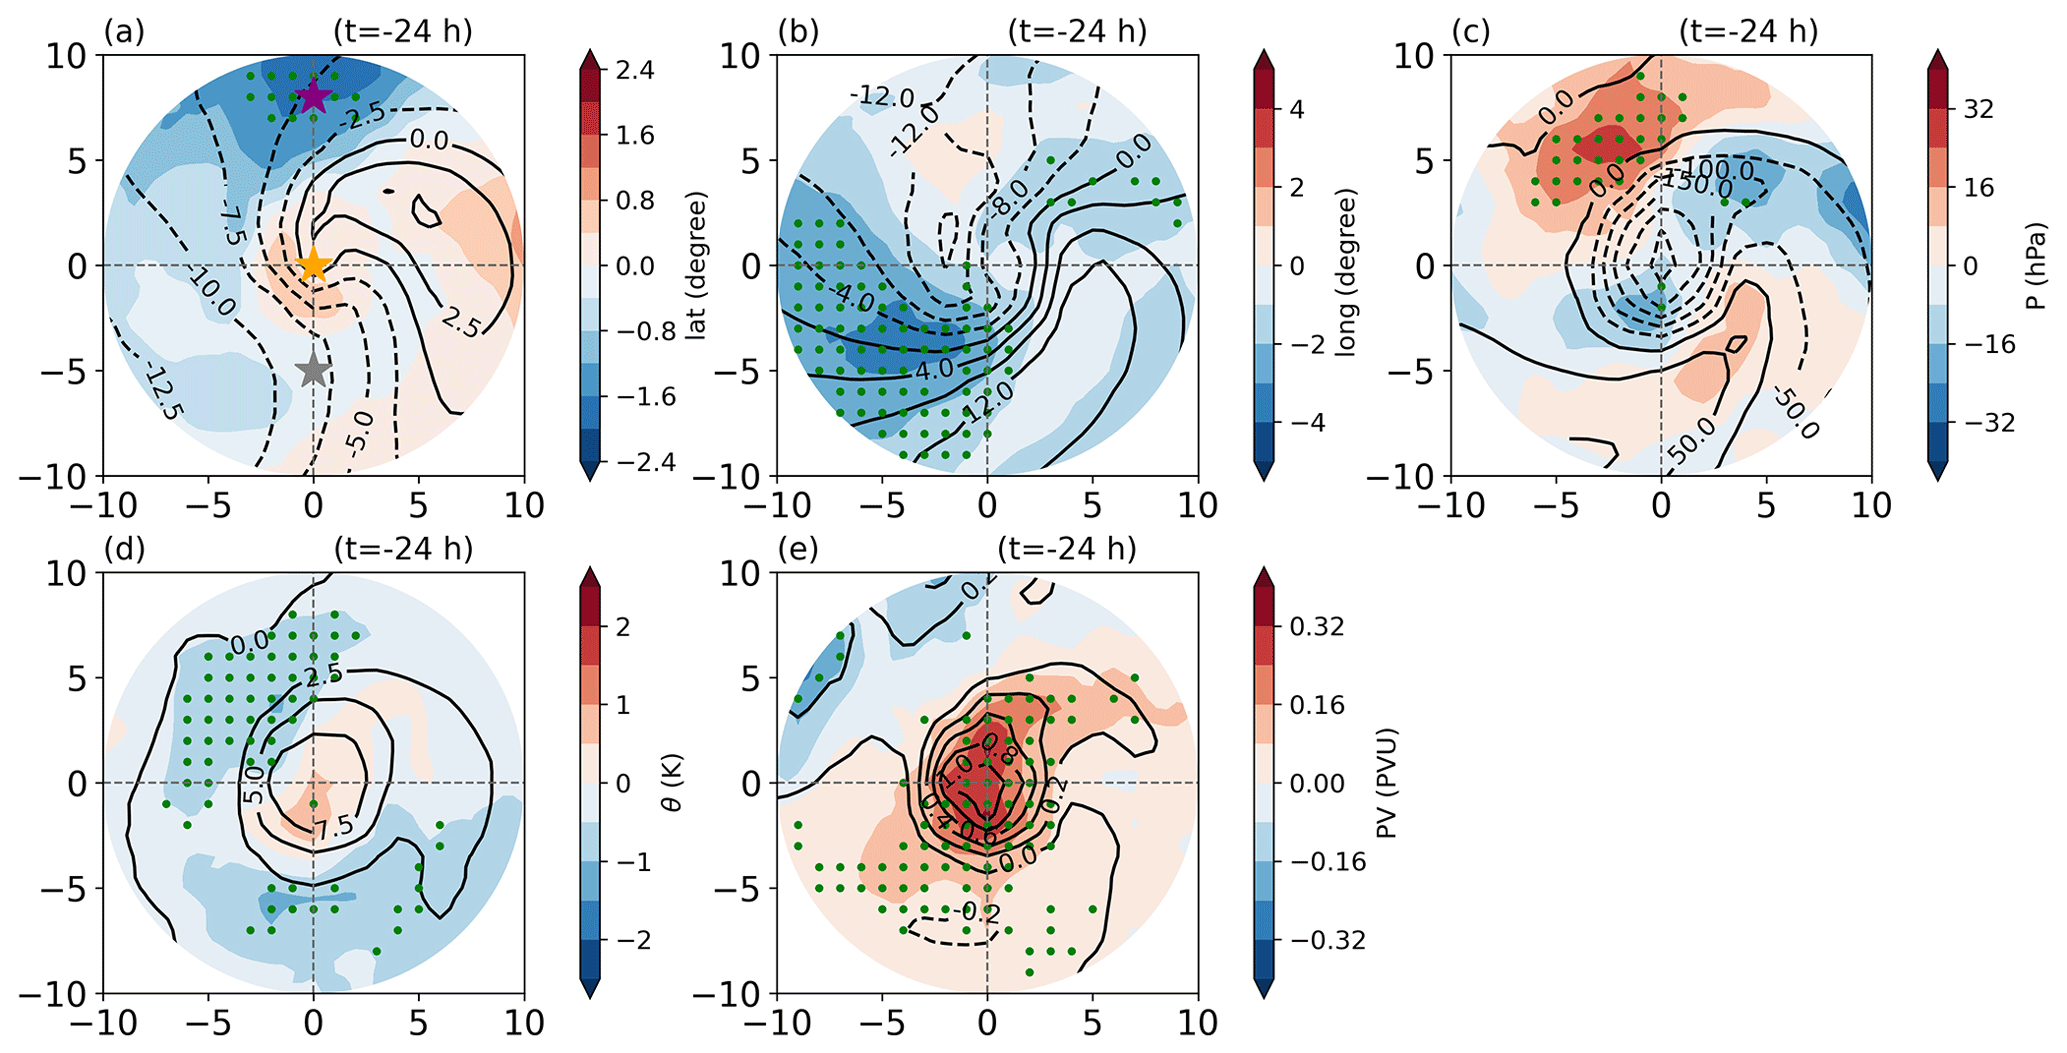
Figure 3Composites of Lagrangian tendencies along backward trajectories initialized at 700 hPa in the last 24 h before arrival in the cyclone area of (a) latitude, (b) longitude, (c) pressure, (d) potential temperature, and (e) PV. Contours show present-day Lagrangian tendencies, and the color shading indicates the response to future climate change (difference in the Lagrangian tendencies between future and present-day climate). Longitude and latitude are relative to the movement of the cyclone (i.e., with the 24 h longitude and latitude changes of the cyclone center subtracted). Green dots denote regions of ensemble agreement on the sign of change; i.e., more than 80 % of the ensemble members indicate a future change of the same sign. A total of 358 and 308 storms are considered in the present-day and future climate, respectively.
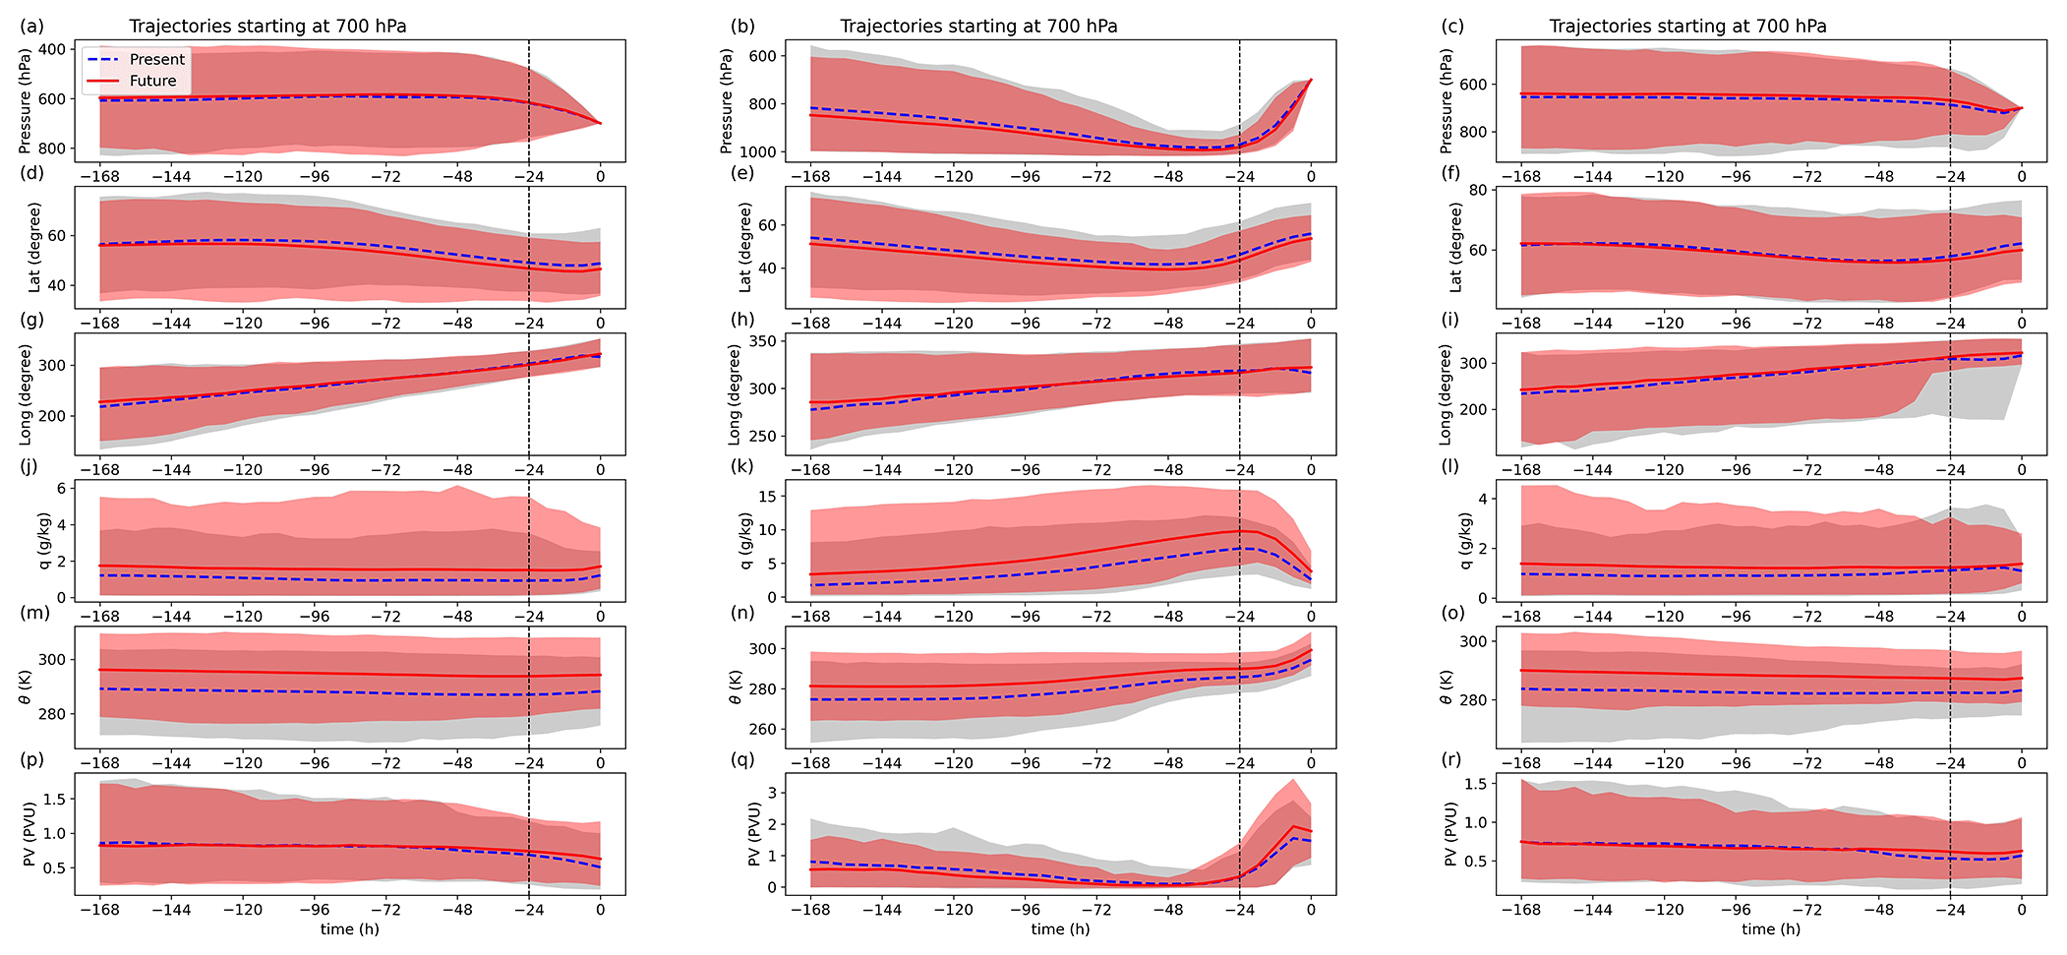
Figure 4Temporal evolution of (a, b, c) pressure, (d, e, f) latitude, (g, h, i) longitude, (j, k, l) specific humidity, (m, n, o) potential temperature, and (p, q, r) PV averages along backward trajectories initialized 5∘ south of the cyclone center (left column, gray star in Fig. 3), at the cyclone center (middle column, orange star in Fig. 3), and 8∘ north of the cyclone center (right column, purple star in Fig. 3) at 700 hPa. The average for present-day climate is shown as a dashed blue line and the average over the future time slice as a red line. The 5th and 95th percentiles are shown in gray shading for present-day climate and red shading for future climate.
The ascent in the warm sector and near the cyclone center is associated with diabatic heating, as shown by the positive potential temperature tendencies in the same region (Fig. 3d), most probably due to latent heat release during cloud formation. This is further illustrated by the time series initialized in the cyclone center shown in Fig. 4 (middle column). In the last 24 h, these air parcels experience a strong decrease in water vapor specific humidity along with the ascent, northward transport, and diabatic heating. The Lagrangian tendency of θ is also positive in most other parts of the cyclone composite, except for the western boundary (see again Fig. 3d).
Lagrangian PV tendencies are positive in the northern and eastern part of the cyclone area, with the largest PV production at the cyclone center and extending towards the warm front (Fig. 3e). The spatial pattern is similar to the pattern of ascent and diabatic heating. As mentioned above, diabatic PV production due to latent heat release in clouds is expected in these low-level air parcels since they are likely located below the vertical maximum of heat release. A region of PV reduction is found to the south of the cyclone center, albeit with much smaller magnitude compared to the PV generation in other regions. The largest reduction occurs near the expected region of the DI (see also the example in Fig. 4p), which might be related to turbulent mixing (Attinger et al., 2021).
Projected future changes of the Lagrangian composites at 700 hPa are shown with color shading in Fig. 3. In the cyclones' warm sector, both the northward motion and ascent are projected to intensify, in particular near the warm front and south of the cyclone center (Fig. 3a, c). The enhanced northward motion is related to a stronger northward flow of air parcels relative to the cyclone center, which overcompensates for the cyclones' enhanced poleward propagation (not shown) that was also found in previous studies (e.g., Tamarin and Kaspi, 2016). Also, the descent in the southern part of the cyclone area intensifies, and on the northwestern flank, enhanced descent is projected in a region of small mean vertical displacement in present-day climate. The mean westerly flow weakens slightly in most regions, in particular southwest of the cyclone center. The spatial pattern of future changes in diabatic heating (Fig. 3d) corresponds relatively well to the change in vertical motion, with regions of stronger ascent experiencing more heating and vice versa. In addition to the enhanced ascent, the larger atmospheric moisture content in a warmer climate explains the increase in diabatic heating through increasing latent heat release, as shown exemplarily for the cyclone center in Fig. 4k. Finally, Fig. 3e shows that the PV generation in the last 24 h before maximum cyclone intensity increases in most of the cyclone area, except for the northwestern part. The strongest intensification is found at the cyclone center, extending along the warm front and towards the southwest. This also corresponds to the region of enhanced ascent and diabatic heating, but the relative changes in PV generation are even larger and spatially more extended than the increase in heating (see also Fig. 4n, q). As already discussed in Sect. 4.1, this amplified PV generation can be explained by the increased latent heat release also at higher altitudes (see Fig. S2 for the composite change at 500 hPa), leading to a larger vertical heating gradient. The region of an increasing Lagrangian PV tendency in a warmer climate also extends into the southern sector of the cyclone composite where air parcels, on average, descend and the Lagrangian PV tendency is negative in present-day climate. This thus indicates a reduced PV destruction in this region (see also Fig. 4p). It may point towards a role of other processes beyond latent heating, in particular turbulent mixing, for future changes in near-surface PV anomalies. Nevertheless, the magnitude of these PV tendency changes is much smaller than the changes near the cyclone center induced by latent heating.
In summary, the most apparent future changes in PV generation occur around the cyclone center. These PV generation changes in the last 24 h explain a substantial part of the total future composite changes in the cyclones' low-level PV anomalies, also in a quantitative manner (see Fig. 8a in part 1). Our Lagrangian analysis thus provides strong evidence that these PV anomaly changes can be explained by amplified latent heating, driven by both a larger moisture content and enhanced ascent in a warmer climate. This thus corroborates the first part of our hypothesis formulated in Sect. 1. Changes in PV generation further away from the cyclone center are smaller and thus of minor importance for the cyclones' dynamics, as also illustrated exemplarily in the time series along trajectories initialized south and north of the cyclone center shown in Figs. 4 (left column) and 4 (right column), respectively.
4.2.2 Upper levels (250 hPa)
The Lagrangian tendency composites at 250 hPa are shown in Fig. 5. In present-day climate, most of the cyclone area is dominated by trajectories coming from the west (Fig. 5b).
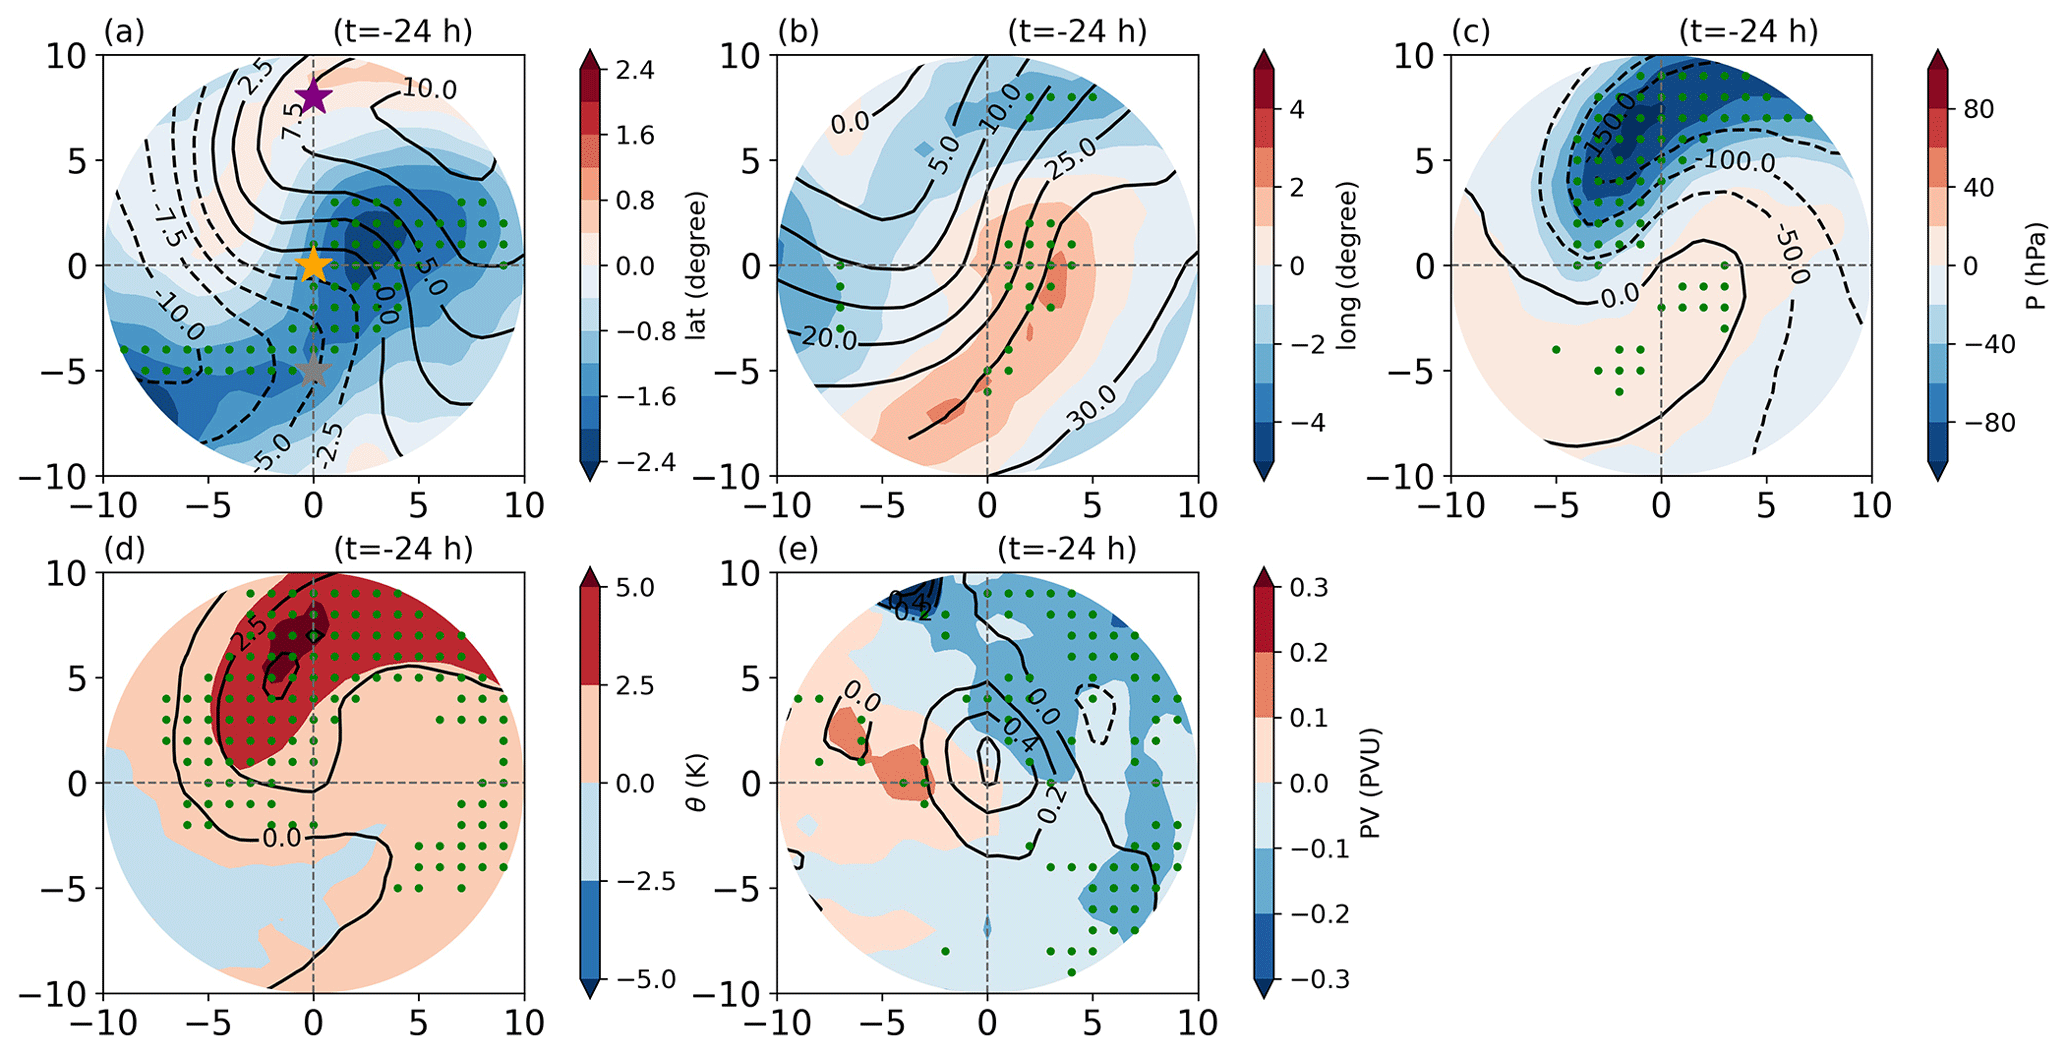
Figure 5Composites of Lagrangian tendencies along backward trajectories initialized at 250 hPa in the last 24 h before arrival in the cyclone area of (a) latitude, (b) longitude, (c) pressure, (d) potential temperature, and (e) PV. Contours show present-day Lagrangian tendencies, and the color shading indicates the response to future climate change (difference in the Lagrangian tendencies between future and present-day climate). Longitude and latitude are relative to the movement of the cyclone (i.e., with the 24 h longitude and latitude changes of the cyclone center subtracted). Green dots denote regions of ensemble agreement on the sign of change; i.e., more than 80 % of the ensemble members indicate a future change of the same sign. A total of 358 and 308 storms are considered in the present-day and future climate, respectively.
The maximum eastward displacement southeast of the cyclone center (with a longitude change of more than 30∘ in 24 h relative to the cyclone center) is co-located with the exit region of an upper-level jet streak (see Fig. 8d in part 1). The meridional movement of the trajectories (Fig. 5a) is characterized by southward displacement in the western part of the composite, which is co-located with a region of northerly flow also at lower levels (see again Fig. 3a), and northward displacement in its eastern part, which is strongest northeast of the cyclone center. The spatial pattern of the regions of ascent and descent shown in Fig. 5c is indicative of cyclonic wrap-up. Ascending trajectories are located northeast of the cyclone center, with the strongest ascent in the north, which is in contrast to the pattern at 700 hPa (see again Fig. 3c). These poleward ascending trajectories are related to the WCB outflow, as also shown in the time series in Fig. 6 (right column) and discussed further in Sect. 4.3. The descent of trajectories located to the southwest of the cyclone center is weaker than the ascent in the northeastern part. Similar to the composite at 700 hPa, also at upper levels the spatial pattern of the Lagrangian tendencies of θ (Fig. 5d) is similar to the pattern of vertical displacement (Fig. 3c). Trajectories arriving over the northern and eastern part of the composite region experience diabatic heating, with the strongest θ increase in the area of largest ascent, the WCB outflow region. As exemplarily shown in Fig. 6c, l, and o, this ascent from the middle to the upper troposphere goes along with a decrease in specific humidity, indicating that the diabatic heating, as for the lower level, is most probably due to latent heat release during cloud formation. Descending trajectories southwest of the cyclone center experience a slight decrease in θ, likely because of longwave radiative cooling.
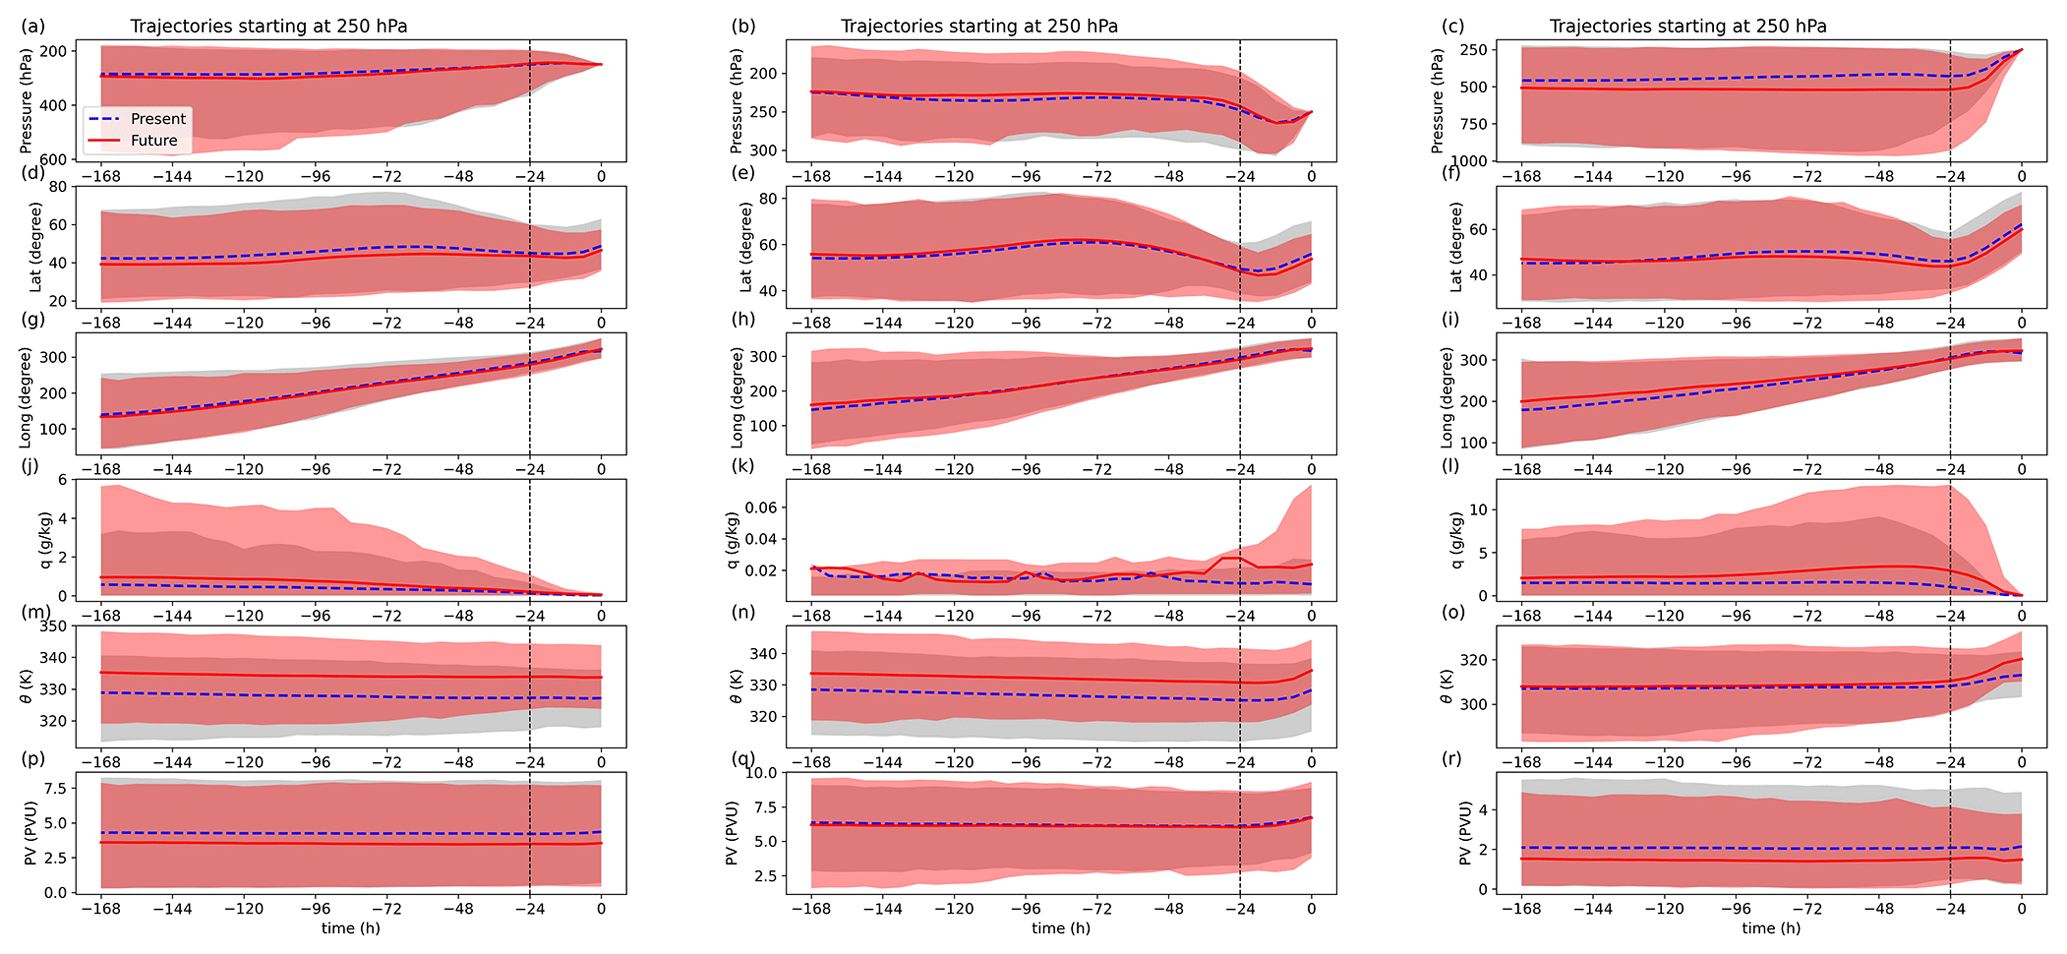
Figure 6Temporal evolution of (a, b, c) pressure, (d, e, f) latitude, (g, h, i) longitude, (j, k, l) specific humidity, (m, n, o) potential temperature, and (p, q, r) PV averages along backward trajectories initialized 5∘ south of the cyclone center (left column, gray star in Fig. 3), at the cyclone center (middle column, orange star in Fig. 3), and 8∘ north of the cyclone center (right column, purple star in Fig. 3) at 700 hPa. The average for present-day climate is shown as a dashed blue line and the average over the future time slice as a red line. The 5th and 95th percentiles are shown in gray shading for present-day climate and red shading for future climate.
The Lagrangian PV tendency in the 24 h before the trajectories reach the cyclone area is shown in Fig. 5e. In contrast to the lower levels (cf. Fig. 3), here the spatial pattern of the PV tendencies does not correspond to the pattern of heating and vertical motion. The strongest PV generation occurs in trajectories reaching the cyclone center. As shown in the time series in Fig. 6 (center column), these trajectories are located in the lower stratosphere (PV > 6 PVU) and are very dry (specific humidity < 0.1 g Kg−1). The modest increase in θ (Fig. 6n) and the diabatic PV generation (Fig. 6q) can thus not be explained by latent heat release. As shown by Chagnon et al. (2013) and Cavallo and Hakim (2013), such lower-stratospheric positive PV anomalies can be diabatically produced by radiative processes near the lowered tropopause above the cyclone center. In particular, longwave radiative cooling is expected to peak in the tropopause region, where vertical humidity gradients are large, leading to a positive vertical heating gradient and thus PV generation above. Farther away from the cyclone center, the mean PV tendency in the last 24 h is close to zero (see again Fig. 5e). This is also the case in the WCB outflow region north of the cyclone center, in spite of substantial latent heat release in these ascending air parcels (see also Fig. 6o and r). Most likely, this is related to varying positions of the air parcels relative to the spatial maximum of diabatic heating, leading to PV generation in some of them, or in the earlier period of the ascent, and PV destruction in others (those located above the heating maximum), which compensate for each other. A small region of negative PV tendency is located northeast of the cyclone center and can be linked to the PV destruction above the heating maximum in the WCB.
Projected future changes in the Lagrangian tendencies at 250 hPa (color shading in Fig. 5) indicate a strengthening of the ascent as well as enhanced northward and reduced eastward transport in the WCB outflow region north of the cyclone center. This corresponds to an intensification of the WCB outflow that wraps around the cyclone center. This enhanced ascent and WCB activity goes along with amplified diabatic heating (Fig. 5d). The region south of the cyclone center experiences decreasing northward and enhanced eastward transport, which is, however, not related to pronounced changes in vertical motion or diabatic heating. Finally, there are no pronounced future changes in Lagrangian PV tendencies in the last 24 h before the cyclones' maximum intensity (Fig. 5e). The PV tendencies slightly decrease northeast of the cyclone center, but this decrease is small compared to the projected change in PV advection in this region (see example in Fig. 6r).
Hence, again, in contrast to the 700 hPa level, the 24 h Lagrangian PV tendency changes do not explain the projected changes in PV anomalies at 250 hPa (Fig. 8c in part 1). The projected PV anomaly reduction south of the cyclone center can be explained by a strong PV reduction at the origin of the air parcels 7 d before arriving in the cyclone area (Fig. 6p). These lower PV values at the origin, which are approximately conserved during transport (at least in the mean over all trajectories), are due to a future reduction in the mean PV climatology (Fig. S1) but also a mean downward and, in particular, southward shift in the location of the origin (Fig. 6a, d). The reduced PV anomalies in this southern region are thus primarily caused by enhanced meridional transport of low-PV air from more southerly regions, which is consistent with the mean wind changes shown in Fig. 8d of part 1. Also for trajectories arriving at the cyclone center, the PV at their origin 7 d before is slightly lower in the simulated future climate (Fig. 6q), but this difference is mostly compensated for by enhanced PV production in the last 24 h. As discussed above, this diabatic PV change is likely associated with radiative processes. The trajectories thus arrive at the cyclone center with almost the same PV in present-day and future climate, but, because of the decrease in climatological PV (Fig. S1), this leads to a larger positive PV anomaly in the future climate, explaining the positive signal at the cyclone center in Fig. 8c of part 1. Finally, the projected increase in PV anomalies northeast of the cyclone center (see again Fig. 8c in part 1), which cannot be explained by our Lagrangian diagnostic (Fig. 6, right column), should be interpreted with care, as it is not robust across vertical levels (in a region of large vertical PV gradients) and (at least at many grid points) ensemble members. An increase in PV anomalies in the northeast is thus not apparent in the upper-tropospheric vertical mean change in Fig. 9b of part 1 and is thus not thought to substantially affect future changes in cyclone dynamics.
In summary, several processes shape future changes in cyclonic PV anomalies at upper levels, in particular changes in PV advection, but possibly also radiative processes in the lower stratosphere near the cyclone center. The latter should be investigated in more detail in future studies. Amplified latent heat release affects the WCB outflow region and is linked to enhanced vertical motion there, but this does not go along with consistent changes in PV anomalies, likely due to a compensation between a strengthening of both diabatic PV generation and reduction. Altogether, this corroborates the second part of our hypothesis formulated in Sect. 1.
4.3 Lagrangian composite cross sections
The Lagrangian composite analysis has shown that transport and diabatic processes along trajectories shape future changes in cyclonic PV anomalies on specific pressure levels. To better understand the three-dimensional structure of such Lagrangian tendency changes and further link these tendencies to the classical airstream concept (see Sect. 1), in the following, this analysis is extended with the help of vertical cross sections of Lagrangian pressure and PV tendencies. More specifically, four cross sections are studied: (1) west to east through the cyclone center, (2) south to north through the cyclone center, (3) south to north 8∘ east of the center (WCB region), and (4) west to east 4∘ south of the center (dry intrusion region).
4.3.1 Cyclone center cross sections
Figure 7 shows the two cross sections (1) and (2), which are located at the center of the composite cyclone. The west–east section indicates the presence of two regions of strong ascent in present-day climate (Fig. 7a). The first region is located above the cyclone center, with the most vigorous ascent at mid-levels. This region extends further to the north of the center and to higher altitudes, as shown in Fig. 7c. The second region is located in the eastern part of the cross section, with the strongest ascent around 400 hPa. Both the ascent at high levels north of the cyclone center and the ascent in the eastern part of the cross section are likely associated with WCBs, more specifically with a cyclonic WCB branch wrapping around the cyclone center and an anticyclonic branch extending further downstream, respectively, as already described in previous studies (Martínez-Alvarado et al., 2014; Binder et al., 2016). The region of westward motion is evident at 500 hPa (see Fig. S2), indicating that the outflow of the cyclonic branch is located at lower altitudes. An area of descent is located to the south of the cyclone center, peaking around 700–650 hPa (Fig. 7c), which is probably linked to the dry intrusion.
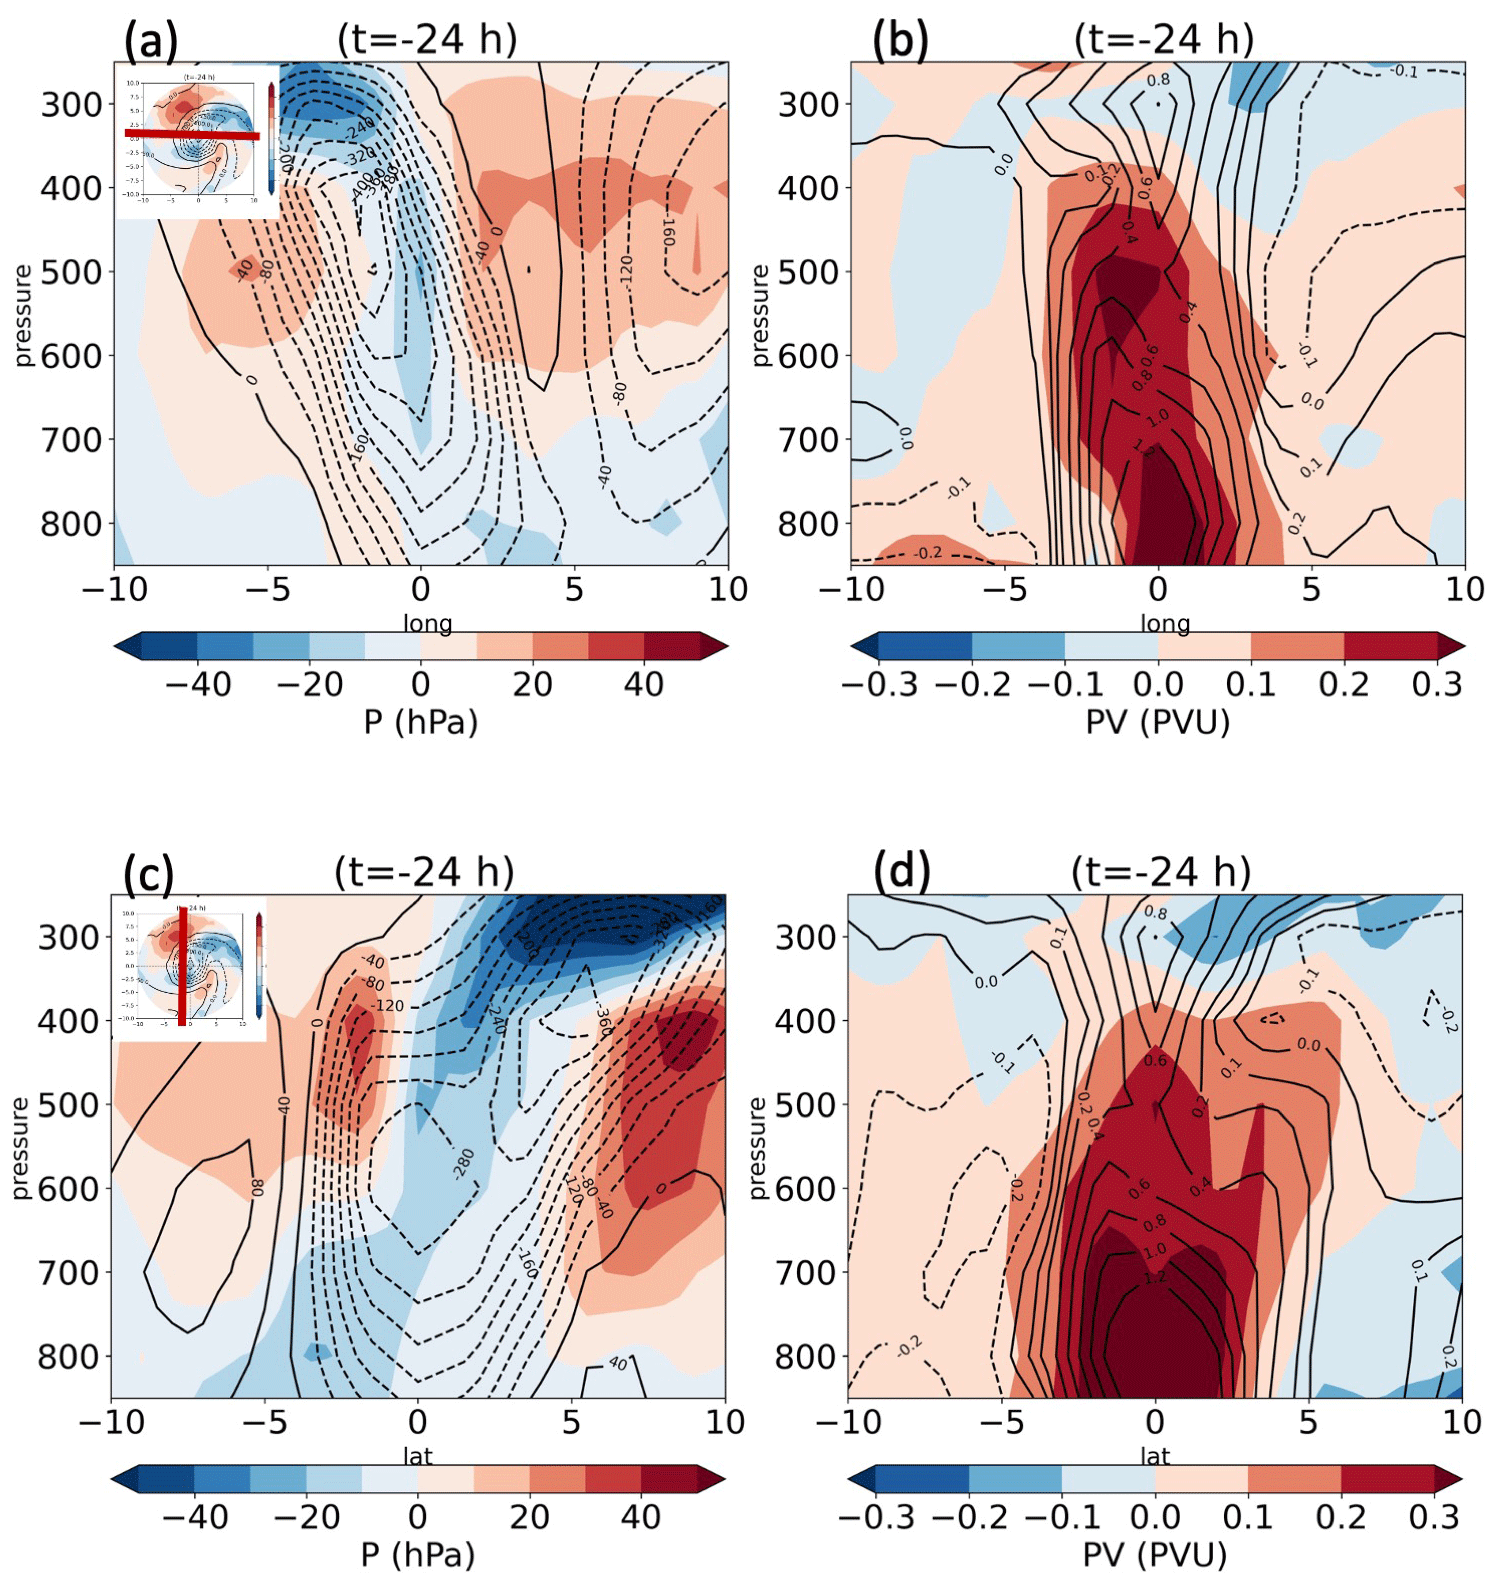
Figure 7(a, b) West–east and (c, d) south–north vertical cross sections through the cyclone center. Contours show present-day Lagrangian tendencies along backward trajectories in the last 24 h before arrival in the cyclone area of (a, c) pressure and (b, d) PV. Color shading shows the response to future climate change.
The strongest PV production occurs along trajectories initialized near the cyclone center at low levels (Fig. 7b, d), with a maximum PV increase of more than 1.2 PVU in 24 h. It extends up to mid-levels. This PV production, as described above, is due to latent heat release during cloud formation. A second maximum in PV production is located above the cyclone center at upper levels, peaking around 300 hPa, above the region of strong ascent. As discussed in Sect. 4.2.2, the diabatic PV generation in this region near and above the tropopause is likely due to radiative heating and cooling (Chagnon et al., 2013; Cavallo and Hakim, 2013). Together, the PV generation by these diabatic processes at lower and upper levels contributes to the formation of a PV tower above the cyclone center. The PV tendencies in the air parcels associated with the WCB are positive in the mid-level region of strong ascent above the cyclone center, contributing to cyclone intensification (see again Binder et al., 2016), and small to slightly negative in the upper-level outflow regions to the north and east of the cyclone center. The latter, as discussed above, is due to the compensation between PV generation below and PV destruction above the heating maximum (Madonna et al., 2014; Methven, 2015). In spite of these small Lagrangian PV tendencies, WCB outflow typically leads to negative PV anomalies in the upper troposphere due to net upward transport of low-PV air from lower levels (Steinfeld and Pfahl, 2019; Grams et al., 2011). In the region of mean descent south of the cyclone center, Lagrangian PV tendencies are negative (see also the example in Fig. 4p), possibly associated with turbulent mixing of the descending air parcels with lower-tropospheric, low-PV air (Attinger et al., 2021).
In the simulated future climate, the ascent in the cyclones' core region near the center is projected to intensify over the entire column (blue shading in Fig. 7a, c), with a maximum intensification at upper levels slightly west of the center that corresponds to an upward extension of the region of strong ascent in the cyclonic branch of the WCB outflow. This enhanced ascent goes along with amplified PV production at low and mid-levels due to stronger latent heat release (red shading in Fig. 7b, d). Two regions are identified where the PV tendency increases by more than 0.2 PVU: the lower levels above the cyclone center (see also Fig. 4, center column) and the core region of the WCB ascent between 600 and 500 hPa slightly west of the center. On the contrary, there is no clear future change in the radiative PV generation at upper levels above the cyclone center. The increase observed at 250 hPa in Fig. 6q is thus not representative for the altitudes slightly below. This apparently complex response of such radiative processes near the tropopause to climate warming warrants future investigation. In the upper-tropospheric outflow region of the cyclonic branch of the WCB north of the cyclone center, the ascent intensifies above 300 hPa and also shifts upwards (dipole pattern in Fig. 7c). The changes in PV tendencies in this region are relatively small but consistently negative in the upper part (300 hPa and above). Such a reduction of PV generation may be partly explained by the upward shift of the tropopause and WCB outflow in a warmer climate, leading to weaker PV tendencies in a region characterized by radiative PV production in the lower stratosphere in present-day climate. In the anticyclonic branch of the WCB in the eastern part of the cross section, the ascent is projected to weaken at mid- and upper levels, without a clear effect on PV tendencies. Finally, the region of descent south of the cyclone center shifts upward, associated with intensified descent at mid-levels. PV tendency changes in this area are again small but positive, indicating a weakening of the PV reduction in the descending air parcels. In the next two subsections, two additional cross sections are analyzed to better characterize the changes in the eastern WCB branch as well as the dry intrusion region of descent south of the center.
4.3.2 WCB cross section
As described above, we have identified two WCB branches. The evolution of the first, cyclonic branch has been described in detail with the vertical cross sections at the cyclone center. To analyze the second branch, we have constructed the south–north cross section (3), 8∘ east of the center, as shown in Fig. 8.
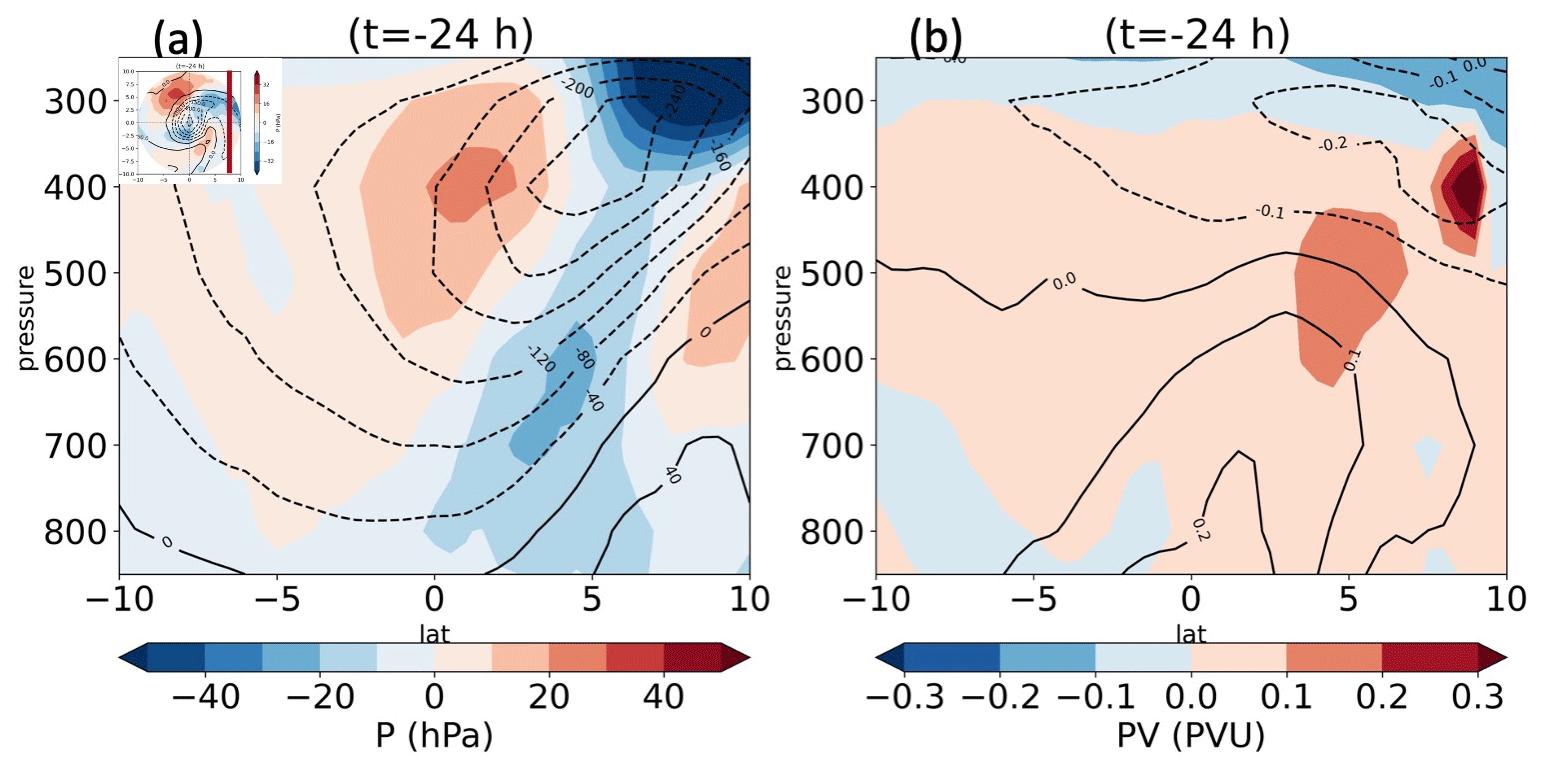
Figure 8South–north vertical cross section through the WCB region 8∘ east of the cyclone center. Contours show present-day Lagrangian tendencies along backward trajectories in the last 24 h before arrival in the cyclone area of (a) pressure and (b) PV. Color shading shows the response to future climate change.
The cross section is dominated by ascending trajectories (Fig. 8a), with the strongest ascent of more than 240 hPa in 24 h at upper levels in the northern part associated with the WCB outflow. A dipole pattern is apparent in the Lagrangian PV tendencies (Fig. 8b), with PV generation below 500 hPa (albeit with a smaller magnitude compared to the cyclone center; cf. Fig. 7b and d) and PV destruction above, in particular in the northern part. This large area of negative PV tendencies may contribute to ridge building downstream of the cyclones (see again Steinfeld and Pfahl, 2019; Grams et al., 2011).
In future climate, the ascent of this WCB branch is projected to shift poleward, associated with reduced ascent on the southern flank of the present-day maximum (peaking at 400 hPa) and enhanced ascent on its northern flank (throughout the entire column). The strongest increase in ascent is found above 300 hPa near the northern edge of the cross section, implying an upward extension of the WCB outflow, similar to the cyclonic branch. Figure 8a also shows that the reduced ascent observed for the eastern WCB branch in Fig. 7a does not imply a weakening of the entire branch, but, as discussed above, rather a spatial shift. PV tendencies are projected to increase across most of the vertical section from the surface up to 300 hPa (Fig. 8b). In some areas around 400 hPa, this changes the sign of the tendency, from PV destruction in present-day climate to PV generation in future climate. The strongest PV tendency increase is found above the area of the strongest mid-level amplification of ascent, which is consistent with enhanced PV generation by latent heat release in the ascending air masses. It also coincides with increasing precipitation in the region of the warm front (not shown).
4.3.3 DI cross section
The Lagrangian tendency composite at 700 hPa (Fig. 3), the north–south vertical cross section through the cyclone center (Fig. 7c, d), and the time series in Fig. 4 (left column) show a descending airstream south of the center with characteristics of a dry intrusion (Raveh-Rubin, 2017). To study the spatial pattern of this DI in more detail, we analyze the west–east vertical cross section (4) 4∘ south of the cyclone center, as shown in Fig. 9.
Figure 9West–east vertical cross section through the dry intrusion region 4∘ south of the cyclone center. Contours show present-day Lagrangian tendencies along backward trajectories in the last 24 h before arrival in the cyclone area of (a) pressure and (b) PV. Color shading shows the response to future climate change.
In this cross section, there is a broad region of descent in the western part and ascent in the eastern part (Fig. 9a), with the latter being associated with the WCB. The transition between these two regimes around 5∘ east of the cyclone center is likely associated with the mean position of the cold front. The two areas of strongest descent are located at the western boundary at low levels (∼ 800 hPa) and east of the cyclone center at middle levels (∼ 550 hPa). Apparently, some DI trajectories arrive to the west of the cyclone, moving southeastward at low levels, and others to the east of the cyclone, moving northeastward close to the cyclone center. This is consistent with the fanning out of DI trajectories as they descend behind the cold front described in previous studies (Browning, 1997). Lagrangian PV tendencies are negative in the regions of strongest descent and positive below the maximum descent east of the cyclone center (Fig. 9b).
In a warmer climate, the descent of the DI trajectories at low levels in the western part is projected to weaken. In contrast, at the mid-level maximum east of the cyclone center, the descent is amplified. PV tendencies increase in most areas below 500 hPa, weakening the PV destruction in most regions but amplifying PV generation below the area of maximum descent south of the cyclone center. These projected changes in DI descent and PV tendencies may have implications for severe weather events associated with the DI, which should be investigated in more detail in future studies.
In this study, we have used a Lagrangian perspective based on air parcel trajectory calculations to investigate projected future changes of airstreams in intense North Atlantic extratropical winter cyclones as well as their role for PV anomaly changes. The strongest 1 % of cyclones in 10-member CESM-LE simulations have been considered, amounting to 358 cyclones in the present-day climate and 308 cyclones in the future climate. Lagrangian tendency composites have been constructed to link this Lagrangian perspective to the Eulerian composite analysis of part 1 of this study.
Our results show that lower-tropospheric air parcel properties, in particular PV, are driven by changes happening in the last 24 h before the air parcels arrive in the cyclone area. This period is strongly affected by diabatic heating associated with cloud formation in ascending airstreams, which leads to diabatic PV production maximizing at and around the center of the composite cyclone. Primarily due to the increasing atmospheric moisture content in a warming climate, this diabatic PV generation on the day before the cyclones' maximum intensity is projected to intensify, which quantitatively explains the increase in low-level cyclonic PV anomalies that has been identified in part 1 and that has a strong impact also on low-level wind changes, in particular in the cyclones' warm sector. The amplified latent heating is also associated with enhanced ascent and PV generation in WCB airstreams (in agreement with previous studies based on the same CESM simulations; see Joos et al., 2023; Binder et al., 2023), which further contributes to the intensification of mid-level PV anomalies in the cyclones' PV tower. Accordingly, our Lagrangian analysis corroborates the hypothesis that the relative importance of moist processes, especially latent heat release during cloud formation, for cyclone dynamics increases in a warmer climate compared to other, dry-dynamical mechanisms, which has already been formulated in part 1 and other previous studies (Pfahl et al., 2015; Büeler and Pfahl, 2019; Sinclair et al., 2020; Binder et al., 2023). Changes in low-level PV tendencies and anomalies in regions further away from the cyclone center, including the DI region to the south, are of smaller magnitude and thus likely of secondary importance for general aspects of the cyclones' dynamics. Nevertheless, projected changes in DI descent and diabatic PV destruction (likely associated with turbulence) may have implications for more localized, smaller-scale severe weather events that should be investigated in future studies.
Future changes in air parcel properties at upper levels are more complex and affected by several processes also operating on timescales longer than 24 h. Accordingly, the upper-level composite PV anomaly changes identified in part 1 do not correspond to the 24 h Lagrangian PV change composite shown in Fig. 5e). Enhanced vertical and especially meridional transport of low-PV air masses explain the decrease in PV anomalies south of the cyclone center. An increase in the stratospheric anomaly above the center is related to a combination of altered transport, diabatic PV generation likely due to radiative processes, and changes in the background PV climatology. In particular, the complex changes in radiative PV production near the tropopause level warrant further investigation. Air parcels arriving in the WCB outflow regions north (cyclonic branch) and northeast (anticyclonic branch) of the cyclone center experience enhanced ascent, leading to an elevated WCB outflow level and a modest intensification of diabatic PV destruction. However, this is not associated with robust and consistent changes in PV anomalies in the outflow regions, most likely because the enhanced PV destruction is partly compensated for by enhanced PV generation during an earlier period, when the air parcels are located at lower altitudes, and also by the complex interplay of changes in other processes (advection, radiation) and the spatial pattern of the WCB outflow that may mask the relatively small cloud diabatic tendency changes. Nevertheless, note that the lack of robust changes in PV anomalies on the 250 hPa level does not imply that the enhanced WCB ascent and diabatic heating may not have an effect on the persistence and intensity (through the elevated outflow level) of downstream ridges and atmospheric blocking (cf. Steinfeld et al., 2022).
Limitations of our study are related to the fact that it is based on a single climate model only. As shown previously, the CESM simulations applied here capture WCB properties and their connection to cyclones reasonably well but still underestimate the magnitude of positive low-level PV anomalies associated with the WCB (Joos et al., 2023; Binder et al., 2023). Future investigations should thus focus on the robustness of the conclusions obtained here when using more than one model. Furthermore, the relatively coarse spatial and temporal resolution (time step of 6 h) limits the ability of the trajectory calculations to resolve ascending motion. This implies that, for instance, convection embedded in the WCB is not captured (Oertel et al., 2020), and the influence of diabatic changes on future cyclone dynamics may be underestimated (Willison et al., 2015).
The code of the CESM version 1 that was used for the large ensemble simulations is available from https://www.cesm.ucar.edu/models/cesm1.0/ (NCAR, 2015). The code of the trajectory model LAGRANTO is available from https://iacweb.ethz.ch/staff/sprenger/lagranto/download.html (Sprenger and Wernli, 2015).
The CESM-LE reruns output is very large and thus cannot all be made publicly available; subsets can be provided upon request.
The supplement related to this article is available online at: https://doi.org/10.5194/wcd-5-163-2024-supplement.
Both authors designed the study. EDT performed the analysis, produced the figures, and drafted the manuscript. Both authors discussed the results and edited the manuscript.
At least one of the (co-)authors is a member of the editorial board of Weather and Climate Dynamics. The peer-review process was guided by an independent editor, and the authors also have no other competing interests to declare.
Publisher’s note: Copernicus Publications remains neutral with regard to jurisdictional claims made in the text, published maps, institutional affiliations, or any other geographical representation in this paper. While Copernicus Publications makes every effort to include appropriate place names, the final responsibility lies with the authors.
This article is part of the special issue “Past and future European atmospheric extreme events under climate change”. It is not associated with a conference.
We are grateful to Urs Beyerle (ETH Zurich) for performing the CESM-LE reruns. We acknowledge the HPC service of ZEDAT, Freie Universität Berlin, for providing computational resources (Bennett et al., 2020).
This research has been supported by the Deutsche Forschungsgemeinschaft (grant no. CRC 1114 “Scaling Cascades in Complex Systems”, project C06).
This paper was edited by Gwendal Rivière and reviewed by three anonymous referees.
Attinger, R., Spreitzer, E., Boettcher, M., Wernli, H., and Joos, H.: Systematic assessment of the diabatic processes that modify low-level potential vorticity in extratropical cyclones, Weather Clim. Dynam., 2, 1073–1091, https://doi.org/10.5194/wcd-2-1073-2021, 2021. a, b
Bennett, L., Melchers, B., and Proppe, B.: Curta: a general-purpose high-performance computer at ZEDAT, Freie Universität Berlin, https://doi.org/10.17169/refubium-26754, 2020. a
Binder, H., Boettcher, M., Joos, H., and Wernli, H.: The role of warm conveyor belts for the intensification of extratropical cyclones in Northern Hemisphere winter, J. Atmos. Sci., 73, 3997–4020, https://doi.org/10.1175/JAS-D-15-0302.1, 2016. a, b, c, d, e, f, g
Binder, H., Joos, H., Sprenger, M., and Wernli, H.: Warm conveyor belts in present-day and future climate simulations – Part 2: Role of potential vorticity production for cyclone intensification, Weather Clim. Dynam., 4, 19–37, https://doi.org/10.5194/wcd-4-19-2023, 2023. a, b, c, d, e
Browning, K.: The dry intrusion perspective of extra-tropical cyclone development, Meteorol. Appl., 4, 317–324, https://doi.org/10.1017/S1350482797000613, 1997. a, b, c
Browning, K. A.: Conceptual models of precipitation systems, Weather Forecast., 1, 23–41, https://doi.org/10.1175/1520-0434(1986)001<0023:CMOPS>2.0.CO;2, 1986. a
Browning, K. A.: Organization of clouds and precipitation in extratropical cyclones, in: Extratropical cyclones, Springer, 129–153, https://doi.org/10.1007/978-1-944970-33-8_8, 1990. a
Büeler, D. and Pfahl, S.: Potential Vorticity Diagnostics to Quantify Effects of Latent Heating in Extratropical Cyclones. Part II: Application to Idealized Climate Change Simulations, J. Atmos. Sci., 76, 1885–1902, https://doi.org/10.1175/JAS-D-18-0342.1, 2019. a, b
Carlson, T. N.: Airflow through midlatitude cyclones and the comma cloud pattern, Mon. Weather Rev., 108, 1498–1509, https://doi.org/10.1175/1520-0493(1980)108<1498:ATMCAT>2.0.CO;2, 1980. a, b
Catto, J. L., Shaffrey, L. C., and Hodges, K. I.: Can climate models capture the structure of extratropical cyclones?, J. Climate, 23, 1621–1635, https://doi.org/10.1175/2009JCLI3318.1, 2010. a, b, c, d
Catto, J. L., Ackerley, D., Booth, J. F., Champion, A. J., Colle, B. A., Pfahl, S., Pinto, J. G., Quinting, J. F., and Seiler, C.: The Future of Midlatitude Cyclones, Current Climate Change Reports, 5, 407–420, https://doi.org/10.1007/s40641-019-00149-4, 2019. a
Cavallo, S. M. and Hakim, G. J.: Physical mechanisms of tropopause polar vortex intensity change, J. Atmos. Sci., 70, 3359–3373, https://doi.org/10.1175/JAS-D-13-088.1, 2013. a, b, c
Chagnon, J., Gray, S., and Methven, J.: Diabatic processes modifying potential vorticity in a North Atlantic cyclone, Q. J. Roy. Meteor. Soc., 139, 1270–1282, https://doi.org/10.1002/qj.2037, 2013. a, b, c
Dacre, H. F. and Gray, S. L.: Quantifying the climatological relationship between extratropical cyclone intensity and atmospheric precursors, Geophys. Res. Lett., 40, 2322–2327, https://doi.org/10.1002/grl.50105, 2013. a
Dolores-Tesillos, E., Teubler, F., and Pfahl, S.: Future changes in North Atlantic winter cyclones in CESM-LE – Part 1: Cyclone intensity, potential vorticity anomalies, and horizontal wind speed, Weather Clim. Dynam., 3, 429–448, https://doi.org/10.5194/wcd-3-429-2022, 2022. a
Fluck, E. and Raveh-Rubin, S.: Dry air intrusions link Rossby wave breaking to large-scale dust storms in Northwest Africa: Four extreme cases, Atmos. Res., 286, 106663, https://doi.org/10.1016/j.atmosres.2023.106663, 2023. a
Grams, C. M., Wernli, H., Böttcher, M., Čampa, J., Corsmeier, U., Jones, S. C., Keller, J. H., Lenz, C.-J., and Wiegand, L.: The key role of diabatic processes in modifying the upper-tropospheric wave guide: a North Atlantic case-study, Q. J. Roy. Meteor. Soc., 137, 2174–2193, https://doi.org/10.1002/qj.891, 2011. a, b, c
Harrold, T.: Mechanisms influencing the distribution of precipitation within baroclinic disturbances, Q. J. Roy. Meteor. Soc., 99, 232–251, https://doi.org/10.1002/qj.49709942003, 1973. a, b
Hoskins, B. J., McIntyre, M. E., and Robertson, A. W.: On the use and significance of isentropic potential vorticity maps, Q. J. Roy. Meteor. Soc., 111, 877–946, https://doi.org/10.1002/qj.49711147002, 1985. a
Joos, H.: Warm conveyor belts and their role for cloud radiative forcing in the extratropical storm tracks, J. Climate, 32, 5325–5343, https://doi.org/10.1175/JCLI-D-18-0802.1, 2019. a
Joos, H. and Wernli, H.: Influence of microphysical processes on the potential vorticity development in a warm conveyor belt: a case-study with the limited-area model COSMO, Q. J. Roy. Meteor. Soc., 138, 407–418, https://doi.org/10.1002/qj.934, 2012. a
Joos, H., Sprenger, M., Binder, H., Beyerle, U., and Wernli, H.: Warm conveyor belts in present-day and future climate simulations – Part 1: Climatology and impacts, Weather Clim. Dynam., 4, 133–155, https://doi.org/10.5194/wcd-4-133-2023, 2023. a, b, c, d
Kay, J. E., Deser, C., Phillips, A., Mai, A., Hannay, C., Strand, G., Arblaster, J., Bates, S., Danabasoglu, G., Edwards, J., Holland, M., Kushner, P., Lamarque, J.-F., Lawrence, D., Lindsay, K., Middleton, A., Munoz, E., Neale, R., Oleson, K., Polvani, L., and Vertenstein, M.: The Community Earth System Model (CESM) large ensemble project: A community resource for studying climate change in the presence of internal climate variability, B. Am. Meteorol. Soc., 96, 1333–1349, https://doi.org/10.1175/BAMS-D-13-00255.1, 2015.
Klawa, M. and Ulbrich, U.: A model for the estimation of storm losses and the identification of severe winter storms in Germany, Nat. Hazards Earth Syst. Sci., 3, 725–732, https://doi.org/10.5194/nhess-3-725-2003, 2003. a
Kolen, B., Slomp, R., Van Balen, W., Terpstra, T., Bottema, M., and Nieuwenhuis, S.: Learning from French experiences with storm Xynthia; damages after a flood, HKV LIJN IN WATER and Rijkswaterstaat, Waterdienst, ISBN 978-90-77051-77-1, 2010. a
Lackmann, G. M.: Cold-frontal potential vorticity maxima, the low-level jet, and moisture transport in extratropical cyclones, Mon. Weather Rev., 130, 59–74, https://doi.org/10.1175/1520-0493(2002)130<0059:CFPVMT>2.0.CO;2, 2002. a
Laurila, T. K., Gregow, H., Cornér, J., and Sinclair, V. A.: Characteristics of extratropical cyclones and precursors to windstorms in northern Europe, Weather Clim. Dynam., 2, 1111–1130, https://doi.org/10.5194/wcd-2-1111-2021, 2021. a
Leckebusch, G. C., Koffi, B., Ulbrich, U., Pinto, J. G., Spangehl, T., and Zacharias, S.: Analysis of frequency and intensity of European winter storm events from a multi-model perspective, at synoptic and regional scales, Clim. Res., 31, 59–74, https://doi.org/10.3354/cr031059, 2006. a
Madonna, E., Wernli, H., Joos, H., and Martius, O.: Warm conveyor belts in the ERA-Interim dataset (1979–2010). Part I: Climatology and potential vorticity evolution, J. Climate, 27, 3–26, https://doi.org/10.1175/JCLI-D-12-00720.1, 2014. a, b, c, d, e, f, g, h, i
Martínez-Alvarado, O., Joos, H., Chagnon, J., Boettcher, M., Gray, S., Plant, R., Methven, J., and Wernli, H.: The dichotomous structure of the warm conveyor belt, Q. J. Roy. Meteor. Soc., 140, 1809–1824, https://doi.org/10.1002/qj.2276, 2014. a
Methven, J.: Potential vorticity in warm conveyor belt outflow, Q. J. Roy. Meteor. Soc., 141, 1065–1071, https://doi.org/10.1002/qj.2393, 2015. a
NCAR: Community Earth System Model (CESM), NCAR [code], https://www.cesm.ucar.edu/models/cesm1.0/, 2020.
Oertel, A., Boettcher, M., Joos, H., Sprenger, M., and Wernli, H.: Potential vorticity structure of embedded convection in a warm conveyor belt and its relevance for large-scale dynamics, Weather Clim. Dynam., 1, 127–153, https://doi.org/10.5194/wcd-1-127-2020, 2020. a, b
Pfahl, S., Madonna, E., Boettcher, M., Joos, H., and Wernli, H.: Warm conveyor belts in the ERA-Interim dataset (1979–2010). Part II: Moisture origin and relevance for precipitation, J. Climate, 27, 27–40, https://doi.org/10.1175/JCLI-D-13-00223.1, 2014. a, b
Pfahl, S., O’Gorman, P. A., and Singh, M. S.: Extratropical cyclones in idealized simulations of changed climates, J. Climate, 28, 9373–9392, https://doi.org/10.1175/JCLI-D-14-00816.1, 2015. a, b
Priestley, M. D. K. and Catto, J. L.: Future changes in the extratropical storm tracks and cyclone intensity, wind speed, and structure, Weather Clim. Dynam., 3, 337–360, https://doi.org/10.5194/wcd-3-337-2022, 2022. a
Raveh-Rubin, S.: Dry intrusions: Lagrangian climatology and dynamical impact on the planetary boundary layer, J. Climate, 30, 6661–6682, https://doi.org/10.1175/JCLI-D-16-0782.1, 2017. a, b, c, d, e, f
Raveh-Rubin, S. and Wernli, H.: Large-scale wind and precipitation extremes in the Mediterranean: dynamical aspects of five selected cyclone events, Q. J. Roy. Meteor. Soc., 142, 3097–3114, https://doi.org/10.1002/qj.2891, 2016. a
Roberts, J. F., Champion, A. J., Dawkins, L. C., Hodges, K. I., Shaffrey, L. C., Stephenson, D. B., Stringer, M. A., Thornton, H. E., and Youngman, B. D.: The XWS open access catalogue of extreme European windstorms from 1979 to 2012, Nat. Hazards Earth Syst. Sci., 14, 2487–2501, https://doi.org/10.5194/nhess-14-2487-2014, 2014. a
Schelhaas, M.-J., Nabuurs, G.-J., and Schuck, A.: Natural disturbances in the European forests in the 19th and 20th centuries, Glob. Change Biol., 9, 1620–1633, https://doi.org/10.1046/j.1365-2486.2003.00684.x, 2003. a
Schemm, S. and Wernli, H.: The linkage between the warm and the cold conveyor belts in an idealized extratropical cyclone, J. Atmos. Sci., 71, 1443–1459, https://doi.org/10.1175/JAS-D-13-0177.1, 2014. a, b, c
Schultz, D. M.: Reexamining the cold conveyor belt, Mon. Weather Rev., 129, 2205–2225, https://doi.org/10.1175/1520-0493(2001)129<2205:RTCCB>2.0.CO;2, 2001. a, b
Shaw, T., Baldwin, M., Barnes, E., Caballero, R., Garfinkel, C., Hwang, Y.-T., Li, C., O'Gorman, P., Rivière, G., Simpson, I., and Voigt, A.: Storm track processes and the opposing influences of climate change, Nat. Geosci., 9, 656, https://doi.org/10.1038/ngeo2783, 2016. a
Sinclair, V. A., Rantanen, M., Haapanala, P., Räisänen, J., and Järvinen, H.: The characteristics and structure of extra-tropical cyclones in a warmer climate, Weather Clim. Dynam., 1, 1–25, https://doi.org/10.5194/wcd-1-1-2020, 2020. a, b
Slater, T. P., Schultz, D. M., and Vaughan, G.: Near-surface strong winds in a marine extratropical cyclone: acceleration of the winds and the importance of surface fluxes, Q. J. Roy. Meteor. Soc., 143, 321–332, https://doi.org/10.1002/qj.2924, 2017. a
Sprenger, M. and Wernli, H.: The LAGRANTO Lagrangian analysis tool – version 2.0, Geosci. Model Dev., 8, 2569–2586, https://doi.org/10.5194/gmd-8-2569-2015, 2015 (code available at: https://iacweb.ethz.ch/staff/sprenger/lagranto/download.html). a
Steinfeld, D. and Pfahl, S.: The role of latent heating in atmospheric blocking dynamics: a global climatology, Clim. Dynam., 53, 6159–6180, https://doi.org/10.1007/s00382-019-04919-6, 2019. a, b, c
Steinfeld, D., Boettcher, M., Forbes, R., and Pfahl, S.: The sensitivity of atmospheric blocking to upstream latent heating – numerical experiments, Weather Clim. Dynam., 1, 405–426, https://doi.org/10.5194/wcd-1-405-2020, 2020. a
Steinfeld, D., Sprenger, M., Beyerle, U., and Pfahl, S.: Response of moist and dry processes in atmospheric blocking to climate change, Environ. Res. Lett., 17, 084020, https://doi.org/10.1088/1748-9326/ac81af, 2022. a
Tamarin, T. and Kaspi, Y.: The poleward motion of extratropical cyclones from a potential vorticity tendency analysis, J. Atmos. Sci., 73, 1687–1707, https://doi.org/10.1175/JAS-D-15-0168.1, 2016. a
Ulbrich, U., Leckebusch, G., and Pinto, J. G.: Extra-tropical cyclones in the present and future climate: a review, Theor. Appl. Climatol., 96, 117–131, https://doi.org/10.1007/s00704-008-0083-8, 2009. a
Wernli, B. H. and Davies, H. C.: A Lagrangian-based analysis of extratropical cyclones. I: The method and some applications, Q. J. Roy. Meteor. Soc., 123, 467–489, https://doi.org/10.1002/qj.49712353811, 1997. a, b
Wernli, H.: A Lagrangian-based analysis of extratropical cyclones. II: A detailed case-study, Q. J. Roy. Meteor. Soc., 123, 1677–1706, https://doi.org/10.1002/qj.49712354211, 1997. a
Wernli, H. and Schwierz, C.: Surface cyclones in the ERA-40 dataset (1958–2001). Part I: Novel identification method and global climatology, J. Atmos. Sci., 63, 2486–2507, https://doi.org/10.1175/JAS3766.1, 2006. a
Willison, J., Robinson, W. A., and Lackmann, G. M.: North Atlantic storm-track sensitivity to warming increases with model resolution, J. Climate, 28, 4513–4524, https://doi.org/10.1175/JCLI-D-14-00715.1, 2015. a