the Creative Commons Attribution 4.0 License.
the Creative Commons Attribution 4.0 License.
 | 05 Jan 2026
The multi-year negative Indian Ocean Dipole of 2021–2022
Gill M. Martin
Maheswar Pradhan
Suryachandra A. Rao
Sarah Ineson
The years 2021 and 2022 witnessed negative Indian Ocean Dipole (nIOD) conditions, with the 2022 event being the strongest on record. The dipole mode index was negative since the summer of 2021 and remained negative until early winter 2022, an unprecedented duration of 19 months. This makes it the first such occurrence of a multi-year nIOD. It co-existed with a triple-dip La Niña event during 2020–2022. In this study, we explore the dynamics behind the occurrence of this multi-year nIOD event. The tropical Indian Ocean (TIO) witnessed predominant westerly wind anomalies starting in the summer of 2021 and lasting till the end of 2022, with a record number and duration of westerly wind bursts (WWBs). The anomalous westerlies were possibly supported by the background La Niña state and anomalous convection over the eastern TIO associated with tropical intra-seasonal oscillations. Occurrences of WWBs outside their preferred climatological months and strong westerly wind anomalies modulated the intensity of the zonal currents and the Wyrtki jets in the TIO. The associated heat and mass transfer caused the depression of the thermocline in the eastern TIO, resulting in the sustenance of nIOD conditions. Anomalous westerly wind activity in the TIO during the spring of 2022 served as a bridge between the two nIOD events and sustained it for a record duration. This multi-year nIOD event thus prevented the Indian summer monsoon rainfall from being in large excess, as the monsoon conducive modulation of the Walker circulation was counteracted by the anomalous subsidence over India by the nIOD-modulated regional Hadley circulation.
- Article
(3858 KB) - Full-text XML
-
Supplement
(506 KB) - BibTeX
- EndNote


The works published in this journal are distributed under the Creative Commons Attribution 4.0 License. This license does not affect the Crown copyright work, which is re-usable under the Open Government Licence (OGL). The Creative Commons Attribution 4.0 License and the OGL are interoperable and do not conflict with, reduce or limit each other.
© Crown copyright 2025
The Indian Ocean Dipole (IOD) is a strongly coupled ocean-atmosphere phenomenon that manifests as a zonal dipole in the Indian Ocean sea-surface temperature (SST) (Ajayamohan et al., 2009; Ajayamohan and Rao, 2008; Rao et al., 2009; Rao and Yamagata, 2004; Saji et al., 1999). Anomalously warm SSTs in the eastern Indian Ocean, along with cooler SSTs in the western Indian Ocean, characterize a negative Indian Ocean Dipole (nIOD) event. Such events are known to suppress the Indian Summer Monsoon Rainfall (ISMR, Ajayamohan et al., 2008, 2009; Ajayamohan and Rao, 2008; Ashok et al., 2001; Cherchi et al., 2007; Cherchi and Navarra, 2013; Krishnan et al., 2011; Ratna et al., 2021). nIOD events can also lead to severe droughts during the short rainy season in East Africa (Black et al., 2003; Endris et al., 2019; Manatsa and Behera, 2014), and enhance rainfall in Indonesia (Nur'utami and Hidayat, 2016) and Australia (Cai et al., 2009). Positive IOD (pIOD ) events enhance the Maha rainfall in Sri Lanka (Zubair et al., 2003), produce dipolar rainfall anomalies over Brazil, and enhance rainfall over South China (Bazo et al., 2013; Chan et al., 2008; Qiu et al., 2014). Therefore, the evolution of IOD is closely monitored by operational weather and climate forecasting centers.
IOD conditions in the Indian Ocean are quantified using the dipole mode index (DMI, Saji et al., 1999), which is defined as the difference in area-averaged SST anomalies over western (50–70° E, 10° S–10° N) and eastern Indian Ocean (90–110° E, 10° S–Equator), normalized by its standard deviation. SST anomalies are calculated with respect to the 1960–2022 climatology in this study and are detrended. The indices hence calculated are normalized by the standard deviation of the time-series for 1960–2022. Strong nIOD conditions evolved during the boreal summer of 2022. DMI became strongly negative with a value less than −2 standard deviations during September–November (SON) 2022, thereby making it one of the strongest nIOD events on record (Fig. 1a). It is also worthwhile to note that nIOD-type conditions were present during the summer of 2021 as well, with the DMI index (3 month running mean, Fig. 1b) being negative from May 2021 and lasting till the end of 2022. Such persistent nIOD conditions, lasting for about 19 months during 2021–2022, have not been observed in association with any other nIOD event in the observational record since 1960 (since when systemic Indian Ocean observations became available, Fig. 1d). Another peculiar feature of this event was that it peaked during the boreal summer of 2022 (Fig. 1b), unlike other events, which usually peak in SON. The 2021–2022 event co-occurred with a triple-dip La Niña event, which developed in mid-2020 and continued till 2022 (as is seen from the Niño 3.4 index, and the relative Niño 3.4 index, Fig. 1c). Such triple-dip events are rare and have occurred only four times since 1950 (Ratna et al., 2024). Multi-year La-Niña events exhibit an increasing trend, with eight out of the ten events in the past century occurring after 1970 (Wang et al., 2023).
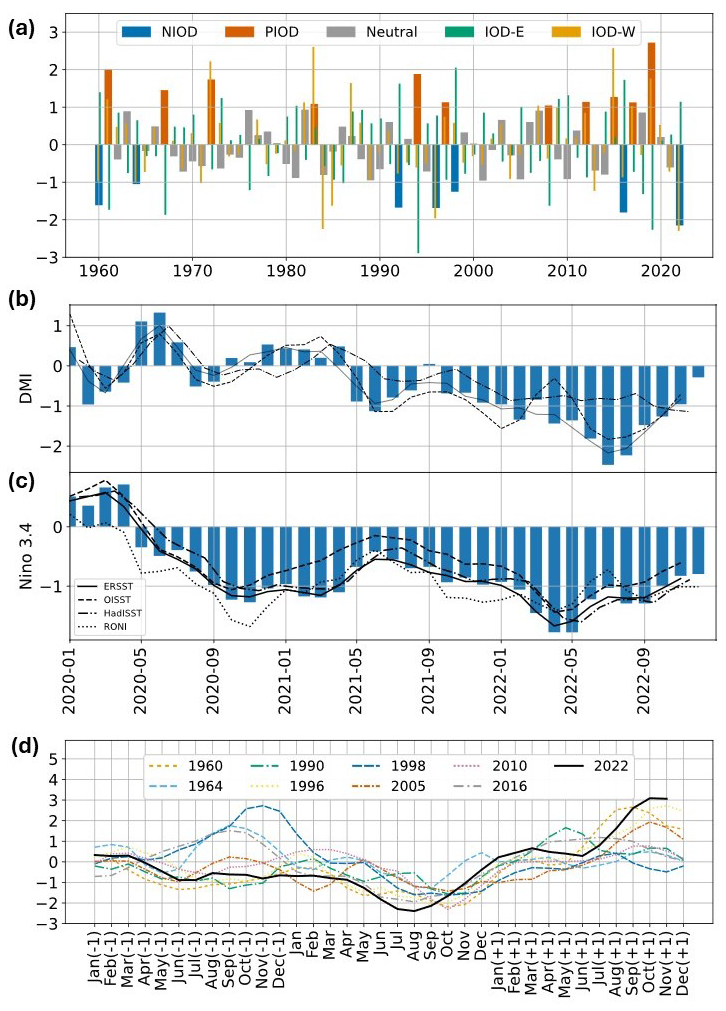
Figure 1The September–November (SON) DMI index, and the IOD east and west pole indices, for the period 1960–2022 based on ERSST dataset. IOD events are categorized as negative (positive) based on whether the normalized DMI was less than (greater than) −1 (+1) standard deviation; (b) the monthly DMI index from ERSST (bars), and the three-month running mean for ERSST, OISST and HadlSST (lines) for the period 2020–2022; (c) same as (b) but for the Niño 3.4 and the relative Niño 3.4 index; and (d) The time evolution of the 3 month running mean of DMI based on ERSST dataset for all nIOD events since 1960. (−1) on the x axis indicates the year previous to the nIOD event, and (+1) indicates the subsequent year. The black curve denotes the evolution of DMI from NDJ 2021 to OND 2023.
Strong La Niña conditions often result in a large excess in rainfall over India during the summer monsoon season (often exceeding 110 % of the long-period average (LPA) during June–September (JJAS) due to the modulation of the associated Walker circulation (Rasmusson et al., 1983; Sikka and Gadgil, 1980). La Niña years are associated with notably decreased (increased) ISMR when preceded by La Niña (El Niño) conditions during the previous winter (Sharma et al., 2024), and triple-dip La Niña events are often associated with positive ISMR anomaly (Ratna et al., 2024). The persistent La Niña conditions during 2020–2022, did not result in a very large positive rainfall anomaly over India. 2020 was an above-normal monsoon year (109 % of the long-period average, LPA). 2021 was a normal monsoon year (99 % of LPA) was a normal monsoon year, and rainfall during 2022 was above normal (106 % of LPA, Ratna et al., 2024). IOD events are closely related to the ENSO state, with the relation between nIOD and La-Niña being much stronger compared to that between El-Niño and pIOD (Ashok et al., 2001; Saji and Yamagata, 2003). The lack of a large positive rainfall anomaly in these years could have been caused by the compensating effect of the nIOD conditions. Two competing processes might have co-existed: (i) the La-Niña associated enhancement of zonal Walker circulation, which tends to enhance rainfall over India by promoting convection over Indian longitudes, and (ii) anomalously warm SST in the IOD east pole can suppress the convection over India by the modulation of the local Hadley circulation. nIOD events are also associated with a strengthened Indian Ocean Walker Circulation, with enhanced convection over the eastern TIO (Lu et al., 2018).
The interaction between the El Niño and Southern Oscillation (ENSO) and IOD is well-documented. Model experiments have revealed that about one-third of the IOD events can be explained by ENSO forcing, while the rest of the events develop due to the internal dynamics of the Indian Ocean (Behera et al., 2006; Xiao et al., 2022; Yang et al., 2015). An ENSO event can also be forced by an extreme IOD event (Annamalai et al., 2005; Luo et al., 2010). For the 2021–2022 nIOD case, the evolution of La Niña conditions in the Pacific preceded the development of nIOD. This leads to the assumption that the nIOD event might be forced by tropical Pacific SSTs. Negative (positive) IOD events tend to co-occur with La Niña (El-Niño) as the associated modulation of the Walker circulation forces anomalous westerly winds (easterlies) in the tropical Indian Ocean (TIO) region. These anomalous winds are reinforced by local air-sea interactions, which peak in the boreal autumn (Hendon, 2003; Hendon et al., 2012). Anomalously strong equatorial westerly winds, often called westerly-wind bursts (WWBs), can trigger strong eastward current in the equatorial Indian Ocean, referred to as the Wyrtki jets (WJs) (Wyrtki, 1973). These jets distribute upper-ocean heat and mass (Reverdin, 1987; Wyrtki, 1973), and anomalous changes to the volume transport of these jets are instrumental in the development of IOD events (Cai et al., 2014; Murtugudde et al., 2000; Vinayachandran et al., 1999, 2007).
The 2021–2022 nIOD event was, therefore, unique in several aspects: (1) it was the strongest nIOD event recorded during 1960–2022. (2) It peaked during the boreal summer of 2022. (3) nIOD conditions were sustained for a record 19 months, making it the first occurrence of a multi-year nIOD event during 1960–2022. (4) This event co-occurred with a triple-dip La Niña event. Did the triple-dip La Niña of 2020–2022 help in sustaining the nIOD conditions? This study will attempt to answer this question.
These peculiar aspects of the event warrant further investigation of the dynamics leading to such a long-lived event. This assumes further significance as the prolonged duration of extreme climatic events can pose hazards comparable to the intensity of these events. Recent studies have shown that the frequency of consecutive La Niña events has increased in recent years (Wang et al., 2023) and is projected to increase further in a warming world (Geng et al., 2023). Consecutive La Niñas can intensify nIOD conditions in the TIO, therefore compounding the climate risk associated with such events. In this study, we aim to investigate the dynamics behind the multi-year nIOD event of 2021–2022. The possible impact of the triple-dip La Niña of 2020–2022 and the multi-year nIOD on the Indian monsoon is also investigated.
The article is organized as follows: Sect. 2 describes the observational data used for the analysis and the methodology. Section 3 describes the major findings, and Sect. 4 summarizes the results.
The following sources of observational monthly SST are utilized: (1) the Extended Reconstructed Sea Surface Temperature (ERSST), Version 5 (Huang et al., 2017), (2) the Optimum Interpolation Sea Surface Temperature (OISST) version 2.1 (Huang et al., 2021), and (3) the Hadley Centre Sea Ice and Sea Surface Temperature data set (HadlSST, Rayner et al., 2003). The ocean temperature profiles (pentad) are obtained from the National Centers for Environmental Prediction (NCEP) Global Ocean Data Assimilation System (GODAS, Behringer et al., 1998), and the depth of the 20 °C isotherm is computed from it. OSCAR (Ocean Surface Current Analysis Real-time, https://doi.org/10.5067/OSCAR-03D01, ESR, 2009) dataset provides near-surface ocean current estimates on a ° grid with a 5 d resolution. The monthly temperature profiles from the MOAA GPV 1° gridded dataset (Hosoda et al., 2008) produced by the Japan Agency for Marine-Earth Science and Technology (JAMSTEC) are also used to compute the 20 °C isotherm. The daily zonal and meridional winds are obtained from the fifth-generation European Centre for Medium-Range Weather Forecasts (ECMWF) reanalysis (ERA5, https://doi.org/10.24381/cds.adbb2d47, Copernicus Climate Change Service, 2023a; https://doi.org/10.24381/cds.bd0915c6, Copernicus Climate Change Service, 2023b). The daily Southern Oscillation Index (SOI) data for the period 1991–2022 (calculated using the 1887–1989 base period) is obtained from the open data portal of the Queensland Government (from their website at https://data.longpaddock.qld.gov.au/SeasonalClimateOutlook/SouthernOscillationIndex/SOIDataFiles/LatestSOI1887-1989Base.txt, last access: 3 January 2024). The relative Niño 3.4 index is also used to remove the possible impact of the global warming signal (L'Heureux et al., 2024; Van Oldenborgh et al., 2021) and is obtained from https://www.cpc.ncep.noaa.gov/data/indices/ (last access: 7 August 2025). The observational phases and amplitudes of the Madden-Julian Oscillation (MJO) and Boreal Summer Intraseasonal Oscillation (BSISO) are based on Kikuchi (2020) and Kikuchi et al. (2012), and are obtained from the website of the International Pacific Research Center (https://iprc.soest.hawaii.edu/users/kazuyosh/ISO_index/data/MJO_25-90bpfil.rt_pc.txt, https://iprc.soest.hawaii.edu/users/kazuyosh/ISO_index/data/BSISO_25-90bpfil.rt_pc.txt, last access: 3 January 2024). The daily Altimeter satellite gridded Sea Level Anomaly (SLA) level 4 data is obtained from the Copernicus Marine Service website (https://doi.org/10.48670/moi-00148, CMEMS, 2024).
The WWB events in the Indian Ocean are identified from ERA5 10 m zonal winds following the methodology described in Seiki and Takayabu (2007), but with a more stringent check on the duration of WWBs. Daily anomalies of the 10 m zonal winds averaged between 2.5° S–2.5° N were computed as the deviations from a 91 d running mean daily climatology. The cases where the anomalies met or exceeded a threshold of 5 m s−1 with a longitudinal extent of 10° longitude (∼ 1100 km) and lasted for more than 4 d (as compared to 2 d in Seiki and Takayabu, 2007) were classified as WWBs. The time duration between two consecutive WWBs should be more than 7 d to ensure that the two events are independent of each other and not a part of a common westerly wind activity.
3.1 Role of Winds, Westerly Wind Bursts, and Wyrtki Jets
Negative IOD events are often triggered by equatorial westerly wind anomalies in the TIO (Ashok et al., 2004; Saji and Yamagata, 2003). Figure 2a shows the 11 d running mean of equatorial (averaged over 5° S–5° N, 60–90° E) 10 m zonal-wind anomalies for all the nIOD events since 1980 (nIOD events are defined based on whether the normalized DMI was less than −1 standard deviation). As the 2022 event is thought to be a multi-year event, the wind anomalies for the previous 2 years (2020 and 2021) are also shown in the same figure (indicated by year-1 and year-2 in Fig. 2a).
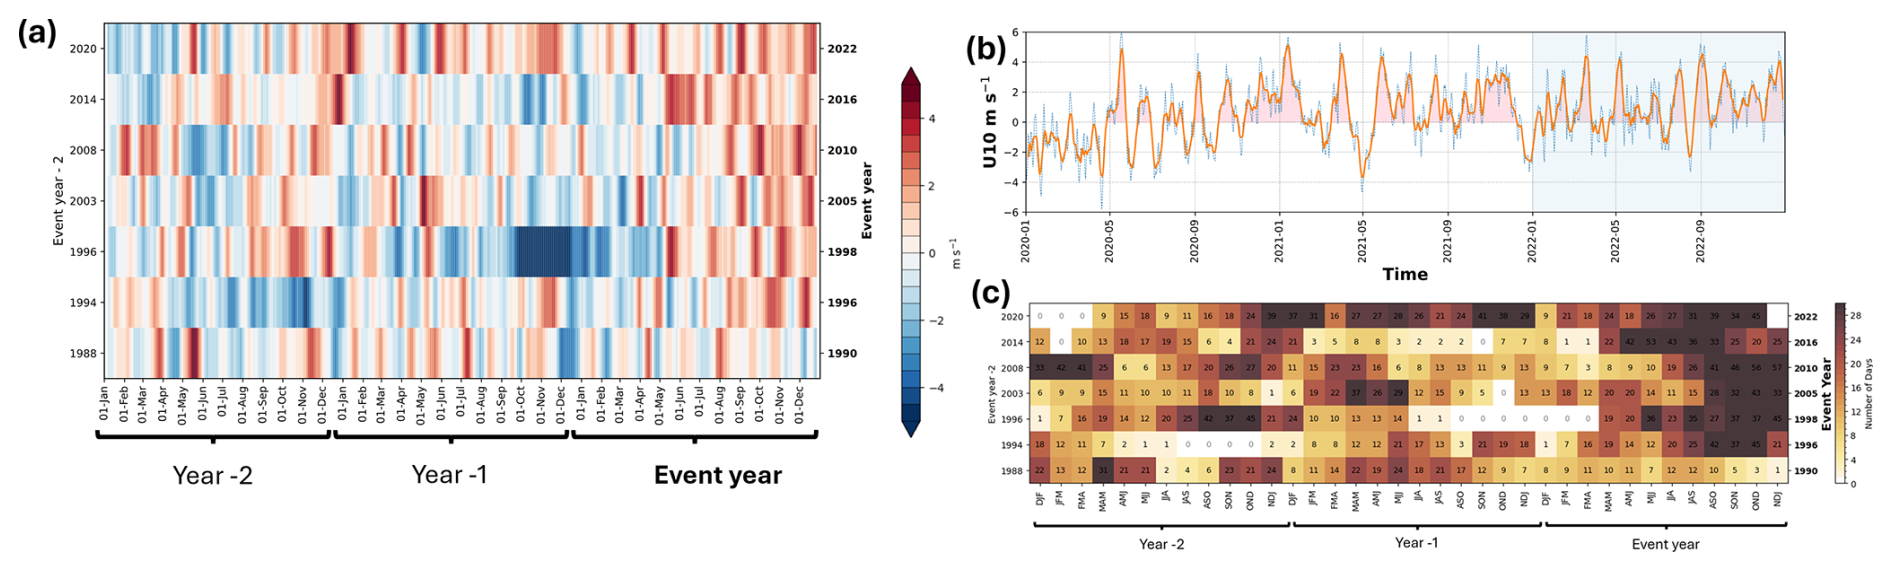
Figure 2(a) The 11 d running mean of equatorial (averaged over 5° S–5° N, 60–90° E) 10 m zonal-wind anomalies for all the nIOD events since 1980. The wind anomalies for the previous two years are indicated by Year-2 and Year-1 on the x axis. (b) Evolution of the equatorial 10 m zonal mean wind anomalies (dashed line), its 7 d running mean (solid line) for the period January 2020 to December 2022. (c) The count of the number of days in a 3 month rolling aggregate when the westerly wind anomaly averaged over the equatorial Indian Ocean (5° S–5° N, 60–90° E) was greater than 2 m s−1. The wind anomalies for the previous two years are indicated by Year-2 and Year-1 on the x axis.
For most nIOD events, strong westerly wind anomalies are generally favored from mid-summer (July–August), persisting till the end of the year. However, the timing of the occurrence of anomalous westerlies in the TIO can impact the evolution of nIOD events. The 2016 event, for example, peaked during boreal summer due to the early initiation of anomalous westerlies (Lu et al., 2018). The 1998 nIOD was associated with a build-up of anomalous heat content in the western TIO, and a WWB event during May in the equatorial Indian Ocean caused the early initiation of nIOD. Also, the abrupt transition from the 1997 El Niño to a La Niña state during May 1998 (McPhaden, 1999) could have aided the nIOD event. Therefore, it is important to assess the evolution of zonal winds in TIO for the 2021–2022 event. A spell of westerly wind anomaly starting in October 2020 and lasting till January 2021 is particularly interesting. Climatologically, the zonal surface (850 hPa) winds over the equatorial Indian Ocean during January–February are close to zero (weak easterly). However, January 2021 witnessed strong anomalous westerly winds, with peak anomalies of ∼5 m s−1. There were multiple strong and long-lived westerly wind events during 2021–2022. The wind anomalies were almost always westerly, starting in mid-May 2021 till December 2022, with a few weak and short-lived anomalous easterly events (Fig. 2b). None of the other nIOD events have exhibited such a strong and persistent westerly wind forcing. The zonal winds at 850 hPa also exhibit similar signatures (figure not shown). Westerly zonal wind anomalies over the equatorial Indian Ocean associated with negative IOD events were quantitatively assessed by counting, within a 3 month rolling window, the number of days on which the anomaly exceeded 2 m s−1 (Fig. 2c). For the nIOD events of 1996, 2005, and 2010, the westerly anomalies are dominant towards the end of boreal summer (JAS, ASO). Some nIOD events develop early in the summer (such as 2016, 1998) and are associated with an early initiation of westerly anomalies in the equatorial Indian Ocean (Lu et al., 2018). Unlike all such events, the 2021–2022 event has strong and persistent westerly anomalies in the equatorial Indian Ocean from OND 2020 onwards, and there are only 3 months between October 2020 and December 2022 where no such westerly anomalies occur.
WWBs are short-duration synoptic-scale disturbances that occur near the equator and are found over the Indian and Pacific Oceans. Past studies suggested that WWB occurrences are random (Fedorov et al., 2003; Moore and Kleeman, 1999); however, more recent studies have shown that they are often associated with large-scale environmental conditions such as ENSO (Eisenman et al., 2005; Lengaigne et al., 2003, 2004; Roundy and Kiladis, 2006; Seiki and Takayabu, 2007). WWBs are defined following Seiki and Takayabu (2007) (see Sect. 2 Data and Methods), and the annual count and cumulative duration of WWBs for 1980–2022 are shown in Fig. 3a. 2021 witnessed a record number of five WWBs with a cumulative duration of ∼29 d, while 2022 witnessed three events with a cumulative duration of ∼23 d (third largest duration since the 1980s, Fig. 3a).
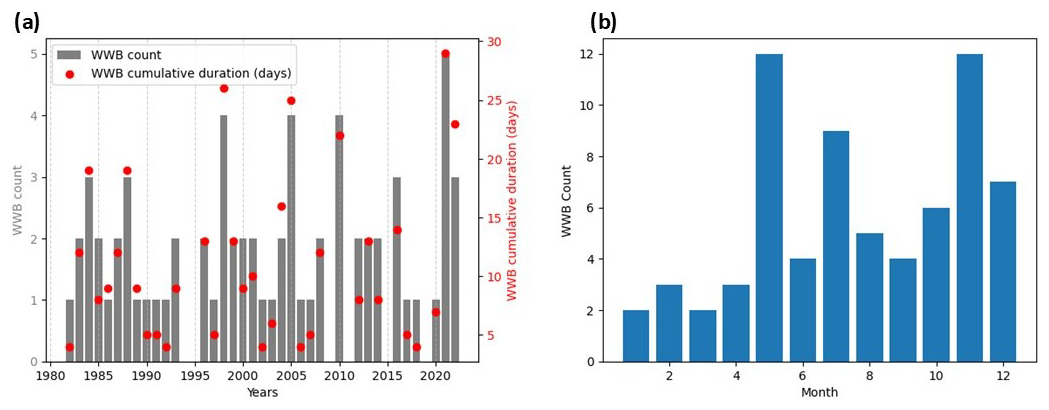
Figure 3(a) Number (bars) and cumulative duration (days, red markers) of WWBs. (b) Total WWB count by month for the years 1980–2022 to illustrate the seasonal cycle.
Boreal spring and fall are the transition seasons between the southwest and northeast monsoons. Strong westerly winds during these seasons drive strong eastward flow in the upper 80–100 m of the equatorial Indian Ocean and are referred to as the Wyrtki jets. They play an important role in heat and mass transfer in the Indian Ocean. McPhaden et al. (2015) demonstrated the role of WJs in IOD development. Recently, Xiao et al. (2024) have reported an association between easterly wind bursts and positive IOD events. Given the record number and duration of WWBs in the Indian Ocean during 2021–2022, the peculiar features of WJs are explored in the subsequent sections.

Figure 4The time-longitude sections of (a) 2° S–2° N averaged zonal currents in the upper ocean (0–100 m averaged) for 40–100° E along with the climatological currents (contours) obtained from OSCAR, (b) The D20 anomaly (m) from NCEP GODAS (shading), and the 11 d running mean of 10 m zonal wind anomaly (m s−1) averaged over 5° S–5° N (positive (negative) values are indicated by solid (dashed) contours and the contour interval is −4 to 4 by 2, zero contour is not shown), (c) the 0–200 m averaged weekly temperature anomaly from NCEP GODAS, (d) the observed Altimeter satellite gridded Sea Level Anomaly (SLA) level 4 data obtained from the Copernicus Marine Service website, and (e) 11 d running mean of zonal wind (shading) and zonal wind anomaly (contours).
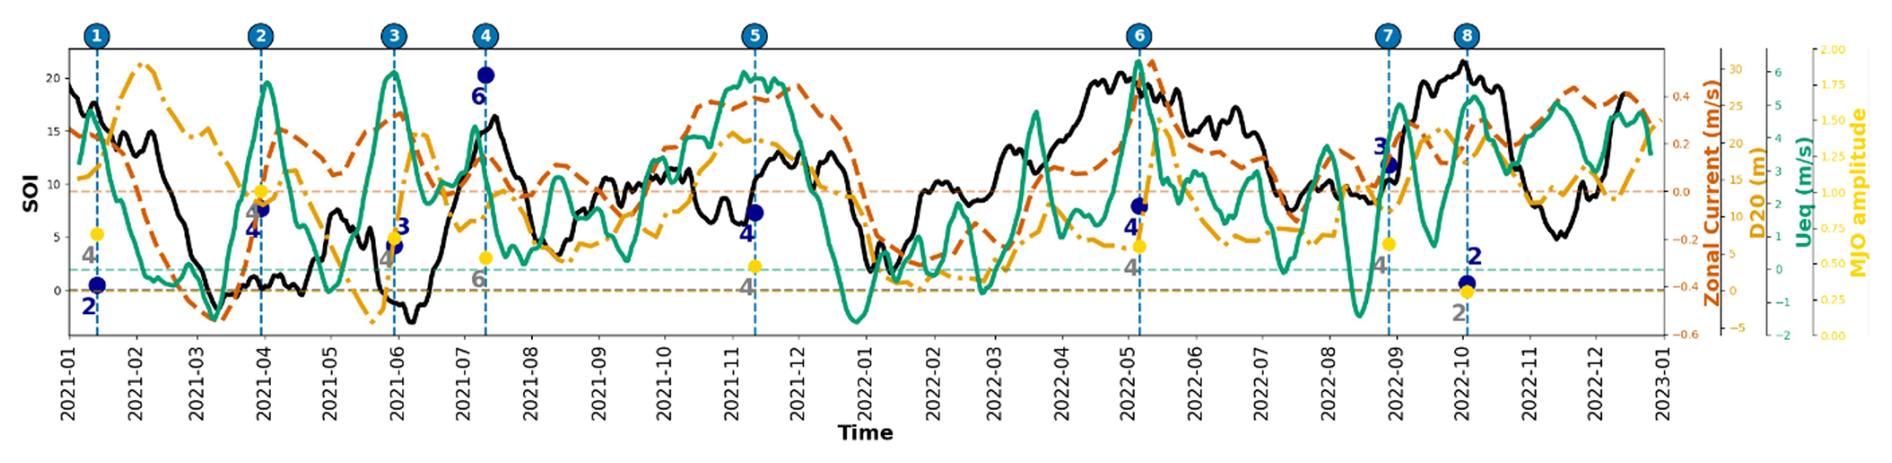
Figure 5The time evolution of 31 d running mean of daily SOI, equatorial zonal currents (OSCAR, 2° S–2° N, 40–100° E), GODAS D20 anomalies over the IOD east pole, and the 10 m zonal wind anomalies (5° S–5° N, 60–90° E). The vertical dotted lines in blue indicate the occurrences of WWBs, and the MJO (gray)/BSISO (blue) phases on the day of WWBs are indicated by markers.
The succeeding discussion is arranged around the event numbers as shown in Figs. 4 and 5.
-
Climatologically, the spring WJ is restricted to April–May, while the fall WJ lasts longer from mid-September to early-January. As mentioned earlier, January 2021 witnessed strong westerly wind activity in the equatorial TIO (Figs. 2 and 5). In response to this unusual occurrence of a WWB in January (marked as event 1 in Fig. 4, which has occurred only twice since 1980, Fig. 3b), the fall WJ strengthened in early January instead of decaying (Figs. 4a and 5). This unusual forcing was, in fact, so strong that it led to a positive D20 anomaly exceeding 40 m in the IOD east pole region (Figs. 4b, c and 5), a build-up of significant heat content in the upper ocean (Fig. 4c), and positive sea-level anomaly (SLA, Fig. 4d). This positive anomaly in the upper-ocean heat content lasted till the end of March 2021. A cyclonic circulation formed over peninsular India and Sri Lanka during 11–15 January 2021 and moved westwards. The rainfall stations in the peninsular Indian state of Tamil Nadu recorded extremely heavy to heavy rainfall associated with this system (India Meteorological Department, 2021). Under the influence of this cyclonic circulation, strong westerly wind anomalies set up to the south of this system, over the equatorial Indian Ocean (figure not shown), and ultimately led to the unusual occurrence of the WWB on 13 January 2021.
-
The spring of 2021 saw two WWBs separated by two months. The first occurred towards the end of March (event 2), and the other was close to monsoon onset over Kerala in June (event 3), initiating WJs (Figs. 4a and 5). In response to event 2, the anomalous D20 deepened slightly before witnessing a rapid shoaling towards the end of May 2021 (Figs. 4c and 5). The WJs usually peak around the Bay of Bengal monsoon onset date in early May (Li et al., 2022) and gradually decelerate thereafter.
-
Event 3 led to the extension of the WJ outside the usual period of April–May (Seiki and Takayabu, 2007; McPhaden et al., 2015), lasting till mid-June. It caused an eastward propagating, downwelling Kelvin wave, which caused rapid deepening of D20 (reaching a positive anomaly of ∼20 m) and an increase in SLA over the eastern TIO due to the strengthening of the WJ (Figs. 4b–d and 5). The transition of equatorial westerlies to cross-equatorial monsoon flow causes the WJ to dissipate. The progression of monsoon after the onset over Kerala on 3 June 2021 was sluggish due to the co-occurrence of cyclone Yaas on 26 May (close to the monsoon onset), and a delay in transition to cross-equatorial monsoon flow. This delay might have provided conducive conditions for the WJ to last till mid-June.
-
July 2021 witnessed another WWB (event 4), thus causing the zonal surface currents to be weakly eastward (∼0.2–0.4 m s−1) and a positive SLA. This WWB maintained the D20 anomaly around ∼14 m. During mid-August, another bout of anomalous zonal westerly winds was observed (with a magnitude of ∼2 m s−1). This event was not strong enough to qualify as a WWB but sustained the weak eastward current. The sequence of persistent zonal westerly wind anomalies starting in mid-May 2021 till the end of September played an important role in modifying the seasonality of the upper-ocean zonal currents such that they remained weakly eastward till late July, against the climatological transition to westward in mid-June. The associated mass transport caused the thermocline to uplift in the western TIO and deepen in the eastern TIO. The associated weakening of climatological south-easterlies along the Java-Sumatra coast during boreal summer reduced the evaporative cooling through the wind-evaporation-SST feedback (as indicated by latent heat flux anomaly, figure not shown) and suppressed upwelling (discussed in detail in Sect. 3.3) and maintained the positive SST anomaly. Thus, the negative IOD conditions were maintained during the boreal summer of 2021.
-
Starting in mid-September, an equatorial westerly wind anomaly was observed, which lasted till early December (Fig. 4b and e). The fall WJ initiated towards the end of September and peaked in mid-November (Fig. 4a, event 5). This led to the deepening of D20 in the eastern TIO (Figs. 4b, c, and 5), positive SLA (Fig. 4d), and nIOD conditions persisted till the end of 2021. The larger intra-seasonal variability in the anomalous westerly wind activity in boreal spring compared to boreal fall is worth noting. The boreal fall WJs usually subside towards the end of January next year, and weak westward flowing surface currents (with a climatological magnitude of ∼0.2 m s−1) are observed in the equatorial TIO during February–March.
The anomalous zonal westerly winds subsided in early December 2021 (Figs. 2, 4e, and 5), in response to which the fall WJ also weakened towards the end of December 2021 (Fig. 4). Thus, the positive D20 anomaly also started decreasing and remained close to zero during January–February 2022 (Figs. 4b, c, and 5). Two peaks in anomalous zonal westerly winds occurred during February–March 2022, with peak magnitudes in the range of 3–4 m s−1 (Figs. 2, 4b, and 5). These were not strong enough to qualify as WWB since the zonal extent was not basin-wide but restricted to the eastern TIO. However, they possibly weakened the westward-flowing zonal ocean current. The second peak initiated the eastward ocean current in mid-March 2022 and caused the deepening of the thermocline in the eastern TIO (by ∼10 m towards the end of March, Figs. 4b, c, and 5).
-
The current was strengthened by a WWB event occurring in early May and triggered a WJ (event 6). Intermittent bouts of anomalous zonal westerly winds in the TIO from May to December 2022 were observed, with peaks occurring in early May, early June, early July, early August, late August, early October, mid-November, and December (Fig. 5). Climatologically, during the summer monsoon months of JJA, the zonal current in the upper TIO is weak westward, and the current reverses from westward to eastward in mid-September (Fig. 4a). In response to the westerly zonal wind anomaly, which was initiated in late July and peaked in early August, the sign of the current reversed in early August (Fig. 5).
-
The two subsequent WWBs (late August and early October, events 7 and 8) initiated the fall WJ in early September, with peak surface currents in November 2022. Eastward zonal currents lasted about five months (August–December 2022) with large intra-seasonal fluctuations, thus maintaining the nIOD conditions.
The interplay between the persistent zonal westerly wind anomalies, WWBs, the WJs, and the associated deepening of the thermocline sustained the nIOD conditions starting in May 2021 and lasting till November 2022 – a record 19 months! The 2022 nIOD was stronger than the 2021 event, possibly because of three reasons – (1) the 2021 event pre-conditioned the TIO, (2) strong zonal westerly wind anomalies were observed during February–March 2022 with the associated weakening of the westward zonal current, and (3) The large intra-seasonal variability of zonal westerlies during summer and fall of 2022 which had a larger amplitude compared to those during 2021.
3.2 Impact of La Niña, BSISO, and MJO on the 2021–2022 nIOD
It is clear from the preceding discussion that the westerly wind forcing in the TIO played an important role in the sustenance of nIOD conditions during 2021–2022. It has been shown in previous studies that ENSO and IOD events have a strong tendency to co-occur, though they can evolve independently as well. Seiki and Takayabu (2007) noted that WWBs in the Indian Ocean occur in phase with La Niña events and rarely occur during El-Niño years. The prolonged La Niña conditions during 2020–2022 could have provided a conducive background state to the frequent WWB activity in the TIO. To explore this aspect, a scatter plot of the 31 d running mean of the Southern Oscillation Index (SOI) and the zonal wind speed averaged over 2.5° S–2.5° N, 60–90° E on the day of peak WWB activity is shown in Fig. 6. The 31 d running mean of daily SOI for the period 1991–2022 is considered for this purpose. The individual nIOD events (1996, 1998, 2005, 2010, 2016) and the 2021–2022 event are indicated. Also shown is the linear regression line. Sustained SOI value greater (lesser) than +7 (−7) indicates La Niña (El-Niño) conditions (Yu et al., 2021). Daily values of SOI reflect the day-to-day fluctuations of weather patterns but are not representative of the background ENSO state. Thus, we use a 31 d running mean of daily SOI values, such that the daily weather fluctuations are filtered out, but some elements of the intra-seasonal fluctuations of the Walker circulation are retained. Strong La Niña conditions modulate the zonal Walker circulation such that there is anomalous subsidence over the central and eastern Pacific while there is anomalous convection over the Maritime continents. This anomalous convection can strengthen the zonal westerly wind anomalies in the TIO. It is clear from Fig. 6 that not all WWB/westerlies are associated with La Niña. Many WWB events lie within the ±7 envelope, which might not be associated with La Niña forcing. However, a sizeable number of WWB events occur when SOI is greater than +7, and almost no WWB events occur when SOI is less than −7, which is associated with the El-Niño forcing. Five out of the eight WWBs during 2021–2022 occurred when the SOI was greater than +7. From Fig. 5, it is seen that some of the peaks of SOI match well with the peaks of westerly wind activity, for example, the peak during July 2021, May 2022, and October 2022. In other instances, the WWB activity occurred during the strengthening/mature phase of the SOI. Thus, we infer that the background state associated with the La Niña provided conducive conditions for triggering WWBs in the TIO. It is also interesting to note from Fig. 6 that the peak strength of the WWBs was likely not unusual compared to other years; it was the number and duration that were unusual compared to other years (Fig. 2c).
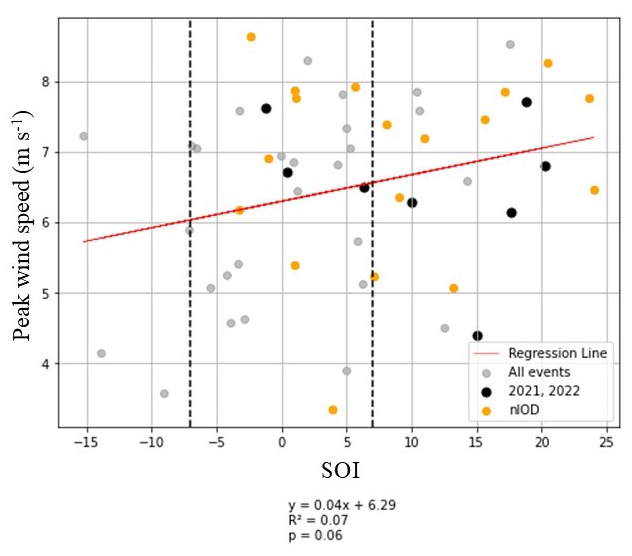
Figure 6Scatter plot of the 31 d running mean of the daily Southern Oscillation Index (SOI) for the period 1991–2022 with the peak zonal winds averaged over 2.5° S–2.5° N, 60–90° E associated with WWBs. The regression equation is indicated.
The large intra-seasonal variability in tropical convection can be attributed to the equatorial eastward propagating Madden-Julian Oscillation (MJO) and the northward propagating boreal summer intra-seasonal oscillation (BSISO) in the off-equatorial monsoon regimes. The interaction between IOD and BSISO/MJO is well known (Ajayamohan et al., 2009; Shinoda and Han, 2005). Out of the eight WWBs during 2021–2022, six events were associated with phase 4 of MJO (Fig. 5), when the convection is located over the eastern Indian Ocean. Three out of the four events occurring during boreal summer co-occurred with phases 3 or 4 of the BSISO (Fig. 5), during which convection is centered over the eastern TIO and western Pacific, respectively, and are associated with enhanced westerlies in the equatorial IO. Interestingly, these BSISO phases were supported by a peak (three events)/rapidly increasing values of SOI (two events), indicating a possible association between the ENSO state and the BSISO.
3.3 Anomalous sub-surface conditions
Figure 7 shows the monthly time series of standardized D20 anomalies averaged over the IOD east pole region from MOAA GPV data (2001–2022) and NCEP GODAS (1980–2022). A positive D20 anomaly indicates downwelling. Positive D20 anomalies dominate during 2021–2022 in both datasets. In fact, such a persistent downwelling episode has not been observed since the 1980s. The scatter plots of standardized D20 anomalies over the IOD east pole and the 10 m zonal equatorial wind anomaly for each season are shown in Fig. 8. The individual nIOD events and pIOD events are also indicated. The standardized D20 anomaly remained greater than +0.5 (often greater than or equal to +1) for all the seasons during 2021 and 2022, except for December–February (DJF) 2022. The associated anomalous zonal wind forcing was also very strong (often greater than +1 standard deviation). The positive D20 and surface zonal wind anomalies during DJF and March–May (MAM) seasons during 2021 and 2022 are unlike other nIOD events, where such positive anomalies are seen only during June–August (JJA) and SON. The persistent westerly wind anomalies and the WJs prevailed and conditioned the Indian Ocean to an nIOD state by suppressing the upwelling along the Java-Sumatra coast (Schott et al., 2009).
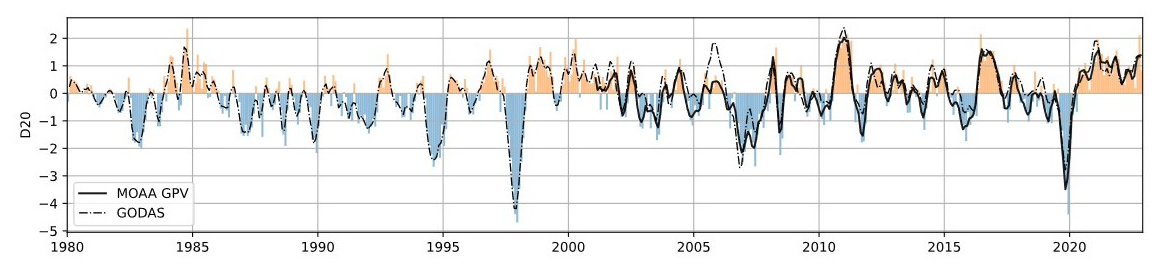
Figure 7The evolution of the 3 month running mean of the standardized anomalies of the depth of the 20 °C isotherm (D20) over the IOD east pole region from NCEP GODAS (dashed lines; 1980–2022), and MOAA GPV data (solid lines; 2001–2022). The bars indicate the monthly anomalies for the NCEP GODAS dataset.
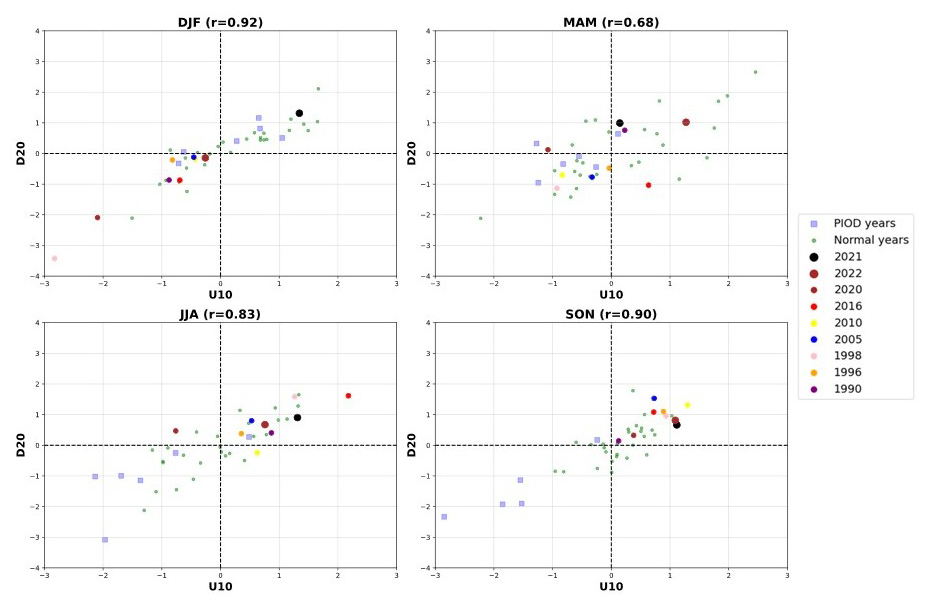
Figure 8Scatter plot of the standardized anomalies of 10 m zonal winds over the equator (U10; averaged over 5° S–5° N, 60–90° E) and D20 anomalies over the IOD east pole region for different seasons. The correlation (r) between the time series is indicated in brackets.
The absence of climatological upwelling in the eastern equatorial TIO is due to the lack of steady climatological easterlies. The climatological south-easterlies from April to October off the Java-Sumatra coast favour coastal upwelling and can trigger a pIOD event. During nIOD events, this upwelling is suppressed. Positive D20 anomalies indicate the suppression of upwelling in the IOD east pole region starting in late 2020 and lasting till the end of 2022 (Figs. 7 and 8). The coupling between SST and D20 in the IOD east pole is positive only during the boreal summer (r=0.59) and fall seasons (r=0.68), as indicated by the scatter plots of SST and D20 in Fig. 9. The large sub-surface heat content during DJF and MAM 2021 was not reflected in the SST due to the negative coupling between SST and D20 (Fig. 9). During JJA 2021, when the SST-D20 coupling is positive, positive SST anomalies emerged in the IOD east pole and were maintained during SON 2021. Positive D20 anomalies (greater than +1 standard deviation) again emerged during MAM 2022 with weakly positive SST anomalies. These positive SST anomalies peaked in JJA 2022, coinciding with the DMI peak, and diminished during SON 2022.
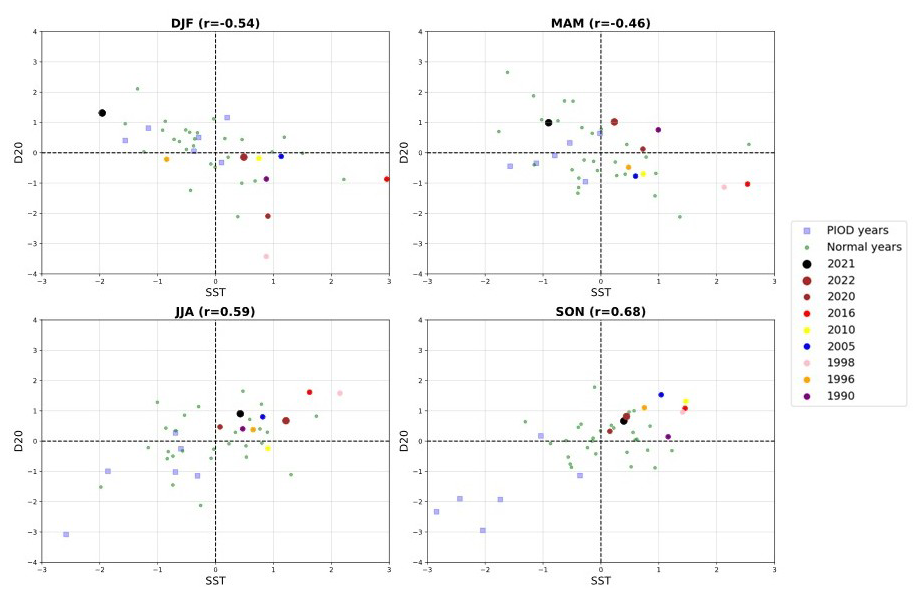
Figure 9Scatter plot of the standardized anomalies of SST and D20 anomalies over the IOD east pole region for different seasons. The correlation (r) between the time series is indicated in brackets.
3.4 Impact on Indian Summer Monsoon
The June–September (JJAS) mean Walker and Hadley circulation derived from ERA5 for 2021 and 2022 is shown in Fig. 10. The La Niña conditions during JJAS 2021 were weak, with the monthly Niño 3.4 index remaining less than −0.5 standard deviation. Therefore, the associated ascending branch of the Walker cell was restricted to the warm pool region longitudes (∼120–180° E, Fig. 10a). Weak nIOD conditions in the TIO forced anomalous ascending motion over the IOD east pole region in the regional Hadley circulation and caused subsidence over northern Indian latitudes (Fig. 10c). The combined influence of weak La Niña and nIOD during JJAS 2021 prevented above normal monsoon rainfall over India (JJAS rainfall being ∼99 % of LPA). Strong La Niña conditions were present during the summer of 2022. It caused large-scale modulation of the Walker circulation such that strong ascending motion is noted over Indian longitudes (60–90° E, Fig. 10c). Strong nIOD conditions modulated the regional Hadley circulations and caused ascending motion over the IOD east pole with subsidence over Indian latitudes. Thus, nIOD conditions suppressed the influence of strong La Niña present during JJAS 2022, and the resultant rainfall over India during JJAS was restricted to ∼106 % of LPA.
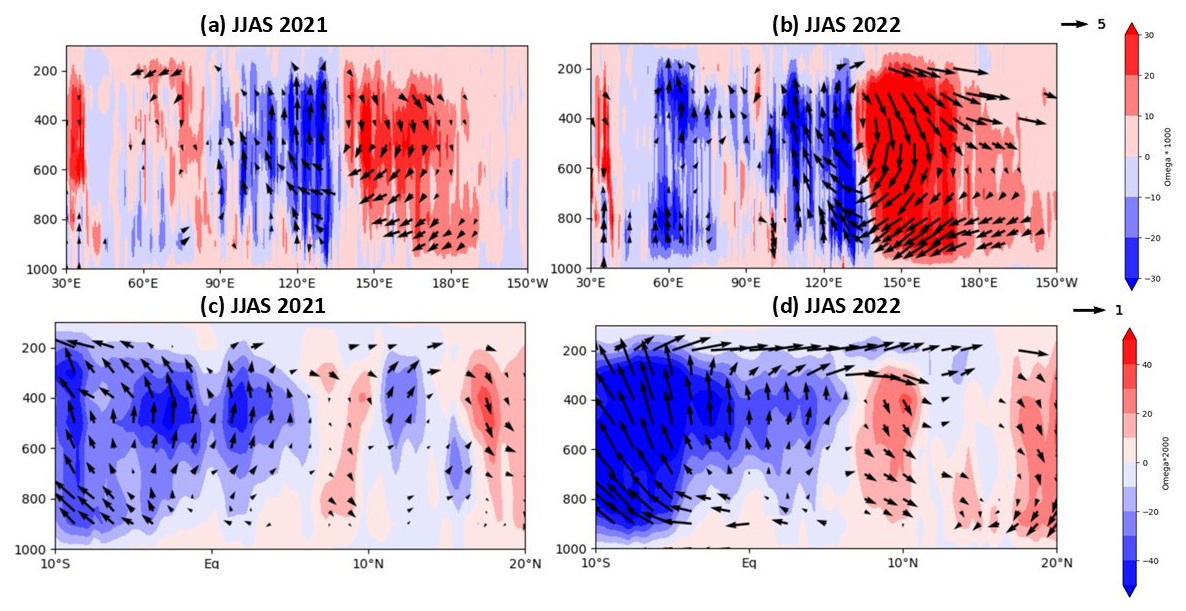
Figure 10The height-longitude section of the anomalous JJAS mean Walker circulation (averaged over 1° S–1° N) for (a) 2021 and (b) 2022, and the height-latitude section of the anomalous JJAS mean Hadley circulation (averaged over 90–110° E) for (c) 2021 and (d) 2022. The vertical velocity (Omega) is scaled by 1000 and 2000 in (a, b) and (c, d), respectively, to elucidate the vertical motion. Vector magnitudes less than 10 and 5 are masked out in (a, b) and (c, d), respectively. The units are m s−1 for the zonal component and Pa s−1 for the vertical velocity.
The nIOD event of 2022 was one of the strongest events in the observational record. The event was unique in several aspects. The DMI was negative since May 2021 and remained negative until the end of 2022, making it the first ever multi-year nIOD event on record since the 1960s. It co-occurred with the triple-dip La Niña of 2020–2022. 2021–2022 witnessed a record number of WWBs in the TIO, with the largest cumulative duration. Despite a persistent La Niña forcing in the tropical Pacific, the Indian Summer Monsoon rainfall during 2021–2022 did not witness a large excess. Did the multi-year nIOD event have a compensating impact on the ISMR? Motivated by this question, we explore the dynamics behind the first-ever multi-year nIOD event ever recorded. The major findings are summarized below:
-
2021–2022 witnessed large intra-seasonal fluctuations in the 10 m equatorial zonal wind anomalies, with the anomalies mainly remaining westerly from May 2021 to November 2022. Such persistent zonal westerly wind anomalies are not seen to be associated with other nIOD events.
-
2021 witnessed the largest WWB activity in the TIO. Most unusual was the WWB occurrence in January 2021 which was associated with a cyclonic circulation over peninsular India and Sri Lanka and extreme rainfall, which led to a build-up of a large positive heat content anomaly in the eastern TIO. The WWBs during the boreal spring of 2021 initiated the positive D20 anomaly over the eastern IO. The WWB during July 2021 and the subsequent anomalous westerly winds maintained a weak eastward equatorial zonal current during the summer of 2021. This maintained the positive D20 anomaly in the eastern IO, which strengthened during the fall of 2021.
-
Strong and unusual anomalous westerly winds over TIO during February–March 2022 weakened the climatological westward current and initiated a spring WJ during mid-March 2022. This jet peaked in May 2022 in response to a WWB, and the eastward zonal current lasted till June. These sequences of events deepened D20 in the eastern TIO during MAM 2022. Two large-amplitude anomalous westerly wind events during August and September initiated weak eastward zonal currents, which were strengthened in the fall on account of the WJ dynamics. Thus, the nIOD event was maintained till the end of the year.
-
WWBs played an important role in sustaining the multi-year nIOD event. La Niña forcing played an important role in maintaining conducive conditions for WWBs. Out of the eight WWB events during 2021–2022, five occurred when SOI was greater than +10, suggesting the possible role of La Niña forcing. Some of the peaks in SOI match well with the peaks of anomalous westerly wind activity, while in other instances, the WWB activity occurred during the strengthening/mature phase of the SOI. A more quantitative assessment of the impact of La Niña on WWBs requires further investigation.
-
Six out of the eight WWB events during 2021–2022 co-occurred with phase 4 of the MJO, and three out of the four events occurring during boreal summer co-occurred with phase 3 or 4 of the BSISO. These MJO/BSISO phases aid zonal westerly wind anomalies in the TIO, as the convection is located over the eastern Indian Ocean.
-
The co-existence of La Niña and nIOD conditions had a compensating impact on the Indian monsoon. Weak La-Niña and nIOD conditions caused a near-normal monsoon rainfall during 2021. During 2022, when La Niña was much stronger, the strong nIOD conditions induced anomalous subsidence over the Indian landmass by modulating the regional Hadley circulation. This prevented the ISMR from being in large excess.
To conclude, the sustenance of the multi-year nIOD event was the outcome of various factors that co-existed and complemented each other. Most importantly, the triple-dip La Niña provided a conducive background state in the Indian Ocean for nIOD to develop. The La Niña modulated Walker circulation, thus providing favourable conditions for WWBs in the TIO. WWBs and equatorial zonal westerly wind anomalies were also aided by the MJO/BSISO. Anomalous convection in the eastern TIO during February–March 2022 caused strong anomalous zonal westerly winds in the TIO, leading to the early initiation of Wyrtki jets and not allowing the positive D20 anomaly in the eastern TIO to subside. It, therefore, acted as a bridge between the weak 2021 nIOD event and the strong 2022 nIOD. The pre-conditioning of TIO during 2021 by WWBs and La Niña was therefore important for the development of the 2022 nIOD event. The projected increase in the frequency of La Niña events (Geng et al., 2023; Wang et al., 2023) poses a challenge to the life, livelihood, and economy of India, as La Niñas tend to result in floods and damage to agriculture. The compensating effect of multi-year nIOD events can reduce the risks associated with such La Niñas. Multi-year nIOD events can, however, suppress or enhance rainfall elsewhere, thereby translating the threat of compound extremes to other geographical locations.
The data used in this study can be downloaded from the following websites:
-
ERSST (https://psl.noaa.gov/data/gridded/data.noaa.ersst.v5.html, last access: 30 August 2024)
-
OISST (https://psl.noaa.gov/data/gridded/data.noaa.oisst.v2.html, last access: 30 August 2024)
-
HadISST (https://www.metoffice.gov.uk/hadobs/hadisst/, last access: 30 August 2024)
-
SOI (https://data.longpaddock.qld.gov.au/
SeasonalClimateOutlook/SouthernOscillationIndex/ SOIDataFiles/LatestSOI1887-1989Base.txt,
last access: 17 July 2024) -
MJO phase and amplitude (https://iprc.soest.hawaii.edu/users/kazuyosh/ISO_index/data/MJO_25-90bpfil.rt_pc.txt, last access: 2 September 2024)
-
BSISO phase and amplitude (https://iprc.soest.hawaii.edu/users/kazuyosh/ISO_index/data/BSISO_25-90bpfil.rt_pc.txt, last access: 2 September 2024)
-
ERA5 reanalysis (https://www.ecmwf.int/en/forecasts/dataset/ecmwf-reanalysis-v5, last access: 6 June 2024)
-
NCEP GODAS (https://psl.noaa.gov/data/gridded/data.godas.html, last access: 10 June 2024)
-
MOAA GPV (https://www.jamstec.go.jp/argo_research/dataset/moaagpv/moaa_en.html, last access: 10 June 2024)
-
SLA data from the Copernicus Marine Service website (http://climate.copernicus.eu, last access: 6 June 2024)
-
OSCAR (https://podaac.jpl.nasa.gov/dataset/OSCAR_L4_OC_third-deg, last access: 15 July 2024)
-
The relative Niño 3.4 index (https://www.cpc.ncep.noaa.gov/data/indices/, last access: 7 August 2025).
The scripts used to produce the analyses and figures in this study are available on request from the authors.
The supplement related to this article is available online at https://doi.org/10.5194/wcd-7-1-2026-supplement.
AS performed the analysis, figures, and wrote the initial draft of the manuscript. SAR conceived the original motivation for the study, and GMM, MP, and SI contributed to the design of the study and the analyses. All authors contributed to the understanding and interpretation of the analyses, and to the final manuscript draft.
The contact author has declared that none of the authors has any competing interests.
Publisher's note: Copernicus Publications remains neutral with regard to jurisdictional claims made in the text, published maps, institutional affiliations, or any other geographical representation in this paper. While Copernicus Publications makes every effort to include appropriate place names, the final responsibility lies with the authors. Views expressed in the text are those of the authors and do not necessarily reflect the views of the publisher.
Gill M. Martin and Sarah Ineson were funded by the Met Office Weather and Climate Science for Service Partnership (WCSSP) India project, which is supported by the UK Department for Science, Innovation and Technology (DSIT). WCSSP India is a collaborative initiative between the Met Office and the Indian Ministry of Earth Sciences (MoES). Ankur Srivastava, Maheswar Pradhan, and Suryachandra A. Rao are supported by the Indian Institute of Tropical Meteorology (IITM), and IITM is fully funded by the Ministry of Earth Sciences, Government of India.
This work has been supported by the UK Department for Science, Innovation and Technology (DSIT) (Met Office Weather and Climate Science for Service Partnership (WCSSP) India project).
This paper was edited by Yen-Ting Hwang and reviewed by two anonymous referees.
Ajayamohan, R. S. and Rao, S. A.: Indian Ocean Dipole Modulates the Number of Extreme Rainfall Events over India in a Warming Environment, J. Meteorol. Soc. Jpn., 86, 245–252, https://doi.org/10.2151/jmsj.86.245, 2008.
Ajayamohan, R. S., Rao, S. A., and Yamagata, T.: Influence of Indian Ocean Dipole on Poleward Propagation of Boreal Summer Intraseasonal Oscillations, J. Climate, 21, 5437–5454, https://doi.org/10.1175/2008JCLI1758.1, 2008.
Ajayamohan, R. S., Rao, S. A., Luo, J., and Yamagata, T.: Influence of Indian Ocean Dipole on boreal summer intraseasonal oscillations in a coupled general circulation model, J. Geophys. Res., 114, D06119, https://doi.org/10.1029/2008JD011096, 2009.
Annamalai, H., Xie, S. P., McCreary, J. P., and Murtugudde, R.: Impact of Indian Ocean Sea surface temperature on developing El Niño, J. Climate, 18, https://doi.org/10.1175/JCLI-3268.1, 2005.
Ashok, K., Guan, Z., and Yamagata, T.: Impact of the Indian Ocean Dipole on the Relationship between the Indian Monsoon Rainfall and ENSO, Geophys. Res. Lett., 28, 4499–4502, https://doi.org/10.1029/2001GL013294, 2001.
Ashok, K., Guan, Z., Saji, N. H., and Yamagata, T.: Individual and combined influences of ENSO and the Indian Ocean Dipole on the Indian summer monsoon, J. Climate, 17, 3141–3155, https://doi.org/10.1175/1520-0442(2004)017<3141:IACIOE>2.0.CO;2, 2004.
Bazo, J., Lorenzo, M. D. L. N., and Porfirio Da Rocha, R.: Relationship between monthly rainfall in NW peru and tropical sea surface temperature, Adv. Meteorol., 2013, 152875, https://doi.org/10.1155/2013/152875, 2013.
Behera, S. K., Luo, J. J., Masson, S., Rao, S. A., Sakuma, H., Yamagata, T., Behera, S. K., Luo, J. J., Masson, S., Rao, S. A., Sakuma, H., and Yamagata, T.: A CGCM Study on the Interaction between IOD and ENSO, J. Climate, 19, 1688–1705, https://doi.org/10.1175/JCLI3797.1, 2006.
Behringer, D. W., Ji, M., and Leetmaa, A.: An improved coupled model for ENSO prediction and implications for ocean initialization. Part I: The ocean data assimilation system, Mon. Weather Rev., 126, https://doi.org/10.1175/1520-0493(1998)126<1013:AICMFE>2.0.CO;2, 1998.
Black, E., Slingo, J., and Sperber, K. R.: An observational study of the relationship between excessively strong short rains in coastal East Africa and Indian ocean SST, Mon. Weather Rev., 131, https://doi.org/10.1175/1520-0493(2003)131<0074:AOSOTR>2.0.CO;2, 2003.
Cai, W., Cowan, T., and Sullivan, A.: Recent unprecedented skewness towards positive Indian Ocean Dipole occurrences and its impact on Australian rainfall, Geophys. Res. Lett., 36, https://doi.org/10.1029/2009GL037604, 2009.
Cai, W., Santoso, A., Wang, G., Weller, E., Wu, L., Ashok, K., Masumoto, Y., and Yamagata, T.: Increased frequency of extreme Indian Ocean Dipole events due to greenhouse warming, Nature, 510, 254–8, https://doi.org/10.1038/nature13327, 2014.
Chan, S. C., Behera, S. K., and Yamagata, T.: Indian Ocean Dipole influence on South American rainfall, Geophys. Res. Lett., 35, https://doi.org/10.1029/2008GL034204, 2008.
Cherchi, A. and Navarra, A.: Influence of ENSO and of the Indian Ocean Dipole on the Indian summer monsoon variability, Clim. Dynam., 41, https://doi.org/10.1007/s00382-012-1602-y, 2013.
Cherchi, A., Gualdi, S., Behera, S., Luo, J. J., Masson, S., Yamagata, T., and Navarra, A.: The influence of tropical Indian Ocean SST on the Indian summer monsoon, J. Climate, https://doi.org/10.1175/JCLI4161.1, 2007.
CMEMS: Global Ocean Gridded L 4 Sea Surface Heights And Derived Variables Reprocessed 1993 Ongoing, Marine Data Store (MDS) [data set], https://doi.org/10.48670/moi-00148, 2024.
Copernicus Climate Change Service: ERA5 hourly data on single levels from 1940 to present, Copernicus Climate Change Service (C3S) Climate Data Store (CDS) [data set], https://doi.org/10.24381/cds.adbb2d47, 2023a.
Copernicus Climate Change Service: ERA5 hourly data on pressure levels from 1940 to present, Copernicus Climate Change Service (C3S) Climate Data Store (CDS) [data set], https://doi.org/10.24381/cds.bd0915c6, 2023b.
Eisenman, I., Yu, L., and Tziperman, E.: Westerly wind bursts: ENSO's tail rather than the dog?, J. Climate, 18, https://doi.org/10.1175/JCLI3588.1, 2005.
Endris, H. S., Lennard, C., Hewitson, B., Dosio, A., Nikulin, G., and Artan, G. A.: Future changes in rainfall associated with ENSO, IOD and changes in the mean state over Eastern Africa, Clim. Dynam., 52, https://doi.org/10.1007/s00382-018-4239-7, 2019.
ESR: OSCAR third deg, Ver. 1, PO.DAAC [data set], CA, USA, https://doi.org/10.5067/OSCAR-03D01, 2009.
Fedorov, A. V., Harper, S. L., Philander, S. G., Winter, B., and Wittenberg, A.: How predictable is El Niño?, B. Am Meteorol. Soc., 84, https://doi.org/10.1175/BAMS-84-7-911, 2003.
Geng, T., Jia, F., Cai, W., Wu, L., Gan, B., Jing, Z., Li, S., and McPhaden, M. J.: Increased occurrences of consecutive La Niña events under global warming, Nature, 619, https://doi.org/10.1038/s41586-023-06236-9, 2023.
Hendon, H. H.: Indonesian rainfall variability: Impacts of ENSO and local air-sea interaction, J. Climate, 16, https://doi.org/10.1175/1520-0442(2003)016<1775:IRVIOE>2.0.CO;2, 2003.
Hendon, H. H., Lim, E. P., and Liu, G.: The role of air-sea interaction for prediction of Australian summer monsoon rainfall, J. Climate, 25, https://doi.org/10.1175/JCLI-D-11-00125.1, 2012.
Hosoda, S., Ohira, T., and Nakamura, T.: A monthly mean dataset of global oceanic temperature and salinity derived from Argo float observations, JAMSTEC Report of Research and Development, 8, https://doi.org/10.5918/jamstecr.8.47, 2008.
Huang, B., Thorne, P. W., Banzon, V. F., Boyer, T., Chepurin, G., Lawrimore, J. H., Menne, M. J., Smith, T. M., Vose, R. S., and Zhang, H. M.: Extended reconstructed Sea surface temperature, Version 5 (ERSSTv5): Upgrades, validations, and intercomparisons, J. Climate, 30, 8179–8205, https://doi.org/10.1175/JCLI-D-16-0836.1, 2017.
Huang, B., Liu, C., Banzon, V., Freeman, E., Graham, G., Hankins, B., Smith, T., and Zhang, H. M.: Improvements of the Daily Optimum Interpolation Sea Surface Temperature (DOISST) Version 2.1, J. Climate, 34, https://doi.org/10.1175/JCLI-D-20-0166.1, 2021.
India Meteorological Department: Brief Report on Extremely Heavy Rainfall Events over Tamil Nadu (1–15 Jan 2021), 32 pp., https://internal.imd.gov.in/severewx/20210211_severe_1.pdf (last access: 2 January 2026), 2021.
Kikuchi, K.: Extension of the bimodal intraseasonal oscillation index using JRA-55 reanalysis, Clim. Dynam., 54, https://doi.org/10.1007/s00382-019-05037-z, 2020.
Kikuchi, K., Wang, B., and Kajikawa, Y.: Bimodal representation of the tropical intraseasonal oscillation, Clim. Dynam., 38, https://doi.org/10.1007/s00382-011-1159-1, 2012.
Krishnan, R., Ayantika, D. C., Kumar, V., and Pokhrel, S.: The long-lived monsoon depressions of 2006 and their linkage with the Indian Ocean Dipole, Int. J. Climatol., 31, 1334–1352, https://doi.org/10.1002/joc.2156, 2011.
Lengaigne, M., Boulanger, J. P., Menkes, C., Madec, G., Delecluse, P., Guilyardi, E., and Slingo, J.: The March 1997 Westerly Wind Event and the onset of the 1997/98 El Niño: Understanding the role of the atmospheric response, J. Climate, 16, https://doi.org/10.1175/1520-0442(2003)016<3330:TMWWEA>2.0.CO;2, 2003.
Lengaigne, M., Guilyardi, E., Boulanger, J. P., Menkes, C., Delecluse, P., Inness, P., Cole, J., and Slingo, J.: Triggering of El Niño by westerly wind events in a coupled general circulation model, Clim. Dynam., 23, https://doi.org/10.1007/s00382-004-0457-2, 2004.
L'Heureux, M. L., Tippett, M. K., Wheeler, M. C., Nguyen, H., Narsey, S., Johnson, N., Hu, Z. Z., Watkins, A. B., Lucas, C., Ganter, C., Becker, E., Wang, W., and Di Liberto, T.: A Relative Sea Surface Temperature Index for Classifying ENSO Events in a Changing Climate, J. Climate, 37, https://doi.org/10.1175/JCLI-D-23-0406.1, 2024.
Li, K., Yin, Y., Yang, Y., Liu, Y., and Yu, W.: Dynamic Response of the Spring Wyrtki Jet to the Monsoon Onset Over the Bay of Bengal, Geophys. Res. Lett., 49, https://doi.org/10.1029/2022GL101435, 2022.
Lu, B., Ren, H. L., Scaife, A. A., Wu, J., Dunstone, N., Smith, D., Wan, J., Eade, R., MacLachlan, C., and Gordon, M.: An extreme negative Indian Ocean Dipole event in 2016: dynamics and predictability, Clim. Dynam., 51, https://doi.org/10.1007/s00382-017-3908-2, 2018.
Luo, J. J., Zhang, R., Behera, S. K., Masumoto, Y., Jin, F. F., Lukas, R., and Yamagata, T.: Interaction between El Niño and extreme Indian Ocean dipole, J. Climate, 23, https://doi.org/10.1175/2009JCLI3104.1, 2010.
Manatsa, D. and Behera, S. K.: On the major shifts in the IOD during the last century, the role of the Mascarene High displacements, Int. J. Climatol., 34, https://doi.org/10.1002/joc.3820, 2014.
McPhaden, M. J.: Genesis and evolution of the 1997–98 El Niño, Science, 283, 950–954, https://doi.org/10.1126/science.283.5404.950, 1999.
McPhaden, M. J., Wang, Y., and Ravichandran, M.: Volume transports of the Wyrtki jets and their relationship to the Indian Ocean Dipole, J. Geophys. Res.-Oceans, 120, https://doi.org/10.1002/2015JC010901, 2015.
Moore, A. M. and Kleeman, R.: Stochastic forcing of ENSO by the intraseasonal oscillation, J. Climate, 12, https://doi.org/10.1175/1520-0442(1999)012<1199:SFOEBT>2.0.CO;2, 1999.
Murtugudde, R., McCreary, J. P., and Busalacchi, A. J.: Oceanic processes associated with anomalous events in the Indian Ocean with relevance to 1997–1998, J. Geophys. Res., 105, 3295–3306, https://doi.org/10.1029/1999jc900294, 2000.
Nur'utami, M. N. and Hidayat, R.: Influences of IOD and ENSO to Indonesian Rainfall Variability: Role of Atmosphere-ocean Interaction in the Indo-pacific Sector, Procedia Environ. Sci., 33, https://doi.org/10.1016/j.proenv.2016.03.070, 2016.
Qiu, Y., Cai, W., Guo, X., and Ng, B.: The asymmetric influence of the positive and negative IOD events on China's rainfall, Sci. Rep., 4, https://doi.org/10.1038/srep04943, 2014.
Rao, S. A. and Yamagata, T.: Abrupt termination of Indian Ocean dipole events in response to intraseasonal disturbances, Geophys. Res. Lett., 31, https://doi.org/10.1029/2004GL020842, 2004.
Rao, S. A., Luo, J.-J., Behera, S. K., and Yamagata, T.: Generation and termination of Indian Ocean dipole events in 2003, 2006 and 2007, Clim. Dynam., 33, 751–767, https://doi.org/10.1007/s00382-008-0498-z, 2009.
Rasmusson, E. M., Carpenter, T. H., Rasmusson, E. M., and Carpenter, T. H.: The Relationship Between Eastern Equatorial Pacific Sea Surface Temperatures and Rainfall over India and Sri Lanka, Mon. Weather Rev., 111, 517–528, https://doi.org/10.1175/1520-0493(1983)111<0517:TRBEEP>2.0.CO;2, 1983.
Ratna, S., Musale, M., Sharma, T., Sabeerali, C. T., Rohini, P., Bandgar, A., Sreejith, O. P., and Hosalikar, K. S.: Triple-dip La Niña (2020–2022) and its impact on Indian Summer Monsoon Rainfall: Insight from the Monsoon Mission Coupled Forecasting System, MAUSAM, 75, 759–768, https://doi.org/10.54302/mausam.v75i3.6283, 2024.
Ratna, S. B., Cherchi, A., Osborn, T. J., Joshi, M., and Uppara, U.: The Extreme Positive Indian Ocean Dipole of 2019 and Associated Indian Summer Monsoon Rainfall Response, Geophys. Res. Lett., 48, https://doi.org/10.1029/2020GL091497, 2021.
Rayner, N. A., Parker, D. E., Horton, E. B., Folland, C. K., Alexander, L. V., Rowell, D. P., Kent, E. C., and Kaplan, A.: Global analyses of sea surface temperature, sea ice, and night marine air temperature since the late nineteenth century, J. Geophys. Res.-Atmos., 108, 4407, https://doi.org/10.1029/2002jd002670, 2003.
Reverdin, G.: The Upper Equatorial Indian Ocean. The Climatological Seasonal Cycle, J. Phys. Oceanogr., 17, 903–927, https://doi.org/10.1175/1520-0485(1987)017<0903:tueiot>2.0.co;2, 1987.
Roundy, P. E. and Kiladis, G. N.: Observed relationships between oceanic Kelvin waves and atmospheric forcing, J. Climate, 19, https://doi.org/10.1175/JCLI3893.1, 2006.
Saji, N. H. and Yamagata, T.: Possible impacts of Indian Ocean Dipole mode events on global climate, Clim. Res., 25, 151–169, https://doi.org/10.3354/cr025151, 2003.
Saji, N. H., Goswami, B. N., Vinayachandran, P. N., and Yamagata, T.: A dipole mode in the tropical Indian Ocean, Nature, 401, 360–363, https://doi.org/10.1038/43854, 1999.
Schott, F. A., Xie, S. P., and McCreary, J. P.: Indian ocean circulation and climate variability, Rev. Geophys., 47, RG1002, https://doi.org/10.1029/2007RG000245, 2009.
Seiki, A. and Takayabu, Y. N.: Westerly wind burst and their relationship with intraseasonal variations and ENSO. Part I: Statistics, Mon. Weather Rev., 135, https://doi.org/10.1175/MWR3477.1, 2007.
Sharma, T., Ratna, S. B., Pai, D. S., Bandgar, A., Rajeevan, M., Mohapatra, M., Sreejith, O. P., and Hosalikar, K. S.: Indian summer monsoon rainfall response to two distinct evolutions of La Niña events, Int. J. Climatol., 44, 4405–4427, https://doi.org/10.1002/joc.8588, 2024.
Shinoda, T. and Han, W.: Influence of the Indian Ocean dipole on atmospheric subseasonal variability, J. Climate, 18, https://doi.org/10.1175/JCLI3510.1, 2005.
Sikka, D. R. and Gadgil, S.: On the Maximum Cloud Zone and the ITCZ over Indian, Longitudes during the Southwest Monsoon, Mon. Weather Rev., 108, 1840–1853, https://doi.org/10.1175/1520-0493(1980)108<1840:OTMCZA>2.0.CO;2, 1980.
Van Oldenborgh, G. J., Hendon, H., Stockdale, T., L'Heureux, M., Coughlan De Perez, E., Singh, R., and Van Aalst, M.: Defining El Nio indices in a warming climate, Environ. Res. Lett., 16, https://doi.org/10.1088/1748-9326/abe9ed, 2021.
Vinayachandran, P. N., Saji, N. H., and Yamagata, T.: Response of the Equatorial Indian Ocean to an unusual wind event during 1994, Geophys. Res. Lett., 26, https://doi.org/10.1029/1999GL900179, 1999.
Vinayachandran, P. N., Kurian, J., and Neema, C. P.: Indian Ocean response to anomalous conditions in 2006, Geophys. Res. Lett., 34, https://doi.org/10.1029/2007GL030194, 2007.
3Wang, B., Sun, W., Jin, C., Luo, X., Yang, Y. M., Li, T., Xiang, B., McPhaden, M. J., Cane, M. A., Jin, F., Liu, F., and Liu, J.: Understanding the recent increase in multiyear La Niñas, Nat. Clim. Change, 13, https://doi.org/10.1038/s41558-023-01801-6, 2023.
Wyrtki, K.: An equatorial jet in the Indian Ocean, Science, 181, https://doi.org/10.1126/science.181.4096.262, 1973.
Xiao, H. M., Lo, M. H., and Yu, J. Y.: The increased frequency of combined El Niño and positive IOD events since 1965s and its impacts on maritime continent hydroclimates, Sci. Rep., 12, https://doi.org/10.1038/s41598-022-11663-1, 2022.
Xiao, Y., Tan, X., and Tang, Y.: Definition of springtime easterly wind bursts in the Indian Ocean and their roles in triggering positive IOD events, Environ. Res. Commun., 6, https://doi.org/10.1088/2515-7620/ad32db, 2024.
Yang, Y., Xie, S. P., Wu, L., Kosaka, Y., Lau, N. C., and Vecchi, G. A.: Seasonality and predictability of the Indian Ocean dipole mode: ENSO forcing and internal variability, J. Climate, 28, https://doi.org/10.1175/JCLI-D-15-0078.1, 2015.
Yu, N., Liu, H., Chen, G., Chen, W., Ray, J., Wen, H., and Chao, N.: Analysis of Relationships Between ENSO Events and Atmospheric Angular Momentum Variations, Earth Space Sci., 8, https://doi.org/10.1029/2021EA002030, 2021.
Zubair, L., Rao, S. A., and Yamagata, T.: Modulation of Sri Lankan Maha rainfall by the Indian Ocean Dipole, Geophys. Res. Lett., 30, https://doi.org/10.1029/2002GL015639, 2003.