the Creative Commons Attribution 4.0 License.
the Creative Commons Attribution 4.0 License.
 | 17 Jun 2026
Physical processes leading to extreme day-to-day temperature change – Part 2: Future climate change
Kalpana Hamal
Stephan Pfahl
Extreme temperature swings from one day to the next, whether warming or cooling, can significantly impact human health, ecosystems, and the economy. These effects may become more pronounced or attenuated in the future. Part 1 of this research identified the physical processes – advection, as well as adiabatic and diabatic temperature changes – that cause extreme day-to-day temperature (DTDT) fluctuations in the present climate. Extreme DTDT variations are projected to change under future warming; however, how and which processes drive these changes remain poorly understood. This study addresses this question globally by analysing physical processes in Community Earth System Model Large Ensemble (CESM–LE) simulations under a high–emission scenario, employing both Eulerian composite and Lagrangian backwards–trajectory analyses. The projected changes in (extreme) DTDT variations display a seasonal contrast: weakening in mid- to high latitudes and intensification in the tropics during December–February (DJF), while during June–August (JJA), tropical intensification is more widespread, and only some extratropical locations experience reductions in DTDT variations. The spatial pattern of projected changes in the DTDT variations is mostly associated with changes in the standard deviation of daily temperature, whereas changes in temporal autocorrelation give rise to regional variations in magnitude. In the extratropics during DJF, the weakening of DTDT extremes is mainly driven by reduced advection contributions due to Arctic amplification. However, during JJA, reductions in extremes result from changes in advection, diabatic, and adiabatic processes, with differences between events and regions in their relative contributions. Furthermore, changes in diabatic processes play a significant role in the projected intensification of extremes in JJA over land areas in the tropics and subtropics, while the tropical intensification during DJF results from local changes in diabatic and adiabatic processes. Our findings demonstrate that a regional and seasonal perspective that, in addition to the well–established role of advection, also accounts for diabatic and adiabatic heating processes is essential for understanding projected extreme DTDT changes and for developing suitable adaptation strategies.
- Article
(18533 KB) - Full-text XML
- Companion paper
-
Supplement
(3496 KB) - BibTeX
- EndNote


In its Sixth Assessment Report, the Intergovernmental Panel on Climate Change emphasises that temperature extremes have adverse effects on human health, agriculture, and the economy, and anticipates these challenges worsening as associated weather extremes intensify (Intergovernmental Panel on Climate, 2023). Rapid day-to-day temperature (DTDT) changes, as one specific type of temperature extremes (Hamal and Pfahl, 2025), significantly impact health, primarily contributing to increased mortality rates, especially among children and older individuals (Chan et al., 2012; Hovdahl, 2022; Martínez-Solanas et al., 2021; Wu et al., 2022). They also lead to economic losses, which are notably higher at low latitudes than at high latitudes, and negatively affect agriculture (Kotz et al., 2021; Linsenmeier, 2023; Zou et al., 2024). Furthermore, these impacts are projected to increase in a warming future, particularly affecting economic activity in warm, poor regions (Linsenmeier, 2023) and being associated with reductions in cropland and yields (Wang et al., 2022). The population's exposure to the risk of these DTDT changes has continued to increase (Chen et al., 2025). Therefore, studying DTDT changes and their extremes in a warming climate is important.
Research on future projected changes in DTDT variations and their extremes remains limited. Zhou et al. (2020) projected a decrease in the magnitude of extreme DTDT variations across mid to high latitudes on the annual time scale, associated with declining strong wind patterns. Similar results have been observed for the Northern Hemisphere winter and summer (Kim et al., 2013; Wang et al., 2025). Xu et al. (2020) found a reduction in DTDT variations during winter and an increase along the Arctic Coast during summer, driven by notable shifts in the meridional temperature gradient. Similarly, an increase in summer variability across extratropics and tropical landmasses has been attributed to anthropogenic influences (Wan et al., 2021). All these studies have examined the typical or average magnitude and trends of DTDT changes, except for Zhou et al. (2020) and Liu et al. (2025), who also examined extreme DTDT changes using a fixed temperature threshold (Zhou et al., 2020) and a percentile threshold method (Liu et al., 2025), respectively, on an annual timescale. Here, to investigate projected extreme DTDT changes at a seasonal timescale, a percentile–based threshold method is applied, similar to previous studies of temperature extremes in a warming climate (Schielicke and Pfahl, 2022; Vogel et al., 2020). Furthermore, we aim to investigate the detailed thermodynamic and dynamic processes underlying the projected changes in extreme DTDT variations using Eulerian composites and Lagrangian backward trajectories.
Backward trajectory analyses have been widely used to identify the physical processes underlying the formation of temperature extremes, encompassing advection (the transport of air from climatologically warmer regions to colder regions or vice versa), Lagrangian temperature changes associated with adiabatic compression or expansion, and diabatic heating or cooling. The process–based analyses have been conducted both for the past (Papritz and Spengler, 2017; Röthlisberger and Papritz, 2023a, b; Nygård et al., 2023; Quinting and Reeder, 2017; Bieli et al., 2015; Zschenderlein et al., 2019; Mayer, 2025) and within the context of future climate change (Brunner et al., 2018; Schaller et al., 2018; Schielicke and Pfahl, 2022; Chan et al., 2022; Jeong et al., 2025), providing a better understanding of temperature extremes. These studies also highlighted that temperature extremes are intricately linked to synoptic–scale circulation patterns, such as ridges and troughs, which control the advection of air masses and the adiabatic warming or cooling due to subsidence or ascent, respectively (Kautz et al., 2022; Neal et al., 2022; Jeong et al., 2025). Additionally, turbulent mixing and diabatic processes, such as radiative cooling and sensible heat fluxes near the Earth's surface, significantly contribute to the formation of extreme temperatures (Hartig et al., 2023; Röthlisberger and Papritz, 2023b, a). Future changes in extreme temperatures (daily temperature extremes and heatwaves) are primarily driven by thermodynamic processes, with less influence from dynamic processes (Brunner et al., 2018; Schaller et al., 2018; Schielicke and Pfahl, 2022; Vogel et al., 2020; Chan et al., 2022). Here, we investigate whether this also holds for extreme DTDT changes in a warming climate.
Building on the methodology and process understanding from Part 1 of this study (Hamal and Pfahl, 2025), we investigate historical and future extreme DTDT changes in global climate simulations from the Community Earth System Model Large Ensemble (CESM–LE) using Lagrangian backward trajectory analyses of surface air masses initialised at selected locations on the 2 d involved in extreme DTDT changes. Furthermore, the contributions of various processes – advection, adiabatic, and diabatic warming/cooling – to projected extreme DTDT changes are analysed using a Lagrangian temperature decomposition. This study aims to address the following research questions:
-
What is the role of changes in atmospheric circulation patterns for projected changes in extreme DTDT variations?
-
Which physical processes contribute to extreme DTDT changes in a warming climate?
2.1 CESM–LE
In this study, we use 30 ensemble members from the fully coupled 1st version of the CESM–LE project (Kay et al., 2015) to assess the influence of natural variability. The ensemble members differ by small random perturbations applied to their initial air temperature fields, with magnitudes of approximately 10−14 K. The simulations are externally forced using historical conditions up to 2005 and representative concentration pathway (RCP) 8.5 conditions for 2006–2100. The atmospheric variables in the CESM–LE dataset are available on a horizontal grid with approximately 1° spacing in latitude and 1.25° in longitude, with 30 hybrid vertical levels and 6-hourly intervals. Our analysis focuses on two 10-year time slices: 1991–2000 (historical climate) and 2091–2100 (future climate). The CESM simulations were rerun for these time slices using restart files from the original CESM–LE simulations to generate additional output required for the trajectory calculations (Schielicke and Pfahl, 2022; Dolores-Tesillos et al., 2022). Afterwards, all fields were remapped to a uniform horizontal resolution of 1° × 1°. The analysis incorporates near–surface temperatures at a reference height of 2 m above ground level, total cloud cover, precipitation, and several three-dimensional atmospheric fields, including temperature, pressure, geopotential height, and horizontal and vertical wind components. The temporal resolution of near-surface temperature and composite analyses is daily (average over 6-h intervals), whereas the input data for trajectory calculations are maintained at 6-h resolution. Previous applications of the CESM–LE for simulating temperature extremes and associated processes across various regions demonstrate its reliability and confirm its suitability for the present study (Schielicke and Pfahl, 2022; Wang et al., 2019).
2.2 ERA5
We use 2 m air temperature (calculated from hourly data) data from 1991 to 2000, at a spatial resolution of 1° × 1° from the fifth-generation European Centre for Medium-Range Weather Forecasts (ECMWF) global reanalysis product (ERA5, Hersbach et al., 2020), to calculate present-day DTDT variability and compare it with the model simulations. More details are provided in Sect. 2 of Part 1 (Hamal and Pfahl, 2025).
2.3 Calculation of DTDT changes and their extremes
The DTDT change, δT, is defined as the difference in daily mean near-surface air temperature between the day of the event (t) and the previous day (t−1). Here, Tt−1 and Tt represent the near-surface air temperatures on these 2 d, respectively. The standard deviation of the DTDT change σDTDT can be expressed as a function of the usual standard deviation σT and the lag-1 autocorrelation r1,T of the daily mean temperature, as indicated in Eq. (1), which was derived in Sect. 2 of Part 1 (Hamal and Pfahl, 2025). We calculate all these quantities for the historical and future scenarios for each ensemble member, and then average over ensemble members to obtain the ensemble mean.
Extreme DTDT changes are examined using the percentile method for both historical and future climates. Cooling and warming events are determined at each grid point and for each ensemble member, using the 5th and 95th percentiles of DTDT change as thresholds. The analysis focuses on two seasons: December–February (DJF) and June–August (JJA). At each location, 44 events are selected for DJF and 45 for JJA for each member and each 10-year time slice (historical and future climate).
2.4 Trajectory calculation
We employ a Lagrangian analysis method to compute backwards trajectories, similar to the approach used for ERA5 in Hamal and Pfahl (2025), but here applied to each CESM–LE's historical and future extreme DTDT changes during both days t−1 and t, respectively. 3 d backward trajectories are initialised at 18:00 UTC from pressure levels of 10, 30, 50, and 100 hPa above the surface at each selected grid box (see Sect. 2.5). Output data, including latitude, longitude, pressure, temperature, and potential temperature, are recorded at 6-h intervals. We then compare the trajectories for extreme events in the historical and future scenarios to assess their projected changes.
Trajectory density maps were quantified using two-dimensional Kernel Density Estimation (KDE) applied to the geographic coordinates of back-trajectory positions 3 d before arriving at the target grid box. The KDE was evaluated on a common fixed grid over the selected locations, ensuring spatial consistency and direct comparability across all events and ensemble members. The resulting density field was normalised by the total density and expressed as a percentage (%), representing the relative frequency of air-mass occurrence at each grid point.
2.5 Lagrangian temperature decomposition
To better understand the underlying mechanisms of extreme DTDT changes, our analysis focuses on different locations that show significant projected changes during DJF and JJA. For DJF, we select two locations: North America (51° N, 86° W) and tropical South America (13° S, 56° W), whereas for JJA, we focus on western North America (45° N, 120° W) and central Europe (50° N, 10° E) in the main paper. Additional grid points are shown in the Supplement. At these locations, the Lagrangian decomposition method (Eq. 2) developed in Part 1 (Hamal and Pfahl, 2025) is utilised to quantify the contributions of advection, adiabatic, and diabatic processes to extreme DTDT changes in both historical and future scenarios. This method is applied to 3 d backward trajectories initiated during the 2 d associated with extreme DTDT change events in both present and future climates.
Here, the DTDT change () is decomposed into three contributing factors that are calculated as in Part 1 (Eqs. A4–A6 in Hamal and Pfahl, 2025): the mean temperature difference at the origin of the air masses 3 d before initialization, which indicates the contribution of changes in advection change (, a contribution of mean adiabatic compression or expansion change resulting from vertical descent or ascent (, and a contribution of mean diabatic heating or cooling change from processes such as latent heating in clouds, radiation, and surface fluxes (). The mean here refers to an average over several trajectories. The final term is the residuum change (res), resulting from numerical inaccuracies in the calculations. The residual change is usually small and therefore not further addressed in the subsequent text and Figures. Equation (2) is applied separately for the historical and future climate, and projected changes in the contributions are calculated as differences between the time slices.
Furthermore, to determine the contribution of Arctic Amplification (AA) to changes in extreme DTDT events, we compare the seasonal mean temperature change at the air parcels' origin points (−72 h) between days t and t−1. To determine the origin, we use historical trajectory pathways, neglecting projected changes in circulation and thereby isolating the effect of seasonal-mean background warming in the source regions. As the mean latitude of the source regions typically changes between days t−1 and t, this differential warming is due to AA.
2.6 Statistical test
To quantify observational uncertainty in the historical climate, we generate a probability distribution by bootstrapping the ERA5 dataset: randomly selecting 10 years from ERA5 to obtain one sample of a 10-year average temperature metric (e.g., DTDT), and repeating this procedure n=1000 times. A 10-year average is used because the 10-year historical time slice is available from CESM-LE (see again Sect. 2.1). This distribution is then compared with the variability represented by the CESM–LE multi–member ensemble, which is sampled in a similar manner by pooling all ensemble members from the historical simulations. To assess projected climate change, we employ the same bootstrap approach, comparing all pooled ensemble members from the historical and future climate simulations. The statistical significance of these bootstrap results is then evaluated using a false discovery rate (FDR) correction (Wilks, 2016) at the 1 % significance level. For the composite maps, statistical significance is determined using a two-sample t-test, and we only display differences that exceed the 95 % confidence threshold.
3.1 Projected DTDT changes in DJF and JJA
During the historical climate period, temperature variability in the CESM–LE simulations, quantified through both σDTDT and σT, is typically larger in the mid-to-high latitudes of both the Northern and Southern Hemispheres than in the tropics. This pattern is consistently observed during DJF and JJA (Figs. 1a–b and 2a–b). The model captures large–scale spatial patterns (cf. Part 1); however, the magnitude lies outside of the non–parametric bootstraps resampling based on ERA5 in many regions (hatching in Figs. 1a–b and 2a–b). Approximately 40 %–70 % of global land regions exhibit systematic biases in the daily temperature metrics simulated by CESM–LE relative to ERA5 (Fig. S1). Regions with notable biases include large parts of the Northern Hemisphere mid- and high latitudes and Southeast Asia during DJF (Fig. 1a–b), where the model overestimates variability, and several subtropical regions during JJA (Figs. 2a–b and S1a–b, d–e). In contrast, the model underestimates variability in the tropics and at most locations in JJA. The simulated autocorrelation generally agrees well with ERA5 (Figs. 1c, 2c), though there are regional exceptions, notably in the deep tropics, Central America, and the Arabian Peninsula, where it shows positive biases (Fig. S1c and f). Furthermore, in CESM–LE, the spatial pattern of σDTDT is generally similar to σT (as outlined in Eq. 1), with the influence of r1,T being restricted to the regional scale, as discussed for ERA5 in Part 1.
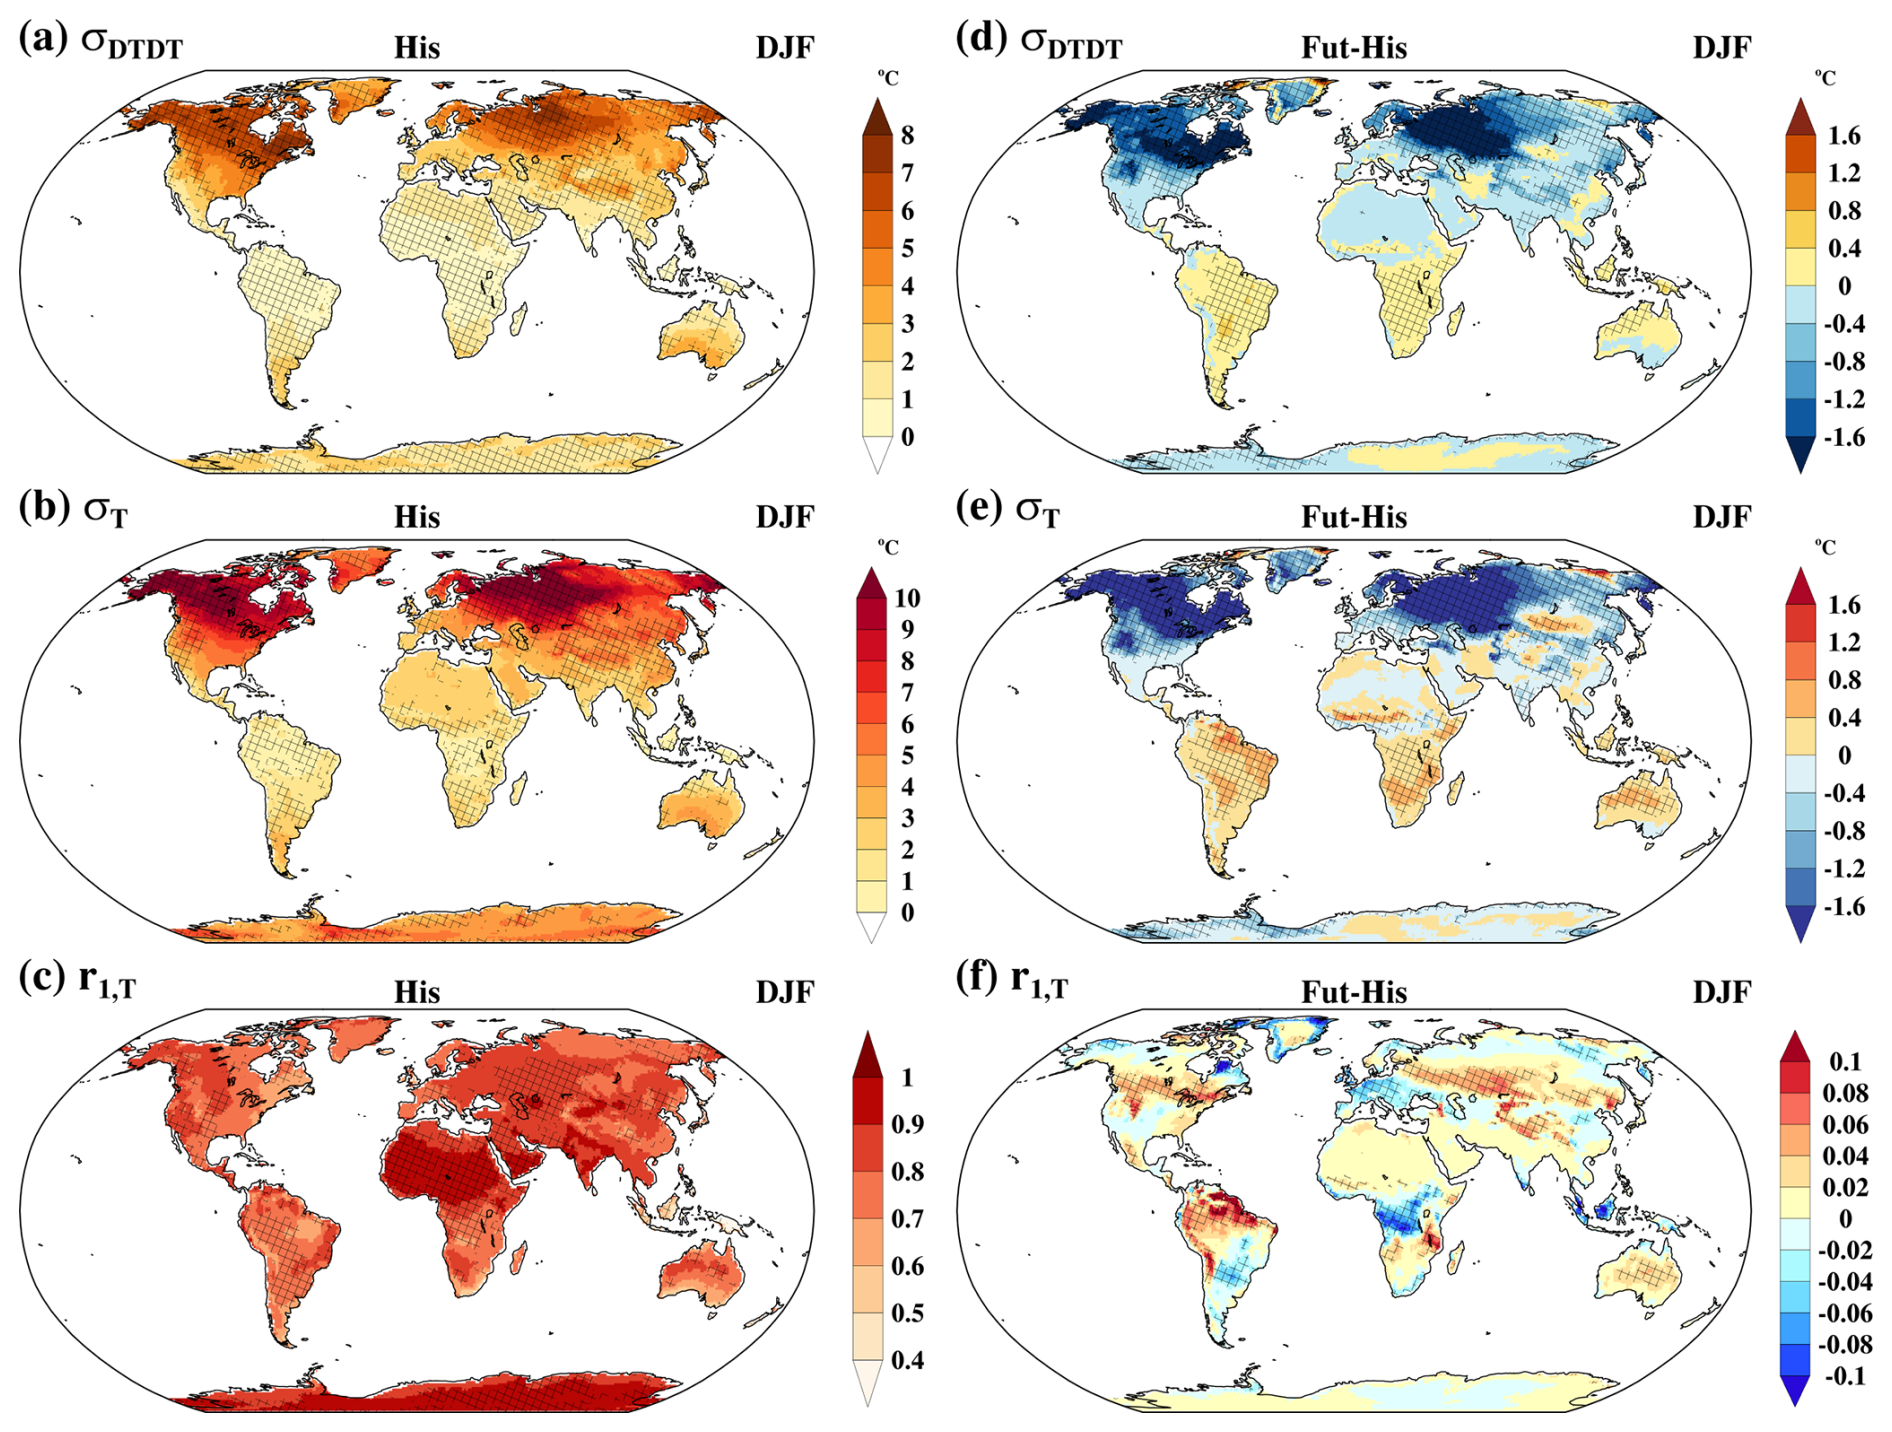
Figure 1The ensemble means of (a, d) standard deviation of DTDT variations (σDTDT °C), (b, e) standard deviation of daily mean temperature (σT, °C), and (c, f) lag–1 autocorrelation of daily mean temperature (r1,T) in December–February (DJF) in the historical climate (a–c) and projected change (d–f). In panels (a)–(c), cross–hatching marks grid points where the CESM–LE ensemble mean differs significantly from the ERA5-derived metric, with statistical significance determined through bootstrap resampling. In panels (d)–(f), cross–hatching denotes grid points where the future minus historical difference is significantly different from zero, assessed via bootstrapping.
The projected changes in σDTDT, σT, and r1,T compared to the historical climate are illustrated in Figs. 1d–f and 2d–f. During DJF, the projected σDTDT and σT changes differ between high and low latitudes (Fig. 1d–e). A significant reduction in temperature variability of more than 20 % is projected across Northern Hemisphere mid-to high latitudes (Fig. S2a–b), where the variation among ensemble members is also highest (locally above 0.6 °C, Fig. S3a–b). Conversely, an increase in variability of more than 20 % is projected in several tropical regions, including the Amazon, southern Africa, the Maritime Continent, and northern Australia. Projected σDTDT changes are primarily associated with changes in σT. Although the changes in r1,T are relatively modest (10 %–20 %, Fig. S2c), they introduce important regional variations in the magnitude of the response, particularly in the Northern Hemisphere midlatitudes and the tropics (Fig. 1f). For example, over some areas in North America and northwestern Asia, a reduction of σT combined with an increase in autocorrelation is linked to a more pronounced decline in σDTDT (see Eq. 1). In these areas, the DTDT distribution is projected to become narrower and more peaked, accompanied by increases in skewness and kurtosis (Fig. S4a). Conversely, in the deep tropics, the projected magnitude of σDTDT changes is slightly larger than the change σT due to reduced autocorrelation. Additionally, in these regions, the historically low variability and sharply peaked distribution are expected to broaden, leading to decreases in kurtosis and skewness (Fig. S4b).
During JJA, most regions globally are projected to experience an increase in σDTDT (Fig. 2d–e) exceeding 20 % in many areas (Fig. S2d–e). The increases in σDTDT in regions such as Europe, the Amazon, the Sahel, the Maritime Continent, southern Australia, South and Southeast Asia, Central America, and parts of northern Russia are associated with concurrent increases in σT. In these regions, changes in the distribution's shape are also evident, with notable shifts in kurtosis and skewness (Fig. S4d) and slight changes in autocorrelation (Fig. 2f). Only in a few regions, σDTDT variability is projected to decrease by more than 10 % (Figs. 2d and S2d). Over parts of western and eastern North America, Northeastern Asia and Greenland, σDTDT projections are expected to decrease despite smaller changes or even a slight increase in σT, which is due to significant increasing r1,T (Fig. 2d–f, Eq. 1). The inter–model variations of the JJA response are relatively small (Fig. S3d–f).
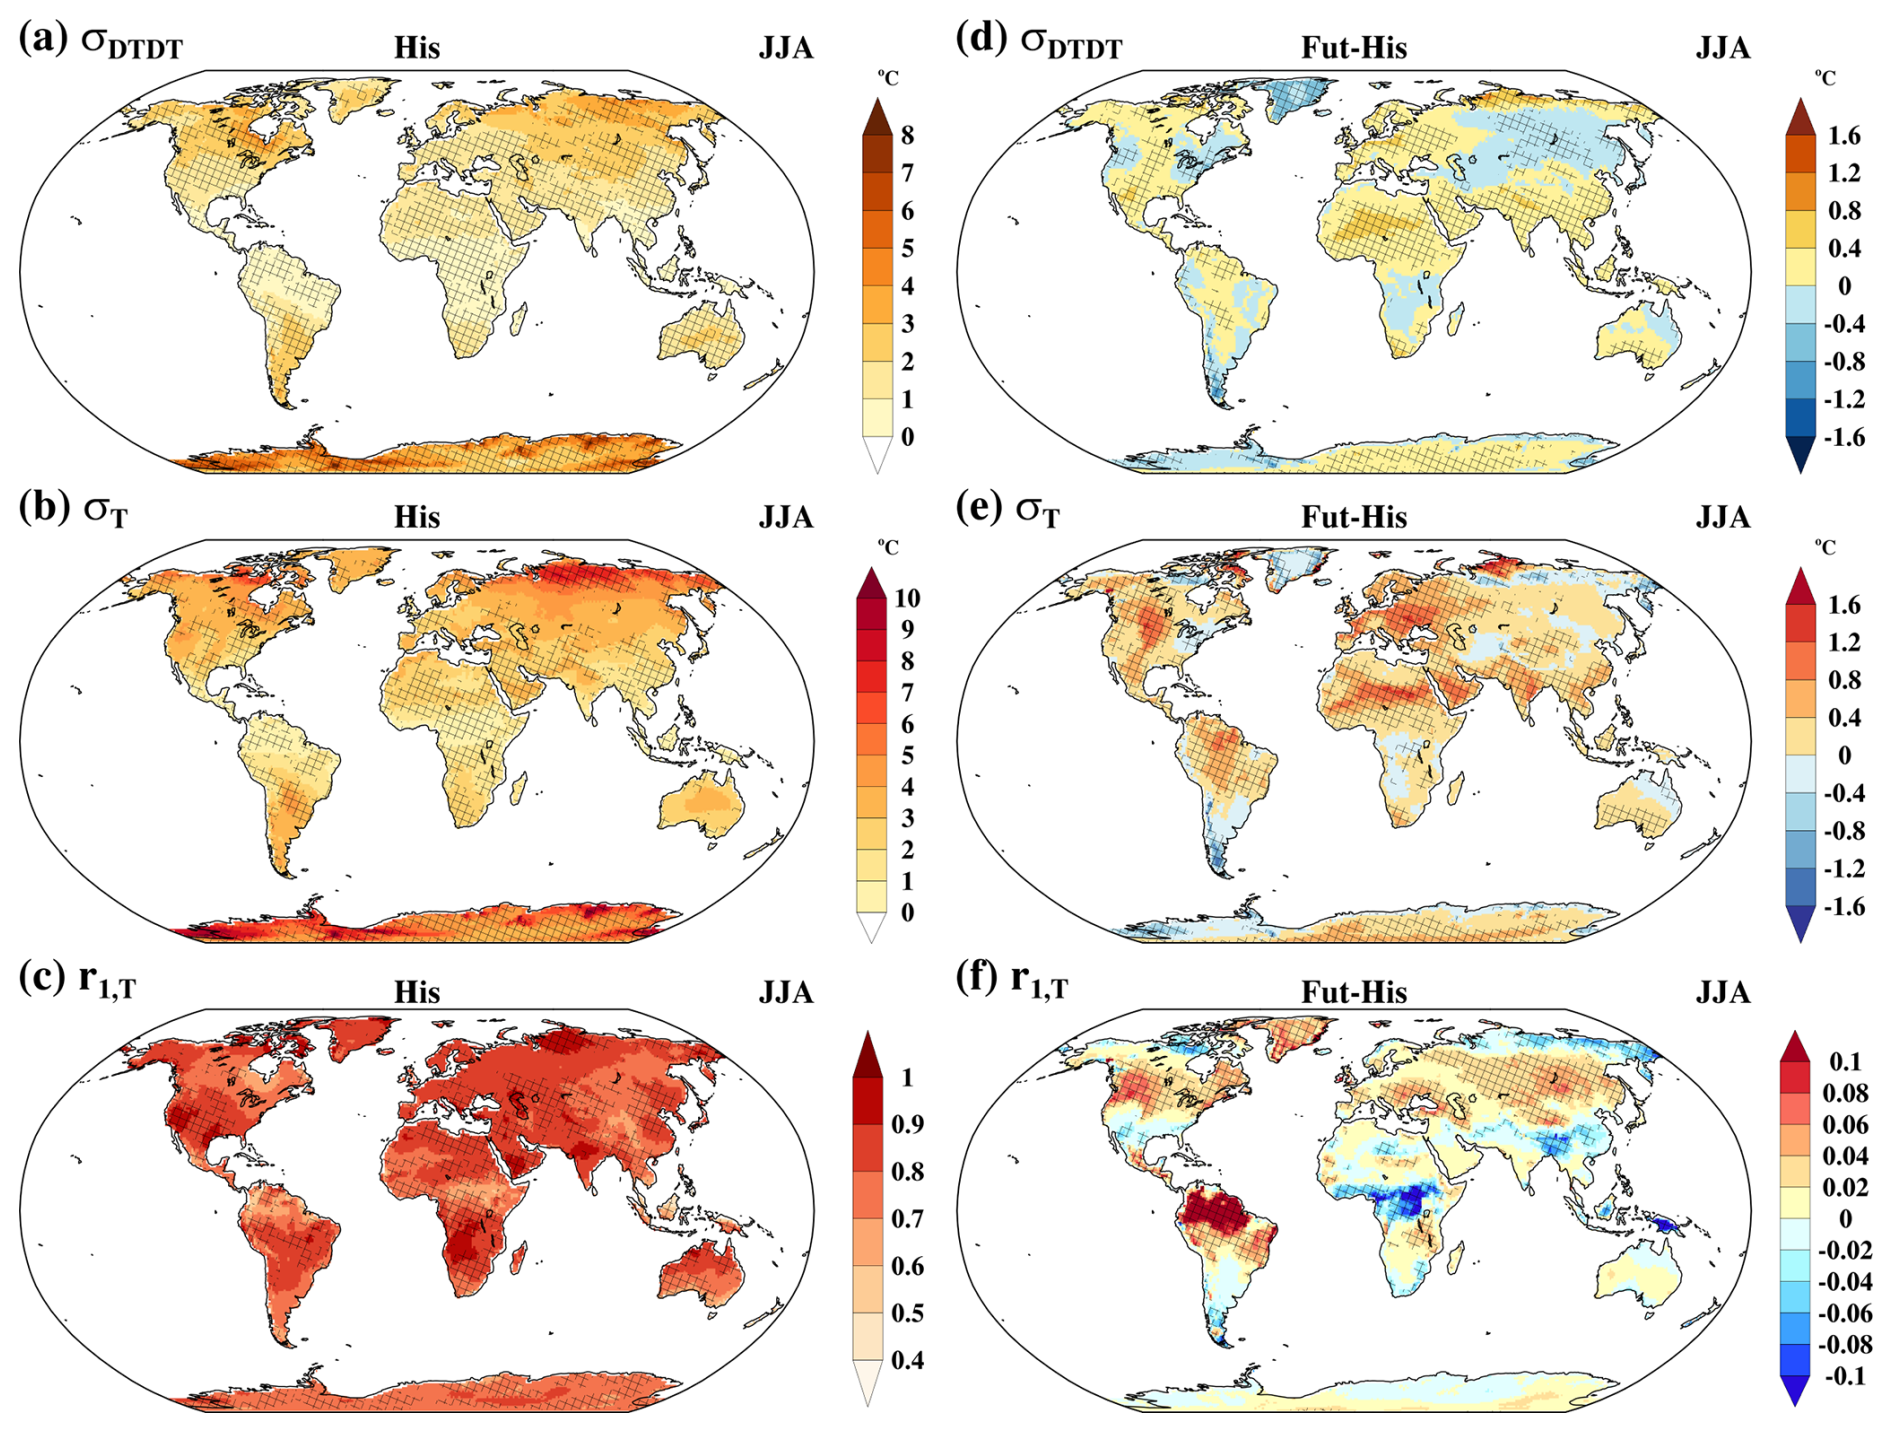
Figure 2The ensemble means of (a, d) standard deviation of DTDT variations (σDTDT, °C), (b, e) standard deviation of daily mean temperature (σT, °C), and (c, f) lag-1 autocorrelation of daily mean temperature (r1,T) in June–August (JJA) in the historical climate (a–c) and projected change (d–f). In panels (a)–(c), cross–hatching marks grid points where the CESM–LE ensemble mean differs significantly from the ERA5–derived metric, with statistical significance determined through bootstrap resampling. In panels (d)–(f), cross–hatching denotes grid points where the future minus historical difference is significantly different from zero, assessed via bootstrapping.
3.2 Projected extreme DTDT changes
The 5th and 95th percentiles serve as thresholds at each grid point to identify historical and projected extremes of DTDT cooling and warming, as depicted in Fig. 3. In DJF, the model overestimates the historical magnitudes of warming and cooling events in the subtropics and mid- to high latitudes, but underestimates them in the tropics relative to ERA5. By contrast, JJA is characterised by a widespread underestimation of these events, except for overestimations observed in arid regions and high latitudes (Stippling in Fig. 3a–d). The future patterns of extreme DTDT changes closely correspond with the projected climatological σDTDT and σT patterns (Figs. 1, 2, and 3). During DJF, the areas with the largest historical extreme DTDT changes, primarily in mid- to high latitudes, are expected to experience a decrease in intensity in the future (Fig. 3e–f). In contrast, in tropical regions, these extremes are projected to intensify. In JJA, projected changes exhibit regional variations, with intensities mainly increasing in parts of the tropics and subtropics. Exceptions with weakening extreme DTDT changes are observed in some extratropical regions, including western and eastern North America, Northeastern Asia, Greenland, and Southern South America (Fig. 3g–h).
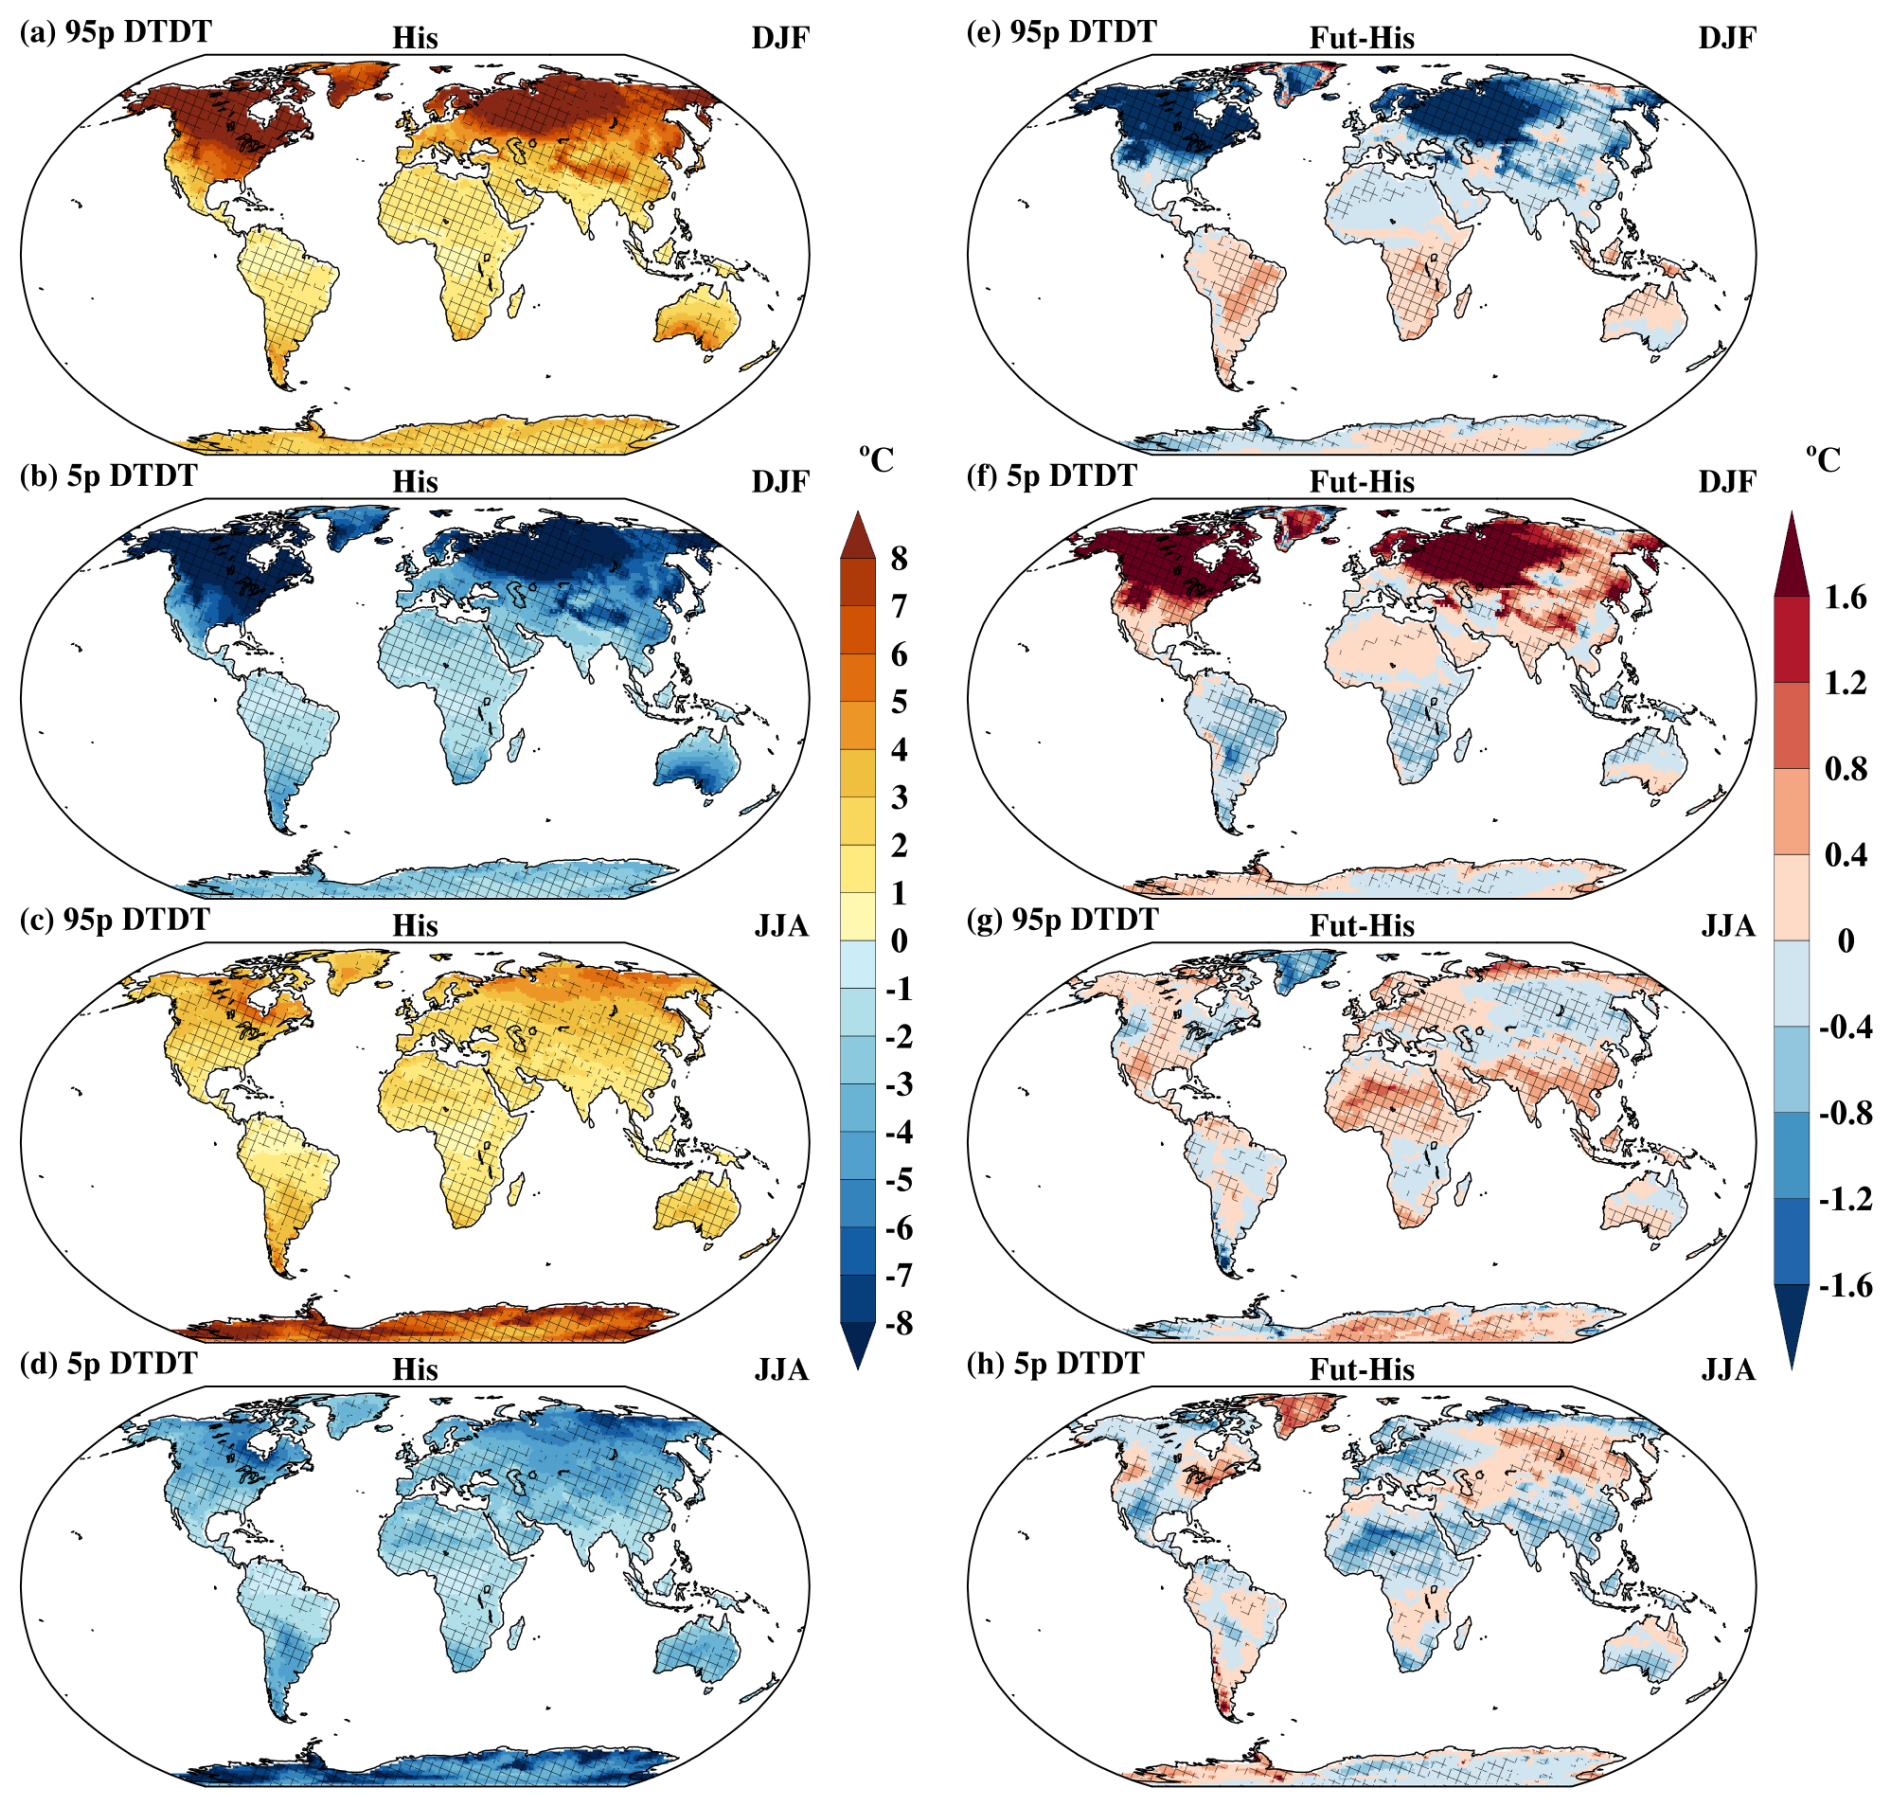
Figure 3The ensemble means of the (a, e, c and g) 95th percentile (95p) and (b, f, d and h) 5th percentile (5p) of DTDT variations during (a–b, e–f) December–February (DJF) and (c–d, g–h) July–August (JJA) based on the historical climate (a–d) and projected change (e–h). In panels (a)–(d), cross–hatching marks grid points where the CESM–LE ensemble mean differs significantly from the ERA5–derived metric, with statistical significance determined through bootstrap resampling. In panels (e)–(h), cross–hatching denotes grid points where the future minus historical difference is significantly different from zero, assessed via bootstrapping.
3.2.1 Projected weakening of extreme DTDT changes
During DJF, the northern mid- to high-latitude regions (North America, Northern Asia, and Northern Europe) are projected to experience a decrease in extreme DTDT changes relative to the historical climate, driven by consistent changes in atmospheric circulation and physical processes, as illustrated in Figs. 4–6 and S5–S11. This section focuses exclusively on the results for North America. Composites of anomalies from the seasonal climatology are shown for both days involved in an extreme DTDT change for geopotential height (GP) at 500 hPa, wind at 850 hPa, and sea level pressure (SLP) in Fig. 4, together with changes in the day-to-day circulation differences in Fig. S5.
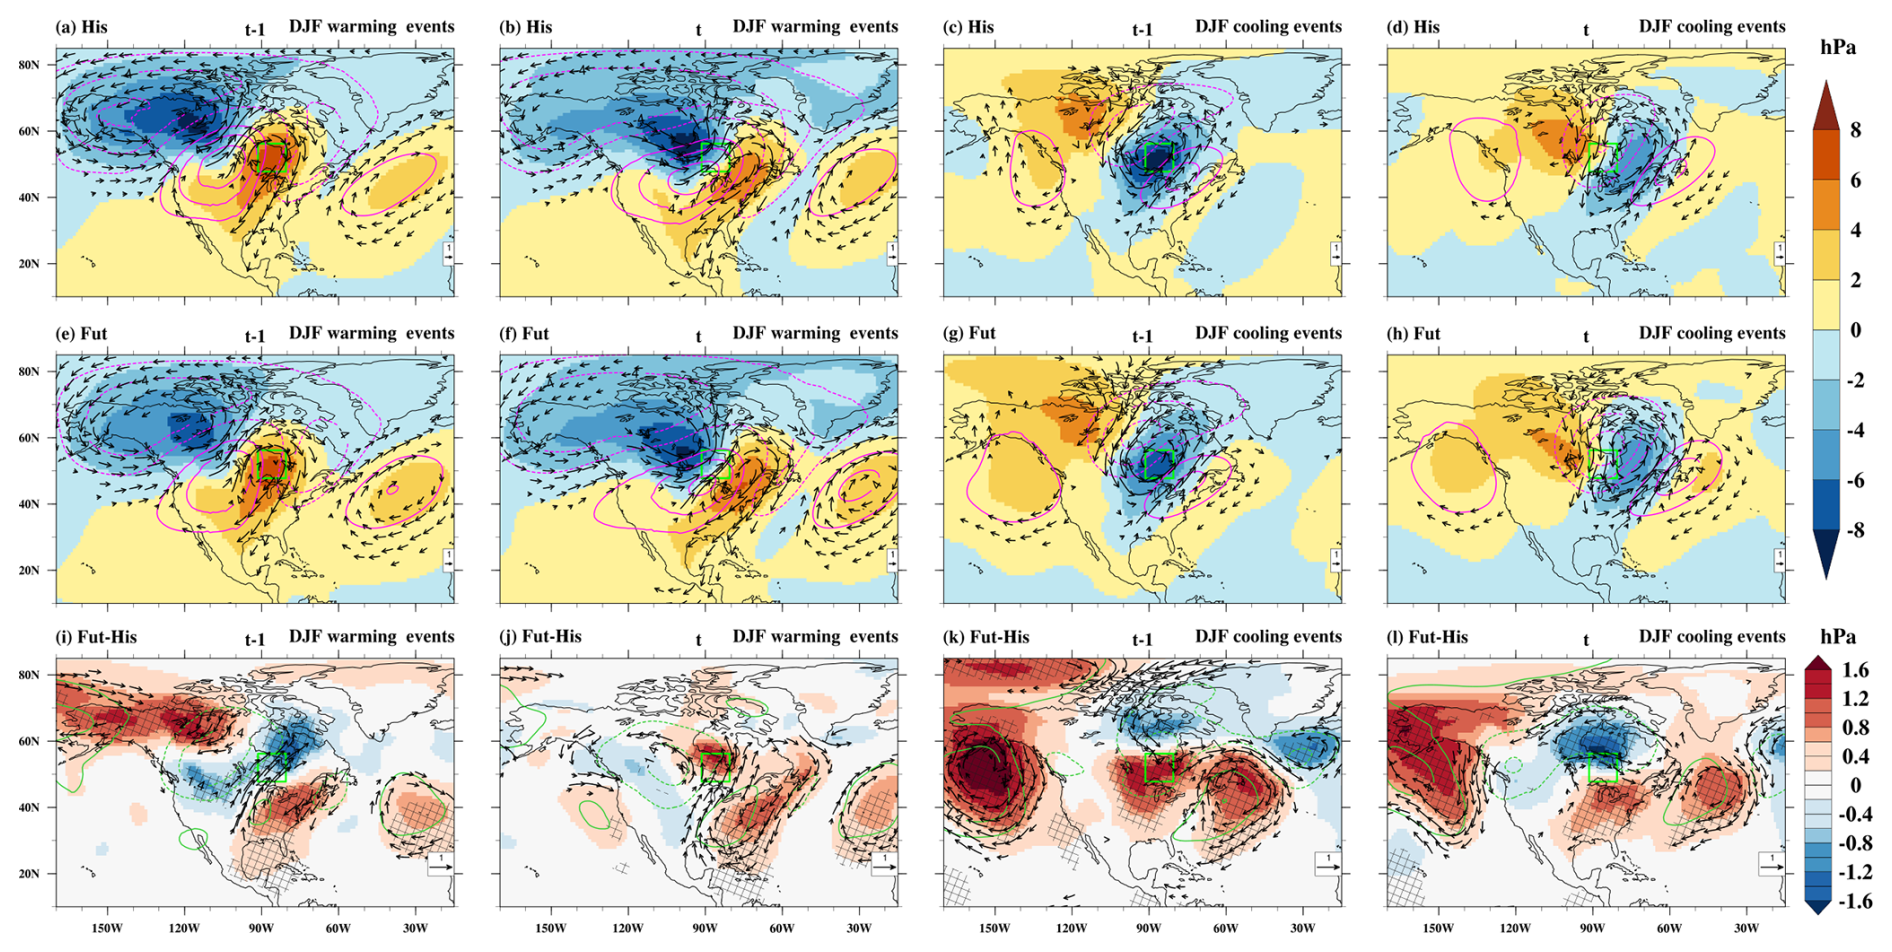
Figure 4Composite of sea level pressure anomalies (hPa, color shading), wind anomalies at 850 hPa (m s−1 vectors), and geopotential height anomalies at 500 hPa (gpm, magenta and darkgreen contours) relative to the seasonal mean on the (a, e, i, c, g, k) previous day (t−1) and (b, f, j, d, h, l) the event day (t) of the warming (a–b, e–f and i–j) and cooling (c–d, g–h and k–l) events during December–February (DJF) in (a–d) historical climate (His), (e–h) future climate (Fut), and (i–l) projected changes (Fut–His) at a selected grid box in North America (green box). Note that, in (a)–(h), wind vector anomalies ≥2 m s−1 and in (i)–(l), wind vector difference anomalies ≥ 0.5 m s−1 are plotted. The dotted and bold contours indicate negative and positive geopotential height anomalies, respectively. Additionally, the cross–hatching area indicates where the ensemble mean of sea level pressure differences exceeds the 95 % confidence threshold based on a t-test.
In the simulated historical period, DTDT warming events are associated with pronounced shifts in GP, SLP, wind anomalies, and air mass origin between days t−1 and t (Figs. 4a–b and 5a–b). On day t−1, the grid box lies within a high–pressure area downstream of an eastward–propagating ridge at 500 hPa, in a transition zone between southwesterly wind anomalies to the west and northeasterlies to the east (Fig. 4a), associated with the advection of relatively cool air masses (Fig. 5a, m). By day t, the ridge moves over the grid box, featuring southwesterly wind anomalies in between an upstream surface low and the high that shifted downstream (Fig. 4b) and the advection of much warmer continental air masses (Fig. 5b, m). This shift to southwesterly advection (see also Fig. S5a) contributes an average warming of +6.2 °C to the DTDT change (Figs. 5m and 6a). In terms of vertical transport, weaker subsidence at t compared to t−1 reduces the adiabatic warming by −2.6 °C (Figs. 5i, 6a), partially offsetting the temperature increase. Conversely, enhanced diabatic heating during the final 24 h of the event day contributes +4.8 °C to the DTDT change (Fig. 5q), further amplifying the warming. The strength of these process contributions varies across events, as illustrated by the box–and–whisker plots (Fig. 6a). In summary, the simulated DTDT warming events during the historical period are primarily driven by a shift toward southwesterly warm–air advection, with diabatic heating reinforcing the effect and adiabatic changes slightly dampening it (Fig. 6a). These model results generally align with the patterns and process contributions identified from ERA5 reanalysis data (see Figs. 4a–c and 5k in Part 1). A quantitative comparison indicates that CESM–LE exhibits slightly smaller advection, along with greater reduced–adiabatic and enhanced–diabatic contributions than ERA5.
In general, the future synoptic–scale pattern for DTDT warming events resembles the historical pattern, though SLP and GP anomalies weaken and shift southeastward (Fig. 4e–f). This leads to an earlier shift to southwesterly flow at t−1, shifting air mass origins southwestward (Figs. 4i, 5e). By day t, GP anomalies move further downstream, reducing westerly and enhancing southerly meridional flow (Figs. 4j, 5f). Thus, both days exhibit a stronger southerly component, though the southwesterly strengthening is more pronounced at t−1, resulting in a northeasterly anomaly between days (Fig. S5c). These relatively subtle changes in circulation patterns are associated with an average net reduction of −1.1 °C in the advective contribution to DTDT warming compared to the historical period (Fig. 6c). This advective reduction is because the projected warming at the origin of the traced air masses (at −3 d) is 9.4 °C in day t−1 but only 8.3 °C in day t (Fig. 5n), which is both considerably above global mean warming (Fig. S6a–c). Nevertheless, from Arctic Amplification alone, one would expect an even larger reduction of the advective contribution (Fig. S7a and c), indicating that changes in circulation mitigate the effect of AA. Furthermore, projected changes in vertical motion indicate slightly increased subsidence on day t−1 (by 5–6 hPa in 3 d, Fig. 5j) compared to day t, which modestly enhances adiabatic warming, reducing the warming between t−1 and t by an additional −0.5 °C. Diabatic heating decreases relative to the historical period on both days, with a slightly larger reduction on the event day (mainly in the last 24h before arrival; Fig. 5r), contributing an additional −0.5 °C to the overall decrease in warming. Overall, the weakening of all three contributions together results in a mean reduction in the DTDT warming of −2.1 °C, with the reduced advective contribution accounting for approximately half of this signal. However, changes in diabatic and adiabatic warming also play a significant role (Fig. 6c).
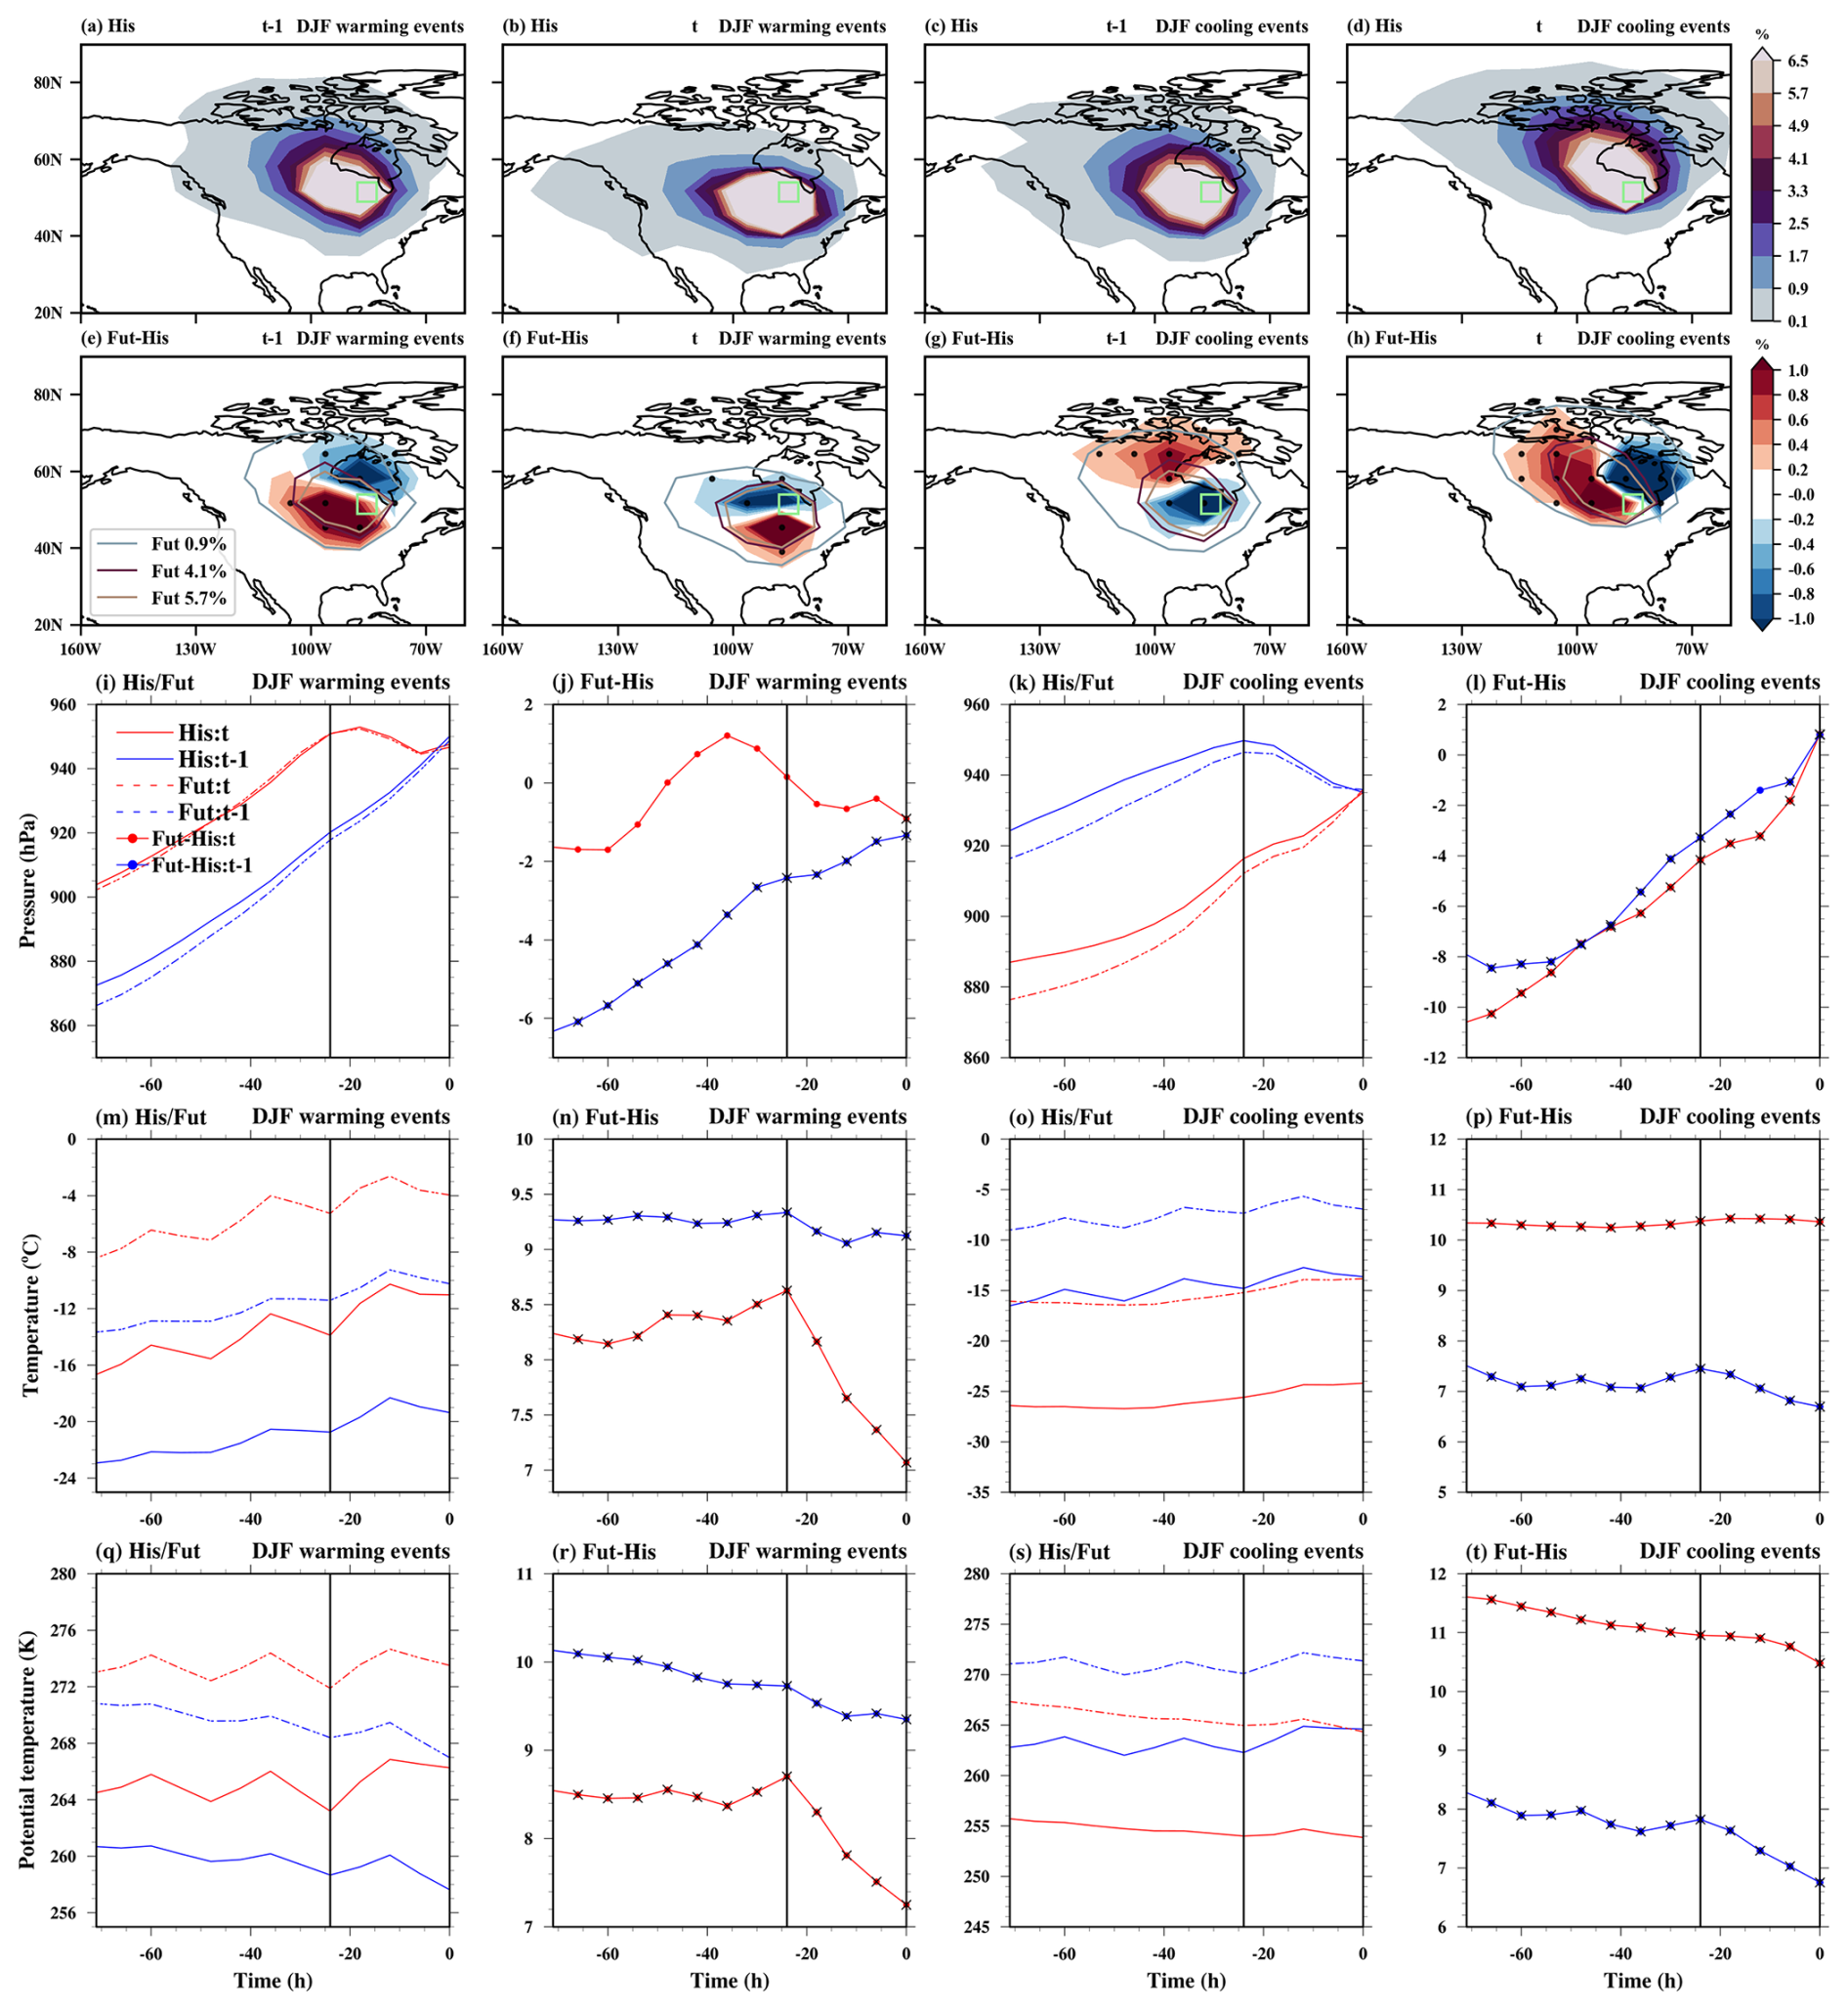
Figure 5The spatial distribution of trajectory density initiated on the previous day (t−1) and the event day (t) is depicted for both December–February (DJF) warming and cooling events over North America (green box). Color shading shows the air mass density (%) during the 3 d before arriving at the target grid box for (a–d) historical climate and (e–h) projected change. In (e)–(h), stippling areas indicate where the ensemble mean of density differences exceeds the 95 % confidence threshold based on a t-test. The contours outline the 0.9 %, 4.1 %, and 5.7 % levels of future trajectory density. The mean Lagrangian evolution of distinct physical parameters (pressure, temperature, and potential temperature) is shown along the air mass trajectories initialised on the previous and event days for historical/future extreme events (1st and 3rd columns) and projected changes in extremes (2nd and 4th columns). Additionally, bold circles with crosses show where the ensemble mean differences at each timestep exceed the 95 % confidence threshold based on a t-test.
During historical DTDT cooling events, a southeastward transition of a trough–ridge pattern and associated SLP anomalies between days t−1 and t dominate the temperature drop (Figs. 4c–d, 5c–d, and S5b). Specifically, the shift from a southwesterly advection of a warm air mass downstream of a low–pressure anomaly on day t−1 to northwesterly transport of a colder air mass between an upstream surface high and the downstream low on day t drives the cooling. This pattern results in a large advective contribution of −9.8 °C to the temperature decrease (Figs. 5o and 6b). The advective cooling is partially offset by moderate adiabatic warming (+2.9 °C), resulting from enhanced subsidence and descent of air masses on the event day (Fig. 5k and o). Additionally, diabatic cooling on day t contributes −2.4 °C (Fig. 5s), further intensifying the overall temperature decline. Collectively, the strong cold–air advection, reinforced by diabatic cooling, is the primary driver of DTDT cooling events across North America and other mid- to high-latitude regions (Figs. 6b and S5–S11). A comparison of North America cooling events shows that, while diabatic cooling is similar between CESM–LE and ERA5, cold–air advection is slightly weaker in CESM-LE, and adiabatic warming is marginally more pronounced compared to ERA5 (see Figs. 4d–f and 5l in Part 1).
The synoptic circulation pattern characterising future DTDT cooling events is very similar to that of historical events (Figs. 4c–d, g–h, k–l, S5d). On days t−1, a slight northward increase of the low-pressure anomaly is associated with strong northerly winds and enhanced air mass origins over Northern Canada, accompanied by downstream weakening of the westerly flow across the selected grid box (Figs. 4k and 5g). By the event day, the intensified low-pressure anomaly shifts southward, with enhanced northwesterly flow and airmass origins extending west-northward (Figs. 4l, 5h, S5d). Nonetheless, the average temperature of the air masses 3 d prior to their arrival rises by 10.3 °C on the day of the event, compared to a warming by only 7.5 °C for the trajectories initialized at t−1, which is due to the generally larger warming at higher latitudes, where the air masses on the day of the event originate, associated with Arctic amplification (Figs. 5h, p, S6d–f, and S7b, d). As a result, the contribution of advective cooling is substantially reduced in future events relative to the historical period (+2.8 °C, Fig. 6d). Vertical motion changes also show slightly enhanced subsidence at t (approximately 4–5 hPa in 3 d; Fig. 5l), which contributes to a modest increase in adiabatic warming (+0.4 °C) and further limits surface cooling. Diabatic cooling is similarly weaker in the future climate, with a slightly greater reduction on day t−1 – particularly during the final 24 h (Fig. 5t) – leading to an additional change of +0.4 °C. Overall, the dominant factor limiting future DTDT cooling (+3.6 °C) is the reduced strength of cold air advection associated with Arctic amplification (Fig. S7d), with smaller but reinforcing contributions from enhanced adiabatic warming and reduced diabatic cooling (Fig. 6d).
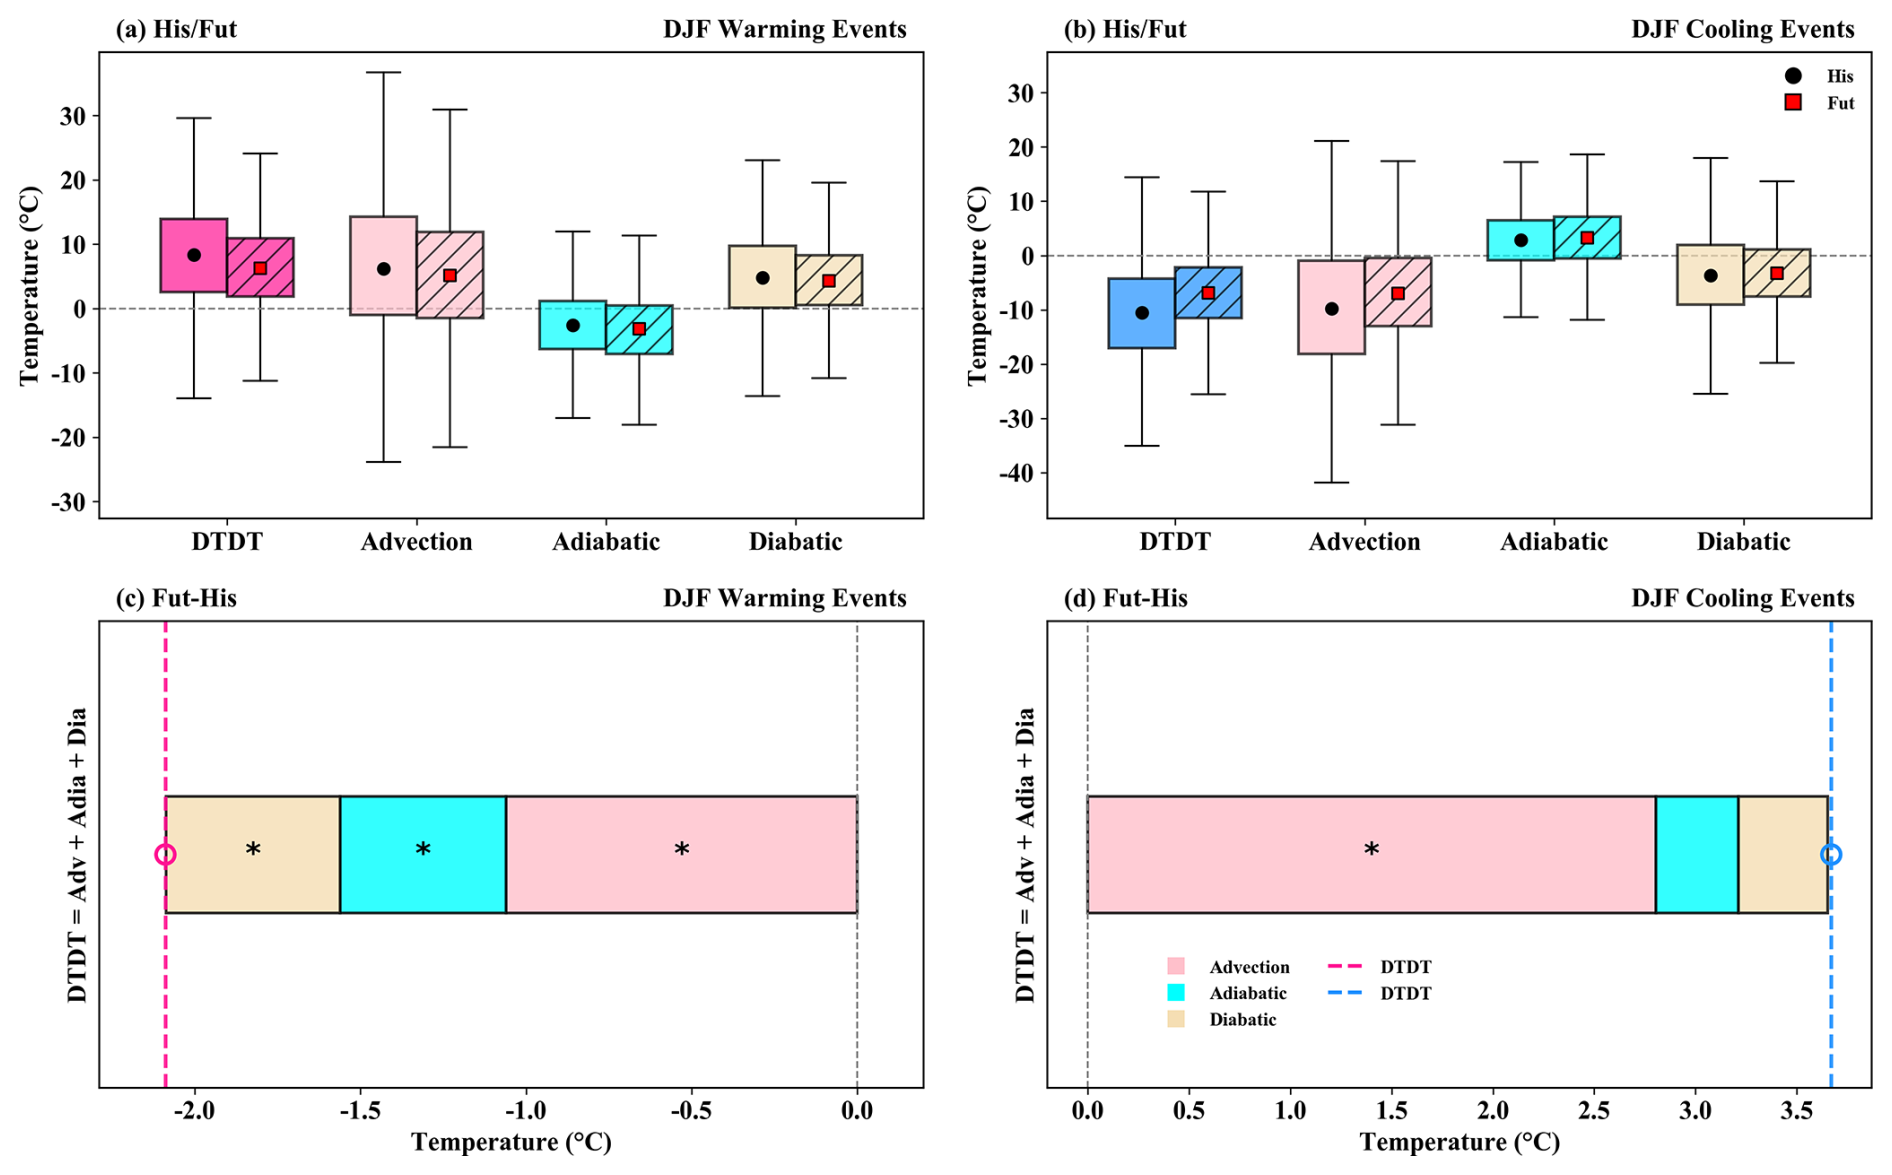
Figure 6The contribution of the different physical processes (advection, adiabatic and diabatic temperature change) over North America during December–February (DJF) to genesis of DTDT (a, c) warming and (b, d) cooling events during historical/future climate (a–b, box plots) and projected change (c–d, stacked plots) according to Eq. (2), which refers to a 3 d–time scale. The box spans the 25th and 75th percentiles of the trajectory data; the black dot/red square inside the box gives the mean of the related quantities in the historical/future climate, and the whiskers indicate 1.5 times the interquartile range in panels (a) and (b). The dotted lines in the stacked plots in panels (c) and (d) show the mean future change for DTDT warming and cooling events, respectively, and coloured bars indicate the contributions of the individual processes. Circle and ∗ symbols mark future change distributions for which the ensemble mean differences exceed the 95 % confidence threshold based on a t-test.
The CESM–LE future projections suggest that extreme DTDT changes will also weaken during JJA in some extratropical regions, including eastern and western North America, Northeastern Asia, Greenland, and southern South America. As an example, a grid box in western North America is examined in detail in the following section (Figs. 7–9). Further examples are shown in Figs. S13–S16.
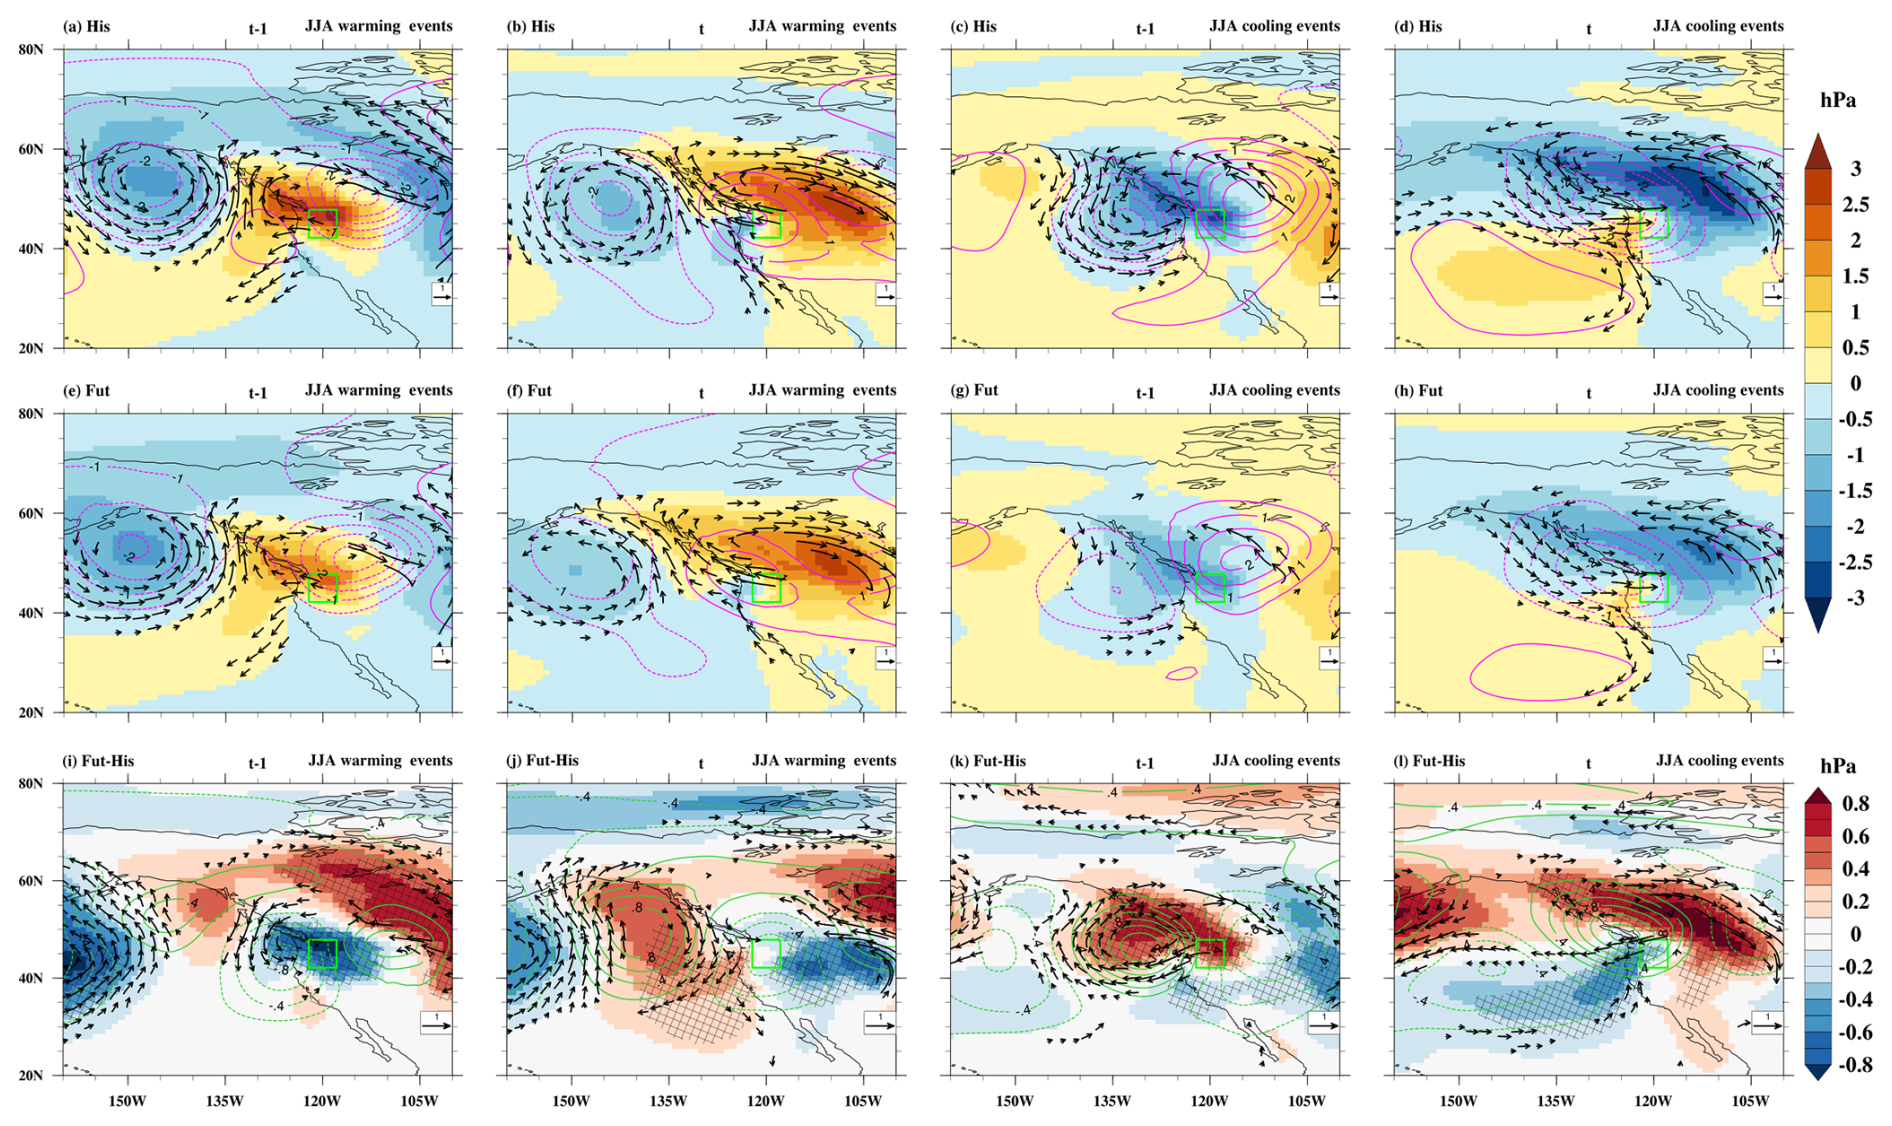
Figure 7Composite of sea level pressure anomalies (hPa, color shading), wind anomalies at 850 hPa (m s−1 vectors), and geopotential height anomalies at 500 hPa (gpm, magenta and darkgreen contours) relative to the seasonal mean on the (a, e, i, c, g, k) previous day (t−1) and (b, f, j, d, h, l) event day (t) of the warming (a–b, e–f and i–j) and cooling (c–d, g–h and k–l) events during June–August (JJA) in (a–d) historical climate (His), (e–h) future climate (Fut), and (i–l) projected changes (Fut–His) at a selected grid box in western North America (green box). Note that, in (a)–(h), wind vector anomalies and in (i)–(l), wind vector difference anomalies are plotted. The dotted and bold contours indicate negative and positive geopotential height anomalies, respectively. Additionally, the cross–hatching area shows where the ensemble mean of sea level pressure differences exceeds the 95 % confidence threshold based on a t-test.
In the historical climate simulations, DTDT warming events are typically associated with a positive SLP anomaly near the selected grid box at t−1, but with a cyclonic 500 hPa anomaly with a maximum to the east (Fig. 7a). Winds near the grid box are weak, and air masses originate in the vicinity, mostly over the continent (Fig. 8a). By day t, the cyclonic anomaly at 500 hPa is replaced by a mature anticyclonic anomaly that began developing along the west coast on day t−1 (Fig. 7b). This transition is associated with the accumulation of warmer air masses over the continent beneath an amplified upper–level ridge (Figs. S13a and 8b). Nevertheless, wind changes near the grid box between days t−1 and t are small, and air masses have nearly identical source regions (Fig. 8a–b) and source temperatures (Fig. 8m). Accordingly, the contribution of advection to the warming is small and even slightly negative (−0.4 °C); however, there is significant variability between individual events (Fig. 9a). The warming is thus driven by adiabatic and diabatic processes during the 3 d of air mass transport, with increased adiabatic warming due to stronger subsidence within the anticyclonic circulation anomaly at t compared to t−1, contributing +2.4 °C (Figs. 8i, m, 9a). Near the surface, the descent weakens, allowing substantial diabatic warming likely linked to surface sensible heat fluxes, which further elevate surface temperatures (Fig. 8q) and contribute approximately +3.4 °C to the temperature change. Overall, warm advection plays a negligible role for DTDT warming events during the historical period, which are instead driven by increasing descent and diabatic heating (Fig. 9a). However, note that the roles of advection and adiabatic processes in CESM–LE are reversed and are larger in magnitude than in ERA5 (Fig. S5c in Part 1). Nevertheless, according to ERA5, diabatic warming is the primary contributor to DTDT warming events, with a magnitude nearly equal to that in CESM–LE.
In the future climate scenario, the synoptic pattern resembles that of the historical climate, albeit with subtle changes. DTDT warming events are linked to smaller positive SLP anomalies and a weakened anticyclonic circulation over the West Coast at t−1 (Fig. 7e, i). This goes along with a further reduction in the transport of oceanic air masses and increases the presence of northerly and localised air masses near the target grid point at t−1 (Fig. 8e). By day t, the anticyclonic anomaly centered over the grid point is also weaker (Fig. 7f, j) and air mass origins shift northward (Fig. 8f). Although there is a slight shift towards warm air advection (Fig. 8m, n), contributing approximately +0.7 °C to the projected change in DTDT magnitude, it does not compensate for the overall reduction (Fig. 9c). The primary driver of the projected decline in DTDT warming is a significant decrease in adiabatic warming (−1.2 °C) due to a smaller mean descent of air masses (by −11 hPa) particularly on the day of the event (Fig. 8i, j), which is linked to a weakening of the anticyclonic anomaly at 500 hPa described above (see again Figs. 7j, S13c). Surface diabatic heating plays a secondary role. Since changes in heating are slightly greater on day t−1 than on day t, it contributes an additional −0.3 °C to the overall reduction (Fig. 8r). Thus, the decline in adiabatic warming, combined with a modest reduction in surface diabatic heating, is the key factor decreasing the magnitude of DTDT warming events under future climate conditions (Fig. 9c). However, when considering only the last day before arrival, the changes in diabatic heating are the main factor weakening the DTDT warming (by −0.9 °C), while adiabatic warming changes are weaker and of opposite sign (+0.3 °C). This suggests that the process decomposition of DTDT warming events over western North America depends on the temporal limits of the analysis.
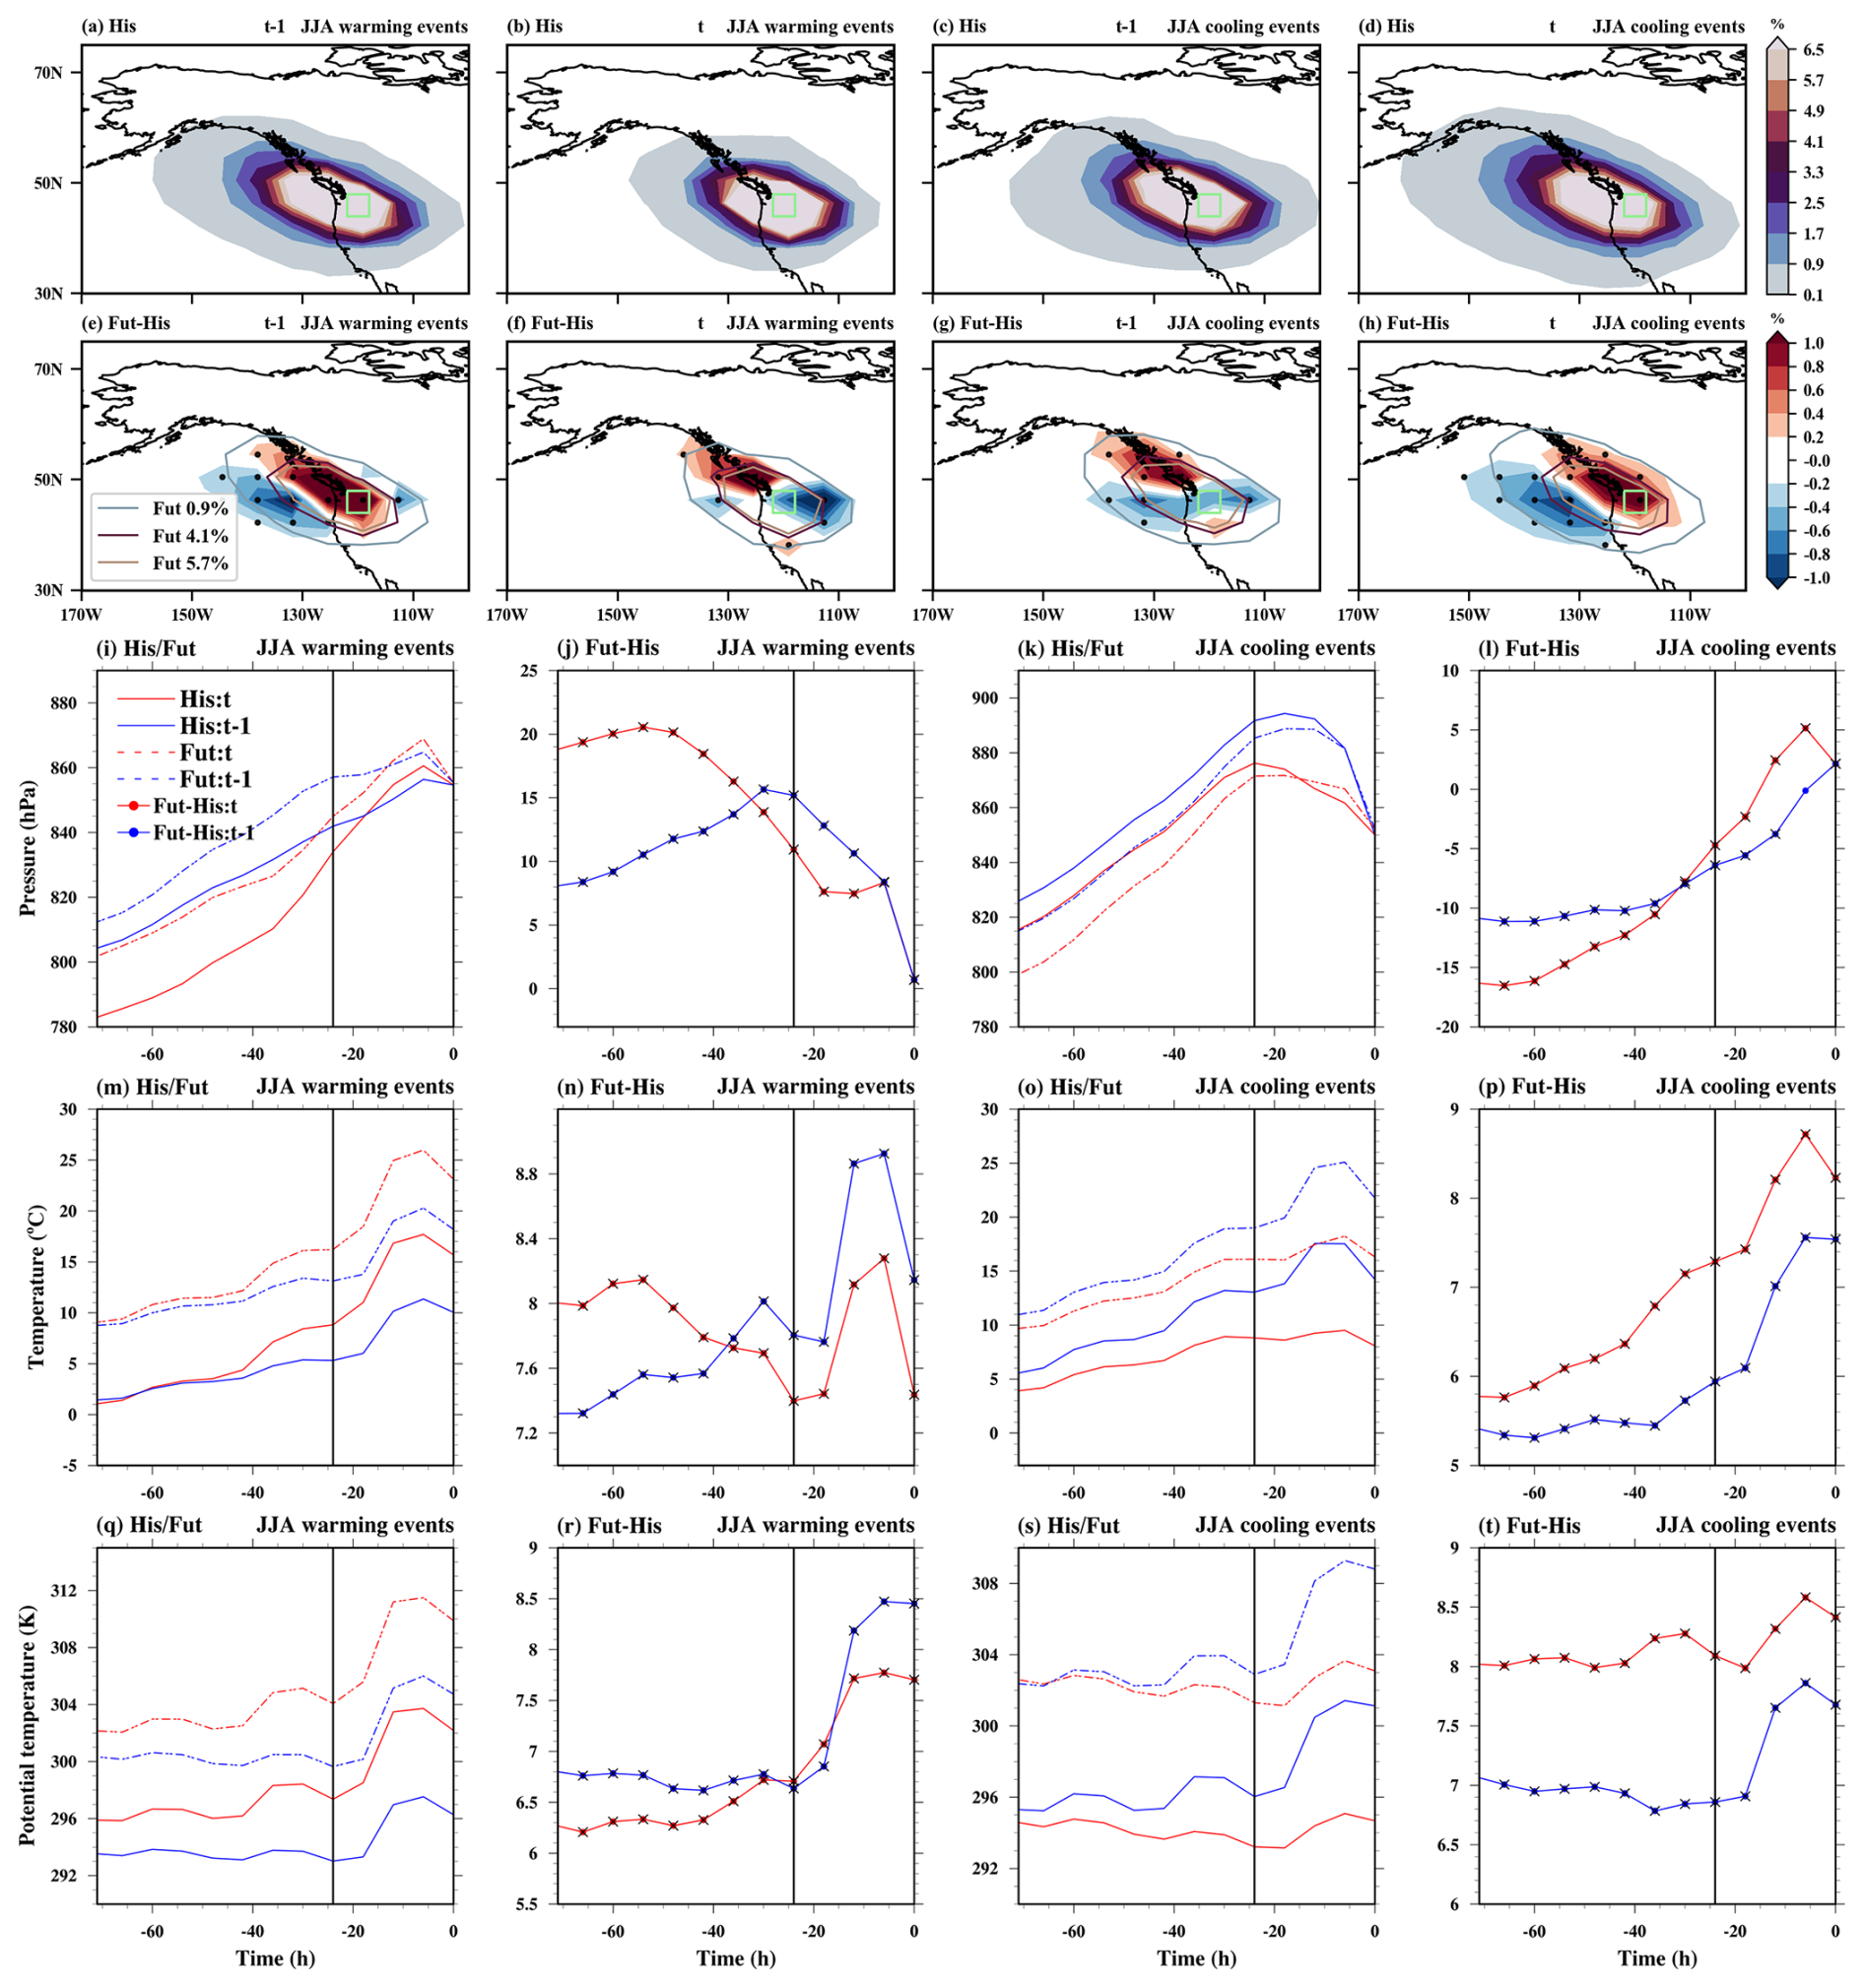
Figure 8The spatial distribution of trajectory density initiated on the previous day (t−1) and the event day (t) is depicted for both June–August (JJA) warming and cooling events over western North America (green box). Color shading shows the air mass density (%) during the 3 d before arriving at the target grid box for (a–d) historical climate and (e–h) projected change. In (e)–(h), stippling areas indicate where the ensemble mean of density differences exceeds the 95 % confidence threshold based on a t-test. The contours outline the 0.9 %, 4.1 %, and 5.7 % levels of future trajectory density. The mean Lagrangian evolution of distinct physical parameters (pressure, temperature, and potential temperature) is shown along the air mass trajectories initialised on the previous and event days for historical/future extreme events (1st and 3rd columns) and projected changes in extremes (2nd and 4th columns). Additionally, bold circles with crosses show where the ensemble mean differences at each timestep exceed the 95 % confidence threshold based on a t-test.
During historical DTDT cooling events, an anticyclonic circulation anomaly at 500 hPa over and to the east of the selected grid box at day t−1 shifts further eastward and is replaced by an eastward–moving cyclonic anomaly from the Pacific Ocean on the day of the event (Fig. 7c–d). This is accompanied by an eastward shift of a negative SLP anomaly and stronger westerly winds on the southern flank of the cyclonic anomaly reaching the grid box on day t, such that the density distribution of air masses extends further into the western Pacific region compared to t−1 (Fig. 8c–d). As a result, a slight shift towards cold air advection leads to an average temperature drop of −1.6 °C (Figs. 8o, 9b). This advective cooling is partly offset by a modest increase in adiabatic warming (+1 °C) due to stronger air mass descent on the day of the event (Fig. 8k, o). However, the main factor driving the DTDT decrease is reduced diabatic heating near the surface on day t relative to t−1 (Fig. 8s), mainly on the last day before the trajectories arrive (Fig. 9b), with a mean contribution of −5.5 °C. These processes are similar in ERA5, but CESM–LE overestimates adiabatic and diabatic contributions and underestimates advection in its representation of DTDT cooling events (see Fig. S5d in Part 1).
In projected DTDT cooling events, the configuration of circulation anomalies remains similar to present–day, but their magnitude significantly weakens (Fig. 7g–h, k–l). At t−1, air masses mainly originate from the north with a slight oceanic extension, whereas by day t they shift towards the continent, accompanied by a significant reduction in oceanic air masses due to weakened westerly winds, which are linked to a weakening of the southern flank of the cyclonic anomaly (Fig. 8g–h, k–l, and S13d). Together, this leads to a future reduction in the temperature difference between days t−1 and t at the air mass origin (Fig. 8o, p), thereby reducing the contribution of cold air advection to the DTDT cooling by approximately +0.4 °C (Fig. 9d). The cooling is further suppressed by increased adiabatic warming (+0.7 °C), linked to stronger mean ascent (by 6 hPa) at day t (Fig. 8l, o). Near the surface, diabatic cooling is projected to increase slightly by −0.3 °C in the future (Fig. 8s, t). Therefore, future reductions in DTDT cooling events are mainly driven by reduced advection and further increases in adiabatic warming, with changes in diabatic cooling playing only a minor role (Fig. 9d).
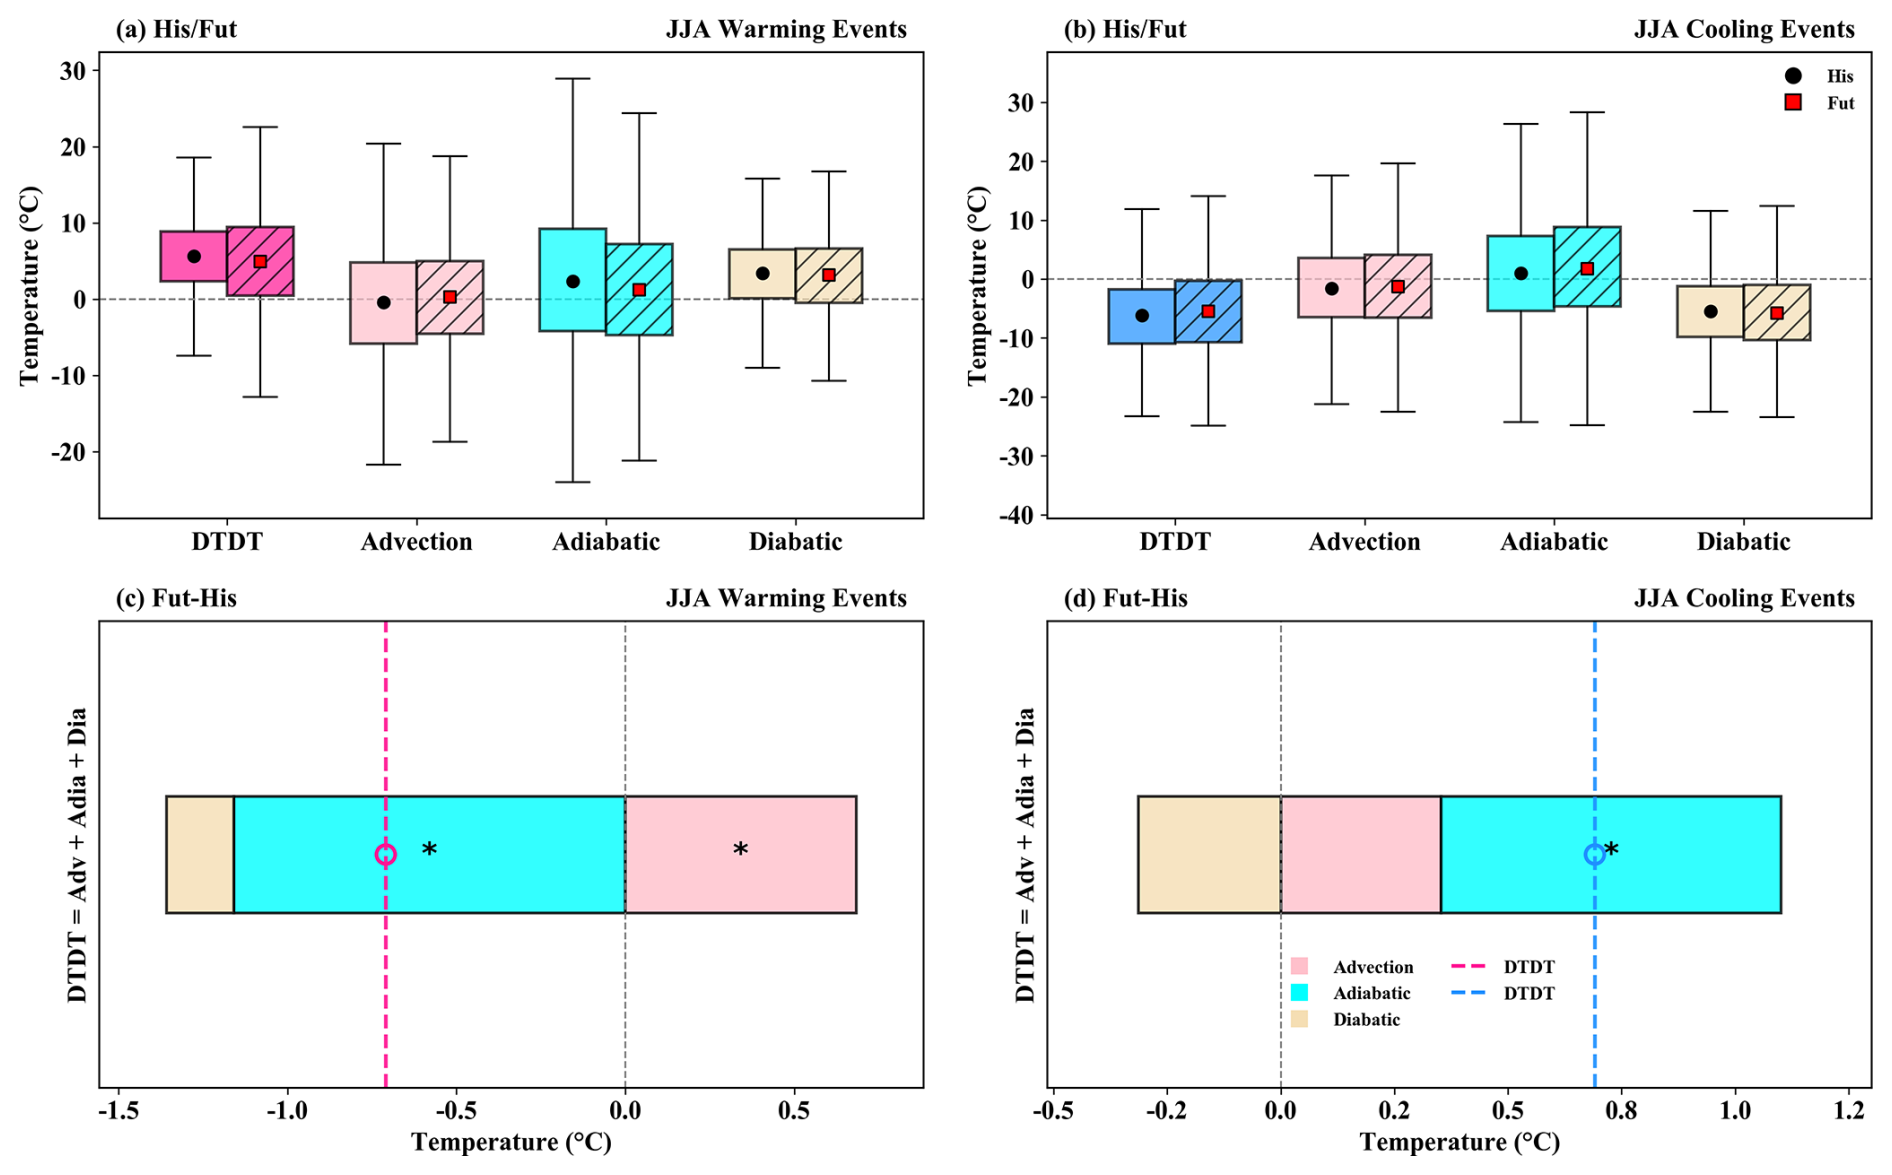
Figure 9The contribution of the different physical processes (advection, adiabatic and diabatic temperature change) over western North America during June–August (JJA) to the genesis of DTDT (a, c) warming and (b, d) cooling events during historical/future climate (a–b, box plots) and projected change (c–d, stacked plots) according to Eq. (2), which refers to a 3 d-time scale. The box spans the 25th and 75th percentiles of the trajectory data; the black dot/red square inside the box gives the mean of the related quantities in the historical/future climate, and the whiskers indicate 1.5 times the interquartile range in panels (a) and (b). The dotted lines in the stacked plots in panels (c) and (d) show the mean future change for DTDT warming and cooling events, respectively, and coloured bars indicate the contributions of the individual processes. Circle and ∗ symbols mark future change distributions for which the ensemble means differences exceed the 95 % confidence threshold based on a t-test.
3.2.2 Projected intensification of extreme DTDT changes
During DJF, many tropical regions (the Amazon, southern Africa, and maritime continents) are projected to experience an increase in extreme DTDT changes compared to the historical climate. To investigate the mechanisms behind extreme DTDT changes, we focus on a specific location in tropical South America (Figs. 10–12; see Figs. S17–18 for another location in tropical southern Africa).
In the CESM historical simulation, air masses at −3 d cluster around the selected target grid box, indicating that local conditions mainly drive DTDT changes (Fig. 10a–d), similar to the ERA5 analysis (see Fig. 9a–d in Part 1). During warming events, the temperature and pressure evolution along the backward trajectories is very similar for trajectories initialised at t−1 and t between 3 and 1 d before reaching the target location (Fig. 10i and m), while diabatic heating within the last 24 h plays a significant role for the DTDT increase (Fig. 10q). Therefore, we analyse the physical processes on a 1 d time scale (Fig. 11a), in contrast to the 3 d–analysis presented above for the extratropics. Composite precipitation and cloud cover are further analysed in Fig. 12 to explore these local diabatic effects. On day t−1, significant precipitation (5–8 mm d−1) and high cloud cover (80 %–90 %) reduce solar radiation and thus diabatic heating, leading to lower temperatures. Conversely, on day t, decreased precipitation (≤4 mm d−1) and less cloud cover (70 %–80 %) enhance diabatic heating, contributing to higher temperatures (Figs. 10m, 12b). This shift from wet and cloudy to dry and less cloudy conditions highlights the role of albedo changes and solar heating in driving a +2 °C increase over 1 d, along with enhanced diabatic heating (+2.2 °C; Fig. 11a). The magnitudes of DTDT warming events in ERA5 and CESM–LE are nearly identical, reflecting a similar scale of diabatic heating but an underestimation of the adiabatic contribution in CESM-LE (see also Fig. 9k in Part 1 and Fig. 11a).
The localized patterns persist during future DTDT warming events, with high air particle densities at −3 d continuing to cluster in the grid box and towards its northeast (reduced in the South) on both days (Fig. 10e–f). Thus, changes in remote advection and adiabatic warming play only a minor role in future DTDT changes (Figs. 10j, n and 11c). The projected warming is primarily driven by diabatic heating (nearly +1 °C) near the surface over the last 24 h, emphasising the enhanced role of radiative heating (Figs. 10r and 11c). This finding is further supported by a significant increase in precipitation and cloud cover on day t−1, which, however, subsequently decreases on day t, contributing to the intensified DTDT warming in the future climate (Fig. 12i–j). Also, for tropical Southern Africa (Fig. S17c) and Southeast Asia (not shown), the intensification of DTDT warming events is mainly driven by diabatic heating.
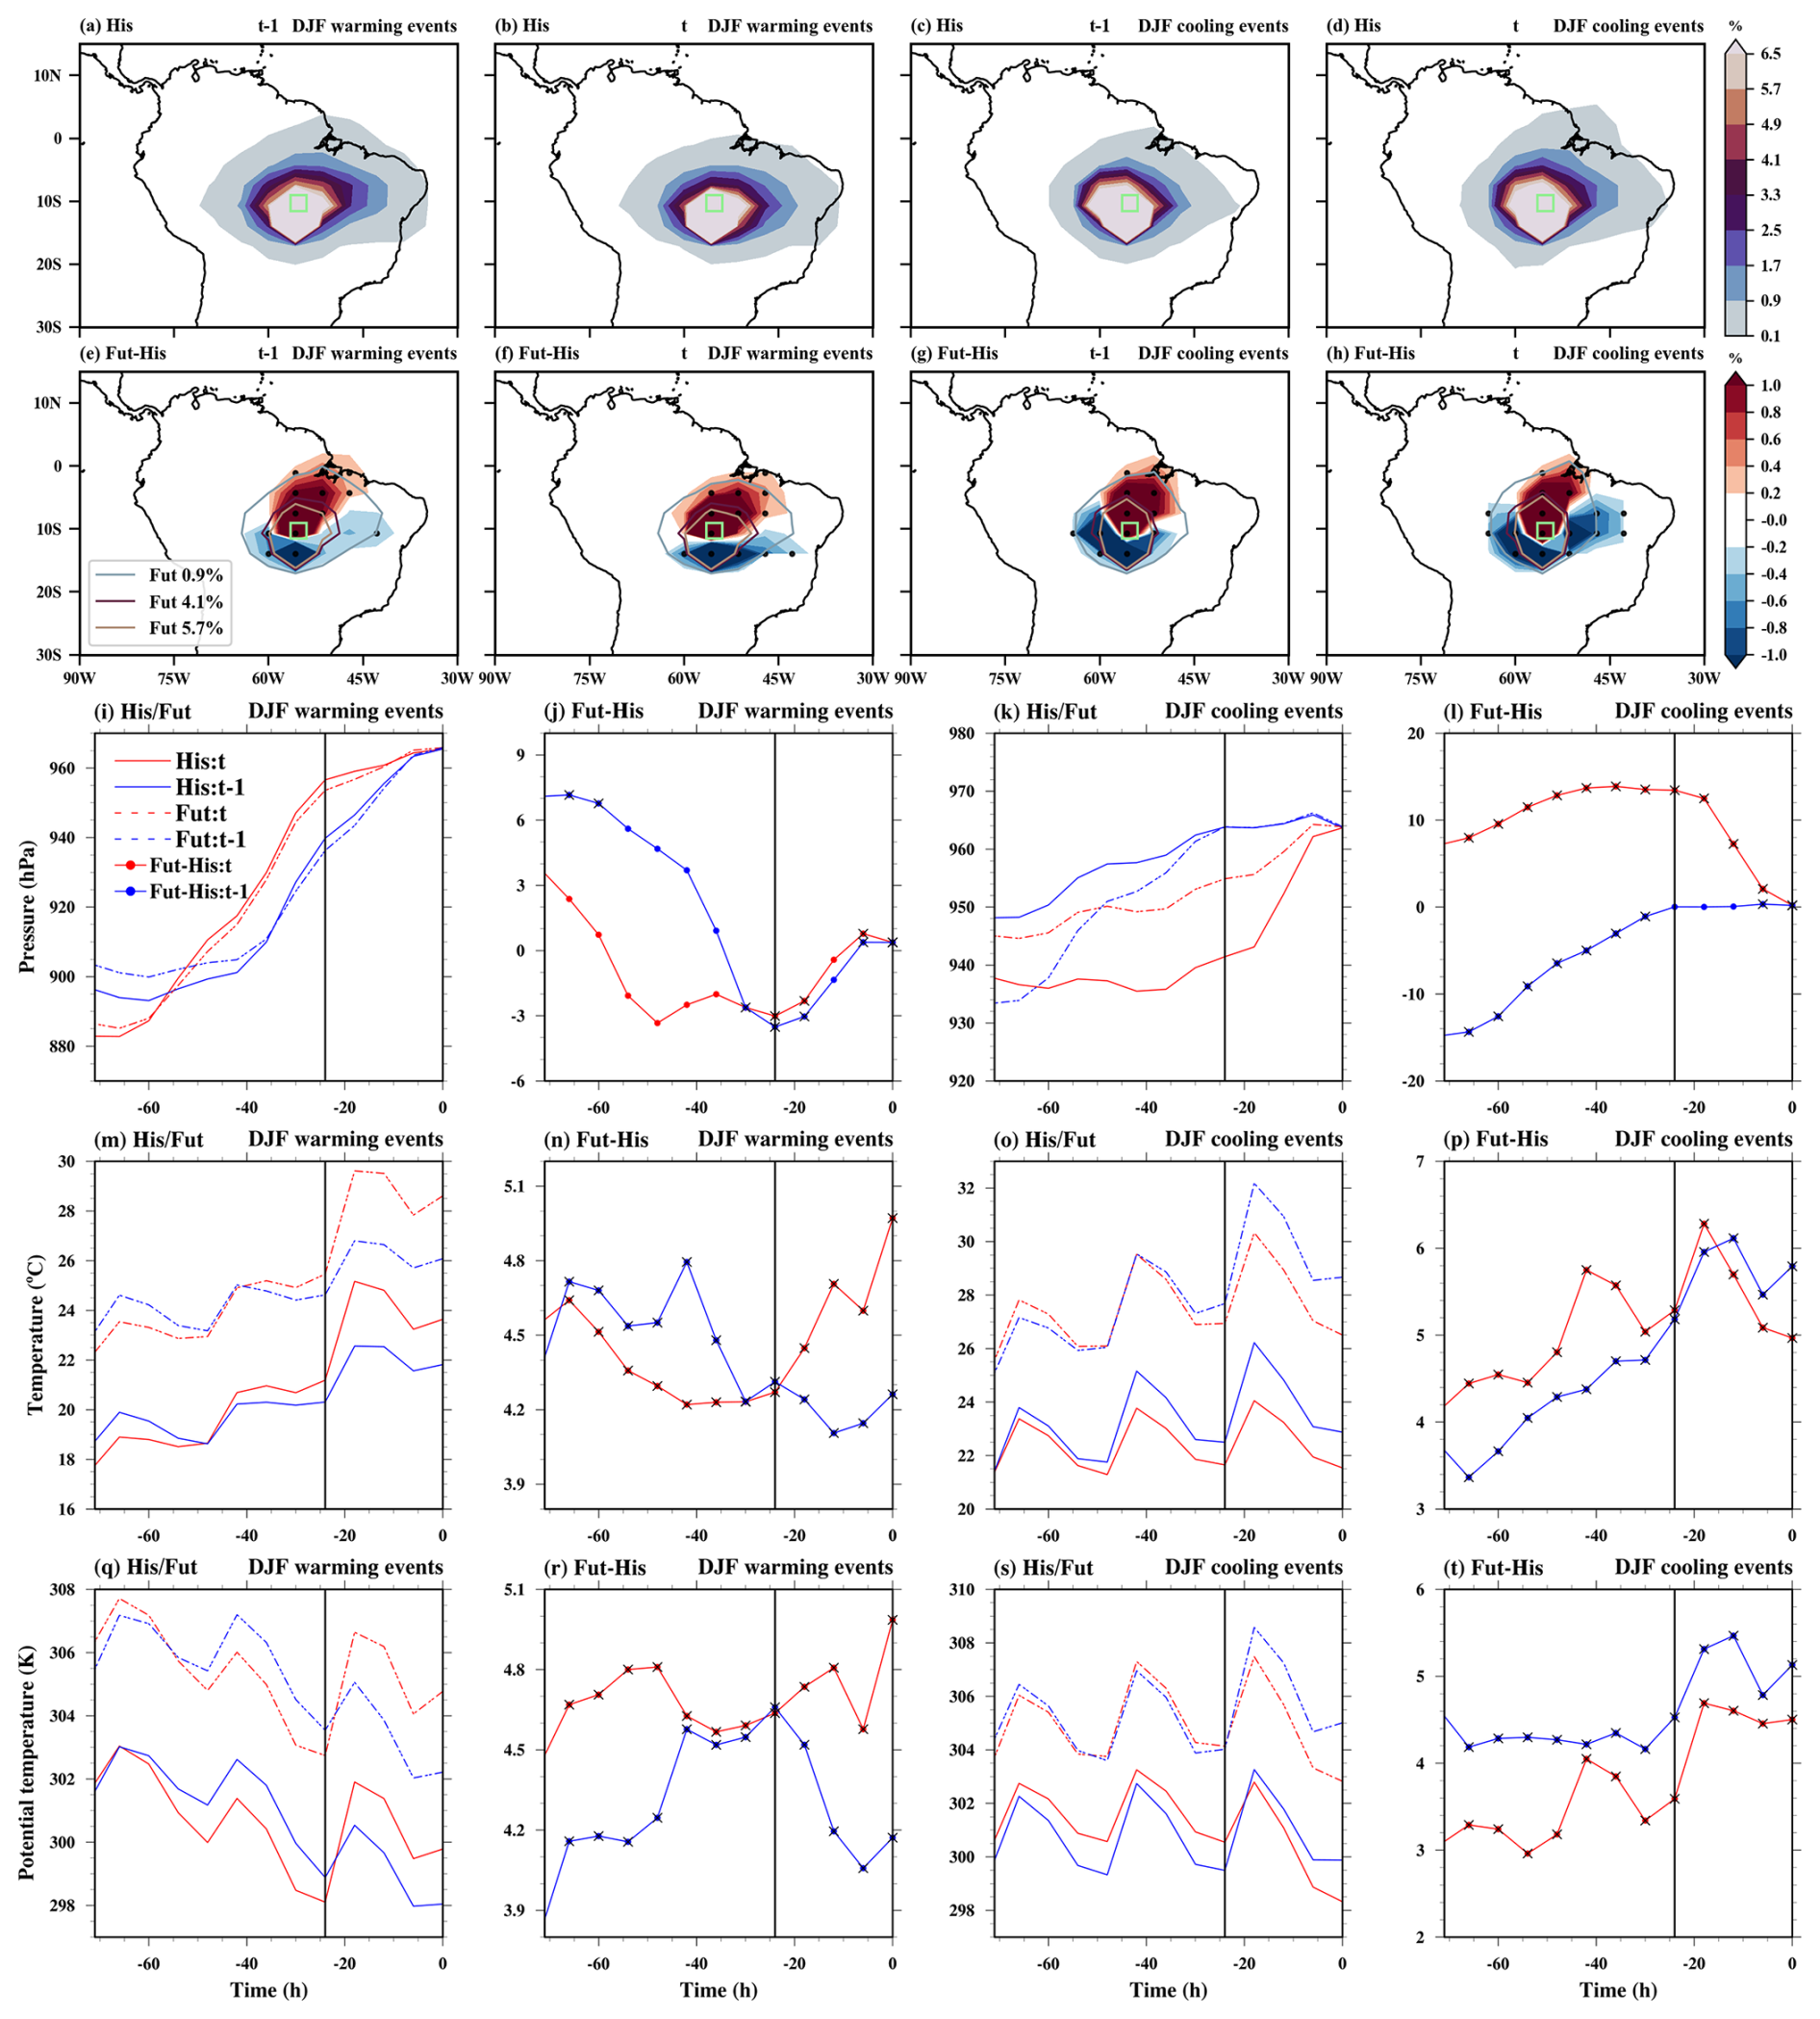
Figure 10The spatial distribution of trajectory density initiated on the previous day (t−1) and the event day (t) is depicted for both December–February (DJF) warming and cooling events over tropical South America (green box). Color shading shows the air mass density (%) during the 3 d before arriving at the target grid box for (a–d) historical climate and (e–h) projected change. In (e)–(h), stippling areas indicate where the ensemble mean of density differences exceeds the 95 % confidence threshold based on a t-test. The contours outline the 0.9 %, 4.1 %, and 5.7 % levels of future trajectory density. The mean Lagrangian evolution of distinct physical parameters (pressure, temperature, potential temperature) is shown along the air mass trajectories initialised on the previous and event days for historical/future extreme events (1st and 3rd columns) and for projected changes in extremes (2nd and 4th columns). Additionally, bold circles with crosses show where the ensemble mean differences at each timestep exceed the 95 % confidence threshold based on a t-test.
Also, for the historical DTDT cooling events, the distribution of air masses on both days is concentrated around the grid box, with remote advection and adiabatic heating playing little role for the temperature decrease (Figs. 10c–d, k, o, s, 11b). These events are primarily driven by local diabatic effects near the surface in the 24 h preceding the arrival of the air masses at the target location, with magnitudes comparable to those in the ERA5 reanalysis, but biases in the adiabatic contribution (see Fig. 9l in Part 1). Similar to DTDT warming events, on day t−1, precipitation (8–10 mm d−1) and cloud cover (70 %–80 %) are smaller, leading to increased diabatic heating and higher temperatures, compared to the larger precipitation (>10 mm d−1) and cloud cover (80 %–90 %) on day t, which result in decreased diabatic heating and lower temperatures (Figs. 11b and 12c–d). This transition from dry, less cloudy to wet, cloudy conditions highlights the significant role of changes in albedo and solar heating in driving surface diabatic cooling.
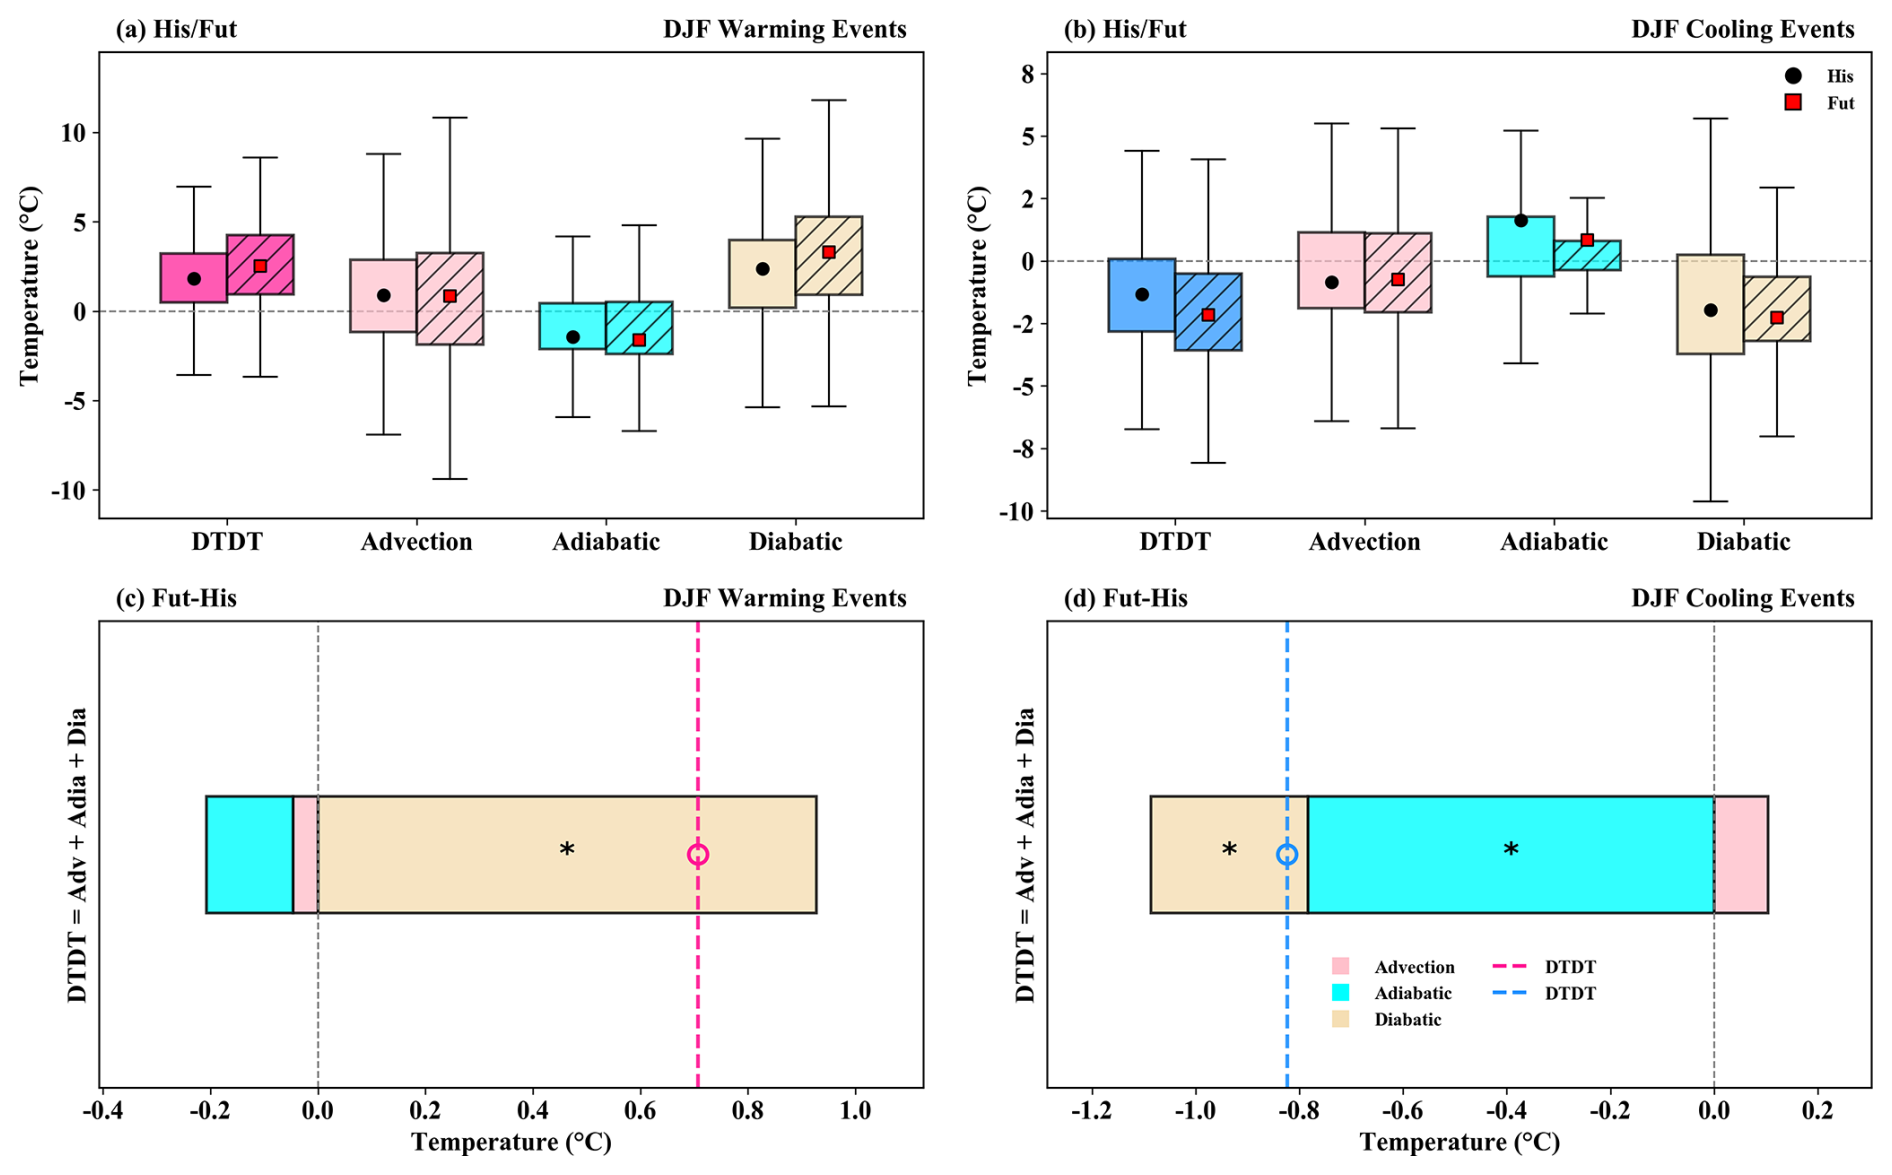
Figure 11The contribution of the different physical processes (advection, adiabatic and diabatic temperature change) over tropical South America during December–February (DJF) to the genesis of DTDT (a, c) warming and (b, d) cooling events during historical/future climate (a–b, box plots) and projected change (c–d, stacked plots) according to Eq. (2), which refers to a 1 d–time scale. The box spans the 25th and 75th percentiles of the trajectory data; the black dot/red square inside the box gives the mean of the related quantities in the historical/future climate, and the whiskers indicate 1.5 times the interquartile range in panels (a) and (b). The dotted lines in the stacked plots in panels (c) and (d) show the mean future change for DTDT warming and cooling events, respectively, and coloured bars indicate the contributions of the individual processes. Circle and ∗ symbols mark future change distributions for which the ensemble means differences exceed the 95 % confidence threshold based on a t-test.
In future DTDT cooling events, local effects are projected to remain dominant, with increased air particle densities around the grid box and its north (reduced in the southeast) compared to the historical climate (Fig. 10g–h). While the contributions of changes in advection to the future intensification of DTDT cooling are small, a reversal in the role of adiabatic warming is the primary factor for this intensification (Fig. 11d). In contrast to the historical climate, in which a stronger descent and adiabatic warming on day t compared to t−1 slightly offsets the diabatically–driven cooling (Figs. 10k, 11b), in the future, the ascent and adiabatic warming are projected to weaken on day t, leading to increased cooling (Fig. 10l, p). In addition, an intensification of diabatic cooling (Figs. 10t, 11d) associated with a marked decline in precipitation and cloud cover on day t−1, followed by an increase on day t (Fig. 12k–1), further enhances DTDT cooling. A consistent pattern is also evident in Southeast Asia (not shown). A synergy between adiabatic and diabatic processes, albeit with a larger contribution from diabatic changes, leads to future intensification of DTDT cooling events over tropical Southern Africa (Fig. S17d).
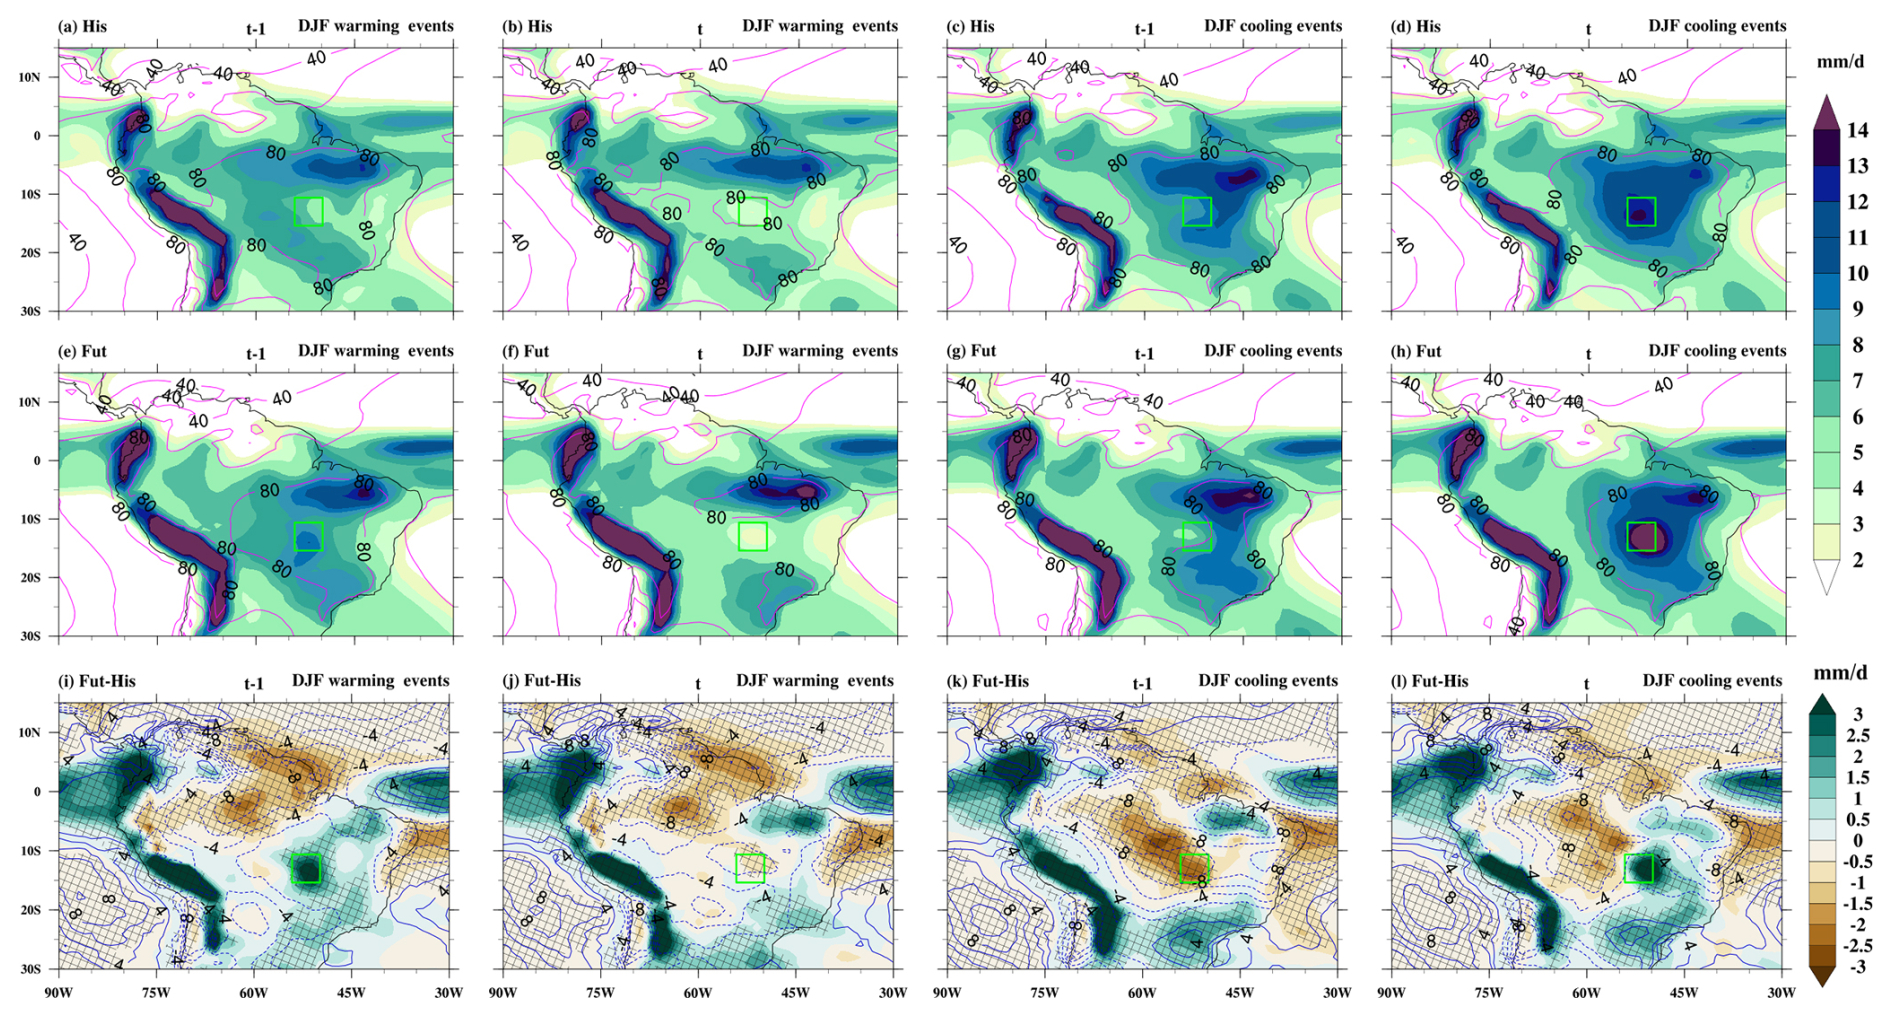
Figure 12Composite of absolute total precipitation (mm d−1, colour shading) and total cloud cover (%, magenta and blue contours) on the previous (t−1) and event (t) days of warming and cooling events during December–February (DJF) over tropical South America. The top panel displays ensemble means for the (a–d) historical climate (His), (e–h) future climate (Fut), and (i–l) projected change (Fut–His). The green box represents the study grid box, and the cross–hatching area in (i)–(l) indicates that the ensemble mean of the total precipitation differences exceeds the 95 % confidence threshold based on a t-test. The green and brown shading illustrate increases and decreases in total precipitation, respectively, while blue bold and dotted contours represent increases and decreases in total cloud cover (in i–l).
During JJA, some sub–tropical and mid–latitude regions, such as the Sahel, parts of Europe, Southern Asia, Central America, and the Amazon, are projected to experience an increase in extreme DTDT changes relative to the historical climate. To study the underlying atmospheric circulation and physical processes, we select a grid box over central Europe (Figs. 13–15). Further examples for locations in the subtropics (Figs. S19–S21) and midlatitudes (Figs. S22–S24) are shown in the Supplement.
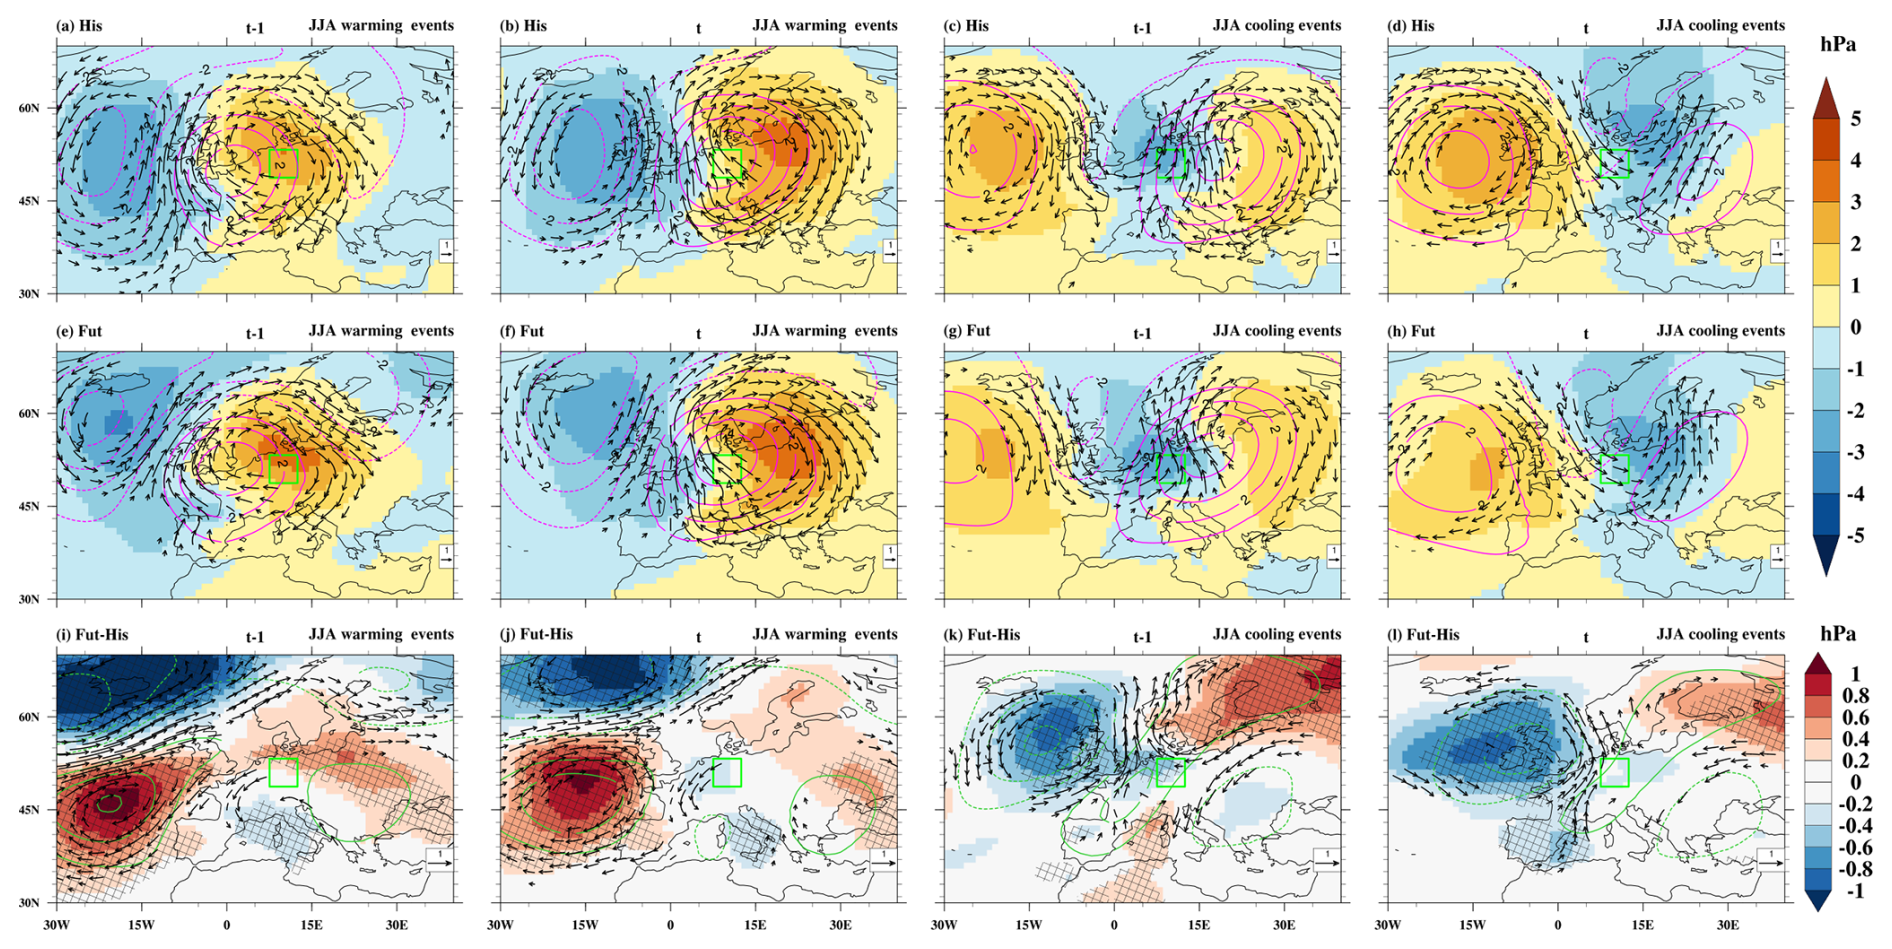
Figure 13Composite of sea level pressure anomalies (hPa, color shading), wind anomalies at 850 hPa (m s−1, vectors), and geopotential height anomalies at 500 hPa (gpm, magenta and darkgreen contours) relative to the seasonal mean on the (a, e, i, c, g, k) previous day (t−1) and (b, f, j, d, h, l) event day (t) of the warming (a–b, e–f and i–j) and cooling (c–d, g–h and k–l) events during June–August (JJA) in (a–d) historical climate (His), (e–h) future climate (Fut), and (i–l) projected changes (Fut–His) at a selected grid box in central Europe (green box). Note that, in (a)–(h), wind vector anomalies ≥3 m s−1 and in (i)–(l), wind vector difference anomalies ≥0.5 m s−1 are plotted. The dotted and bold contours indicate negative and positive geopotential height anomalies, respectively. Additionally, the cross–hatching area shows where the ensemble mean of sea level pressure differences exceeds the 95 % confidence threshold based on a t-test.
During JJA warming in central Europe in the historical CESM–LE simulations, a mature trough–ridge anomaly pattern shifts southeastward from day t−1 to t (Figs. S19a, 13a–b), bringing central Europe under the influence of southeasterly winds and warm continental air masses on the event day (Fig. 14a–b), which aligns with the ERA5 synoptic pattern (see Figs. 6a–c and S6a–b in Part 1). This transition enhances warm air advection (Fig. 14m), which plays a crucial role in driving the temperature increase, resulting in an average temperature rise of +3.2 °C (Fig. 15a). In contrast, adiabatic warming makes a minor negative contribution, averaging −0.3 °C, due to slightly more substantial subsidence on day t−1 than on day t (Fig. 14i, m). However, the effect of adiabatic warming varies considerably across individual events, shown by the bars and whiskers (Fig. 15a). Enhanced diabatic heating contributes an average of +2.5 °C to the DTDT increase, with a more pronounced rise in potential temperature on day t than on day t−1 (Fig. 14q). Overall, warm air advection and diabatic heating are the primary contributors to DTDT warming events, with adiabatic warming playing a minor role in the historical climate (Fig. 15a). A quantitative comparison reveals that CESM–LE indicates contributions from advection and diabatic heating similar to those of ERA5, but the adiabatic warming is slightly underestimated (see Fig. 7k, Part 1).
In general, the synoptic–scale flow pattern associated with future DTDT warming events resembles the historical pattern (Fig. 13e, f). Notable differences are nonetheless evident upstream over the North Atlantic, where the low-pressure anomaly weakens in future projections (Fig. S19c). Concurrently, the adjacent continental ridge experiences a structural reorganisation: its southwestern branch weakens, while the northeastern branch slightly intensifies and shifts eastward at day t (Fig. 13i–j). Collectively, these circulation changes reduce the inflow of southwesterly maritime air masses and shift toward continental sources, contributing to enhanced DTDT warming (Figs. 14e–f, S19c). These subtle changes in circulation patterns result in a modest increase in warm–air advection, contributing approximately +0.5 °C to the DTDT change (Fig. 15c). Meanwhile, vertical descent intensifies on day t−1 (by ∼5 hPa) but diminishes notably on day t (by ∼10 hPa), leading to a negative adiabatic warming contribution that offsets the DTDT increase by −1.1 °C (Fig. 14j, n). Conversely, diabatic heating increases on both days compared to the historical period, with a greater increase on day t (Fig. 14r). This intensified diabatic heating adds +1.9 °C to the DTDT change. Overall, the combined effect of slightly increased warm air advection and amplified diabatic heating – despite being partly offset by enhanced adiabatic warming – appears to be the main factor driving the projected intensification of DTDT warming events (Fig. 15c). A similarly important role of diabatic heating intensification is also evident in future DTDT warming events over the selected subtropical regions: Southern Asia and the Sahel (Figs. S20–S21), as well as in Central America and northern Amazon (not shown). In contrast, changes in advection are more significant for events in mid-latitudes: southern South Africa, Northern Asia, Southern Australia (Figs. S22–S24), and northern Europe (not shown).
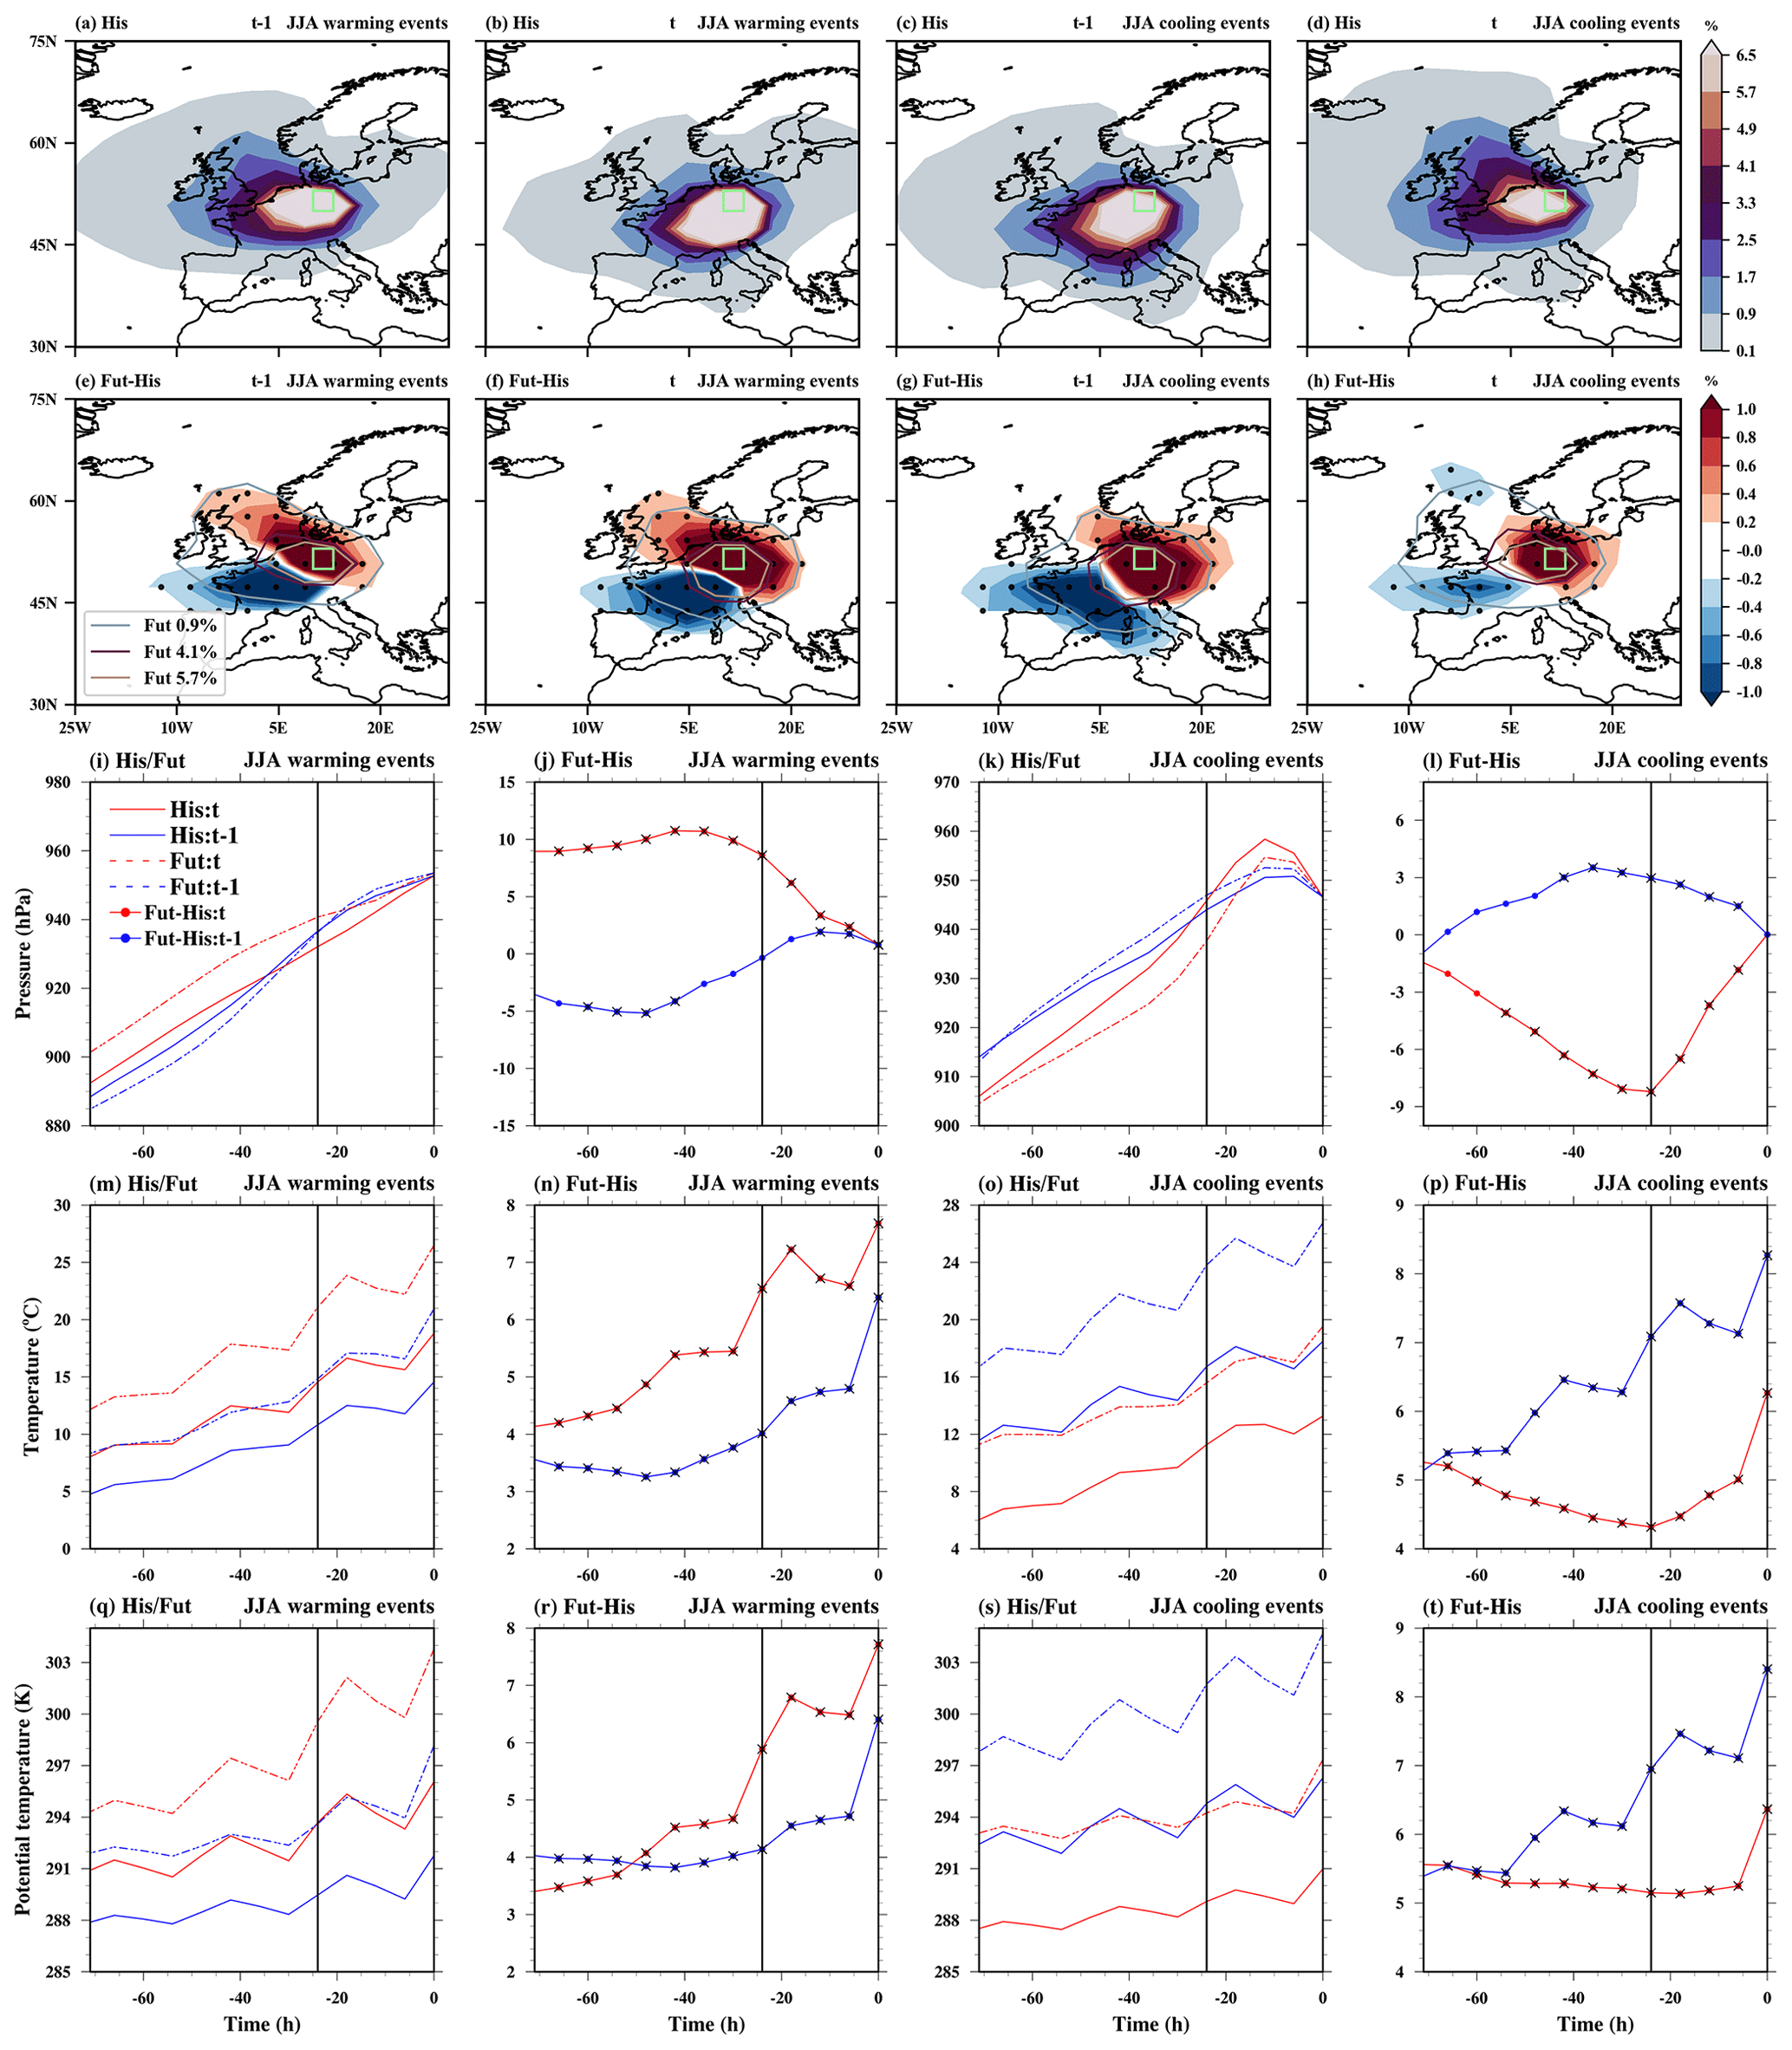
Figure 14The spatial distribution of trajectory density initiated on the previous day (t−1) and the event day (t) is depicted for both June–August (JJA) warming and cooling events over central Europe (green box). Color shading shows the air mass density (%) during the 3 d before arriving at the target grid box for (a–d) historical/future climate and (e–h) projected change. In (e)–(h), stippling areas indicate where the ensemble mean of density differences exceeds the 95 % confidence threshold based on a t-test. The contours outline the 0.9 %, 4.1 %, and 5.7 % levels of future trajectory density. The mean Lagrangian evolution of distinct physical parameters (pressure, temperature, and potential temperature) is shown along the air mass trajectories initialised on the previous and event days for historical/future extreme events (1st and 3rd columns) and projected changes in extremes (2nd and 4th columns). Additionally, bold circles with crosses show where the ensemble mean differences at each timestep exceed the 95 % confidence threshold based on a t-test.
During JJA cooling events in the historical climate, there is a transition from warm continental air masses to colder maritime air masses, coinciding with the development and eastward shift of a North Atlantic ridge (Figs. 13c–d, 14c–d and S19b). This cold air advection causes an average decline in surface temperature of −5.5 °C (Figs. 14o, 15b). The cooling is partly offset by a modest increase in adiabatic warming (∼0.7 °C), driven by stronger descent of air masses on day t (Fig. 14k, o). Additionally, reduced diabatic heating contributes a further temperature drop of −0.5 °C (Fig. 14s). Overall, strong cold air advection and slightly reduced diabatic heating are the main drivers of DTDT cooling events over central Europe under historical conditions (Fig. 15b), which also agrees with the ERA5 reanalysis (see Fig. 7l in Part 1). In the CESM–LE, the contributions from advection and adiabatic warming are somewhat smaller, but the diabatic contribution is similar to that in ERA5.
For projected DTDT cooling events, on both days, the synoptic atmospheric circulation over the continent remains largely similar to that in the historical climate (Fig. 13c–d, g–h). Nevertheless, notable changes are expected along the North Atlantic ridge. The high-pressure anomaly weakens at both the surface and 500 hPa (Fig. S19d), and an eastward shift of the ridge becomes evident at day t (Fig. 13k–l). Regarding air-mass origins, a reduction in southwesterly maritime air masses and a concurrent increase in continental northeasterly air masses are evident, both more pronounced on day t−1 than on day t (Figs. 13k–l, and 14g–h). Together, these changes slightly reduce the contribution of horizontal temperature advection to the cooling signal (+0.3 °C). Projected changes in adiabatic warming are negligible (Figs. 14l, 15d), such that changes in diabatic heating are the primary contributor to the future DTDT cooling (−2.2 °C) intensification, which results from a much stronger intensification of the diabatic heating of air masses on day t−1 compared to day t (Figs. 14t, 15d). Changes in diabatic heating are also the main driver of the future intensification of DTDT cooling over Southern Asia, the Sahel, Northern Asia (Figs. S20–21, S23), Central America, the northern Amazon, and Northern Europe (not shown). Either advection or all processes contribute more equally to events over southern South Africa, Northern Asia, and Southern Australia (Figs. S22–S24).
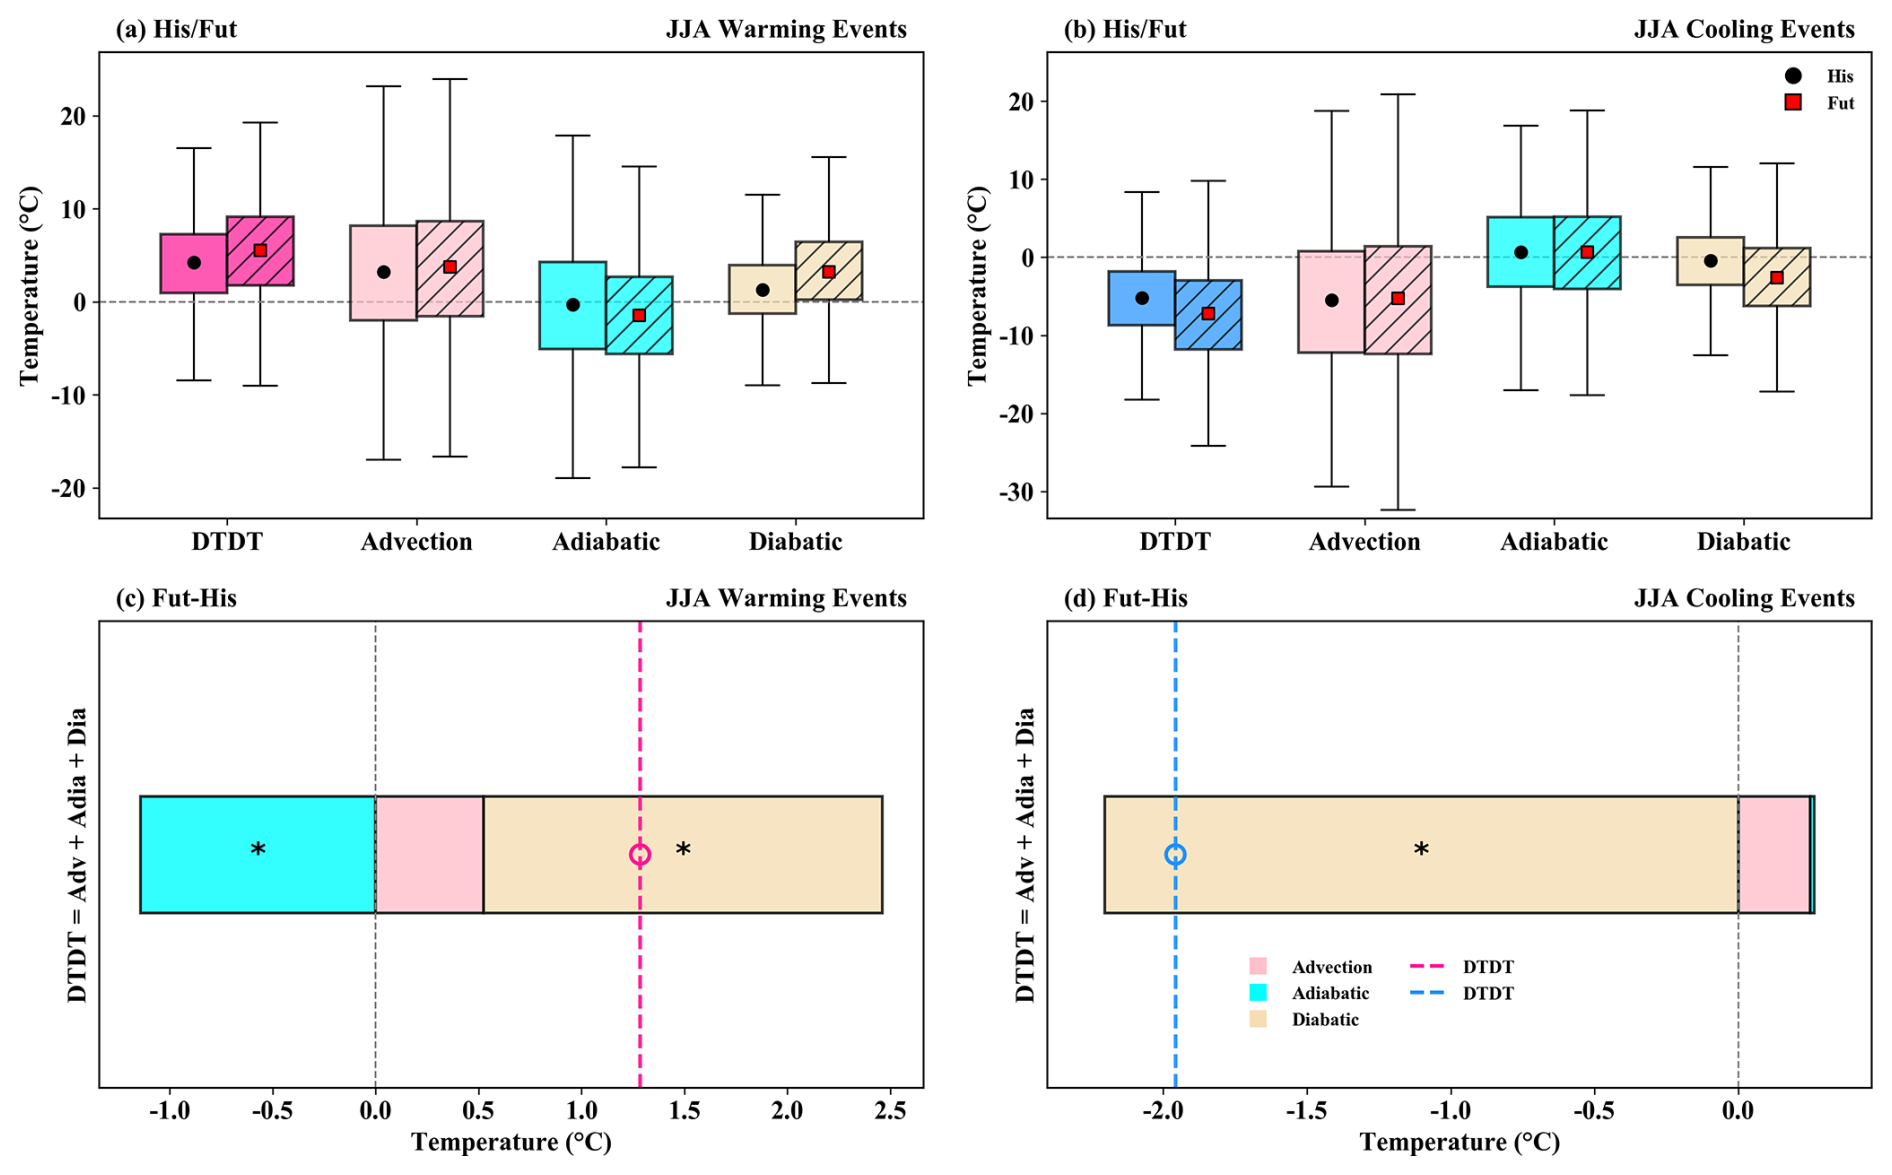
Figure 15The contribution of the different physical processes (advection, adiabatic and diabatic temperature change) over central Europe during June–August (JJA) to the genesis of DTDT (a, c) warming and (b, d) cooling events during historical/future climate (a–b, box plots) and projected change (c–d, stacked plots) according to Eq. (2), which refers to a 3 d-time scale. The box spans the 25th and 75th percentiles of the trajectory data; the black dot/red square inside the box gives the mean of the related quantities in the historical/future climate, and the whiskers indicate 1.5 times the interquartile range in panels (a) and (b). The dotted lines in the stacked plots in panels (c) and (d) show the mean future change for DTDT warming and cooling events, respectively, and coloured bars indicate the contributions of the individual processes. Circle and ∗ symbols mark future change distributions for which the ensemble means differences exceed the 95 % confidence threshold based on a t-test.
This study has examined historical patterns and projected changes in extreme DTDT variations and their underlying physical processes based on the CESM–LE, a large single–model ensemble designed to understand Earth system variability and global change (Kay et al., 2015). Our results from the CESM–LE in the historical climate indicate that DTDT variations and extremes are more pronounced in the extratropics than in the tropics during both DJF and JJA, consistent with the ERA5 reanalysis (see also Figs. 1–3 in Part 1). A comparison of CESM–LE and ERA5 reanalysis results reveals notable regional differences in magnitude, particularly an overestimation in mid- to high latitudes and Southeast Asia during DJF, and in some subtropical areas during JJA. The differences in daily standard deviations align with patterns observed in other models from the CMIP5 and CMIP6 initiatives (Bathiany et al., 2018; Giorgi and Raffaele, 2022). The larger magnitude of σDTDT in CESM–LE is due to both higher daily standard deviations and lower autocorrelation compared to ERA5, and vice versa for the smaller magnitude of σDTDT, particularly in tropics and subtropics (Fig. S1). The overestimation of extremes, particularly in the extratropics during DJF, often results from diabatic processes, consistent with recent studies suggesting that the overestimation of daily temperature extremes is driven by amplified diabatic heating from sensible heat fluxes (Röthlisberger et al., 2025). Simpson et al. (2022) argue that, at higher latitudes, this is partly due to the limited representation of snow density, which affects the thermal conductance of the snow layer. In contrast, the underestimation in the tropics is primarily associated with biases in the adiabatic contribution and, consequently, in vertical motion, likely stemming from an inadequate representation of convective and turbulent processes (Bergman and Sardeshmukh, 2004; Bao and Stevens, 2021; Stohl, 1998). Similarly, the widespread underestimation across most regions during JJA results mainly from a combination of underestimated advective and adiabatic processes. These seasonal and regional biases have important implications for targeted model development and improvement. Nevertheless, the general agreement between the spatial patterns of temperature variability in the CESM–LE and ERA5 increases confidence in future projections.
The projected DTDT variations and extremes reveal distinct seasonal and spatial differences. During DJF, projected DTDT changes are characterised by weakening in mid- to high latitudes and intensification in the tropics. Also, during JJA, most tropical regions exhibit a significant intensification, but the signal in the extratropics is less coherent, with only a few regions, such as Greenland, western North America, eastern North America, and southern South America, experiencing a weakening in the magnitude of DTDT change. These results are similar to those of other recent studies on DTDT variations and extremes (Liu et al., 2025; Wang et al., 2025; Zhou et al., 2020; Xu et al., 2020). Furthermore, these projected changes in temperature variability in CESM–LE are generally similar to those in other CMIP5 and CMIP6 models (Bathiany et al., 2018; Tamarin-Brodsky et al., 2020; Wang et al., 2025; Xu et al., 2020). We further show how the changes in DTDT variations σDTDT can be decomposed into contributions from changes in the standard deviation of daily mean temperature σT and its autocorrelation r1,T. In particular, the projected σDTDT changes are mainly determined by σT changes during DJF and, in most regions, also during JJA. However, in some regions, changes in temporal autocorrelation also affect the magnitude of projected σDTDT change. For example, the projected large increase in σDTDT over the tropics in DJF is due to a reduction in r1, T. Conversely, a decrease in the magnitude of σDTDT over northern mid–latitude locations in JJA is associated with an increase in r1,T. A similar future increase in autocorrelation over longer time scales is projected across these regions by other models (Li and Thompson, 2021), which may be linked to slow–moving weather patterns and the Arctic amplification (Kornhuber and Tamarin-Brodsky, 2021). These results indicate the need to further study projected changes in daily persistence using a multi–model ensemble.
Additionally, we have examined in detail the physical mechanisms driving regional extreme DTDT changes during DJF and JJA using a combination of Eulerian composites and a Lagrangian temperature decomposition into contributions from advection, adiabatic and diabatic temperature changes. This detailed process analysis goes substantially beyond prior studies on extreme DTDT variations (Zhou et al., 2020; Liu et al., 2025). The physical processes found in CESM–LE for historical simulations are generally similar to those in ERA5 (see also Part 1), though with some differences in magnitude. The future weakening of both types of extremes (DTDT warming and cooling) over the extratropics and also in the subtropics (Fig. S12) during DJF is mainly due to a reduced contribution of advection, consistent with previous studies on general aspects of temperature variability (Wang et al., 2025, 2019; Tamarin-Brodsky et al., 2020). These changes are driven by a combination of subtle shifts in circulation patterns and changes in temperature gradients associated with Arctic amplification and changes in land–sea contrast (Figs. S7–S11), leading to a decrease in DTDT variance (Chen et al., 2019; Dai and Deng, 2021; Garfinkel and Harnik, 2017; Screen, 2014; Zhou et al., 2020). For example, during future DTDT warming events over North America, synoptic flow anomalies are weaker and slightly displaced compared to the historical period, and are associated with a stronger southwesterly flow anomaly on day t−1 than on day t. Additionally, the projected temperature increase is greater over the more poleward air mass origins on day t−1 than on day t due to Arctic amplification (Fig. S6), which is more evident at high latitudes (Figs. S9 and S11). Both these factors reduce the DTDT variance. While advective changes predominate for these DTDT extremes, a minor contribution also arises from modifications in diabatic and adiabatic processes. Changes in diabatic processes, especially significant at the surface, are likely driven by variations in surface albedo and heat fluxes (Chen et al., 2019; Diro and Sushama, 2020).
The weakening of extreme DTDT changes during JJA shows clear regional and event–type differences, unlike the more uniform pattern in DJF. This trend is driven not only by changes in advection but also by significant contributions from both adiabatic and diabatic processes. During warming events, eastern North America experiences combined reductions in advection and diabatic heating, while western North America is mainly affected by a decrease in adiabatic warming due to reduced subsidence in a weakened anticyclonic circulation. Similarly, cooling events show decreases in advection, along with region–specific changes: increased diabatic heating in the east and adiabatic warming in the west. Generally, in the Northern Hemisphere, the advection–driven changes (also see Fig. S15) associated with JJA extremes are linked to Arctic warming (Coumou et al., 2018; Kornhuber and Tamarin-Brodsky, 2021). The changes in diabatic processes are probably associated with changes in surface net radiative forcing, as discussed by Wang et al. (2025). Notably, despite the decline in extreme DTDT changes, daily heat extremes and heatwaves are still expected to intensify in the future (Bartusek et al., 2022; White et al., 2023; Zhang et al., 2023; Heeter et al., 2023). Overall, the reduction in extreme DTDT variability across extratropical regions in JJA results from a complex interaction of dynamical and thermodynamic factors, with their relative importance varying across regions and event types.
Conversely, an intensification of extreme DTDT variations is also evident in certain extratropical regions, particularly Northern Europe, Northern Asia, the south of Southern Africa and Southern Australia (Figs. S22–S24), where recent research indicates generally rising risks associated with temperature extremes (Ciavarella et al., 2021; Nangombe et al., 2019; Beobide-Arsuaga et al., 2025; Chapman et al., 2024). In the southern hemisphere, increased DTDT extremes result from advection alone or in combination with adiabatic and diabatic processes, whereas changes in the northern high latitudes are primarily diabatic, with advection changes playing a secondary role (mainly during warming events), while vertical motion remains largely unaffected. Also, the projected intensification at lower latitudes primarily results from enhanced diabatic processes, with advection playing a secondary role (Figs. S20–S21). One important mechanism by which diabatic processes can influence temperature variability is through land–atmosphere interactions (Sato and Nakamura, 2019; Beobide-Arsuaga et al., 2025), leading to amplified temperature fluctuations and more frequent extremes, including extreme DTDT changes (Liu et al., 2025; Cattiaux et al., 2015). For example, the future amplification of DTDT warming events in central Europe is driven by increased diabatic heating on the event day, which closely resembles the mechanisms underlying the intensification of heatwaves (Schielicke and Pfahl, 2022). Heatwaves often occur in parallel with soil moisture depletion, which lowers the latent heat flux and increases the sensible heat flux through a higher Bowen ratio (Lin et al., 2022; Zscheischler and Seneviratne, 2017). Overall, these insights imply that regions such as the Sahel and central Europe could experience more pronounced soil drying in a warming climate (Ruosteenoja et al., 2018; Elkouk et al., 2021), possibly creating a feedback loop that amplifies future temperature extremes.
Similarly, an intensification in extreme DTDT changes is projected in the tropics during DJF, highlighting increased risks for many developing countries. These regions are expected to encounter a disproportionate share of climate change's socioeconomic, agricultural, and health impacts (Bathiany et al., 2018; Ebi et al., 2025; Linsenmeier, 2023; Raymond et al., 2020). Historical and future extreme DTDT changes over these areas are not driven by large–scale advection, but by local diabatic and adiabatic processes. The intensification of future DTDT warming events is mainly caused by stronger local diabatic heating, linked to reduced cloud cover and precipitation on event days, which allows more solar radiation to reach the surface and raise temperatures – similar to processes during heatwaves (Birch et al., 2022; Mckinnon et al., 2024; Moustakis et al., 2020). For future DTDT cooling, local diabatic cooling remains relevant, whereas reduced adiabatic warming intensifies it. Nevertheless, such adiabatic changes and their influence on near–surface temperature might be linked to cloud–diabatic effects through lower–tropospheric static stability (Luo et al., 2024). Note, however, that these results must be interpreted with caution, as the trajectory calculations use wind fields from the model grid and therefore cannot capture the full spectrum of convective and turbulent motions. This limitation is especially pronounced in the tropics, where intense moist convection introduces significant uncertainty into the calculated transport pathways (Bergman and Sardeshmukh, 2004; Bao and Stevens, 2021; Stohl, 1998).
Our study is the first to apply a Lagrangian backwards–trajectory method to investigate the physical processes underlying projected extreme DTDT changes. The results reveal clear seasonal and regional variations in the occurrence of these extremes, for which not only advection but also changes in adiabatic and diabatic processes are important. In the extratropics during DJF, reductions in extreme DTDT changes are mainly attributable to weaker temperature advection, primarily linked to Arctic amplification. The weakening of extremes during JJA is caused not only by advection but also by diabatic and adiabatic processes. In contrast, there is substantial intensification of DTDT extremes over tropical and subtropical land areas during JJA, mainly driven by diabatic processes that are likely associated with changes in surface fluxes. Adiabatic warming changes, combined with diabatic processes, are crucial for the increase in tropical extremes during DJF. These findings highlight the importance of accounting for the Lagrangian temperature change of air masses when examining spatial and seasonal variations in future DTDT changes, which can significantly affect ecosystems, public health, and infrastructure. They also emphasise the need for region–specific adaptation strategies to mitigate the risks associated with rapid temperature changes.
The code for the trajectory model LAGRANTO is available at https://iacweb.ethz.ch/staff/sprenger/lagranto/ (Sprenger and Wernli, 2015). The model code for CESM version 1 used for the ensemble simulation is available at https://www2.cesm.ucar.edu/models/cesm1.0/ (Kay et al., 2015). ERA5 data are available via the Copernicus Climate Change Service https://doi.org/10.24381/cds.143582cf (Copernicus Climate Change Service, 2023).
The supplement related to this article is available online at https://doi.org/10.5194/wcd-7-1009-2026-supplement.
Both authors designed the study. KH performed the analysis, produced the figures, and drafted the manuscript. Both authors discussed the results and edited the manuscript.
At least one of the (co-)authors is a member of the editorial board of Weather and Climate Dynamics. The peer-review process was guided by an independent editor, and the authors also have no other competing interests to declare.
Publisher's note: Copernicus Publications remains neutral with regard to jurisdictional claims made in the text, published maps, institutional affiliations, or any other geographical representation in this paper. The authors bear the ultimate responsibility for providing appropriate place names. Views expressed in the text are those of the authors and do not necessarily reflect the views of the publisher.
We acknowledge the HPC service of ZEDAT, Freie Universität Berlin, for providing computational Resources (Bennett, 2020). We are grateful to two anonymous reviewers whose constructive comments helped us to improve the paper.
The article processing charges for this open-access publication were covered by the Freie Universität Berlin.
This paper was edited by Gwendal Rivière and reviewed by two anonymous referees.
Bao, J. and Stevens, B.: The Elements of the Thermodynamic Structure of the Tropical Atmosphere, J. Meteorol. Soc. JPN II, 99, 1483–1499, https://doi.org/10.2151/jmsj.2021-072, 2021.
Bartusek, S., Kornhuber, K., and Ting, M.: 2021 North American heatwave amplified by climate change-driven nonlinear interactions, Nat. Clim. Change, 12, 1143–1150, https://doi.org/10.1038/s41558-022-01520-4, 2022.
Bathiany, S., Dakos, V., Scheffer, M., and Lenton, T. M.: Climate models predict increasing temperature variability in poor countries, Sci. Adv., 4, eaar5809, https://doi.org/10.1126/sciadv.aar5809, 2018.
Bennett, L. M., Proppe, B., and Curta, B.: a general-purpose high-performance computer at ZEDAT, Freie Universität Berlin, https://doi.org/10.17169/refubium-26754, 2020.
Beobide-Arsuaga, G., Suarez-Gutierrez, L., Barkhordarian, A., Olonscheck, D., and Baehr, J.: Increasing central and northern European summer heatwave intensity due to forced changes in internal variability, Nat. Commun., 16, 9485, https://doi.org/10.1038/s41467-025-65392-w, 2025.
Bergman, J. W. and Sardeshmukh, P. D.: Dynamic Stabilization of Atmospheric Single Column Models, J. Climate, 17, 1004–1021, https://doi.org/10.1175/1520-0442(2004)017<1004:DSOASC>2.0.CO;2, 2004.
Bieli, M., Pfahl, S., and Wernli, H.: A Lagrangian investigation of hot and cold temperature extremes in Europe, Q. J. Roy. Meteorol. Soc., 141, 98–108, https://doi.org/10.1002/qj.2339, 2015.
Birch, C. E., Jackson, L. S., Finney, D. L., Marsham, J. M., Stratton, R. A., Tucker, S., Chapman, S., Senior, C. A., Keane, R. J., Guichard, F., and Kendon, E. J.: Future Changes in African Heatwaves and Their Drivers at the Convective Scale, J. Climate, 35, 5981–6006, https://doi.org/10.1175/JCLI-D-21-0790.1, 2022.
Brunner, L., Schaller, N., Anstey, J., Sillmann, J., and Steiner, A. K.: Dependence of Present and Future European Temperature Extremes on the Location of Atmospheric Blocking, Geophys. Res. Lett., 45, 6311–6320, https://doi.org/10.1029/2018GL077837, 2018.
Cattiaux, J., Douville, H., Schoetter, R., Parey, S., and Yiou, P.: Projected increase in diurnal and interdiurnal variations of European summer temperatures, Geophys. Res. Lett., 42, 899–907, https://doi.org/10.1002/2014GL062531, 2015.
Chan, E. Y. Y., Goggins, W. B., Kim, J. J., and Griffiths, S. M.: A study of intracity variation of temperature-related mortality and socioeconomic status among the Chinese population in Hong Kong, J. Epidemiol. Comm. H., 66, 322–327, https://doi.org/10.1136/jech.2008.085167, 2012.
Chan, P. W., Catto, J. L., and Collins, M.: Heatwave–blocking relation change likely dominates over decrease in blocking frequency under global warming, npj Clim. Atmos. Sci., 5, 68, https://doi.org/10.1038/s41612-022-00290-2, 2022.
Chapman, S., Syktus, J., Trancoso, R., Toombs, N., and Eccles, R.: Projected changes in mean climate and extremes from downscaled high-resolution CMIP6 simulations in Australia, Weather Clim. Extrem., 46, 100733, https://doi.org/10.1016/j.wace.2024.100733, 2024.
Chen, H., Yang, J., Tan, C., Wang, J., and Cai, X.: Dynamic evolution of Day-To-Day Temperature fluctuations and population exposure on a global scale, PLoS One, 20, e0333887, https://doi.org/10.1371/journal.pone.0333887, 2025.
Chen, J., Dai, A., and Zhang, Y.: Projected Changes in Daily Variability and Seasonal Cycle of Near-Surface Air Temperature over the Globe during the Twenty-First Century, J. Climate, 32, 8537–8561, https://doi.org/10.1175/JCLI-D-19-0438.1, 2019.
Ciavarella, A., Cotterill, D., Stott, P., Kew, S., Philip, S., van Oldenborgh, G. J., Skålevåg, A., Lorenz, P., Robin, Y., Otto, F., Hauser, M., Seneviratne, S. I., Lehner, F., and Zolina, O.: Prolonged Siberian heat of 2020 almost impossible without human influence, Clim. Change, 166, 9, https://doi.org/10.1007/s10584-021-03052-w, 2021.
Copernicus Climate Change Service: Complete ERA5 global atmospheric reanalysis, Copernicus Climate Change Service (C3S) Climate Data Store (CDS) [data set], https://doi.org/10.24381/cds.143582cf, 2023.
Coumou, D., Di Capua, G., Vavrus, S., Wang, L., and Wang, S.: The influence of Arctic amplification on mid-latitude summer circulation, Nat. Commun., 9, 2959, https://doi.org/10.1038/s41467-018-05256-8, 2018.
Dai, A. and Deng, J.: Arctic Amplification Weakens the Variability of Daily Temperatures over Northern Middle-High Latitudes, J. Climate, 34, 2591–2609, https://doi.org/10.1175/JCLI-D-20-0514.1, 2021.
Diro, G. T. and Sushama, L.: Contribution of Snow Cover Decline to Projected Warming Over North America, Geophys. Res. Lett., 47, e2019GL084414, https://doi.org/10.1029/2019GL084414, 2020.
Dolores-Tesillos, E., Teubler, F., and Pfahl, S.: Future changes in North Atlantic winter cyclones in CESM-LE – Part 1: Cyclone intensity, potential vorticity anomalies, and horizontal wind speed, Weather Clim. Dynam., 3, 429–448, https://doi.org/10.5194/wcd-3-429-2022, 2022.
Ebi, K., Haines, A., Andrade, R. F. S., Åström, C., Barreto, M. L., Bonell, A., Brink, N., Caminade, C., Carlson, C. J., Carter, R., Chua, P., Cissé, G., Colón-González, F. J., Dasgupta, S., Galvao, L. A., Garrido Zornoza, M., Gasparrini, A., Gordon-Strachan, G., Hajat, S., Harper, S., Harrington, L. J., Hashizume, M., Hess, J., Hilly, J., Ingole, V., Jacobson, L. V., Kapwata, T., Keeler, C., Kidd, S. A., Kimani-Murage, E. W., Kolli, R. K., Kovats, S., Li, S., Lowe, R., Mitchell, D., Murray, K., New, M., Ogunniyi, O. E., Perkins-Kirkpatrick, S. E., Pescarini, J., Pineda Restrepo, B. L., Pinho, S. T. R., Prescott, V., Redvers, N., Ryan, S., Santer, B., Schleussner, C. F., Semenza, J. C., Taylor, M., Temple, L., Thiam, S., Thiery, W., Tompkins, A. M., Undorf, S., Vicedo-Cabrera, A. M., Wan, K., Warren, R., Webster, C., Woodward, A., Wright, C., and Stuart-Smith, R. F.: The attribution of human health outcomes to climate change: a transdisciplinary guidance document, Clim. Change, 178, https://doi.org/10.1007/s10584-025-03976-7, 2025.
Elkouk, A., El Morjani, Z. E. A., Pokhrel, Y., Chehbouni, A., Sifeddine, A., Thober, S., and Bouchaou, L.: Multi-model ensemble projections of soil moisture drought over North Africa and the Sahel region under 1.5, 2, and 3 °C global warming, Clim. Change, 167, 52, https://doi.org/10.1007/s10584-021-03202-0, 2021.
Garfinkel, C. I. and Harnik, N.: The Non-Gaussianity and Spatial Asymmetry of Temperature Extremes Relative to the Storm Track: The Role of Horizontal Advection, J. Climate, 30, 445–464, https://doi.org/10.1175/JCLI-D-15-0806.1, 2017.
Giorgi, F. and Raffaele, F.: On the dependency of GCM-based regional surface climate change projections on model biases, resolution and climate sensitivity, Clim. Dynam., 58, 2843–2862, https://doi.org/10.1007/s00382-021-06037-8, 2022.
Hamal, K. and Pfahl, S.: Physical processes leading to extreme day-to-day temperature change – Part 1: Present-day climate, Weather Clim. Dynam., 6, 879–899, https://doi.org/10.5194/wcd-6-879-2025, 2025.
Hartig, K., Tziperman, E., and Loughner, C. P.: Processes Contributing to North American Cold Air Outbreaks Based on Air Parcel Trajectory Analysis, J. Climate, 36, 931–943, https://doi.org/10.1175/JCLI-D-22-0204.1, 2023.
Heeter, K. J., Harley, G. L., Abatzoglou, J. T., Anchukaitis, K. J., Cook, E. R., Coulthard, B. L., Dye, L. A., and Homfeld, I. K.: Unprecedented 21st century heat across the Pacific Northwest of North America, npj Clim. Atmos. Sci., 6, 5, https://doi.org/10.1038/s41612-023-00340-3, 2023.
Hersbach, H., Bell, B., Berrisford, P., Hirahara, S., Horányi, A., Muñoz-Sabater, J., Nicolas, J., Peubey, C., Radu, R., Schepers, D., Simmons, A., Soci, C., Abdalla, S., Abellan, X., Balsamo, G., Bechtold, P., Biavati, G., Bidlot, J., Bonavita, M., De Chiara, G., Dahlgren, P., Dee, D., Diamantakis, M., Dragani, R., Flemming, J., Forbes, R., Fuentes, M., Geer, A., Haimberger, L., Healy, S., Hogan, R. J., Hólm, E., Janisková, M., Keeley, S., Laloyaux, P., Lopez, P., Lupu, C., Radnoti, G., de Rosnay, P., Rozum, I., Vamborg, F., Villaume, S., and Thépaut, J.-N.: The ERA5 global reanalysis, Q. J. Roy. Meteorol. Soc., 146, 1999–2049, https://doi.org/10.1002/qj.3803, 2020.
Hovdahl, I.: The deadly effect of day-to-day temperature variation in the United States, Environ. Res. Lett., 17, 104031, https://doi.org/10.1088/1748-9326/ac9297, 2022.
Intergovernmental Panel on Climate, C.: Climate Change 2022 – Impacts, Adaptation and Vulnerability: Working Group II Contribution to the Sixth Assessment Report of the Intergovernmental Panel on Climate Change, Cambridge University Press, Cambridge, https://doi.org/10.1017/9781009325844, 2023.
Jeong, D. I., Yu, B., and Cannon, A. J.: Future Changes in North American Summer Heatwave Variability and Associated Dynamic and Thermodynamic Processes, J. Climate, 38, 6727–6744, https://doi.org/10.1175/JCLI-D-25-0114.1, 2025.
Kautz, L.-A., Martius, O., Pfahl, S., Pinto, J. G., Ramos, A. M., Sousa, P. M., and Woollings, T.: Atmospheric blocking and weather extremes over the Euro-Atlantic sector – a review, Weather Clim. Dynam., 3, 305–336, https://doi.org/10.5194/wcd-3-305-2022, 2022.
Kay, J. E., Deser, C., Phillips, A., Mai, A., Hannay, C., Strand, G., Arblaster, J. M., Bates, S. C., Danabasoglu, G., Edwards, J., Holland, M., Kushner, P., Lamarque, J.-F., Lawrence, D., Lindsay, K., Middleton, A., Munoz, E., Neale, R., Oleson, K., Polvani, L., and Vertenstein, M.: The Community Earth System Model (CESM) Large Ensemble Project: A Community Resource for Studying Climate Change in the Presence of Internal Climate Variability, B. Am. Meteorol. Soc., 96, 1333–1349, https://doi.org/10.1175/BAMS-D-13-00255.1, 2015 (data available at: https://www2.cesm.ucar.edu/models/cesm1.0/, last access: 15 Apriol 2026).
Kim, O.-Y., Wang, B., and Shin, S.-H.: How do weather characteristics change in a warming climate?, Clim. Dynam., 41, 3261–3281, https://doi.org/10.1007/s00382-013-1795-8, 2013.
Kornhuber, K. and Tamarin-Brodsky, T.: Future Changes in Northern Hemisphere Summer Weather Persistence Linked to Projected Arctic Warming, Geophys. Res. Lett., 48, e2020GL091603, https://doi.org/10.1029/2020GL091603, 2021.
Kotz, M., Wenz, L., Stechemesser, A., Kalkuhl, M., and Levermann, A.: Day-to-day temperature variability reduces economic growth, Nat. Clim. Change, 11, 319–325, https://doi.org/10.1038/s41558-020-00985-5, 2021.
Lin, H., Li, Y., and Zhao, L.: Partitioning of Sensible and Latent Heat Fluxes in Different Vegetation Types and Their Spatiotemporal Variations Based on 203 FLUXNET Sites, J. Geophys. Res.-Atmos., 127, e2022JD037142, https://doi.org/10.1029/2022JD037142, 2022.
Linsenmeier, M.: Temperature variability and long-run economic development, J. Environ. Econom. Manage., 121, 102840, https://doi.org/10.1016/j.jeem.2023.102840, 2023.
Liu, Q., Fu, C., Xu, Z., and Ding, A.: Global warming intensifies extreme day-to-day temperature changes in mid–low latitudes, Nat. Clim. Change, https://doi.org/10.1038/s41558-025-02486-9, 2025.
Luo, H., Quaas, J., and Han, Y.: Diurnally asymmetric cloud cover trends amplify greenhouse warming, Sci. Adv., 10, eado5179, https://doi.org/10.1126/sciadv.ado5179, 2024.
Martínez-Solanas, È., Quijal-Zamorano, M., Achebak, H., Petrova, D., Robine, J.-M., Herrmann, F. R., Rodó, X., and Ballester, J.: Projections of temperature-attributable mortality in Europe: a time series analysis of 147 contiguous regions in 16 countries, The Lancet Planet. H., 5, e446–e454, https://doi.org/10.1016/S2542-5196(21)00150-9, 2021.
Mayer, A.: A New Global Lagrangian Analysis of Near-Surface Temperature Extremes, Geophys. Res. Lett., 52, e2025GL116696, https://doi.org/10.1029/2025GL116696, 2025.
McKinnon, K. A., Simpson, I. R., and Williams, A. P.: The pace of change of summertime temperature extremes, P. Natl. Acad. Sci. USA, 121, e2406143121, https://doi.org/10.1073/pnas.2406143121, 2024.
Moustakis, Y., Onof, C. J., and Paschalis, A.: Atmospheric convection, dynamics and topography shape the scaling pattern of hourly rainfall extremes with temperature globally, Commun. Earth Environ., 1, 11, https://doi.org/10.1038/s43247-020-0003-0, 2020.
Nangombe, S. S., Zhou, T., Zhang, W., Zou, L., and Li, D.: High-Temperature Extreme Events Over Africa Under 1.5 and 2 °C of Global Warming, J. Geophys. Res.-Atmos., 124, 4413–4428, https://doi.org/10.1029/2018JD029747, 2019.
Neal, E., Huang, C. S. Y., and Nakamura, N.: The 2021 Pacific Northwest Heat Wave and Associated Blocking: Meteorology and the Role of an Upstream Cyclone as a Diabatic Source of Wave Activity, Geophys. Res. Lett., 49, e2021GL097699, https://doi.org/10.1029/2021GL097699, 2022.
Nygård, T., Papritz, L., Naakka, T., and Vihma, T.: Cold wintertime air masses over Europe: where do they come from and how do they form?, Weather Clim. Dynam., 4, 943–961, https://doi.org/10.5194/wcd-4-943-2023, 2023.
Papritz, L. and Spengler, T.: A Lagrangian Climatology of Wintertime Cold Air Outbreaks in the Irminger and Nordic Seas and Their Role in Shaping Air–Sea Heat Fluxes, J. Climate, 30, 2717–2737, https://doi.org/10.1175/JCLI-D-16-0605.1, 2017.
Quinting, J. F. and Reeder, M. J.: Southeastern Australian Heat Waves from a Trajectory Viewpoint, Mon. Weather Rev., 145, 4109–4125, https://doi.org/10.1175/MWR-D-17-0165.1, 2017.
Raymond, C., Matthews, T., and Horton, R. M.: The emergence of heat and humidity too severe for human tolerance, Sci. Adv., 6, eaaw1838, https://doi.org/10.1126/sciadv.aaw1838, 2020.
Röthlisberger, M. and Papritz, L.: Quantifying the physical processes leading to atmospheric hot extremes at a global scale, Nat. Geosci., 16, 210–216, https://doi.org/10.1038/s41561-023-01126-1, 2023a.
Röthlisberger, M. and Papritz, L.: A Global Quantification of the Physical Processes Leading to Near-Surface Cold Extremes, Geophys. Res. Lett., 50, e2022GL101670, https://doi.org/10.1029/2022GL101670, 2023b.
Röthlisberger, M., Sprenger, M., Beyerle, U., Fischer, E. M., and Wernli, H.: Advective, adiabatic and diabatic contributions to heat extremes simulated with the Community Earth System Model version 2, EGUsphere [preprint], https://doi.org/10.5194/egusphere-2025-5146, 2025.
Ruosteenoja, K., Markkanen, T., Venäläinen, A., Räisänen, P., and Peltola, H.: Seasonal soil moisture and drought occurrence in Europe in CMIP5 projections for the 21st century, Clim. Dynam., 50, 1177–1192, https://doi.org/10.1007/s00382-017-3671-4, 2018.
Sato, T. and Nakamura, T.: Intensification of hot Eurasian summers by climate change and land–atmosphere interactions, Sci. Rep., 9, 10866, https://doi.org/10.1038/s41598-019-47291-5, 2019.
Schaller, N., Sillmann, J., Anstey, J., Fischer, E. M., Grams, C. M., and Russo, S.: Influence of blocking on Northern European and Western Russian heatwaves in large climate model ensembles, Environ. Res. Lett., 13, 054015, https://doi.org/10.1088/1748-9326/aaba55, 2018.
Schielicke, L. and Pfahl, S.: European heatwaves in present and future climate simulations: a Lagrangian analysis, Weather Clim. Dynam., 3, 1439–1459, https://doi.org/10.5194/wcd-3-1439-2022, 2022.
Screen, J. A.: Arctic amplification decreases temperature variance in northern mid- to high-latitudes, Nat. Clim. Change, 4, 577–582, https://doi.org/10.1038/nclimate2268, 2014.
Simpson, I. R., Lawrence, D. M., Swenson, S. C., Hannay, C., McKinnon, K. A., and Truesdale, J. E.: Improvements in Wintertime Surface Temperature Variability in the Community Earth System Model Version 2 (CESM2) Related to the Representation of Snow Density, J. Adv. Model. Earth Syst., 14, e2021MS002880, https://doi.org/10.1029/2021MS002880, 2022.
Sprenger, M. and Wernli, H.: The LAGRANTO Lagrangian analysis tool – version 2.0, Geosci. Model Dev., 8, 2569–2586, https://doi.org/10.5194/gmd-8-2569-2015, 2015 (data available at: https://iacweb.ethz.ch/staff/sprenger/lagranto/, last access: 15 April 2026).
Stohl, A.: Computation, accuracy and applications of trajectories – A review and bibliography, Atmos. Environ., 32, 947–966, https://doi.org/10.1016/S1352-2310(97)00457-3, 1998.
Tamarin-Brodsky, T., Hodges, K., Hoskins, B. J., and Shepherd, T. G.: Changes in Northern Hemisphere temperature variability shaped by regional warming patterns, Nat. Geosci., 13, 414–421, https://doi.org/10.1038/s41561-020-0576-3, 2020.
Vogel, M. M., Zscheischler, J., Fischer, E. M., and Seneviratne, S. I.: Development of Future Heatwaves for Different Hazard Thresholds, J. Geophys. Res.-Atmos., 125, e2019JD032070, https://doi.org/10.1029/2019JD032070, 2020.
Wan, H., Kirchmeier-Young, M. C., and Zhang, X.: Human influence on daily temperature variability over land, Environ. Res. Lett., 16, 094026, https://doi.org/10.1088/1748-9326/ac1cb9, 2021.
Wang, F., Vavrus, S. J., Francis, J. A., and Martin, J. E.: The role of horizontal thermal advection in regulating wintertime mean and extreme temperatures over interior North America during the past and future, Clim. Dynam., 53, 6125–6144, https://doi.org/10.1007/s00382-019-04917-8, 2019.
Wang, J., Zhang, J., and Zhang, P.: Rising temperature threatens China's cropland, Environ. Res. Lett., 17, 084042, https://doi.org/10.1088/1748-9326/ac84f1, 2022.
Wang, P., Ye, F., Yang, Y., Tang, J., and Liao, H.: Mitigated Rapid Temperature Variability in the Northern Mid-High Latitudes Under Carbon Neutrality, Geophys. Res. Lett., 52, e2025GL118040, https://doi.org/10.1029/2025GL118040, 2025.
White, R. H., Anderson, S., Booth, J. F., Braich, G., Draeger, C., Fei, C., Harley, C. D. G., Henderson, S. B., Jakob, M., Lau, C.-A., Mareshet Admasu, L., Narinesingh, V., Rodell, C., Roocroft, E., Weinberger, K. R., and West, G.: The unprecedented Pacific Northwest heatwave of June 2021, Nat. Commun., 14, 727, https://doi.org/10.1038/s41467-023-36289-3, 2023.
Wilks, D. S.: “The Stippling Shows Statistically Significant Grid Points”: How Research Results are Routinely Overstated and Overinterpreted, and What to Do about It, B. Am. Meteorol. Soc., 97, 2263–2273, https://doi.org/10.1175/BAMS-D-15-00267.1, 2016.
Wu, Y., Wen, B., Li, S., Gasparrini, A., Tong, S., Overcenco, A., Urban, A., Schneider, A., Entezari, A., Vicedo-Cabrera, A. M., Zanobetti, A., Analitis, A., Zeka, A., Tobias, A., Alahmad, B., Armstrong, B., Forsberg, B., Íñiguez, C., Ameling, C., De la Cruz Valencia, C., Åström, C., Houthuijs, D., Van Dung, D., Royé, D., Indermitte, E., Lavigne, E., Mayvaneh, F., Acquaotta, F., de'Donato, F., Sera, F., Carrasco-Escobar, G., Kan, H., Orru, H., Kim, H., Holobaca, I.-H., Kyselý, J., Madureira, J., Schwartz, J., Katsouyanni, K., Hurtado-Díaz, M., Ragettli, M. S., Hashizume, M., Pascal, M., de Sousa Zanotti Stagliorio Coélho, M., Scovronick, N., Michelozzi, P., Goodman, P., Nascimento Saldiva, P. H., Abrutzky, R., Osorio, S., Dang, T. N., Colistro, V., Huber, V., Lee, W., Seposo, X., Honda, Y., Bell, M. L., and Guo, Y.: Fluctuating temperature modifies heat-mortality association around the globe, The Innovation, 3, 100225, https://doi.org/10.1016/j.xinn.2022.100225, 2022.
Xu, Z., Huang, F., Liu, Q., and Fu, C.: Global pattern of historical and future changes in rapid temperature variability, Environ. Res. Lett., 15, 124073, https://doi.org/10.1088/1748-9326/abccf3, 2020.
Zhang, X., Zhou, T., Zhang, W., Ren, L., Jiang, J., Hu, S., Zuo, M., Zhang, L., and Man, W.: Increased impact of heat domes on 2021-like heat extremes in North America under global warming, Nat. Commun., 14, 1690, https://doi.org/10.1038/s41467-023-37309-y, 2023.
Zhou, X., Wang, Q., and Yang, T.: Decreases in days with sudden day-to-day temperature change in the warming world, Global Planet. Change, 192, 103239, https://doi.org/10.1016/j.gloplacha.2020.103239, 2020.
Zou, Z., Li, C., Wu, X., Meng, Z., and Cheng, C.: The effect of day-to-day temperature variability on agricultural productivity, Environ. Res. Lett., 19, 124046, https://doi.org/10.1088/1748-9326/ad8ede, 2024.
Zscheischler, J. and Seneviratne, S. I.: Dependence of drivers affects risks associated with compound events, Sci. Adv., 3, e1700263, https://doi.org/10.1126/sciadv.1700263, 2017.
Zschenderlein, P., Fink, A. H., Pfahl, S., and Wernli, H.: Processes determining heat waves across different European climates, Q. J. Roy. Meteorol. Soc., 145, 2973–2989, https://doi.org/10.1002/qj.3599, 2019.