
the Creative Commons Attribution 4.0 License.
the Creative Commons Attribution 4.0 License.
 | 13 Jul 2026
A synoptic clustering-based definition of South China Sea summer monsoon onset and application to seasonal prediction
Dzung Nguyen-Le
Accurate prediction of the South China Sea summer monsoon (SCSSM) onset date is important for water resources, agriculture, and disaster preparedness across East Asia, yet reliable seasonal prediction remains challenging. Here, we propose a synoptic clustering-based onset definition that identifies monsoon onset as a persistent transition into large-scale monsoon circulation regimes derived from clustering of low-level atmospheric fields. Using ECMWF SEAS5 seasonal forecasts, we compare predictions based on this regime-based framework with those based on the conventional area-averaged 850 hPa zonal-wind criterion of Wang et al. (2004). The clustering-based definition yields improved deterministic prediction skill, more favorable ratio of predictable component values, and generally higher categorical and probabilistic forecast skill during both the dependent training period and an independent forecast period. Additional diagnostics show that the identified regime transition is accompanied by coherent convective and thermodynamic changes, supporting its physical consistency with monsoon establishment. Overall, the results suggest that circulation-regime-based onset definitions provide a physically meaningful and practically useful alternative to conventional threshold-based approaches for seasonal prediction of SCSSM onset.
- Article
(12818 KB) - Full-text XML
-
Supplement
(8663 KB) - BibTeX
- EndNote


The onset of the South China Sea (SCS) summer monsoon (SCSSM) marks a rapid reorganization of the Asian monsoon system, characterized by a transition from a dry, trade-wind-dominated spring regime to a convectively coupled summer circulation (Wang and LinHo, 2002; Ding et al., 2004, 2015; Wang et al., 2004). Climatologically occurring in mid-May, this transition is marked by a reversal of lower-tropospheric zonal winds over the SCS, enhanced low-level moisture convergence, and the eastward retreat of the western North Pacific (WNP) subtropical high (WNPSH), leading to the establishment of deep convection over the basin (Zhou and Chan, 2007; Wang et al., 2009). As a precursor to the broader East Asian summer monsoon, variability in the SCSSM onset date (OD) strongly regulates the initiation of the regional rainy season over Southeast Asia and southern China. Previous studies have shown that this transition is sensitive to subseasonal disturbances and remote forcing, including intraseasonal oscillations, tropical–extratropical wave interactions, and large-scale Indo-Pacific circulation anomalies that modulate low-level westerlies and convective instability over the SCS (Ding and Chan, 2005; Geen, 2021).
Although the SCSSM onset occurs every year, its interannual variability exerts a strong control on regional climate through modulation of large-scale circulation, moisture transport, and convective activity. Variations in OD alter the establishment and persistence of low-level westerlies over the SCS and the WNP, thereby redistributing summer rainfall across East and Southeast Asia and shaping regional drought and flood risks. An early SCSSM onset is often followed by suppressed summer rainfall over subtropical East Asia, including the middle and lower reaches of the Yangtze River basin, whereas a delayed onset tends to prolong the pre-monsoon rainfall regime and enhance flood potential (Jiang et al., 2018; He and Zhu, 2015). Over Southeast Asia, early onset favors enhanced convection and an increased likelihood of extreme rainfall events, while delayed onset is associated with reduced low-level moisture convergence and suppressed heavy rainfall in May (Hu et al., 2022a, b). The SCSSM OD also modulates tropical cyclone activity over the WNP by influencing background vorticity, vertical wind shear, and monsoon trough development, with earlier onset linked to increased tropical cyclone genesis and a higher frequency of landfalling storms along the southeastern coast of China (Chen et al., 2017; Huangfu et al., 2017; Wang and Chen, 2018). In addition to rainfall and tropical cyclone impacts, variability in SCS summer circulation is also closely connected to regional oceanic and thermal extremes. Recent studies have shown that summer marine heat waves in the SCS exhibit pronounced spatial diversity linked to circulation anomalies and local air–sea interaction processes (Tang et al., 2025), while water-vapor transport from the SCS can strongly modulate tropical-night variability over South China (Chen et al., 2023). Together, these mechanisms identify SCSSM OD variability as a key driver of seasonal-scale climate variability with direct implications for agriculture, water resources, disaster risk management, and broader climate hazards across the ocean–land system.
Motivated by these impacts, substantial efforts have been devoted to predicting the SCSSM OD using dynamical seasonal forecast systems. Despite the chaotic nature of the atmosphere, previous studies demonstrate that useful predictive skill for interannual variability in SCSSM onset exists at seasonal lead times of approximately one to three months (Zhu and Li, 2017; Martin et al., 2019; Chevuturi et al., 2019, 2021; Attada et al., 2022). This seasonal predictability is derived primarily from slowly evolving boundary conditions, most notably El Niño–Southern Oscillation (ENSO), which modulates large-scale circulation over the WNP through the Indo-Pacific Ocean Capacitor effect (Xie et al., 2016). As a result, operational forecast systems such as the UK Met Office GloSea5 and the European Centre for Medium-Range Weather Forecasts (ECMWF) seasonal forecasting system 5 (SEAS5) can skillfully identify early and late onset years up to three months in advance, particularly when onset is defined using robust pentad-mean circulation-based metrics, such as the area-averaged 850 hPa zonal wind over the SCS (USCS) index of Wang et al. (2004), rather than local precipitation alone (Bombardi et al., 2017, 2020; Chevuturi et al., 2019; Martin et al., 2019). The broader value of improving circulation-based seasonal prediction is also reflected in related forecast applications over South China, where extended-range skill for extreme heat events depends strongly on the prediction of relevant large-scale circulation anomalies, with ECMWF generally outperforming other S2S systems (Li et al., 2024).
However, extending this predictive capability to longer lead times of four to five months remains a formidable challenge. State-of-the-art dynamical models encounter a pronounced spring predictability barrier, during which the influence of ENSO conditions from the preceding winter weakens and stochastic atmospheric variability associated with the seasonal transition becomes dominant, often rendering forecasts initialized in winter (e.g., preceding December or January) statistically insignificant for predicting a May onset (Martin et al., 2019). In addition to intrinsic predictability limits, systematic model deficiencies persist. Coupled systems such as ECMWF SEAS5 frequently exhibit a cold sea surface temperature (SST) bias over the SCS and struggle to realistically simulate the northward propagation of intraseasonal oscillations, leading to a systematic late-onset bias and degraded forecast skill at extended lead times (Chevuturi et al., 2021; Bui-Minh et al., 2024). Together, these limitations suggest that existing linear indices and conventional dynamical frameworks may not adequately capture the nonlinear precursors required to bridge the predictability gap between seasonal (∼ three-month) and long-range (∼ five-month) forecasts.
In parallel with advances in dynamical seasonal prediction, recent studies have proposed alternative circulation-based approaches to defining monsoon onset using clustering of synoptic-scale atmospheric patterns (e.g., Borah et al., 2013; Dai et al., 2021; Bui-Minh et al., 2024). These approaches typically employ self-organizing maps (SOM; Kohonen, 2001) to project high-dimensional atmospheric fields onto a finite set of representative circulation patterns, which are subsequently grouped using clustering algorithms such as K-means. The resulting clusters objectively distinguish between pre-monsoon and monsoon circulation regimes, allowing onset to be identified as the sustained transition from dry, pre-monsoon patterns to convectively active monsoon-associated patterns. By construction, this framework captures the full spatial structure and temporal evolution of the large-scale circulation, rather than relying on a single variable or threshold-based index. Bui-Minh et al. (2024) shows that synoptic-pattern clustering provides a more physically consistent and temporally coherent identification of monsoon onset than traditional index-based definitions. Importantly, such pattern-based definitions are more closely aligned with the dynamical structures resolved by numerical models, suggesting potential advantages for seasonal prediction.
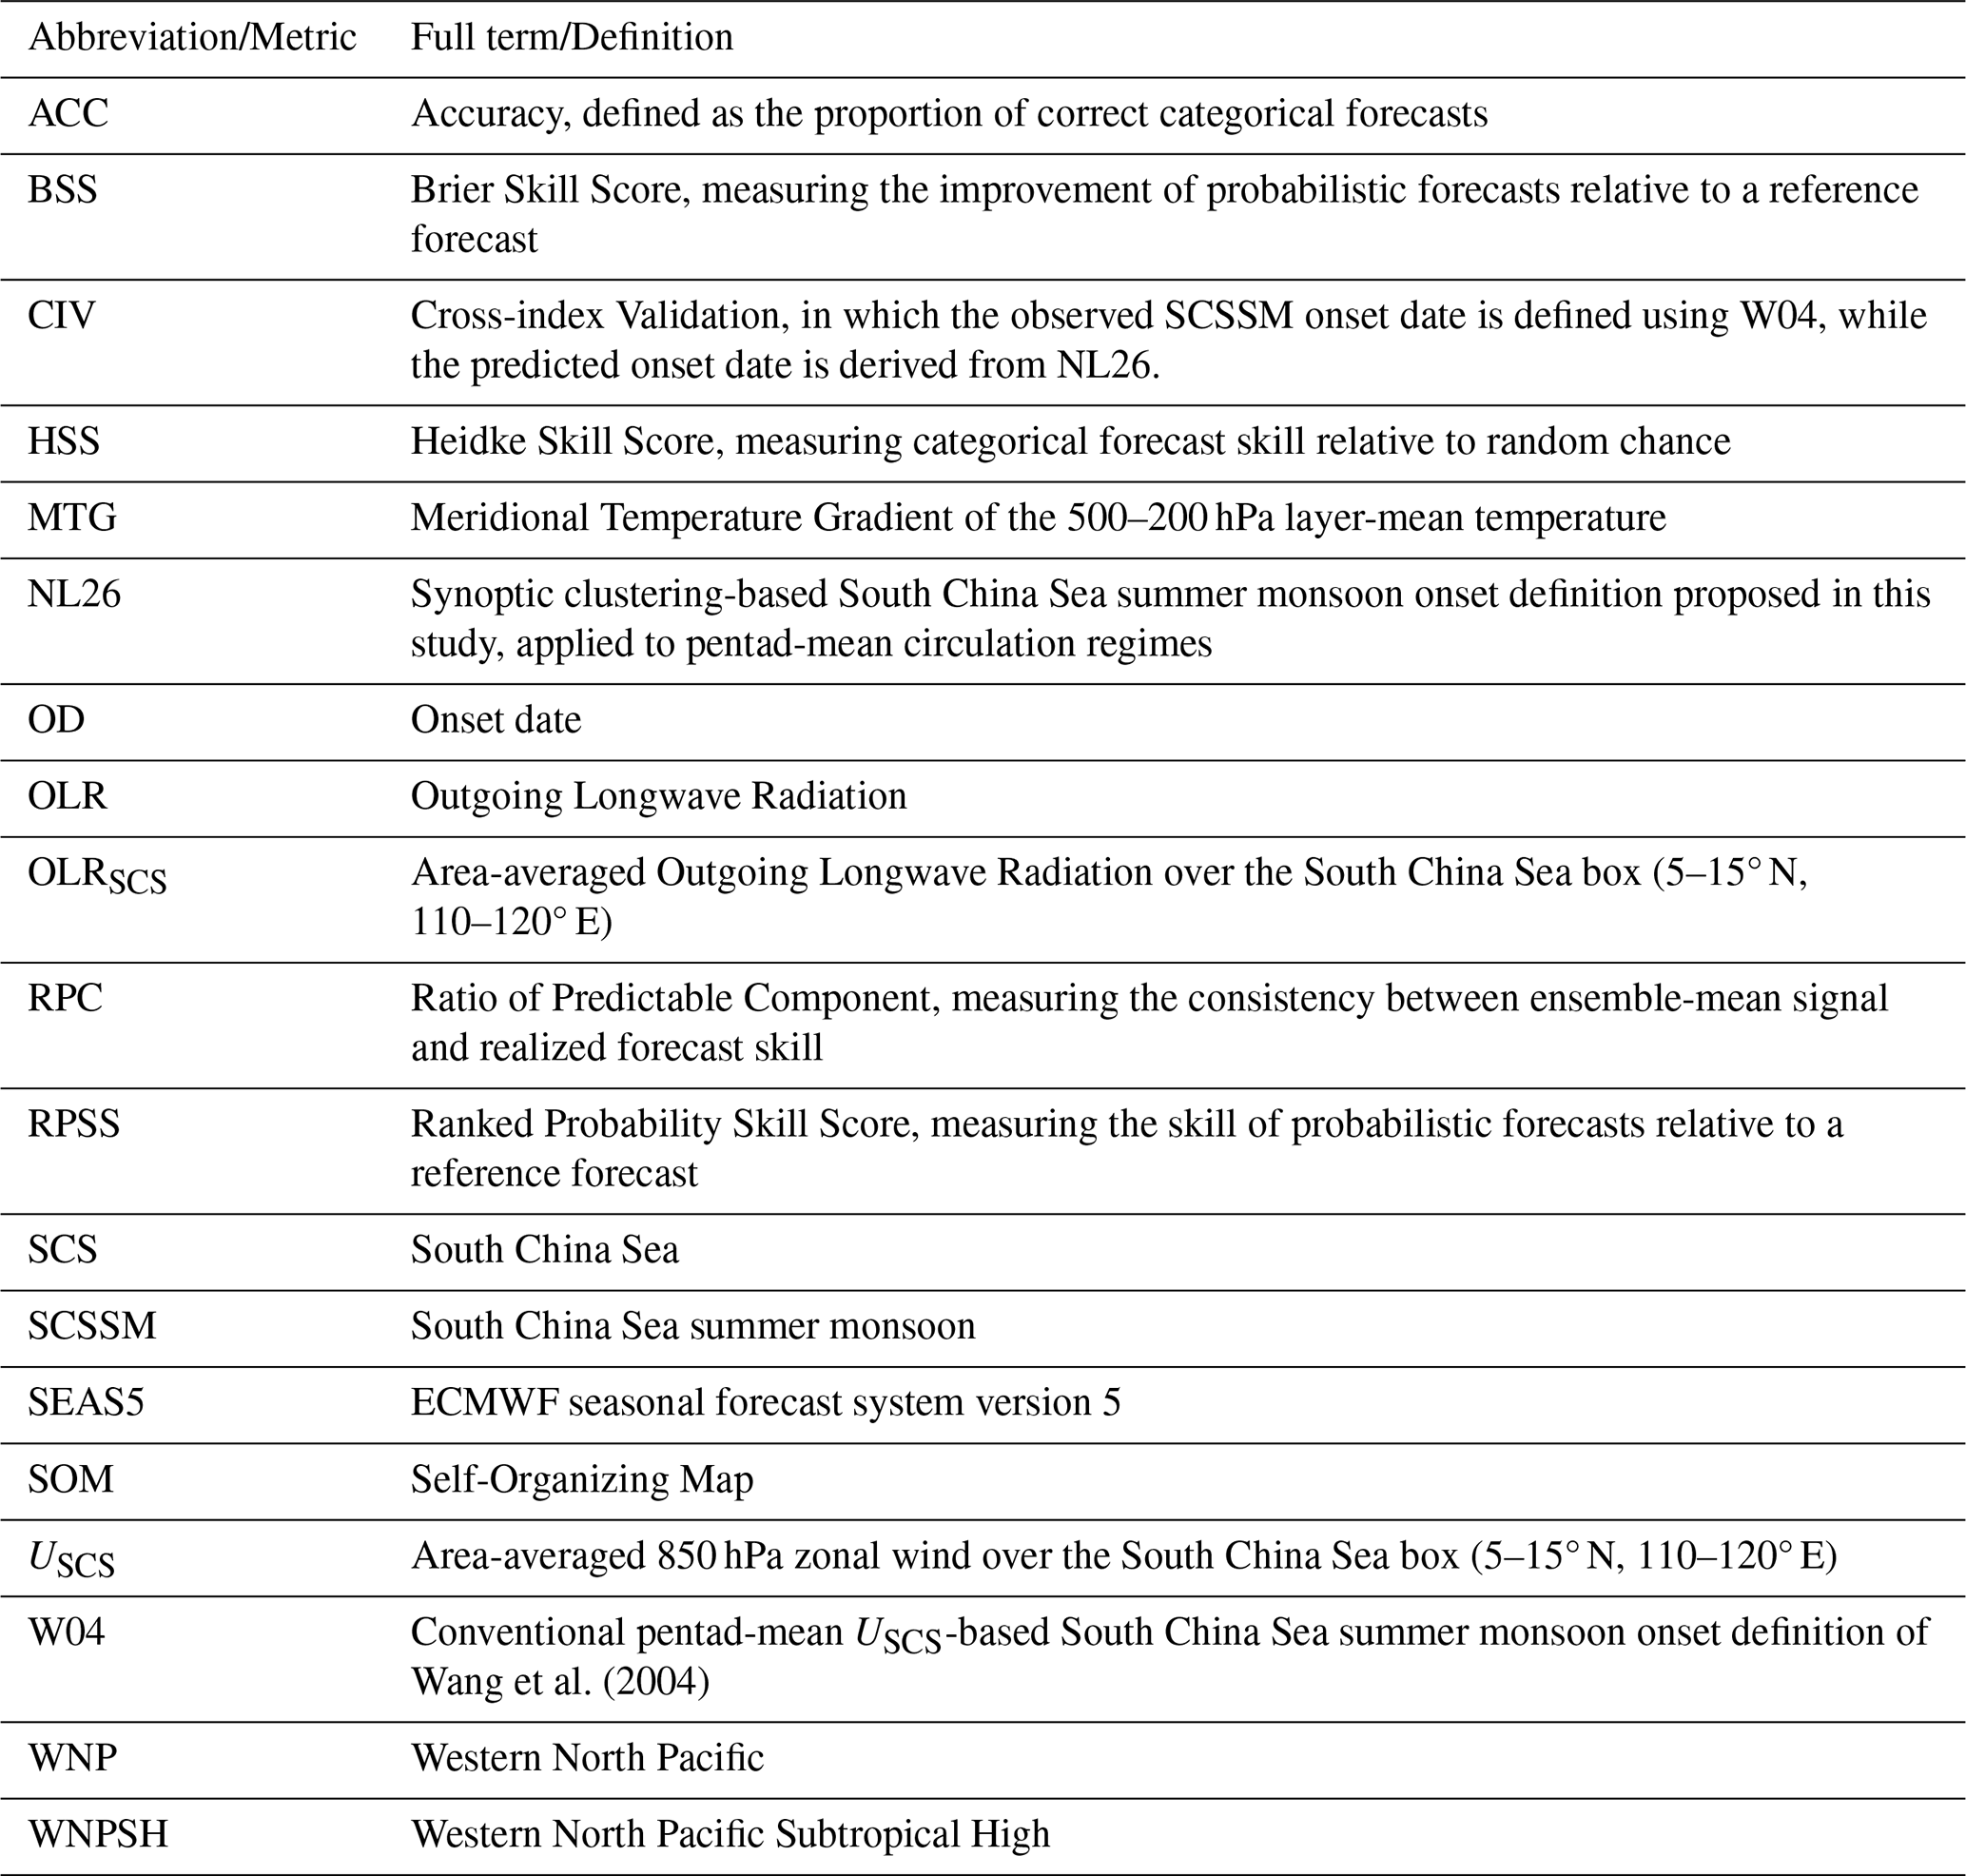
Table 1Main abbreviations and key forecast verification metrics used in this study.
Despite this promise, the extent to which synoptic-pattern-based definitions can improve the predictability of SCSSM OD in operational seasonal forecast systems, particularly at lead times exceeding three months, has not yet been systematically assessed. This study addresses this gap by developing a synoptic clustering-based definition of SCSSM onset using the combination of SOM and clustering techniques and evaluating its performance within a seasonal prediction framework. Specifically, the proposed onset definition will be applied to retrospective forecasts from the ECMWF SEAS5 system to assess whether it enhances prediction skill for SCSSM onset date at extended lead times. By explicitly linking monsoon onset to large-scale circulation regimes rather than single-variable indices, this work aims to provide a more robust and dynamically meaningful framework for understanding and predicting the SCSSM onset.
The remainder of this paper is organized as follows. Section 2 describes the data and methodology. Section 3 presents the synoptic clustering-based definition of the SCSSM OD. Section 4 evaluates its performance in seasonal prediction. Finally, discussions and conclusions are given in Sect. 5.
2.1 Datasets
2.1.1 Observational data
The fifth generation of the ECMWF Reanalysis dataset (ERA5; Hersbach et al., 2020) for the period 1979 to the present, with a horizontal resolution of 0.25°×0.25°, is used to analyze atmospheric circulation. The analysis focuses on 850 hPa zonal wind (U850), meridional wind (V850), geopotential height (Z850), and 500–200 hPa layer-mean temperature. Pentad (5 d) means are computed from hourly ERA5 data. Pentad mean outgoing longwave radiation (OLR) data are obtained from the National Oceanic and Atmospheric Administration (NOAA) Climate Data Record (CDR) of Daily OLR, which provides global daily mean OLR on a 1°×1° grid from 1979 to the present (Lee, 2025). Because OLR is closely related to deep convection, it is used to characterize the convective evolution associated with SCSSM onset. Monthly SST data are taken from the UK Met Office Hadley Centre Global Sea Ice and Sea Surface Temperature dataset (HadISST; Rayner et al., 2003), with a resolution of 1°×1°, available from 1870 to the present. Anomalies are calculated by subtracting the 1981–2010 climatology from detrended data over the corresponding period of record.
2.1.2 Model data
The ECMWF SEAS5 (Johnson et al., 2019) coupled forecasting system consists of the Integrated Forecast System (IFS) atmospheric model, the HTESSEL land surface model, and the Nucleus for European Modelling of the Ocean (NEMO). SEAS5 provides seasonal forecasts at an O320 horizontal resolution (approximately 36 km) with 91 vertical levels in the atmosphere, and an ORCA 0.25° grid (approximately 27 km) with 75 vertical levels in the ocean. The SEAS5 hindcasts and forecasts are initialized on the first day of each month and integrated for seven months, using a 21-member ensemble for hindcasts over 1981–2016 and a 51-member ensemble for real-time forecasts from 2017 onward.
2.2 Methodology
2.2.1 Clustering
The methodology applied in this study follows Nguyen-Le et al. (2017) and Nguyen-Le and Yamada (2019) and is designed to classify synoptic scale atmospheric circulation patterns over the SCS and surrounding regions before and after the SCSSM onset using SOM. From a synoptic perspective, SCSSM onset is characterized by the development of the low-level monsoon trough and cross-equatorial flow near 105° E, the eastward retreat of the WNPSH, and the establishment of a coherent monsoonal meridional circulation (Liu et al., 2016; Huangfu et al., 2017; Hu et al., 2018). Based on these dynamical features, SOM input vectors are constructed from pentad-mean ERA5 reanalysis fields of Z850, U850, and V850, which are concatenated for each pentad to form a single high-dimensional input vector for SOM training. A total of 864 input vectors is generated, corresponding to 18 pentads per year (from pentad 19, 1–5 April, to pentad 36, 25–29 June) over the 38 year period 1979–2016. The spatial domain spans 5° S–25° N and 95–135° E, yielding 161 longitude points and 81 latitude points. This domain was selected to include the main circulation systems associated with SCSSM onset, including the SCS, the Indochina Peninsula, the cross-equatorial flow near 105° E, the tropical eastern Indian Ocean–western Pacific pathway, and the WNPSH. It is broad enough to capture the large-scale transition from pre-monsoon easterlies to monsoon southwesterlies while remaining focused on circulation features directly relevant to SCSSM onset. Consequently, each raw input vector contains elements. Because these elements are not statistically independent owing to strong spatial coherence and inter-variable correlations, direct use of the full input vectors is neither efficient nor optimal. To reduce dimensionality and remove redundant information, principal component analysis (PCA) is applied jointly to the three original reanalysis fields. Prior to PCA, each variable is normalized to ensure comparable variance contributions, as both PCA and SOMs are sensitive to variable scaling. The first d=144 empirical orthogonal function (EOF) modes are retained, corresponding to 99 % of the cumulative explained variance. The associated principal components (PCs) are then used as input to the SOM in place of the original fields. This procedure reduces the dimensionality of each input vector from 39 123–144, corresponding to a reduction factor of approximately 270, thereby improving statistical independence among input elements and substantially reducing computational cost.
The SOM training outcome depends on both the lattice size and several training parameters, including the learning rate, neighborhood radius, and training length. A trial-and-error approach is therefore employed to identify an optimal SOM configuration. Multiple lattice sizes (4×4, 5×5, 6×6, 7×7, and 8×8) are tested and evaluated based on node occupancy, quantization error (QE), and topographic error (TE). Specifically, an excessive number of samples assigned to individual nodes (e.g., >10) indicates insufficient pattern separation and suggests the need for a larger lattice, whereas the presence of empty nodes implies over-partitioning and an excessively large lattice. Based on these criteria, a SOM with a 6×6 hexagonal lattice (36 nodes) is selected, using a learning rate of 0.2 and a neighborhood radius of three. To ensure numerical stability and convergence, the SOM is trained for two million iterations. Given the relatively limited sample size, bootstrap resampling is incorporated into the training procedure, whereby samples are randomly drawn with replacement from the original dataset. A total of 1000 SOM realizations are generated using this configuration. The final “master” SOM is selected as the realization exhibiting the lowest QE and TE (Fig. S1 in the Supplement) and a relatively smooth Sammon mapping (Sammon, 1969), indicating good preservation of the topological relationships among patterns (Fig. S2 in the Supplement).
Because the SOM is designed to preserve the topological structure of the original high-dimensional input space in a two-dimensional lattice, nodes that are adjacent in the SOM represent more similar circulation patterns than those that are farther apart (Vesanto and Alhoniemi, 2000). This similarity can be quantified using the unified distance matrix (U-matrix), which measures the average distance between the codebook vector of a given node and those of its nearest neighbors (Ultsch and Siemon, 1990). To enhance the objectivity and robustness of pattern classification, a two-step clustering strategy is adopted. First, the SOM organizes the atmospheric states according to their topological similarity. Second, the resulting SOM nodes are further grouped into a smaller number of circulation regimes based on the U-matrix structure using K-means clustering. A known limitation of K-means is the need to predefine the number of clusters, K. To address this issue, K is determined objectively by examining the spatial distribution of U-matrix values. Potential clusters are identified around local minima of the U-matrix, while cluster boundaries correspond to nodes with relatively large U-matrix values separating adjacent minima. Figure S3 in the Supplement shows the U-matrix of the master SOM, with values normalized to the unit interval. Based on the number, spatial separation, and surrounding high-distance boundaries of the local minima, the SOM lattice is partitioned into six distinct clusters (K=6), representing six characteristic synoptic-scale circulation regimes during the April–June period. Four clusters correspond to pronounced local minima located in the top-left, bottom-left, bottom-middle, and bottom-right regions of the lattice. In addition, elevated U-matrix values in the top-middle and top-right portions of the SOM indicate circulation patterns that are markedly different from those elsewhere, supporting their identification as two additional, independent regimes. Further methodological details regarding the combined use of SOMs and U-matrix-guided clustering can be found in Nishiyama et al. (2007), Nguyen-Le et al. (2017), and Nguyen-Le and Yamada (2019).
2.2.2 Prediction
In the prediction phase, the circulation clustering results are applied to prognostic atmospheric fields from SEAS5. Pentad-mean forecasts of Z850, U850, and V850 fields from pentad 19 (1–5 April) to pentad 36 (25–29 June) for the period 2017–2025 are extracted over the same spatial domain used in the SOM training. Forecasts initialized from December of the preceding year through April, corresponding to lead times of approximately five to one months, are analyzed to assess lead-time dependence. The forecast fields are normalized using the means and standard deviations derived from the ERA5 training period and projected onto the same PCA space to construct a forecast vector , where d=144. The Euclidean distance between p and the centroid of each synoptic-scale circulation cluster (C1–C6) is then computed, and each forecast pentad is assigned to the cluster with the minimum distance. The SCSSM onset date is subsequently identified using the synoptic clustering-based definition introduced in Sect. 3.
2.3 Measures of prediction skill
Following Chevuturi et al. (2019, 2021), the prediction skill of the SCSSM OD is evaluated separately for the dependent and independent periods by comparing onset dates diagnosed from SEAS5 hindcasts (1981–2016) and forecasts (2017–2025) with those derived from ERA5 reanalysis. OD are calculated for each individual ensemble member as well as for the ensemble mean, allowing assessment of both deterministic and probabilistic forecast skill. Skill is further evaluated for different initialization months to examine lead-time dependence.
2.3.1 Deterministic prediction skill
The ability of SEAS5 to reproduce the observed interannual variability of the SCSSM OD is quantified using the Pearson correlation coefficient (r) between predicted and observed onset dates. The statistical significance of the correlation is assessed using a two-tailed Student's t test, with p<0.05 indicating significance.
Because correlation alone does not fully characterize predictability, potential predictability is further evaluated using the ratio of predictable component (RPC) (Eade et al., 2014) defined as
where r is the correlation between the ensemble-mean prediction and observations, is the variance of the ensemble mean representing the predictable signal, and is the total variance across all ensemble members. RPC quantifies the consistency between the ensemble-mean forecast signal and the realized forecast skill. An RPC close to unity indicates good agreement between signal amplitude and skill, whereas values below and above unity indicate underconfident and overconfident forecast systems, respectively.
2.3.2 Categorical skill of ensemble-mean forecasts
To evaluate the skill of SEAS5 in predicting the relative timing of SCSSM onset, observed and predicted OD are classified into three tercile-based categories: early, normal, and late. These categories are defined from the historical observed climatology, such that onset dates below the 33.3rd percentile are classified as early, those between the 33.3rd and 66.7th percentiles as normal, and those above the 66.7th percentile as late. This framework provides a balanced reference climatology with equal probability for each category and enables forecast skill to be assessed using standard categorical and probabilistic verification metrics, including the Heidke Skill Score (HSS), Brier Skill Score (BSS), and Ranked Probability Skill Score (RPSS).
For deterministic forecasts based on ensemble-mean OD, categorical prediction skill is quantified using Accuracy (ACC) and the HSS (WCRP, 2015). ACC measures the fraction of correct categorical forecasts relative to the total number of forecasts and is defined as
where C(FiOi) equals 1 if the forecast category Fi matches the observed category Oi (early–normal–late), and 0 otherwise, and N is the total number of forecasts. ACC ranges from 0 (no skill) to 1 (perfect accuracy).
The HSS evaluates forecast accuracy relative to random chance and is defined as
where C(Fi) and n(Oi) denote the marginal frequencies of forecast and observed categories, respectively. The HSS ranges from negative values (worse than random) to 1 (perfect skill), with 0 indicating no skill relative to climatological chance.
2.3.3 Probabilistic skill of ensemble forecasts
Probabilistic prediction skill is evaluated using the full ensemble information. For each forecast, probabilities for the three onset categories (early/normal/late) are defined as the fraction of ensemble members predicting each category. These probabilistic forecasts are verified against observations using the BSS and the RPSS, which assess forecast reliability, resolution, and discrimination relative to a climatological reference forecast. The discrete BSS (dBSS) for each category is defined as
where BSc is the Brier Score for a given category,
where Fi denoting the forecast probability, Oi the observed category indicator (1 for the observed category and 0 otherwise), and N the number of forecasts. The reference score BSclim is computed assuming equal climatological probabilities (). The dBSS ranges from negative values (worse than climatology) to 1 (perfect skill), with 0 indicating no skill.
The discrete RPSS (dRPSS) evaluates cumulative probability errors across ordered onset categories (early–normal–late) and is defined as
where the Ranked Probability Score (RPS) is given by
with C=3 denoting the number of ordered categories. The reference score RPSclim is calculated using climatological probabilities of for each category. The dRPSS similarly ranges from negative values to 1, with 0 indicating no skill relative to climatology, and summarizes forecast errors arising from systematic biases while accounting for discrimination and resolution.
To account for finite ensemble size, a discrete correction term D is applied to both dBSS and dRPSS following Weigel et al. (2007),
where M is the ensemble size and pk is the climatological forecast probability for category k. The correction term is averaged across all years to account for variations in ensemble size and becomes negligible for large ensembles. This correction is particularly important for small ensembles, where limited probability spread can otherwise lead to artificially inflated skill estimates.
3.1 Definition of SCSSM onset based on synoptic circulation regimes
Figure 1 presents the six synoptic circulation regimes (C1–C6) identified from the combination of SOM and K-means clustering, illustrated by composites of 850 hPa winds and geopotential height. Together, these clusters represent the dominant low-level circulation regimes spanning the seasonal transition from pre-monsoon to monsoon conditions. Specifically, clusters C2, C4, and C5 (Fig. 1a–c) are representative of pre-monsoon regimes. These patterns are characterized by easterly or southeasterly low-level flow over the SCS region, associated with the westward extension or persistence of the WNPSH. Geopotential height contours are largely zonal and tightly packed north of the SCS, indicating weak low-level convergence and unfavorable conditions for sustained deep convection over the basin. Consistent with this interpretation, these clusters occur almost exclusively before the SCSSM onset defined by the USCS index of Wang et al. (2004), as reflected by their low post-onset occurrence frequencies (3.1 % for C2, 11.0 % for C4, and 24.0 % for C5).
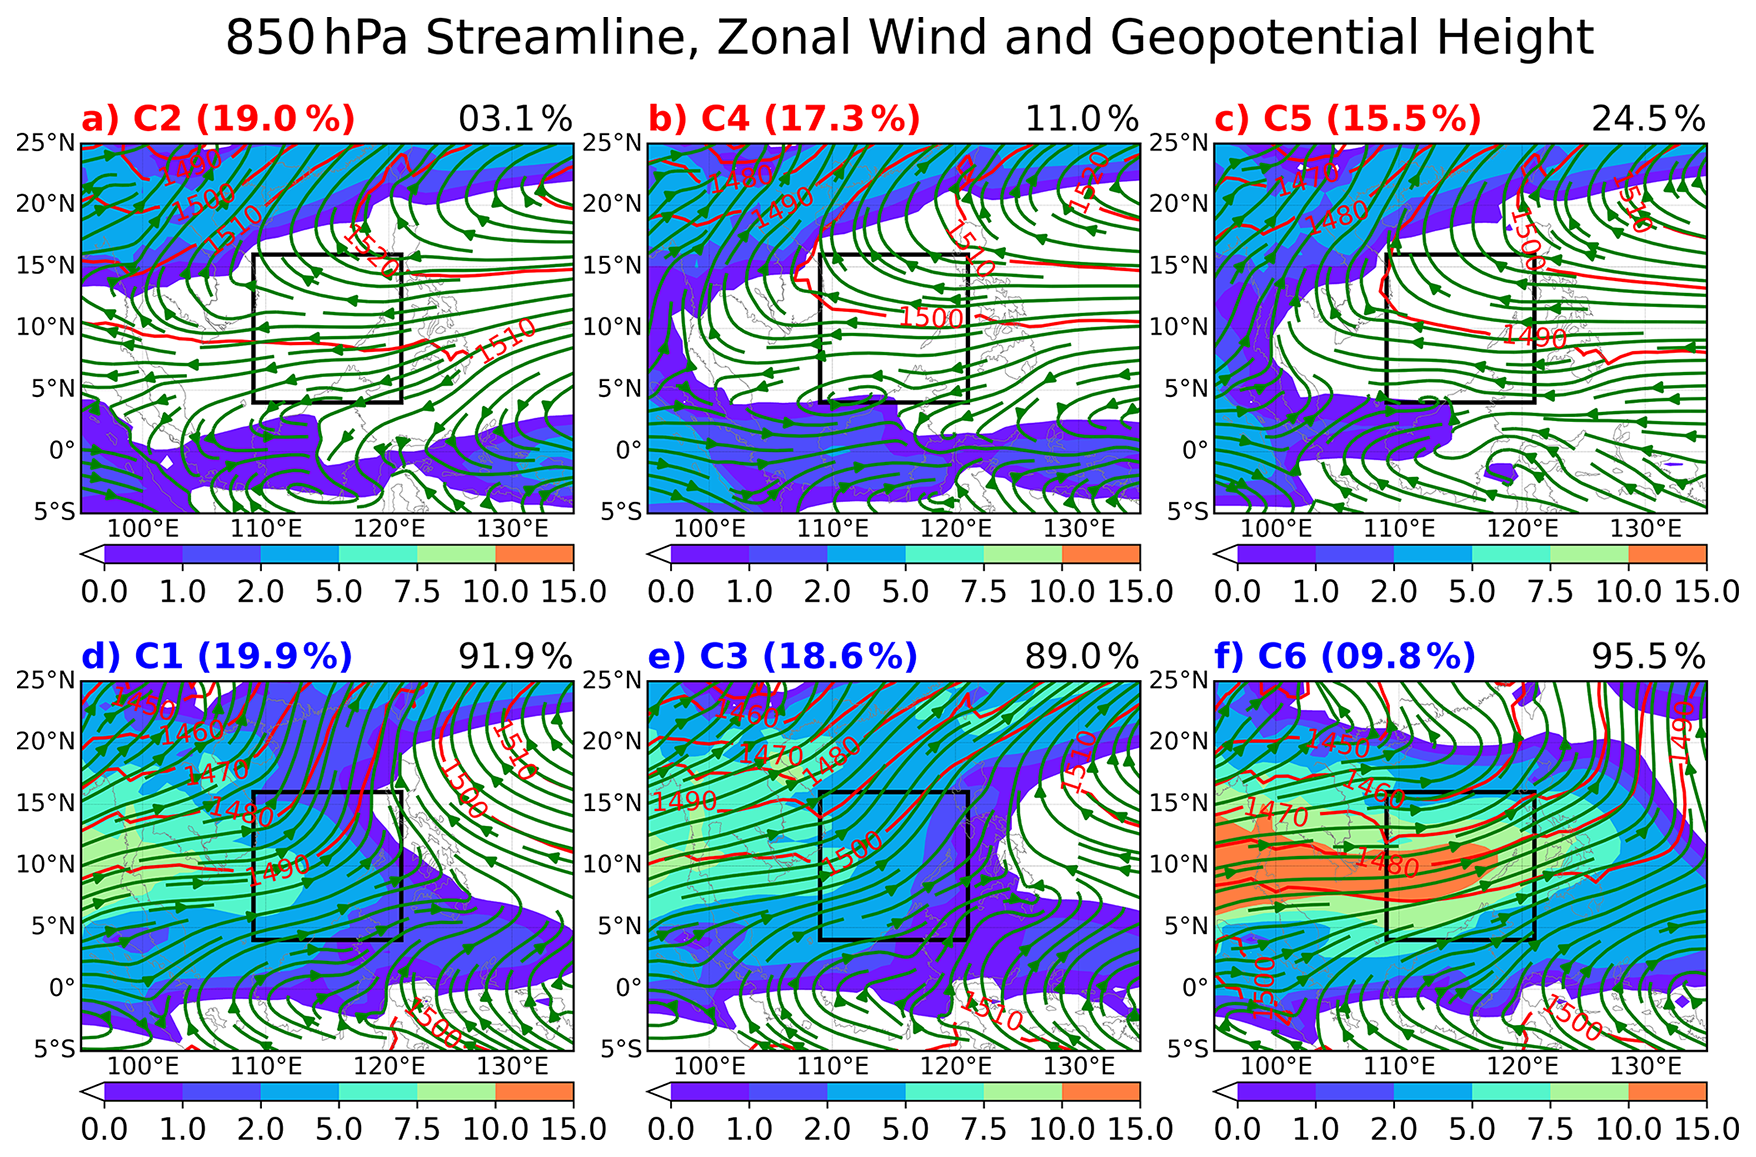
Figure 1Synoptic circulation regimes associated with the SCSSM identified from SOM clustering. Shown are composites of 850 hPa winds (vectors), zonal wind (shades) and geopotential height (contours) for six clusters (C1–C6). The black box denotes the SCS region used for onset definition based on the USCS of Wang et al. (2004). Cluster labels and their relative frequencies of occurrence (%) are shown in each panel, while numbers in the upper-right corner indicate the percentage of occurrences after the SCSSM OD defined by Wang et al. (2004). (a) C2, (b) C4, and (c) C5 represent pre-monsoon regimes, whereas Clusters (d) C1, (e) C3, and (f) C6 correspond to monsoon regimes.
In contrast, clusters C1, C3, and C6 (Fig. 1d–f) correspond to monsoon regimes, characterized by the establishment of low-level westerlies over the SCS and enhanced cyclonic curvature of the flow. These regimes are associated with an eastward retreat and weakening of the WNPSH, strengthened geopotential height gradients across the SCS, and enhanced low-level convergence conducive to deep convection. Among the monsoon regimes, C6 (Fig. 1f) represents the most mature and canonical monsoon state, characterized by strong and spatially coherent southwesterly flow extending across the SCS into the WNP and a pronounced eastward retreat of the WNPSH. This regime occurs almost exclusively after the onset defined by Wang et al. (2004), with a post-onset occurrence frequency of 95.5 %, indicating a fully established monsoon circulation. C3 (Fig. 1e) also corresponds to a mature monsoon regime, exhibiting stronger low-level westerlies over the SCS and a further eastward withdrawal of the WNPSH compared to C1, reflecting a more developed monsoon structure. While C1 (Fig. 1d) represents a relatively weaker or early-stage monsoon circulation, the high post-onset occurrence frequencies of C3 (89.0 %) and C1 (91.9 %) confirm that all three regimes are robustly associated with post-onset monsoon conditions and collectively capture variability in monsoon strength and maturity.
The clear dynamical separation between pre-monsoon and monsoon circulation patterns, together with their contrasting post-onset occurrence frequencies, demonstrates that the combination of SOM and K-means clustering effectively captures the large-scale circulation transition underlying SCSSM onset. Importantly, the presence of multiple monsoon regimes indicates that SCSSM onset is not associated with a single circulation pattern, but rather with a regime transition toward persistent low-level westerlies and enhanced convergence marked by the eastward retreat of the WNPSH over the SCS. Based on this regime framework, the OD of the SCSSM can be defined objectively using synoptic circulation transitions rather than a single-variable threshold.
The OD of the SCSSM is defined as the first pentad from pentad 24 (26–30 April onward) that satisfies the following two criteria: (a) Regime continuity criterion: both the onset pentad and the subsequent pentad must belong to the monsoon regimes (C1, C3, or C6); and (b) Mature monsoon condition: within the subsequent four pentads (including the onset pentad), cluster C3 or C6 must occur at least once.
The first criterion ensures that the identified onset reflects a genuine transition into a monsoon regime rather than a transient synoptic fluctuation, thereby excluding “bogus” onsets associated with brief westerly intrusions (Wang et al., 2004). The second criterion requires the emergence of C3 or C6, which represent more developed monsoon circulation states, thereby ensuring that the identified onset is followed by a sufficiently mature and dynamically robust monsoon configuration. Together, these criteria identify SCSSM onset as a regime transition associated with the establishment of low-level westerlies over the SCS and the retreat of the WNPSH, providing a dynamically grounded alternative to traditional single-index onset definitions.
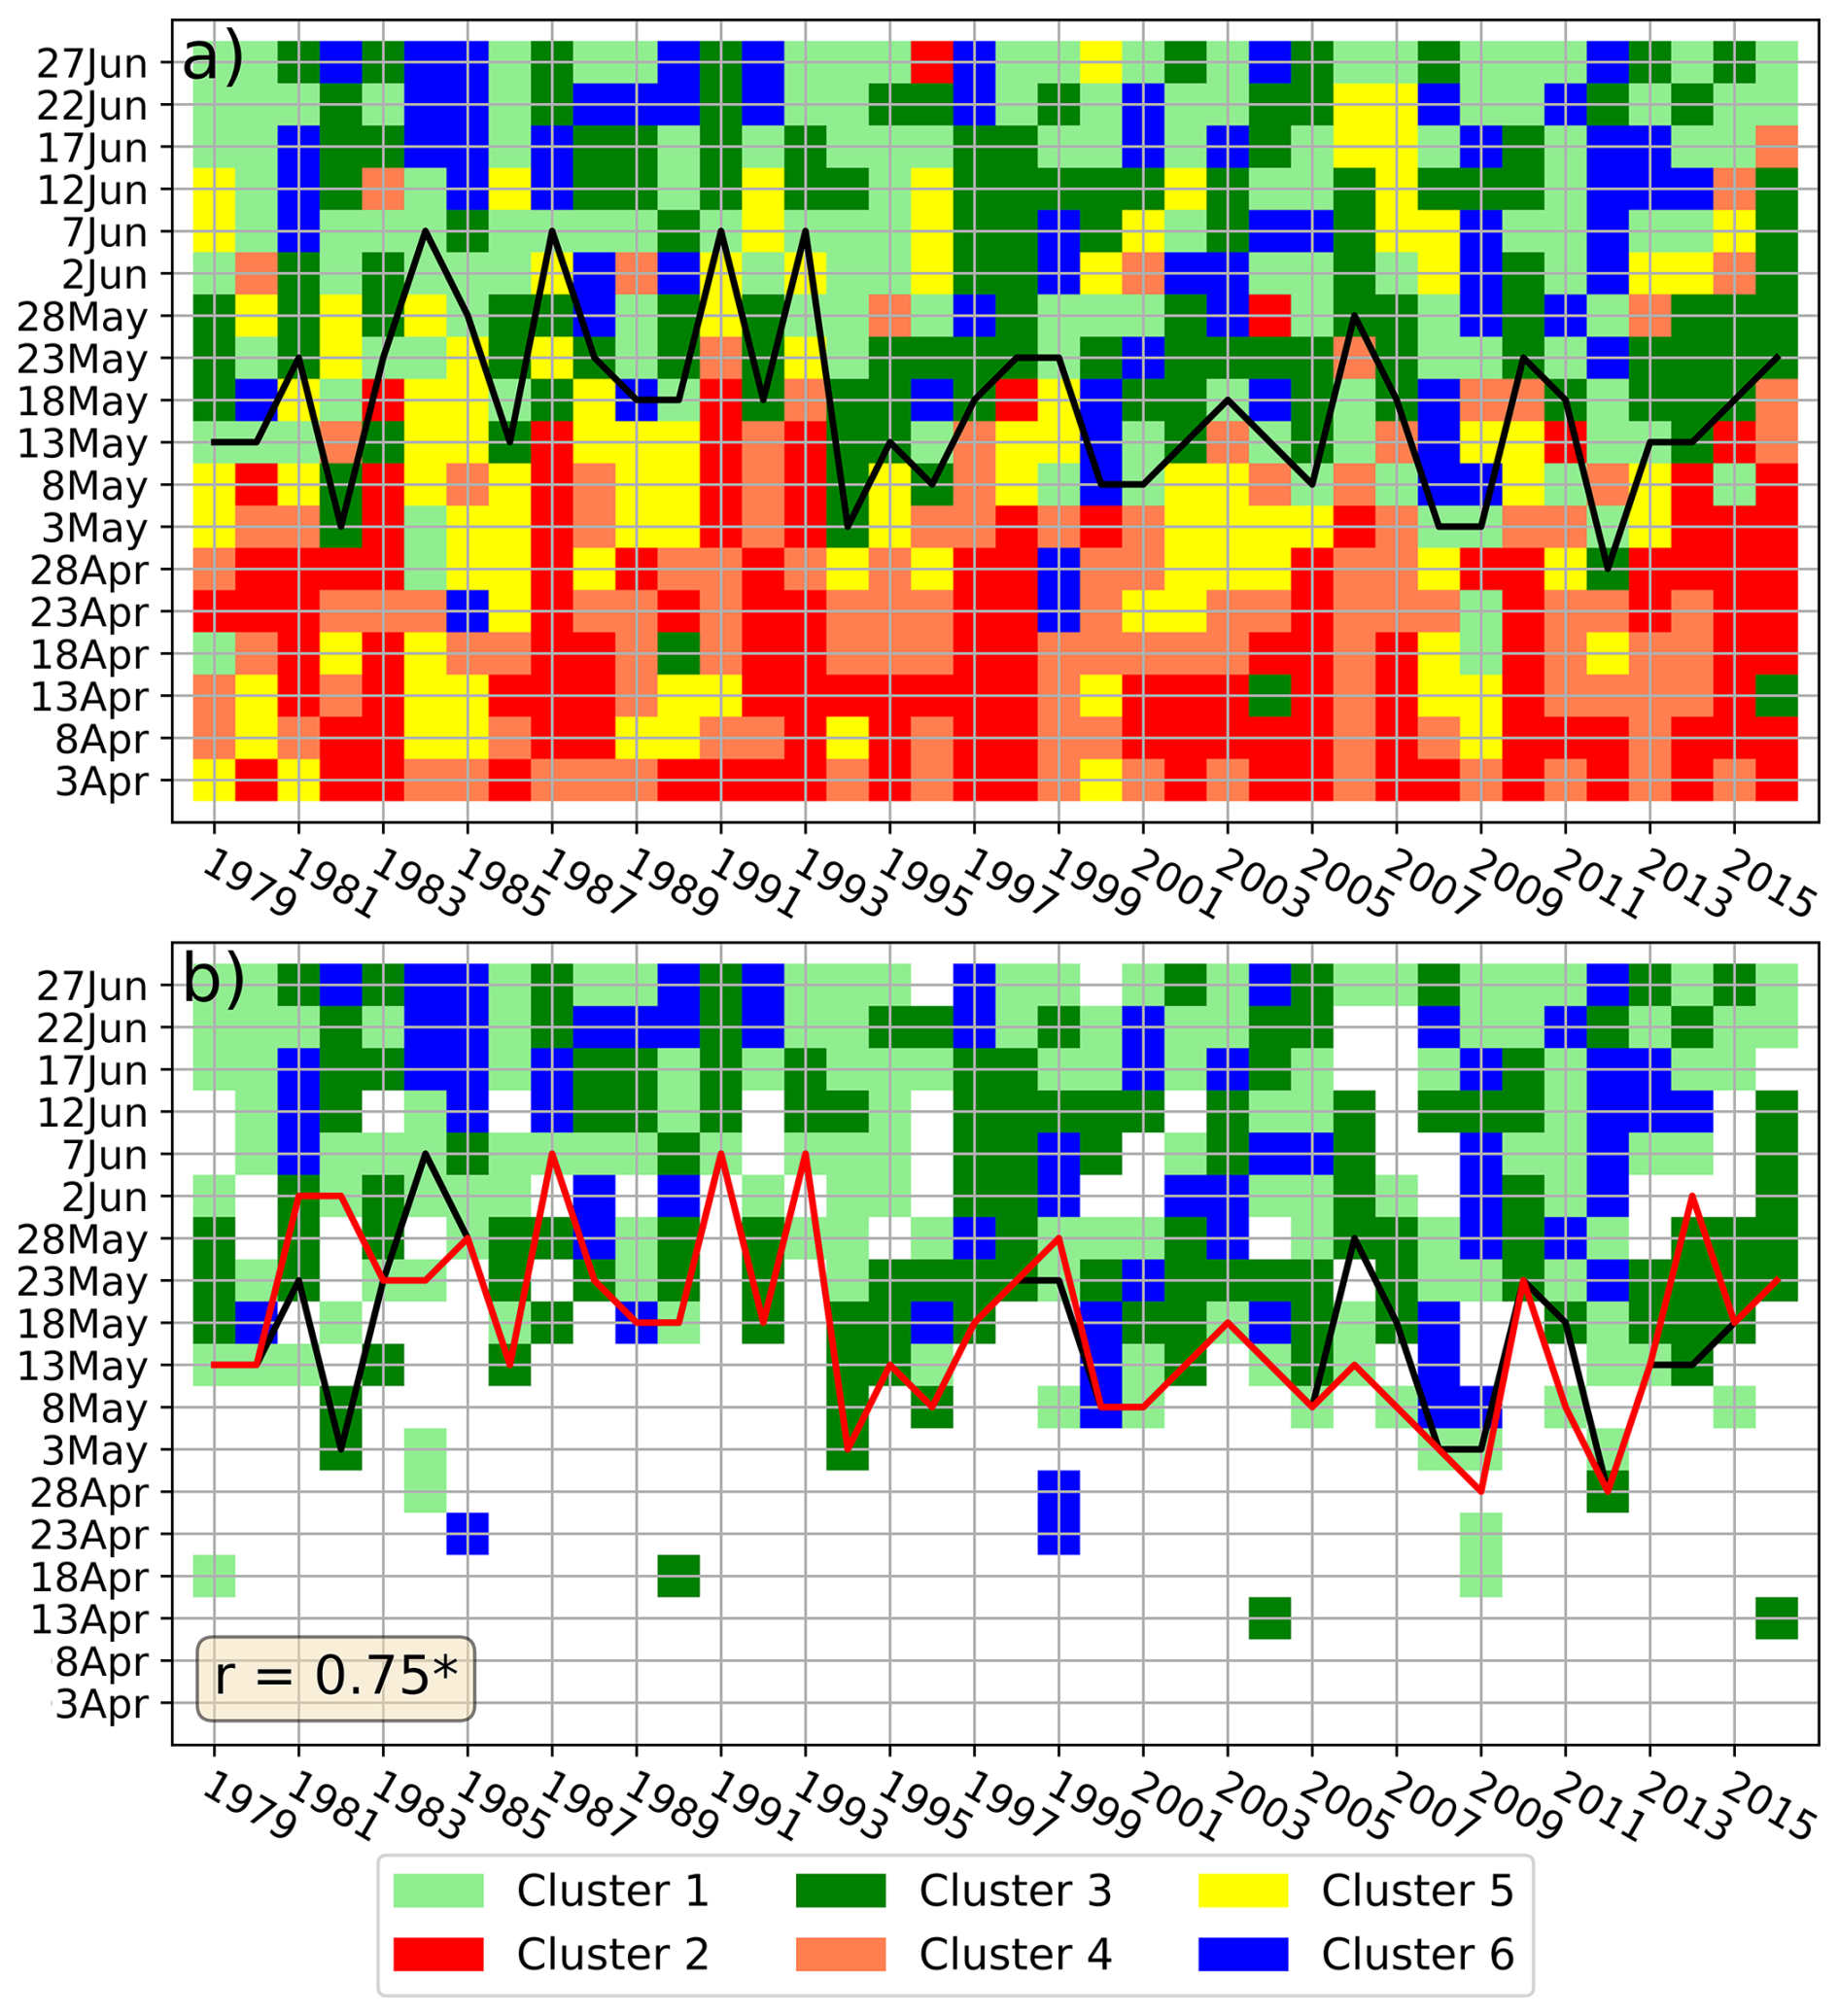
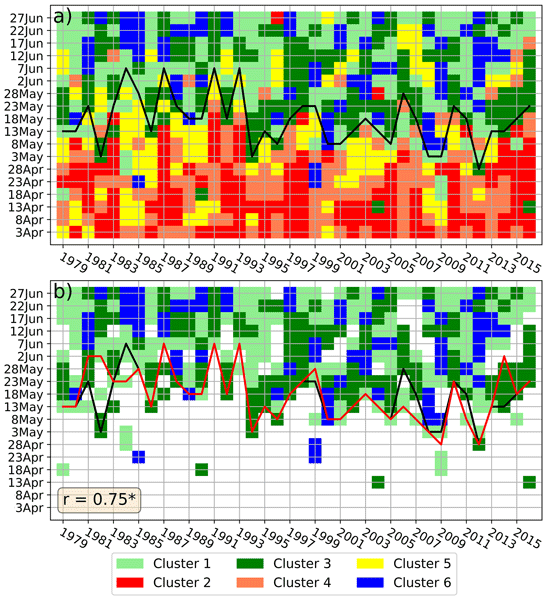
Figure 2Interannual evolution of synoptic circulation regimes and SCSSM onset date (OD). Colored shading indicates the dominant synoptic circulation regime (C1–C6) for each pentad from early April to late June in individual years during 1979–2016. (a) Onset dates identified by the synoptic clustering-based definition in the present study are indicated by the black line. (b) Comparison between onset dates identified by the synoptic clustering-based definition (black line) and those identified by the USCS-based definition of Wang et al. (2004) (red line). The two onset time series are significantly correlated (r=0.75, p<0.01). Only the monsoon regimes (C1, C3, and C6) are shown in (b).
Figure 2 compares the SCSSM OD identified using the synoptic clustering-based definition (NL26; red line) with those derived from the USCS index of Wang et al. (2004) (W04; black line). The two definitions agree well, with a statistically significant correlation of 0.75 (p<0.01), indicating that the clustering-based definition captures the dominant interannual variability of SCSSM onset timing represented by the conventional circulation-based index. This overall agreement suggests that the new framework remains broadly consistent with established onset metrics while being explicitly grounded in large-scale circulation regimes. Nevertheless, the two definitions differ in several years because they emphasize different aspects of the onset transition. The W04 definition is based on the crossing of a regional low-level zonal-wind threshold and can therefore identify onset when westerlies emerge over the SCS, even if the broader circulation has not yet fully transitioned into a mature monsoon regime. By contrast, the NL26 definition requires a continuous transition into one of the monsoon regimes in two consecutive pentads and further requires the occurrence of cluster C3 or C6 within the subsequent four pentads, thereby ensuring that the identified onset is followed by a more developed monsoon circulation state.
Representative examples are shown in Figs. S4–S6 in the Supplement. In 2014 (Fig. S4), NL26 identifies onset earlier than W04 because a coherent monsoon-type circulation had already been established by 13 May, with southwesterly flow extending from the Indian Ocean across the Indochina Peninsula into the southern and western SCS, along with an eastward retreat of the WNPSH, even though the area-averaged USCS threshold had not yet been met. Particularly in 1982 (Fig. S5), which shows the largest discrepancy between the two definitions, NL26 identifies onset much earlier, on 3 May, because the circulation in early May already exhibited a monsoon-like spatial organization. On 3 and 8 May, southwesterly flow extended from the eastern Indian Ocean across Indochina into the western and central SCS, and the WNPSH had retreated eastward, indicating an early large-scale reorganization toward a monsoon regime. However, during the following three pentads, the circulation over the SCS became weaker and more transitional again, and the USCS remained weak or negative. This interrupted evolution may also have been influenced by Typhoon Pat, which occurred from 13–23 May 1982 and could have contributed to the disturbed low-level circulation over the SCS during the period when the two definitions diverged most strongly. From 28 May onward, the monsoon flow re-intensified and expanded westward and northward, covering nearly all of Indochina and extending into southern China, indicating the recovery of the summer monsoon circulation. As a result, W04 did not identify onset until 2 June, when stronger and more widespread low-level westerlies were finally re-established over the basin. In contrast, in 2006 (Fig. S6), W04 identifies onset earlier than NL26 because the USCS threshold was crossed on 13 May during an early westerly event, while the broader circulation over the SCS remained transitional and lacked a coherent monsoon structure. This early westerly surge may also have been influenced by Typhoon Chanchu, which has been suggested as an important contributor to the unusually early SCSSM onset signal in 2006 (Mao and Wu, 2008). A more robust monsoon regime, with sustained southwesterlies and clearer large-scale reorganization, was not established until 28 May, when NL26 identifies onset. These examples suggest that NL26 can reduce sensitivity to isolated zonal-wind threshold crossings and better captures the structural maturity of the monsoon circulation. Overall, the NL26 definition preserves the large-scale timing of SCSSM onset while providing a more dynamically constrained and physically interpretable identification, supporting its use in seasonal prediction.
It should be noted that the advantage of NL26 is not simply the addition of a persistence requirement. A persistence-filtered USCS index could reduce some false onsets associated with brief wind reversals, but it would still be based on a single area-averaged variable. By contrast, NL26 identifies onset through the evolution of multivariate circulation regimes, thereby incorporating the spatial coherence of low-level winds, the retreat of the WNPSH, and the structural maturity of the monsoon circulation. This distinction explains why NL26 can differ from W04 even when both are applied at the pentad scale.
3.2 Climatological evolution and interannual modulation of SCSSM onset
Figure 3 illustrates the climatological evolution of low-level circulation from two pentads prior to SCSSM onset to three pentads after onset, based on the synoptic clustering-based definition. The composites show 850 hPa winds and geopotential height, with the black box indicating the SCS region used to calculate area-averaged U850 (USCS). During the pre-onset phase P[−2] and P[−1] (Fig. 3a and b), the SCS is dominated by easterly to northeasterly low-level flow, reflected by negative USCS values (−2.5 and , respectively). This circulation is associated with a westward-extending WNPSH, as indicated by the orientation and packing of geopotential height contours north of the SCS. Low-level convergence over the basin is weak, consistent with suppressed convective conditions characteristic of the pre-monsoon regime.
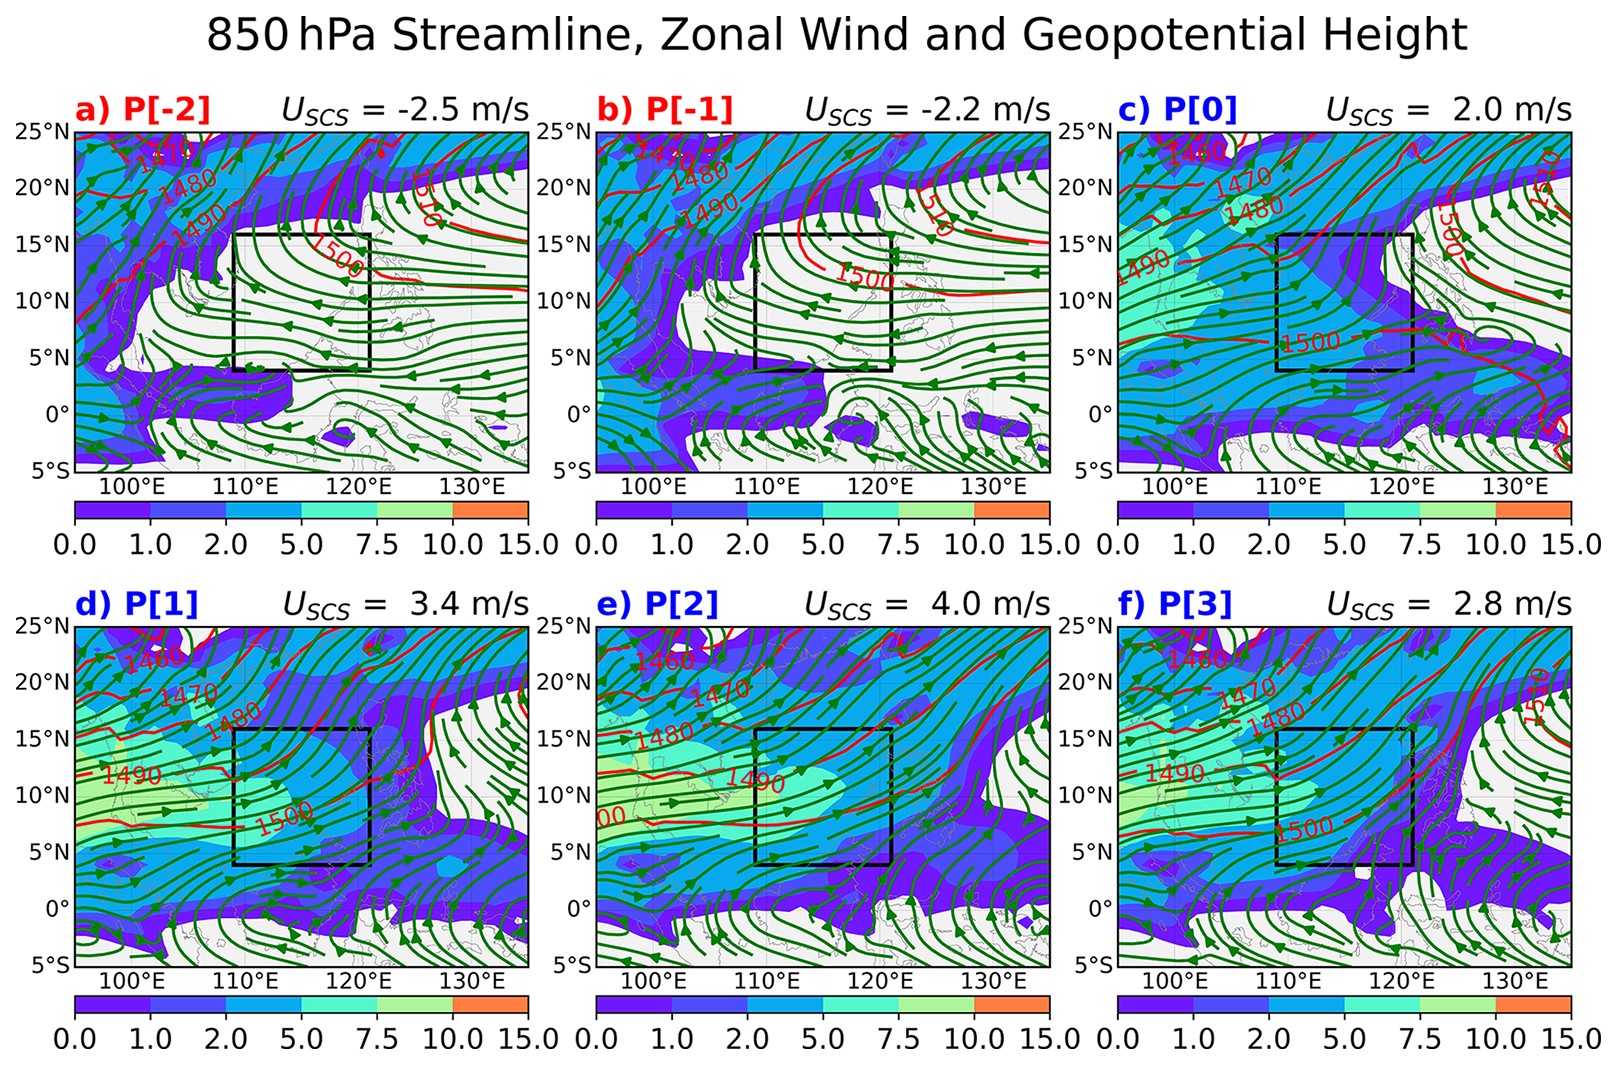
Figure 3Climatological evolution of 850 hPa winds (vectors; m s−1), zonal wind (U850; shades; m s−1) and geopotential height (Z850; contours; m) from two pentads before to three pentads after the SCSSM onset, based on the synoptic clustering-based definition. Panels show composites for P[−2] and P[−1] (pre-onset), P[0] (onset), and P[1]–P[3] (post-onset). The black box denotes the SCS region used to compute the area-averaged U850 (USCS), whose values are indicated in the upper-right corner of each panel.
At the onset pentad P[0] (Fig. 3c), an abrupt circulation transition occurs. Low-level winds over the SCS reverse to westerly, with USCS becoming positive (2.0 m s−1), marking the establishment of monsoon flow. This transition is accompanied by an eastward retreat of the WNPSH and enhanced meridional geopotential height gradients across the SCS, indicating strengthened low-level convergence favorable for deep convection.
In the post-onset period P[1]–P[3] (Fig. 3d–f), westerly flow intensifies and becomes more spatially coherent across the SCS, with USCS increasing to 3.4–4.0 m s−1 before slightly weakening by P[3]. The circulation exhibits a well-developed monsoon structure, characterized by persistent southwesterlies extending from the equatorial Indian Ocean into the SCS and WNP. The sustained positive USCS and stable geopotential height configuration demonstrate that the onset identified by the clustering-based definition corresponds to a robust and persistent transition into the summer monsoon regime rather than a transient wind reversal.
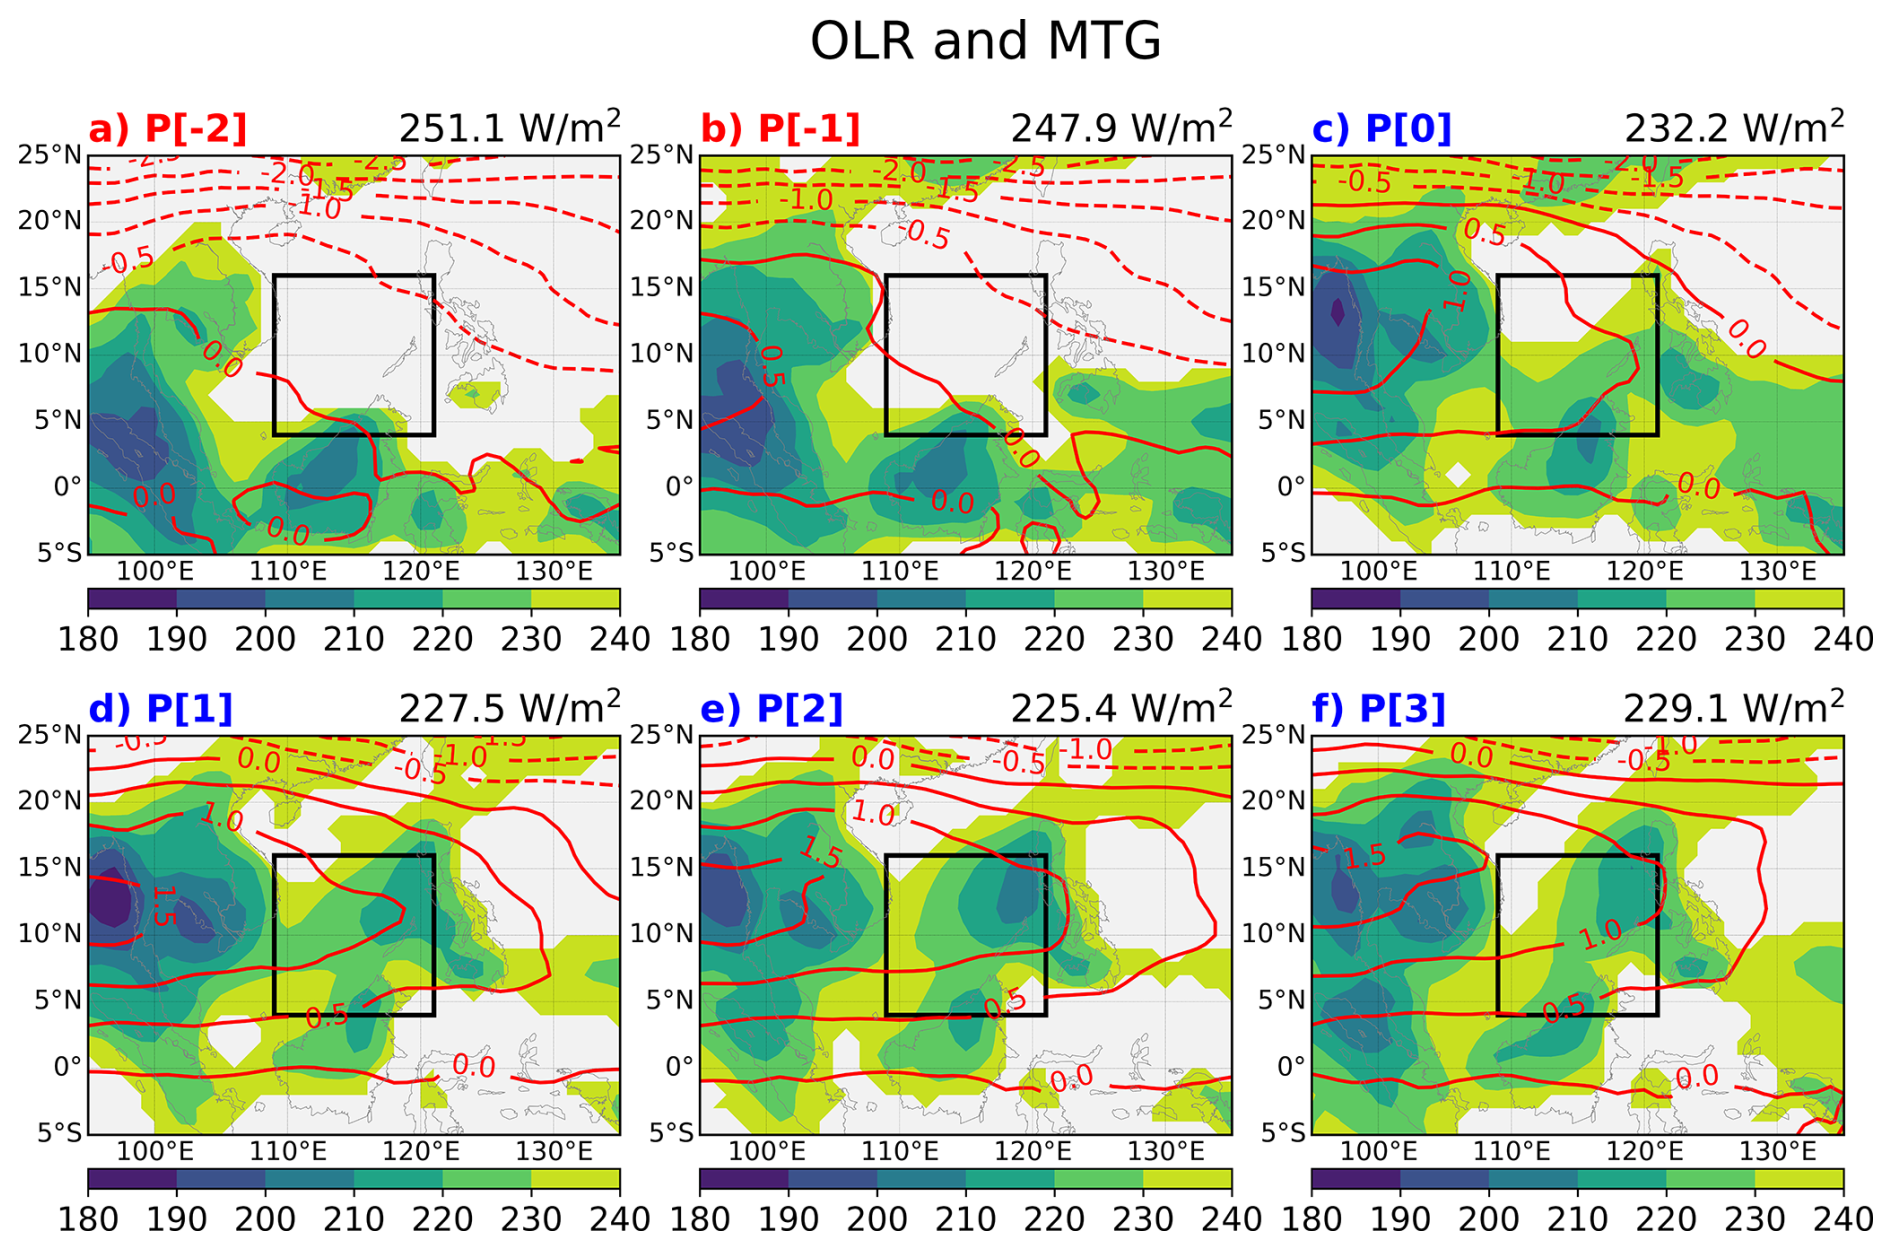
Figure 4Climatological evolution of outgoing longwave radiation (OLR; shading; W m−2) and meridional temperature gradient (MTG; contours; K per 1000 km) from two pentads before to three pentads after the SCSSM onset, based on the synoptic clustering-based definition. Panels show composites for P[−2] and P[−1] (pre-onset), P[0] (onset), and P[1]–P[3] (post-onset). The black box indicates the South China Sea (SCS) region used to calculate the area-averaged OLRSCS, and the corresponding values are shown in the upper-right corner of each panel.
Figure 4 further examines the thermodynamic and convective evolution associated with the synoptic clustering-based SCSSM onset definition using pentad composites of OLR and MTG. During the pre-onset phase, relatively high OLR values persist over the SCS, with area-averaged values (OLRSCS) remaining above 240 W m−2, indicating weak or suppressed convection. Over the same period, MTG over the SCS is weak and locally negative, indicating that the meridional thermal contrast in the middle-to-upper troposphere remains unfavorable for the establishment of monsoon circulation. From the onset pentad onward, however, area-averaged OLRSCS decreases markedly to below 240 W m−2, indicating enhanced deep convection, while MTG becomes positive over most of the SCS, reflecting the development of a thermally favorable large-scale environment for monsoon onset. These features persist through the subsequent pentads, consistent with the sustained circulation transition shown in Fig. 3. Together, Figs. 3 and 4 indicate that the onset identified by the clustering-based definition is not only dynamically consistent in terms of low-level circulation reorganization but is also accompanied by robust convective and thermodynamic signatures.
Interannual variations in the timing of this transition are influenced by slowly varying large-scale boundary conditions, including tropical SST anomalies, which modulate the background circulation over the Indo-western Pacific. To avoid interrupting the climatological narrative, composite SST and 850 hPa wind anomalies associated with early and late onset years during the preceding winter and spring are presented in Fig. S7 in the Supplement. These composites show that early onset years are generally associated with La Niña-like conditions and a circulation background more favorable for earlier establishment of low-level westerlies over the SCS, whereas late onset years are associated with El Niño-like conditions and a strengthened WNPSH that delays the monsoon transition. Therefore, the onset timing identified by the NL26 definition can be interpreted as arising from the interaction between a slowly varying large-scale background state and the rapid transition into monsoon circulation regimes documented in Figs. 3 and 4.
This section examines the applicability of the synoptic clustering-based SCSSM onset definition to seasonal prediction using SEAS5 forecasts. Prediction skill is evaluated separately for a dependent period (1981–2016) and an independent forecast period (2017–2025) to assess both in-sample performance and out-of-sample robustness. Forecast results based on the clustering-based definition proposed in this study (NL26) are systematically compared with those based on the conventional USCS-based definition of W04. This comparison is performed separately for each initialization month, allowing the added value of NL26 to be assessed under the same lead time as W04.
4.1 Prediction skill during the training (hindcast) period (1981–2016)
First, performance of the ECMWF SEAS5 seasonal prediction system in forecasting SCSSM OD using both the W04 and NL26 definitions is evaluated during the dependent training period (1981–2016). Forecasts initialized from December (approximately five-month lead time) to April (one-month lead time) are examined to assess lead-time dependence, and both deterministic and probabilistic skill metrics are considered.
4.1.1 Deterministic prediction skill
Figure 5 shows the deterministic hindcast skill of SEAS5 when SCSSM onset is defined using W04. Correlation coefficients between the ensemble-mean predictions and observed onset dates range from 0.31–0.45, with statistically significant skill only for the February (r=0.43) and April (r=0.45) initializations. Although the forecast system captures part of the interannual variability, the overall skill remains modest, particularly at longer lead times. The corresponding RPC values are consistently below unity (0.41–0.61), indicating an underconfident forecast system in which the ensemble-mean signal is weaker than implied by the achieved skill. This behavior suggests that, in some years, onset dates defined by the USCS threshold can be affected by transient westerly events that are not yet accompanied by a coherent basin-scale monsoon transition, as illustrated by the 2006 case in Fig. S5, which reduces deterministic predictability even during the dependent period.
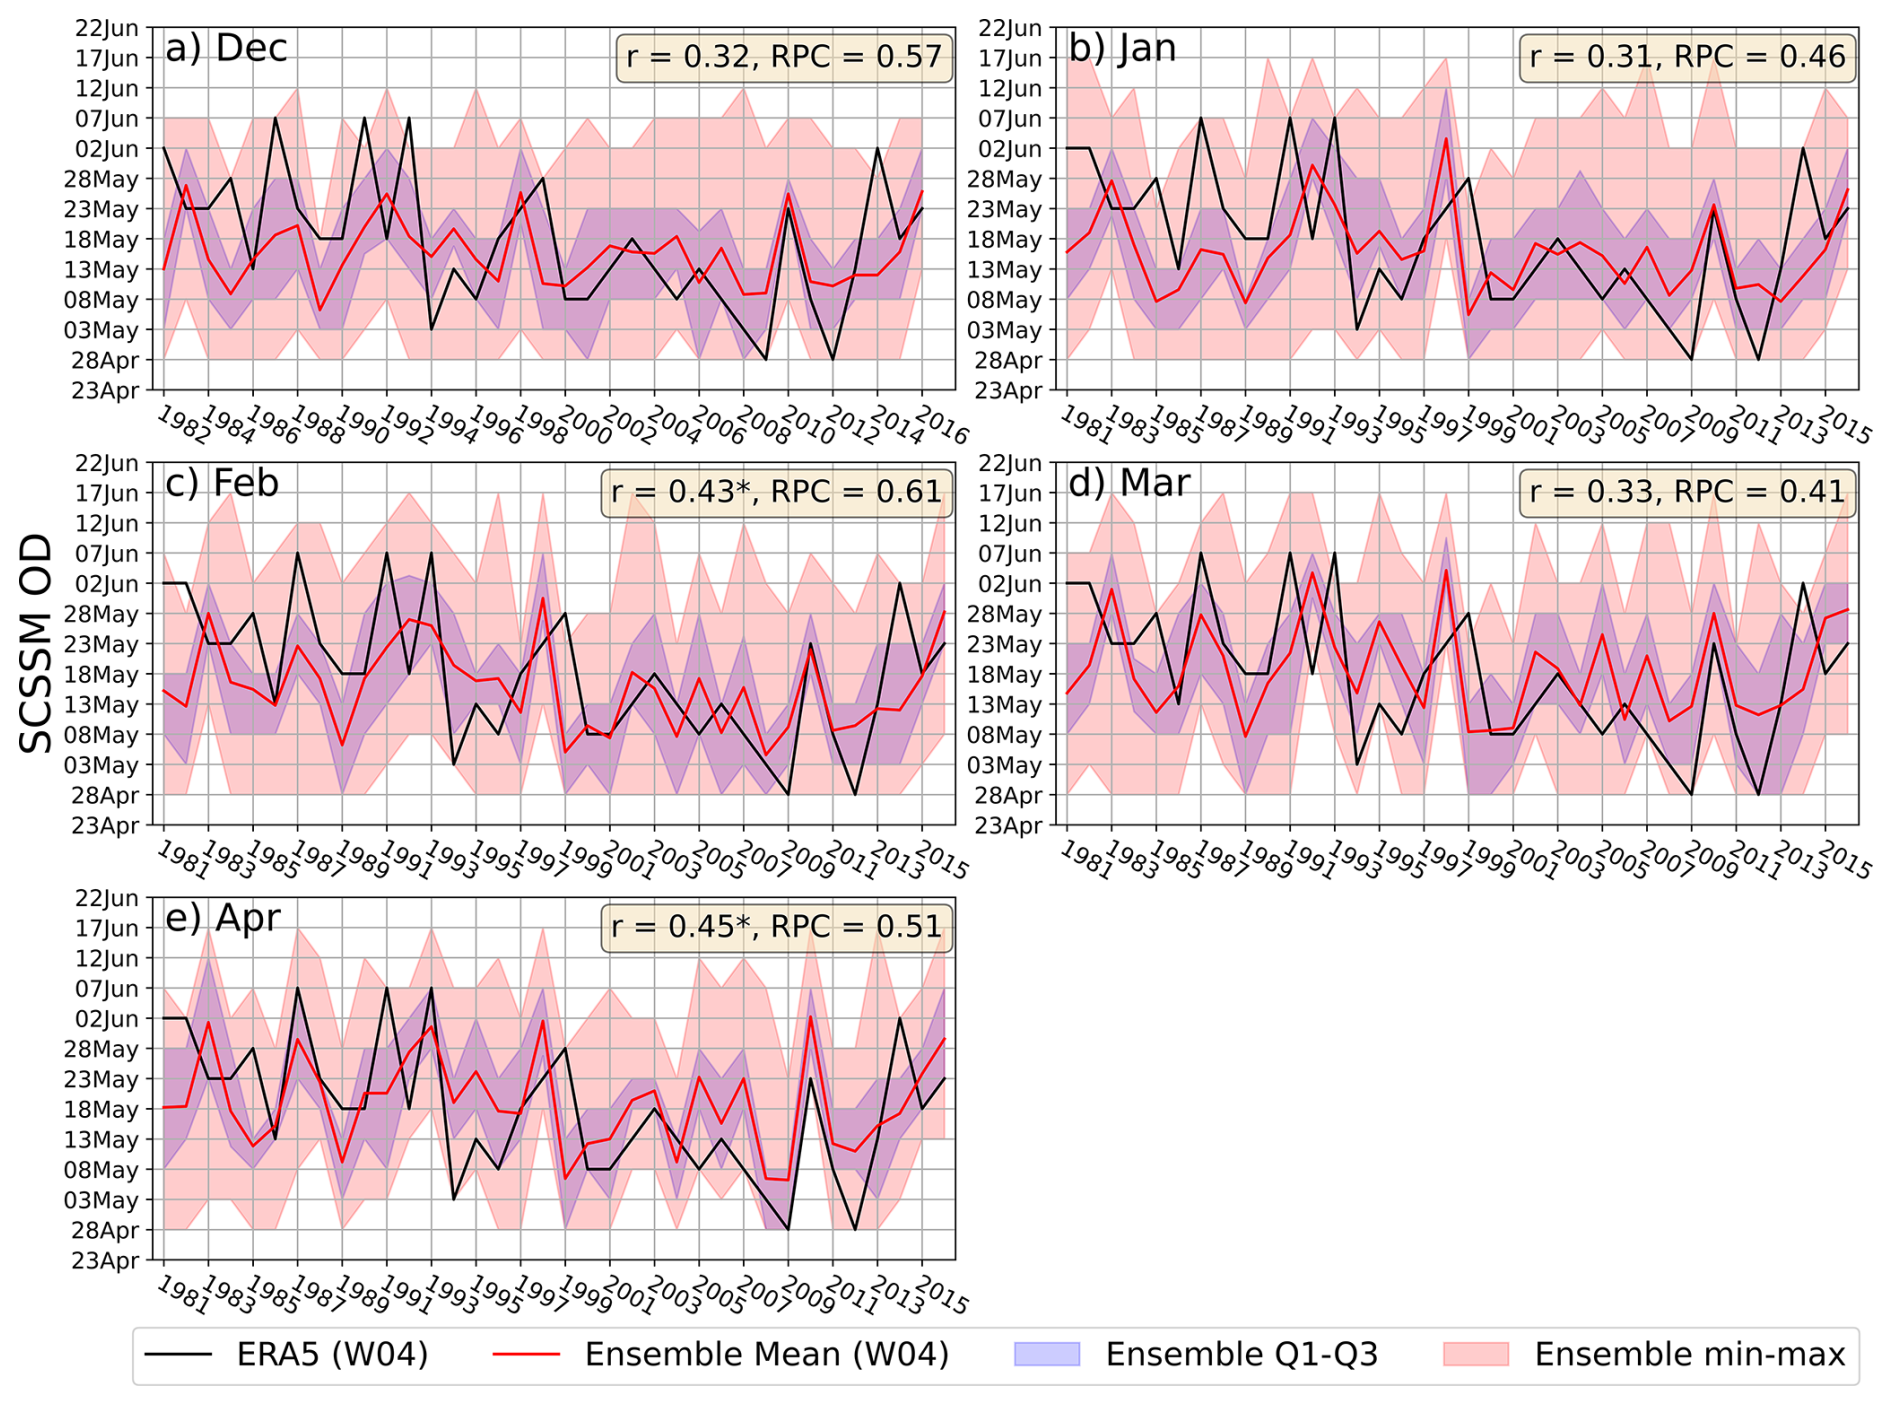
Figure 5Hindcast performance of the ECMWF SEAS5 system in predicting SCSSM onset during the dependent training period (1981–2016) using the U850-based definition of Wang et al. (2004). Time series show observed onset dates from ERA5 (black) and ensemble-mean predictions (red) for forecasts initialized from December–April. Blue shading denotes the interquartile range (Q1–Q3), while red shading indicates the full ensemble spread. The Pearson correlation coefficient (r) and ratio of predictable component (RPC) are shown for each initialization month. The * denotes r is statistically significant at the 95 % confidence level.
In contrast, Fig. 6 shows a clear improvement in deterministic forecast skill when the NL26 definition is applied. Correlation coefficients increase to 0.34–0.51, with statistically significant skill for all initialization months. The strongest skill is obtained for the February (r=0.50) and April (r=0.51) initializations, but improvement is already evident at longer lead times. For example, the December-initialized forecast correlation increases from 0.32 under W04 to 0.49 under NL26, indicating that the clustering-based definition is more strongly linked to the slowly varying large-scale circulation signals that seasonal forecast systems can capture.
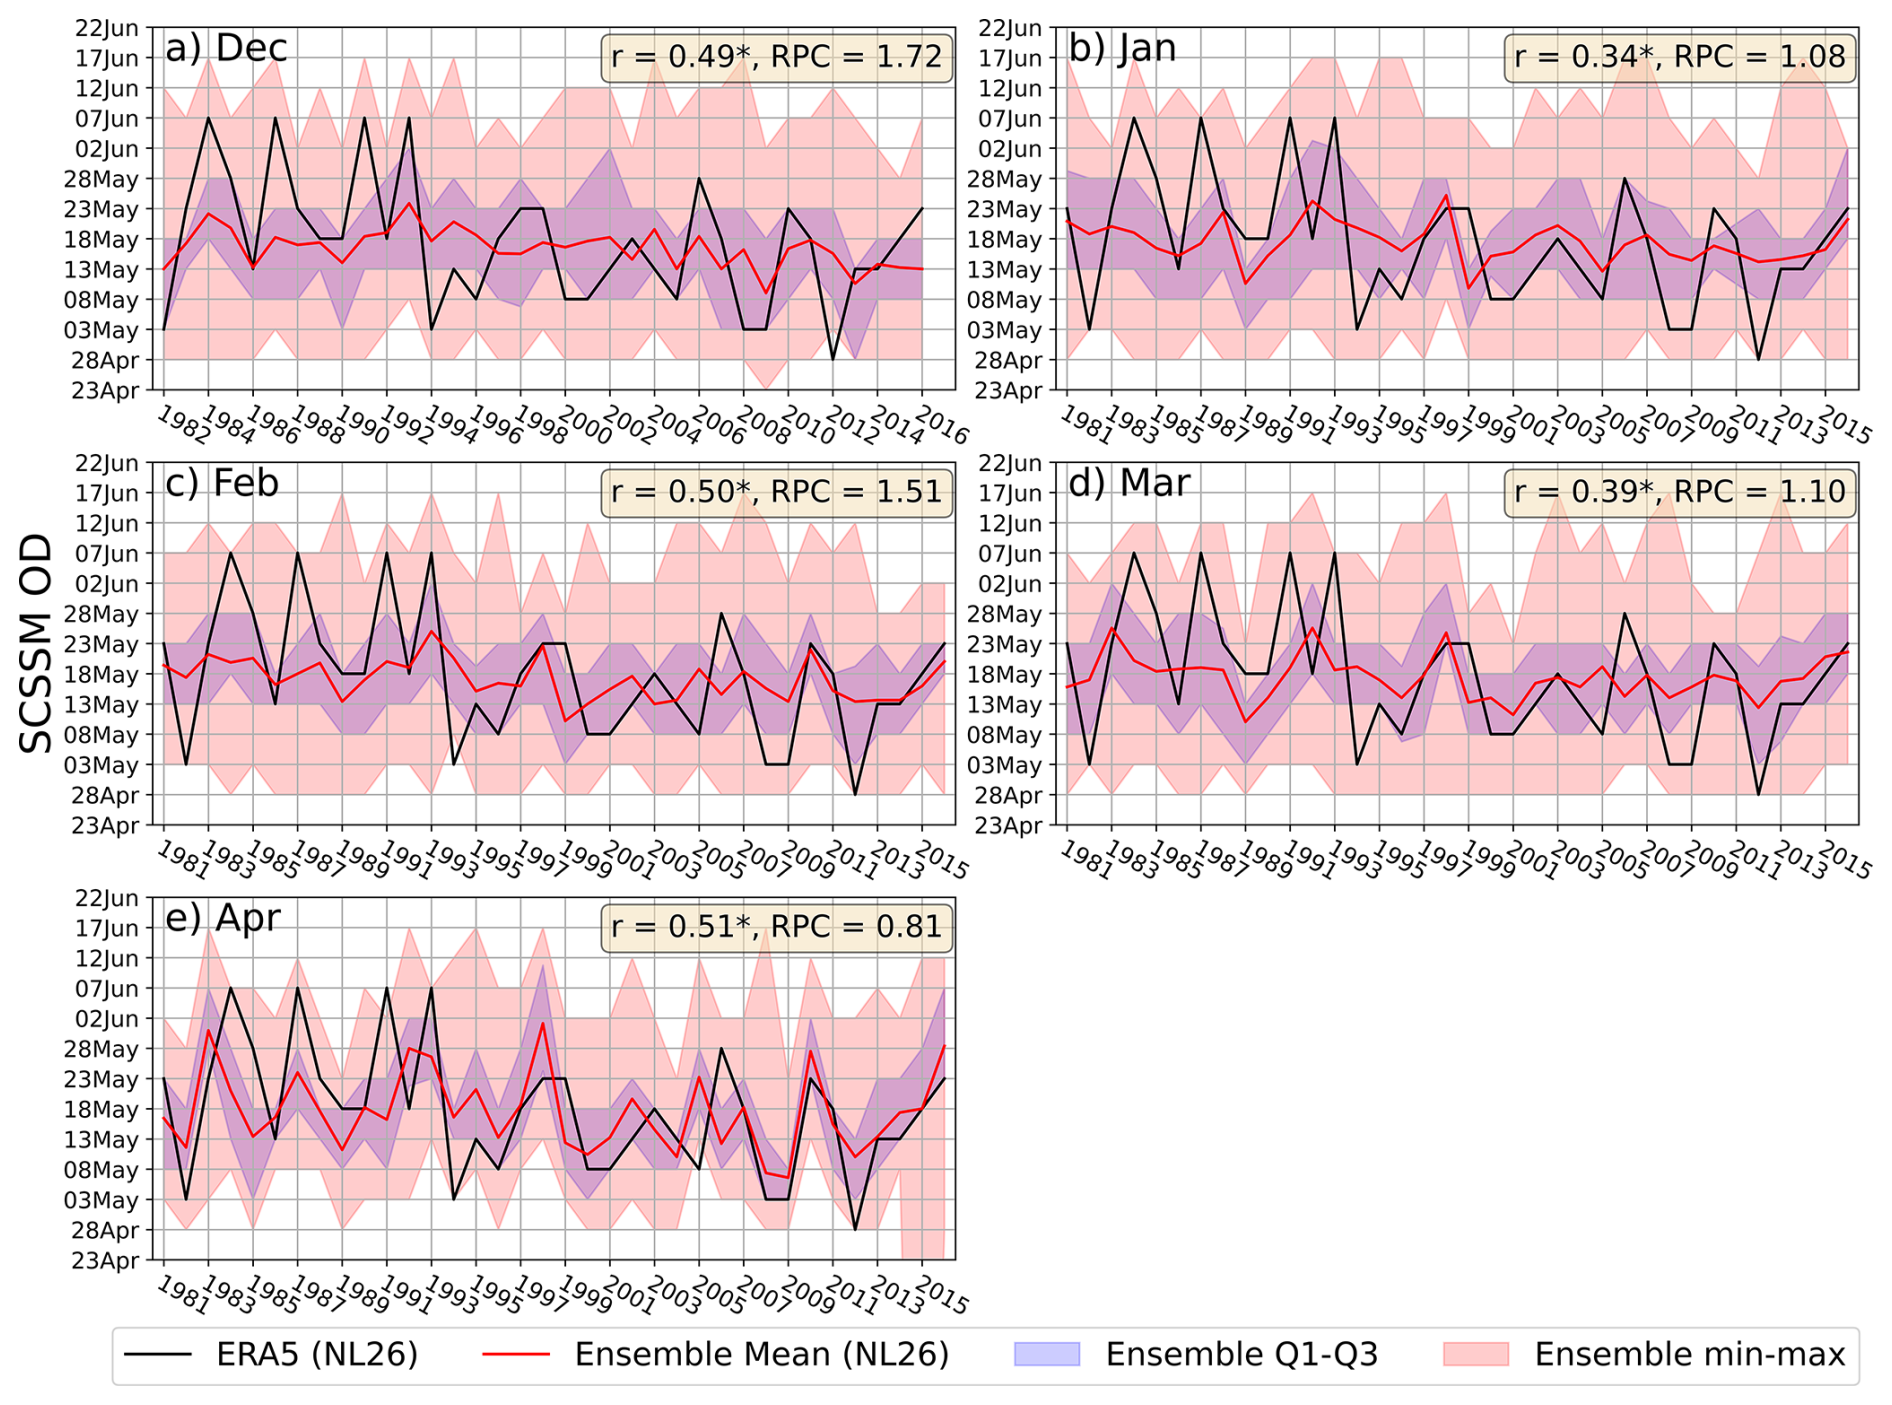
Figure 6Same as Fig. 5, but for SCSSM OD defined using the synoptic clustering-based definition (NL26).
The RPC values also increase substantially under NL26, ranging from 0.81–1.72. For January and March initializations, RPC values are close to unity (1.08 and 1.10, respectively), indicating good consistency between the ensemble-mean signal and the realized forecast skill. For December and February, however, RPC exceeds 1 more clearly (1.72 and 1.51), suggesting that the ensemble-mean signal amplitude is stronger than would be expected from the achieved skill alone. Even so, the marked increase in both r and RPC relative to W04 suggests that the clustering-based definition reduces sensitivity to isolated threshold-crossing events and aligns the onset metric more closely with coherent large-scale circulation features represented in SEAS5. In addition, the lead-time dependence is not strictly monotonic. Skill for January and March initializations is slightly lower than for December and February, respectively. This behavior likely reflects the limited sample size, initialization-dependent model errors, and the mixed influence of slowly varying boundary forcing and subseasonal circulation variability on SCSSM onset. Thus, shorter lead time does not necessarily guarantee higher onset-prediction skill.
Figure 7 further tests whether the improved deterministic skill under NL26 is simply a consequence of verifying the forecast against its own target definition. In this cross-index validation (CIV), the observed onset dates are defined using W04, whereas the forecast onset dates are still derived using NL26. The correlations remain statistically significant for all initialization months, ranging from 0.33–0.44. Although these values are generally lower than those obtained when NL26 forecasts are verified against NL26 observations (cf. Fig. 6), they are comparable to or slightly higher than those obtained using W04 for both prediction and verification (cf. Fig. 5), especially for the December, January, and March initializations. This result indicates that the improvement associated with NL26 is not solely an artifact of matched-definition verification.
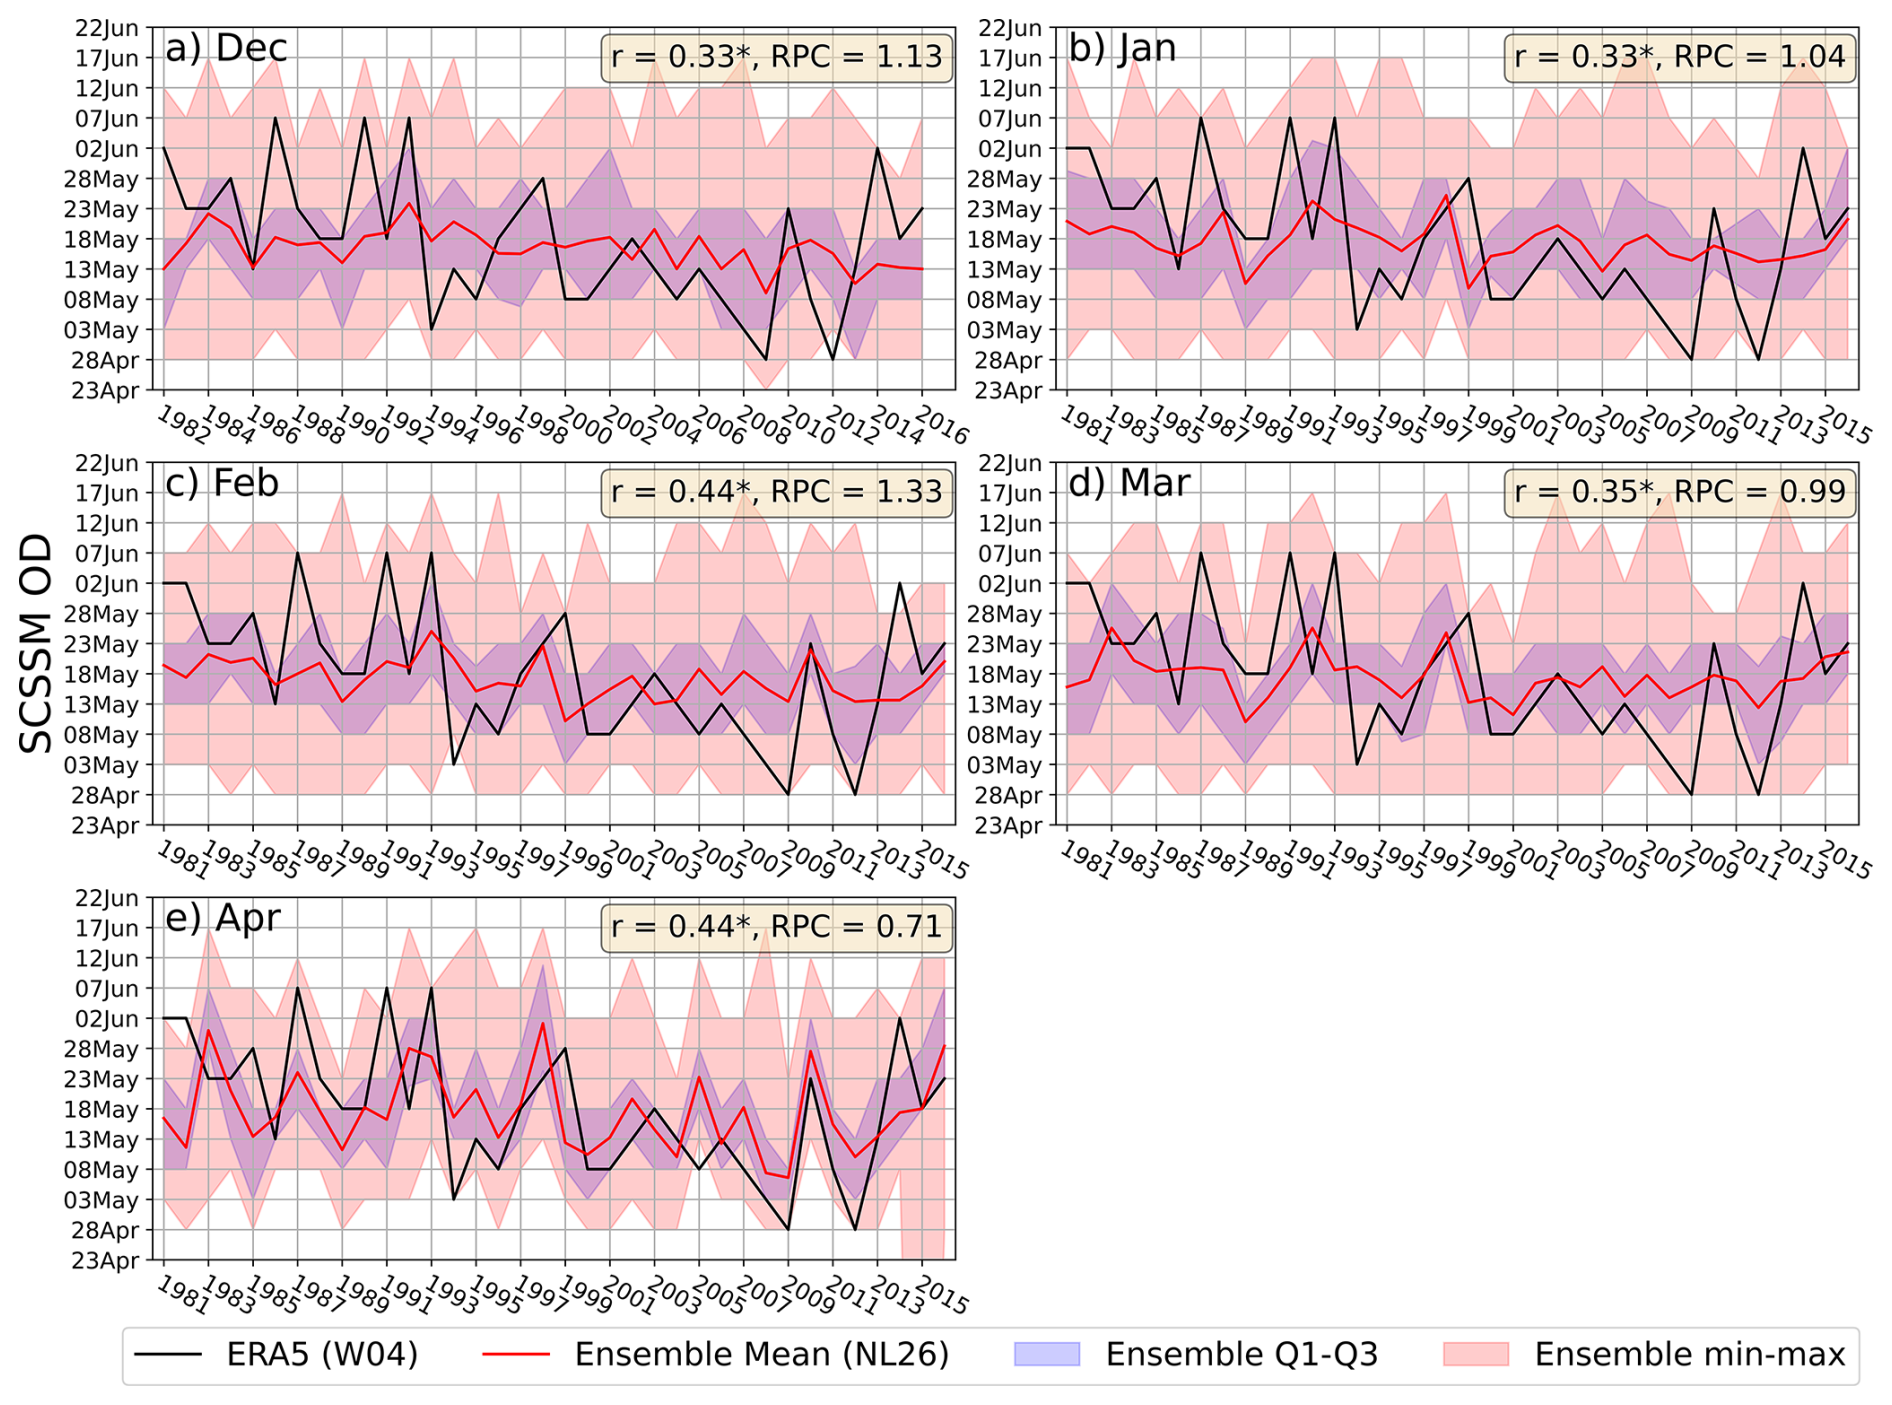
Figure 7Same as Fig. 5, but for cross-index validation (CIV), in which the observed SCSSM onset date is defined using W04, while the predicted onset date from SEAS5 is derived using the synoptic clustering-based definition (NL26).
The RPC values in the CIV range from 0.71–1.33. These values are generally closer to unity than those in the matched NL26 verification for several initialization months, particularly January and March, suggesting a more balanced relationship between ensemble-mean signal amplitude and realized forecast skill in the cross-index framework. Overall, the cross-index results support the practical forecasting value of the clustering-based definition: even when evaluated against the conventional W04 observational benchmark, NL26-based forecasts retain meaningful deterministic skill and outperform or match the conventional W04-based forecasts at most lead times.
4.1.2 Categorical and probabilistic prediction skill
Figure 8 compares the categorical and probabilistic prediction skill of SEAS5 under the W04, NL26, and CIV frameworks using ACC, HSS, category-specific BSS, and RPSS. For deterministic categorical skill (Fig. 8a and b), NL26 consistently outperforms W04 across all initialization months. ACC increases from about 0.39–0.44 under W04 to 0.46–0.56 under NL26, while HSS rises from 0.12–0.25 to 0.18–0.29. The largest gains are found for the shorter lead times, especially April, but the improvement is evident for all start months. These results indicate that the clustering-based definition provides more skillful categorical forecasts and better discriminates among early, normal, and late onset years than the conventional threshold-based definition.
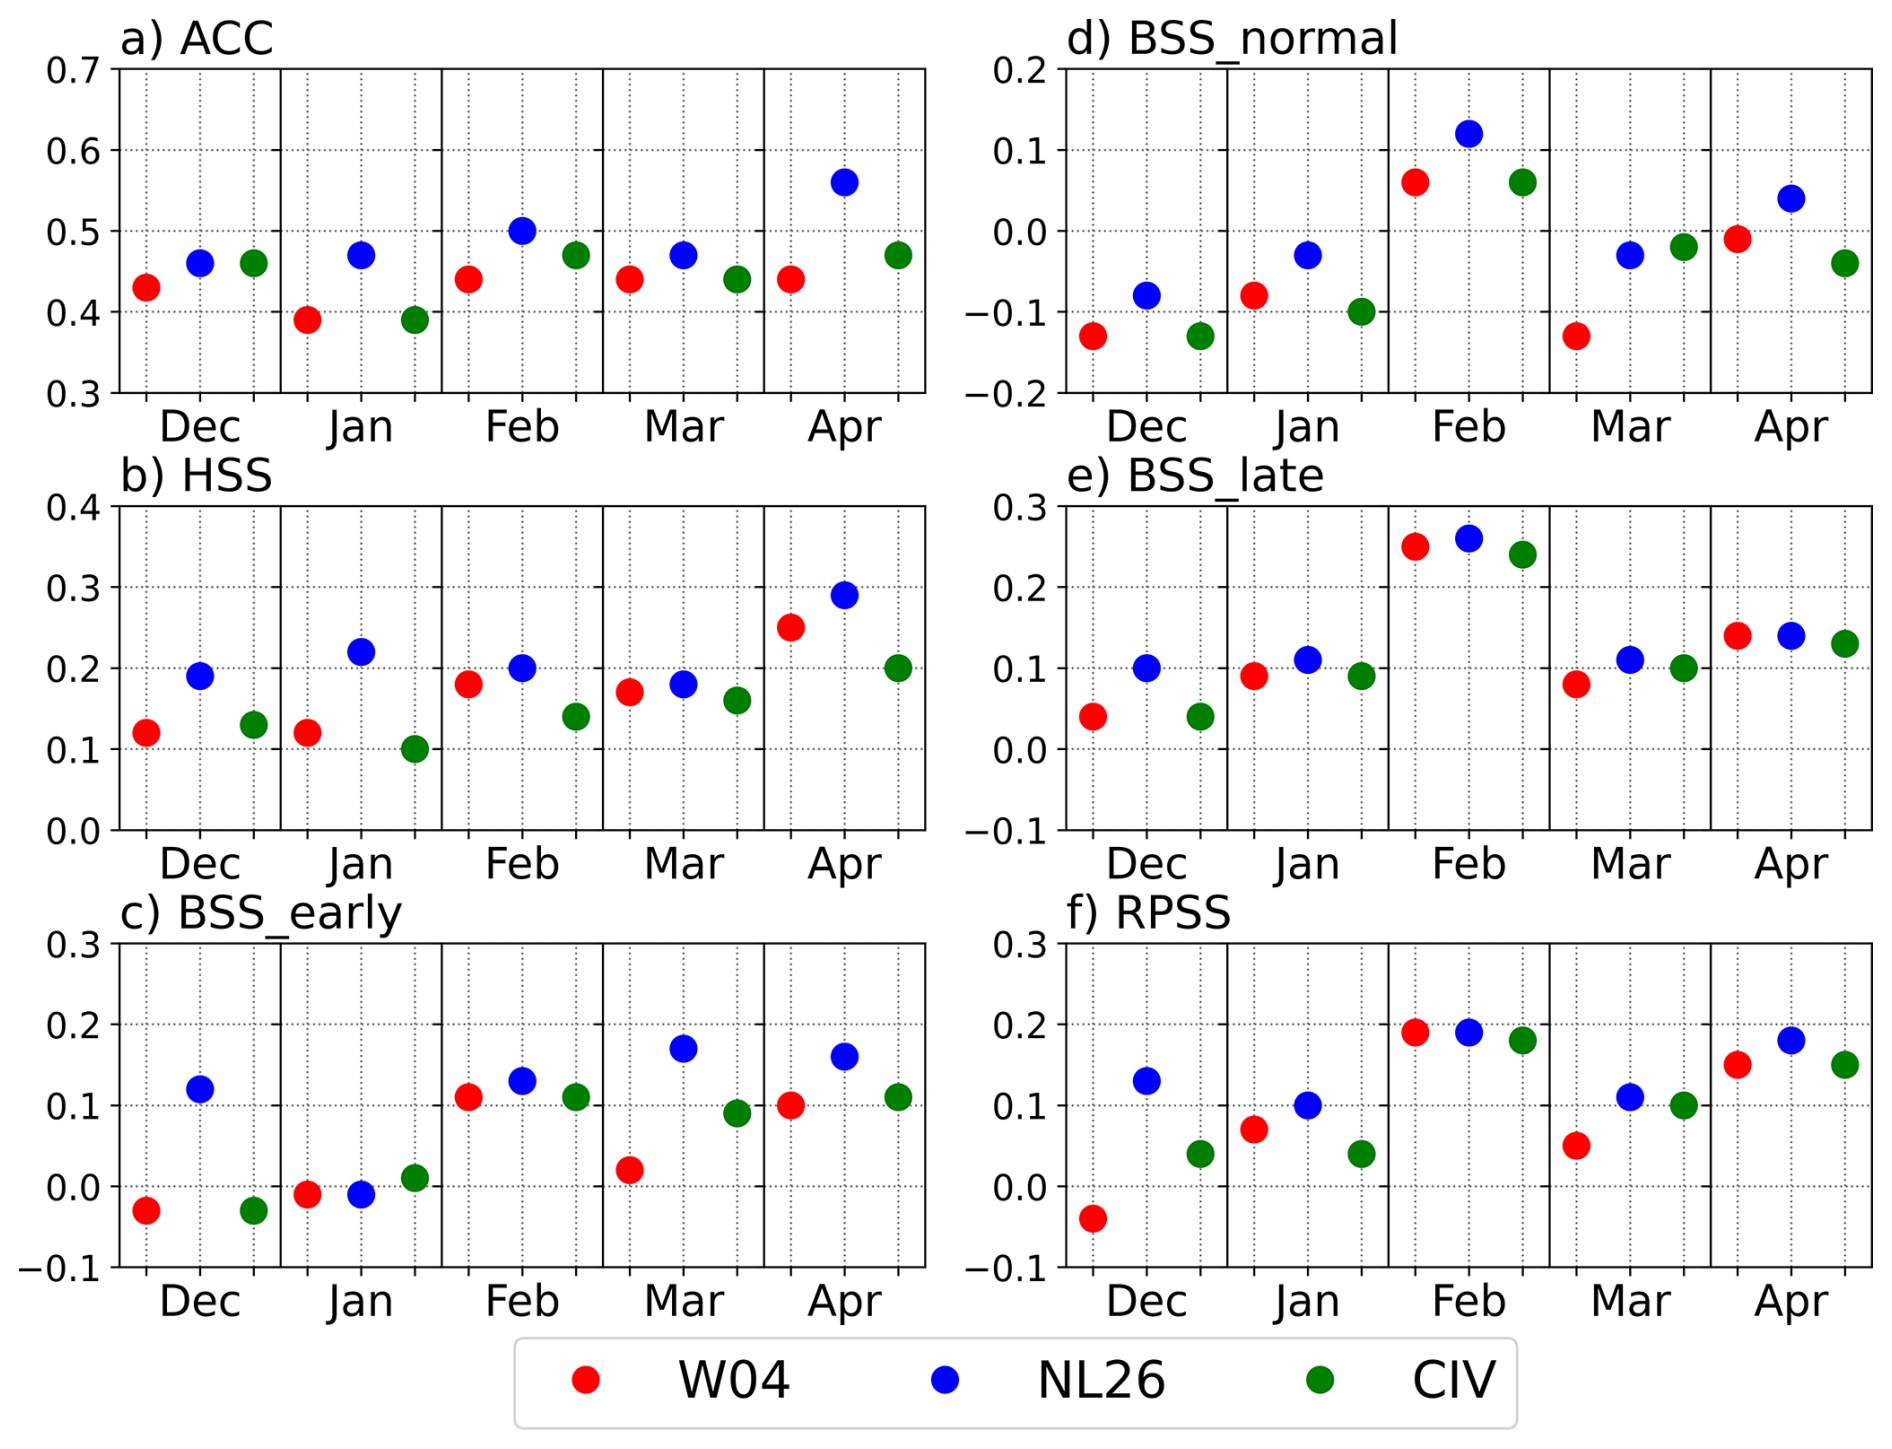
Figure 8Categorical and probabilistic prediction skill of SEAS5 for SCSSM onset date during the dependent training period (1981–2016), comparing the USCS-based definition of Wang et al. (2004) (W04), the synoptic clustering-based definition (NL26), and cross-index validation (CIV). Shown are (a) Accuracy (ACC), (b) Heidke Skill Score (HSS), (c) Brier Skill Score (BSS) for early onset, (d) BSS for normal onset, (e) BSS for late onset, and (f) Ranked Probability Skill Score (RPSS) for forecasts initialized from December–April.
CIV yields intermediate but still positive results. Its ACC ranges from 0.39–0.47 and is generally higher than W04 for all initialization months except December, while HSS ranges from 0.10–0.20 and remains above the W04 values for February and March and comparable in April. Thus, even when NL26-based forecasts are verified against W04-observed onset categories, the skill remains broadly competitive with, and in several cases superior to, that of the conventional W04.
The probabilistic metrics further highlight the advantage of NL26. RPSS is negative for W04 in December and only weakly positive in January and March, suggesting limited improvement over climatology at longer lead times. By contrast, RPSS is positive for all initialization months under NL26, with values of about 0.10–0.19 and is consistently higher than W04. CIV also maintains positive RPSS for all start months and remains close to NL26, especially from February onward. This indicates that the improved probabilistic skill under NL26 is not merely an artifact of matched-definition verification.
Consistent improvements are also evident in the category-specific BSS values (Fig. 8c–e). For the early onset category, W04 shows little skill at long lead times and even negative BSS in December and January, whereas NL26 yields positive skill for all months except January and reaches its highest values in March and April. CIV also remains positive from February onward and is notably higher than W04 in March and April. For the late onset category, all three frameworks show useful skill, but NL26 again performs best, with the largest BSS values in February and generally higher scores than W04 and CIV across all lead times. Skill for the normal onset category is comparatively modest for all frameworks, with negative BSS in several months, especially for W04. Nevertheless, NL26 shows clear positive skill in February and April and is generally less degraded than W04, while CIV remains close to zero or weakly positive in the better-performing months. This suggests that near-normal onset remains the most difficult category to predict, whereas early and late onset years tend to be more predictable.
Overall, the results from the dependent training period demonstrate that defining SCSSM onset using NL26 improves categorical and probabilistic prediction skill relative to W04. The CIV further shows that these improvements are not solely due to verification against the same onset definition: even when evaluated against W04-based observations, NL26-derived forecasts retain broadly comparable or superior skill. These results suggest that the clustering-based framework aligns onset timing more closely with the large-scale circulation features that are predictable in SEAS5, thereby yielding more skillful categorical and probabilistic forecasts.
4.2 Prediction skill during the independent forecast period (2017–2025)
This section evaluates the out-of-sample performance of the synoptic clustering-based SCSSM onset definition using independent SEAS5 forecasts for 2017–2025, which were not included in the training of the SOM circulation regimes.
4.2.1 Deterministic prediction skill
Figure 9 shows the deterministic forecast skill of SEAS5 during the independent period (2017–2025) when SCSSM onset is defined using W04. As expected for a short out-of-sample evaluation period, the skill is generally weaker than during the dependent period (cf. Fig. 5). Correlations between ensemble-mean forecasts and observed onset dates range from −0.21 to 0.25 and are not statistically significant for any initialization month. Skill is weak for all initializations and becomes near zero or negative for January, March, and April. The corresponding RPC values range from −0.35 to 0.76, with negative values for several start months, indicating poor consistency between the ensemble-mean signal and the realized forecast skill. Overall, these results suggest that the W04-defined onset is difficult to predict robustly in independent forecasts, likely because it remains sensitive to transient wind fluctuations that are poorly constrained at seasonal lead times.
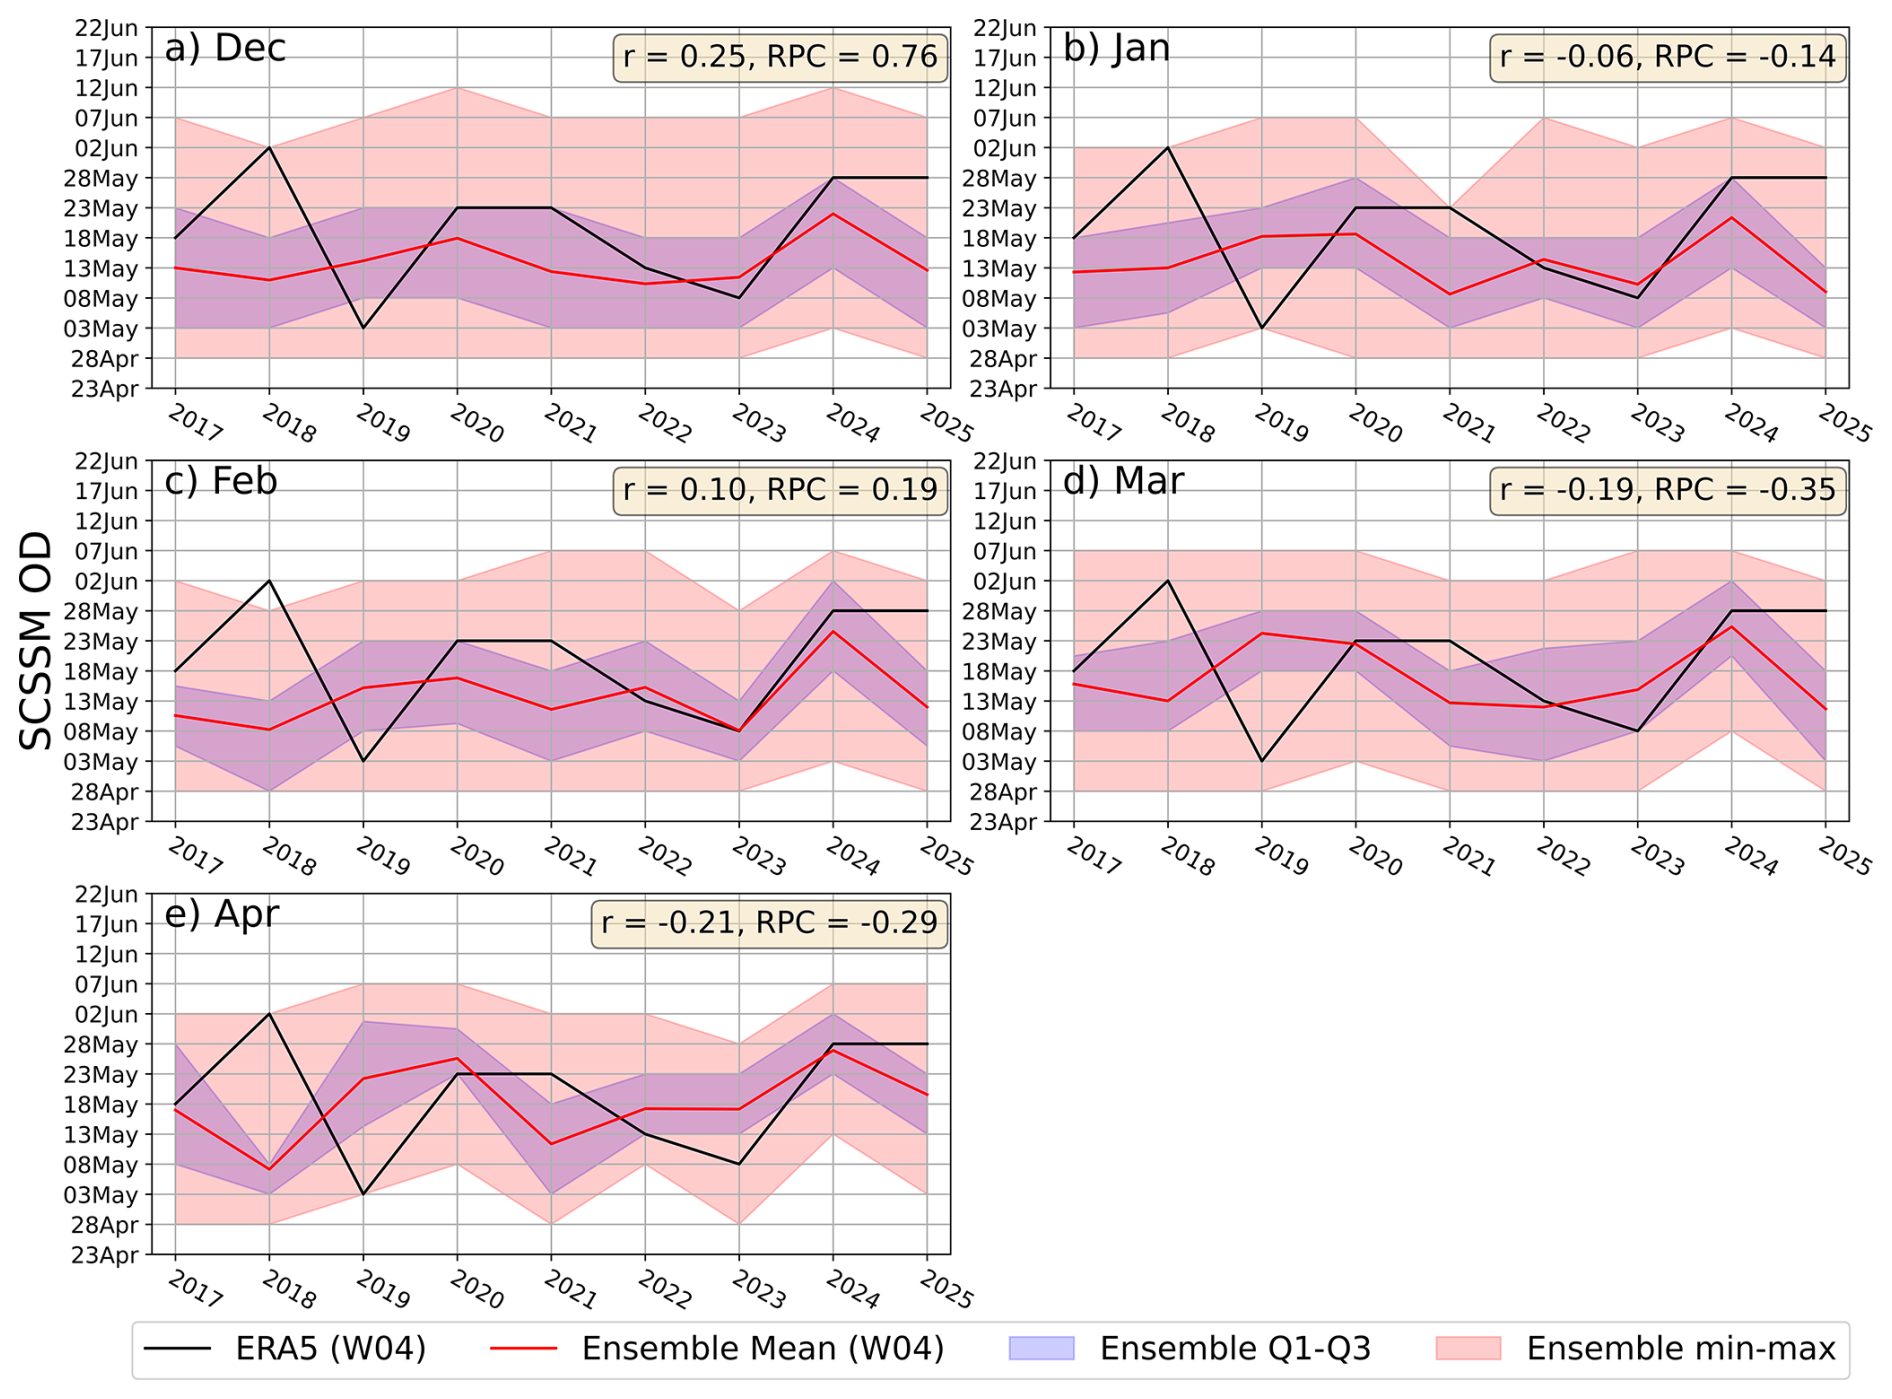
Figure 9Forecast performance of the ECMWF SEAS5 system in predicting SCSSM onset during the independent forecast period (2017–2025) using the U850-based definition of Wang et al. (2004). Time series show ERA5 onset dates (black) and ensemble-mean forecasts (red), with blue shading denotes the interquartile range (Q1–Q3) and red shading indicates the full ensemble spread. The Pearson correlation coefficient (r) and ratio of predictable component (RPC) are shown for each initialization month. The * denotes r is statistically significant at the 95 % confidence level.
In contrast, Fig. 10 shows that the NL26 definition yields consistently better deterministic forecast skill during the independent period. Correlations are positive for all initialization months, ranging from 0.34–0.43. Although none of these values reaches statistical significance given the short sample size, they are uniformly higher than those obtained under W04 and indicate a more stable year-to-year relationship between ensemble-mean forecasts and observed onset dates. The strongest skill is obtained for April (r=0.43), followed by December (r=0.39) and January–March ().
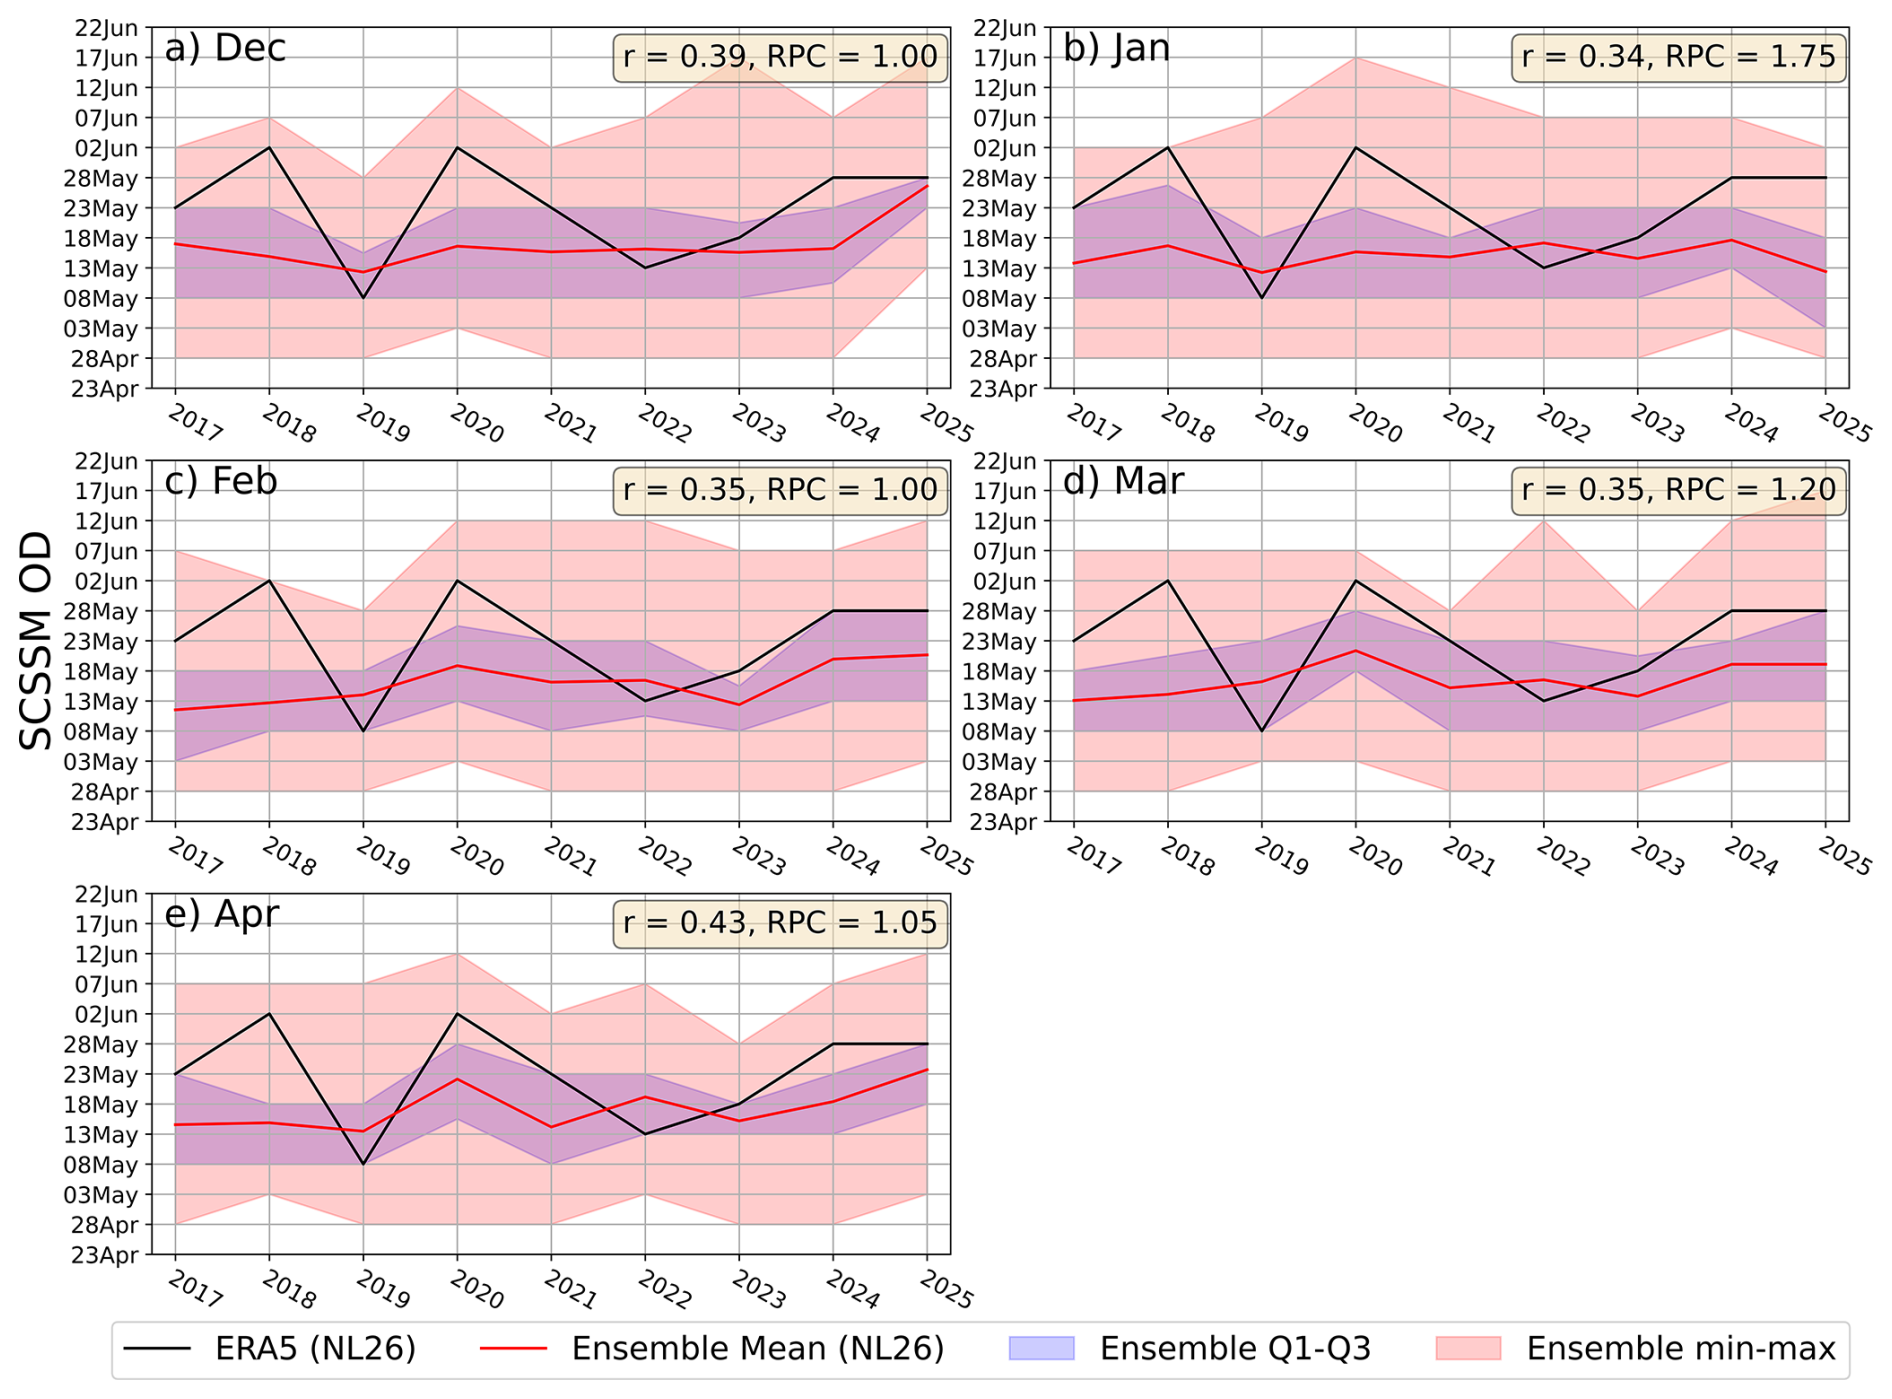
Figure 10Same as Fig. 9, but for SCSSM OD defined using the synoptic clustering-based definition (NL26).
The RPC values under NL26 range from 1.00–1.75 and are therefore substantially higher than those under W04. For December and February, RPC equals 1.00, indicating close consistency between ensemble-mean signal amplitude and realized skill. For January and March, RPC exceeds unity more clearly (1.75 and 1.20), suggesting that the forecast system is somewhat overconfident for those initializations, with a stronger ensemble-mean signal than implied by the achieved skill. Nevertheless, the marked improvement in both correlation and RPC relative to W04 indicates that the clustering-based definition is more closely tied to predictable large-scale circulation variability and is more robust under out-of-sample conditions.
Figure 11 further evaluates the practical forecasting value of NL26 through CIV. In this case, the forecast onset dates are derived using NL26, but verification is performed against observed W04 onset dates. Correlations remain positive for all initialization months, ranging from 0.29–0.45. The highest skill is found for December (r=0.45) and February (r=0.43), while January and April also retain moderate positive correlations (0.40 and 0.39, respectively). These values are generally comparable to, or higher than, those obtained from the NL26 (cf. Fig. 10) and clearly exceed those obtained under W04 (cf. Fig. 9), indicating that the improved performance of NL26 is not simply an artifact of verification against its own target definition.
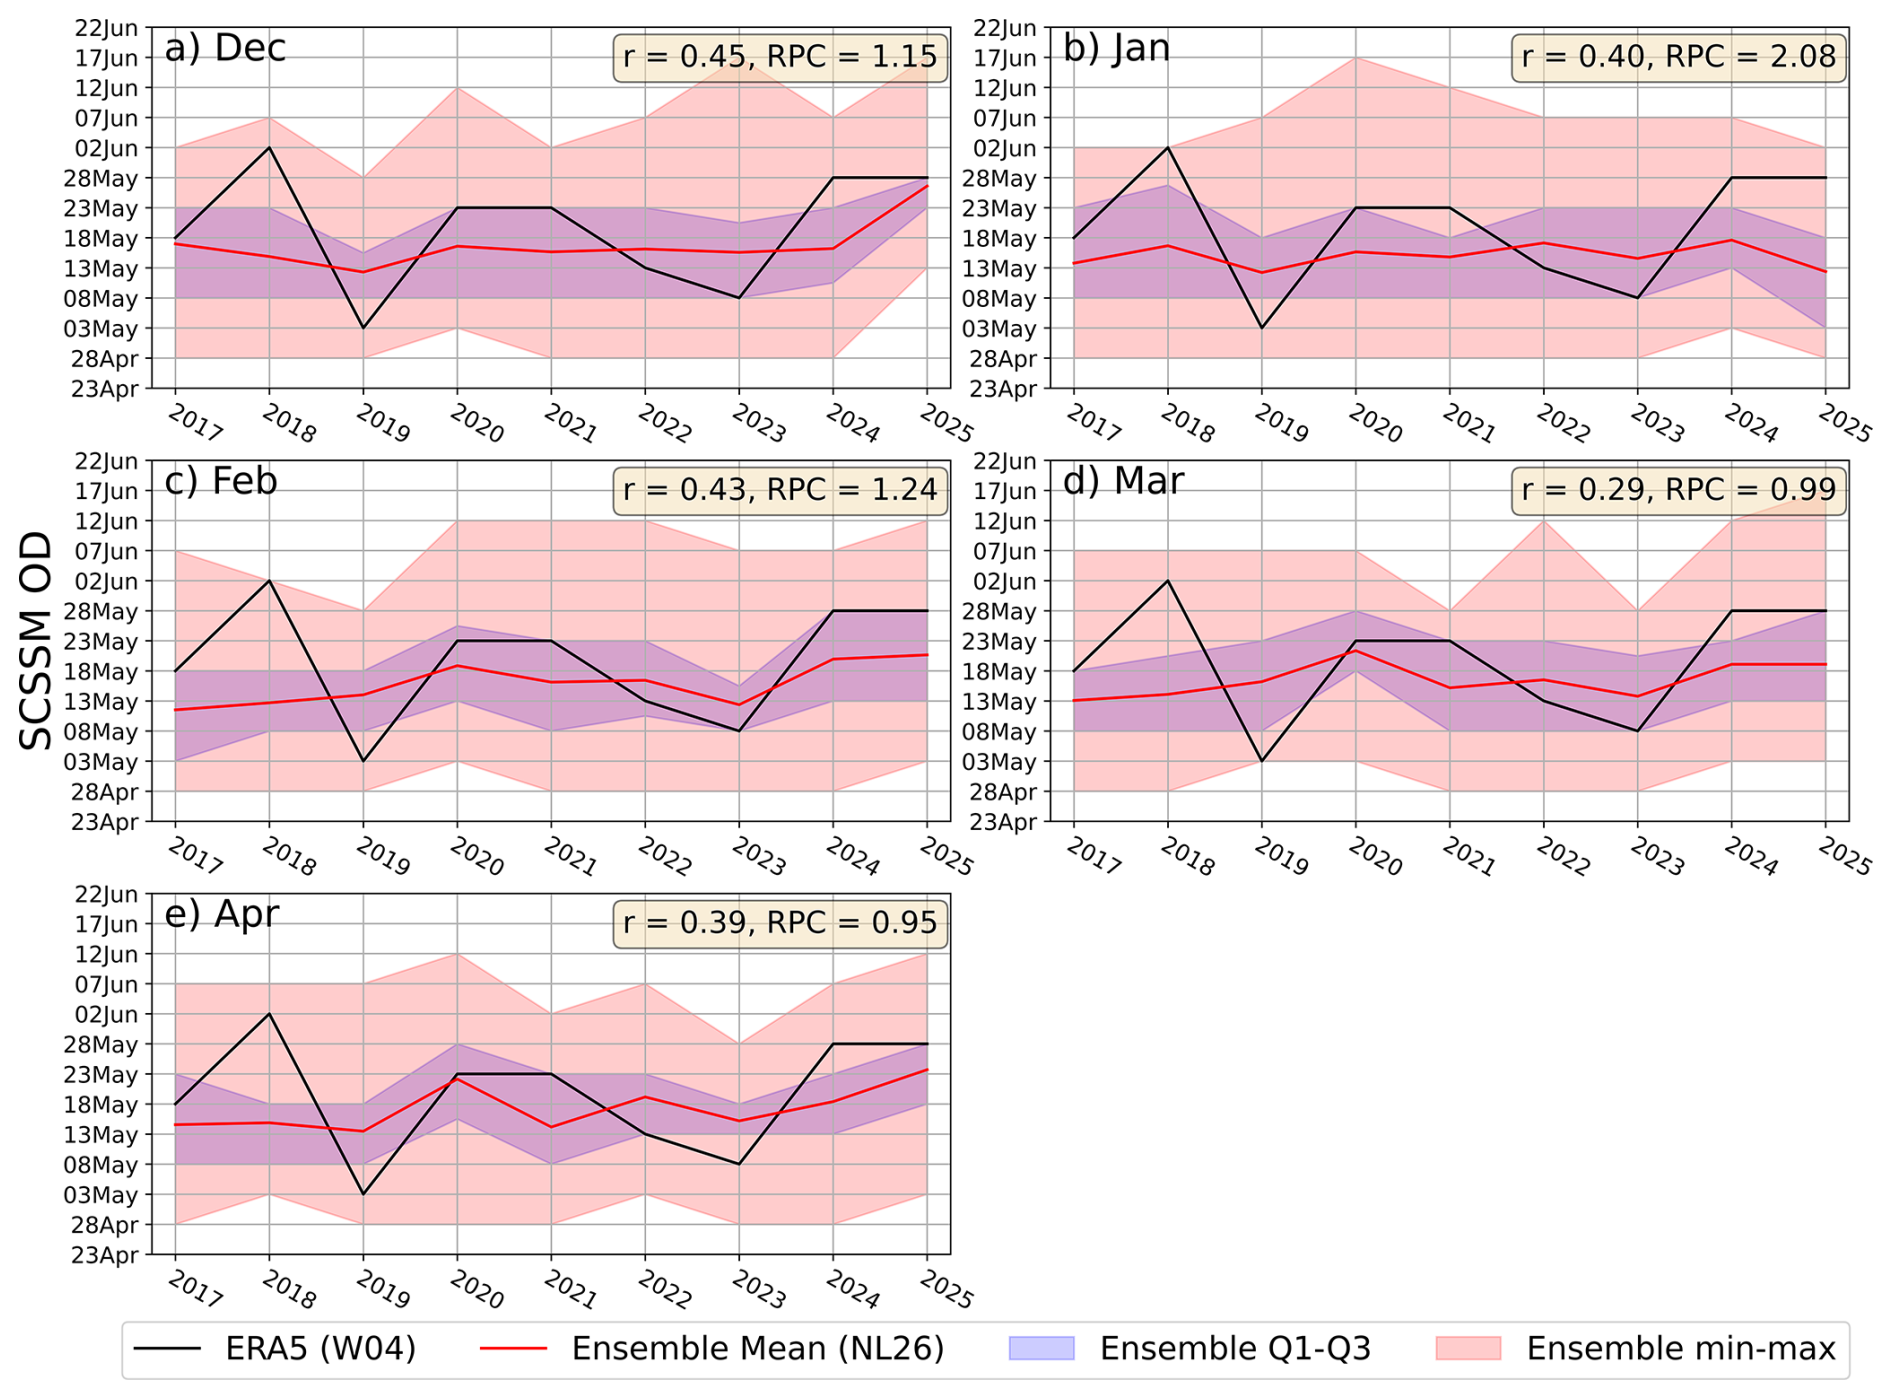
Figure 11Same as Fig. 9, but for cross-index validation (CIV), in which the observed SCSSM onset date is defined using W04, while the predicted onset date from SEAS5 is derived using the synoptic clustering-based definition (NL26).
The RPC values in the CIV range from 0.95–2.08. For March and April, the values are close to unity (0.99 and 0.95), indicating good consistency between ensemble-mean signal amplitude and realized forecast skill. For December–February, RPC is larger than 1, especially in January (2.08), suggesting overconfidence in the forecast signal. Even so, the consistently positive correlations and generally favorable RPC values support the practical utility of the clustering-based framework: NL26-based forecasts retain meaningful deterministic skill even when evaluated against the conventional W04 observational benchmark.
The year-to-year relationship between the two onset definitions during the independent period is further illustrated in Fig. S8 in the Supplement. Similar to the dependent period, NL26 and W04 remain strongly correlated (r=0.90, p<0.01), indicating that the clustering-based definition continues to capture the dominant interannual variability of SCSSM onset timing. At the same time, differences remain evident in several years, reflecting the distinct physical meanings of the two definitions. In particular, W04 is more sensitive to threshold crossing in USCS, whereas NL26 emphasizes coherent regime transition and monsoon maturity. This supports the interpretation that the improved forecast skill of NL26 arises not from a fundamentally different onset chronology, but from a more dynamically constrained identification of the same large-scale seasonal transition.
Overall, the independent-period results confirm that deterministic forecast skill is more robust under NL26 than under W04. While the short evaluation period limits statistical significance, the consistent improvement in correlation and RPC across nearly all initialization months, together with the favorable CIV results, indicates that the clustering-based definition provides a more predictable representation of SCSSM onset for seasonal forecasting applications. Although ENSO-related SST anomalies remain an important source of background modulation, recent studies suggest that the ENSO–SCSSM onset relationship has weakened in recent decades, which may reduce the strength and stability of seasonal predictability during the independent period (Hu et al., 2022c, 2026). This weakening may partly explain why forecast skill in 2017–2025 is generally lower and less statistically robust than during 1979–2016, particularly for the conventional W04.
4.2.2 Categorical and probabilistic prediction skill
Figure 12 compares the categorical and probabilistic prediction skill under the W04, NL26, and CIV frameworks during the independent period (2017–2025). Consistent with the deterministic results, the categorical skill is generally modest due to small sample size, but NL26 still outperforms W04 across most metrics and initialization months. For deterministic categorical forecasts (Fig. 12a and b), ACC and HSS are generally higher under NL26 than under W04. The largest improvement occurs for the February initialization, when ACC increases from 0.29 under W04 to 0.43 under NL26 and HSS increases from 0.22–0.26. Positive gains are also evident in December, January, and April. CIV typically yields intermediate values, indicating that the categorical improvement under NL26 is only partly reduced when verification is performed against W04-based observations.
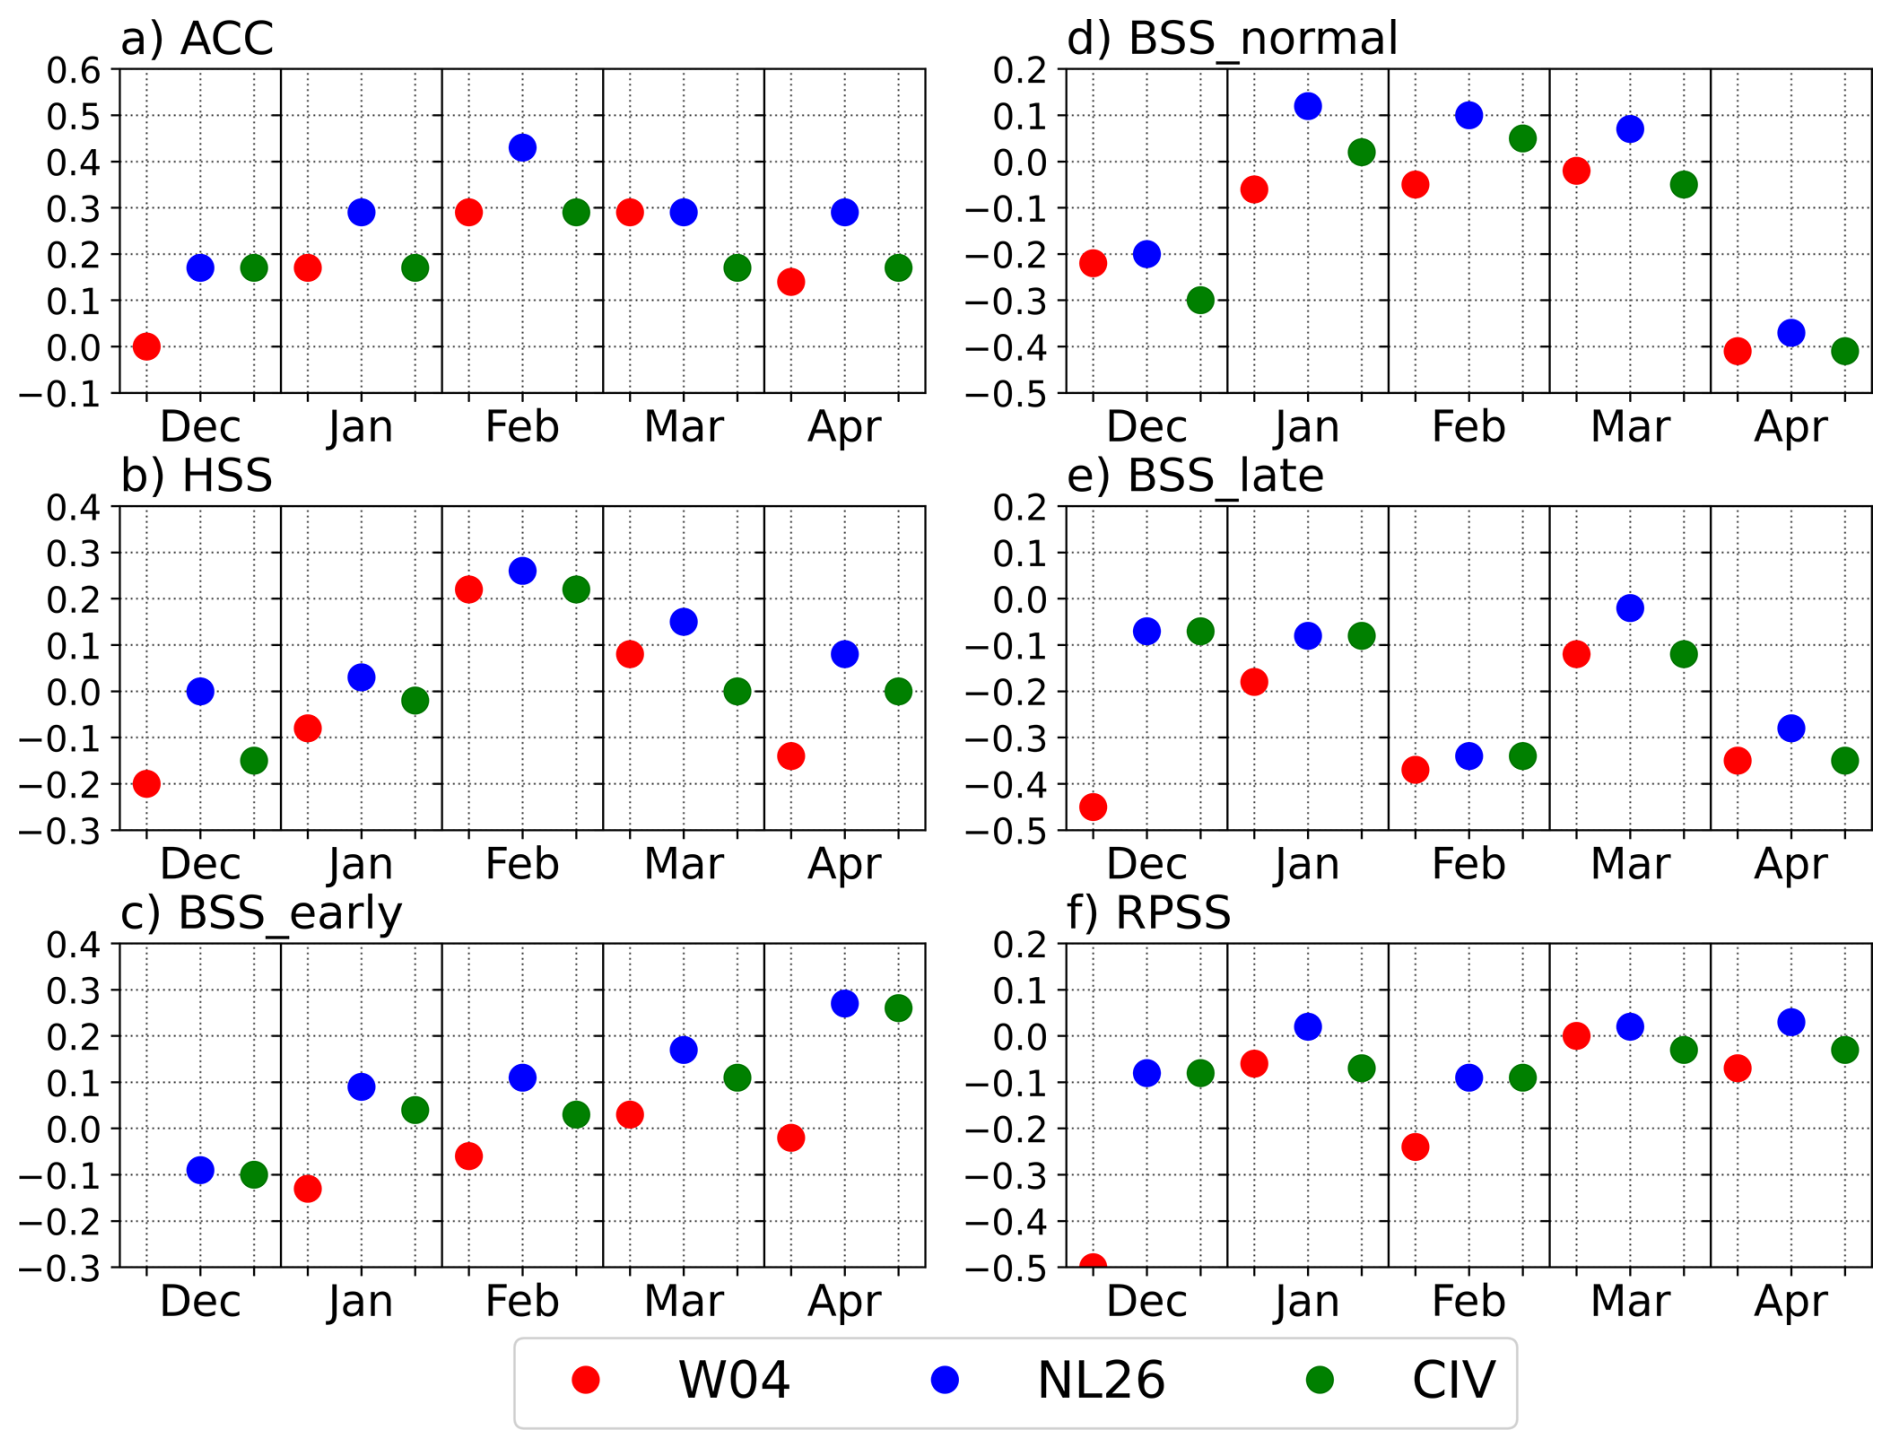
Figure 12Categorical and probabilistic prediction skill of SEAS5 for SCSSM onset date during the independent forecast period (2017–2025), comparing the USCS-based definition of Wang et al. (2004) (W04), the synoptic clustering-based definition (NL26), and cross-index validation (CIV). Shown are (a) Accuracy (ACC), (b) Heidke Skill Score (HSS), (c) Brier Skill Score (BSS) for early onset, (d) BSS for normal onset, (e) BSS for late onset, and (f) Ranked Probability Skill Score (RPSS) for forecasts initialized from December–April.
The probabilistic skill metrics show a more nuanced but still favorable picture for NL26. RPSS values under W04 are negative for most initialization months and reach their lowest value in December, indicating that the W04-based probabilistic forecasts often perform worse than climatology. By contrast, RPSS under NL26 is near zero or slightly positive for January, March, and April and is less negative than W04 in the remaining months. CIV yields RPSS values close to those of NL26 and generally remains better than W04, particularly in December and February. These results suggest that the probabilistic advantage of NL26 persists, although the improvement is weaker than in the dependent period.
Category-specific BSS values further illustrate the forecast characteristics. For the early onset category (Fig. 12c), W04 shows negative skill for most initialization months, whereas NL26 becomes positive from January onward and reaches its highest values in March and April. CIV also shows positive skill from January onward and approaches NL26 in April, indicating that the gain for early onset prediction is robust. For the normal onset category (Fig. 12d), skill is mixed. W04 remains negative for all start months, while NL26 shows clear positive skill from January–March, with the best performance in January and February. CIV likewise becomes positive in January and February, but all three frameworks show negative skill in April, suggesting that near-normal onset remains difficult to predict robustly. For the late onset category (Fig. 12e), skill is generally weak for all three frameworks, with mostly negative BSS values. Even so, NL26 is consistently less negative than W04 and nearly neutral in March, while CIV remains broadly comparable to NL26. This suggests that although late-onset prediction is challenging during the independent period, the clustering-based framework still provides a modest improvement over the conventional threshold-based definition.
Overall, the results from the independent forecast period indicate that the synoptic clustering-based definition of SCSSM onset remains more skillful than the conventional W04 definition across deterministic, categorical, and probabilistic metrics, despite the expected reduction in absolute skill under true out-of-sample conditions. The gains are especially evident for deterministic correlation, categorical skill, and the prediction of early onset years, while the benefits for probabilistic skill are more modest but still generally favorable. Together with the cross-index validation, these results demonstrate that the clustering-based definition is not only more predictable within the training period but also retains useful forecast value when applied to independent forecasts.
5.1 Discussions
This study shows that defining SCSSM OD in terms of persistent synoptic circulation regimes improves seasonal prediction skill relative to the conventional USCS-based definition of Wang et al. (2004). The superior performance of the synoptic clustering-based definition (NL26) can be understood from both physical and predictability perspectives. The conventional W04 definition is based on threshold crossing in area-averaged low-level zonal wind and is therefore sensitive to short-lived westerly intrusions and transient synoptic disturbances. Such events may satisfy the onset criterion without representing a genuine transition into a mature summer monsoon circulation, thereby introducing noise into the diagnosed onset date and degrading forecast verification. By contrast, NL26 identifies onset as a continuous transition into monsoon circulation regimes and further requires the emergence of a more developed monsoon regime shortly thereafter. This framework filters out spurious or short-lived events and places greater emphasis on large-scale circulation structures that evolve more smoothly and are more predictable on seasonal timescales.
The physical relevance of NL26 is supported not only by its circulation characteristics, but also by its thermodynamic and convective consistency. The OLR and MTG analysis shows that the onset identified by NL26 is accompanied by a marked decrease in area-averaged OLR over the SCS and the emergence of positive MTG over most of the basin, indicating enhanced deep convection and a more favorable large-scale thermal structure for monsoon development. These features persist beyond the onset pentad and are consistent with the sustained circulation transition shown in the low-level wind and geopotential height composites. Thus, the improved forecast skill of NL26 does not arise simply from redefining the onset target mathematically, but from identifying a more dynamically and thermodynamically coherent monsoon transition.
The present results show that NL26 and W04 do not represent entirely different year-to-year variations in SCSSM onset. In both the dependent and independent periods, the two onset definitions remain strongly correlated, indicating that they capture the same main interannual signal. Their differences arise mainly in years when the crossing of the USCS threshold does not coincide with a coherent transition to a mature monsoon circulation. In practice, NL26 can identify onset later than W04 when brief westerly surges satisfy the wind threshold without a mature monsoon reorganization, and earlier than W04 when a coherent monsoon-type circulation becomes established before the formal wind threshold is crossed. This suggests that NL26 improves forecast skill by providing a more dynamically constrained identification of the same large-scale seasonal transition.
The results also support a multi-timescale view of SCSSM onset. Slowly varying large-scale boundary forcing, including tropical sea surface temperature anomalies, helps shape the background circulation for onset timing. At the same time, the abrupt circulation transition near the onset pentad suggests that higher-frequency atmospheric disturbances can affect the exact onset date once the background state becomes favorable. However, the present analysis does not explicitly separate the effects of interannual and subseasonal variability. Therefore, the role of subseasonal disturbances should be regarded as a physically plausible interpretation rather than a demonstrated causal result. In this sense, NL26 may better isolate the predictable component of onset timing, while the detailed subseasonal triggering mechanisms remain beyond the scope of this study.
The weaker and less statistically robust forecast skill during the independent period also deserves attention. Although NL26 continues to outperform W04 in deterministic, categorical, and several probabilistic measures, the magnitude of skill is reduced compared with the dependent period. This likely reflects both the shorter verification sample and changes in the underlying climate drivers of SCSSM onset. In particular, recent studies suggest that the ENSO–SCSSM onset relationship has weakened in recent decades, which may reduce the stability of the low-frequency predictability that seasonal forecast systems exploit. This change is likely one reason why forecast skill in the independent period is lower overall, especially for the conventional W04 definition, which is more sensitive to localized wind fluctuations and less directly tied to the large-scale circulation transition.
Despite its advantages, the proposed method also has several limitations. First, although the clustering-based framework shows promise for seasonal forecasting, its use in real-time operational prediction would require stable classification of circulation regimes from forecast output, which may be sensitive to model biases and ensemble spread. The resulting SOM regimes may also be partly sensitive to the selected spatial domain; although the domain used here was chosen to include the key circulation systems controlling SCSSM onset, sensitivity tests with alternative domains should be explored in future work. Second, the combined SOM and K-means workflow is more complex than conventional threshold-based onset definitions and may pose practical challenges for implementation and replication unless the algorithm settings and reference patterns are carefully documented. Third, the independent verification period remains relatively short, so skill estimates may be sensitive to a few unusual years. Finally, although the added OLR and MTG diagnostics support the physical consistency of NL26, a more complete diagnosis of precipitation, moisture, and subseasonal variability would further strengthen understanding of the mechanisms behind the improved predictability. These considerations do not undermine the value of the approach, but they indicate that further testing across longer hindcasts, additional forecast systems, and other monsoon regions is still needed.
5.2 Conclusions
This study introduces a synoptic clustering-based definition of SCSSM onset that identifies onset as a persistent transition into large-scale monsoon circulation regimes rather than a simple threshold crossing in regional low-level zonal wind. The method uses SOM and K-means clustering to characterize the dominant synoptic circulation regimes over the SCS and defines onset using continuity and maturity criteria that distinguish genuine monsoon establishment from short-lived westerly intrusions.
Several main conclusions emerge. First, the proposed definition is physically consistent with SCSSM onset. In addition to the abrupt reversal of low-level winds and the eastward retreat of the WNPSH, the onset identified by NL26 is accompanied by enhanced convection, reflected in reduced OLR over the SCS, and by a more favorable thermal structure, reflected in positive MTG over much of the basin. Second, NL26 remains strongly correlated with the conventional W04 index, indicating that it captures the same dominant interannual variability of SCSSM onset timing, while providing a more dynamically constrained identification of the transition in years when threshold crossing and coherent monsoon reorganization differ. Third, application to ECMWF SEAS5 forecasts demonstrates that NL26 improves seasonal prediction skill relative to W04. During the dependent training period, the clustering-based definition yields higher deterministic skill, more favorable RPC values, and generally improved categorical and probabilistic forecast skill. Cross-index validation further shows that these improvements are not solely due to matched-definition verification: NL26-based forecasts remain competitive when evaluated against W04-observed onset dates. During the independent forecast period, absolute skill is reduced, as expected, but NL26 still shows more robust deterministic and categorical performance than W04 and retains useful predictive value under out-of-sample conditions.
Overall, the results suggest that predictability-oriented, circulation-regime-based definitions provide a physically meaningful and practically useful alternative to traditional threshold-based onset indices for SCSSM seasonal prediction. More broadly, the framework developed here may also be useful for other monsoon systems and climate-transition phenomena in which persistence and structural maturity of circulation regimes are central to predictability. Future work should test the method in longer hindcast archives, additional forecast systems, and other monsoon regions, while also exploring more explicit diagnostics of precipitation, moisture, and subseasonal variability to better understand the mechanisms linking circulation regimes to forecast skill.
The code used in this study is available from the corresponding author upon reasonable request.
All datasets analyzed in this study are publicly available from the following sources: ERA5 (ECMWF; https://www.ecmwf.int/en/forecasts/dataset/ecmwf-reanalysis-v5, login required, last access: 12 July 2026); OLR (NOAA; https://www.ncei.noaa.gov/products/climate-data-records/outgoing-longwave-radiation-daily, last access: 12 July 2026); HadISST (UK Met Office Hadley Centre; https://www.metoffice.gov.uk/hadobs/hadisst, last access: 12 July 2026); SEAS5 (ECMWF; https://cds.climate.copernicus.eu/datasets, last access: 12 July 2026).
The supplement related to this article is available online at https://doi.org/10.5194/wcd-7-1219-2026-supplement.
The author has declared that there are no competing interests.
Publisher's note: Copernicus Publications remains neutral with regard to jurisdictional claims made in the text, published maps, institutional affiliations, or any other geographical representation in this paper. The authors bear the ultimate responsibility for providing appropriate place names. Views expressed in the text are those of the authors and do not necessarily reflect the views of the publisher.
The author gratefully acknowledges Le Duc for valuable guidance and assistance with the implementation of the SOM and K-means clustering techniques.
This paper was edited by Yang Zhang and reviewed by three anonymous referees.
Attada, R., Ehsan, M. A., and Pillai, P. A.: Evaluation of Potential Predictability of Indian Summer Monsoon Rainfall in ECMWF's Fifth-Generation Seasonal Forecast System (SEAS5), Pure Appl. Geophys., 179, 4639–4655, https://doi.org/10.1007/s00024-022-03184-9, 2022.
Bombardi, R. J., Pegion, K. V., Kinter, J. L., Cash, B. A., and Adams, J. M.: Sub-seasonal Predictability of the Onset and Demise of the Rainy Season over Monsoonal Regions, Front. Earth Sci., 5, https://doi.org/10.3389/feart.2017.00014, 2017.
Bombardi, R. J., Moron, V., and Goodnight, J. S.: Detection, variability, and predictability of monsoon onset and withdrawal dates: A review, Int. J. Climatol., 40, 641–667, https://doi.org/10.1002/joc.6264, 2020.
Borah, N., Sahai, A. K., Chattopadhyay, R., Joseph, S., Abhilash, S., and Goswami, B. N.: A self-organizing map-based ensemble forecast system for extended range prediction of active/break cycles of Indian summer monsoon, JGR Atmospheres, 118, 9022–9034, https://doi.org/10.1002/jgrd.50688, 2013.
Bui-Minh, T., Doan, Q.-V., Nguyen, K.-C., Phan-Van, T., Trinh-Tuan, L., Cong, T., and Trinh-Minh, N.: Determining the onset of summer rainfall over Vietnam using self-organizing maps, Clim. Dynam., 62, 9189–9206, https://doi.org/10.1007/s00382-024-07385-x, 2024.
Chen, R., Wen, Z., Lin, W., and Qiao, Y.: Diverse relationship between the tropical night in South China and the water vapor transport over the South China Sea and the plausible causes, Atmos. Res., 296, 107080, https://doi.org/10.1016/j.atmosres.2023.107080, 2023.
Chen, T.-C., Tsay, J.-D., Matsumoto, J., and Alpert, J.: Impact of the Summer Monsoon Westerlies on the South China Sea Tropical Cyclone Genesis in May, Weather Forecast., 32, 925–947, https://doi.org/10.1175/WAF-D-16-0189.1, 2017.
Chevuturi, A., Turner, A. G., Woolnough, S. J., Martin, G. M., and MacLachlan, C.: Indian summer monsoon onset forecast skill in the UK Met Office initialized coupled seasonal forecasting system (GloSea5-GC2), Clim. Dynam., 52, 6599–6617, https://doi.org/10.1007/s00382-018-4536-1, 2019.
Chevuturi, A., Turner, A. G., Johnson, S., Weisheimer, A., Shonk, J. K. P., Stockdale, T. N., and Senan, R.: Forecast skill of the Indian monsoon and its onset in the ECMWF seasonal forecasting system 5 (SEAS5), Clim. Dynam., 56, 2941–2957, https://doi.org/10.1007/s00382-020-05624-5, 2021.
Dai, L., Cheng, T. F., and Lu, M.: Define East Asian Monsoon Annual Cycle via a Self-Organizing Map-Based Approach, Geophys. Res. Lett., 48, e2020GL089542, https://doi.org/10.1029/2020GL089542, 2021.
Ding, Y. and Chan, J. C. L.: The East Asian summer monsoon: an overview, Meteorol. Atmos. Phys., 89, 117–142, https://doi.org/10.1007/s00703-005-0125-z, 2005.
Ding, Y., Li, C., and Liu, Y.: Overview of the South China sea monsoon experiment, Adv. Atmos. Sci., 21, 343–360, https://doi.org/10.1007/BF02915563, 2004.
Ding, Y., Liu, Y., Song, Y., and Zhang, J.: From MONEX to the global monsoon: A review of monsoon system research, Adv. Atmos. Sci., 32, 10–31, https://doi.org/10.1007/s00376-014-0008-7, 2015.
Eade, R., Smith, D., Scaife, A., Wallace, E., Dunstone, N., Hermanson, L., and Robinson, N.: Do seasonal-to-decadal climate predictions underestimate the predictability of the real world?, Geophys. Res. Lett., 41, 5620–5628, https://doi.org/10.1002/2014GL061146, 2014.
Geen, R.: Forecasting South China Sea Monsoon Onset Using Insight From Theory, Geophys. Res. Lett., 48, e2020GL091444, https://doi.org/10.1029/2020GL091444, 2021.
He, J. and Zhu, Z.: The relation of South China Sea monsoon onset with the subsequent rainfall over the subtropical East Asia, Int. J. Climatol., 35, 4547–4556, https://doi.org/10.1002/joc.4305, 2015.
Hersbach, H., Bell, B., Berrisford, P., Hirahara, S., Horányi, A., Muñoz-Sabater, J., Nicolas, J., Peubey, C., Radu, R., Schepers, D., Simmons, A., Soci, C., Abdalla, S., Abellan, X., Balsamo, G., Bechtold, P., Biavati, G., Bidlot, J., Bonavita, M., De Chiara, G., Dahlgren, P., Dee, D., Diamantakis, M., Dragani, R., Flemming, J., Forbes, R., Fuentes, M., Geer, A., Haimberger, L., Healy, S., Hogan, R. J., Hólm, E., Janisková, M., Keeley, S., Laloyaux, P., Lopez, P., Lupu, C., Radnoti, G., De Rosnay, P., Rozum, I., Vamborg, F., Villaume, S., and Thépaut, J.: The ERA5 global reanalysis, Q. J. Roy. Meteor. Soc., 146, 1999–2049, https://doi.org/10.1002/qj.3803, 2020.
Hu, P., Chen, W., Huang, R., and Nath, D.: On the weakening relationship between the South China Sea summer monsoon onset and cross-equatorial flow after the late 1990s, Int. J. Climatol., 38, 3202–3208, https://doi.org/10.1002/joc.5472, 2018.
Hu, P., Chen, W., Chen, S., Liu, Y., Wang, L., and Huang, R.: The Leading Mode and Factors for Coherent Variations among the Subsystems of Tropical Asian Summer Monsoon Onset, J. Climate, 35, 1597–1612, https://doi.org/10.1175/JCLI-D-21-0101.1, 2022a.
Hu, P., Chen, W., Li, Z., Chen, S., Wang, L., and Liu, Y.: Close Linkage of the South China Sea Summer Monsoon Onset and Extreme Rainfall in May over Southeast Asia: Role of the Synoptic-Scale Systems, J. Climate, 35, 4347–4362, https://doi.org/10.1175/JCLI-D-21-0740.1, 2022b.
Hu, P., Chen, W., Chen, S., Wang, L., and Liu, Y.: The Weakening Relationship between ENSO and the South China Sea Summer Monsoon Onset in Recent Decades, Adv. Atmos. Sci., 39, 443–455, https://doi.org/10.1007/s00376-021-1208-6, 2022c.
Hu, P., Chen, W., Cai, Q., Yang, R., Zhou, Y., and Wang, Y.: Delayed Tropical Asian Summer Monsoon Onset in Recent Decades, Geophys. Res. Lett., 53, e2025GL120825, https://doi.org/10.1029/2025GL120825, 2026.
Huangfu, J., Huang, R., and Chen, W.: Relationship between the South China Sea summer monsoon onset and tropical cyclone genesis over the western North Pacific, Int. J. Climatol., 37, 5206–5210, https://doi.org/10.1002/joc.5141, 2017.
Jiang, X., Wang, Z., and Li, Z.: Signature of the South China Sea summer monsoon onset on spring-to-summer transition of rainfall in the middle and lower reaches of the Yangtze River basin, Clim. Dynam., 51, 3785–3796, https://doi.org/10.1007/s00382-018-4110-x, 2018.
Johnson, S. J., Stockdale, T. N., Ferranti, L., Balmaseda, M. A., Molteni, F., Magnusson, L., Tietsche, S., Decremer, D., Weisheimer, A., Balsamo, G., Keeley, S. P. E., Mogensen, K., Zuo, H., and Monge-Sanz, B. M.: SEAS5: the new ECMWF seasonal forecast system, Geosci. Model Dev., 12, 1087–1117, https://doi.org/10.5194/gmd-12-1087-2019, 2019.
Kohonen, T.: Self-Organizing Maps, Springer, Berlin, Heidelberg, https://doi.org/10.1007/978-3-642-56927-2, 2001.
Lee, H.-T.: NOAA Climate Data Record (CDR) of Daily Outgoing Longwave Radiation (OLR), Version 2.0, https://doi.org/10.25921/9PT5-BY77, 2025.
Li, X., Chen, R., and Qiao, Y.: Assessing the extended-range forecast skills of the extreme heat events over South China based on three S2S models, Atmos. Sci. Lett., 25, e1253, https://doi.org/10.1002/asl.1253, 2024.
Liu, B., Zhu, C., Yuan, Y., and Xu, K.: Two Types of Interannual Variability of South China Sea Summer Monsoon Onset Related to the SST Anomalies before and after 1993/94, J. Climate, 29, 6957–6971, https://doi.org/10.1175/JCLI-D-16-0065.1, 2016.
Mao, J. and Wu, G.: Influences of Typhoon Chanchu on the 2006 South China Sea summer monsoon onset, Geophys. Res. Lett., 35, 2008GL033810, https://doi.org/10.1029/2008GL033810, 2008.
Martin, G. M., Chevuturi, A., Comer, R. E., Dunstone, N. J., Scaife, A. A., and Zhang, D.: Predictability of South China Sea Summer Monsoon Onset, Adv. Atmos. Sci., 36, 253–260, https://doi.org/10.1007/s00376-018-8100-z, 2019.
Nguyen-Le, D. and Yamada, T. J.: Using Weather Pattern Recognition to Classify and Predict Summertime Heavy Rainfall Occurrence over the Upper Nan River Basin, Northwestern Thailand, Weather Forecast., 34, 345–360, https://doi.org/10.1175/WAF-D-18-0122.1, 2019.
Nguyen-Le, D., Yamada, T. J., and Tran-Anh, D.: Classification and forecast of heavy rainfall in northern Kyushu during Baiu season using weather pattern recognition, Atmos. Sci. Lett., 18, 324–329, https://doi.org/10.1002/asl.759, 2017.
Nishiyama, K., Endo, S., Jinno, K., Bertacchi Uvo, C., Olsson, J., and Berndtsson, R.: Identification of typical synoptic patterns causing heavy rainfall in the rainy season in Japan by a Self-Organizing Map, Atmos. Res., 83, 185–200, https://doi.org/10.1016/j.atmosres.2005.10.015, 2007.
Rayner, N. A., Parker, D. E., Horton, E. B., Folland, C. K., Alexander, L. V., Rowell, D. P., Kent, E. C., and Kaplan, A.: Global analyses of sea surface temperature, sea ice, and night marine air temperature since the late nineteenth century, J. Geophys. Res., 108, 2002JD002670, https://doi.org/10.1029/2002JD002670, 2003.
Sammon, J. W.: A Nonlinear Mapping for Data Structure Analysis, IEEE T. Comput., C-18, 401–409, https://doi.org/10.1109/T-C.1969.222678, 1969.
Tang, S., Chen, R., and Chen, Z.: Spatial Diversity of the Summer Marine Heat Waves in the South China Sea, J. Climate, 38, 1051–1065, https://doi.org/10.1175/JCLI-D-24-0254.1, 2025.
Ultsch, A. and Siemon, H. P: Kohonen's Self Organizing Feature Maps for Exploratory Data Analysis. in Proceedings of the International Neural Network Conference (INNC-90), Paris, France, 9–13 July 1990 1. Dordrecht, Netherlands, edited by: Widrow, B. and Angeniol, B., 1, Kluwer Academic Press, 305–308, ISBN 978-0-7923-0830-0, 1990.
Vesanto, J. and Alhoniemi, E.: Clustering of the self-organizing map, IEEE T. Neural Networ., 11, 586–600, https://doi.org/10.1109/72.846731, 2000.
Wang, B. and LinHo: Rainy Season of the Asian-Pacific Summer Monsoon, J. Climate, 15, 386–398, https://doi.org/10.1175/1520-0442(2002)015%3C0386:RSOTAP%3E2.0.CO;2, 2002.
Wang, B., LinHo, Zhang, Y., and Lu, M.-M.: Definition of South China Sea Monsoon Onset and Commencement of the East Asia Summer Monsoon, J. Climate, 17, 699–710, https://doi.org/10.1175/2932.1, 2004.
Wang, B., Huang, F., Wu, Z., Yang, J., Fu, X., and Kikuchi, K.: Multi-scale climate variability of the South China Sea monsoon: A review, Dynam. Atmos. Oceans, 47, 15–37, https://doi.org/10.1016/j.dynatmoce.2008.09.004, 2009.
Wang, L. and Chen, G.: Relationship between South China Sea summer monsoon onset and landfalling tropical cyclone frequency in China, Int. J. Climatol., 38, 3209–3214, https://doi.org/10.1002/joc.5485, 2018.
World Climate Research Programme (WCRP): Forecast verification – issues, methods, and FAQ, http://www.cawcr.gov.au/projects/verification (last access: 25 January 2026), 2015.
Weigel, A. P., Liniger, M. A., and Appenzeller, C.: The Discrete Brier and Ranked Probability Skill Scores, Mon. Weather Rev., 135, 118–124, https://doi.org/10.1175/MWR3280.1, 2007.
Xie, S.-P., Kosaka, Y., Du, Y., Hu, K., Chowdary, J. S., and Huang, G.: Indo-western Pacific ocean capacitor and coherent climate anomalies in post-ENSO summer: A review, Adv. Atmos. Sci., 33, 411–432, https://doi.org/10.1007/s00376-015-5192-6, 2016.
Zhou, W. and Chan, J. C. L.: ENSO and the South China Sea summer monsoon onset, Int. J. Climatol., 27, 157–167, https://doi.org/10.1002/joc.1380, 2007.
Zhu, Z. and Li, T.: Empirical prediction of the onset dates of South China Sea summer monsoon, Clim. Dynam., 48, 1633–1645, https://doi.org/10.1007/s00382-016-3164-x, 2017.
- Abstract
- Introduction
- Datasets and methodology
- Synoptic clustering-based definition of the South China Sea summer monsoon onset
- Application to seasonal prediction of SCSSM onset
- Discussions and Conclusions
- Code availability
- Data availability
- Competing interests
- Disclaimer
- Acknowledgements
- Review statement
- References
- Supplement
Predicting the start of the summer monsoon over the South China Sea is important because it affects rainfall, farming, and flood risk across East Asia, but it is difficult to forecast far in advance. We tested a new way to define monsoon onset based on a lasting shift in large-scale weather patterns rather than a single wind threshold. Using seasonal forecast data, we found that this approach improves prediction skill and gives a more physically consistent picture of monsoon onset.
Predicting the start of the summer monsoon over the South China Sea is important because it...
- Abstract
- Introduction
- Datasets and methodology
- Synoptic clustering-based definition of the South China Sea summer monsoon onset
- Application to seasonal prediction of SCSSM onset
- Discussions and Conclusions
- Code availability
- Data availability
- Competing interests
- Disclaimer
- Acknowledgements
- Review statement
- References
- Supplement