
the Creative Commons Attribution 4.0 License.
the Creative Commons Attribution 4.0 License.
 | 23 Jul 2026
Synoptic climatology of extratropical transition of tropical cyclones over the Southern Hemisphere
Elizabeth A. Ritchie
Neil J. Holbrook
Tropical cyclones that move into the midlatitudes undergo changes in their structure and transition into extratropical cyclones. The process is known as extratropical transition (ET). ET can result in severe weather locally and also affect the weather downstream. Although the importance of ET has been recognised primarily in the Northern Hemisphere, there are only a handful of studies focusing on the Southern Hemisphere. The current study conducts a comprehensive synoptic-climatological analysis of ET over the Southern Hemisphere. We use a state-of-the-art low-pressure system detection and classification scheme to objectively track tropical cyclones and detect those that undergo ET based on ERA5 data. Our results show that ET preferentially occurs in the southwest Indian Ocean, off the northwest coast of Australia, and in the southwest Pacific. The ET fraction is higher in March–May and lower in January and February, and the latitude of ET also changes strongly with season. The observed seasonality is associated with meridional shifts in the large-scale circulation and sea surface temperature pattern. The changes in structural characteristics and background environment during ET are investigated via cyclone-centred composites. In general, the transitioning cyclone lies on the equatorward side of the jet entrance, with an upper-level trough approaching from the west and a ridge developing downstream. Highly asymmetric fields of vertical velocity and equivalent potential temperature advection are indicative of warm, moist, ascending (cold, dry, descending) air to the east (west), responsible for an increasingly asymmetric precipitation pattern.
Case-to-case variability in synoptic configurations at ET is examined by applying K-means clustering on surface and upper-level fields, which identifies four distinct ET clusters. In particular, Clusters 2 and 3 feature the transitioning cyclone with a relatively strong intensity and high precipitation, accompanied by enhanced latent heat release in its southeastern sector. In the upper troposphere, the cyclone-associated divergent outflow impinges on the waveguide and enhances the potential vorticity gradient, leading to downstream jet streak formation and contributing to ridge development.
- Article
(10032 KB) - Full-text XML
-
Supplement
(1117 KB) - BibTeX
- EndNote


Tropical cyclones (TCs) are warm-cored weather systems that derive their energy from wind-driven evaporation from the warm tropical oceans. In comparison, extratropical cyclones have a cold-core structure and develop in a baroclinic environment with strong temperature and moisture gradients. When a TC moves into the midlatitudes, it undergoes changes in its physical structure and transitions into an extratropical cyclone in a process known as extra-tropical transition (ET). During ET, a TC loses its typical deep warm-core and symmetric structure and transitions to an extratropical cyclone characterised by cold-core and asymmetric frontal structure (e.g., Klein et al., 2000; Sinclair, 2002; Evans and Hart, 2003). An early study by Klein et al. (2000) established a conceptual model of the ET process with two major stages: transformation and intensification. In the early transformation stage, a TC and its warm core weaken due to decreased sea surface temperatures (SSTs) and increased vertical wind shear in the midlatitudes, as suggested by an idealised model simulation (Ritchie and Elsberry, 2001). When the TC moves closer to the midlatitude baroclinic zone, the cloud distribution becomes asymmetric, with strong convection concentrated to the north or northwest but substantially reduced to the south (in the Northern Hemisphere). At this time, the cyclone starts to develop features of extratropical cyclones, such as warm conveyor belts and dry intrusions (Quinting et al., 2014; Ritchie and Elsberry, 2001). At the final transformation stage, the cyclone is fully embedded in the baroclinic zone, and it may subsequently reintensify when interacting with the upper-tropospheric trough.
TCs undergoing ET can lead to severe weather events, including strong winds and heavy precipitation. As reviewed in previous studies (Jones et al., 2003; Evans et al., 2017), wind fields become asymmetric and expand during ET, with the strongest winds preferentially located on the left side of the track (in the Southern Hemisphere). TC Alby (1978) is a pronounced example of ET-related wind impact, which causes bushfire in the southwest of Western Australia due to its left-of-track strong winds bringing hot and dry air to the region (Foley and Hanstrum, 1994). ET-related heavy precipitation results in flooding farther inland and at higher latitudes, in which are not normally affected by TC-related hazards. Examples include Hurricane Agnes (1972) in the North Atlantic (Bosart and Dean, 1991), and TC Audrey (1964) and TC Bola (1988) in the southwest Pacific (Jones et al., 2003). Similar to wind fields, the precipitation distribution becomes more asymmetric during ET. However, the heaviest precipitation can occur either to the right or left of the track, depending on the relative position of the midlatitude trough to the TC, their intensity, and the TC-induced downstream ridge (e.g., Atallah et al., 2007; Chen, 2011). Moreover, the precipitation area tends to increase at the beginning of ET, whereas it decreases late (Matyas, 2013).
In addition to the severe weather directly associated with the transitioning cyclone, ET can also affect the weather downstream. A pronounced example is Supertyphoon Nuri (2014) in the western North Pacific. At the upper troposphere, the TC-associated divergent outflow impinges on the midlatitude jet stream, exciting a Rossby wave. As the wave propagates downstream to the eastern Pacific, it develops a highly-amplified ridge-trough couplet and leads to a heatwave under the ridge off the west coast of North America (Keller et al., 2019). Quinting and Jones (2016) have also shown that Rossby wave packets are more frequent and amplified downstream of recurving TCs in the western South Indian Ocean. Moreover, heatwaves in southeastern Australia are associated with an upper-level anticyclone, formed as a result of Rossby wave amplification and breaking. Parker et al. (2013) argue that a TC off the northwest coast of Australia can affect heatwaves in the southeast of the country, indirectly by its upper-level divergent outflow perturbing Rossby waves and triggering downstream development, and directly by advecting anticyclonic potential vorticity (PV) anomaly from deep convection near the TC to the upper-level anticyclone.
In the Northern Hemisphere, numerous case studies of individual ET events have been conducted (e.g., Atallah and Bosart, 2003; Atallah et al., 2007; Chen, 2011; Quinting et al., 2014). Basin-specific ET climatologies have also been well documented. In the western North Pacific, Klein et al. (2000) produced a brief ET climatology by analysing satellite imagery, showing that 27 % of TCs undergo ET in the period 1994–1998. The authors highlighted some key characteristics of ET, such as cold and dry (warm and moist) air streams to the west (east) of the transitioning TC, and lower-level frontogenesis to the north. A later study by Kitabatake (2011) applied an objective ET detection, known as cyclone phase space (CPS) by Hart (2003), on best-track and reanalysis datasets, showing an ET fraction of 49 % for this basin in the period 1979–2004. This study found a clear seasonal cycle of ET fraction (30 % in June–August, whereas 60 % in September–October), which is regulated by two competing factors: warm ocean and atmospheric baroclinicity. In the North Atlantic, Hart and Evans (2001) showed that 46 % of TCs transitioned to extratropical cyclones in the period 1950–1996, based on the transition declaration from the National Hurricane Centre best-track dataset. In this basin, most transitions occur at lower latitudes at the beginning and end of the North Atlantic hurricane season. Whereas their locations shift to higher latitudes in August and September, as warm SSTs extend poleward while the baroclinic zone intensifies and migrates equatorward. In the eastern North Pacific, however, there is a much lower ET fraction, with only 9 % of TCs transitioning to extratropical cyclones (Wood and Ritchie, 2014). The substantially reduced ET frequency is associated with a strong and deep subtropical ridge extending westward to the eastern North Pacific, which suppresses TCs moving north enough to interact with the midlatitude flow.
By comparison, only a handful of studies have investigated the synoptic dynamics and climatology of ET over the Southern Hemisphere. A detailed case study of TC Edisoana (1990) in the southwest Indian Ocean was conducted by Griffin and Bosart (2014). Climatological investigation is limited to Foley and Hanstrum (1994); Sinclair (2002); Griffin and Bosart (2014), supplemented by a global analysis by Bieli et al. (2019). An early study by Foley and Hanstrum (1994) analysed mean sea level pressure charts for all TCs off the west coast of Australia during the period 1964–1990, and further identified two distinct synoptic patterns associated with cyclone development. The “cradle” pattern features a cyclone embedded within a steady environmental easterly flow on the poleward flank. In contrast, TCs are captured by a meridionally-oriented cold front to their southwest in the “capture” pattern. The latter pattern comprises some characteristics of ET, including asymmetric cloud distribution and an upper-level jet streak on the poleward side of the transitioning cyclone. Griffin and Bosart (2014) conducted a brief ET climatology for the southwest Indian Ocean, based on a subjective diagnostic of the 1000–500 hPa thickness and surface trough development. The authors found an ET fraction of 43.8 % on average, with a higher frequency in January and December, but a much lower frequency in October and November. In the southwest Pacific, Sinclair (2002) produced a 28 year climatology of TCs that enter the midlatitudes and reported an average of 9 events each year, with a peak in March. The study investigated the structural changes of TCs as they move into the midlatitudes. On average, TCs typically mature near 20° S, and they weaken between 20–25° S in strong environmental vertical wind shear associated with the upper-level westerlies. Poleward of 25° S, the cyclones start to obtain extratropical characteristics, including asymmetric distribution of vertical motion, thermal advection, and regions of cold- and warm-frontogenesis. More recently, Bieli et al. (2019) produced a global ET climatology in the period 1979–2017, applying the CPS framework on the best TC track data and two reanalysis datasets. ET fractions differ substantially across the Southern Hemisphere, with an ET fraction of 20 %–30 % in the South Indian Ocean and the Australian region, and a fraction of up to 45 % in the South Pacific. Nonetheless, this study primarily focuses on statistics, seasonality, and general basin-scale environmental patterns, rather than synoptic-scale features and dynamics associated with ET.
ET climatologies relying on a subjective definition (e.g., Foley and Hanstrum, 1994; Griffin and Bosart, 2014) can lead to inconsistency in identifying ET events and determining ET timing, thereby limiting the comparability across studies. A combination of best-track datasets and objective ET identification in the CPS framework has been commonly used to produce ET climatologies (e.g., Kitabatake, 2011; Wood and Ritchie, 2014; Bieli et al., 2019), but both sources can have their own limitations. Best-track data often vary in definitions and methodologies across observational agencies, and they are also constrained spatially and temporally, especially when cyclones weaken into the post-tropical stage. As a result, some studies have started to identify ET in reanalysis and climate model datasets by applying the CPS to objectively tracked TCs (Zarzycki et al., 2017). On the other hand, the CPS framework does not resolve the cyclone inner-core structure and is sensitive to input data (Evans et al., 2017). For example, Wood and Ritchie (2014) and Bieli et al. (2019) have found that the CPS-based ET detection using Japanese 55-yr Reanalysis has a better agreement with observed ET events, compared with the detections using ERA-Interim or ERA-40 reanalyses from the European Centre for Medium-Range Weather Forecasts (ECMWF). Moreover, Kofron et al. (2010a) compared three ET detection methods, including open wave in the 500 hPa geopotential heights by Demirci et al. (2007), scalar frontogenesis by Harr and Elsberry (2000), and CPS parameters. They found that CPS is limited in distinguishing ET events from recurving non-ET cases, as well as in distinguishing between cases that reintensify or dissipate after transition. Their following work therefore proposed a new ET detection method, based on isentropic PV on the 330 K potential temperature surface (Kofron et al., 2010b).
Given the limited number of Southern Hemisphere studies and the limitations of the CPS framework and subjective ET definitions, the current research aims to conduct a comprehensive synoptic climatology of ET over the Southern Hemisphere, with a focus on identifying synoptic patterns during ET and the diversity among them. To achieve these goals, we apply a state-of-the-art objective cyclone tracking and classification framework to the latest generation ECMWF reanalysis to identify ET events in the period 1979–2021. The synoptic configurations associated with ET are clustered to examine the case-to-case variability. The paper is structured as follows. Section 2 introduces the datasets and methodologies used in this study. In Sect. 3, we first present the ET climatology and seasonality, then reveal characteristics of ET. This is followed by a clustering analysis of ET events. Section 4 discusses the results with previous studies, and Sect. 5 provides a summary and an outlook for future work.
2.1 ERA5 reanalysis
Atmospheric fields are obtained from the ECMWF v5 (ERA5; Hersbach et al., 2020). This study uses 6 hourly (00, 06, 12, and 18 UTC) surface and pressure-level variables with a horizontal grid spacing of 0.5°. Vertical pressure levels are from 1000–100 hPa with a 50 hPa interval. The 6 hourly fields are used for objective cyclone tracking and classification (described in the following section) and to examine synoptic patterns during ET. At the broad scale, we use monthly-averaged surface and pressure-level fields with the same spatial resolution to investigate the large-scale background environment. These data cover the period from 1979–2021.
2.2 Cyclone detection and classification
TempestExtremes software (Ullrich and Zarzycki, 2017; Ullrich et al., 2021) is applied to objectively detect and track cyclones, based on 6 hourly ERA5 reanalysis in the period 1979–2021. This tool has been used for detecting TCs (Zarzycki and Ullrich, 2017) and for studying ET (Zarzycki et al., 2017). The algorithm first detects a mean sea level pressure (MSLP) minimum surrounded by a closed contour of MSLP greater than 10 Pa within a 5.5° great circle distance from the centre, and detected cyclones are connected in time.
The detected cyclones are classified into different types, using a unified low-pressure system detection and classification framework (Han and Ullrich, 2025). The framework is known as the System for Classification of Low-Pressure Systems (SyCLoPS), which classifies detected cyclones into 16 categories (e.g., TC, thermal low, subtropical cyclone, extratropical cyclone), without topographical, latitudinal, and temporal restrictions as applied in previous studies. The framework produces good agreement with the International Best Track Archive for Climate Stewardship (IBTrACS; Knapp et al., 2010), in terms of distinguishing tropical and extratropical systems. It also yields better TC detection skill compared with previous methods (Zarzycki and Ullrich, 2017). The current study focuses on TC tracks over the Southern Hemisphere in the 1979–2021 period (a total number of 984 tracks).
2.3 ET identification
The CPS framework by Hart (2003) is the foundation for past ET studies. This framework assesses the cyclone structural changes, based on three parameters derived from geopotential height: lower-level thermal asymmetry (B), lower-level thermal wind (), and upper-level thermal wind (). B is calculated as the difference in the 900–600 hPa thickness between the right and left sides of the cyclone relative to its direction. and parameters measure the cyclone thermal structure. is defined as the vertical derivative of the geopotential height perturbation between 900 and 600 hPa, and is calculated in the same way as but for the 600–300 hPa layer. Mature axisymmetric TCs feature B<10 m, whereas extratropical cyclones have B>10 m. Warm-core TCs have a positive value of , whereas cold-core extratropical cyclones have a negative value of . The three CPS parameters are calculated along the identified TC tracks, and ET completes when B is greater than 10 m and becomes negative (Evans and Hart, 2003).
In the current study, however, ET time is identified based on a new framework by Han and Ullrich (2025), through evaluating the maximum 100 hPa relative humidity near the detected cyclone centre (RH100MAX) and the environmental vertical wind shear between 200 and 850 hPa averaged within a radius of 1000 km (DEEPSHEAR). RH100MAX determines the occurrence of deep convection, and DEEPSHEAR indicates atmospheric baroclinicity or an unfavourable condition for deep convection. These two parameters are found to be sensitive to ET. A transitioning TC loses its deep convective core, indicated by decreased moisture in the upper troposphere. Moreover, as the system undergoes ET, it mainly gains energy from baroclinic sources and becomes embedded in an environment of enhanced vertical wind shear. A detailed justification for this choice can be found in Han and Ullrich (2025). In this framework, a cyclone is classified as a tropical system when RH100MAX>20 % and (so-called tropical condition). The system failing to satisfy the tropical condition is then considered as a non-tropical system. For the system satisfying the tropical condition, it is considered under the transition, if its latitude is poleward of 15°, and RH100MAX<55 % or . ET time (more specifically, ET complete time) is determined when the system no longer satisfies the tropical condition.
An illustrative example of ET detection for TC Debbie 2017 is shown in Fig. 1. TC Debbie begins as a tropical low in the southeast of Papua New Guinea and subsequently intensifies into a TC off the northeast coast of Australia (Fig. 1a). In this period, the system is characterised by high upper-level relative humidity associated with deep convection and in an environment of weak vertical wind shear (Fig. 1b). As the cyclone moves poleward and makes landfall in northeast Australia, DEEPSHEAR increases while RH100MAX decreases dramatically. The ET time is defined when the vertical wind shear exceeds 18 m s−1, and the cyclone is located at around 30° S in the Tasman Sea.
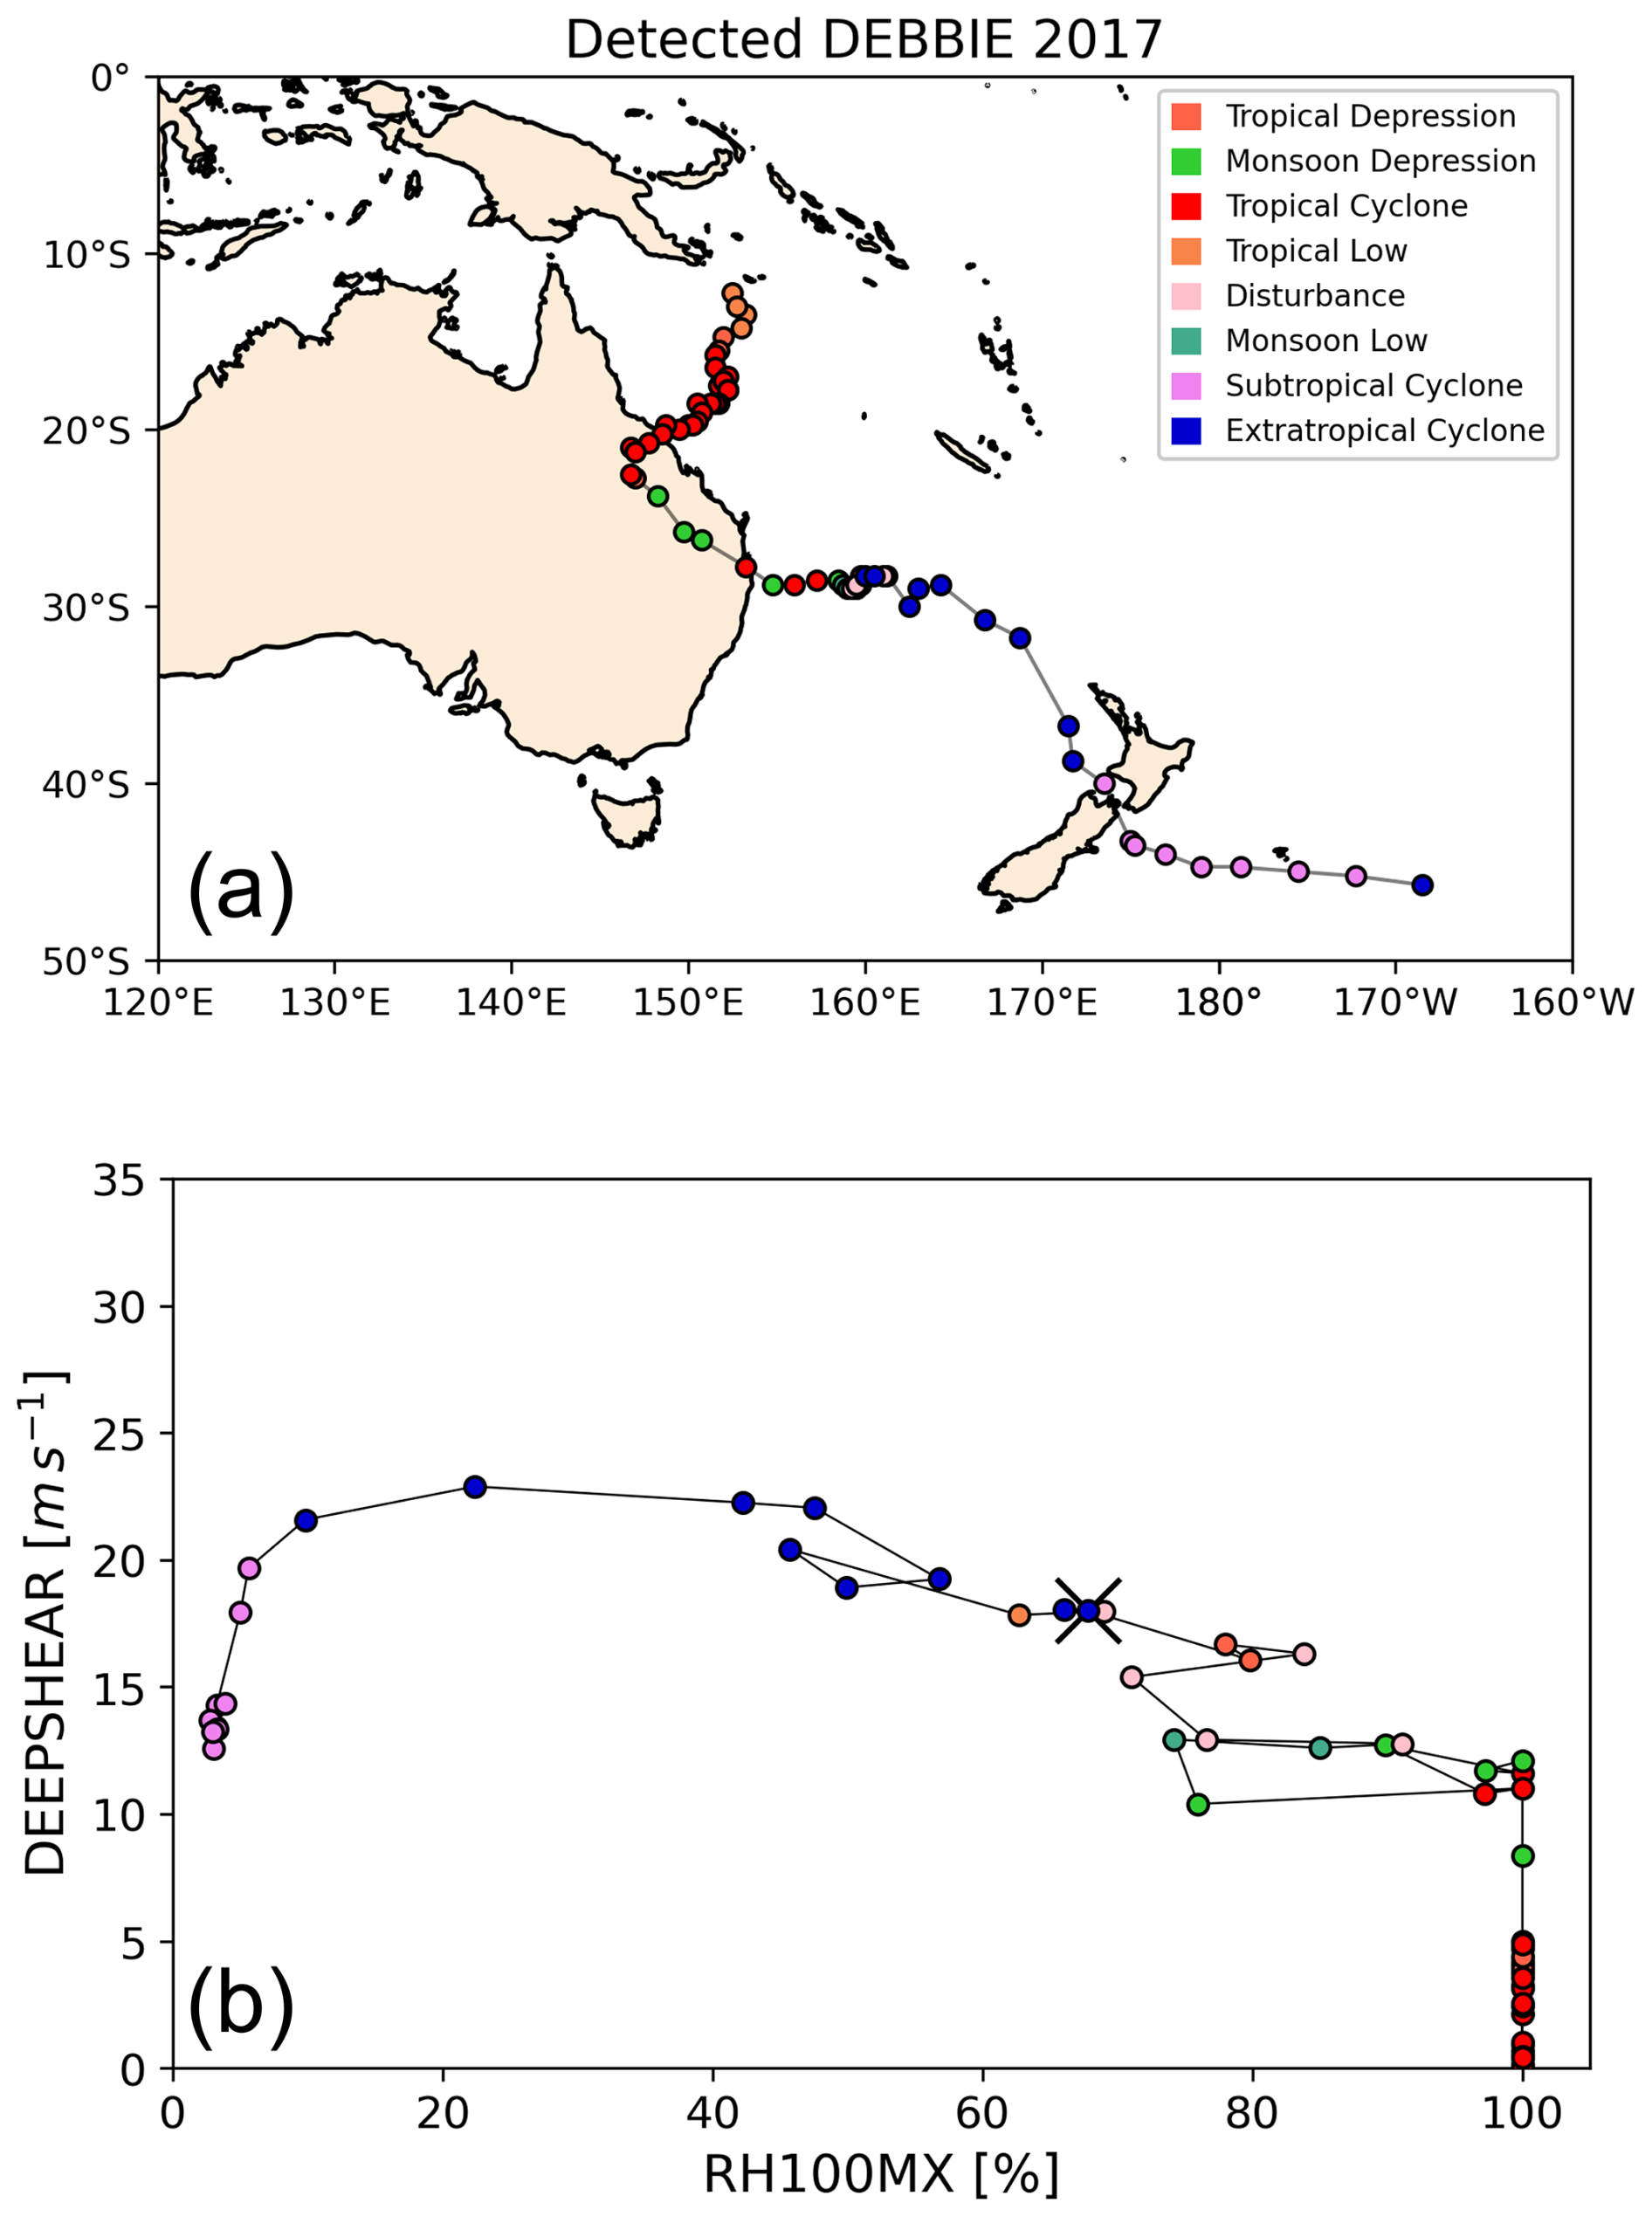
Figure 1An example of ET identification in the SyCLoPS framework. (a) Objectively-detected TC Debbie 2017 and (b) its corresponding RH100MAX-DEEPSHEAR phase space. Types of cyclones are marked by various colours. In panel (b), the black cross marks the ET time, and the supersaturation of RH100MAX is converted to 100 %.
We compare ET detection in the RH100MAX-DEEPSHEAR method by Han and Ullrich (2025) with that using the CPS framework by Hart (2003). The RH100MAX-DEEPSHEAR approach yields 506 ET cases out of the total 984 identified TC tracks in our study period (Fig. 2a). In comparison, the CPS method produces a higher number of ET cases (600 out of 984), with more events completing ET at relatively lower latitudes (figure not shown). This discrepancy is discussed further in Sect. 4.1. Nonetheless, the two methods show consistent structural evolution during ET, characterised by increasing lower-level asymmetry and a warm core progressively replaced by a cold core from the upper to the lower troposphere (figure not shown).
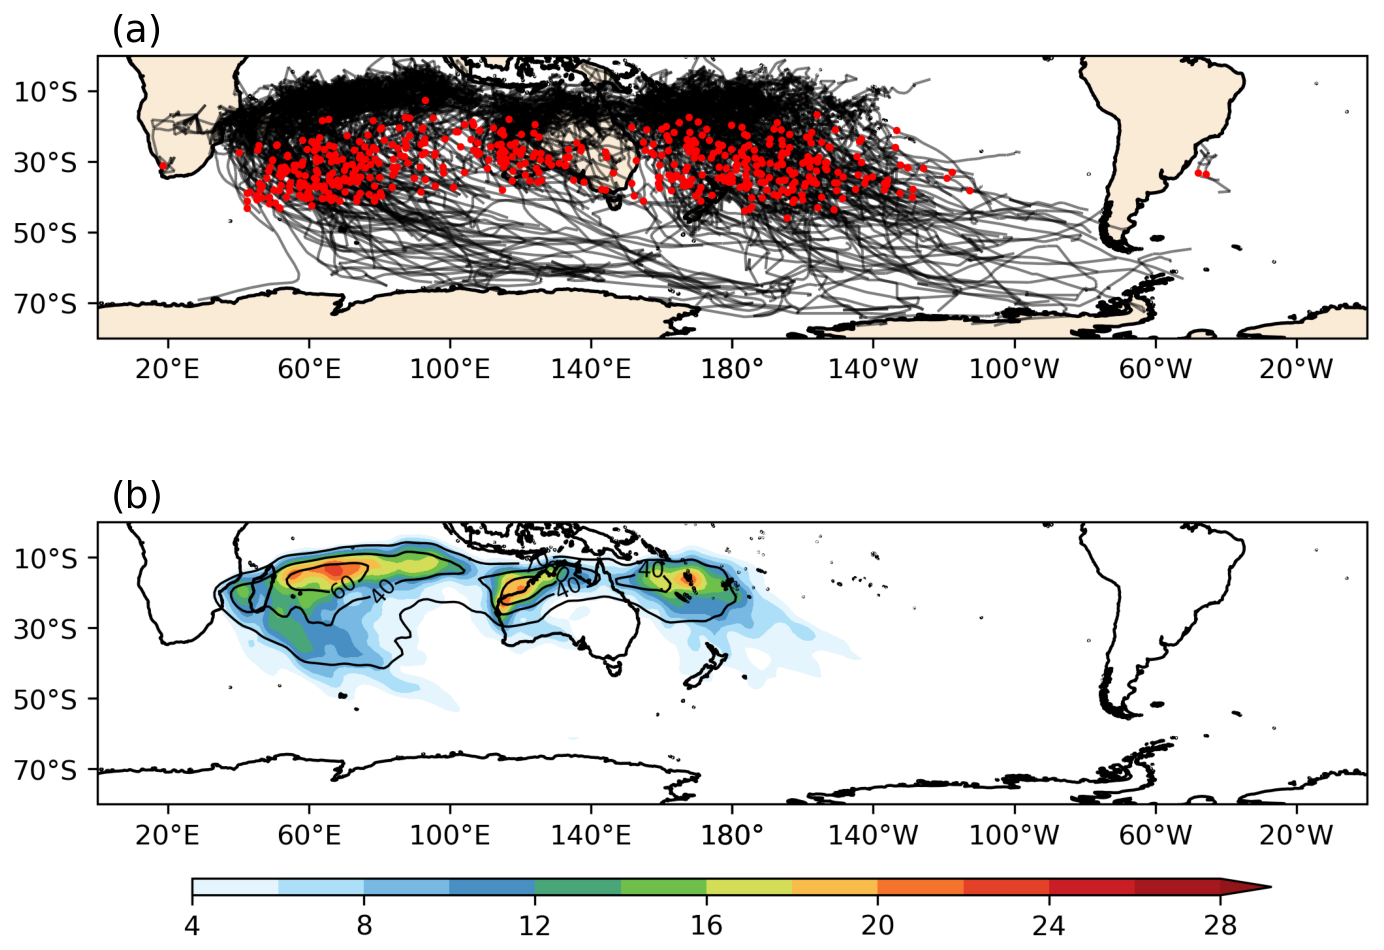
Figure 2(a) TC tracks that undergo ET, with red dots marking the position of ET. (b) The densities of all TC tracks (black contour every 20) and those that undergo ET (shaded as per the colourbar). Track density is represented by the total number of tracks passing each 1.25°×1.25° grid cell in the period 1979–2021. All track densities are smoothed by a Gaussian filter with σ=2.
2.4 K-means clustering
K-means clustering is performed on 2226 km×2226 km cyclone-centred fields of 500 hPa geopotential height (Z500) and MSLP at ET time. These two fields are chosen to consider the interaction between TCs and their upstream trough in the upper troposphere. Z500 has been previously used to determine ET time when a TC becomes an open wave in the upper levels (Demirci et al., 2007). Before clustering, Z500 and MSLP fields are standardised separately. For each variable, the mean and standard deviation are computed at each grid point across a total of 504 detected ET events, and the fields are then normalised by subtracting the corresponding mean and dividing by the corresponding standard deviation. The optimal cluster number K is determined objectively by evaluating the silhouette score and the Davies–Bouldin index for K between 2 and 20 (Fig. S1 in the Supplement). A silhouette score close to one indicates greater separation between clusters (Rousseeuw, 1987), whereas a Davies–Bouldin index close to zero indicates a better separation (Davies and Bouldin, 1979). Four is determined as a sensible cluster number, which maximises the silhouette score while minimising the Davies–Bouldin index. In addition, four clusters capture the most variability of synoptic patterns associated with ET.
To test the sensitivity to input field choice, the clustering is repeated using only MSLP fields and again using only Z500 fields. Clustering with MSLP only and Z500 only both produce the same optimal cluster number (K=4), as obtained from clustering with both MSLP and Z500. The results with only Z500 are in strong agreement with the results based on both MSLP and Z500, with minor differences in composite mean patterns and sample sizes of individual clusters. In contrast, clustering based solely on MSLP yields less comparable composite mean structures and has larger differences in sample sizes.
3.1 Climatology and seasonality
In the Southern Hemisphere, ET events predominantly occur in the southwest Indian Ocean, off the northwest coast of Australia, and over the southwest Pacific, whereas they are rare in the South Atlantic and southeast Pacific (Fig. 2a). TCs that transition to extratropical cyclones tend to have longer tracks, compared with those that do not (figure not shown). The track density is calculated for the total 984 TC tracks and for those undergoing ET respectively, as the total number of tracks passing each 1.25°×1.25° grid box. The number of ET events follows that of the total number of TCs over the Southern Hemisphere (Fig. 2b). In the southwest Indian Ocean and along the northwest coast of Australia, the highest ET densities coincide with the regions of maximum TC density. In the southwest Pacific, most ET events occur northeast of Australia and are shifted eastward relative to the region of the highest TC density. The ET events west of 140° E generally move westward at lower latitudes, and recurve into the midlatitude westerlies and move toward the east (Fig. 2a). By comparison, the tracks over the southwest Pacific are characterised by a general southeastward direction during their full lifecycle.
Figure 3a shows a shift in the seasonality in the number of all TC tracks and those that undergo ET. The largest and second-largest TC numbers are in January and February, whereas the largest ET number is in March. At the season peak (January–February), the ET fraction is lower despite high TC and ET numbers, whereas the fraction increases in later months and reaches its peak in May. As shown in Fig. 3b, transitions occur at about 31° S on average, although there is a notable seasonal cycle. ETs tend to occur at lower latitudes early (October–November) and late (May–June) in the season, whereas their mean latitude shifts poleward to around 35° S during the season peak (January–February).
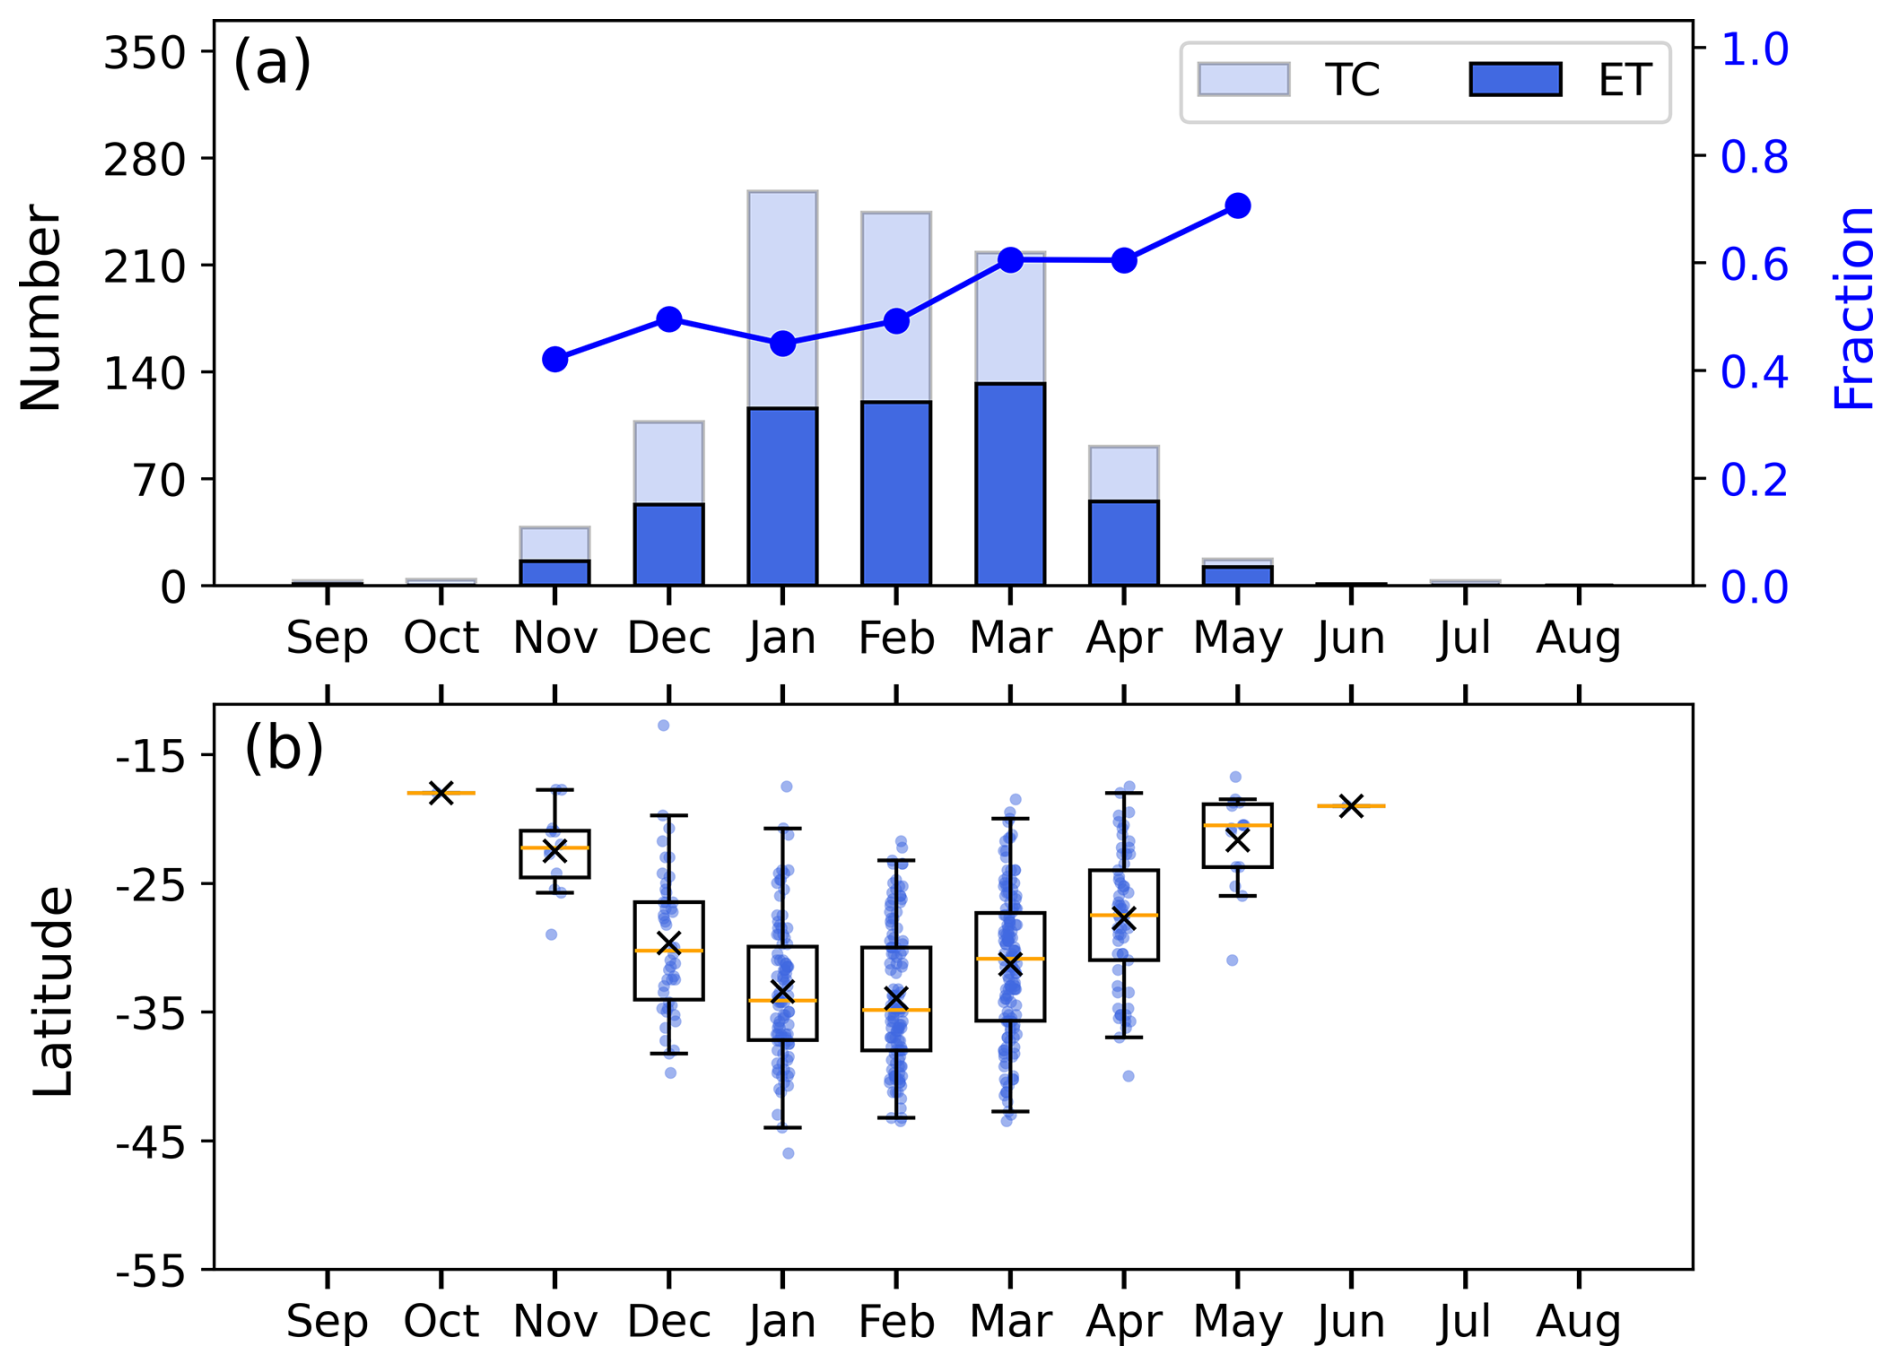
Figure 3(a) Number by month of TC tracks (lighter bars) and those that undergo ET (darker bars), with the blue line representing the ET fraction. The ET fraction is only calculated if a minimum of 5 TC tracks are in a given month over the study period. (b) Latitude of cyclones at their ET time (dots) by month and corresponding box and whisker plot. The medians are marked by orange lines, the means by black crosses, the interquartile ranges by boxes, and the whiskers indicate the 1st and 99th percentiles. Both of the monthly statistics are based on the period 1979–2021.
We analyse the seasonal climatologies of vertical wind shear (between 200 and 850 hPa) and SST in the 1979–2021 period. Vertical wind shear indicates baroclinicity associated with the jet. SST exceeding 26 °C is one of the necessary environmental conditions for TC genesis (Gray, 1968), and warm SSTs are also important for a system to intensify to a TC (Emanuel, 1988). Leading into the Southern Hemisphere TC season (SON), a belt of strong vertical wind shear lies between 20 and 30° S, which likely restricts TC genesis to lower latitudes bounded by the 26 °C-SST isotherm (Fig. 4a). As a result, only a handful of ET events occur at lower latitudes equatorward of the maximum vertical wind shear. Despite the southward intrusion of warm SSTs and higher TC numbers in January and February, the ET fraction is the lowest in this period (Fig. 3a), as a result of a substantially weakened and poleward-shifted baroclinic zone (Fig. 4b). In this configuration, many TCs are likely to decay before reaching far enough south to interact with the midlatitude flow. Moreover, most ET occurs at higher latitudes over cooler SSTs during DJF (Fig. 3b). During autumn (MAM), the baroclinic zone starts to intensify and migrate equatorward close to the 26 °C-SST isotherm (Fig. 4c). Under this large-scale pattern, TCs are more likely to be captured by the midlatitude flow. Therefore, the austral autumn is the most ET-favoured season of the year (Fig. 3a). In addition, it seems that TCs undergo ET at lower latitudes over warmer SSTs, compared with DJF. In JJA, warm SSTs retreat to the deep tropics. In addition, intense vertical wind shear dominates a large area from 40° E–140° W and migrates further equatorward, thereby suppressing TC formation (Fig. 4d). As a result, both TC and ET events are rare at this time of year.
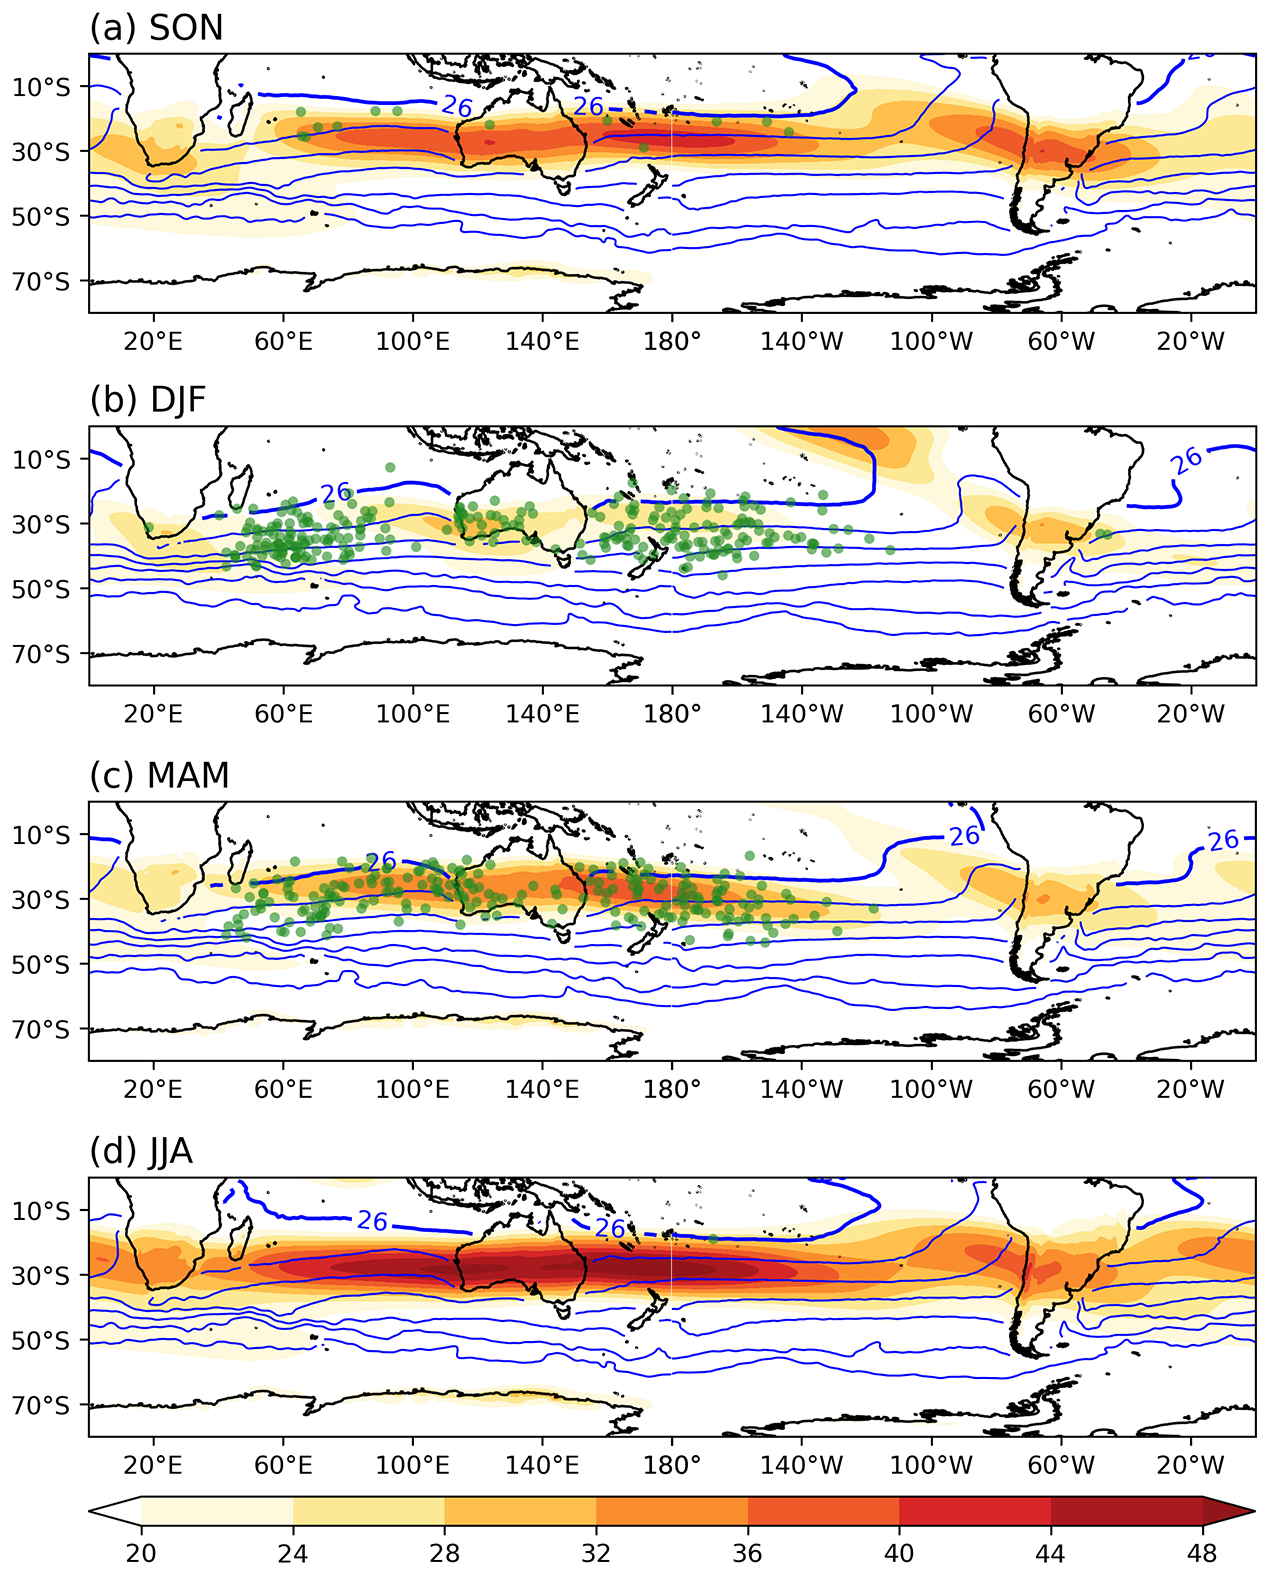
Figure 4Seasonal climatologies of vertical wind shear (in m s−1; shaded as per the colourbar) and SST (in °C; blue contours every 4 °C starting from 2 °C) for (a) September–October–November (SON), (b) December–January–February (DJF), (c) March–April–May (MAM), and (d) June–July–August (JJA) over the Southern Hemisphere. Green dots mark the positions of ET. A thick blue line highlights the 26 °C contour. The seasonal climatologies are based on the period 1979–2021.
3.2 Mean structural characteristics and mechanisms
3.2.1 Evolution of cyclone structure and background environment
Changes in cyclone structure and background environment are analysed based on a 144 h window centred on the ET time. The metrics assessing structural characteristics include central pressure, maximum wind speed, latitude, translation speed and direction, and the three CPS parameters (B, , and , as described in Sect. 2.3). The central pressure and latitude are taken from the TC centre. The speed and direction are computed from the difference between the current cyclone location and its subsequent position. The maximum wind speed is computed as the maximum 10 m wind speed within 200 km of the centre. The three CPS parameters are computed from averages within a 500 km radius from the cyclone centre. As background environmental factors, we examine the 200–850 hPa vertical wind shear (DEEPSHEAR) and SST, averaged within 1000 km from the centre.
To first order, the transitioning TC features poleward propagation during the 144 h window (Fig. 5a and i). The TC exhibits relatively slow southward motion equatorward of 25° S at 72 and 48 h before ET. From −24 to +24 h, the cyclone accelerates and propagates southeastward between 25 and 35° S, and then moves predominantly eastward with a slight deceleration from +48 h onward. At ET, the maximum inner-radius wind speed decreases (Fig. 5b). Before ET, the central pressure increases, whereas it decreases after ET (Fig. 5c). This suggests that, on average, TCs undergoing ET tend to reintensify, although the spread becomes larger after ET.
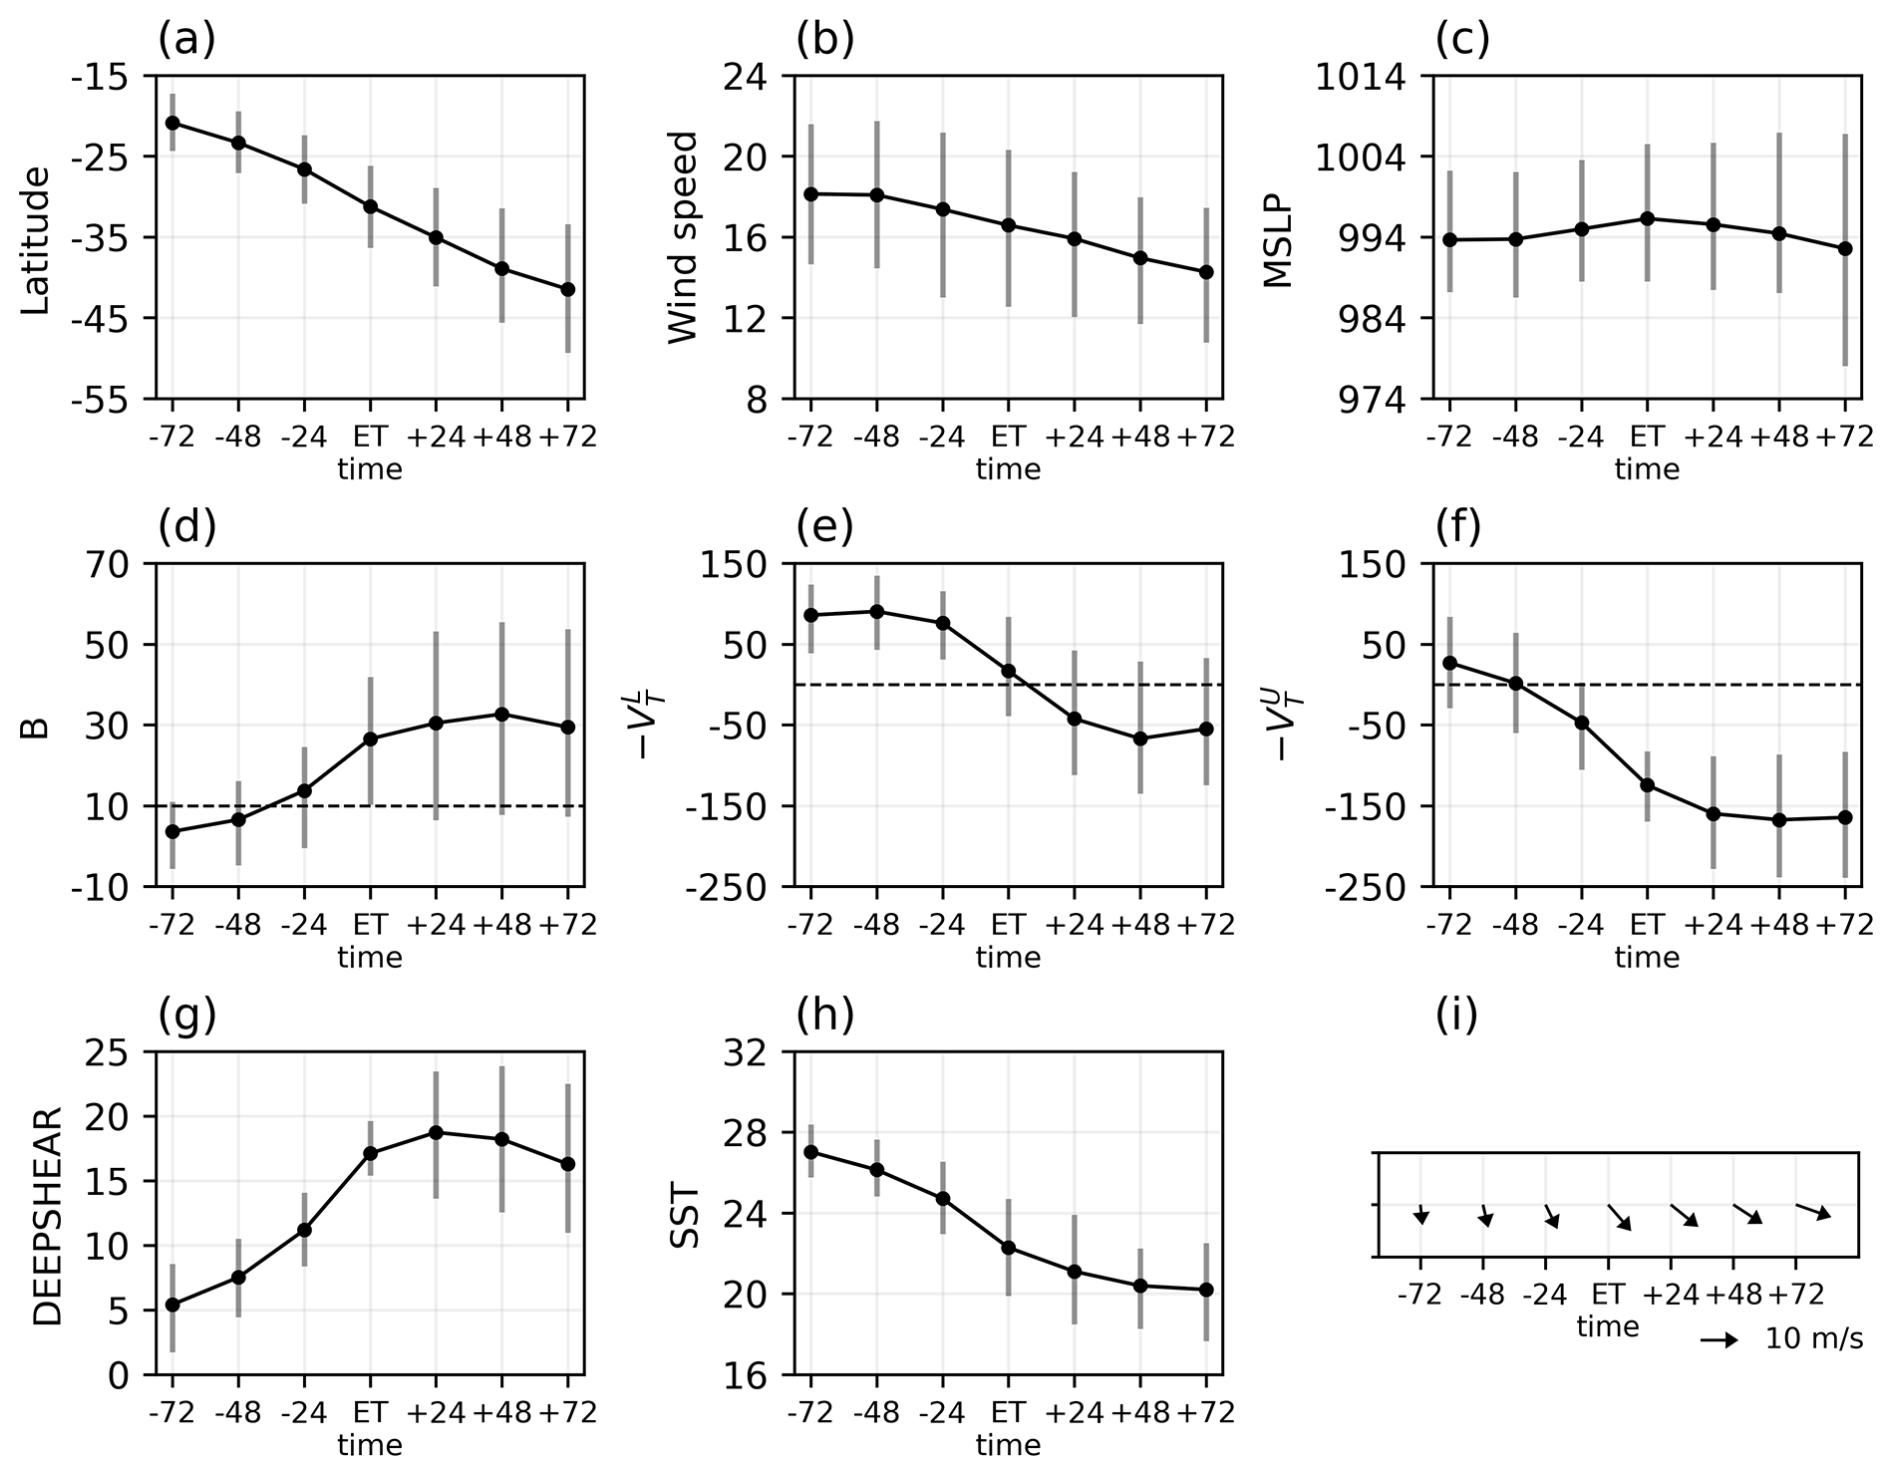
Figure 5Evolution of (a) latitude, (b) wind speed (in m s−1), (c) central pressure (MSLP, in hPa), (d) B, (e) , (f) , (g) vertical wind shear (DEEPSHEAR, in m s−1), (h) SST (in °C), and (i) cyclone speed (in m s−1) and direction from 72 h before to 72 h after ET. Dots denote the mean, and whiskers mark the 25th and 75th percentiles. Dashed horizontal lines in (d–f) mark the thresholds for ET definition in the CPS framework. The bottom (right) aligns with south (east) in (i).
Figure 5d–f show the evolution of the CPS parameters, indicating that the cyclone becomes increasingly asymmetric and transitions from a warm-core to a cold-core structure. The mean value of B starts to increase at −72 h, exceeds 10 m by −24 h, and continues to rise to about 30 m, after which it remains stable (Fig. 5d). The mean remains nearly constant until −24 h, and then it decreases to negative values from +24 h onward (Fig. 5e). The mean value of begins to decrease at −72 h, reaches zero at −48 h, and remains negative after this time (Fig. 5f). The evolution of and implies that the transition in thermal structure occurs earlier in the upper troposphere than in the lower troposphere. At the ET time defined in this study, the mean B has already exceeded 10 m, but the mean remains close to zero and only becomes negative 24 h later (Fig. 5d and e). Therefore, on average, the ET time defined here may be slightly earlier than that detected by the CPS framework. Notably, 24 h after ET, the 75th percentile of remains positive, while the upper and lower quartiles of are both negative (Fig. 5e and f).
The evolution of the background vertical wind shear and SST is shown in Fig. 5g and h. The mean wind shear increases between −72 and +24 h, whereas it slightly decreases from +24 h onward (Fig. 5g). Conversely, the mean SST features a general reduction between −72 and +24 h, and it remains stable at around 20 °C after +48 h (Fig. 5h). The most rapid environmental changes occur during the 24 h before ET (Fig. 5g and h), when the cyclone accelerates and changes direction from southward to southeastward (Fig. 5i).
3.2.2 Synoptic characteristics
Details of the cyclone structure and background environment are further analysed by compositing various fields at different pressure levels (200, 500, 700, and 850 hPa). These fields are centred on TC positions and have a domain of 2226 km×2226 km. The composites are only shown for 24 h before ET, at ET, and 24 h after ET.
At 200 hPa, the composite flow patterns reveal that the TC moves poleward and reaches the equatorward side of the entrance region of a jet to its southeast, while a southwest-northeast oriented trough approaches from the west, and a ridge develops to the east (Fig. 6a–c). From −24 h to ET time, the jet intensifies and a jet streak (a region of wind speed over 46 m s−1) forms in the southeast sector, with an enhanced PV gradient on its southern edge. The intensified jet is consistent with the enhanced environmental vertical wind shear (shown in Fig. 5g). At +24 h, the downstream jet weakens and becomes narrower compared with that at the ET time (Fig. 6b and c). The evolution of the 500 hPa flow pattern shows that the TC gradually merges with the upstream trough and becomes an open wave (Fig. 6d–f). The result is consistent with expectations based on the ET definition proposed by Demirci et al. (2007). A dipole of vorticity advection is characterised by positive values to the northwest and negative values to the southeast, which is associated with the trough propagating toward the east. From −24 to +24 h, the magnitudes of positive and negative vorticity advection decrease, consistent with the weakening upper trough.
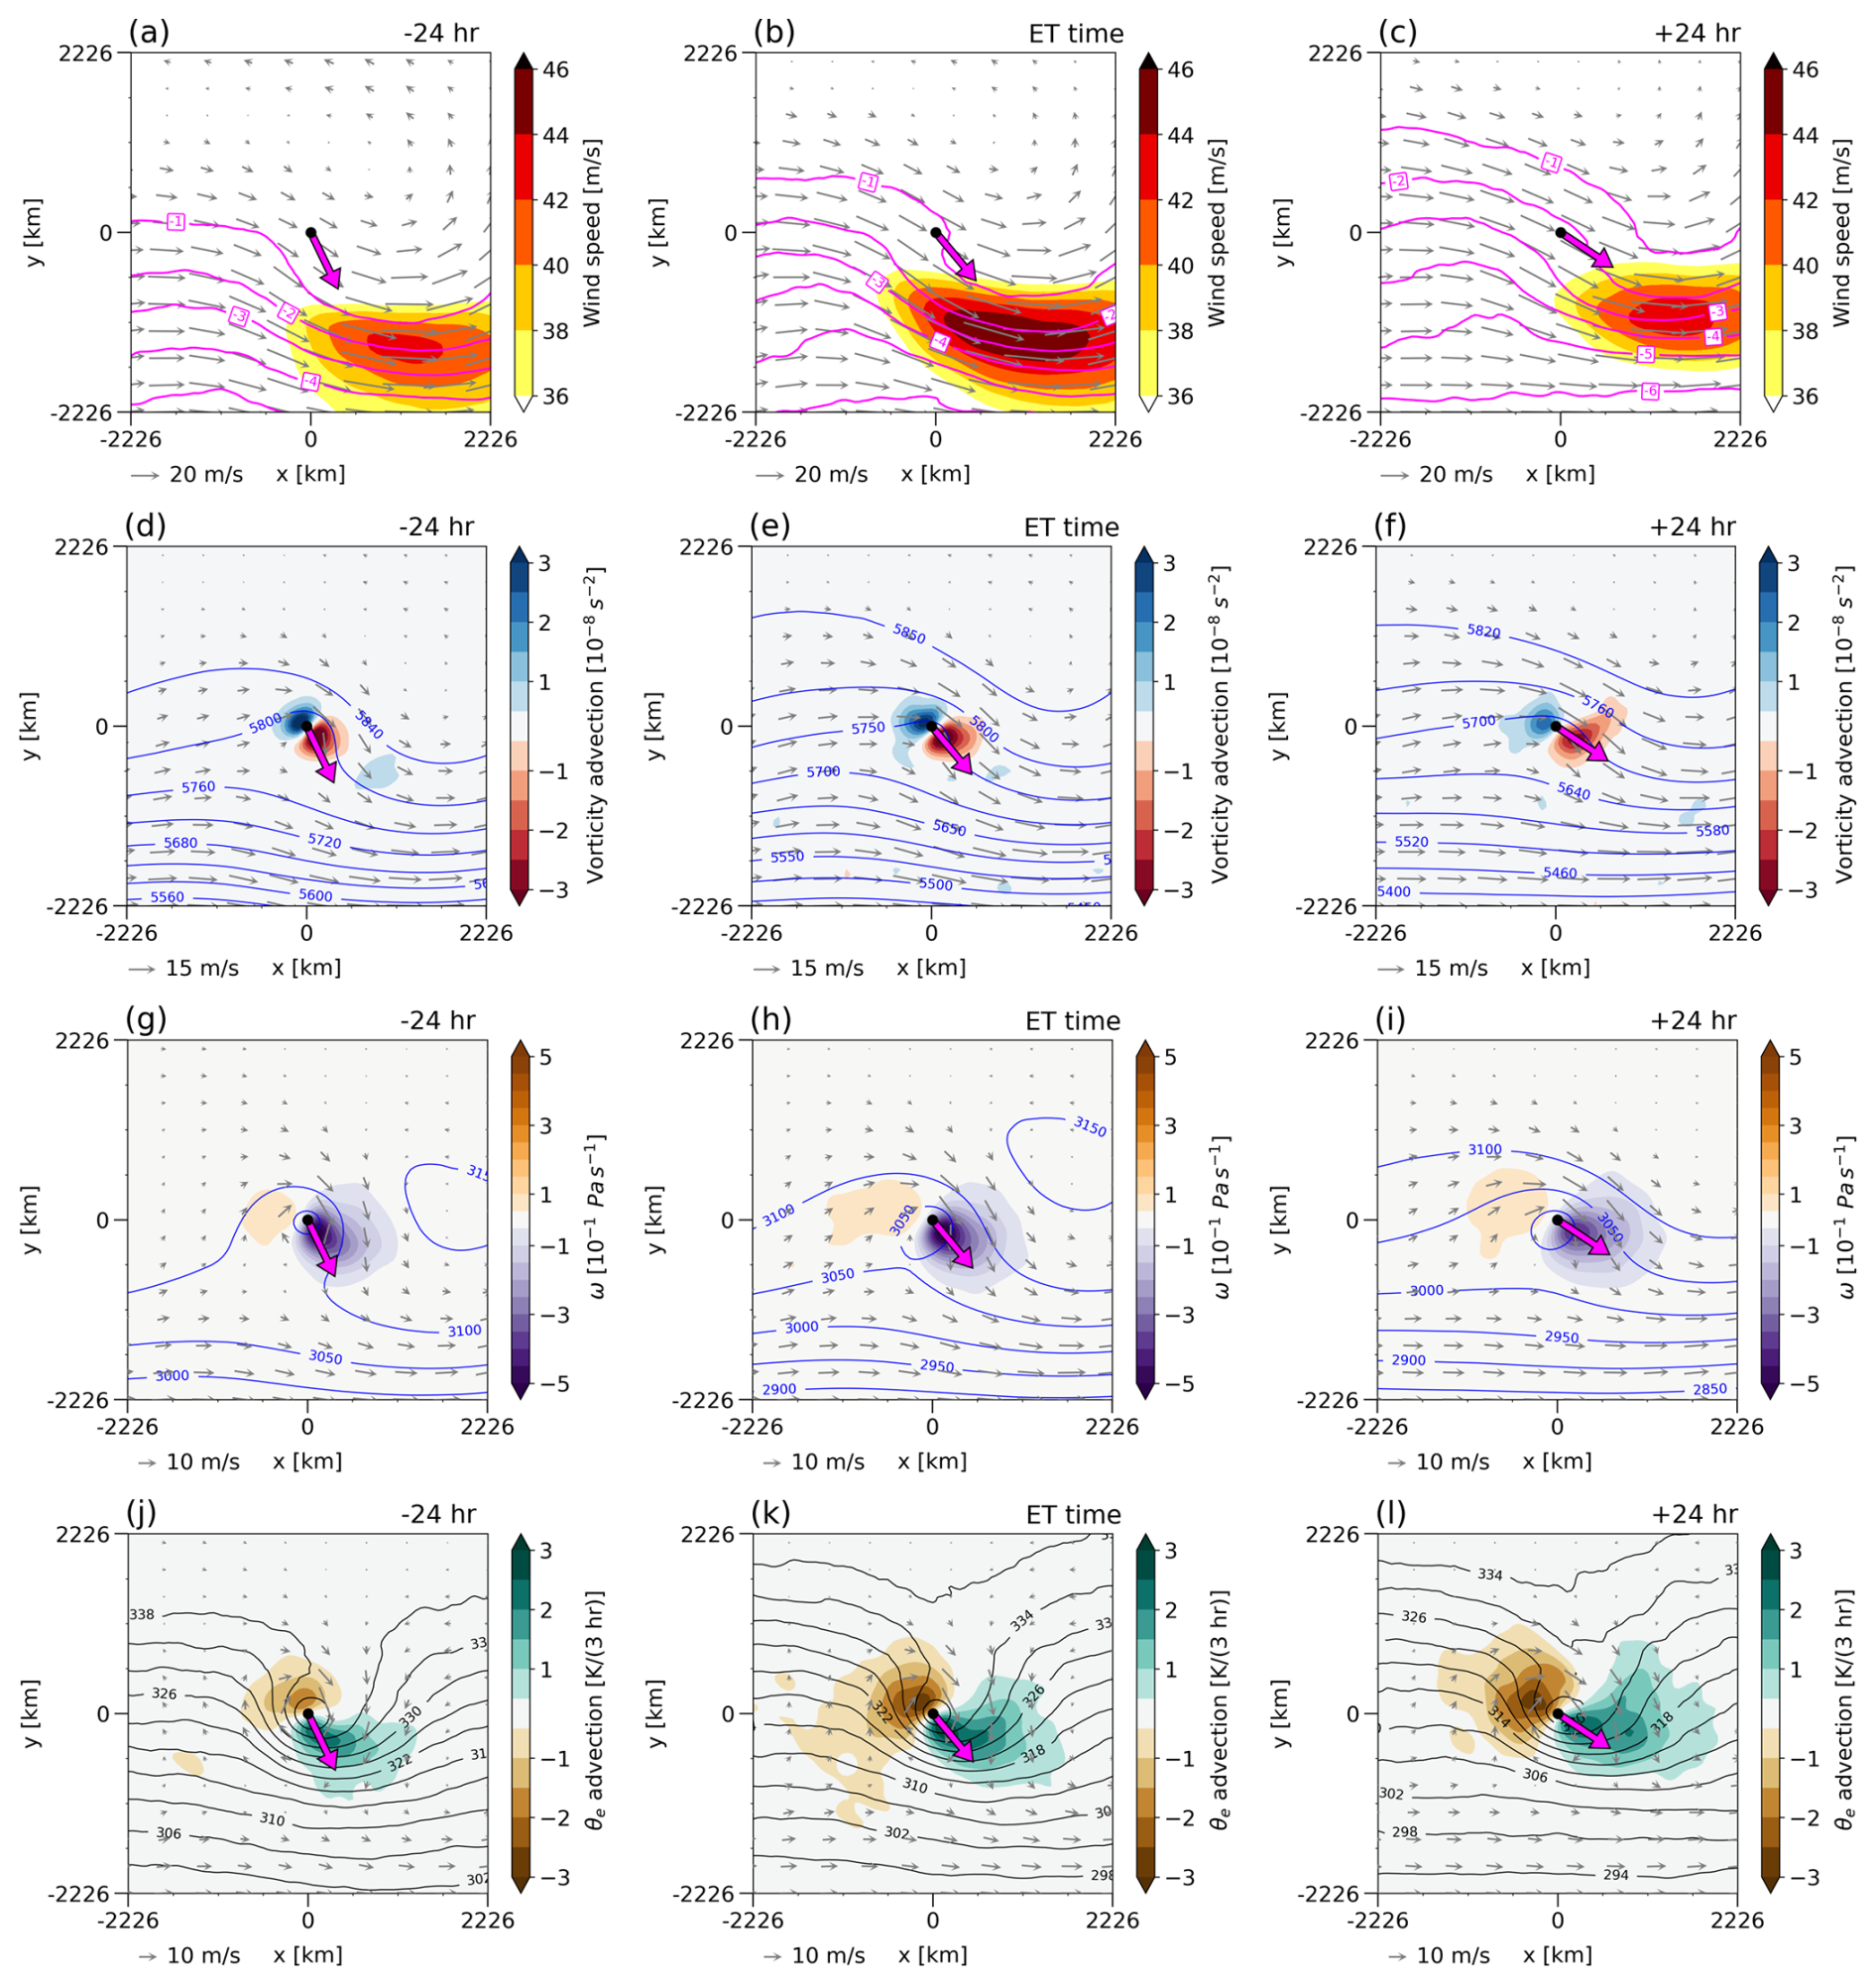
Figure 6Lead-lag composites of (a–c) wind speed (shaded as per the colourbar), wind (arrows), and PV (magenta contours every 1 PVU; ) at 200 hPa; (d–f) vorticity advection (shaded as per the colourbar), wind (arrows), and geopotential height (blue contours every 50 m) at 500 hPa; (g–i) vertical velocity (shaded as per the colourbar), wind (arrows), and geopotential height (blue contours every 50 m) at 700 hPa; and (j–l) advection of equivalent potential temperature (shaded as per the colourbar), wind (arrows), and equivalent potential temperature (black contours every 4 K) at 850 hPa. Magenta arrows indicate the direction of the cyclone. Coordinates are in km relative to the cyclone centre. The bottom (right) of the composites aligns with south (east).
At 700 hPa, the vertical motion and horizontal wind become increasingly asymmetric, with strong ascent and north-northwesterlies ahead of the trough, and weak descent and south-southwesterlies to its rear (Fig. 6g–i). At +24 h, the ascent becomes weaker compared to ET time and −24 h. At this level, the trough has a larger amplitude, while remaining vertically aligned and tilted similarly to that observed at 200 and 500 hPa. Figure 6j–l show the evolution of 850 hPa flow and thermal characteristics. The transitioning TC substantially modifies the equivalent potential temperature field, enhancing its gradient in the southern and southeastern sectors. The equivalent potential temperature gradient is slightly stronger at ET, compared with that at −24 and +24 h (Fig. 6k). The 850 hPa flow pattern features south-southwesterlies (north-northwesterlies) west (east) of the cyclone. There is a notable positive-negative couplet of equivalent potential temperature advection. Between −24 h and ET, the magnitudes of the positive and negative equivalent potential temperature advection increase, followed by a slight reduction after ET (Fig. 6j–l).
Lead-lag composite cross sections are computed for the west–east and south–north directions respectively. PV anomaly is calculated as a deviation from the 30 d running mean centred on the analysis time, with negative (positive) values representing cyclonic (anticyclonic) PV anomalies in the Southern Hemisphere. Before ET, a strong and narrow cyclonic PV tower lies at the TC centre, with an approximate width of 222 km and extending upward to 300 hPa (Fig. 7a and d). The cyclonic PV anomaly is particularly strong in the layer of 600–950 hPa. Within 222 km from the centre, isentropes bend sharply downward, indicating a deep warm-cored structure (Fig. 7a). In the upper troposphere, the TC is surrounded by an anticyclonic PV anomaly, with larger values in the southeast sector (Fig. 7a and d). Vertical motion around the TC is asymmetric, with the strong ascent on the southeast side. From ET onwards, the cyclonic PV tower and warm core weaken and become shallower, whereas the upper-level anticyclonic PV anomaly substantially enhances and peaks at +24 h (Fig. 7b, c, e, and f). The strong upper-level anticyclonic PV anomaly is vertically aligned with the region of the downstream ridge (Fig. 6a–c). There is a weak upper-level cyclonic PV anomaly to the west, reflecting an upstream upper-level trough approaching the transitioning cyclone (Fig. 7b and c). Steeper isentropic slopes on the poleward side of the cyclone suggest that the cyclone moves into an increasingly baroclinic environment (Fig. 7d–f). Moreover, the ascent around the cyclone becomes much weaker after ET, compared to that before ET (Fig. 7a, c, d and f).
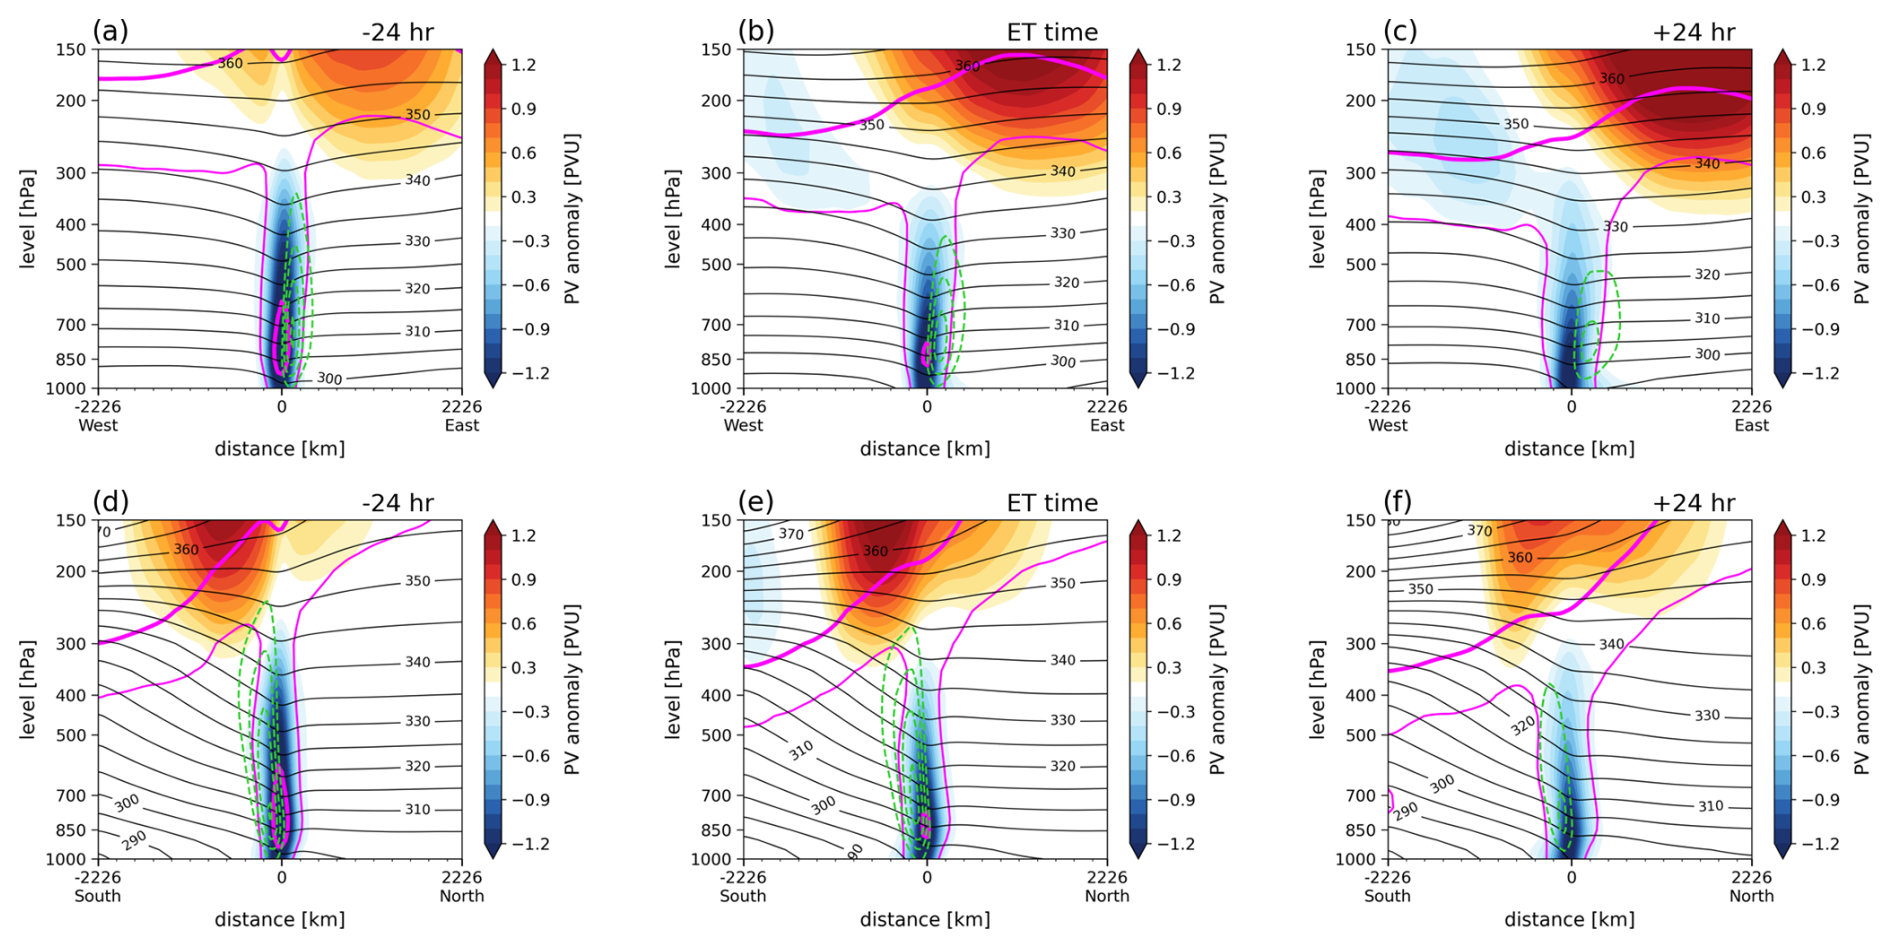
Figure 7Lead-lag cross section composites in (a–c) west–east and (d–f) south–north direction for PV anomaly (shaded as per the colourbar), PV (magenta contours at −2 and −0.7 PVU), potential temperature (black contours every 5 K), and vertical velocity (dashed green contours every , only negative values displayed). PV anomalies are calculated relative to the 30 d running mean. A thick magenta line highlights the −2 PVU contour. Coordinates are in km relative to the cyclone centre.
3.2.3 Precipitation and wind
Figure 8a–f show the cyclone-centred composites of 6 hourly accumulated precipitation, MSLP, and 10 m wind before ET, at ET, and after ET. Note that the bottom (right) of the composites aligns with south (east).
At −72 h (i.e., 72 h before ET), the precipitation and wind fields begin to become slightly asymmetric, and the strongest precipitation and wind are constrained within a radius of 250 km from the cyclone centre, in which MSLP contours are compact (Fig. 8a and d). At ET, the maximum precipitation substantially decreases, particularly in the northern sector of the cyclone, the wind speed weakens, and the area of high wind speed expands zonally (Fig. 8b and e). After ET, the MSLP field becomes broader, while the precipitation and wind further reduce and become highly asymmetric (Fig. 8c and f). During this lead-lag period, the maximum precipitation shifts from the left to the right of the track, whereas the maximum wind speed remains on the left of the track (Fig. 8a–f). Furthermore, the wind field expands, with strong winds isolated on the equatorward side of the TC track. The wind field expansion is further analysed by azimuthally averaging the 10 m wind speed for the same lead-lag period. As shown in Fig. 8g, the radius of maximum azimuthally-averaged wind speed is approximately 100 km from the cyclone centre both before and at ET, whereas it shifts outward to about 300 km after ET. In addition, wind speeds outside the radius of maximum winds increase, and the wind profile becomes flatter.
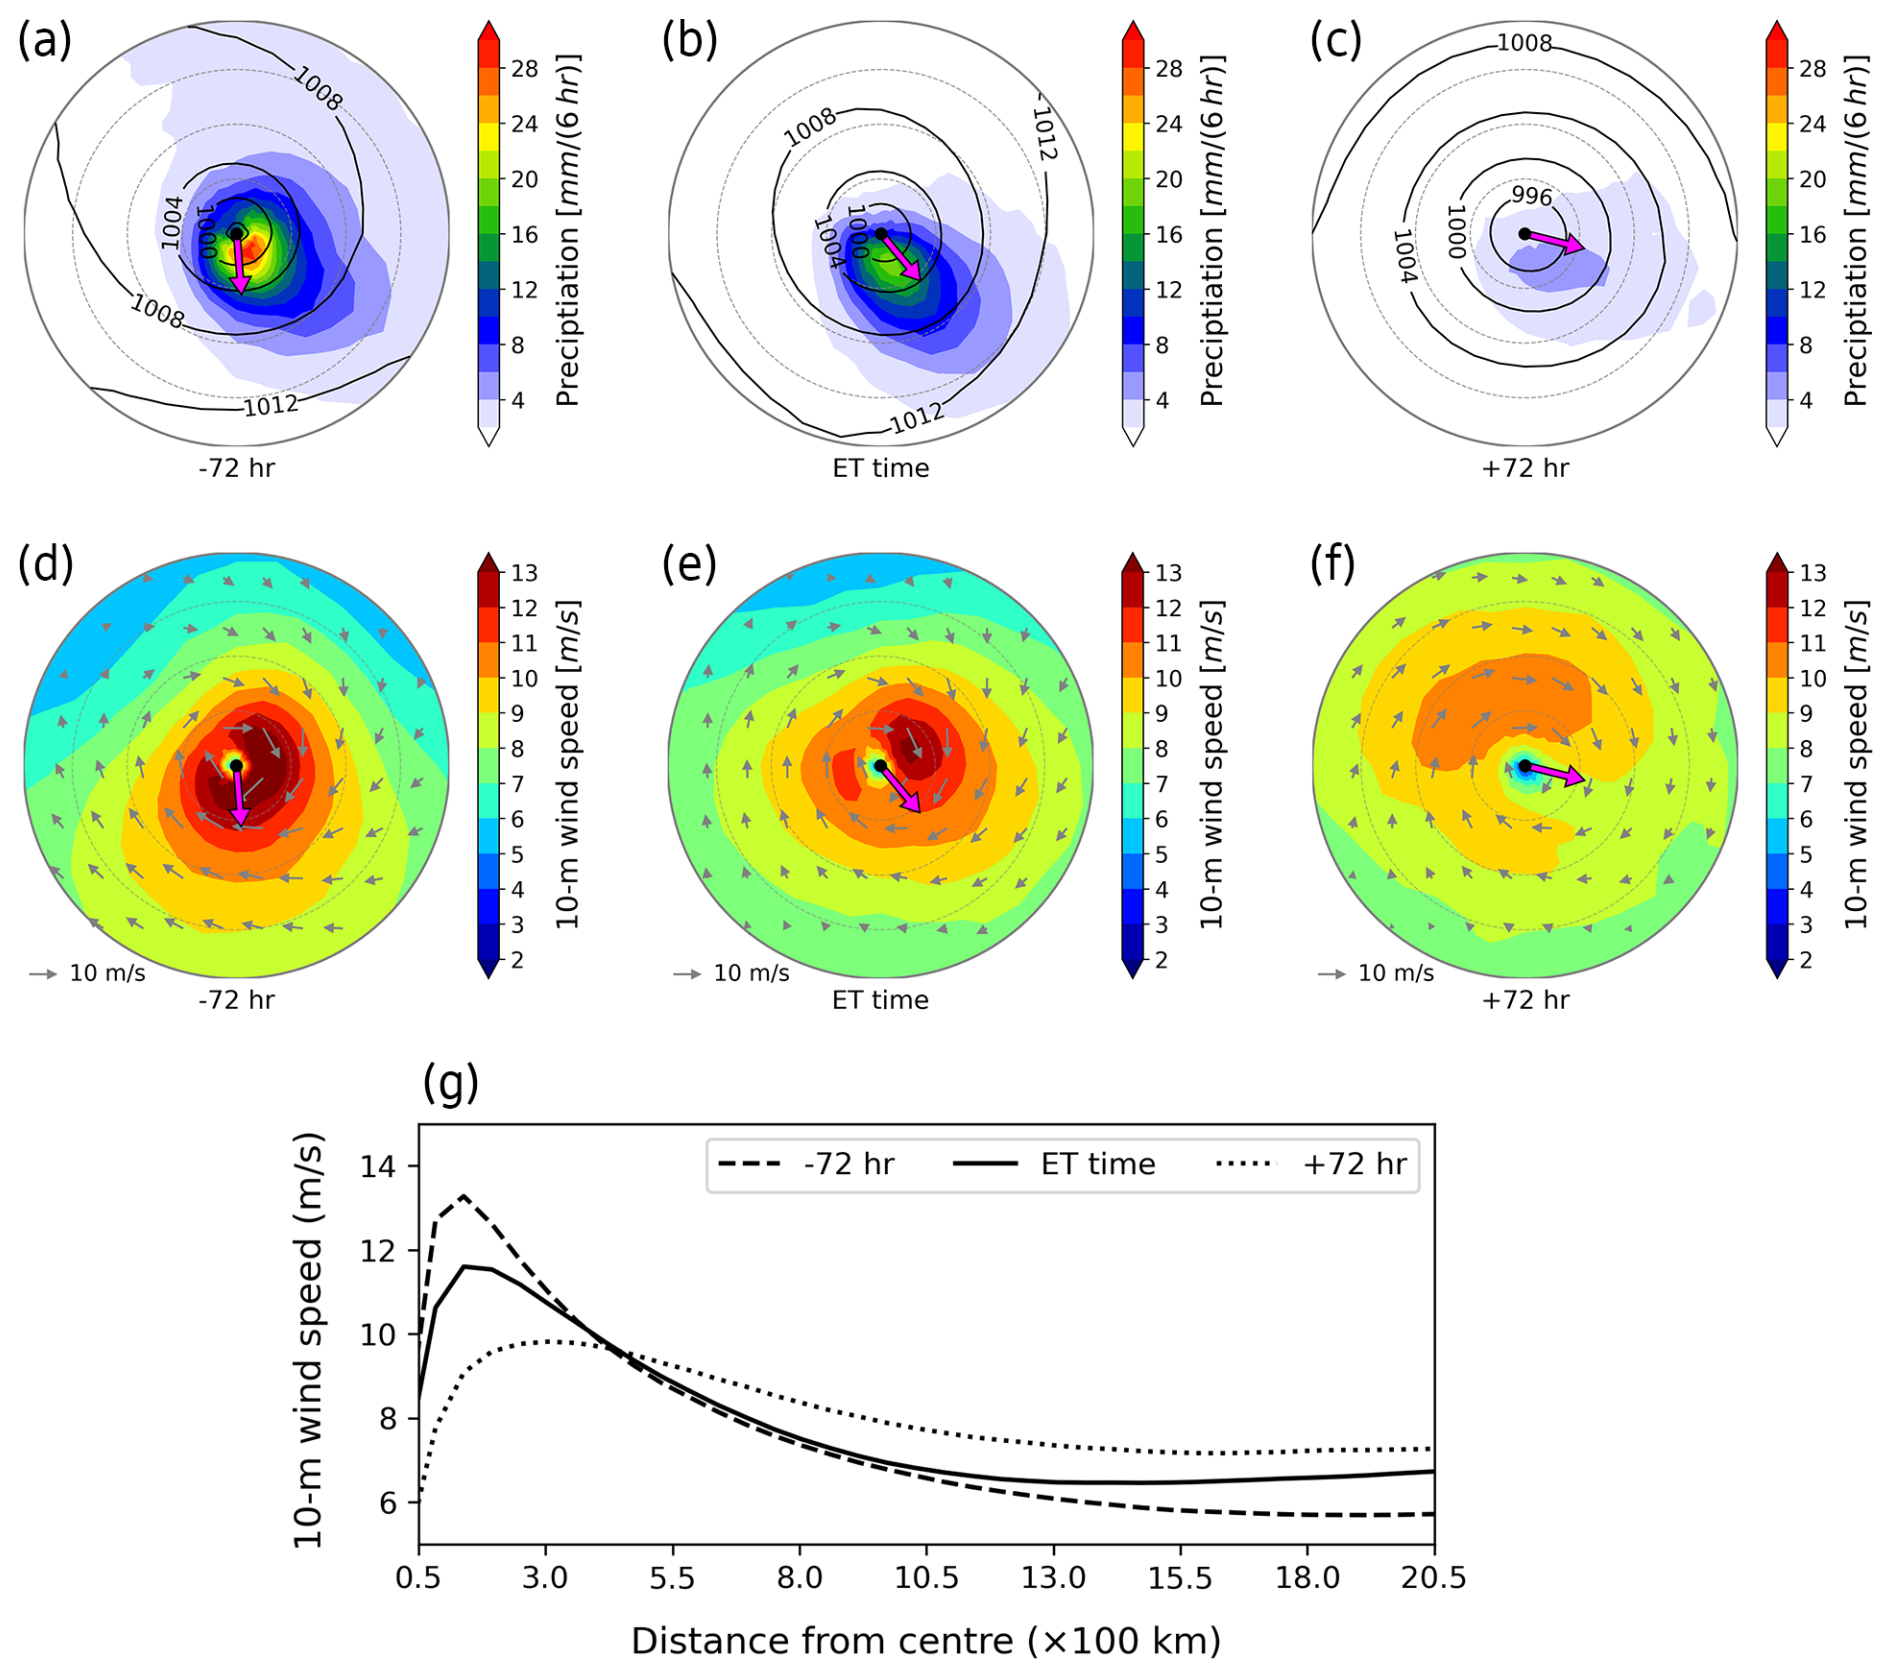
Figure 8Composites of (a–c) 6 hourly accumulated precipitation (shaded as per the colourbar) and MSLP (black contours every 4 hPa), (d–f) 10 m wind (grey arrows) and wind speed (shaded as per the colourbar), and (g) azimuthally-averaged 10 m wind speed from 72 h before to 72 h after ET. Each panel has a radius of 1000 km, with grey dashed rings plotted every 250 km from the centre. The magenta arrow indicates the direction of the cyclone. The composites are not rotated, and the bottom (right) of the composites aligns with south (east).
3.3 ET Morphologies
ET events are sensitive to the interaction and phase between the transitioning TC and the midlatitude flow (e.g., Ritchie and Elsberry, 2001; Jones et al., 2003; Keller et al., 2019), and many studies have shown a large case-to-case variability in their associated synoptic patterns (e.g., Foley and Hanstrum, 1994; Harr and Elsberry, 2000; Harr et al., 2000). As a result, the composite analysis of all ET events is limited. To address this variability, K-means clustering is performed (described in Sect. 2.4), identifying four distinct clusters.
3.3.1 Geographic location and structure evolution
Among the four clusters, C1 is the largest, comprising 177 events and accounting for about 35 % of the 506 ET events. C2 contains 103 events, while C3 is the smallest cluster (accounting for only around 11 %). C4 has a sample size comparable to that of C1 (Table 1). The ET locations vary across the four clusters. As shown in Fig. 9, C2 and C3 feature a more poleward location compared with those in C1 and C4. Geographically, ET events in C2 and C3 preferentially occur in the southwestern Indian Ocean, whereas they are less common in the Australian region (between 100 and 160° E).
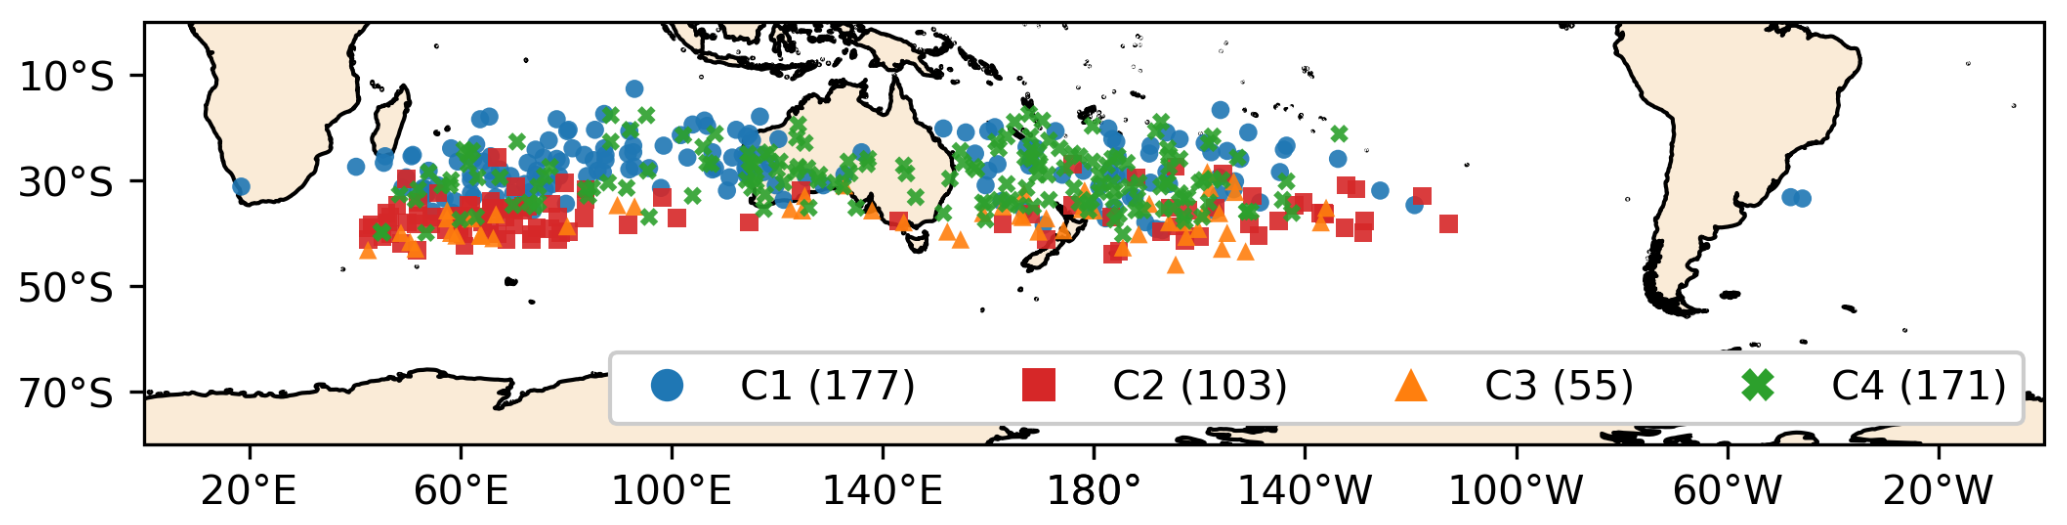
Figure 9Geographic locations of TCs at ET time for clusters 1, 2, 3, and 4. Numbers in parentheses denote the number of ET events in each cluster.
The evolution of cyclone structural characteristics is examined based on a 144 h window centred on ET time for the four clusters, using the metrics computed as in Sect. 3.2.1. On average, cyclones in C2 and C3 undergo transition over a broader latitudinal range (25–55° S), whereas those in C1 and C4 transition within a narrower and more equatorward latitudinal band (Fig. 10a). From ET time onwards, C2 and C3 are characterised by a substantial poleward displacement, whereas the displacement is less pronounced in C1 and C4. Figure 10i shows that cyclones in all clusters predominantly move southward at −72 h, change to southeastward at ET time, and then become nearly eastward at +72 h. Among the four clusters, C1 features the slowest translation speed, whereas the transitioning cyclones in C2 and C3 move faster, particularly at ET time and +24 h. C4 shares a similar pattern with C1, with a slightly increased translation speed. In C2, the southeastward direction becomes eastward from ET time onwards, whereas the cyclones in C3 remain moving toward south and southeast until +48 h. Cyclone intensity, measured as surface wind speed and central pressure, varies across the four clusters. Cyclones in C3 are notably stronger than those in the other clusters, particularly in their central pressure (Fig. 10b and c). In contrast, C1 features the weakest intensity. C2 and C3 feature a more pronounced deepening in central pressure after ET, compared with C1 and C4. As shown in Fig. 10g, all clusters feature rapidly enhanced vertical wind shear, particularly between −24 h and ET. In C1 and C4, wind shear remains high post ET, whereas the values drop substantially for C2 and C3. For all clusters, TC lies over warm SSTs (around 26–27 °C) at −72 h and −48 h, while the surrounding SSTs drop rapidly 24 h before ET (Fig. 10h). Moreover, the transitioning cyclones in C1 and C4 lie above a warmer ocean compared with those in C2 and C3.
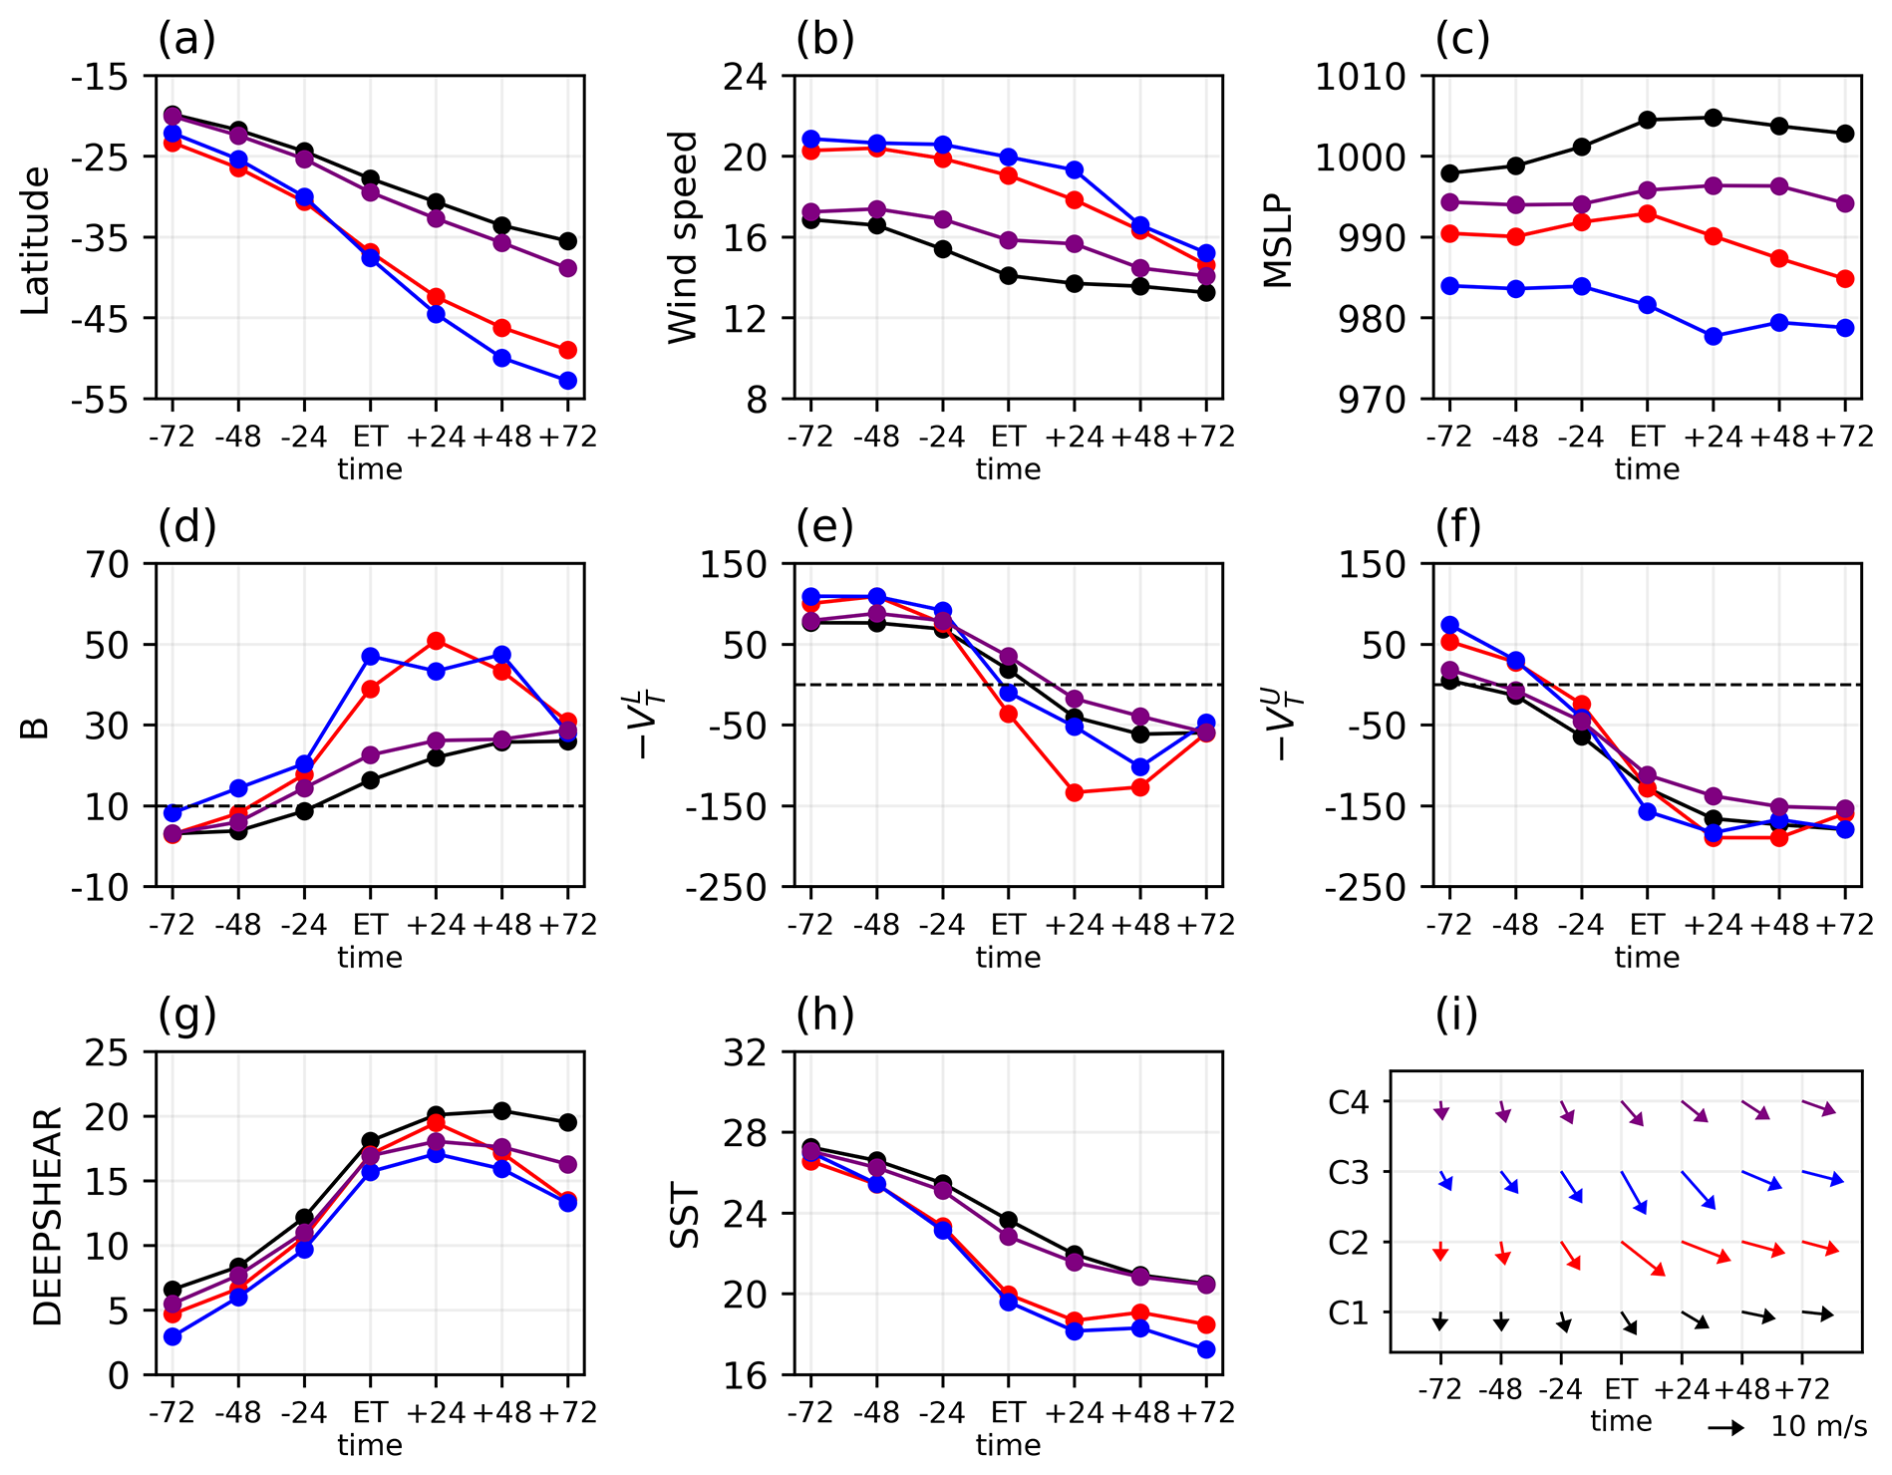
Figure 10Evolution of (a) latitude, (b) wind speed (in m s−1), (c) central pressure (MSLP, in hPa), (d) B, (e) , (f) , (g) vertical wind shear (DEEPSHEAR, in m s−1), (h) SST (in °C), and (i) cyclone speed (in m s−1) and direction from 72 h before to 72 h after ET for individual clusters. Dashed horizontal lines in (d–f) mark the thresholds for ET in the CPS framework. Clusters 1, 2, 3, and 4 are marked by various colors (black, red, blue, and purple). The bottom (right) aligns with south (east) in (g).
For the four clusters, the evolution of the structural characteristics during ET is examined by the three CPS parameters. At ET time, cyclones in all clusters are asymmetric (Fig. 10d) and characterised by an upper-level cold core (Fig. 10f), although only those in C2 and C3 have transitioned into a cold core in the lower troposphere (Fig. 10e). Changes in the CPS parameters are more dramatic in C2 and C3 than in C1 and C4. The mean value of B increases rapidly between −24 h and ET, and it decreases sharply between +48 h and +72 h (Fig. 10e). In the same period, and decrease to negative values rapidly, followed by slight increases (Fig. 10e and f). The post-transition cyclones in C2 are characterised by a high degree of asymmetry and coherent cold-core structures throughout the lower and upper levels, whereas those in C3 feature a slightly weaker cold core in the lower troposphere. This suggests that cyclones in C2 move into a stronger baroclinic environment than those in C3 (Fig. S2 in the Supplement). Compared with C2 and C3, the changes in CPS parameters in C1 and C4 are less pronounced, indicating a relatively weak transition.
3.3.2 Synoptic characteristics
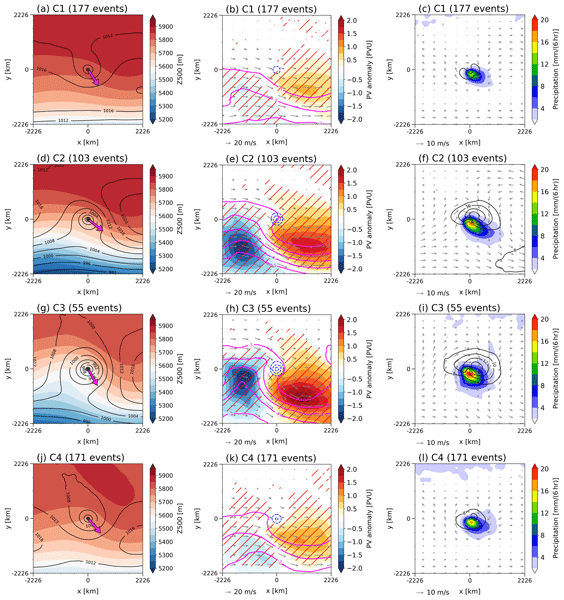
Case-to-case variability of the synoptic patterns associated with individual ET clusters is present in this section. Figure 11 shows the cyclone-centred composite-mean fields for individual clusters. The significance test is performed for 200–300 hPa averaged PV anomalies in individual ET clusters (Fig. 11b, e, h, and k) using a Monte Carlo method, following Quinting and Jones (2016). For each cluster, 1000 random composites of PV anomaly are created. Each composite has the same number of events as in that cluster. Each event consists of a randomly selected year from the period 1979–2021 and a randomly selected day and month from a 14 d window around each ET time. We choose the upper and lower 2 % percentiles of the Monte Carlo composites, and values are significant if they are greater than or less than these percentiles. Figure 12 shows composite vertical cross sections along the northwest-southeast and southwest-northeast directions for each cluster.
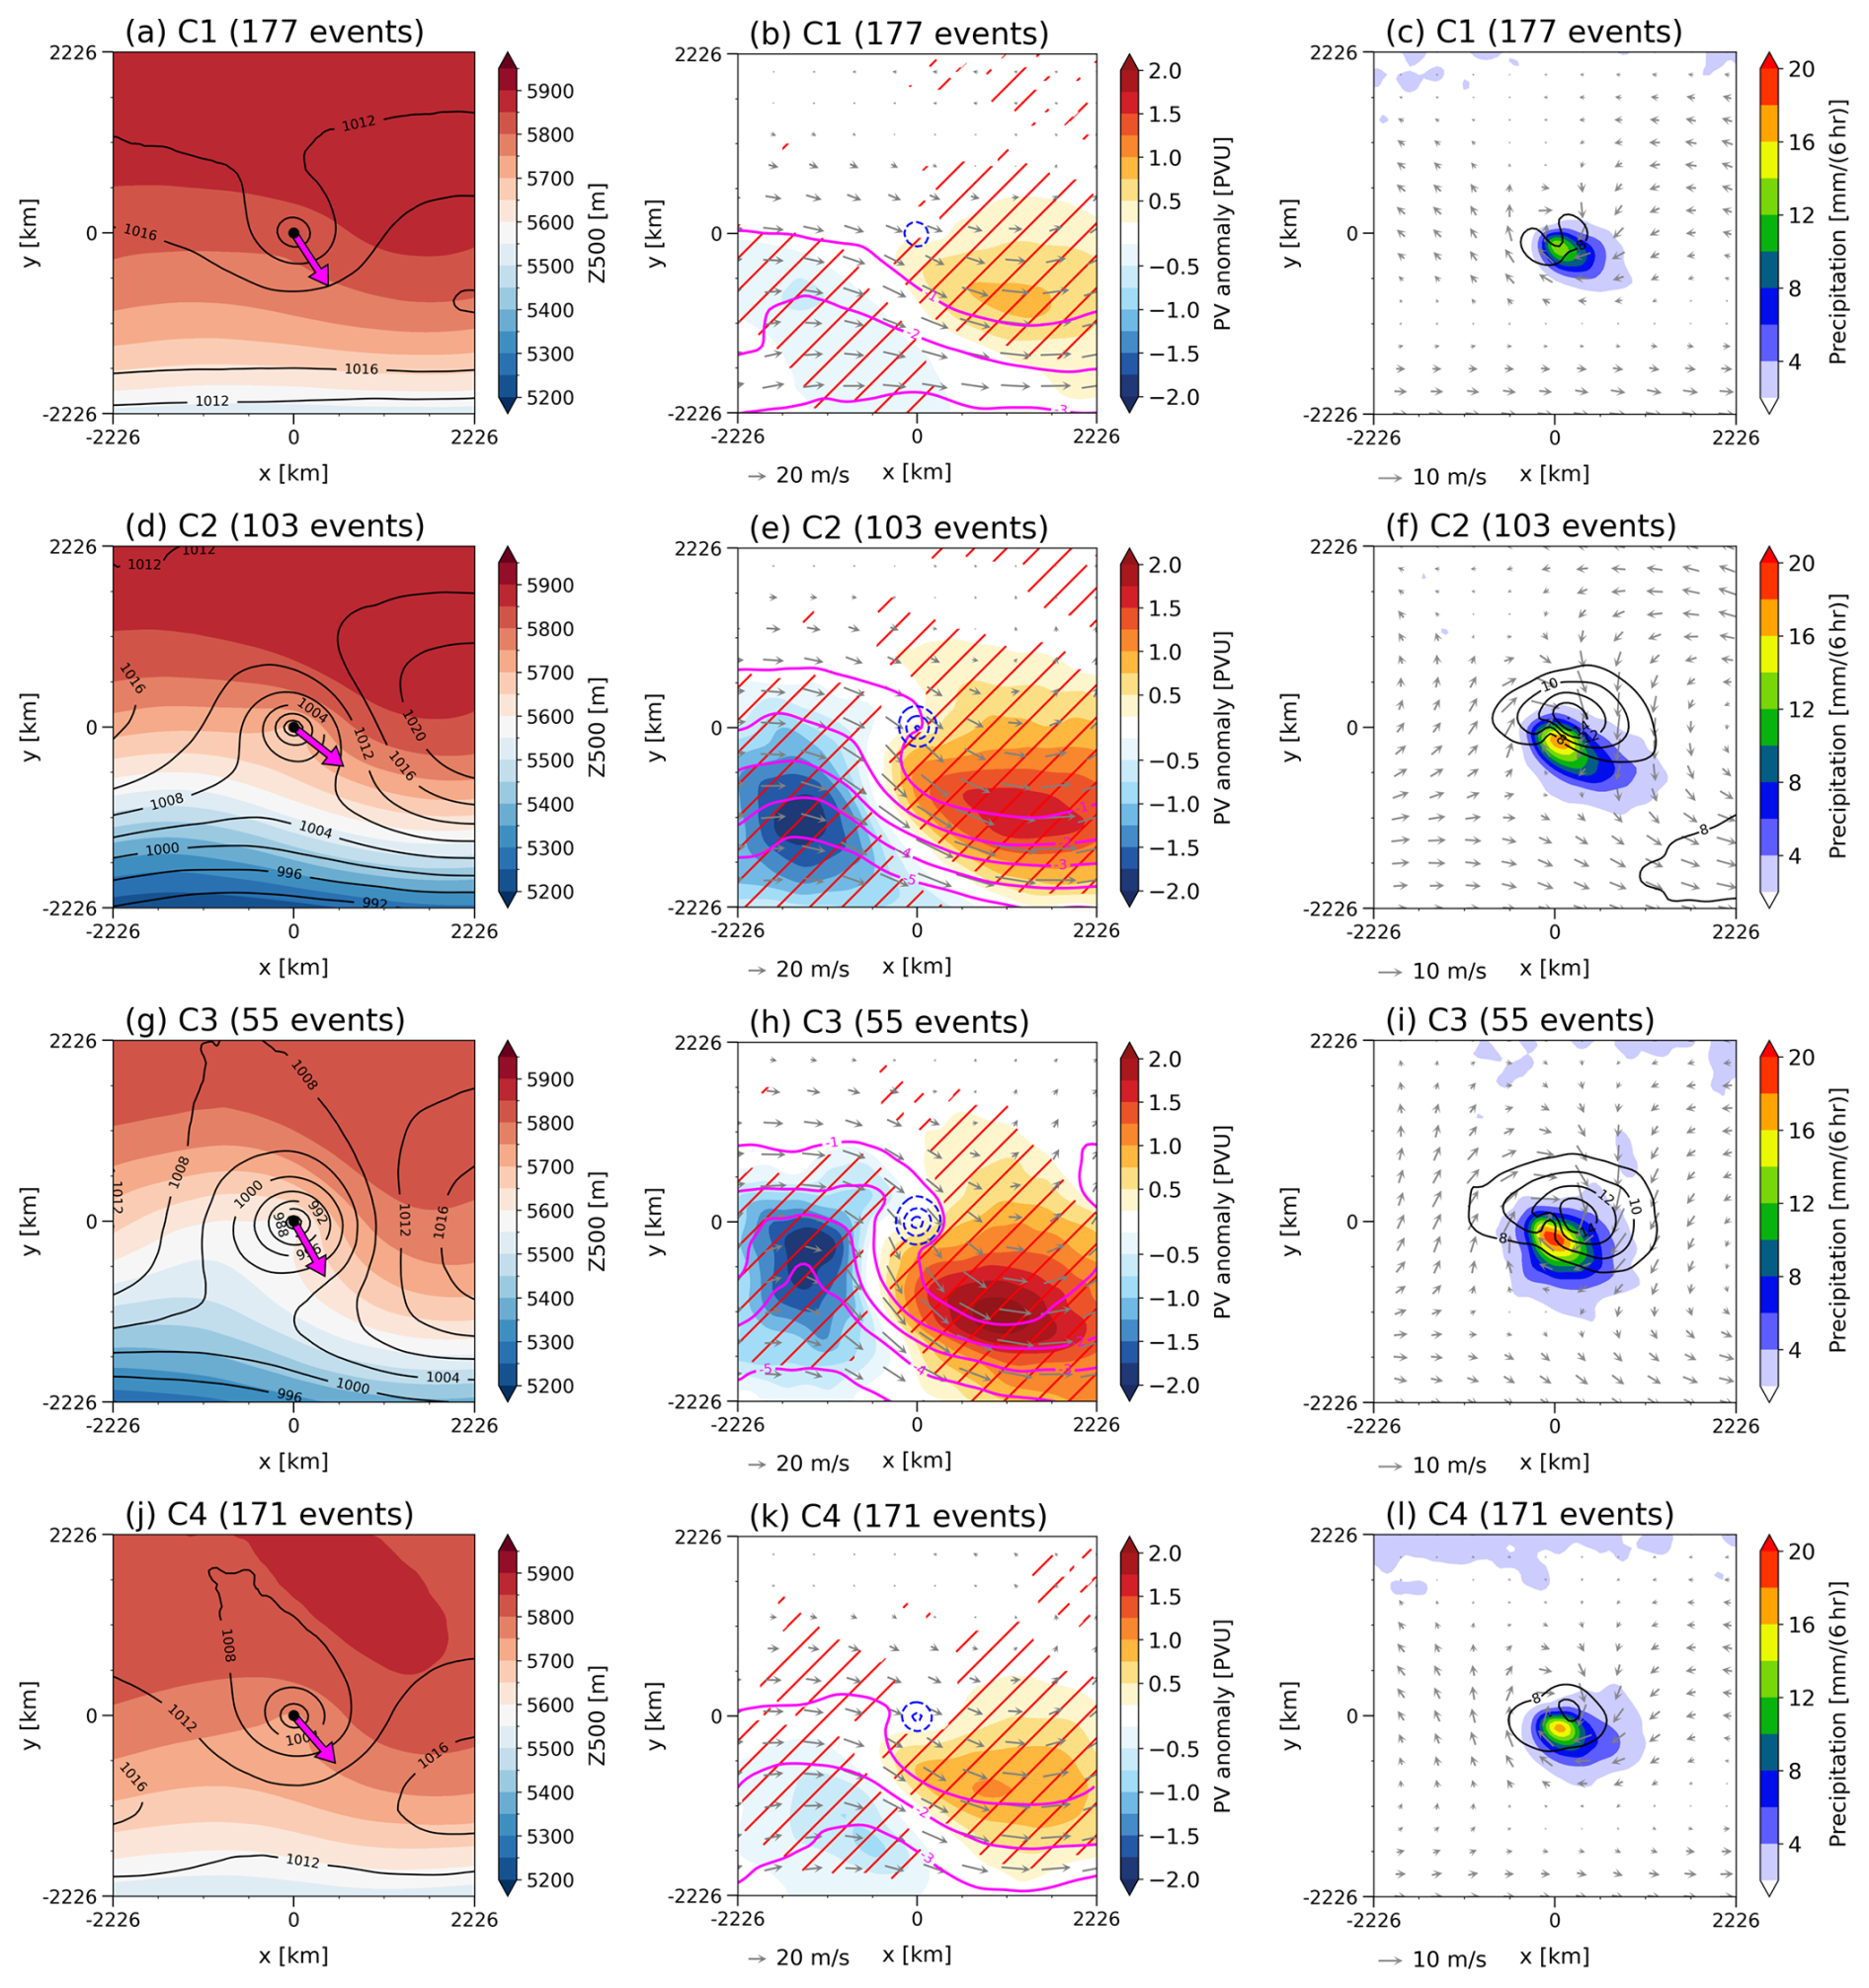
Figure 11Composite fields at ET time for Clusters (a–c) 1, (d–f) 2, (g–i) 3, and (j–l) 4. (a, d, g, j) show MSLP (black contours every 4 hPa) and Z500 (shaded as per the colourbar). (b, e, h, k) show 200–300 hPa averaged PV anomaly (shaded as per the colourbar), PV (magenta contours every 1 PVU), and wind (arrows), and 700–900 hPa averaged negative PV anomaly (dashed blue contours every 0.5 PVU). (c, f, i, l) show 6 hourly accumulated precipitation (shaded as per the colourbar) and 10 m wind speed (black contours every 2 m s−1) and vector (arrows). Magenta arrows indicate the direction of the cyclone in (a, d, g, j). PV anomalies are calculated relative to the 30 d running mean. Statistically significant upper-level PV anomalies (upper 98th percentile and lower 2nd percentile) are hatched. Coordinates are in km relative to the cyclone centre. The bottom (right) of the composites aligns with south (east).
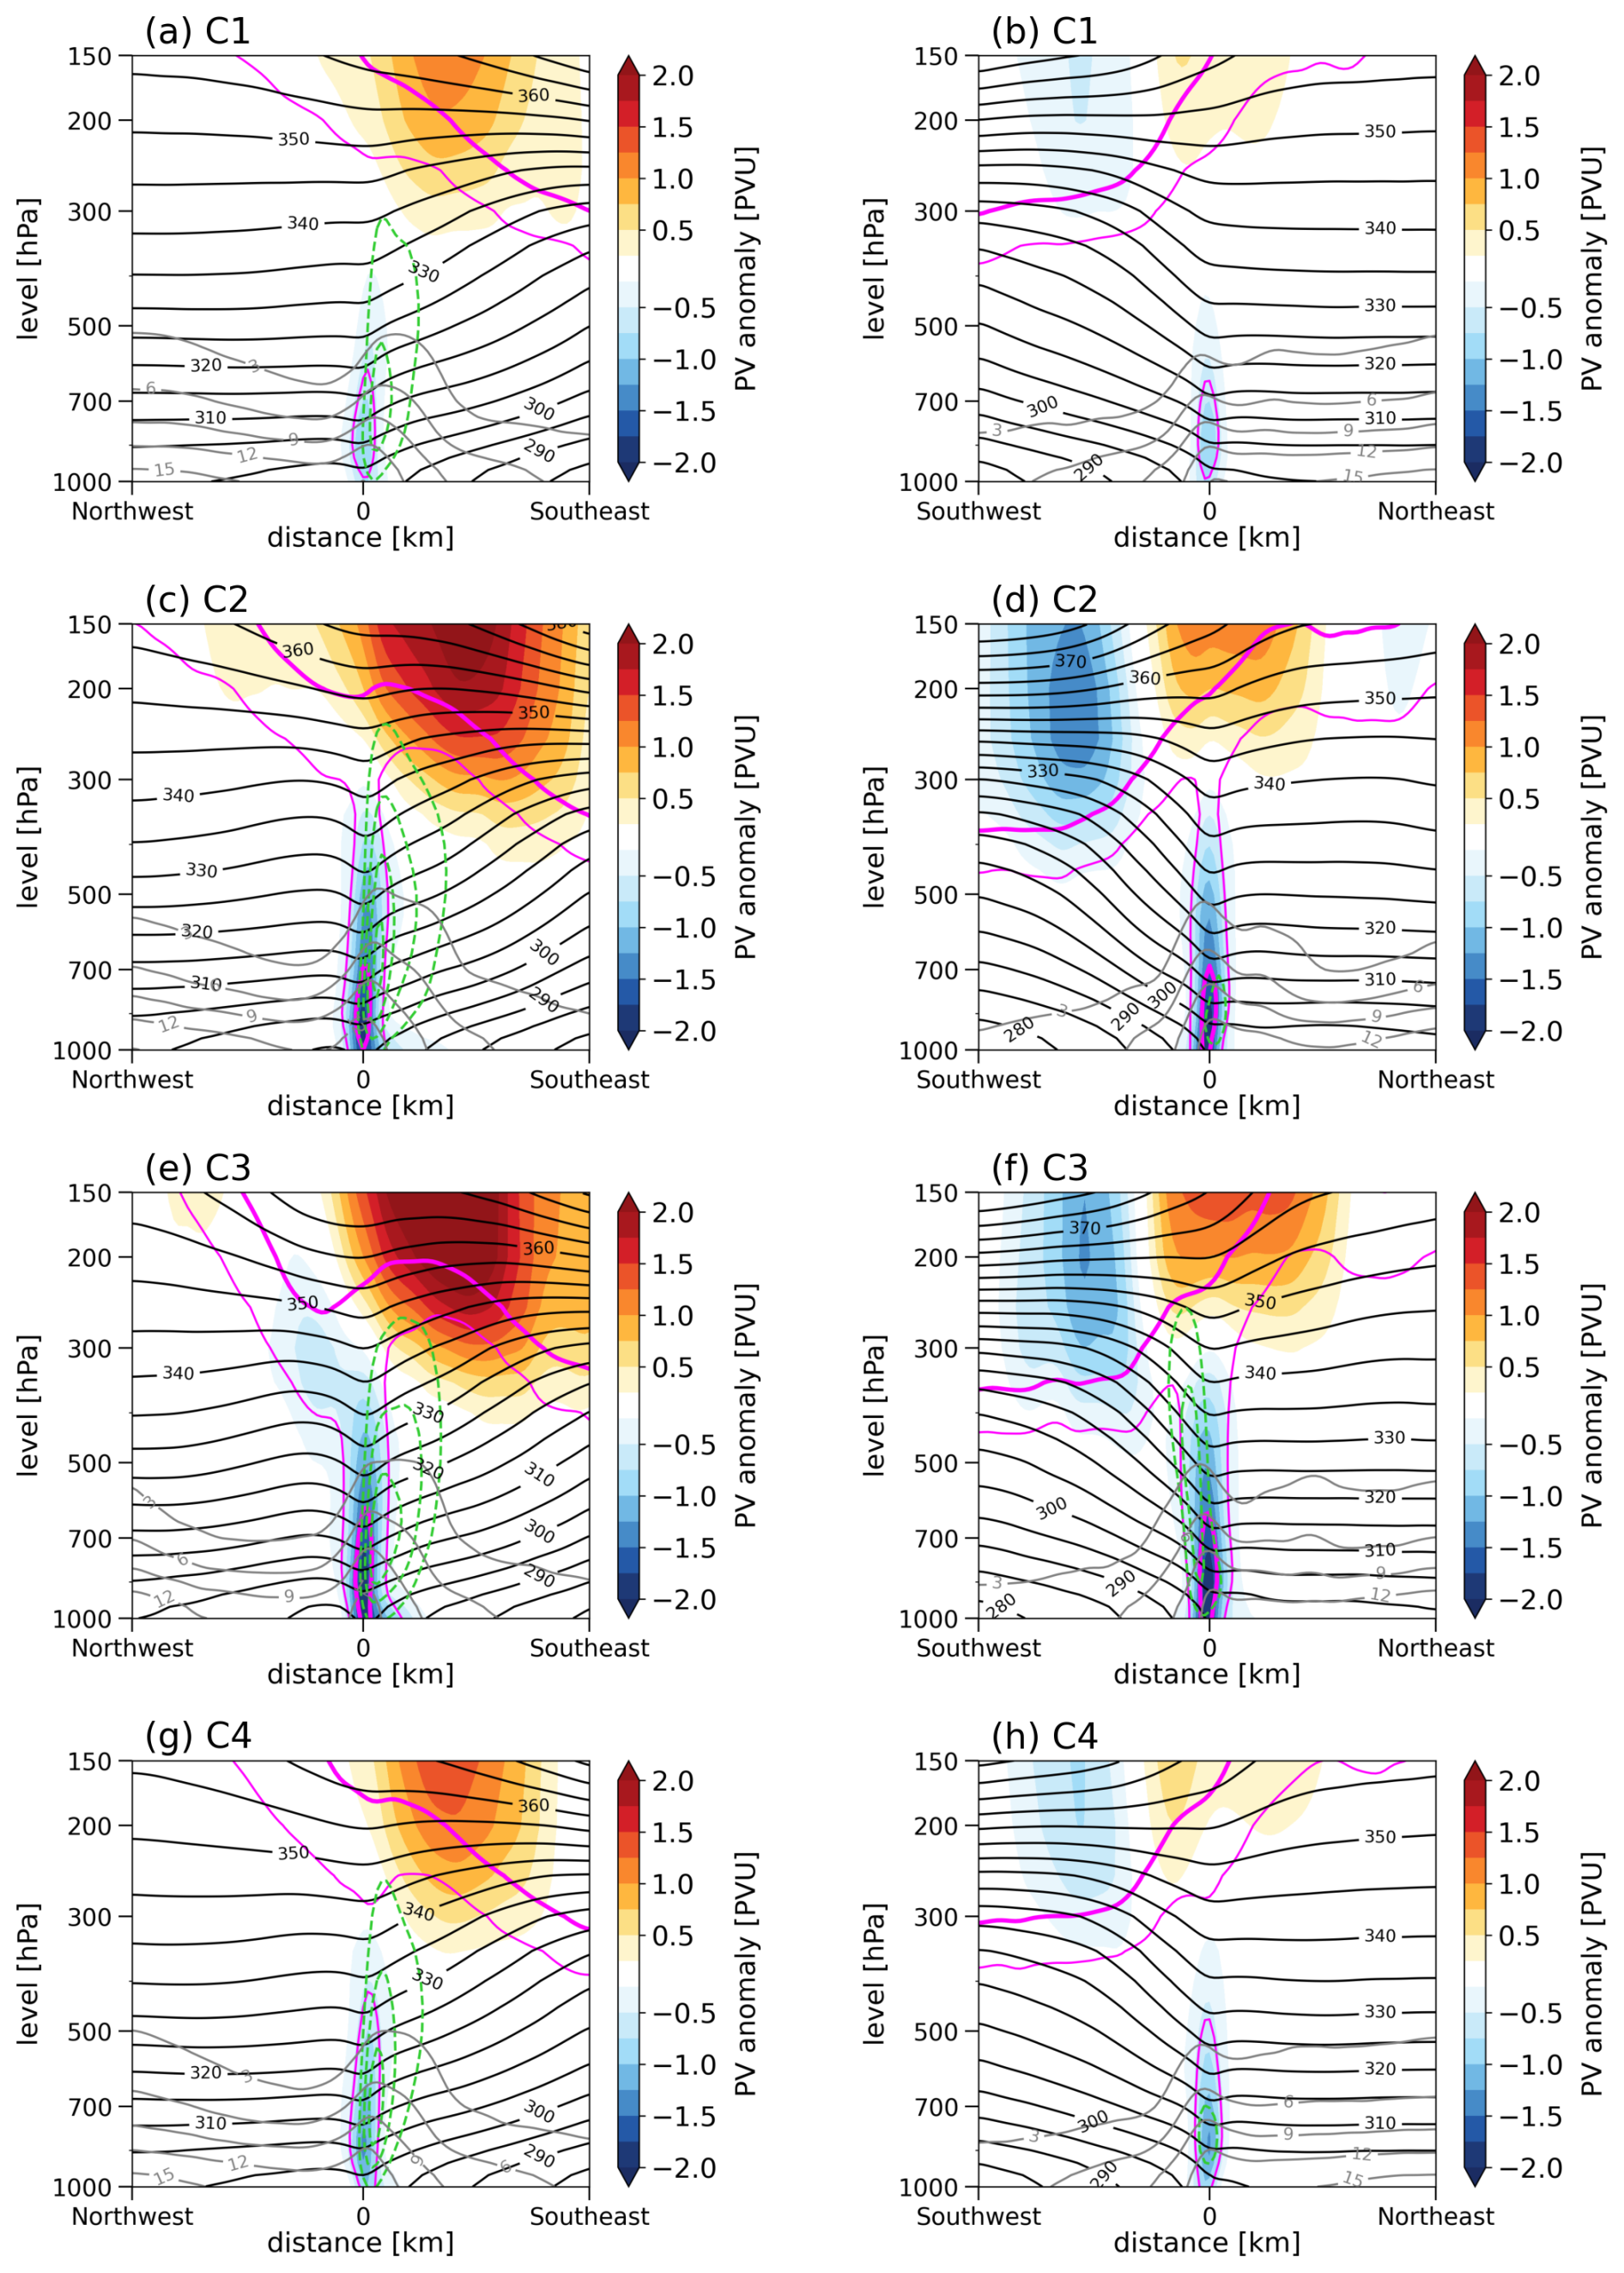
Figure 12Composite northwest-southeast (left column) and southwest-northeast (right column) cross sections at ET time for Clusters (a, b) 1, (c, d) 2, (e, f) 3, and (g, h) 4. PV anomaly is shaded as per the colourbar, and PV is marked by magenta contours at −2 and −1 PVU. Potential temperature is represented by black contours (every 5 K), vertical velocity is dashed green contours (every , only negative values displayed), and specific humidity is marked by grey contours (every 3 g kg−1). PV anomalies are calculated relative to the 30 d running mean. A thick magenta line highlights the −2 PVU contour. Coordinates are in km relative to the cyclone centre.
In C1, the southward-moving TC is flanked by a weak upstream trough and a downstream ridge at 500 hPa (Fig. 11a). As shown in Fig. 11b, the upper-tropospheric PV shows little amplification. The PV anomaly is weak, with magnitudes of both cyclonic and anticyclonic PV anomalies below 0.75 PVU (). Figure 11c shows that the precipitation distribution remains relatively symmetric, with high precipitation occurring within a radius of 500 km around the cyclone centre. The 10 m wind field is characterised by an easterly flow on the poleward flank of the cyclone and a belt of weak winds farther poleward. Furthermore, C1 features the weakest TC of the four clusters, with consistently weak central MSLP, middle-level cyclonic PV anomalies, and surface winds (Fig. 11a–c). Vertical cross sections show that the TC-related cyclonic PV tower is weak and shallow, and a weak warm core is constrained under around 700 hPa (Fig. 12a and b). An anticyclonic PV anomaly lies to the southeast of the cyclone centre, reaching its maximum at 150 hPa and extending downward to around 300 hPa (Fig. 12a). Upward motion and moisture content are particularly pronounced in the southeastern sector, colocated with the area of high precipitation (Fig. 11c). To the southwest of the cyclone, there is a weak cyclonic PV anomaly vertically constrained between 150 and 300 hPa (Fig. 12b).
C2 is characterised by a strong TC moving nearly eastward, flanked by a pronounced upstream trough and downstream ridge at 500 hPa (Fig. 11d). At the surface, the transitioning cyclone merges with a highly amplified trough, sandwiched between two highs. As shown in Fig. 11e, low-PV air intrudes equatorward and wraps cyclonically to the west of the cyclone, and a cyclonic PV anomaly of less than −2 PVU lies in its southwestern sector. A middle-level cyclonic PV anomaly aligns vertically with the surface cyclone centre, which is approached by a southeast-northwest tilted PV trough from the west. In the southeastern sector, PV contours bend poleward, with a strong anticyclonic PV anomaly on the equatorward side of the strongest PV gradient at the upper levels. This indicates a strong upper-level ridge developing in this sector. In contrast to the relatively symmetric precipitation field in C1 (Fig. 11c), the precipitation becomes highly asymmetric, with an elongated precipitation band over the south and southeast of the cyclone (Fig. 11f). The maximum precipitation rate reaches over 20 mm/(6 h) to the south of the centre, decreasing southeastward. A similar asymmetry is also evident in the surface wind field. High surface winds occur on the equatorward side of the cyclone centre, to the left side of the propagating direction. This cluster produces the second strongest TC among the four clusters. Vertical structures feature a strong and deep cyclonic PV tower and warm core (extending from the surface up to about 300 hPa), a strong upper-level anticyclonic PV anomaly to the southeast, and a cyclonic PV anomaly to the southwest (Fig. 12c and d). Ascent is particularly strong in the southeastern sector, expanding horizontally to about 900 km from the centre and vertically to 200 hPa (Fig. 12c). The southeastward expansion of upward motion explains the asymmetric precipitation field (Fig. 11f). In the southwest sector, the −2-PVU contour intrudes substantially and reaches around 400 hPa, resulting in a strong cyclonic PV anomaly (Fig. 12d).
C3 can be regarded as a strongly amplified counterpart of C2. In C3, however, the transitioning cyclone is stronger and propagates more southward (Fig. 11g). At 500 hPa, there is a stronger upstream trough and a deeper downstream ridge at 500 hPa (Fig. 11g). The upper-level flow of C3 is more amplified than that of C2, with low-PV air cyclonically wrapping and approaching from the west, while high-PV air is deflected substantially poleward to the southeast (Fig. 11h). C3 features the strongest middle-level cyclonic PV anomaly, captured by the upstream PV trough. The strongest upper cyclonic (anticyclonic) PV anomaly lies more equatorward (poleward) compared with C2, reflecting a more cyclonic overturning. The precipitation and surface wind fields of C3 are broader, with the highest precipitation rate to the south and the strongest winds to the northeast of the centre (Fig. 11i). The vertical structure of C3 is largely similar to that of C2 (Fig. 12e and f). However, in C3, there is a weak cyclonic PV anomaly between around 200 and 400 hPa to the northwest of the cyclone (Fig. 12e), associated with the cyclonically wrapping PV trough in this sector (Fig. 11h). The downstream anticyclonic PV anomaly is enhanced in the southeast sector, and the ascent is particularly strong in the southwest sector (Fig. 12e and f). Furthermore, C3 features a higher moisture content in the northeast sector compared with C2 (Fig. 12d and f).
The flow patterns of C4 are largely similar to those of C1. A southeastward-propagating TC is flanked by two surface highs, with a more pronounced trough-ridge couplet at 500 hPa (Fig. 11j). There is a northwest-southeast tilting PV trough and a weak middle-tropospheric cyclonic PV anomaly on its leading edge (Fig. 11k). A weak cyclonic PV anomaly of around - 0.75 PVU lies to the southwest of the cyclone, and an anticyclonic PV anomaly of around 1 PVU occurs to the east. As shown in Fig. 11l, the precipitation and surface wind fields of C4 are stronger and broader than those of C1. The maximum wind is found to the northeast of the cyclone centre within a 500 km radius. Vertical cross sections show that the cyclonic PV tower of C4 is weaker and shallower than that of C2 and C3, whereas it is stronger and deeper than that of C1 (Fig. 12g and h). In the southeastern sector, the upper-tropospheric anticyclonic PV anomaly is more horizontally constrained compared with other clusters (Fig. 12g).
3.3.3 TC-jet interaction
To examine the influence of the transitioning TC on the midlatitude flow in the upper troposphere, the divergent wind (Vχ) is calculated by Helmholtz decomposition. We analyse the latent heat release in the lower and middle troposphere by considering the convergence of integrated water vapour transport (integrated from 1000–500 hPa) on the condition of relative humidity greater than 80 % as a proxy, as in Teubler and Riemer (2021).
Figure 13 shows the composite of PV, total wind speed, divergent wind, and latent heat release proxy for the four clusters. The PV, total wind speed, and divergent wind are vertically averaged between 200 and 300 hPa. C1 is characterised by the weakest divergent flow, PV gradient, and latent heat release among the four clusters, in the absence of an upper-level jet downstream (Fig. 13a). The latent heat release is constrained within a radius of 500 km from the cyclone centre, consistent with the precipitation pattern (Fig. 11c). The reduced divergent flow is explained by a relatively low precipitation (Fig. 11c) and weak ascent (Fig. 12a). In C2, by contrast, the divergent flow is strong, and its west-southwestward component is nearly perpendicular to the PV trough approaching from the west (Fig. 13b). The divergent flow acts to deflect PV contours southwestward, thereby increasing the PV gradient. A jet streak forms to the southeast of the cyclone centre and to the poleward side of the region of strong latent heat release. The divergent flow is distributed around the region of strong latent heat release, although the divergent flow is much weaker on its southern side. Compared with C2, C3 features a weaker downstream jet, a lower maximum latent heat release, but a stronger and broader divergent wind (Fig. 13c). The upper-level jet is anticyclonically curved following PV contours to the southeast of the cyclone centre. C4 and C1 share a similar pattern. Although the latent heat release in C4 is comparable to that in C1, the divergent flow is much stronger in C4 (Fig. 13d). In both C1 and C4, the downstream jet is absent, which may be explained by relatively low latitudes at which ET completes in those two clusters (Figs. 9 and 10a).
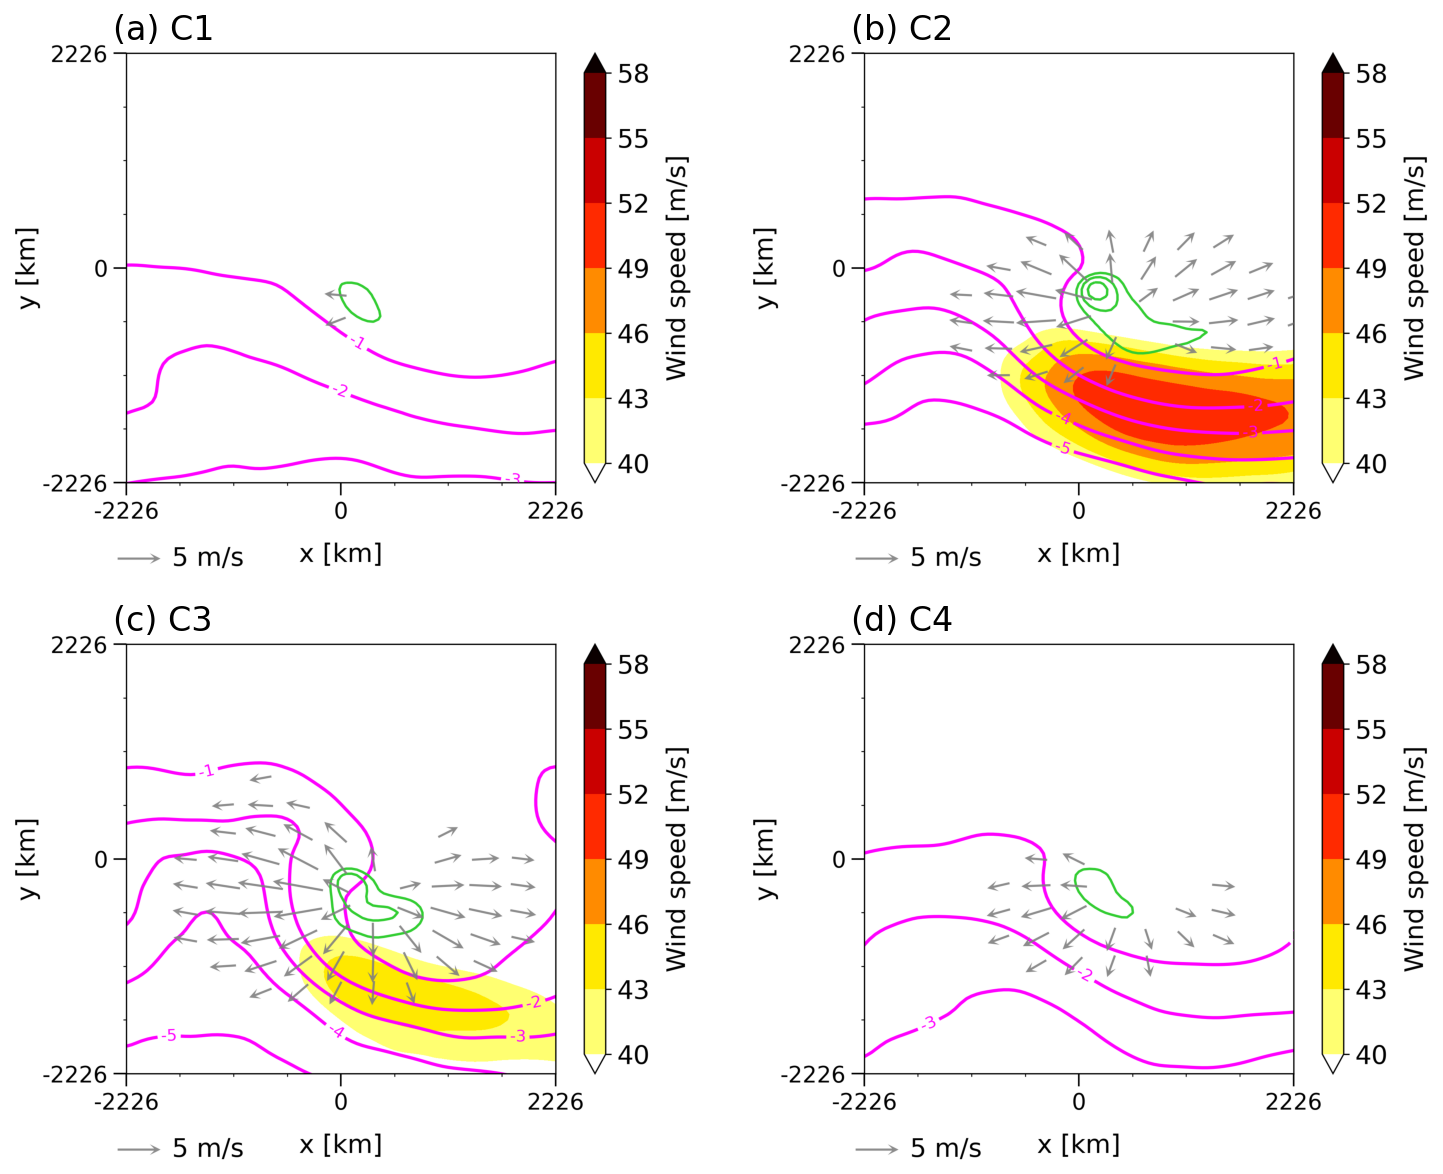
Figure 13Composite fields at ET time for Clusters (a) 1, (b) 2, (c) 3, and (d) 4, showing PV (magenta contours every 1 PVU), wind speed (shaded as per the colourbar), divergent wind (arrows, only for ), and convergence of integrated water vapour transport on the condition of relative humidity greater than 80 % (as proxy for latent heat release, green contours every ). The PV, wind speed, and divergent wind are vertically averaged between 200 and 300 hPa. The water vapour transport is integrated from 1000–500 hPa. Coordinates are in km relative to the cyclone centre. The bottom (right) of the composites aligns with south (east).
4.1 Mean characteristics and mechanisms of ET
Objective TC tracking and ET detection have the pronounced advantage of having a unified definition across basins and tracking cyclones throughout their full life cycle, which is not commonly offered by the best-track dataset. Our results show that ET events preferentially occur in the southwest Indian Ocean, along the northwest coast of Australia, and in the southwest Pacific (Fig. 2). This finding is consistent with previous ET climatologies for the same region (e.g., Foley and Hanstrum, 1994; Sinclair, 2002; Bieli et al., 2019), despite differences in ET definition.
The ET definition using RH100MAX-DEEPSHEAR does not perfectly align with that based on the CPS framework (Fig. 5). The two approaches evaluate different aspects of ET: the RH100MAX–DEEPSHEAR method emphasises changes in the background environment (moisture availability and large-scale baroclinicity), whereas the CPS framework focuses on cyclone structural changes at a smaller scale. A TC may already have become asymmetric and cold-cored at relatively low latitudes during the transition, while the environmental vertical wind shear remains weak or deep convection is still active. In such cases, the transition may be identified by the CPS framework but not by the RH100MAX–DEEPSHEAR method. Moreover, the objectively detected TC tracks in ERA5 are often longer than those in IBTrACS, which has been used to identify ET events in previous studies (e.g., Kitabatake, 2011; Wood and Ritchie, 2014; Bieli et al., 2019). During the early stage of some ERA5 tracks, systems may still have an asymmetric structure and may not be warm-cored in the lower troposphere, presumably resulting in false identification of ET by the CPS framework. This likely explains more ET events detected based on the CPS framework compared with the RH100MAX–DEEPSHEAR method.
We have shown a pronounced seasonal cycle in ET frequency and geographic location (Fig. 3), which is also found in other ocean basins (e.g., Hart and Evans, 2001; Kitabatake, 2011; Wood and Ritchie, 2014; Bieli et al., 2019). The spatial juxtaposition of warm SSTs and baroclinic zone creates favourable conditions for ET in autumn (Fig. 4c), however, the importance of SST remains debated. It might be expected that a TC over warm SSTs would need stronger vertical shear to transition, but Kitabatake (2011) shows that ET events in the western North Pacific are characterised by enhanced vertical shear and large air–sea thermal contrast, rather than other absolute SSTs. Moreover, other factors are equally important for TC genesis and maintaining TCs, e.g., the lower-level cyclonic vorticity and monsoon trough, which are important for TC genesis in the Australian region (Dare and Davidson, 2004).
In agreement with previous studies (e.g., Foley and Hanstrum, 1994; Sinclair, 2002; Jones et al., 2003), we also find that TCs move slowly southward before transition, and rapidly accelerate and recurve southeastward at ET, then decelerate and propagate eastward post ET, as a result of coupling with the downstream upper-level jet (Figs. 6i and 7a–c). The changes in cyclone structure, on average, follow the conventional transition pathway described in Evans and Hart (2003), becoming asymmetric before progressively developing a cold-core structure from the upper to the lower troposphere (Fig. 6d–f). Nonetheless, an alternative pathway exists, in which thermal structure changes precede changes in symmetry (e.g., Kitabatake, 2011; Wood and Ritchie, 2014). The structural evolution during ET shows large case-to-case variability, with some transitioning more rapidly than others (Fig. 10d–f). In particular, we find that some post-transition cyclones can maintain a lower-level warm core at ET time (Figs. 6e and 10e). This may reflect warm-seclusion cases, in which the lower-troposphere vortex either remains a warm-core structure or becomes weakly cold cored and then reintensifies as a shallow warm core after ET (e.g., Hart, 2003; Evans and Hart, 2003; Kofron et al., 2010a).
As found in previous studies (e.g, Jones et al., 2003; Atallah et al., 2007; Chen, 2011; Evans et al., 2017), a robust feature of ET is highly-asymmetric precipitation and wind fields post transition (Fig. 8a–f). However, caution should be taken when interpreting TC-related precipitation in ERA5, as intense TC-related precipitation can be underestimated and spatially smoothed (Ascenso et al., 2024). Our results show that strong winds are predominantly located on the equatorward side of the cyclone track during and after ET (Fig. 8d–f), however, the strong winds may also occur on the poleward side in some cases (Evans et al., 2017). Furthermore, the wind field expansion (Fig. 8g) may be associated with the upstream upper-level trough (Fig. 6a–f), which imports absolute angular momentum into the cyclone circulation and hence accelerates the outer wind field (Evans and Hart, 2008). Nonetheless, it should be noted that ERA5 is less reliable in representing TC-induced winds (e.g., peak intensity, radius of maximum wind, and inner-core wind structure), leading to underestimated TC strength and delayed timing of maximum intensity compared with IBTrACS (e.g, Dulac et al., 2024). Therefore, the observed wind field expansion may be associated not only with the cyclone’s structural change during ET, but also with better-resolved winds as the cyclone becomes broader.
The transitioning TC is prone to reintensify ahead of the upper-level trough (e.g, Evans et al., 2017; Keller et al., 2019). We show a weak deepening after transition (Fig. 5c), linked to middle-level cyclonic vorticity advection and lower-level warm, moist air advection (Fig. 6d–f and j–l). Both factors promote ascent and thereby decrease the surface pressure. Cyclonic vorticity advection, associated with the upstream trough, provides dynamical forcing for ascent, whereas the warm advection enhances the lower-level thermal contrast and further supports the ascent. Quinting and Jones (2016) have shown that the ascent for recurving TCs is contributed by both the upstream upper-level trough and the lower-level warm advection arising from the interaction of the TC circulation with the baroclinic zone, based on a quasigeostrophic omega diagnostic. Moreover, the strengthened lower-level thermal gradient can favour warm frontogenesis (e.g., Harr and Elsberry, 2000; Quinting et al., 2014).
During ET, the cyclone progressively acquires the flow characteristics of an extratropical cyclone, including a warm conveyor belt and a dry intrusion. This is indicated by the coincidence of warm, moist advection with strong ascent, and of cold, dry air advection with weak descent (Fig. 6g–l). Nonetheless, confirming these interpretations would require additional trajectory analysis to objectively identify the warm conveyor belt (Madonna et al., 2014) and dry intrusion (Raveh-Rubin, 2017), which are beyond the scope of the current study. Furthermore, the moist, warm ascending airstream below the upper-level anticyclonic PV anomaly indicates a close linkage between the diabatic process and upper-level ridge development (Fig. 7). An early study by Stoelinga (1996) has shown that latent heating enhances upper-level divergences and thereby amplifies the downstream ridge. Steinfeld and Pfhal (2019) also find that diabatic processes within the moist, warm ascending airstream contribute to the anticyclonic PV anomaly associated with blocking, by injecting anticyclonic PV air into the upper troposphere. The jet streak formation has been considered as a robust feature of ET (e.g., Foley and Hanstrum, 1994; Sinclair, 2002; Griffin and Bosart, 2014). Our results show that the upper-level jet streak exhibits an anticyclonic curvature and lies on the equatorward side of the maximum PV gradient (Fig. 6b), presumably arising from the TC-associated divergent flow enhancing the PV gradient along the jet.
4.2 Characteristics and mechanisms of individual ET clusters
With K-means clustering, four distinct ET clusters have been identified (characteristics briefly summarised in Table 1). In C1, TCs move nearly southward, embedded in surface easterlies on their poleward side and flanked by a weak trough-ridge couplet aloft (Fig. 11a–c). The surface flow patterns of C1 resemble the “cradle” pattern typical of TCs off the west coast of Australia, as identified in Foley and Hanstrum (1994). In this cluster, TCs are generally shallow and weak (Figs. 10b, c, 11a–c, and 12a, b). They are located at relatively lower latitude (Figs. 9 and 10a), and less influenced by midlatitude features farther south, which presumably leads to a relatively symmetric and compact precipitation pattern.
Foley and Hanstrum (1994)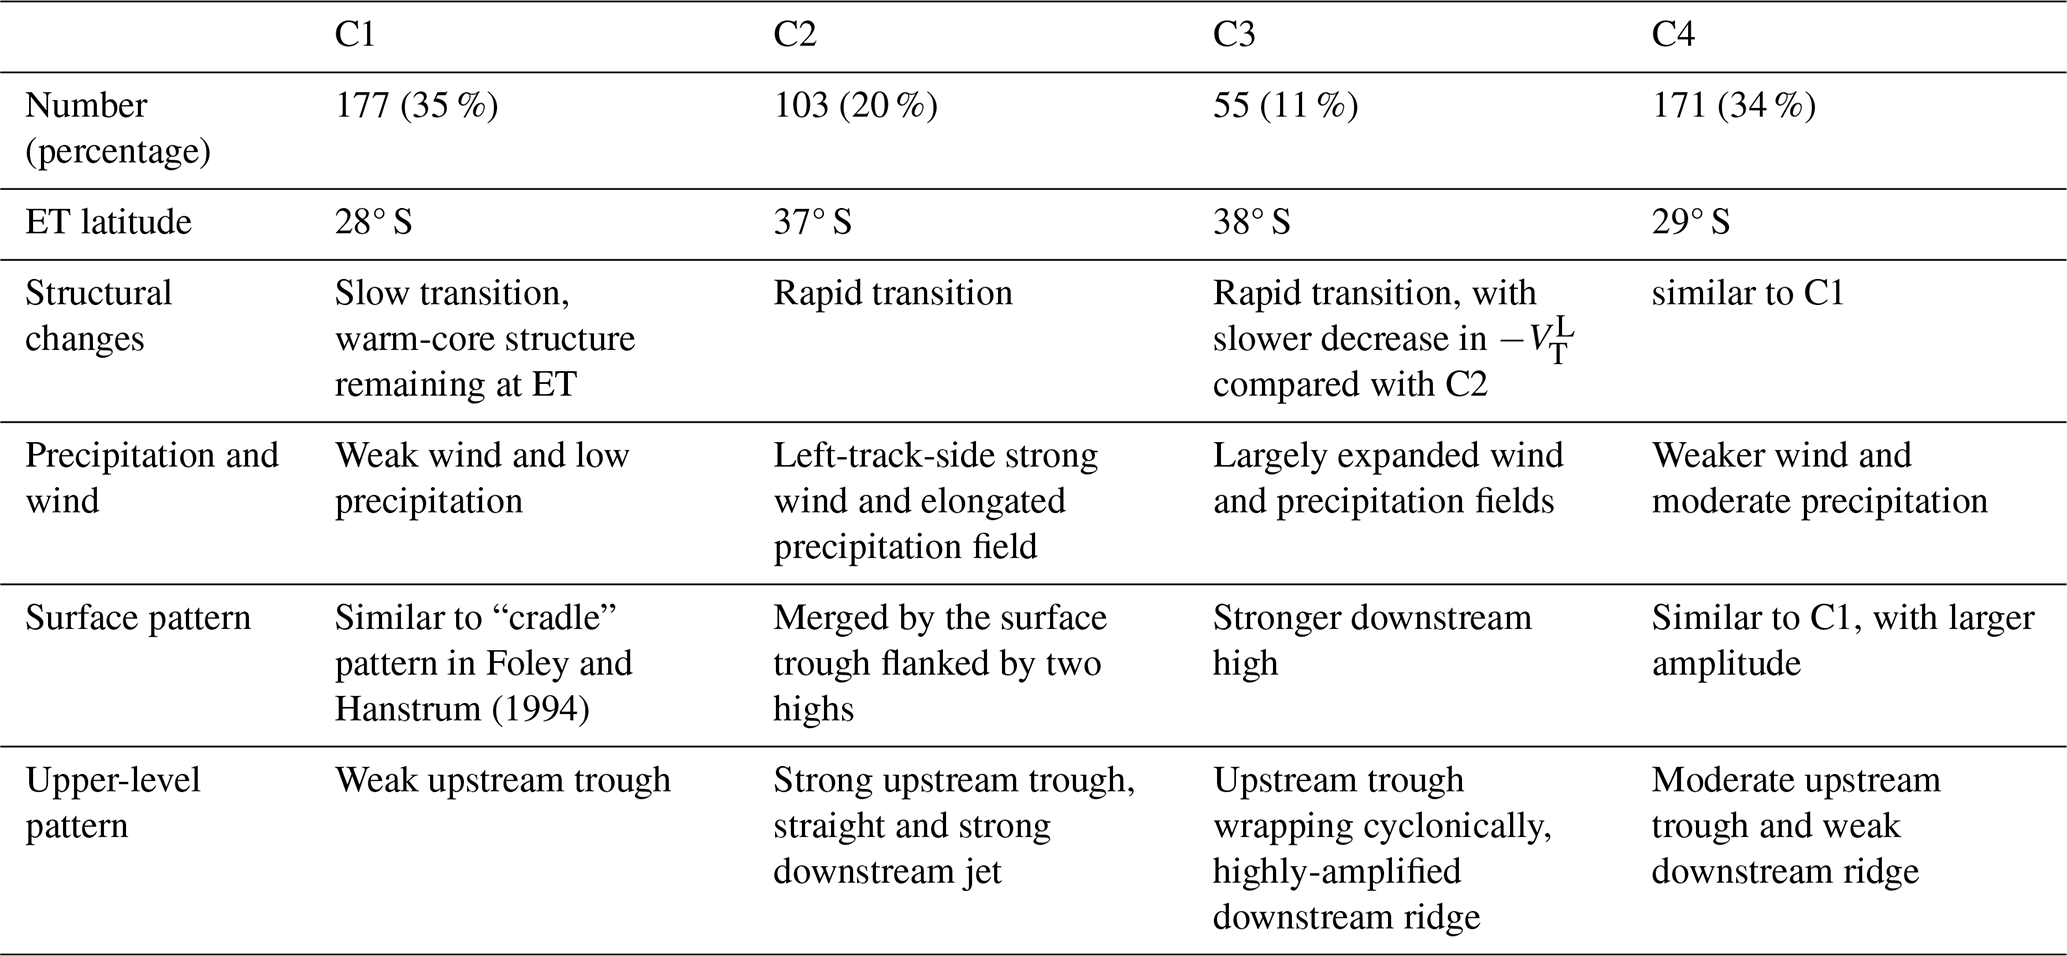
By contrast, C2 and C3 are characterised by the transitioning cyclones embedded in the highly amplified midlatitude flow, with an upper-level trough approaching from the west (Fig. 11e and h). Those features are typical of ET, similar to the “capture” pattern of TCs in the Australian region (Foley and Hanstrum, 1994), to an ET case study in the southwest Indian Ocean (Griffin and Bosart, 2014), and to the conceptual model of ET in the southwest Pacific (Sinclair, 2002). Both clusters exhibit a notable acceleration and change in propagation direction during ET, due to a better coupling with a midlatitude jet (Fig. 13b and c). In both clusters, downstream ridge development is pronounced, despite differences in the orientation of the anticyclonic PV anomaly, i.e., more zonally distributed in C2, whereas more meridionally elongated in C3. These differences likely reflect distinct regimes of interaction between the TC and the midlatitude flow. In C2, the cyclone impinges upon a strong and straight jet (Fig. 13b) and excites the Rossby wave packet downstream. In other words, the transitioning cyclone is the dominant feature during the interaction. In C3, however, the pre-existing amplified midlatitude wave intrudes equatorward and captures the transitioning cyclone, presumably dominating the interaction. Compared with C2 and C3, the upper-level trough is out of phase with the transitioning cyclone in C4 (Figs. 11k and 13d), hence limiting the chance of reintensification and downstream development in this cluster. These findings agree with previous studies in that the relative position between the upstream trough and the transitioning cyclone is crucial for determining the downstream impact of ET (e.g., Ritchie and Elsberry, 2001; Keller et al., 2019).
Although the downstream influence of ET is not explicitly investigated in the current study, C2 and C3 are most likely to promote weather changes downstream, as a result of a strong interaction between TC-related diabatic processes and the midlatitude waveguide. In these clusters, the divergent outflow acts to deflect PV contours poleward and thus increase the meridional PV gradient (Fig. 13b and c), leading to a strong positive PV advection by the divergent flow (expressed as ). The quantity has been previously used to quantify the strength of the interaction between TCs and the midlatitude flow (Archambault et al., 2013, 2015), and it can be considered as a local source to the barotropic Rossby wave (O'Brien and Reeder, 2017). By comparison, the interaction is weak in C1 and C4.
TCs that undergo ET are less studied in the Southern Hemisphere than in the Northern Hemisphere. The current study has conducted a comprehensive Southern Hemispheric-scale synoptic climatology of 506 ET events during the 1979–2021 period, applying a state-of-the-art objective cyclone tracking and classification framework (Han and Ullrich, 2025) on ERA5.
We found that objective TC tracking and ET detection can produce the climatology, seasonality, and synoptic dynamics of ET, comparable to those derived from different ET definitions. During ET, the transitioning cyclone becomes increasingly asymmetric and progressively loses its warm-core structure, accompanied by a jet streak formation and ridge development downstream. A clustering analysis shows that the case-to-case variability of ET-related synoptic configuration is mainly related to the strength of the TC, and the amplitude and relative position of the upstream trough and the downstream ridge in the upper troposphere. This variability motivates our next study to address the question of how the downstream flow and weather respond to the interaction between the transitioning TC and the midlatitude flow in different ET regimes. Such a follow-up study is underway and is working to disentangle different processes that govern the interaction, based on a PV framework (e.g., Jones et al., 2003; Riemer and Jones, 2010) and from an eddy kinetic energy perspective (Orlanski and Sheldon, 1995).
TempestExtremes is based on that of Ullrich and Zarzycki (2017) and Ullrich et al. (2021) and is available at https://github.com/ClimateGlobalChange/tempestextremes (last access: 3 March 2025). TThe SyCLoPS software, built upon TempestExtremes, is based on that of Han and Ullrich (2025) and can be accessed from https://github.com/yepkids/SyCLoPS (last access: 3 March 2025).
ERA5 reanalysis is hosted by the National Computational Infrastructure (NCI) at https://doi.org/10.25914/5f48874388857 (National Computational Infrastructure, 2020). IBTrACS is obtained from the National Oceanic and Atmospheric Administration/National Centers for Environmental Information (NOAA/NCEI) at https://www.ncei.noaa.gov/products/international-best-track-archive (last access: 3 March 2025).
The supplement related to this article is available online at https://doi.org/10.5194/wcd-7-1285-2026-supplement.
CJ led this study and was responsible for formal analysis, writing of the original draft and visualisation. All the authors contribute to conceptualisation, methodology, reviewing, editing, and writing.
The contact author has declared that none of the authors has any competing interests.
Publisher's note: Copernicus Publications remains neutral with regard to jurisdictional claims made in the text, published maps, institutional affiliations, or any other geographical representation in this paper. The authors bear the ultimate responsibility for providing appropriate place names. Views expressed in the text are those of the authors and do not necessarily reflect the views of the publisher.
This research was undertaken with the assistance of resources from the National Computational Infrastructure (NCI), an NCRIS enabled capability supported by the Australian Government.
This research has been supported by the Australian Research Council Centre of Excellence for the Weather of the 21st Century (grant no. CE230100012)
This paper was edited by Roberto Rondanelli and reviewed by Gan Zhang and one anonymous referee.
Archambault, H. M., Bosart, L. F., Keyser, D., and Cordeira, J. M.: A Climatological Analysis of the Extratropical Flow Response to Recurving Western North Pacific Tropical Cyclones, Mon. Weather Rev., 141, 2325–2346, https://doi.org/10.1175/MWR-D-12-00257.1, 2013. a
Archambault, H. M., Keyser, D., Bosart, L. F., Davis, C. A., and Cordeira, J. M.: A Composite Perspective of the Extratropical Flow Response to Recurving Western North Pacific Tropical Cyclones, Mon. Weather Rev., 143, 1122–1141, https://doi.org/10.1175/MWR-D-14-00270.1, 2015. a
Ascenso, G., Ficchì, A., Giuliani, M., Scoccimarro, E., and Castelletti, A.: Downscaling, bias correction, and spatial adjustment of extreme tropical cyclone rainfall in ERA5 using deep learning, Weather and Climate Extremes, 46, 100724, https://doi.org/10.1016/j.wace.2024.100724, 2024. a
Atallah, E., Bosart, L. F., and Aiyyer, A. R.: Precipitation Distribution Associated with Landfalling Tropical Cyclones over the Eastern United States, Mon. Weather Rev., 135, 2185–2206, https://doi.org/10.1175/MWR3382.1, 2007. a, b, c
Atallah, E. H. and Bosart, L. F.: The Extratropical Transition and Precipitation Distribution of Hurricane Floyd (1999), Mon. Weather Rev., 131, 1063–1081, https://doi.org/10.1175/1520-0493(2003)131<1063:TETAPD>2.0.CO;2, 2003. a
Bieli, M., Camargo, S. J., Sobel, A. H., Evans, J. L., and Hall, T.: A Global Climatology of Extratropical Transition. Part I: Characteristics across Basins, J. Climate, 32, 3557–3582, https://doi.org/10.1175/JCLI-D-17-0518.1, 2019. a, b, c, d, e, f, g
Bosart, L. F. and Dean, D. B.: The Agnes Rainstorm of June 1972: Surface Feature Evolution Culminating in Inland Storm Redevelopment, Weather Forecast., 6, 515–537, https://doi.org/10.1175/1520-0434(1991)006<0515:TAROJS>2.0.CO;2, 1991. a
Chen, G.: A Comparison of precipitation distribution of two landfalling tropical cyclones during the extratropical transition, Adv. Atmos. Sci., 28, 1390–1404, https://doi.org/10.1007/s00376-011-0148-y, 2011. a, b, c
Dare, R. A. and Davidson, N. E.: Characteristics of Tropical Cyclones in the Australian Region, Mon. Weather Rev., 132, 3049–3065, https://doi.org/10.1175/MWR2834.1, 2004. a
Davies, D. L. and Bouldin, D. W.: A Cluster Separation Measure, IEEE T. Pattern Anal., PAMI-1, 224–227, https://doi.org/10.1109/TPAMI.1979.4766909, 1979. a
Demirci, O., Tyo, J. S., and Ritchie, E. A.: Spatial and Spatiotemporal Projection Pursuit Techniques to Predict the Extratropical Transition of Tropical Cyclones, IEEE T. Geosci. Remote, 45, 418–425, https://doi.org/10.1109/TGRS.2006.882251, 2007. a, b, c
Dulac, W., Cattiaux, J., Chauvin, F., Bourdin, S., and Fromang, S.: Assessing the representation of tropical cyclones in ERA5 with the CNRM tracker, Clim. Dynam., 62, 223–238, https://doi.org/10.1007/s00382-023-06902-8, 2024. a
Emanuel, K. A.: The Maximum Intensity of Hurricanes, J. Atmos. Sci., 45, 1143–1155, https://doi.org/10.1175/1520-0469(1988)045<1143:TMIOH>2.0.CO;2, 1988. a
Evans, C. and Hart, R. E.: Analysis of the Wind Field Evolution Associated with the Extratropical Transition of Bonnie (1998), Mon. Weather Rev., 136, 2047–2065, https://doi.org/10.1175/2007MWR2051.1, 2008. a
Evans, C., Wood, K. M., Aberson, S. D., Archambault, H. M., Milrad, S. M., Bosart, L. F., Corbosiero, K. L., Davis, C. A., Dias Pinto, J. R., Doyle, J., Fogarty, C., Galarneau, T. J., Grams, C. M., Griffin, K. S., Gyakum, J., Hart, R. E., Kitabatake, N., Lentink, H. S., McTaggart-Cowan, R., Perrie, W., Quinting, J. F. D., Reynolds, C. A., Riemer, M., Ritchie, E. A., Sun, Y., and Zhang, F.: The Extratropical Transition of Tropical Cyclones. Part I: Cyclone Evolution and Direct Impacts, Mon. Weather Rev., 145, 4317–4344, https://doi.org/10.1175/MWR-D-17-0027.1, 2017. a, b, c, d, e
Evans, J. L. and Hart, R. E.: Objective Indicators of the Life Cycle Evolution of Extratropical Transition for Atlantic Tropical Cyclones, Mon. Weather Rev., 131, 909–925, https://doi.org/10.1175/1520-0493(2003)131<0909:OIOTLC>2.0.CO;2, 2003. a, b, c, d
Foley, G. R. and Hanstrum, B. N.: The Capture of Tropical Cyclones by Cold Fronts off the West Coast of Australia, Weather Forecast., 9, 577–592, https://doi.org/10.1175/1520-0434(1994)009<0577:TCOTCB>2.0.CO;2, 1994. a, b, c, d, e, f, g, h, i, j, k
Gray, W. M.: Global view of the origin of tropical disturbances and storms, Mon. Weather Rev., 96, 669–700, https://doi.org/10.1175/1520-0493(1968)096<0669:GVOTOO>2.0.CO;2, 1968. a
Griffin, K. S. and Bosart, L. F.: The Extratropical Transition of Tropical Cyclone Edisoana (1990), Mon. Weather Rev., 142, 2772–2793, https://doi.org/10.1175/MWR-D-13-00282.1, 2014. a, b, c, d, e, f
Han, Y. and Ullrich, P. A.: The System for Classification of Low-Pressure Systems (SyCLoPS): An All-In-One Objective Framework for Large-Scale Data Sets, J. Geophys. Res.-Atmos., 130, e2024JD041287, https://doi.org/10.1029/2024JD041287, 2025. a, b, c, d, e, f
Harr, P. A. and Elsberry, R. L.: Extratropical Transition of Tropical Cyclones over the Western North Pacific. Part I: Evolution of Structural Characteristics during the Transition Process, Mon. Weather Rev., 128, 2613–2633, https://doi.org/10.1175/1520-0493(2000)128<2613:ETOTCO>2.0.CO;2, 2000. a, b, c
Harr, P. A., Elsberry, R. L., and Hogan, T. F.: Extratropical Transition of Tropical Cyclones over the Western North Pacific. Part II: The Impact of Midlatitude Circulation Characteristics, Mon. Weather Rev., 128, 2634–2653, https://doi.org/10.1175/1520-0493(2000)128<2634:etotco>2.0.co;2, 2000. a
Hart, R. E.: A Cyclone Phase Space Derived from Thermal Wind and Thermal Asymmetry, Mon. Weather Rev., 131, 585–616, https://doi.org/10.1175/1520-0493(2003)131<0585:ACPSDF>2.0.CO;2, 2003. a, b, c, d
Hart, R. E. and Evans, J. L.: A Climatology of the Extratropical Transition of Atlantic Tropical Cyclones, J. Climate, 14, 546–564, https://journals.ametsoc.org/view/journals/clim/14/4/1520-0442_2001_014_0546_acotet_2.0.co_2.xml, 2001. a, b
Hersbach, H., Bell, B., Berrisford, P., Hirahara, S., Horányi, A., Muñoz-Sabater, J., Nicolas, J., Peubey, C., Radu, R., Schepers, D., Simmons, A., Soci, C., Abdalla, S., Abellan, X., Balsamo, G., Bechtold, P., Biavati, G., Bidlot, J., Bonavita, M., De Chiara, G., Dahlgren, P., Dee, D., Diamantakis, M., Dragani, R., Flemming, J., Forbes, R., Fuentes, M., Geer, A., Haimberger, L., Healy, S., Hogan, R. J., Hólm, E., Janisková, M., Keeley, S., Laloyaux, P., Lopez, P., Lupu, C., Radnoti, G., de Rosnay, P., Rozum, I., Vamborg, F., Villaume, S., and Thépaut, J.-N.: The ERA5 global reanalysis, Q. J. Roy. Meteor. Soc., 146, 1999–2049, https://doi.org/10.1002/qj.3803, 2020. a
Jones, S. C., Harr, P. A., Abraham, J., Bosart, L. F., Bowyer, P. J., Evans, J. L., Hanley, D. E., Hanstrum, B. N., Hart, R. E., Lalaurette, F., Sinclair, M. R., Smith, R. K., and Thorncroft, C.: The Extratropical Transition of Tropical Cyclones: Forecast Challenges, Current Understanding, and Future Directions, Weather Forecast., 18, 1052–1092, https://doi.org/10.1175/1520-0434(2003)018<1052:TETOTC>2.0.CO;2, 2003. a, b, c, d, e, f
Keller, J. H., Grams, C. M., Riemer, M., Archambault, H. M., Bosart, L., Doyle, J. D., Evans, J. L., Galarneau, T. J., Griffin, K., Harr, P. A., Kitabatake, N., McTaggart-Cowan, R., Pantillon, F., Quinting, J. F., Reynolds, C. A., Ritchie, E. A., Torn, R. D., and Zhang, F.: The Extratropical Transition of Tropical Cyclones. Part II: Interaction with the Midlatitude Flow, Downstream Impacts, and Implications for Predictability, Mon. Weather Rev., 147, 1077–1106, https://doi.org/10.1175/MWR-D-17-0329.1, 2019. a, b, c, d
Kitabatake, N.: Climatology of Extratropical Transition of Tropical Cyclones in the Western North Pacific Defined by Using Cyclone Phase Space, J. Meteorol. Soc. Jpn., Ser. II, 89, 309–325, https://doi.org/10.2151/jmsj.2011-402, 2011. a, b, c, d, e, f
Klein, P. M., Harr, P. A., and Elsberry, R. L.: Extratropical Transition of Western North Pacific Tropical Cyclones: An Overview and Conceptual Model of the Transformation Stage, Weather Forecast., 15, 373–395, https://doi.org/10.1175/1520-0434(2000)015<0373:ETOWNP>2.0.CO;2, 2000. a, b, c
Knapp, K. R., Kruk, M. C., Levinson, D. H., Diamond, H. J., and Neumann, C. J.: The International Best Track Archive for Climate Stewardship (IBTrACS): Unifying Tropical Cyclone Data, B. Am. Meteorol. Soc., 91, 363–376, https://doi.org/10.1175/2009BAMS2755.1, 2010. a
Kofron, D. E., Ritchie, E. A., and Tyo, J. S.: Determination of a Consistent Time for the Extratropical Transition of Tropical Cyclones. Part I: Examination of Existing Methods for Finding “ET Time”, Mon. Weather Rev., 138, 4328–4343, https://doi.org/10.1175/2010MWR3180.1, 2010a. a, b
Kofron, D. E., Ritchie, E. A., and Tyo, J. S.: Determination of a Consistent Time for the Extratropical Transition of Tropical Cyclones. Part II: Potential Vorticity Metrics, Mon. Weather Rev., 138, 4344–4361, https://doi.org/10.1175/2010MWR3181.1, 2010b. a
Madonna, E., Wernli, H., Joos, H., and Martius, O.: Warm Conveyor Belts in the ERA-Interim Dataset (1979–2010). Part I: climatology and potential vorticity evolution, J. Climate, 27, 3–26, https://doi.org/10.1175/JCLI-D-12-00720.1, 2014. a
Matyas, C. J.: Processes Influencing Rain-Field Growth and Decay after Tropical Cyclone Landfall in the United States, J. Appl. Meteorol. Clim., 52, 1085–1096, https://doi.org/10.1175/JAMC-D-12-0153.1, 2013. a
National Computational Infrastructure (NCI): ERA5 Replicated Datasets, NCI [data set], https://doi.org/10.25914/5f48874388857, 2020. a
O'Brien, L. and Reeder, M. J.: Southern Hemisphere summertime Rossby waves and weather in the Australian region: Southern Hemisphere Summertime Rossby Waves, Q. J. Roy. Meteor. Soc., 143, 2374–2388, https://doi.org/10.1002/qj.3090, 2017. a
Orlanski, I. and Sheldon, J. P.: Stages in the energetics of baroclinic systems, Tellus A, 47, 605–628, https://doi.org/10.1034/j.1600-0870.1995.00108.x, 1995. a
Parker, T. J., Berry, G. J., and Reeder, M. J.: The influence of tropical cyclones on heat waves in Southeastern Australia, Geophys. Res. Lett., 40, 6264–6270, https://doi.org/10.1002/2013GL058257, 2013. a
Quinting, J. F. and Jones, S. C.: On the Impact of Tropical Cyclones on Rossby Wave Packets: A Climatological Perspective, Mon. Weather Rev., 144, 2021–2048, https://doi.org/10.1175/MWR-D-14-00298.1, 2016. a, b, c
Quinting, J. F., Bell, M. M., Harr, P. A., and Jones, S. C.: Structural Characteristics of T-PARC Typhoon Sinlaku during Its Extratropical Transition, Mon. Weather Rev., 142, 1945–1961, https://doi.org/10.1175/MWR-D-13-00306.1, 2014. a, b, c
Raveh-Rubin, S.: Dry Intrusions: Lagrangian Climatology and Dynamical Impact on the Planetary Boundary Layer, J. Climate, 30, 6661–6682, https://doi.org/10.1175/JCLI-D-16-0782.1, 2017. a
Riemer, M. and Jones, S. C.: The downstream impact of tropical cyclones on a developing baroclinic wave in idealized scenarios of extratropical transition, Q. J. Roy. Meteor. Soc., 136, 617–637, https://doi.org/10.1002/qj.605, 2010. a
Ritchie, E. A. and Elsberry, R. L.: Simulations of the Transformation Stage of the Extratropical Transition of Tropical Cyclones, Mon. Weather Rev., 129, 1462–1480, https://doi.org/10.1175/1520-0493(2001)129<1462:SOTTSO>2.0.CO;2, 2001. a, b, c, d
Rousseeuw, P. J.: Silhouettes: A graphical aid to the interpretation and validation of cluster analysis, J. Comput. Appl. Math., 20, 53–65, https://doi.org/10.1016/0377-0427(87)90125-7, 1987. a
Sinclair, M. R.: Extratropical Transition of Southwest Pacific Tropical Cyclones. Part I: Climatology and Mean Structure Changes, Mon. Weather Rev., 130, 590–609, https://doi.org/10.1175/1520-0493(2002)130<0590:ETOSPT>2.0.CO;2, 2002. a, b, c, d, e, f, g
Steinfeld, D. and Pfhal, S.: The role of latent heating in atmospheric blocking dynamics: a global climatology, Clim. Dynam., 53, 6159–6180, https://doi.org/10.1007/s00382-019-04919-6, 2019. a
Stoelinga, M. T.: A Potential Vorticity-Based Study of the Role of Diabatic Heating and Friction in a Numerically Simulated Baroclinic Cyclone, Mon. Weather Rev., 124, 849–874, https://doi.org/10.1175/1520-0493(1996)124<0849:APVBSO>2.0.CO;2, 1996. a
Teubler, F. and Riemer, M.: Potential-vorticity dynamics of troughs and ridges within Rossby wave packets during a 40-year reanalysis period, Weather Clim. Dynam., 2, 535–559, https://doi.org/10.5194/wcd-2-535-2021, 2021. a
Ullrich, P. A. and Zarzycki, C. M.: TempestExtremes: a framework for scale-insensitive pointwise feature tracking on unstructured grids, Geosci. Model Dev., 10, 1069–1090, https://doi.org/10.5194/gmd-10-1069-2017, 2017. a, b
Ullrich, P. A., Zarzycki, C. M., McClenny, E. E., Pinheiro, M. C., Stansfield, A. M., and Reed, K. A.: TempestExtremes v2.1: a community framework for feature detection, tracking, and analysis in large datasets, Geosci. Model Dev., 14, 5023–5048, https://doi.org/10.5194/gmd-14-5023-2021, 2021. a, b
Wood, K. M. and Ritchie, E. A.: A 40-Year Climatology of Extratropical Transition in the Eastern North Pacific, J. Climate, 27, 5999–6015, https://doi.org/10.1175/JCLI-D-13-00645.1, 2014. a, b, c, d, e, f
Zarzycki, C. M. and Ullrich, P. A.: Assessing sensitivities in algorithmic detection of tropical cyclones in climate data, Geophys. Res. Lett., 44, 1141–1149, https://doi.org/10.1002/2016GL071606, 2017. a, b
Zarzycki, C. M., Thatcher, D. R., and Jablonowski, C.: Objective tropical cyclone extratropical transition detection in high-resolution reanalysis and climate model data, J. Adv. Model. Earth Sy., 9, 130–148, https://doi.org/10.1002/2016MS000775, 2017. a, b