
the Creative Commons Attribution 4.0 License.
the Creative Commons Attribution 4.0 License.
 | 02 Sep 2026
An energetic perspective on the impact of the Atlantic Multidecadal Variability on the West African Monsoon

Paul-Arthur Monerie
Juliette Mignot
Simona Bordoni
This study explores mechanisms by which the Atlantic Multidecadal Variability (AMV) drives multidecadal changes in the West African Monsoon (WAM), with a focus on Sahel rainfall. We investigate the AMV-WAM connection through an energetic perspective using atmosphere–ocean coupled models forced by an idealized AMV sea surface temperature (SST) pattern. Results show that a positive AMV phase (anomalously warm North Atlantic) increases net energy input to the atmosphere via enhanced surface latent heat flux. The atmospheric circulation adjusts by exporting this excess energy from the North Atlantic. In the Tropical Atlantic and Africa, this is accomplished by anomalous southward cross-equatorial energy transport and a northward shift of the Intertropical Convergence Zone (ITCZ). Over West Africa, this ITCZ shift leads to increased and northward displaced Sahel rainfall. The monsoon intensification is dynamically consistent with enhanced low-level convergence and high-level divergence in the main ascent region and a decrease in mid-level dry-air intrusion, linked to a weakening of the shallow meridional circulation over the Sahara.
- Article
(7862 KB) - Full-text XML
-
Supplement
(31553 KB) - BibTeX
- EndNote


The West African monsoon (WAM) is a complex, strongly coupled system involving the atmosphere, ocean, and land. Its seasonal cycle is marked by a pronounced northward migration of the associated rainfall, which reaches its northernmost position during July, August, and September (JAS) (Thorncroft et al., 2011). During these months, the semi-arid Sahel region records most of its annual precipitation (Nicholson, 2013). Hence, summer seasonal amounts of Sahel precipitation are closely tied to the strength and latitudinal migrations of the WAM.
Rainfall over the Sahel has experienced strong variability during the instrumental record (Rodríguez-Fonseca et al., 2015), with a notable component at decadal-to-multidecadal timescales (Kitoh et al., 2020). The transition from the rainy years in the 1950s–1960s to the severe drought conditions of the 1970s–1980s was particularly remarkable (Dai et al., 2004). Since then, Sahel rainfall has shown a recovery, accompanied by an increased frequency and intensity of extreme rainfall events (e.g. Sanogo et al., 2015; Taylor et al., 2017; Chagnaud et al., 2022). Regionally, the recovery has been weaker in the western Sahel compared to the central and eastern sectors (Lebel and Ali, 2009).
There is no clear consensus on the ultimate causes of this observed decadal variability in Sahel rainfall in the instrumental period. Changes in external forcings, compounded with internal climate variability, make attribution of these rainfall fluctuations particularly challenging. The limited length of the observational record and systematic biases in climate models further complicate the task (Herman et al., 2023). Consequently, the extent to which the Sahel drought and its subsequent partial recovery can be attributed to anthropogenic influences, such as greenhouse gas emissions or aerosol loads, either through direct or ocean-mediated influences, or to internally generated sea surface temperature (SST) variability, either due to the system's stochasticity or to modifications in the deep oceans, is still highly debated (Rotstayn and Lohmann, 2002; Knight et al., 2006; Haywood et al., 2013; Hwang et al., 2013; Dong et al., 2014; Dong and Sutton, 2015; Hua et al., 2019; Zhang et al., 2019; Moreno-Chamarro et al., 2020; Watanabe and Tatebe, 2019; Giannini and Kaplan, 2019; Hirasawa et al., 2020, 2022; Kim et al., 2020; Zhang et al., 2021, 2022; Ndiaye et al., 2022; He et al., 2023; Herman et al., 2023; Monerie et al., 2023; Guo et al., 2024).
Despite this lack of consensus, there is broad agreement that SST variability associated with the Atlantic Multidecadal Variability (AMV) played a prominent role in modulating Sahel rainfall at decadal timescales. Between 40 % and 65 % of Sahel rainfall variability at these timescales can in fact be explained by AMV (Zhang and Delworth, 2006; Villamayor et al., 2018; Kitoh et al., 2020; Joshi et al., 2022). Observational and modelling studies consistently show that the positive phase of AMV, characterized by warmer-than-normal SSTs in the North Atlantic and cooler and weaker anomalies in the South Atlantic (Zhang et al., 2019), promotes enhanced rainfall over the Sahel and higher occurrence of extreme rainfall events (Folland et al., 1986; Knight et al., 2006; Zhang and Delworth, 2006; Mohino et al., 2011; Ting et al., 2011; Martin et al., 2014; Martin and Thorncroft, 2014; O’Reilly et al., 2017; Villamayor et al., 2018; Monerie et al., 2019b; Moreno-Chamarro et al., 2020; Hodson et al., 2022; Badji et al., 2022; Mohino et al., 2024; Cai et al., 2025).
Regarding the involved mechanisms, most studies agree that the AMV positive phase shifts the ITCZ northwards and enhances southwesterly surface winds into the Sahel, promoting enhanced low-level moisture flux convergence, convection, and upper-level divergence (Folland et al., 1986; Knight et al., 2006; Zhang and Delworth, 2006; Ting et al., 2011; Mohino et al., 2011; Wang et al., 2012; Zhang et al., 2021). The cross-equatorial winds are also understood as a response to the sea level pressure interhemispheric gradient that follows the interhemispheric SST gradient (Martin et al., 2014; Martin and Thorncroft, 2014; Xue et al., 2022). Both dynamical and thermodynamical changes contribute to the total response of the WAM precipitation to AMV (O’Reilly et al., 2017; Monerie et al., 2019b). However, there is less agreement on the role of the Saharan Heat Low (SHL) and the shallow meridional circulation (SMC) over the Sahara. While Martin and Thorncroft (2014) suggest that a positive AMV increases Sahel precipitation through an increased SMC in response to a stronger SHL, Shekhar and Boos (2017) challenge this view, highlighting that a strengthened SMC can weaken the monsoon by advecting dry air at mid levels.
The emerging paradigm of monsoons as energetically direct moist circulations, tightly coupled to the ITCZ and the Hadley circulation (Schneider et al., 2014; Biasutti et al., 2018), provides a framework to explore WAM variability from an energetic perspective. The column-integrated moist static energy (MSE) budget offers insights into the WAM response to climate change (Hill et al., 2017, 2018; Mutton et al., 2022). Furthermore, the established relationship between inter-hemispheric atmospheric energy transport and the ITCZ position (Kang et al., 2008; Marshall et al., 2014; Donohoe et al., 2014; Bischoff and Schneider, 2014; Schneider et al., 2014; Adam et al., 2016a, b) enables the use of energetic-based metrics to diagnose the location of the monsoon-related rainfall band (Shekhar and Boos, 2016) and to explore uncertainties related to aerosol forcing in understanding 20th-century Sahel rainfall trends (Monerie et al., 2023). The recent extension of this theory to consideration of the influence of proximal deserts on monsoonal precipitation (Shekhar and Boos, 2016) holds promise to also shed light on the SMC-Sahel rainfall relationship in a unified framework.
Motivated by this perspective, the aim of this study is to improve understanding of the impact of AMV on the WAM through the lens of the energetic framework. The limited length of the observational record, the misrepresentation of Sahel multidecadal variability in current reanalyses (Berntell et al., 2018), and the influence of other sources of decadal SST variability, particularly those centred in the Pacific basin (Mohino et al., 2011; Villamayor and Mohino, 2015; Dong and Dai, 2015; Joshi et al., 2022), hinder the evaluation of the AMV influence on the WAM from observations alone. To overcome these limitations, here we adopt a modelling approach in which atmosphere–ocean coupled models are forced with an idealised North Atlantic SST pattern characteristic of the AMV through SST restoring (Boer et al., 2016). This approach allows us to analyse a large ensemble of realisations, improving signal detection, and to quantify model uncertainty by applying a consistent constraint across different models.
2.1 Description of the simulations
We use two sets of sensitivity experiments, consisting of 10 year runs with global coupled models in which North Atlantic SSTs are constrained to follow a fixed, idealised anomalous pattern of the AMV in its positive (AMV+) and negative (AMV−) phases, respectively. The anomalous pattern (see Fig. S1 in the Supplement) is derived from an estimation of the internal component of the observed SST variability, following the procedure proposed by Ting et al. (2009) and using the ERSSTv4 dataset (Huang et al., 2015). The SST AMV signal is imposed in the North Atlantic, from 10–65° N, with an additional 8° buffer zone in which the amplitude of the AMV anomaly is reduced. Within this region, SSTs are constrained either through alteration of the surface fluxes or through a Newtonian SST nudging. Hereinafter, we will jointly refer to these adjustments as SST restoring. Further details on how the AMV pattern is obtained and on how the models' SST is constrained can be found in Boer et al. (2016) and in the technical notes for AMV simulations (https://www.wcrp-esmo.org/projects-and-panels/dcpp/dcpp-cmip6, last access: 17 July 2026). Four models follow the protocol of the Decadal Climate Prediction Project – Component C (DCPP-C Boer et al., 2016), while nine others follow the protocol proposed in the EU Horizon 2020 PRIMAVERA project (Hodson et al., 2022). In both cases, for each model, multiple ensemble members are generated by slightly perturbing initial conditions. The protocols differ in the applied radiative forcing (pre-industrial conditions in the DCPP-C protocol and 1950s conditions in the PRIMAVERA protocol) and in the magnitude of the anomalous AMV pattern, which is twice as large in the PRIMAVERA runs. Changes associated with a positive AMV phase are estimated by subtracting the negative experiment from the positive one (AMV+ − AMV−). Since this estimation assumes linearity, changes associated with a negative AMV phase can be obtained by reversing the sign of the anomalies. To facilitate comparison between protocols, changes in the model driven by the PRIMAVERA protocol are halved. For each experiment, we first calculate the 10 year mean of the simulation, and then we average all ensemble members for each model. The climatology for a given model and field is computed as half the sum of the positive and negative experiments, after averaging across ensemble members and the ten simulated years. Although there could be non-linear effects in the AMV impacts (e.g. Monerie et al., 2019b, 2025), the current protocol does not allow their estimation.
Table 1 lists the models analysed, including their atmospheric horizontal resolution, protocol followed, number of ensemble members, and main reference.
Boucher et al. (2020)Voldoire et al. (2019)Döscher et al. (2022)Williams et al. (2018)Voldoire et al. (2019)Haarsma et al. (2020)Haarsma et al. (2020)Roberts et al. (2018)Roberts et al. (2018)Hirons et al. (2015)Hirons et al. (2015)Gutjahr et al. (2019)Gutjahr et al. (2019)Table 1Overview of the different models used in this study, together with approximate horizontal resolution, number of atmospheric vertical levels, protocol followed for the simulations, number of members for each experiment, and main reference for the model documentation.
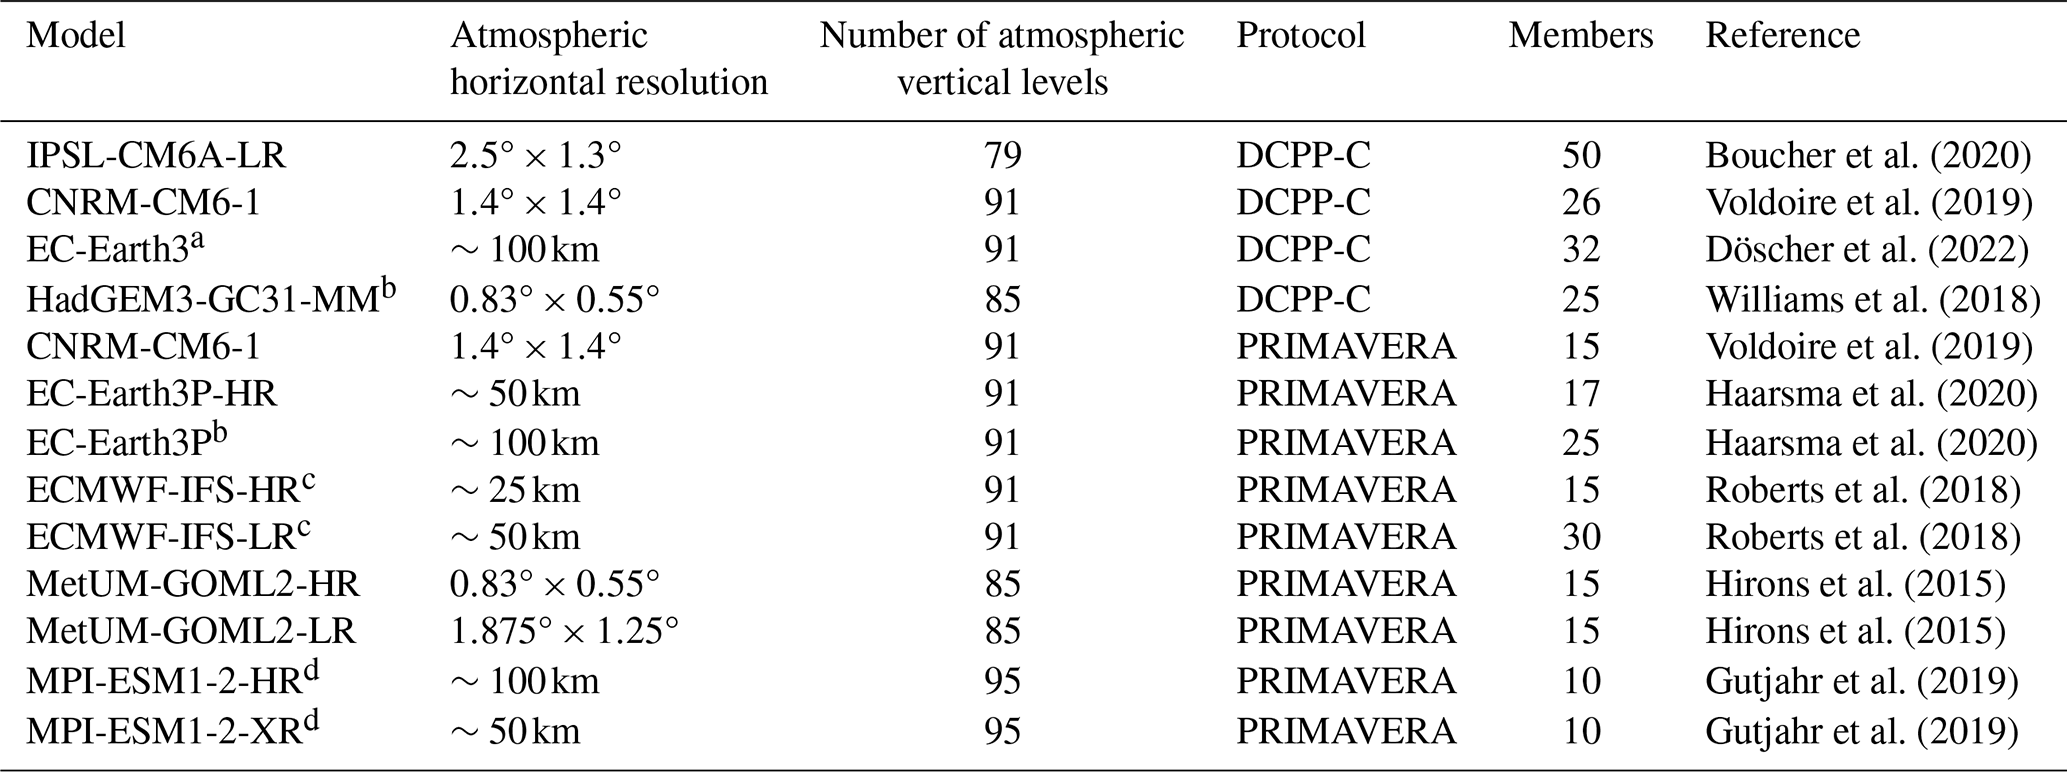
a Too few vertical levels were available in the output of this model, so it was excluded from both the vertical profile analysis and the calculation of low-level atmospheric thickness.
b No soil moisture data was available for these models.
c No near-surface specific humidity data was available for these models.
d Due to an unrealistic response (see Sect. 3.1), these models are removed from the results shown in the paper. Note that this does not affect the main conclusions of the manuscript.
2.2 Derived variables
From the model's monthly mean outputs, we calculate the following derived variables:
-
Top-of-atmosphere radiative energy imbalance. The energy imbalance at the top of the atmosphere RTOA is calculated as the difference between net incoming shortwave radiation and outgoing longwave radiation (OLR), with positive values indicating net radiative energy gain for the atmosphere.
-
Surface energy imbalance. The surface energy imbalance FSFC is calculated as the sum of net surface shortwave radiation, net surface longwave radiation, and surface turbulent enthalpy fluxes (latent and sensible heat), with positive values indicating an energy gain for the atmosphere from below.
-
Net energy input. The net energy input NEI into the atmospheric column is calculated as the sum of the top-of-the-atmosphere and surface energy imbalances. A positive value indicates a net input of energy into the atmosphere.
-
Moist static energy. Moist static energy (MSE, h) is calculated as , where cp is the specific heat at constant pressure, T is the temperature, Lv is the latent heat of vaporization, q is the specific humidity, g is the gravitational constant, and z is the geopotential height.
-
Divergent moist static energy flux. To estimate the column-integrated divergent MSE flux (〈uh〉+, with u denoting the horizontal wind, brackets mass-weighted vertical integrals, and + the divergent component), we use the column-integrated energy balance of the atmosphere:
where ∂t〈e〉, the time tendency of the mass-weighted vertical integral of moist enthalpy , represents the moist energy stored in the atmospheric column, and ∇h is the horizontal divergence operator. Assuming that energy storage is negligible over seasonal and long-term averages (denoted by overbars), we obtain . The divergent component of the mass-weighted vertical integral of the MSE flux is hence inferred from NEI assuming the energy budget in Eq. (1) is closed and atmospheric energy storage is negligible. Note that even though NEI calculation is performed with monthly mean values, the inferred divergent component of the mass-weighted vertical integral of the MSE flux is inclusive of time means and transient eddies.
-
Low-level atmospheric thickness. We calculate the low-level atmospheric thickness (LLAT) as the difference between the geopotential heights of the 700 hPa and the 950 hPa surfaces as a metric of the SHL (Shekhar and Boos, 2017). To focus on robust geopotential changes, we remove the tropical mean between 23° S and 23° N. Following Shekhar and Boos (2017), we also estimate the value and the latitude of the LLAT maximum using cubic-spline interpolation of the zonally averaged field between 10 and 35° E.
-
ITCZ position. We estimate the zonally varying latitude of the ITCZ, ϕmax, following Adam et al. (2016b) as the position of the maximum rainfall by weighting for each longitude the latitude (ϕ) by the 10th power of the area-weighted precipitation (P) and integrating between 20° S and 20° N:
-
African Easterly Jet position. The peak of the African Easterly Jet (AEJ) is identified as the minimum of the 600 hPa zonal wind, zonally averaged between 10° W and 10° E, after cubic-spline interpolation.
2.3 Multimodel averaging
To highlight the average signals across models, the multimodel mean is calculated as the unweighted average across all available models (an equal weight “1 model, 1 vote” approach), without any special weighting for different versions of the same model. In this calculation, each model is represented by the average over all its ensemble members, which varies among models (Table 1). Before averaging, all model outputs are regridded to a common horizontal grid of 1°×1° using a first-order conservative method. For the calculation of vertical profiles, outputs are first computed for each model, regridded linearly to a common 1° horizontal grid (vertical levels are standardised, except for EC-Earth3 in the DCPP-C protocol, which is excluded for profile calculations), and then averaged across the available models.
In maps and spatial plots, model consistency is evaluated by hatching the regions where less than 80 % of the models agree on the sign of the AMV+ minus AMV− changes in a given variable.
2.4 Statistical confidence and intermodel spread
As is common in modelling studies, the intermodel spread is used as a measure of uncertainty. We assume the model values form a sample drawn from a normal distribution with unknown variance, and we use the sample variance as an estimate of the population variance. Confidence intervals are constructed using a two-tailed Student's t-test at a significance level of α=0.05.
We also evaluate the potential relation between the intermodel spread of Sahel rainfall and that of other variables using scatter plots, for which the linear regression and correlation are calculated. The statistical significance of the latter is assessed using a t-test at the same significance level of α=0.05.
Due to the interdependence among models, determining the number of degrees of freedom in our sample of models is not straightforward (Sanderson et al., 2015). Specifically, two elements are provided by the same model (CNRM-CM6-1) run under the two different protocols, while others represent a single model configuration run at different resolutions (for instance, MetUM-GOML2-HR and MetUM-GOML2-LR). Moreover, several models share components (e.g., atmospheric or oceanic), thus reducing overall diversity. Most results shown are based on a sample of 11 models, of which around 6 can be considered independent, although their components might not be completely independent. Therefore, we assess the statistical significance under two assumptions: (1) treating all models as independent realisations, and (2) assuming only 6 independent elements. This dual approach allows us to evaluate the sensitivity of our conclusions to model interdependence. These are indicated in the text and figures with one and two asterisks, respectively.
2.5 Symmetric and antisymmetric components of changes
To quantify how much of a given change in a zonally averaged field can be interpreted as a latitudinal shift vs. an amplitude change, we decompose anomalies into symmetric and antisymmetric components relative to the location of the climatological peak. We restrict the analysis to zonally averaged (in the 10° W–10° E longitudinal sector) fields that exhibit a distinct extremum (maximum or minimum) as a function of latitude (e.g., rainfall or zonal wind at 600 hPa) and focus on a latitude window centred on this peak. For any latitude within this window, the symmetric (antisymmetric) component is defined as half the sum (difference) of the value at that latitude and the value at its mirror latitude relative to the peak. For a given latitude range to one side of the peak (for instance, Sahel latitudes for rainfall), we identify the shift with the antisymmetric component and the amplitude change with the symmetric component, both averaged over the latitude range. The total averaged change for that given latitude range is the sum of both components. Unless otherwise stated, the region taken for the averages is from the latitude of the maximum to the northern limit of the plot. For the multimodel mean, the calculation is performed after model averaging.
3.1 Drift in the global energy response and model selection
We evaluate potential drifts of the simulations by calculating the drift in the TOA energy imbalance RTOA over the simulated years (Fig. 1a). All models except for MPI-ESM-2-HR and MPI-ESM-2-XR show negative RTOA, indicating that the AMV+ experiment is losing energy at TOA relative to AMV−. Although the negative values tend to grow over time, the trends are not statistically significant. This weak negative RTOA and its trend in the difference between AMV+ and AMV− experiments are consistent with a positive value and trend in OLR (Fig. 1b) and in global mean surface temperatures (Fig. 1c). The SST restoring imposes warm anomalies over the North Atlantic in the AMV+ experiment relative to AMV−, resulting in a warmer global mean surface temperature anomaly (Fig. 1c). This initial anomaly tends to increase over time as regions remote from the North Atlantic begin warming up (Fig. 1c). Consequently, the warmer AMV+ experiment loses more OLR to space relative to the AMV− experiment (Fig. 1b), which explains the negative RTOA and its weak negative trend (Fig. 1a).
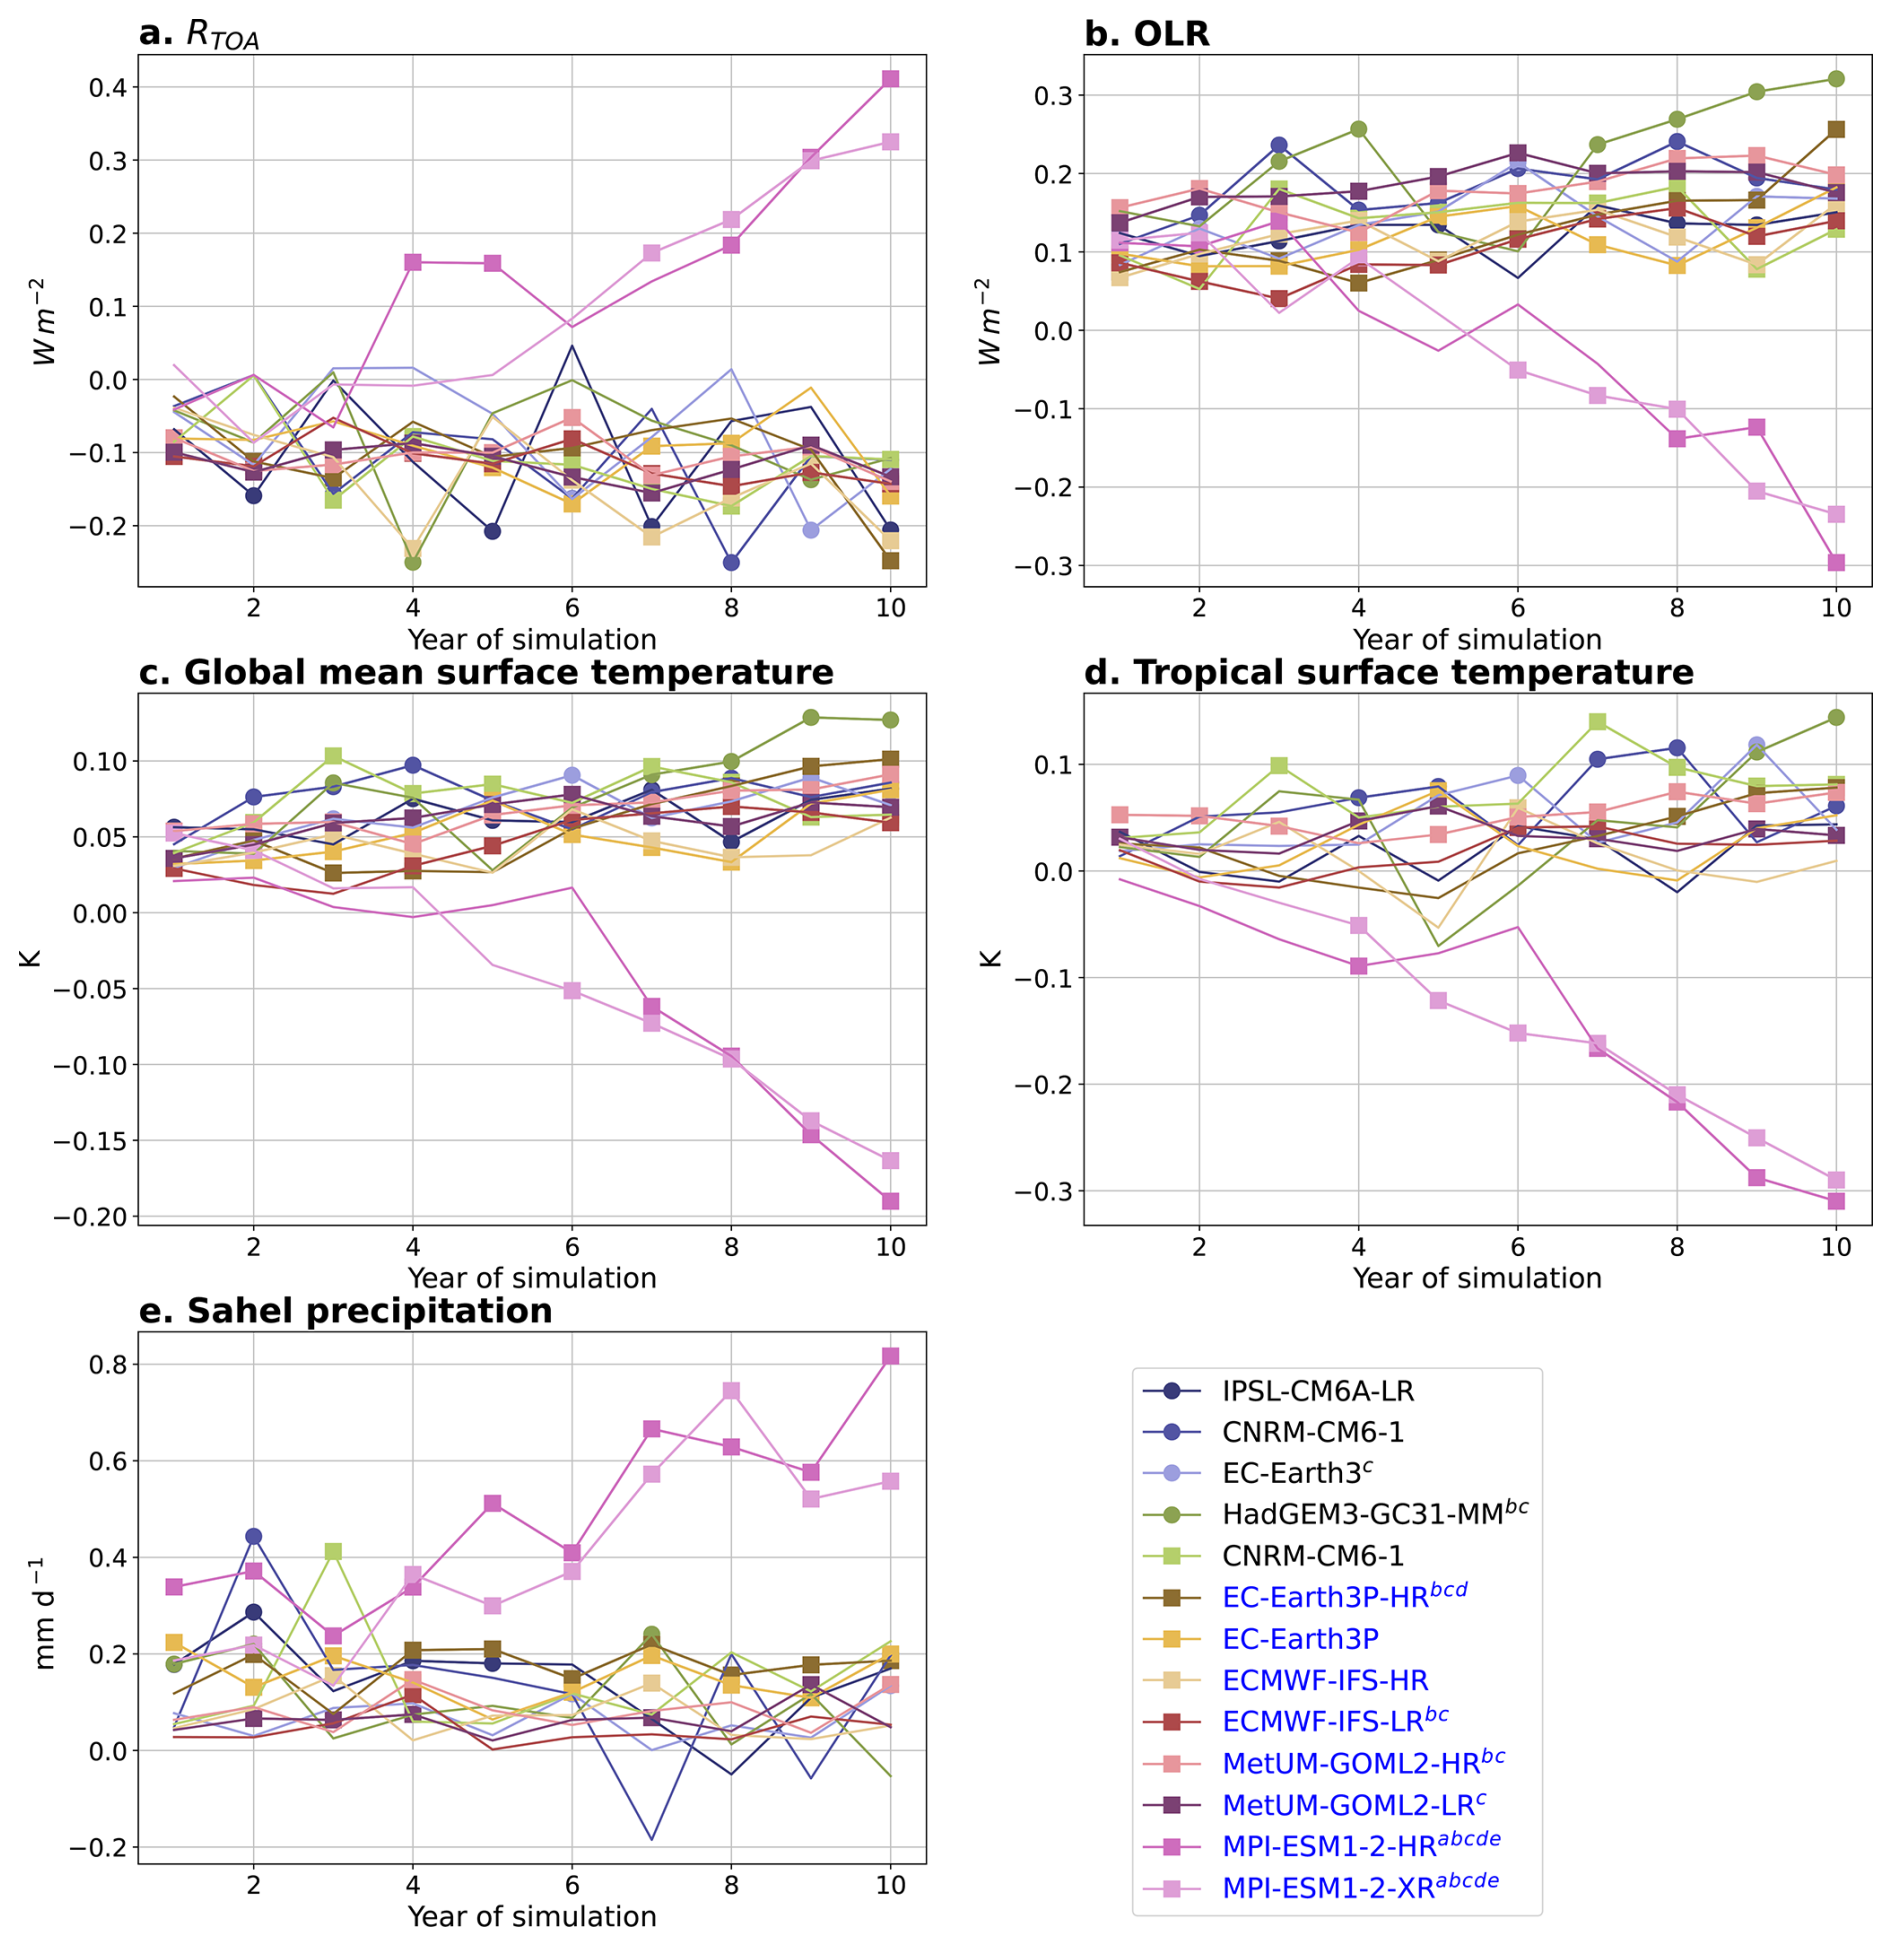
Figure 1Simulation drifts. Differences between AMV+ and AMV− yearly means averaged across all ensemble members for each model vs. simulated year for: (a) global mean net TOA energy imbalance RTOA (W m−2); (b) global mean OLR (W m−2, positive anomalies meaning the Earth is losing more longwave radiation at TOA in AMV+ than in AMV−); (c) global mean surface temperature (K); (d) tropical (20° S–20° N) mean surface temperature (K); (e) Sahel rainfall (averaged over the 10° W–10° E, 10–20° N box, mm d−1). For the models following the PRIMAVERA protocol (marked as blue in the model names), only half the anomalies are shown. Solid symbols mark statistically significant differences (two-tailed t-test) in the AMV+ and AMV− experiments evaluated separately for each year. Letters a to e next to the model name indicate trends in the variables shown in the corresponding plot that are statistically different from 0 (at the level of α=0.05).
Conversely, MPI-ESM-2-HR and MPI-ESM-2-XR exhibit highly anomalous behaviour. In response to warm North Atlantic SST anomalies, these models cool over the simulated period, especially over the tropical ocean regions (Figs. 1d and S2). The reasons for this cooling remain unclear, and while we encourage further analysis, it is out of the scope of this study. This cooling causes a strong positive drift of RTOA (Fig. 1a) due to a corresponding negative drift in OLR (Fig. 1b). In addition, these models present a strong response in Sahel rainfall (see Fig. S3), characterised by a positive and statistically significant trend throughout the simulation (Fig. 1e). We consider this behaviour unrealistic and have therefore removed these two models from the analyses shown here. We caution against the inclusion of the PRIMAVERA AMV+ and AMV− simulations performed with these two models in multimodel means, as it can unrealistically distort results and increase intermodel spread (as in Hodson et al., 2022). Nevertheless, our main conclusions regarding the mechanisms governing the Sahel rainfall response to the AMV SST pattern remain robust regardless of the exclusion of these two models.
3.2 Changes in Sahel rainfall
In response to the imposed positive AMV pattern during boreal summer, there is a pronounced surface warming across continental regions poleward of 30° N, including eastern Asia. In the Southern Hemisphere, warm anomalies appear mainly over South America (Fig. 2a). This pattern is consistent with previous studies evaluating similar experiments (Ruprich-Robert et al., 2018, 2021; Monerie et al., 2021; Hodson et al., 2022). Elsewhere, models show weaker and less consistent temperature responses, with modest multimodel mean changes.
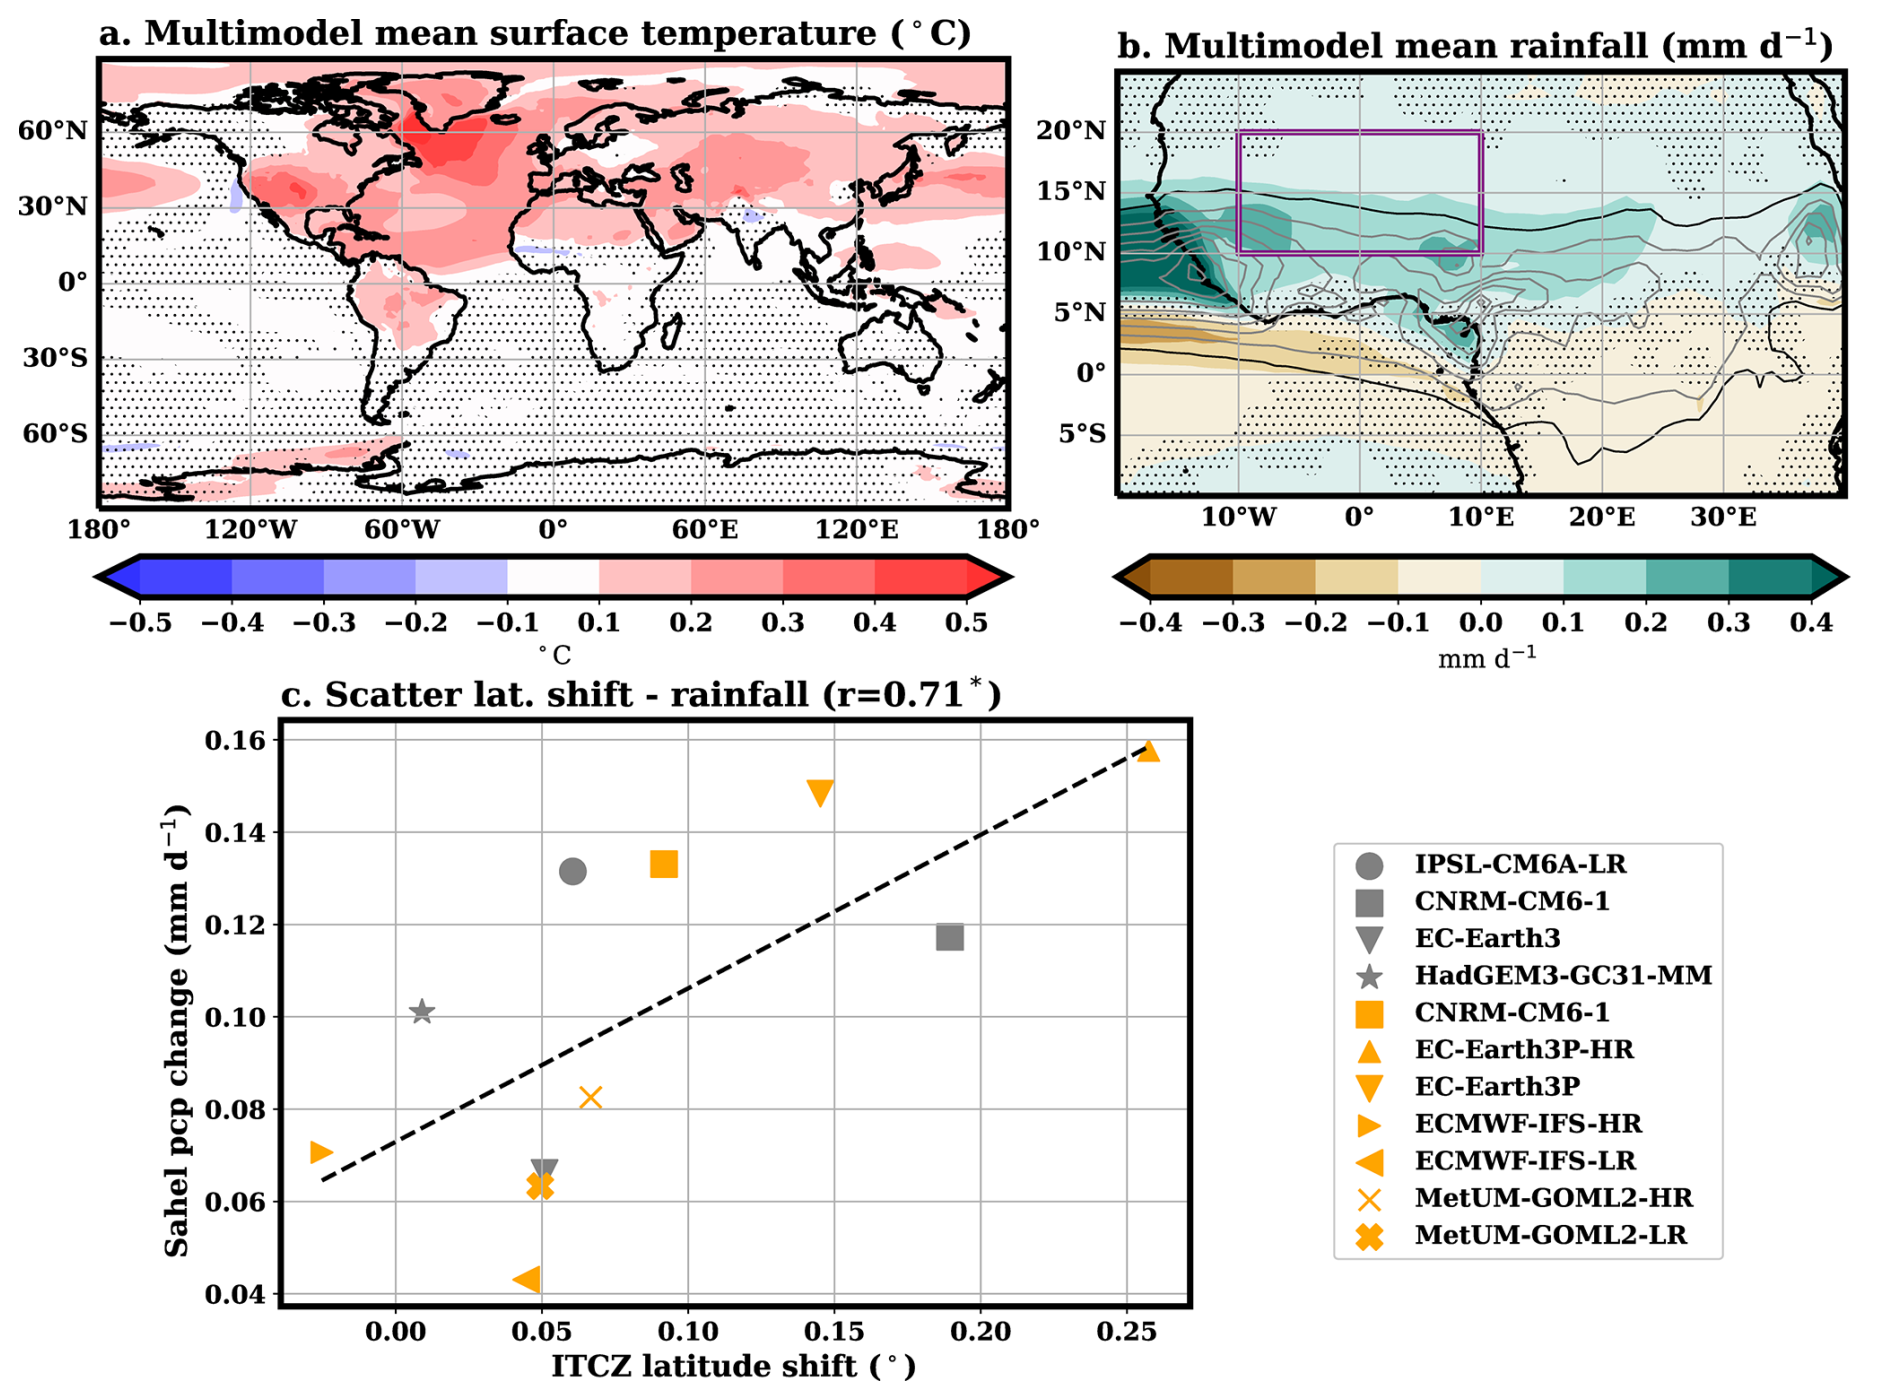
Figure 2Multimodel mean AMV+ minus AMV− change in JAS for: (a) surface temperature (°C) and (b) rainfall over West Africa (mm d−1). Dots mark regions where less than 80 % of the models (less than 9 out of 11) agree on the sign of changes. Contours in panel (b) show multimodel mean JAS rainfall (grey contours are drawn every 2 mm d−1 with the starting black contour at 2 mm d−1). (c) Scatter plot of Sahel (10° W–10° E, 10–20° N, see purple box in panel b) rainfall change as a function of the ITCZ latitude shift (°) averaged over the 10° W–10° E longitude range. The dashed line shows the linear regression fit, and the correlation coefficient is shown in the title. Correlations are marked with one asterisk if they are statistically significant at the level of α=0.05 when taking all the models as independent samples. Two asterisks are used if correlations are statistically significant when lowering the number of independent samples to 6. For the models following the PRIMAVERA protocol (marked with orange symbols in the scatter plot), only half the anomalies are shown.
In agreement with earlier work (e.g. Folland et al., 1986; Knight et al., 2006; Zhang and Delworth, 2006; Mohino et al., 2011; Ting et al., 2011; Martin et al., 2014; Martin and Thorncroft, 2014; Villamayor et al., 2018; Monerie et al., 2019b; Hodson et al., 2022; Mohino et al., 2024), over West Africa, the positive phase of the AMV leads to increased rainfall over the continent, strongest along the western coast, and over the Atlantic north of 5° N (Fig. 2b). Negative precipitation anomalies occur to the south of the main convective regions. Models show high consistency in the positive rainfall response over the Sahel but larger uncertainty over the Guinea Gulf coastal regions west of 0° E (Fig. 2b). On average, models suggest an increase of in JAS rainfall over the Sahel, corresponding to approximately 5 % of the climatological mean.
Increases in Sahel rainfall can arise from an intensification and/or a northward shift of the main rainband. The meridional dipole of precipitation anomalies in Fig. 2b is suggestive of a northward displacement of the ITCZ. Most models indeed show such a northward ITCZ shift over West Africa (Fig. 2c), with a multimodel mean estimate of . Moreover, the intermodel spread in the magnitude of this shift is positively associated with the spread in Sahel rainfall changes, indicating that models simulating a stronger northward ITCZ shift tend to produce larger rainfall increases over the Sahel.
To further evaluate if the rainfall response is better interpreted as an intensification or a latitudinal shift, we decompose rainfall changes averaged in the 10° W–10° E longitude sector into symmetric and antisymmetric components relative to the latitude of maximum climatological rainfall (Fig. 3a). For the multimodel mean, 70 % of the changes in rainfall over Sahel latitudes are explained by the antisymmetric component (Fig. 3b), supporting a dominant contribution from a northward displacement of the precipitation pattern. At the individual model level, results are more disparate, with five models showing a dominance of the antisymmetric component and four a dominance of the symmetric component, consistent with an intensification of the mean precipitation pattern. The intermodel spread of changes over the Sahel is positively correlated with both components (Fig. 3c and d), which is expected since their sum represents the total change. However, the correlation with the symmetric component is weak and not statistically significant, while it is stronger and statistically significant for the antisymmetric one.
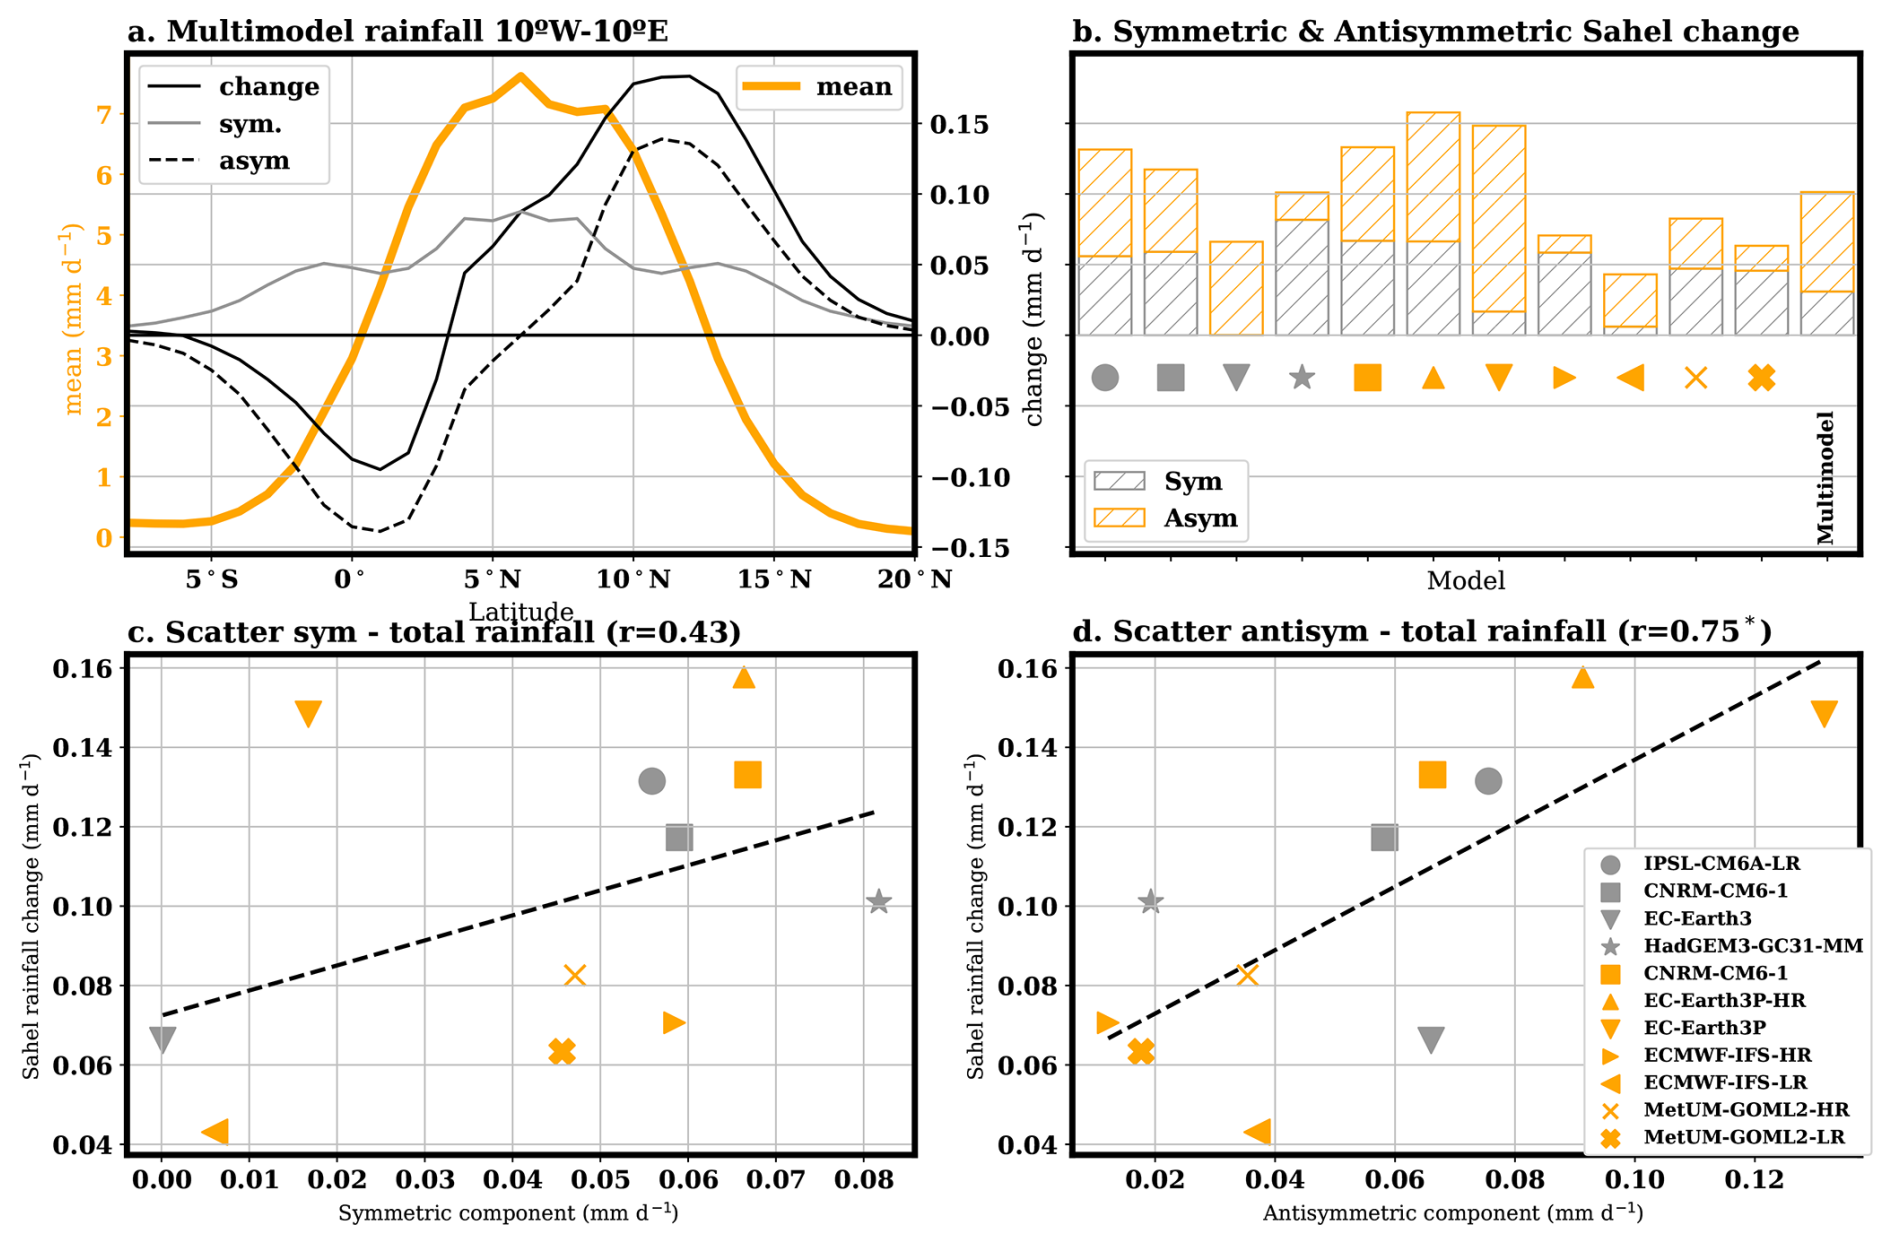
Figure 3Decomposition of rainfall changes into symmetric and antisymmetric components. (a) Multimodel mean climatology of rainfall in JAS averaged between 10° W and 10° E (orange, left axis, mm d−1) and AMV+ minus AMV− change (black continuous line, right axis, mm d−1). The change has been decomposed into symmetric (grey line, right axis) and antisymmetric (dashed line, right axis), relative to the maximum climatological value. (b) Symmetric and antisymmetric components of AMV+ minus AMV− average rainfall change in the Sahel box (see purple box in Fig. 2b) in JAS for all models and the multimodel mean (mm d−1). (c, d) show scatter plots of rainfall change in the Sahel box as a function of its symmetric and antisymmetric components, respectively (mm d−1). For the models following the PRIMAVERA protocol (marked as orange symbols), only half the anomalies are shown. In the scatter plots, the dashed line shows the linear regression fit, and the correlation coefficient is shown in the title. Correlations are marked with one asterisk if they are statistically significant at the level of α=0.05 when taking all the models as independent samples. Two asterisks are used if correlations are statistically significant when lowering the number of independent samples to 6.
In summary, in response to the positive AVM phase, models simulate an enhancement of Sahel rainfall, arising from both an intensification and a northward shift of the main rainband. The northward displacement dominates the mean response and also helps explain the intermodel spread in total rainfall changes.
3.3 Large-scale mechanism driving changes in Sahel rainfall
As shown above, the response of Sahel rainfall to a positive phase of the AMV is dominated by a northward shift of the ITCZ. The energetic framework has established a clear link between similar ITCZ shifts and changes in the cross-equatorial atmospheric energy transport, modulated by the inverse of the net energy input into the atmosphere (NEI) in the equatorial region (Donohoe et al., 2014; Adam et al., 2016a, b, 2019; Shekhar and Boos, 2017). It is therefore of interest to investigate whether the identified rainfall changes at Sahel longitudes are related to corresponding changes in cross-equatorial energy transport and equatorial NEI modifications. To this aim, Fig. 4a shows NEI into the atmosphere and the divergent component of the column-integrated total MSE flux (〈uh〉+, arrows). In response to a positive AMV, changes in equatorial NEI at Sahel longitudes are small (Fig. 4a) and show no consistent alignment with Sahel rainfall changes (not shown). Conversely, a robust anomalous southward cross-equatorial column-integrated MSE flux develops in the Atlantic and along African longitudes (〈vh〉+, with meridional wind v, Fig. 4b), and is also observed at the global scale in the zonal mean (Fig. S4). Provided gross moist stability does not change (Kang et al., 2009), the zonally averaged southward energy transport is realised through a northward displacement of the ascending branch of the Hadley circulation (Donohoe et al., 2014). The simulated increase in Sahel rainfall and associated ITCZ northward shift together with the anomalous southward energy transport at the Sahel longitudes are consistent with the zonally averaged paradigm, suggesting sector-mean zonal energy fluxes are of second-order relevance (Adam et al., 2016b).
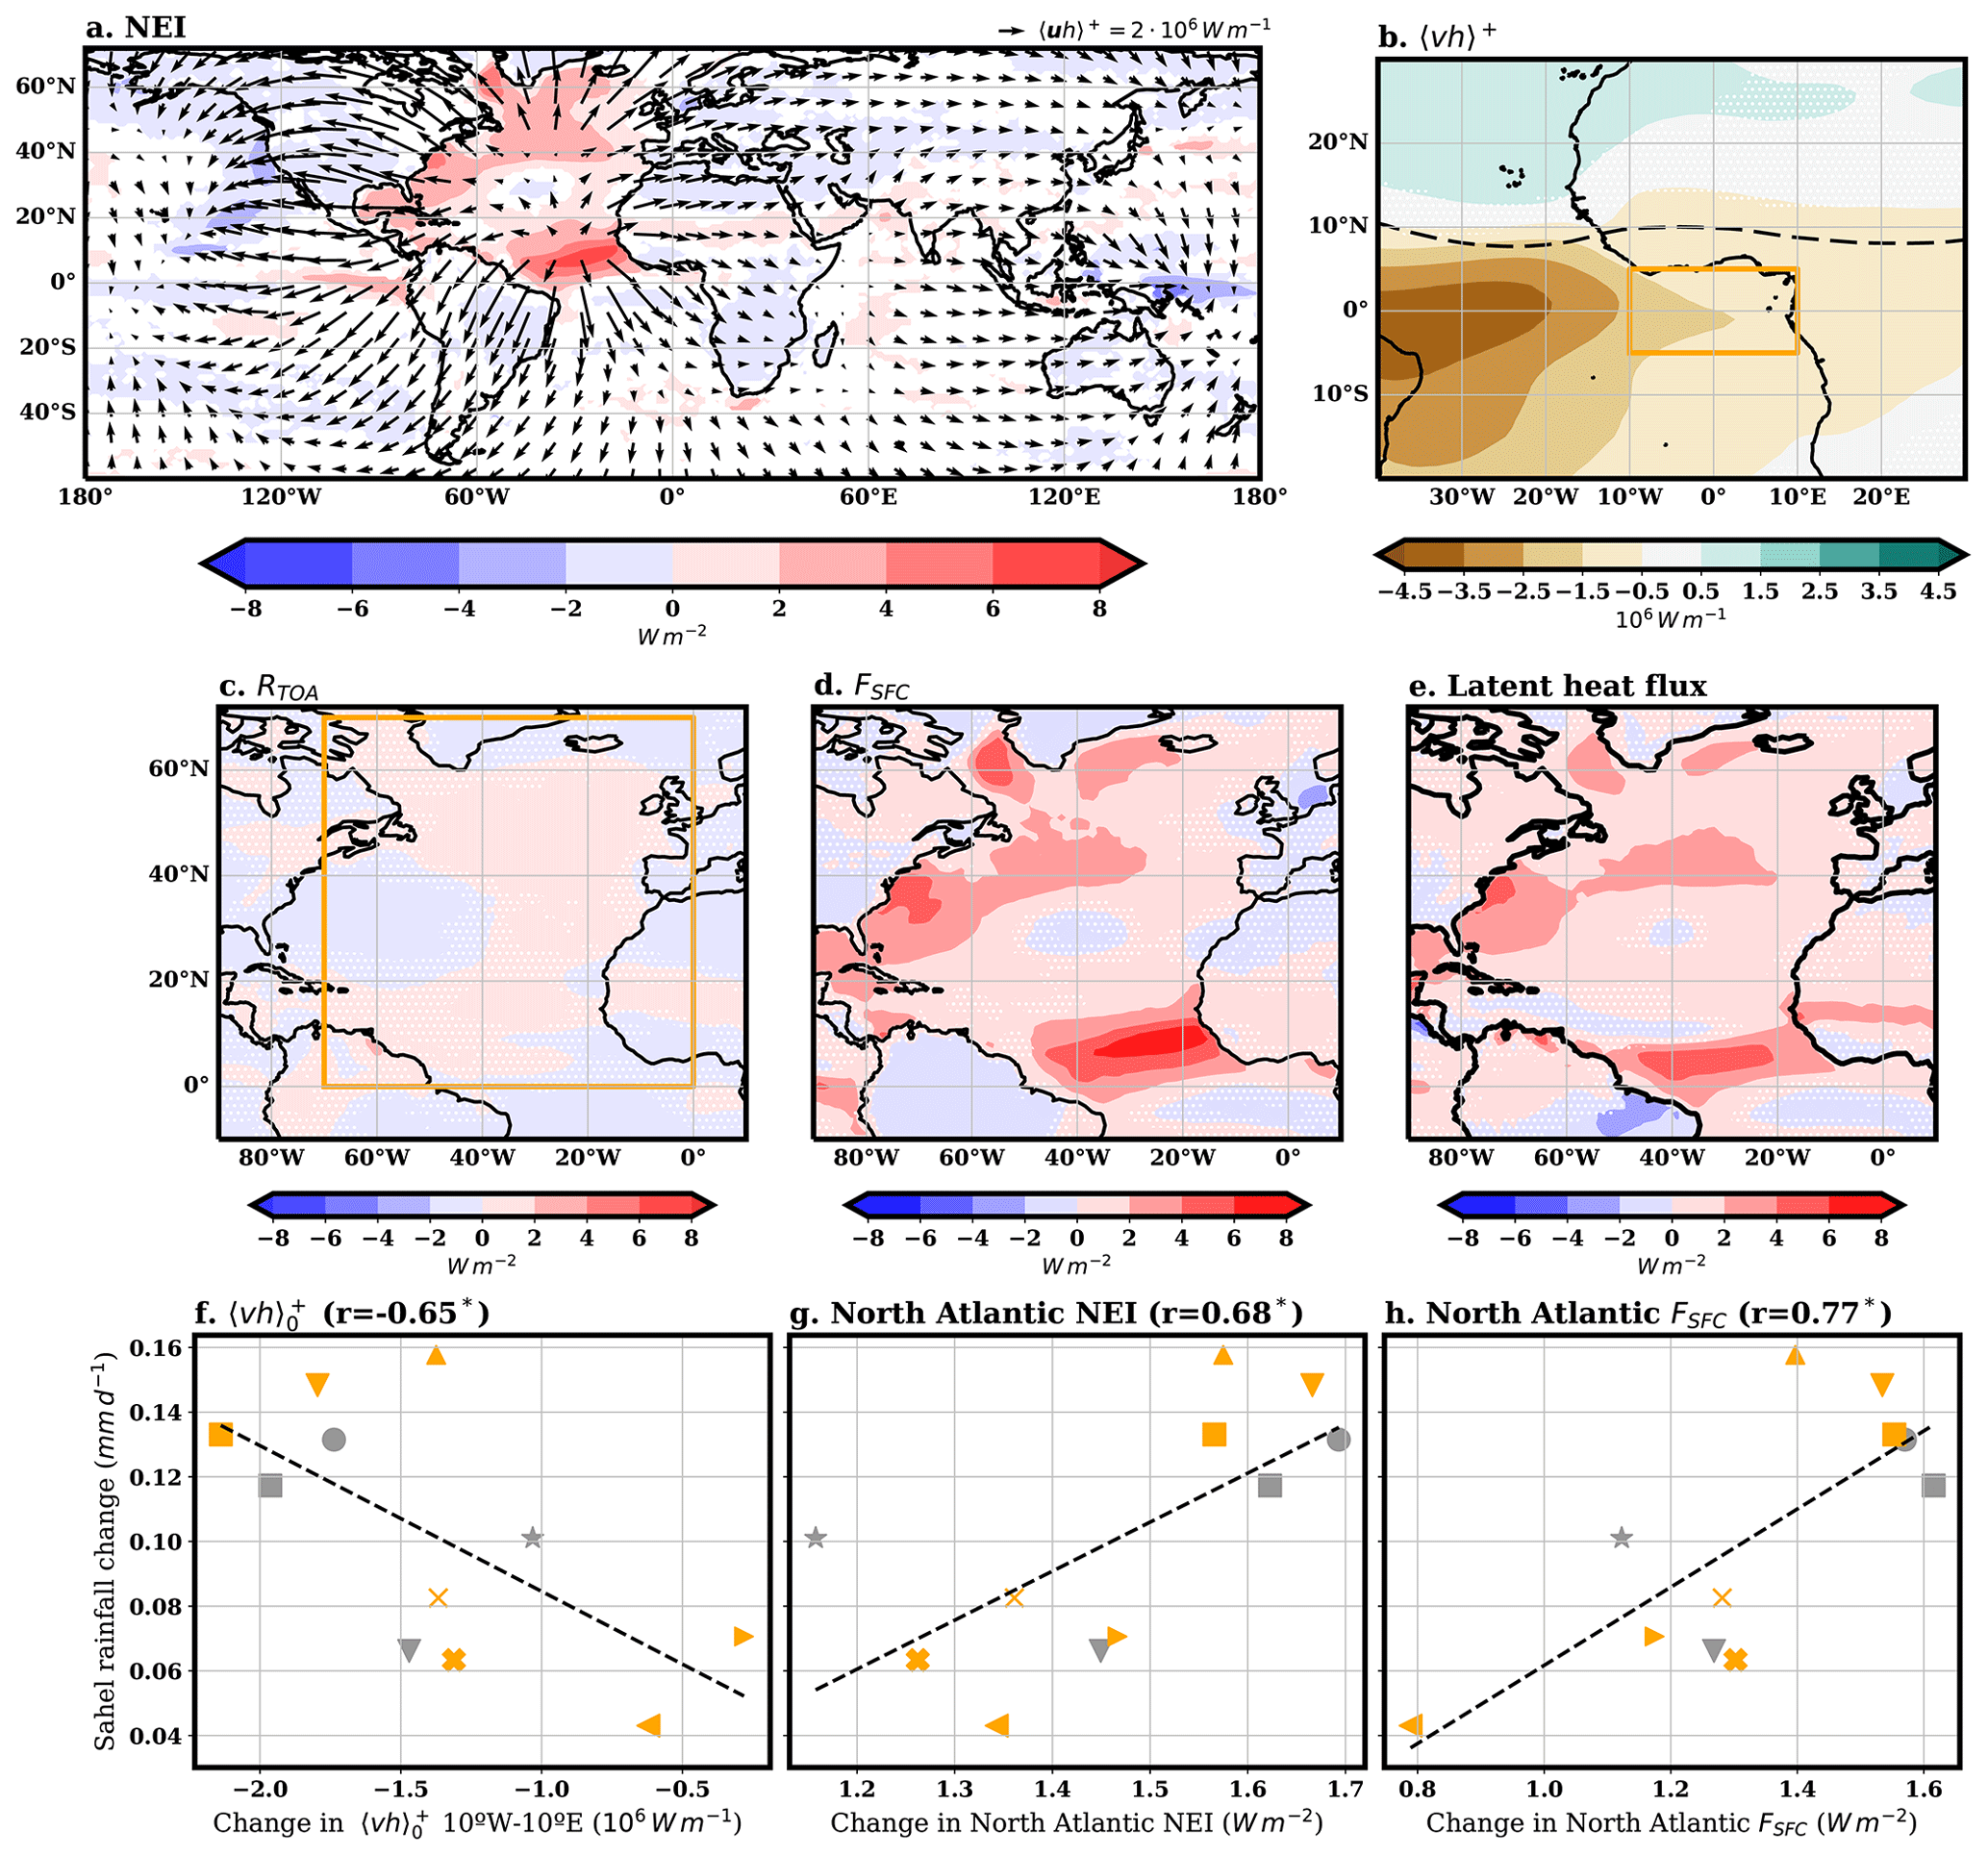
Figure 4Multimodel average changes in AMV+ minus AMV− in JAS for: (a) net energy input (NEI) into the atmospheric column (W m−2, shaded) and associated divergent component of the column integrated MSE flux (〈uh〉+, 106 W m−1, arrows); (b) meridional component of the divergent column integrated MSE flux (〈vh〉+, with meridional wind v, 106 W m−1); (c) energy imbalance at TOA (RTOA, W m−2); (d) energy imbalance at the surface (FSFC, W m−2); (e) latent heat flux at surface (W m−2). For NEI and the energy imbalances, positive values indicate energy gain for the atmosphere. Scatter plots of averaged Sahel rainfall change (mm d−1) and: (f) strength of the divergent component of the column integrated meridional MSE flux at equatorial latitudes averaged over the Sahel longitudes (, 106 W m−1, see orange box in panel b); (g) NEI averaged over the North Atlantic (W m−2, see orange box in panel c); (h) surface energy imbalance averaged over the North Atlantic (FSFC, W m−2). For panel (a), anomalies are only shown in regions where at least 80 % (9 out of 11) of simulations agree on their sign. Dots in panels (b)–(e) mark regions where fewer than 80 % of the models agree on the sign of changes. For the models following the PRIMAVERA protocol (marked with orange symbols in the scatter plot), only half the anomalies are shown. The legend for the symbols in the scatter plots is the same as in Fig. 2c. In the scatter panels, the dashed line shows the linear regression fit, and the correlation coefficient is shown in the title. Correlations are marked with one asterisk if they are statistically significant at the α=0.05 level when considering all models as independent samples. Two asterisks are used if correlations are statistically significant when lowering the number of independent samples to 6.
At Sahel longitudes (10° W–10° E, yellow box in Fig. 4b), the multimodel mean response in the meridional component of the column-integrated divergent MSE flux across the equator is . Combining this with our previous estimate of the mean ITCZ shift at these longitudes yields a displacement of per each W m−1. When scaled to the entire latitude circle, this corresponds to ° per PW, an estimate in close agreement with those reported by Donohoe et al. (2014) for the observed interannual variability of the zonally averaged ITCZ position.
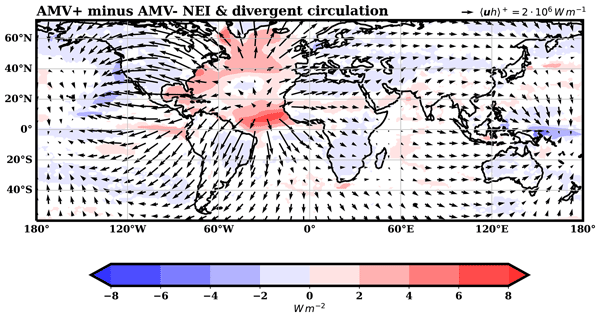
The southward cross-equatorial energy transport arises as a response to the enhanced net input of energy into the atmosphere in the North Atlantic (Fig. 4a, shaded). This energy excess cannot be stored locally and results in large-scale atmospheric circulation adjustments that generate the divergent MSE flux seen in Fig. 4a. These adjustments also include changes in NEI in regions remote from the primary forcing, such as the Atlantic south of the equator, where negative NEI anomalies develop (Fig. 4a) and further strengthen the inter-hemispheric energy gradient. Decomposition of the NEI excess into individual contributions from TOA and surface energy imbalances (Fig. 4c and d) shows that the main contribution comes from the surface imbalance, which is in turn principally driven by the latent heat flux (Fig. 4e). The mean NEI anomaly in the North Atlantic (see box in Fig. 4c) is , 85 % of which originates from latent heat flux changes. A notable exception to the dominance of latent heat fluxes in the NEI pattern is the northern flank of the tropical NEI maximum (approximately between 60–20° W and 10–20° N). In this specific region, the positive surface energy anomaly is primarily due to cloud-radiative feedbacks linked to the northward ITCZ shift (Fig. S5).
Regarding the intermodel spread, the scatterplot in Fig. 4f suggests that models with a stronger southward energy transport response also exhibit larger increases in Sahel precipitation. A similar relationship emerges when comparing Sahel rainfall changes with the NEI or surface energy imbalance averaged over the North Atlantic, where strong NEI anomalies develop (Fig. 4g and h): models with higher atmospheric energy input through surface fluxes tend to produce stronger southward cross-equatorial energy transport and greater Sahel rainfall anomalies. Note that both the tropical and extratropical portions contribute to the North Atlantic NEI, and their combination explains more inter-model spread of Sahel rainfall changes than either contributor separately (Fig. S6).
To further analyse the changes in surface latent heat flux, we apply the bulk aerodynamic formula (Hartmann, 2016), whereby the latent heat flux (LE) can be expressed as:
where ρ is the air density, CDE is the aerodynamic transfer coefficient for moisture, Ur is the mean wind speed at the standard height, qs is the saturation specific humidity, and RH is the relative humidity. To a first-order approximation, we expect the fractional change in latent heat flux (, with δLE denoting the AMV+ minus AMV− anomalies of latent heat flux and LE the estimated climatological value) to be linearly related to the fractional change in saturated specific humidity (), to the fractional change in mean wind speed (), and to the negative fractional change in relative humidity . In Fig. 5, we present these terms for the surface, except for the wind speed, which is estimated from monthly mean zonal and meridional components at 1000 hPa, and RH, which is calculated as the ratio between near-surface specific humidity and saturation specific humidity at the surface. These represent approximations to near-surface wind speed and relative humidity.
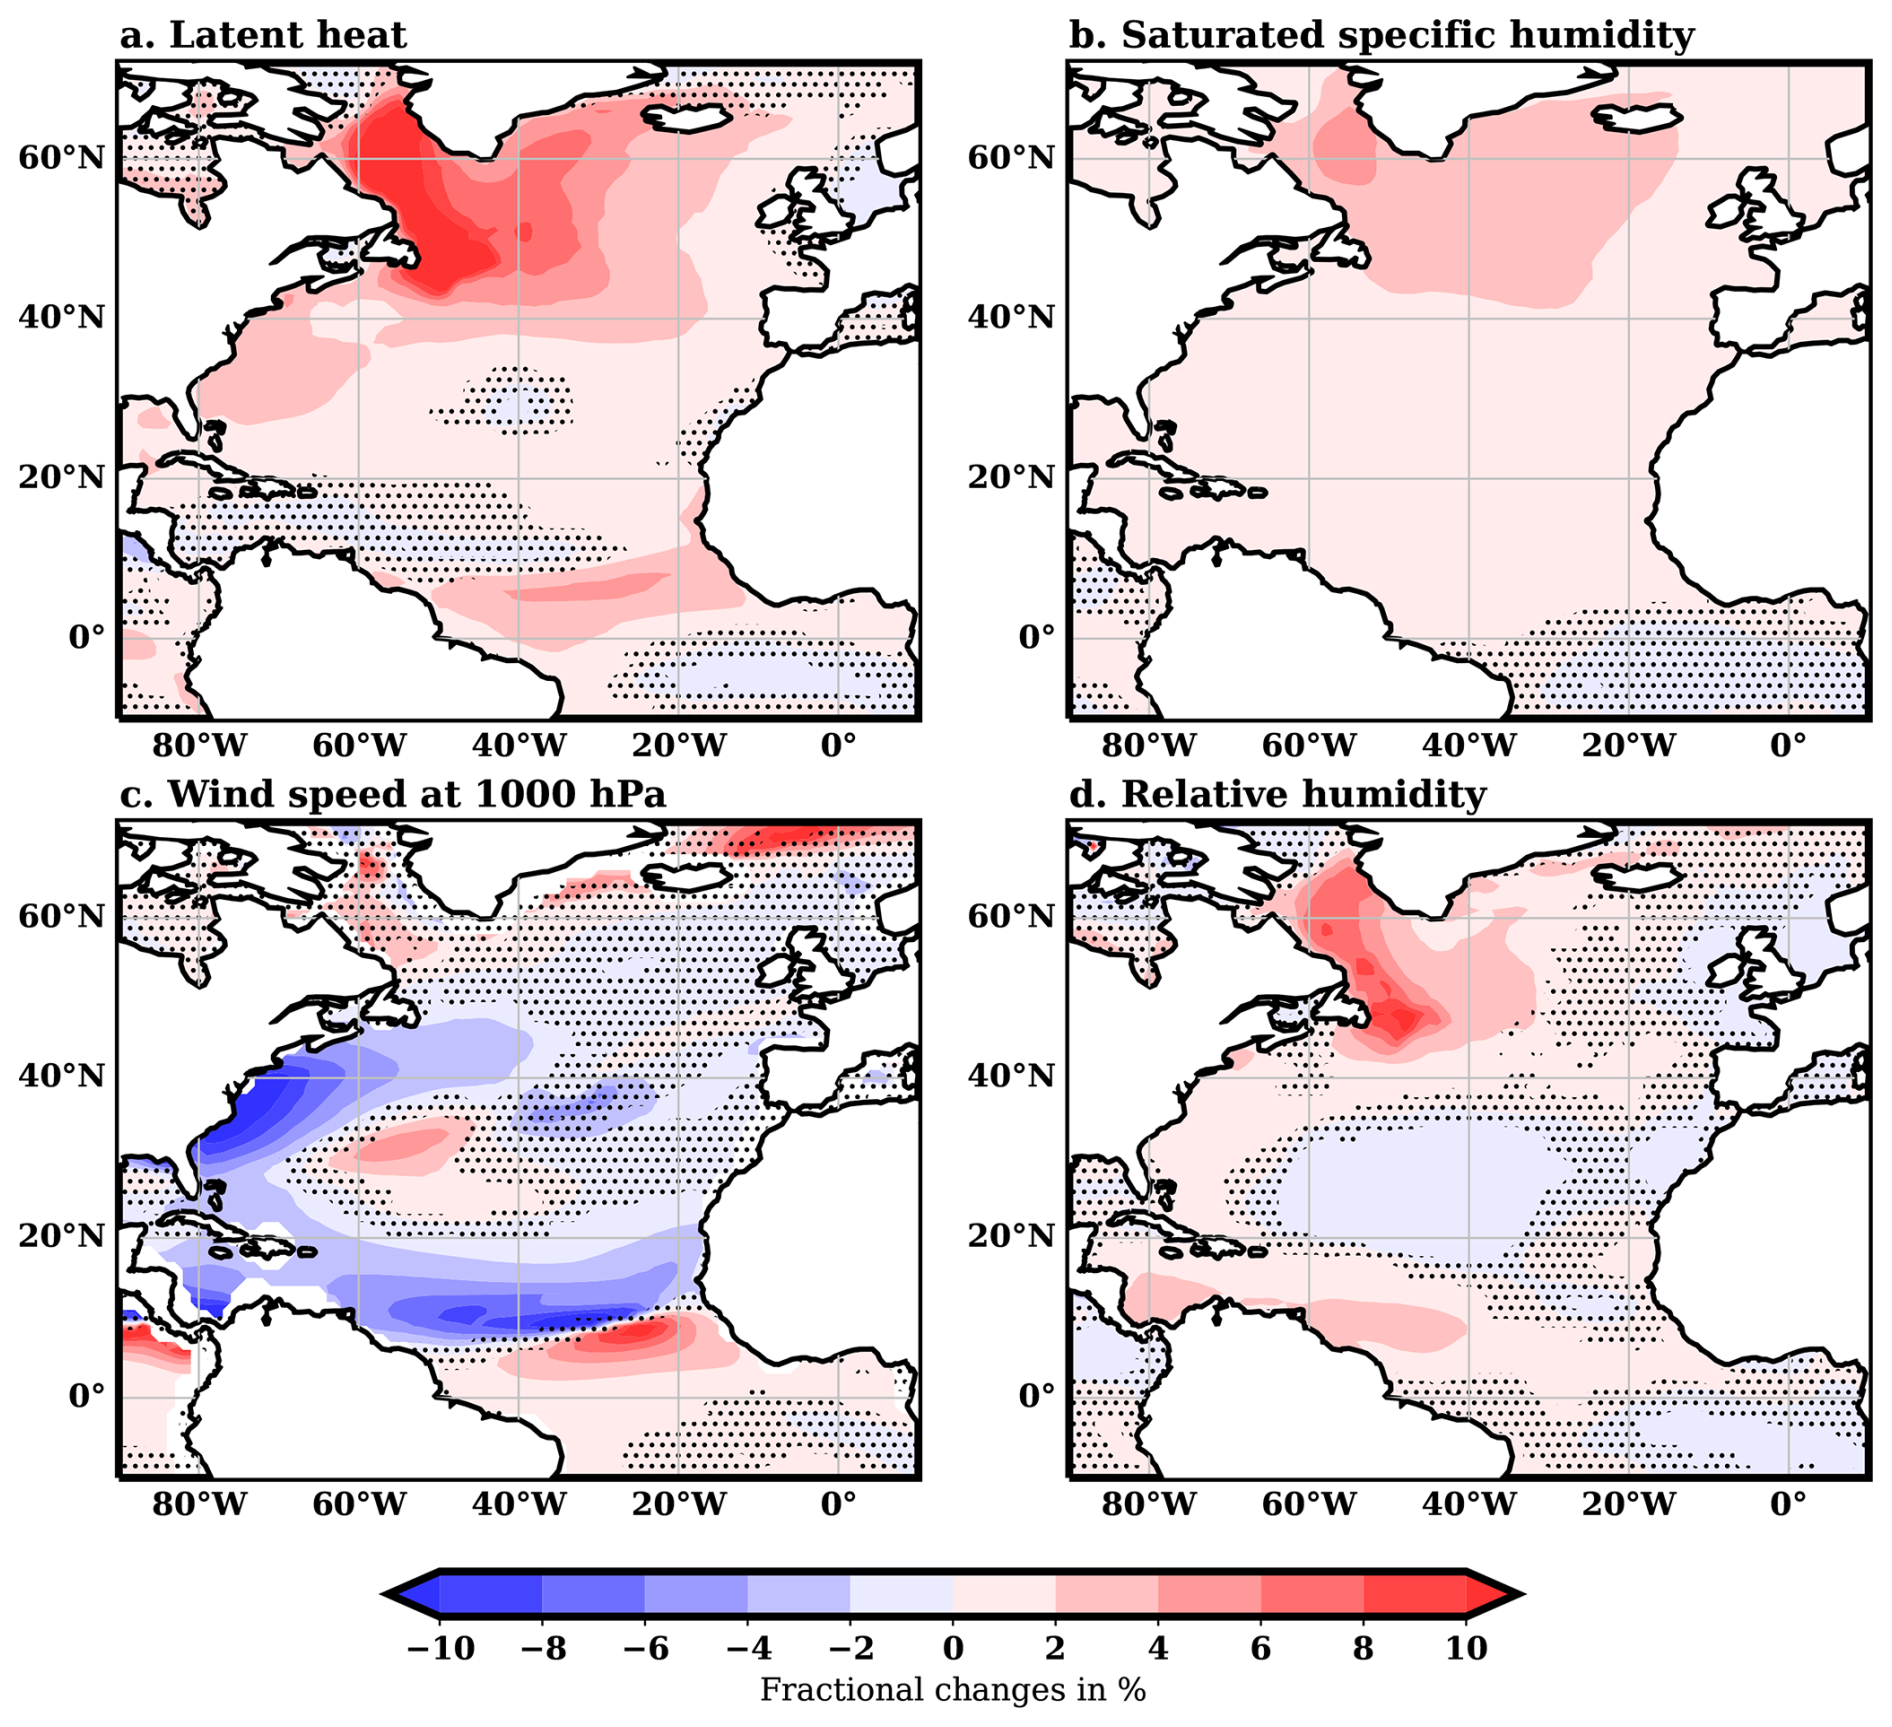
Figure 5Multimodel mean of fractional changes in AMV+ minus AMV− in JAS for: (a) latent heat; (b) saturation specific humidity at surface; (c) wind speed at 1000 hPa; and (d) near-surface relative humidity (plotted as ). Relative humidity is calculated using near-surface specific humidity and the saturated specific humidity at the surface. The latter is estimated over the ocean by first calculating the saturation vapour pressure based on surface temperature (WMO, 2024) and then transforming it into saturation specific humidity, taking into account sea level pressure. Note that ECMWF-IFS-HR and ECMWF-IFS-LR models were not used for surface calculations since they did not provide near-surface specific humidity. Likewise, EC-Earth3 was not used for wind speed at 1000 hPa. Fractional changes are expressed relative to the climatological values at each grid point, which are calculated as half the sum of AMV+ and AMV− simulations. Dots mark regions where fewer than 80 % of the models agree on the sign of changes, and values over land are masked out.
In response to the imposed SST restoring, the warm SST anomalies over the North Atlantic (Fig. 2a) lead to an overall increase in saturation specific humidity (Fig. 5b). This would, in isolation, favour enhanced latent heat flux from the surface over the North Atlantic. However, the anomalous spatial patterns in Fig. 5a and b differ markedly. Over the tropical north Atlantic, between the equator and 20° N, where fractional changes in qs are nearly uniform (Fig. 5b), latent heat flux fractional anomalies show a dipole (Fig. 5a), with weak and negative values in the tropical Atlantic between 10 and 20° N and west of 30° W, and strong and positive values to the south of 10° N. These differences suggest the influence of feedbacks that modulate the initial response to the imposed SST anomalies (Shekhar and Boos, 2016). Because the atmosphere is decoupled from the ocean within the SST-restored region, such feedbacks must be of atmospheric origin. Specifically, the northward shift of the Atlantic ITCZ following the AMV+ forced energy surplus in the North Atlantic would reduce the northerly winds to the north of the climatological ITCZ (approximately located at 10° N) and enhance the southerly winds to the south. This yields a dipole in surface wind speed anomalies (negative north of 10° N, positive to the south; Fig. 5c), which in turn suppresses latent heat flux to the north and increases it to the south, consistent with the pattern in Fig. 5a. Note that in this region, the experimental setup prevents full atmosphere–ocean coupling, such that positive and negative Wind-Evaporation-SST feedbacks (Karnauskas, 2022; Ganguly et al., 2024) are hindered.
In addition, over the North Atlantic subpolar region, changes in relative humidity further enhance latent heat flux into the atmosphere (Fig. 5d). This contribution comes from a reduction in the northwestern Atlantic RH (note the negative sign of the RH term in the bulk formula), as the positive anomaly in near-surface specific humidity (not shown) is smaller than the saturated one. This likely reflects a circulation-driven export of moist air away from the North Atlantic subpolar region, redistributing the excess moisture generated by warmer SSTs.
In summary, our results show that in response to the positive AMV phase, enhanced turbulent latent heat fluxes from the North Atlantic increase the atmospheric energy input. The excess energy is then exported from the North Atlantic by anomalous atmospheric circulation patterns, which in turn feed back onto the surface fluxes. The resulting steady state is characterised by a southward cross-equatorial energy flux across the Atlantic and African longitudes. In the African sector, this flux is accomplished by a northward shift of the monsoonal Hadley-like circulation's ascending branch and is thus associated with a corresponding northward shift of the main rainfall band, ultimately leading to enhanced rainfall over the Sahel.
3.4 Changes in the monsoon structure and dynamics
The large-scale responses to the imposed AMV SST anomalies in the North Atlantic indicate modifications of the West African monsoon that extend beyond changes in seasonal rainfall amounts. The main changes in the monsoon circulation are summarised in Fig. 6. Close to the surface, during the positive phase of the AMV, models consistently show a stronger low-level westerly flow that penetrates further north (Fig. 6a). The magnitude of these anomalies is weak, consistent with the models' general underestimation of the AMV’s impact on Sahel rainfall (Mohino et al., 2024). Changes in the low-level meridional wind reveal a weakening of the southerly winds south of 13° N (Fig. 6b), which enhances low-level wind convergence south of 10° N (Fig. 6c), in the region of mean climatological ascent (Thorncroft et al., 2011; Nicholson, 2013). Positive meridional wind anomalies peak between 15 and 20° N (Fig. 6b), altering the horizontal wind divergent field by weakening and shifting northward the lower branch of the shallow meridional circulation (SMC) (Fig. 6c).
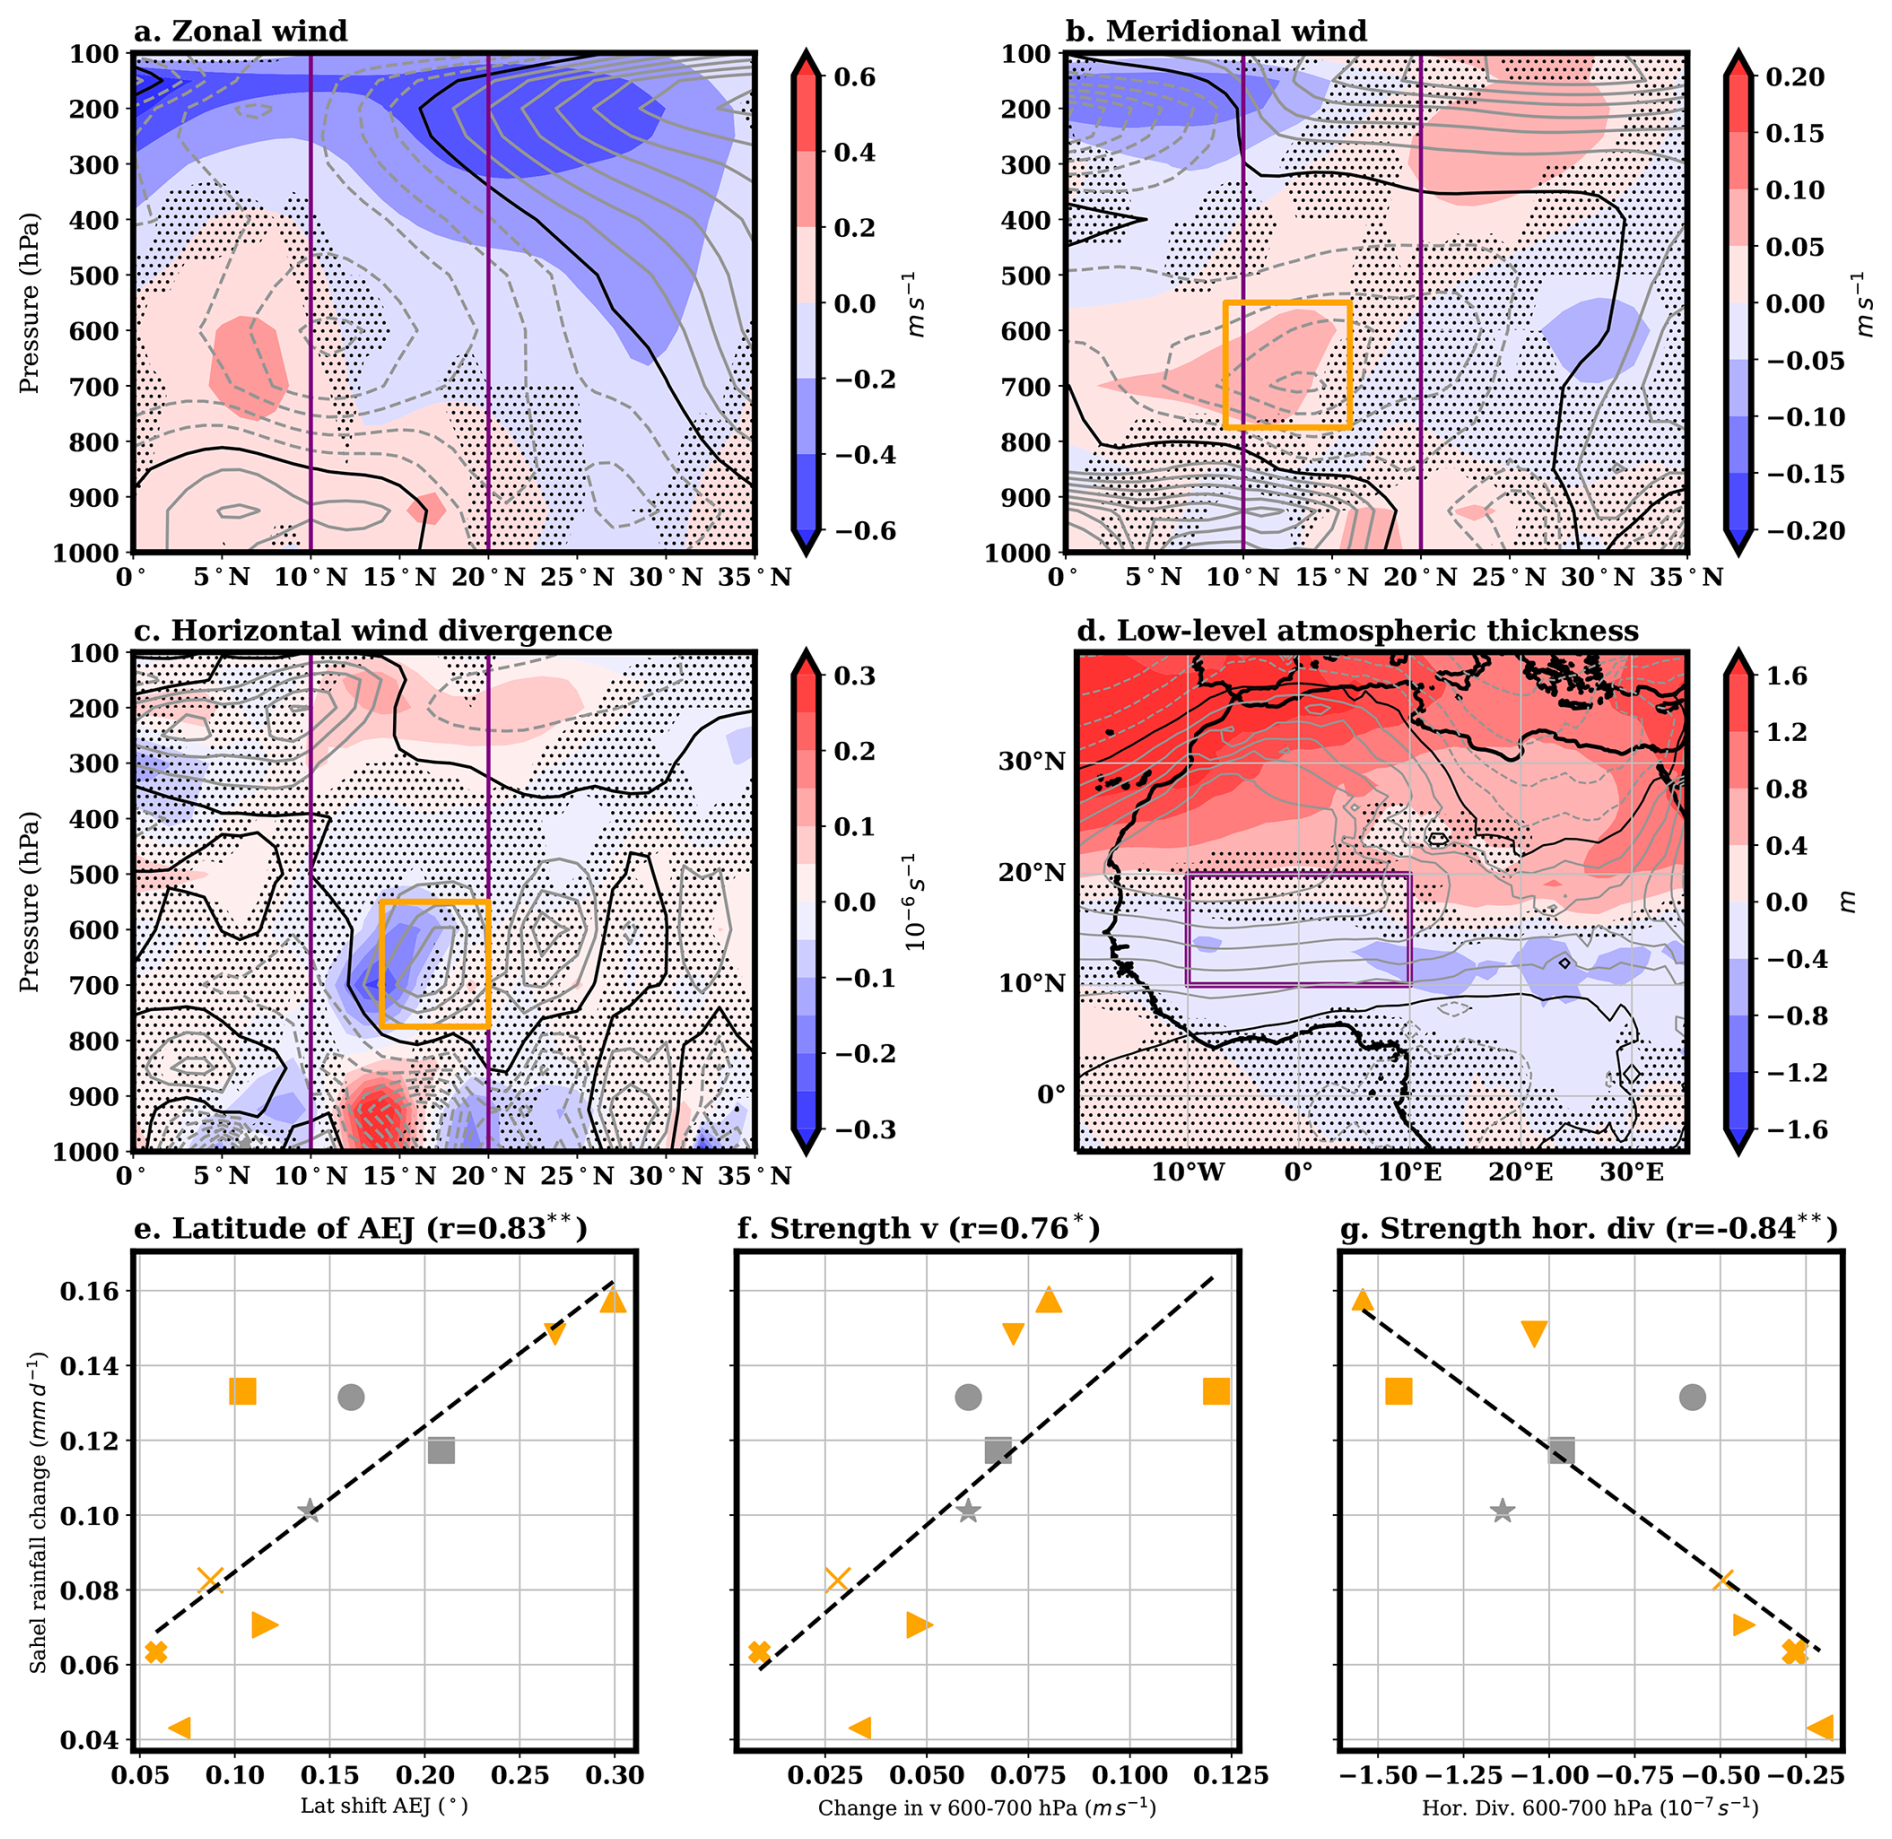
Figure 6Multimodel average changes (shaded) in AMV+ minus AMV− in JAS and climatological values (gray contours, solid for positive values and dashed for negative ones, black contours mark zero isoline) of: (a) zonal wind averaged between 10° W and 10° E (m s−1, contours drawn every 2 m s−1); (b) meridional wind averaged between 10° W and 10° E (m s−1, contours drawn every 0.5 m s−1); (c) divergence of horizontal wind averaged between 10° W and 10° E (, contours drawn every ); (d) low-level atmospheric thickness with respect to average tropical values (m, contours drawn every 10 m). Purple vertical lines in panels (a)–(c) mark the Sahel latitudes. Scatter plots of rainfall change (mm d−1) averaged over the Sahel box (10° W–10° E, 10–20° N, see purple box in panel d), (e) the shift in the latitude of AEJ (°); (f) the change in the northerly meridional wind (m s−1) averaged in the 10° W–10° E, 9–16° N box and between 600 and 700 hPa pressure levels (see orange box in panel b); (g) the change in strength of the horizontal wind divergence () averaged in the 10° W–10° E, 14–20° N box and between 600 and 700 hPa pressure levels (see orange box in panel c). For the models following the PRIMAVERA protocol (marked with orange symbols in the scatter plot), only half of the anomalies are shown. The legend for the symbols in the scatter plots is the same as in Fig. 2c. In the scatter plots, the dashed line shows the linear regression fit, and the correlation coefficient is shown in the title. Correlations are marked with one asterisk if they are statistically significant at the α=0.05 level when considering all models as independent samples. Two asterisks are used if correlations are statistically significant when lowering the number of independent samples to 6.
In the upper troposphere, the Tropical Easterly Jet (TEJ) strengthens, accompanied by enhanced northerlies associated with the upper branch of the Hadley cell (Fig. 6a and b). The upper-level horizontal divergence is also enhanced, especially on its northern edge between 10 and 15° N (Fig. 6c), suggesting a strengthening and northward displacement of the main ascent region, consistent with the rainfall anomalies.
In the mid and lower troposphere, the low-level atmospheric thickness anomalies point to an enhanced and northward-shifted SHL (Lavaysse et al., 2010), with positive anomalies north of 20° N and negative ones to the south (Figs. 6d, S7 and S8). These negative anomalies are linked to the evaporative cooling induced by increased soil moisture following increased precipitation (see Fig. S9). The resulting evaporative cooling modifies the meridional temperature gradients, reducing them south of the climatological maximum and strengthening them to the north, which favours a northward shift of the African Easterly Jet (AEJ), consistent with thermal wind balance (Cook, 1999). Indeed, between 800 and 500 hPa, cyclonic zonal wind anomalies south of 20° N indicate a northward shift of the AEJ (Fig. 6a). The AEJ also shows a slight weakening (see Fig. S10). At mid levels, the upper branch of the SMC, located between 15 and 20° N and 800–600 hPa (see climatological contours showing divergence in Fig. 6c), shows a consistent weakening across models (see Fig. S11). This is reflected in reduced mid-level divergence and a weaker return flow south of 15° N (orange boxes in Fig. 6b and c).
Regarding the intermodel spread, the scatter plots shown in Fig. 6e–g suggest that the changes at mid levels are strongly related to the changes in Sahel rainfall. Models with stronger rainfall change over the Sahel are also those that show a stronger northward shift of the AEJ (Fig. 6e). We speculate this link to be a consequence of the surface response to enhanced rainfall (see Fig. S8): increased soil moisture in the latitudinal band between 10 and 15° N following enhanced precipitation promotes evaporative cooling of the surface by changing the balance between latent and sensible heat fluxes, which alters the surface temperature latitudinal gradient and, through thermal wind balance (Cook, 1999), enhances the AEJ to the north and reduces it to the south. In addition, models that exhibit a weaker shallow meridional circulation, characterised by a weaker mid-level return flow and weaker mid-level divergence close to 15° N, tend to show a stronger rainfall change in the Sahel (Fig. 6g, f). Conversely, the intermodel spread of neither the strength nor of the shift of the SHL structure is related to change in Sahel rainfall (see Fig. S7 and S8). The intermodel spread in rainfall changes is also not related to the shift of the divergence by the SMC upper branch (see Fig. S11).
The preceding analysis suggests, consistent with Shekhar and Boos (2017), a strong coupling between enhanced Sahel rainfall and a weakened return flow of the SMC at mid-levels. Such a weakening reduces the intrusion of dry air into the Sahel, thereby modifying horizontal advection of moist static energy in the region. To further investigate this mechanism, we examine the column-integrated atmospheric energy balance (Eq. 1). Taking time averages, again assuming negligible atmospheric energy storage () and decomposing the total transport in mean and eddy components, the energy budget can be written as:
where overbars denote time averages, and primes denote deviations from the time averages. Together with the continuity equation (, where ω is the vertical velocity in pressure coordinates), the second term on the left-hand side of Eq. (2) can be written as:
This provides the following expression for the column-integrated energy balance:
In most deep convective regions, including monsoon systems, the transient eddy term is small and the dominant balance is between positive and the MSE divergence by the vertical advection term () (Neelin and Held, 1987). In the Sahel monsoon, as shown by Hill et al. (2017), the horizontal advection term () is non negligible and in fact partly balances the positive through import of dry, and hence, lower-MSE air in the upper branch of the SMC.
Building on these ideas, in Fig. 7, we examine changes in the MSE export by the time-mean horizontal flow () over the Sahel. Climatologically, the export of MSE at mid-levels is dominated by the moisture advection term (, compare black and blue lines in Fig. 7a), due to northerly flow between 800 and 300 hPa (Fig. 6b) acting on a negative meridional moisture gradient (Fig. 7c, , blue line and axis), that is, by dry air advection by the upper branch of the SMC, in agreement with Hill et al. (2017). Temperature advection slightly counteracts this MSE export (Fig. 7a, , red line), since the same northerly flow also advects warmer air.
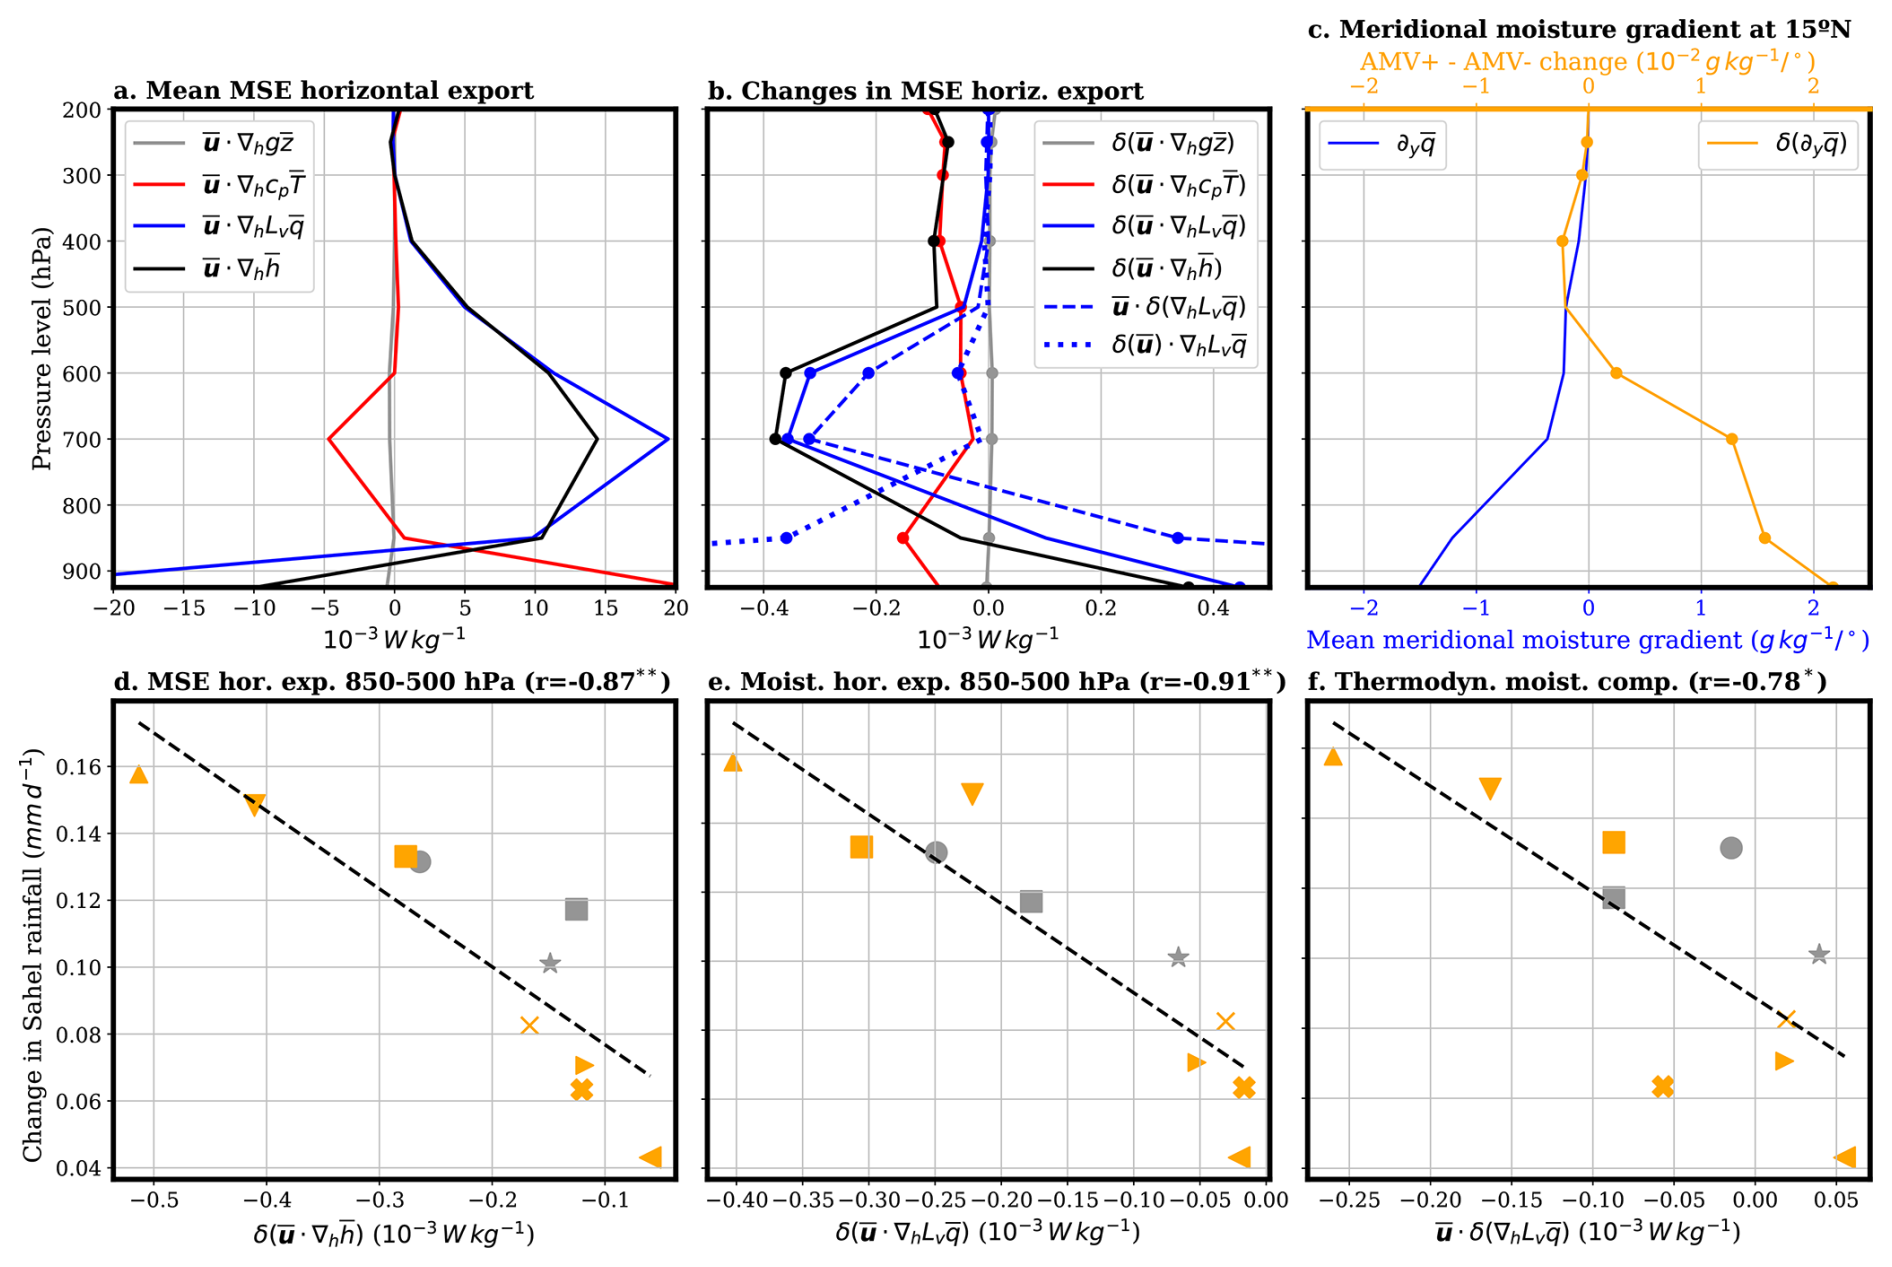
Figure 7(a) Climatological export of MSE by the time-mean horizontal flow (, black line) partitioned into the potential energy (, grey line), sensible (, red line), and latent enthalpy (, blue line) components averaged over the Sahel box (10° W–10° E, 10–20° N) for the multimodel mean. (b) AMV+ minus AMV− multimodel change in the export of MSE by the time-mean horizontal flow (, black) partitioned into the potential energy (, grey), sensible (, red), and latent enthalpy (, blue) averaged over the Sahel box. The change in latent enthalpy has been further decomposed into its thermodynamic (, blue dashed) and dynamic (, blue dotted) components. (c) Multimodel mean meridional gradient of the 10° W–10° E zonally averaged specific humidity (g kg−1 per degree) at 15° N (, blue) and AMV+ minus AMV− changes (, orange). Scatter plots of averaged Sahel rainfall change (mm d−1) and averages of changes over the Sahel box between 850 hPa and the 500 hPa levels of: (d) total export of MSE due to time-mean horizontal flow (); (e) MSE export due to horizontal moisture advection in MSE units (); and (f) its thermodynamic component also in MSE units (). Units for the energetic terms are . For the models following the PRIMAVERA protocol (marked with orange symbols), only half of the anomalies are shown. The legend for the symbols in the scatter plots is the same as in Fig. 2c. Dots in panels (b) and (c) mark changes for which at least 80 % of the models agree on the sign. In the scatter plots, the dashed line shows the linear regression fit, and the correlation coefficient is shown in the title. Correlations are marked with one asterisk if they are statistically significant at the level of α=0.05 when taking all the models as independent samples. Two asterisks are used if correlations are statistically significant when lowering the number of independent samples to 6.
In response to a positive phase of the AMV, models consistently show a reduction in MSE export at mid-levels due to weaker time-mean horizontal advection (Fig. 7b, , black line). Because changes in NEI over the Sahel are positive (Fig. 4a) and the transient eddy MSE flux divergence is small (e.g. Hill et al., 2017), this reduced horizontal export must be compensated by enhanced export through the divergent circulation. Consequently the vertical advection term () becomes more negative. Given the tropical MSE vertical structure, this implies a change from a shallower convection regime to a deeper convection regime with a first-baroclinic mode structure (see Fig. S12). This interpretation agrees with the horizontal divergence anomalies in Fig. 6c, which show reduced divergence at mid levels and stronger divergence aloft.
A decomposition of the change in the time-mean horizontal MSE export in temperature (), geopotential height () and moisture () components shows that the moisture advection term dominates (compare black and blue solid lines in Fig. 7b). Part of the reduced dry-air advection, and therefore the weaker MSE export, stems from the weakening of the meridional flow in the upper branch of the SMC (Fig. 7b, , blue dotted line), as positive meridional wind anomalies (Fig. 6b) act on the climatological negative meridional moisture gradient (Fig. 7c, blue line and axis). However, and consistent with Hill et al. (2017), the dominant contribution arises from thermodynamic changes (Fig. 7b, , dashed blue line) linked to changes in the moisture field itself. Under a positive AMV phase, and consistent with a stronger and more northward location of the rainfall band, the tropospheric moisture content increases across West Africa, especially at Sahel latitudes, peaking slightly north of 15° N in the lower troposphere (not shown). This moistening induces an anomalous positive meridional gradient of moisture in the Sahel (Fig. 7c, , orange line and axis). The climatological northerlies (contours in Fig. 6b) acting on this anomalous meridional gradient explain the negative values of the term in Fig. 7b (blue dashed line).
Regarding intermodel differences, the scatter plots in Fig. 7d–f suggest that changes in Sahel rainfall are strongly linked to mid-tropospheric MSE horizontal advection (, Fig. 7d), mainly through the thermodynamic moisture advection component (, Fig. 7f). Models exhibiting a stronger reduction in MSE export, through a greater decrease in dry air intrusion at mid levels (mainly mediated by modifications in the moisture profile), also simulate larger increases in Sahel rainfall. This relationship is consistent with the models that show greater decreases in mid-tropospheric horizontal divergence (Fig. 6f) indicating a weakening of the shallow convection regime.
In summary, a positive phase of AMV promotes a northward shift of the main monsoon circulation features, particularly the SHL and the AEJ. It also enhances low-level convergence near 10° N and divergence aloft, reinforcing the deep convection branch of the monsoon. While also shifting northward, the shallow meridional circulation weakens, reducing the intrusion of dry air into the Sahel main convective region at mid levels. This weakening not only occurs consistently across models but also scales with the magnitude of rainfall increase. The reduced mid-tropospheric dry-air intrusion lowers the MSE export by horizontal advection, which is then compensated by enhanced MSE export through the divergent circulation (Hill et al., 2017), ultimately supporting stronger precipitation. The dominant driver of the reduced horizontal MSE export is the thermodynamic component of the moisture advection, highlighting a strong coupling between moisture and circulation changes in the West African monsoon response to AMV.
In this work, we have analysed the impact of AMV on the WAM by comparing two sensitivity experiments (AMV+ and AMV−) conducted with different models under a common experimental framework. This framework restores the North Atlantic SSTs towards an idealised AMV pattern, which mitigates some of the limitations inherent to observational analyses, such as the short observational record, the co-existence of different sources of multidecadal variability, and the misrepresentation of Sahel multidecadal variability in current reanalyses (Berntell et al., 2018). It also avoids uncertainties associated with model-dependent SST patterns linked to AMV in fully coupled ocean–atmosphere simulations (Martin et al., 2014). Nevertheless, our approach is not exempt from its own limitations.
The SST restoring, imposed in the North Atlantic, effectively decouples the ocean from the atmosphere in that region. Aside from potentially destabilising the climate system in two models (MPI-ESM1-2-HR and MPI-ESM1-2-XR), this decoupling may alter the surface energy exchanges, particularly in the tropical and subtropical North Atlantic (O’Reilly et al., 2023). On the one hand, the positive surface heat flux anomalies shown in Fig. 4d would thermodynamically cool the tropical SSTs, thereby dampening these fluxes. On the other hand, the surface wind anomalies accompanying the northward shift of the ITCZ could also induce dynamical changes in the ocean, potentially altering equatorial upwelling and heat transport via the subtropical cells (Schneider et al., 2014). These ocean–atmosphere feedbacks could influence our estimates of NEI and of the dominant role of surface latent heat fluxes in driving it. Nevertheless, the potential issues associated with SST restoring for surface heat fluxes are likely smaller during boreal summer, our season of interest. A comparison of fully-coupled and SST-restoring simulations suggests the latter are more realistic during boreal summer, when surface heat fluxes tend to dampen SST anomalies also in the tropical and subtropical regions (Kim et al., 2020; O’Reilly et al., 2023). Furthermore, the observed relationship between reduced sea surface salinity, moisture flux divergence, and Sahel multidecadal variability (Li et al., 2016) suggests that surface latent heat fluxes indeed play a relevant role in the observed AMV–WAM coupling.
Contrary to what might be expected if the restored set up resulted in an overestimation of the relevance of tropical North Atlantic SSTs (Kim et al., 2020; O’Reilly et al., 2023), the simulated response to AMV is weak. The low-level zonal wind response in Fig. 6a is approximately ten times weaker than the observational estimates shown by Martin and Thorncroft (2014), which cannot be accounted for by the surface temperature differences to which they are associated (roughly 2-4 times weaker in the simulations with respect to the composite used in Martin and Thorncroft, 2014). The underestimation of the response in WAM circulation is in agreement with the one already identified by Mohino et al. (2024) in the simulated precipitation response and could be due to a lack of forcing. One could argue that part of the multidecadal variability of WAM responds directly to radiative forcings (i.e., it is not ocean mediated, Dong and Sutton, 2015; Hirasawa et al., 2020), and hence is absent from our experiments. Alternatively, as suggested by Herman et al. (2023), if most of WAM’s multidecadal variability is indeed ocean mediated, the weak simulated response might indicate that SST anomalies outside the North Atlantic also contribute to the overall AMV impact. Another potential explanation for the weak response is the under-representation of key processes and feedbacks, such as those related to soil moisture (Li et al., 2016), African dust (Wang et al., 2012; Balkanski et al., 2021) or vegetation (Wang et al., 2004), which could also hinder the simulated response of WAM to SST anomalies.
Some methodological limitations also need to be emphasized. First, our energetic framework neglects atmospheric energy storage, assuming that the divergent component of the vertically integrated energy flux is balanced by the mean NEI (Eq. 1), which might not be the case for seasonal means (Donohoe et al., 2013). While the limited available model output does not allow us to verify the validity of this assumption in our simulations, a comparison of these terms using ERA5 reanalysis (Hersbach et al., 2020; Mayer et al., 2021) suggests this is a robust approximation for a 10 year summer mean (see Fig. S13). Second, the vertically integrated MSE fluxes (Fig. 4a) do not uniquely identify the specific chain of intermediate physical links driving the WAM adjustment to the AVM forcing. In particular, these integrated fluxes do not allow us to disentangle the relative contributions of the mean circulation and transient eddies, nor the specific roles of latent and sensible energy transport. Consequently, our results do not preclude, and are indeed consistent with, the hypothesis that enhanced moisture transport from the tropical Atlantic acts as a primary causal link between North Atlantic warming and the northward Sahelian ITCZ shift. The presence of a westerly component in the anomalous MSE flux over the Sahel (Fig. 4a) supports this interpretation. High-frequency and vertically resolved model output (not currently available for this ensemble) would be necessary to further attribute these changes to specific process-level dynamics.
In contrast to Martin and Thorncroft (2014), our results do not support the hypothesis that the positive phase of AMV enhances Sahel rainfall through an intensification of the shallow meridional circulation (SMC) established over the Sahara. While the entire monsoon system shifts northward and the SHL deepens, as indicated by increased low-level atmospheric thickness, the SMC consistently weakens across models (Fig. 6c). This result aligns with the mechanism proposed by Shekhar and Boos (2017). The intermodel comparison highlights the relevant role of this SMC weakening at mid-levels: models showing weaker SMC exhibit larger Sahel rainfall increases in response to the positive phase of AMV. Conversely, there is no clear relationship between any measure (strength or shift) of the SHL and Sahel rainfall intensity (see Figs. S7 and S8).
Our results further suggest that, in response to a positive phase of AMV, the increase in Sahel rainfall is associated with a reduction of mid-level dry air intrusion from the north, which reduces the MSE export by the time-mean horizontal flow. This is consistent with a transition to deeper convection and a more top-heavy monsoon structure. This association is in good agreement with recent studies investigating the response of Sahel rainfall to climate change (Mutton et al., 2022, 2024), reinforcing the notion that a weakening of the SMC and a reduction in mid-level dry air intrusion are key features of a wetter Sahel. Interestingly, the dominant driver of this reduced mid-level dry air is the thermodynamic component of the moisture advection, suggesting a strong coupling between moisture and circulation changes.
In this study, we analysed simulations from 13 coupled models in which the North Atlantic SSTs were restored to follow an idealised SST pattern representative of the AMV. We compared two experiments, AMV+ and AMV−, to estimate the linear response to the AMV and study its impact on the WAM from an energetic perspective. The simulations showed no significant drift, except for two models, whose results were deemed unrealistic and were not included in subsequent analyses.
All models simulate increased Sahel rainfall during the positive AMV phase. The multimodel mean response is best described as a northward shift of the local ITCZ rather than a mere intensification. Intermodel differences in the increase of Sahel rainfall are also positively correlated with those in the northward ITCZ shift.
From an energetic perspective, ITCZ shifts, such as those simulated in the Atlantic and West Africa in response to a positive AMV phase, have been associated with changes in the cross-equatorial energy transport (Donohoe et al., 2014; Adam et al., 2016a, b). The imposed warm SST anomalies lead to an increase in the net energy input into the atmosphere over the North Atlantic. This excess energy is then exported from this region by the atmospheric circulation. In the tropical region, such export is directed towards the southern hemisphere, with an anomalous southward cross-equatorial energy flux in Atlantic and African longitudes. As this transport is primarily accomplished by the Hadley circulation (Schneider et al., 2014), the southward cross-equatorial energy flux is consistent with a northward shift of the Atlantic and African ITCZ, leading to enhanced rainfall over the Sahel. Additionally, there is a positive intermodel correlation between anomalous Sahel rainfall and southward cross-equatorial energy flux at Sahel latitudes and net energy input over the North Atlantic. The enhanced NEI into the atmosphere in the North Atlantic arises from enhanced surface latent heat driven by the warmer SST, with feedbacks from the atmospheric circulation further modulating surface fluxes, particularly through wind adjustments accompanying the northward-shifted ITCZ.
The large-scale atmospheric response to the imposed North Atlantic SST anomalies results in coherent changes in the monsoonal circulation consistent with stronger Sahel rainfall. The SHL and the African Easterly Jet are displaced northward, the low-level southwesterly monsoonal flow is enhanced over the Sahel, and both the low-level wind convergence and the upper-level divergence in the region of main climatological ascent strengthen, indicating a stronger and northward displaced deep convection zone. In agreement with Shekhar and Boos (2017), the shallow meridional circulation over the Sahara and the mid-level dry-air advection into the Sahel are consistently weakened across models. In addition, the reduction in mid-level dry-air intrusion shows a strong positive intermodel correlation with Sahel rainfall increases.
The modelled equilibrium response of the WAM to AMV also suggests a strong feedback between moisture and circulation changes. The response of the AEJ and part of the northward shift of the SHL can be traced back to modifications in surface temperature, which are themselves related to the modified rainfall response through changes in soil moisture and local surface turbulent fluxes. Moreover, the thermodynamic component of the response, namely enhanced atmospheric moisture throughout the column, further suppresses dry-air intrusion and promotes deeper convection, sustaining the rainfall increase.
Finally, the energetic framework used in this study, linking the NEI into the atmosphere to the divergent component of the vertically integrated MSE flux, proves to be a powerful diagnostic tool for understanding in simple energetic terms the impact of AMV on Sahel rainfall. This framework may also help elucidate other extratropical sources of variability for Sahel rainfall, such as Arctic sea-ice loss and Southern Ocean warming (Monerie et al., 2019a; Jeong et al., 2025; Datti et al., 2025), whose effects are primarily expressed through meridional shifts of the energy transport. For other sources of Sahel decadal variability, such as the Pacific Decadal Variability (Mohino et al., 2011; Villamayor and Mohino, 2015; Dong and Dai, 2015; Joshi et al., 2022), consideration of the zonal component of the vertical integral of MSE flux and associated shifts of the energy flux prime meridian (Boos and Korty, 2016) could provide additional insights.
Data used in this work are publicly available. Model simulations can be downloaded from the Earth System Grid Federation CMIP6 archive (https://esgf-ui.ceda.ac.uk/search, last access: 22 January 2026). The original data has been processed with Climate Data Operators (cdo) at https://doi.org/10.5281/zenodo.10020800 (Schulzweida, 2023). The scripts used in this study are available upon reasonable request to the corresponding author.
The supplement related to this article is available online at https://doi.org/10.5194/wcd-7-1619-2026-supplement.
EM provided the first design of the article, which was subsequently discussed with P-AM, JM, and SB. EM did the formal analysis and wrote the original draft. All authors reviewed and edited the paper.
The contact author has declared that none of the authors has any competing interests.
Publisher's note: Copernicus Publications remains neutral with regard to jurisdictional claims made in the text, published maps, institutional affiliations, or any other geographical representation in this paper. The authors bear the ultimate responsibility for providing appropriate place names. Views expressed in the text are those of the authors and do not necessarily reflect the views of the publisher.
Authors acknowledge the use of JASMIN facilities for the PRIMAVERA data as part of the IS-ENES3 project that has received funding from the European Union’s Horizon 2020 research and innovation program (grant-no.: 824084). We acknowledge the World Climate Research Programme, which, through its Working Group on Coupled Modelling, coordinated and promoted CMIP6. We thank the climate modelling groups for producing and making available their model output, the Earth System Grid Federation (ESGF) for archiving the data and providing access, and the multiple funding agencies that support CMIP6 and ESGF. This project was provided with computing HPC and storage resources by GENCI at TGCC thanks to the grant 2024-A0170107403 on the supercomputer Joliot Curie’s SKL and ROME partition.
This research has been supported by the Ministerio de Ciencia e Innovación (grant nos. PID2025-168561NB-I00, PID2021-125806NB-I00 and TED2021-130106B-I00), the Universidad Complutense de Madrid (grant no. Recualificación del Sistema Universitario Español para 2021–2023), the European Commission, EU Horizon 2020 Framework Programme (grant nos. 101003470 and 824084), and the Wellcome Trust (grant no. 308964/Z/23/Z).
This paper was edited by Yen-Ting Hwang and reviewed by three anonymous referees.
Adam, O., Bischoff, T., and Schneider, T.: Seasonal and Interannual Variations of the Energy Flux Equator and ITCZ. Part I: Zonally Averaged ITCZ Position, J. Climate, 29, 3219–3230, https://doi.org/10.1175/JCLI-D-15-0512.1, 2016a. a, b, c
Adam, O., Bischoff, T., and Schneider, T.: Seasonal and Interannual Variations of the Energy Flux Equator and ITCZ. Part II: Zonally Varying Shifts of the ITCZ, J. Climate, 29, 7281–7293, https://doi.org/10.1175/JCLI-D-15-0710.1, 2016b. a, b, c, d, e
Adam, O., Schneider, T., Enzel, Y., and Quade, J.: Both differential and equatorial heating contributed to African monsoon variations during the mid-Holocene, Earth Planet. Sc. Lett., 522, 20–29, https://doi.org/10.1016/j.epsl.2019.06.019, 2019. a
Badji, A., Mohino, E., Diakhaté, M., Mignot, J., and Gaye, A. T.: Decadal Variability of Rainfall in Senegal: Beyond the Total Seasonal Amount, J. Climate, 35, 5339–5358, https://doi.org/10.1175/JCLI-D-21-0699.1, 2022. a
Balkanski, Y., Bonnet, R., Boucher, O., Checa-Garcia, R., and Servonnat, J.: Better representation of dust can improve climate models with too weak an African monsoon, Atmos. Chem. Phys., 21, 11423–11435, https://doi.org/10.5194/acp-21-11423-2021, 2021. a
Berntell, E., Zhang, Q., Chafik, L., and Körnich, H.: Representation of multidecadal Sahel rainfall variability in 20th century reanalyses, Sci. Rep.-UK, 8, 10937, https://doi.org/10.1038/s41598-018-29217-9, 2018. a, b
Biasutti, M., Voigt, A., Boos, W. R., Braconnot, P., Hargreaves, J. C., Harrison, S. P., Kang, S. M., Mapes, B. E., Scheff, J., and Schumacher, C.: Global energetics and local physics as drivers of past, present and future monsoons, Nat. Geosci., 11, 392–400, https://doi.org/10.1038/s41561-018-0137-1, 2018. a
Bischoff, T. and Schneider, T.: Energetic constraints on the position of the intertropical convergence zone, J. Climate, 27, 4937–4951, https://doi.org/10.1175/JCLI-D-13-00650.1, 2014. a
Boer, G. J., Smith, D. M., Cassou, C., Doblas-Reyes, F., Danabasoglu, G., Kirtman, B., Kushnir, Y., Kimoto, M., Meehl, G. A., Msadek, R., Mueller, W. A., Taylor, K. E., Zwiers, F., Rixen, M., Ruprich-Robert, Y., and Eade, R.: The Decadal Climate Prediction Project (DCPP) contribution to CMIP6, Geosci. Model Dev., 9, 3751–3777, https://doi.org/10.5194/gmd-9-3751-2016, 2016. a, b, c
Boos, W. R. and Korty, R. L.: Regional energy budget control of the intertropical convergence zone and application to mid-Holocene rainfall, Nat. Geosci., 9, 892–897, https://doi.org/10.1038/ngeo2833, 2016. a
Boucher, O., Servonnat, J., Albright, A. L., Aumont, O., Balkanski, Y., Bastrikov, V., Bekki, S., Bonnet, R., Bony, S., Bopp, L., Braconnot, P., Brockmann, P., Cadule, P., Caubel, A., Cheruy, F., Codron, F., Cozic, A., Cugnet, D., D'Andrea, F., Davini, P., de Lavergne, C., Denvil, S., Deshayes, J., Devilliers, M., Ducharne, A., Dufresne, J.-L., Dupont, E., Ethe, C., Fairhead, L., Falletti, L., Flavoni, S., Foujols, M.-A., Gardoll, S., Gastineau, G., Ghattas, J., Grandpeix, J.-Y., Guenet, B., Guez, L. E., Guilyardi, E., Guimberteau, M., Hauglustaine, D., Hourdin, F., Idelkadi, A., Joussaume, S., Kageyama, M., Khodri, M., Krinner, G., Lebas, N., Levavasseur, G., Levy, C., Li, L., Lott, F., Lurton, T., Luyssaert, S., Madec, G., Madeleine, J.-B., Maignan, F., Marchand, M., Marti, O., Mellul, L., Meurdesoif, Y., Mignot, J., Musat, I., Ottle, C., Peylin, P., Planton, Y., Polcher, J., Rio, C., Rochetin, N., Rousset, C., Sepulchre, P., Sima, A., Swingedouw, D., Thieblemont, R., Traore, A. K., Vancoppenolle, M., Vial, J., Vialard, J., Viovy, N., and Vuichard, N.: Presentation and Evaluation of the IPSL-CM6A-LR Climate Model, J. Adv. Model. Earth Sy., 12, e2019MS002010, https://doi.org/10.1029/2019MS002010, 2020. a
Cai, W., Reason, C., Mohino, E., Rodríguez-Fonseca, B., Malherbe, J., Santoso, A., Li, X., Chikoore, H., Nnamchi, H., McPhaden, M. J., Keenlyside, N., Taschetto, A. S., Wu, L., Ng, B., Liu, Y., Geng, T., Yang, K., Wang, G., Jia, F., Lin, X., Li, S., Yang, Y., Wang, J., Zhang, L., Li, Z., Wilfried, P., Zhou, L., Zhang, X., Engelbrecht, F., Li, Z., and Mutemi, J. N.: Climate impacts of the El Niño–Southern Oscillation in Africa, Nature Reviews Earth and Environment, 6, 503–520, https://doi.org/10.1038/s43017-025-00705-7, 2025. a
Chagnaud, G., Panthou, G., Vischel, T., and Lebel, T.: A synthetic view of rainfall intensification in the West African Sahel, Environ. Res. Lett., 17, 044005, https://doi.org/10.1088/1748-9326/ac4a9c, 2022. a
Cook, K. H.: Generation of the African easterly jet and its role in determining West African precipitation, J. Climate, 12, 1165–1184, https://doi.org/10.1175/1520-0442(1999)012<1165:GOTAEJ>2.0.CO;2, 1999. a, b
Dai, A., Lamb, P. J., Trenberth, K. E., Hulme, M., Jones, P. D., and Xie, P.: The recent Sahel drought is real, Int. J. Climatol., 24, 1323–1331, 2004. a
Datti, A. D., Zeng, G., Monerie, P.-A., Oo, K. T., and Chen, C.: A Review of the arctic-West African monsoon nexus: How arctic sea ice decline influences monsoon system, Theor. Appl. Climatol., 156, 9, https://doi.org/10.1007/s00704-024-05255-4, 2025. a
Dong, B. and Dai, A.: The influence of the Interdecadal Pacific Oscillation on Temperature and Precipitation over the Globe, Clim. Dynam., 45, 2667–2681, https://doi.org/10.1007/s00382-015-2500-x, 2015. a, b
Dong, B. and Sutton, R.: Dominant role of greenhouse-gas forcing in the recovery of Sahel rainfall, Nat. Clim. Change, 5, 757–U173, https://doi.org/10.1038/NCLIMATE2664, 2015. a, b
Dong, B., Sutton, R. T., Highwood, E., and Wilcox, L.: The impacts of European and Asian anthropogenic sulfur dioxide emissions on Sahel rainfall, J. Climate, 27, 7000–7017, https://doi.org/10.1175/JCLI-D-13-00769.1, 2014. a
Donohoe, A., Marshall, J., Ferreira, D., and Mcgee, D.: The relationship between ITCZ location and cross-equatorial atmospheric heat transport: From the seasonal cycle to the Last Glacial Maximum, J. Climate, 26, 3597–3618, https://doi.org/10.1175/JCLI-D-12-00467.1, 2013. a
Donohoe, A., Marshall, J., Ferreira, D., Armour, K., and McGee, D.: The Interannual Variability of Tropical Precipitation and Interhemispheric Energy Transport, J. Climate, 27, 3377–3392, https://doi.org/10.1175/JCLI-D-13-00499.1, 2014. a, b, c, d, e
Döscher, R., Acosta, M., Alessandri, A., Anthoni, P., Arsouze, T., Bergman, T., Bernardello, R., Boussetta, S., Caron, L.-P., Carver, G., Castrillo, M., Catalano, F., Cvijanovic, I., Davini, P., Dekker, E., Doblas-Reyes, F. J., Docquier, D., Echevarria, P., Fladrich, U., Fuentes-Franco, R., Gröger, M., v. Hardenberg, J., Hieronymus, J., Karami, M. P., Keskinen, J.-P., Koenigk, T., Makkonen, R., Massonnet, F., Ménégoz, M., Miller, P. A., Moreno-Chamarro, E., Nieradzik, L., van Noije, T., Nolan, P., O'Donnell, D., Ollinaho, P., van den Oord, G., Ortega, P., Prims, O. T., Ramos, A., Reerink, T., Rousset, C., Ruprich-Robert, Y., Le Sager, P., Schmith, T., Schrödner, R., Serva, F., Sicardi, V., Sloth Madsen, M., Smith, B., Tian, T., Tourigny, E., Uotila, P., Vancoppenolle, M., Wang, S., Wårlind, D., Willén, U., Wyser, K., Yang, S., Yepes-Arbós, X., and Zhang, Q.: The EC-Earth3 Earth system model for the Coupled Model Intercomparison Project 6, Geosci. Model Dev., 15, 2973–3020, https://doi.org/10.5194/gmd-15-2973-2022, 2022. a
Folland, C., Palmer, T., and Parker, D.: Sahel Rainfall and Worldwide Sea Temperatures, 1901-85, Nature, 320, 602–607, https://doi.org/10.1038/320602a0, 1986. a, b, c
Ganguly, I., Gonzalez, A. O., and Karnauskas, K. B.: On the role of wind–evaporation–SST feedbacks in the subseasonal variability of the East Pacific ITCZ, J. Climate, 37, 129–143, https://doi.org/10.1175/JCLI-D-22-0849.1, 2024. a
Giannini, A. and Kaplan, A.: The role of aerosols and greenhouse gases in Sahel drought and recovery, Climatic Change, 152, 449–466, https://doi.org/10.1007/s10584-018-2341-9, 2019. a
Guo, J., Xie, X., Myhre, G., Shindell, D., Kirkevåg, A., Iversen, T., Samset, B. H., Shi, Z., Li, X., Sun, H., Liu, X., and Liu, Y.: Increased Asian Sulfate Aerosol Emissions Remarkably Enhance Sahel Summer Precipitation, Earths Future, 12, e2024EF004745, https://doi.org/10.1029/2024EF004745, 2024. a
Gutjahr, O., Putrasahan, D., Lohmann, K., Jungclaus, J. H., von Storch, J.-S., Brüggemann, N., Haak, H., and Stössel, A.: Max Planck Institute Earth System Model (MPI-ESM1.2) for the High-Resolution Model Intercomparison Project (HighResMIP), Geosci. Model Dev., 12, 3241–3281, https://doi.org/10.5194/gmd-12-3241-2019, 2019. a, b
Haarsma, R., Acosta, M., Bakhshi, R., Bretonnière, P.-A., Caron, L.-P., Castrillo, M., Corti, S., Davini, P., Exarchou, E., Fabiano, F., Fladrich, U., Fuentes Franco, R., García-Serrano, J., von Hardenberg, J., Koenigk, T., Levine, X., Meccia, V. L., van Noije, T., van den Oord, G., Palmeiro, F. M., Rodrigo, M., Ruprich-Robert, Y., Le Sager, P., Tourigny, E., Wang, S., van Weele, M., and Wyser, K.: HighResMIP versions of EC-Earth: EC-Earth3P and EC-Earth3P-HR – description, model computational performance and basic validation, Geosci. Model Dev., 13, 3507–3527, https://doi.org/10.5194/gmd-13-3507-2020, 2020. a, b
Hartmann, D. L.: Global physical climatology, 2nd edn., Elsevier, Amsterdam, Netherlands, https://doi.org/10.1016/C2009-0-00030-0, 2016. a
Haywood, J. M., Jones, A., Bellouin, N., and Stephenson, D.: Asymmetric forcing from stratospheric aerosols impacts Sahelian rainfall, Nat. Clim. Change, 3, 660–665, https://doi.org/10.1038/nclimate1857, 2013. a
He, C., Clement, A. C., Kramer, S. M., Cane, M. A., Klavans, J. M., Fenske, T. M., and Murphy, L. N.: Tropical Atlantic multidecadal variability is dominated by external forcing, Nature, 622, 521–527, https://doi.org/10.1038/s41586-023-06489-4, 2023. a
Herman, R. J., Biasutti, M., and Kushnir, Y.: Drivers of low-frequency Sahel precipitation variability: comparing CMIP5 and CMIP6 ensemble means with observations, Clim. Dynam., 61, 4449–4470, https://doi.org/10.1007/s00382-023-06755-1, 2023. a, b, c
Hersbach, H., Bell, B., Berrisford, P., Hirahara, S., Horányi, A., Muñoz-Sabater, J., Nicolas, J., Peubey, C., Radu, R., Schepers, D., Simmons, A., Soci, C., Abdalla, S., Abellan, X., Balsamo, G., Bechtold, P., Biavati, G., Bidlot, J., Bonavita, M., De Chiara, G., Dahlgren, P., Dee, D., Diamantakis, M., Dragani, R., Flemming, J., Forbes, R., Fuentes, M., Geer, A., Haimberger, L., Healy, S., Hogan, R. J., Hólm, E., Janisková, M., Keeley, S., Laloyaux, P., Lopez, P., Lupu, C., Radnoti, G., de Rosnay, P., Rozum, I., Vamborg, F., Villaume, S., and Thépaut, J.-N.: The ERA5 global reanalysis, Q. J. Roy. Meteor. Soc., 146, 1999–2049, https://doi.org/10.1002/qj.3803, 2020. a
Hill, S. A., Ming, Y., Held, I. M., and Zhao, M.: A Moist Static Energy Budget-Based Analysis of the Sahel Rainfall Response to Uniform Oceanic Warming, J. Climate, 30, 5637–5660, https://doi.org/10.1175/JCLI-D-16-0785.1, 2017. a, b, c, d, e, f
Hill, S. A., Ming, Y., and Zhao, M.: Robust responses of the Sahelian hydrological cycle to global warming, J. Climate, 31, 9793–9814, https://doi.org/10.1175/JCLI-D-18-0238.1, 2018. a
Hirasawa, H., Kushner, P. J., Sigmond, M., Fyfe, J., and Deser, C.: Anthropogenic Aerosols Dominate Forced Multidecadal Sahel Precipitation Change through Distinct Atmospheric and Oceanic Drivers, J. Climate, 33, 10187–10204, https://doi.org/10.1175/JCLI-D-19-0829.1, 2020. a, b
Hirasawa, H., Kushner, P. J., Sigmond, M., Fyfe, J., and Deser, C.: Evolving Sahel rainfall response to anthropogenic aerosols driven by shifting regional oceanic and emission influences, J. Climate, 35, 3181–3193, https://doi.org/10.1175/JCLI-D-21-0795.1, 2022. a
Hirons, L. C., Klingaman, N. P., and Woolnough, S. J.: MetUM-GOML1: a near-globally coupled atmosphere–ocean-mixed-layer model, Geosci. Model Dev., 8, 363–379, https://doi.org/10.5194/gmd-8-363-2015, 2015. a, b
Hodson, D. L. R., Bretonniere, P.-A., Cassou, C., Davini, P., Klingaman, N. P., Lohmann, K., Lopez-Parages, J., Martin-Rey, M., Moine, M.-P., Monerie, P.-A., Putrasahan, D. A., Roberts, C. D., Robson, J., Ruprich-Robert, Y., Sanchez-Gomez, E., Seddon, J., and Senan, R.: Coupled climate response to Atlantic Multidecadal Variability in a multi-model multi-resolution ensemble, Clim. Dynam., 59, 805–836, https://doi.org/10.1007/s00382-022-06157-9, 2022. a, b, c, d, e
Hua, W., Dai, A., Zhou, L., Qin, M., and Chen, H.: An Externally Forced Decadal Rainfall Seesaw Pattern Over the Sahel and Southeast Amazon, Geophys. Res. Lett., 46, 923–932, https://doi.org/10.1029/2018GL081406, 2019. a
Huang, B., Banzon, V. F., Freeman, E., Lawrimore, J., Liu, W., Peterson, T. C., Smith, T. M., Thorne, P. W., Woodruff, S. D., and Zhang, H.-M.: Extended reconstructed sea surface temperature version 4 (ERSS T. v4). Part I: Upgrades and intercomparisons, J. Climate, 28, 911–930, https://doi.org/10.1175/JCLI-D-14-00006.1, 2015. a
Hwang, Y., Frierson, D. M. W., and Kang, S. M.: Anthropogenic sulfate aerosol and the southward shift of tropical precipitation in the late 20th century, Geophys. Res. Lett., 40, 2845–2850, https://doi.org/10.1002/grl.50502, 2013. a
Jeong, H., Park, H.-S., Kang, S. M., and Chung, E.-S.: The greater role of Southern Ocean warming compared to Arctic Ocean warming in shifting future tropical rainfall patterns, Nat. Commun., 16, 2790, https://doi.org/10.1038/s41467-025-57654-4, 2025. a
Joshi, M. K., Rai, A., and Kulkarni, A.: Global-scale interdecadal variability a skillful predictor at decadal-to-multidecadal timescales for Sahelian and Indian Monsoon Rainfall, npj Climate and Atmospheric Science, 5, 2, https://doi.org/10.1038/s41612-021-00227-1, 2022. a, b, c
Kang, S. M., Held, I. M., Frierson, D. M., and Zhao, M.: The response of the ITCZ to extratropical thermal forcing: Idealized slab-ocean experiments with a GCM, J. Climate, 21, 3521–3532, https://doi.org/10.1175/2007JCLI2146.1, 2008. a
Kang, S. M., Frierson, D. M., and Held, I. M.: The tropical response to extratropical thermal forcing in an idealized GCM: The importance of radiative feedbacks and convective parameterization, J. Atmos. Sci., 66, 2812–2827, https://doi.org/10.1175/2009JAS2924.1, 2009. a
Karnauskas, K. B.: A simple coupled model of the wind–evaporation–SST feedback with a role for stability, J. Climate, 35, 2149–2160, https://doi.org/10.1175/JCLI-D-20-0895.1, 2022. a
Kim, W. M., Yeager, S., and Danabasoglu, G.: Atlantic multidecadal variability and associated climate impacts initiated by ocean thermohaline dynamics, J. Climate, 33, 1317–1334, https://doi.org/10.1175/JCLI-D-19-0530.1, 2020. a, b, c
Kitoh, A., Mohino, E., Ding, Y., Rajendran, K., Ambrizzi, T., Marengo, J., and Magaña, V.: Combined oceanic influences on continental climates, in: Interacting climates of ocean basins: observations, mechanisms, predictability, and impacts, vol. 1, 1st edn., Cambridge University Press, New York, USA, 216–249, https://doi.org/10.1017/9781108610995, 2020. a, b
Knight, J. R., Folland, C. K., and Scaife, A. A.: Climate impacts of the Atlantic Multidecadal Oscillation, Geophys. Res. Lett., 33, L17706, https://doi.org/10.1029/2006GL026242, 2006. a, b, c, d
Lavaysse, C., Flamant, C., and Janicot, S.: Regional-scale convection patterns during strong and weak phases of the Saharan heat low, Atmos. Sci. Lett., 11, 255–264, https://doi.org/10.1002/asl.284, 2010. a
Lebel, T. and Ali, A.: Recent trends in the Central and Western Sahel rainfall regime (1990–2007), J. Hydrol., 375, 52–64, https://doi.org/10.1016/j.jhydrol.2008.11.030, 2009. a
Li, L., Schmitt, R. W., Ummenhofer, C. C., and Karnauskas, K. B.: North Atlantic salinity as a predictor of Sahel rainfall, Sci. Adv., 2, e1501588, https://doi.org/10.1126/sciadv.1501588, 2016. a, b
Marshall, J., Donohoe, A., Ferreira, D., and McGee, D.: The ocean’s role in setting the mean position of the Inter-Tropical Convergence Zone, Clim. Dynam., 42, 1967–1979, https://doi.org/10.1007/s00382-013-1767-z, 2014. a
Martin, E. R. and Thorncroft, C. D.: The impact of the AMO on the West African monsoon annual cycle, Q. J. Roy. Meteor. Soc., 140, 31–46, https://doi.org/10.1002/qj.2107, 2014. a, b, c, d, e, f, g
Martin, E. R., Thorncroft, C., and Booth, B. B. B.: The Multidecadal Atlantic SST-Sahel Rainfall Teleconnection in CMIP5 Simulations, J. Climate, 27, 784–806, https://doi.org/10.1175/JCLI-D-13-00242.1, 2014. a, b, c, d
Mayer, J., Mayer, M., and Haimberger, L.: Mass-consistent atmospheric energy and moisture budget monthly data from 1979 to present derived from ERA5 reanalysis, Copernicus Climate Change Service (C3S) Climate Data Store (CDS), https://doi.org/10.24381/cds.c2451f6b, last access: 3 March 2026, 2021. a
Mohino, E., Janicot, S., and Bader, J.: Sahel rainfall and decadal to multi-decadal sea surface temperature variability, Clim. Dynam., 37, 419–440, https://doi.org/10.1007/s00382-010-0867-2, 2011. a, b, c, d, e
Mohino, E., Monerie, P.-A., Mignot, J., Diakhaté, M., Donat, M., Roberts, C. D., and Doblas-Reyes, F.: Impact of Atlantic multidecadal variability on rainfall intensity distribution and timing of the West African monsoon, Earth Syst. Dynam., 15, 15–40, https://doi.org/10.5194/esd-15-15-2024, 2024. a, b, c, d
Monerie, P., Dittus, A. J., Wilcox, L. J., and Turner, A. G.: Uncertainty in Simulating Twentieth Century West African Precipitation Trends: The Role of Anthropogenic Aerosol Emissions, Earths Future, 11, e2022EF002995, https://doi.org/10.1029/2022EF002995, 2023. a, b
Monerie, P.-A., Oudar, T., and Sanchez-Gomez, E.: Respective impacts of Arctic sea ice decline and increasing greenhouse gases concentration on Sahel precipitation, Clim. Dynam., 52, 5947–5964, https://doi.org/10.1007/s00382-018-4488-5, 2019a. a
Monerie, P.-A., Robson, J., Dong, B., Hodson, D. L. R., and Klingaman, N. P.: Effect of the Atlantic Multidecadal Variability on the Global Monsoon, Geophys. Res. Lett., 46, 1765–1775, https://doi.org/10.1029/2018GL080903, 2019b. a, b, c, d
Monerie, P.-A., Robson, J., Dong, B., and Hodson, D.: Role of the Atlantic multidecadal variability in modulating East Asian climate, Clim. Dynam., 56, 381–398, https://doi.org/10.1007/s00382-020-05477-y, 2021. a
Monerie, P.-A., Mohino, E., Moine, M.-P., Biasutti, M., Pohl, B., and Mignot, J.: Exploring uncertainty in dynamical future changes in Sahel precipitation: the extratropical influence, Clim. Dynam., 63, 1–21, https://doi.org/10.1007/s00382-025-07835-0, 2025. a
Moreno-Chamarro, E., Marshall, J., and Delworth, T. L.: Linking ITCZ migrations to the AMOC and North Atlantic/Pacific SST decadal variability, J. Climate, 33, 893–905, https://doi.org/10.1175/JCLI-D-19-0258.1, 2020. a, b
Mutton, H., Chadwick, R., Collins, M., Lambert, F. H., Geen, R., Todd, A., and Taylor, C. M.: The impact of the direct radiative effect of increased CO2 on the West African monsoon, J. Climate, 35, 2441–2458, https://doi.org/10.1175/JCLI-D-21-0340.1, 2022. a, b
Mutton, H., Chadwick, R., Collins, M., Lambert, F. H., Taylor, C. M., Geen, R., and Todd, A.: The impact of a uniform ocean warming on the West African monsoon, Clim. Dynam., 62, 103–122, https://doi.org/10.1007/s00382-023-06898-1, 2024. a
Ndiaye, C. D., Mohino, E., Mignot, J., and Sall, S. M.: On the Detection of Externally Forced Decadal Modulations of the Sahel Rainfall over the Whole Twentieth Century in the CMIP6 Ensemble, J. Climate, 35, 3339–3354, https://doi.org/10.1175/JCLI-D-21-0585.1, 2022. a
Neelin, J. D. and Held, I. M.: Modeling tropical convergence based on the moist static energy budget, Mon. Weather Rev., 115, 3–12, https://doi.org/10.1175/1520-0493(1987)115<0003:MTCBOT>2.0.CO;2, 1987. a
Nicholson, S. E.: The West African Sahel: A Review of Recent Studies on the Rainfall Regime and Its Interannual Variability, International Scholarly Research Notices, 2013, e453521, https://doi.org/10.1155/2013/453521, 2013. a, b
O’Reilly, C. H., Woollings, T., and Zanna, L.: The dynamical influence of the Atlantic multidecadal oscillation on continental climate, J. Climate, 30, 7213–7230, https://doi.org/10.1175/JCLI-D-16-0345.1, 2017. a, b
O’Reilly, C. H., Patterson, M., Robson, J., Monerie, P. A., Hodson, D., and Ruprich-Robert, Y.: Challenges with interpreting the impact of Atlantic Multidecadal Variability using SST-restoring experiments, npj Climate and Atmospheric Science, 6, 14, https://doi.org/10.1038/s41612-023-00335-0, 2023. a, b, c
Roberts, C. D., Senan, R., Molteni, F., Boussetta, S., Mayer, M., and Keeley, S. P. E.: Climate model configurations of the ECMWF Integrated Forecasting System (ECMWF-IFS cycle 43r1) for HighResMIP, Geosci. Model Dev., 11, 3681–3712, https://doi.org/10.5194/gmd-11-3681-2018, 2018. a, b
Rodríguez-Fonseca, B., Mohino, E., Mechoso, C. R., Caminade, C., Biasutti, M., Gaetani, M., García-Serrano, J., Vizy, E. K., Cook, K., and Xue, Y.: Variability and predictability of West African droughts: a review on the role of sea surface temperature anomalies, J. Climate, 28, 4034–4060, https://doi.org/10.1175/JCLI-D-14-00130.1, 2015. a
Rotstayn, L. D. and Lohmann, U.: Tropical Rainfall Trends and the Indirect Aerosol Effect, J. Climate, https://doi.org/10.1175/1520-0442(2002)015<2103:TRTATI>2.0.CO;2, 2002. a
Ruprich-Robert, Y., Delworth, T., Msadek, R., Castruccio, F., Yeager, S., and Danabasoglu, G.: Impacts of the Atlantic Multidecadal Variability on North American Summer Climate and Heat Waves, J. Climate, https://doi.org/10.1175/JCLI-D-17-0270.1, 2018. a
Ruprich-Robert, Y., Moreno-Chamarro, E., Levine, X., Bellucci, A., Cassou, C., Castruccio, F., Davini, P., Eade, R., Gastineau, G., Hermanson, L., Hodson, D., Lohmann, K., Lopez-Parages, J., Monerie, P.-A., Nicolì, D., Qasmi, S., Roberts, C. D., Sanchez-Gomez, E., Danabasoglu, G., Dunstone, N., Martin-Rey, M., Msadek, R., Robson, J., Smith, D., and Tourigny, E.: Impacts of Atlantic multidecadal variability on the tropical Pacific: a multi-model study, npj Climate and Atmospheric Science, 4, 1–11, https://doi.org/10.1038/s41612-021-00188-5, 2021. a
Sanderson, B. M., Knutti, R., and Caldwell, P.: Addressing interdependency in a multimodel ensemble by interpolation of model properties, J. Climate, 28, 5150–5170, https://doi.org/10.1175/JCLI-D-14-00361.1, 2015. a
Sanogo, S., Fink, A. H., Omotosho, J. A., Ba, A., Redl, R., and Ermert, V.: Spatio-temporal characteristics of the recent rainfall recovery in West Africa, Int. J. Climatol., 35, 4589–4605, https://doi.org/10.1002/joc.4309, 2015. a
Schneider, T., Bischoff, T., and Haug, G. H.: Migrations and dynamics of the intertropical convergence zone, Nature, 513, 45–53, https://doi.org/10.1038/nature13636, 2014. a, b, c, d
Schulzweida, U.: CDO User Guide, Zenodo, https://doi.org/10.5281/zenodo.10020800, 2023. a
Shekhar, R. and Boos, W. R.: Improving Energy-Based Estimates of Monsoon Location in the Presence of Proximal Deserts, J. Climate, https://doi.org/10.1175/JCLI-D-15-0747.1, 2016. a, b, c
Shekhar, R. and Boos, W. R.: Weakening and Shifting of the Saharan Shallow Meridional Circulation during Wet Years of the West African Monsoon, J. Climate, 30, 7399–7422, https://doi.org/10.1175/JCLI-D-16-0696.1, 2017. a, b, c, d, e, f, g
Taylor, C. M., Belusic, D., Guichard, F., Arker, D. J. P., Vischel, T., Bock, O., Harris, P. P., Janicot, S., Klein, C., and Panthou, G.: Frequency of extreme Sahelian storms tripled since 1982 in satellite observations, Nature, 544, 475–478, https://doi.org/10.1038/nature22069, 2017. a
Thorncroft, C. D., Nguyen, H., Zhang, C., and Peyrille, P.: Annual cycle of the West African monsoon: regional circulations and associated water vapour transport, Q. J. Roy. Meteor. Soc., 137, 129–147, https://doi.org/10.1002/qj.728, 2011. a, b
Ting, M., Kushnir, Y., Seager, R., and Li, C.: Forced and internal twentieth-century SST trends in the North Atlantic, J. Climate, 22, 1469–1481, https://doi.org/10.1175/2008JCLI2561.1, 2009. a
Ting, M., Kushnir, Y., Seager, R., and Li, C.: Robust features of Atlantic multi-decadal variability and its climate impacts, Geophys. Res. Lett., 38, L17705, https://doi.org/10.1029/2011GL048712, 2011. a, b, c
Villamayor, J. and Mohino, E.: Robust Sahel drought due to the Interdecadal Pacific Oscillation in CMIP5 simulations, Geophys. Res. Lett., 42, 1214–1222, https://doi.org/10.1002/2014GL062473, 2015. a, b
Villamayor, J., Mohino, E., Khodri, M., Mignot, J., and Janicot, S.: Atlantic Control of the Late Nineteenth-Century Sahel Humid Period, J. Climate, 31, 8225–8240, https://doi.org/10.1175/JCLI-D-18-0148.1, 2018. a, b, c
Voldoire, A., Saint-Martin, D., Senesi, S., Decharme, B., Alias, A., Chevallier, M., Colin, J., Gueremy, J.-F., Michou, M., Moine, M.-P., Nabat, P., Roehrig, R., Salas y Melia, D., Seferian, R., Valcke, S., Beau, I., Belamari, S., Berthet, S., Cassou, C., Cattiaux, J., Deshayes, J., Douville, H., Ethe, C., Franchisteguy, L., Geoffroy, O., Levy, C., Madec, G., Meurdesoif, Y., Msadek, R., Ribes, A., Sanchez-Gomez, E., Terray, L., and Waldman, R.: Evaluation of CMIP6 DECK Experiments With CNRM-CM6-1, J. Adv. Model. Earth Sy., 11, 2177–2213, https://doi.org/10.1029/2019MS001683, 2019. a, b
Wang, C., Dong, S., Evan, A. T., Foltz, G. R., and Lee, S.-K.: Multidecadal covariability of North Atlantic sea surface temperature, African dust, Sahel rainfall, and Atlantic hurricanes, J. Climate, 25, 5404–5415, https://doi.org/10.1175/JCLI-D-11-00413.1, 2012. a, b
Wang, G., Eltahir, E. A. B., Foley, J. A., Pollard, D., and Levis, S.: Decadal variability of rainfall in the Sahel: results from the coupled GENESIS-IBIS atmosphere-biosphere model, Clim. Dynam., 22, 625–637, https://doi.org/10.1007/s00382-004-0411-3, 2004. a
Watanabe, M. and Tatebe, H.: Reconciling roles of sulphate aerosol forcing and internal variability in Atlantic multidecadal climate changes, Clim. Dynam., 53, 4651–4665, https://doi.org/10.1007/s00382-019-04811-3, 2019. a
Williams, K. D., Copsey, D., Blockley, E. W., Bodas-Salcedo, A., Calvert, D., Comer, R., Davis, P., Graham, T., Hewitt, H. T., Hill, R., Hyder, P., Ineson, S., Johns, T. C., Keen, A. B., Lee, R. W., Megann, A., Milton, S. F., Rae, J. G. L., Roberts, M. J., Scaife, A. A., Schiemann, R., Storkey, D., Thorpe, L., Watterson, I. G., Walters, D. N., West, A., Wood, R. A., Woollings, T., and Xavier, P. K.: The Met Office Global Coupled Model 3.0 and 3.1 (GC3.0 and GC3.1) Configurations, J. Adv. Model. Earth Sy., 10, 357–380, https://doi.org/10.1002/2017MS001115, 2018. a
WMO: Guide to Instruments and Methods of Observation. Volume I – Measurement of Meteorological Varibles, WMO-No. 8, WMO, Geneva, Switzerland, https://library.wmo.int/idurl/4/41650, 2024. a
Xue, J., Wang, B., Yu, Y., Li, J., Sun, C., and Mao, J.: Multidecadal variation of northern hemisphere summer monsoon forced by the SST inter-hemispheric dipole, Environ. Res. Lett., 17, 044033, https://doi.org/10.1088/1748-9326/ac5a65, 2022. a
Zhang, J., Liu, Y., Sun, C., Li, J., Ding, R., Xie, F., Xie, T., Zhang, Y., and Gong, Z.: On the connection between AMOC and observed land precipitation in Northern Hemisphere: a comparison of the AMOC indicators, Clim. Dynam., 56, 651–664, https://doi.org/10.1007/s00382-020-05496-9, 2021. a, b
Zhang, R. and Delworth, T. L.: Impact of Atlantic multidecadal oscillations on India/Sahel rainfall and Atlantic hurricanes, Geophys. Res. Lett., 33, L17712, https://doi.org/10.1029/2006GL026267, 2006. a, b, c, d
Zhang, R., Sutton, R., Danabasoglu, G., Kwon, Y.-O., Marsh, R., Yeager, S. G., Amrhein, D. E., and Little, C. M.: A Review of the Role of the Atlantic Meridional Overturning Circulation in Atlantic Multidecadal Variability and Associated Climate Impacts, Rev. Geophys., 57, 316–375, https://doi.org/10.1029/2019RG000644, 2019. a, b
Zhang, S., Stier, P., Dagan, G., and Wang, M.: Anthropogenic Aerosols Modulated 20th-Century Sahel Rainfall Variability Via Their Impacts on North Atlantic Sea Surface Temperature, Geophys. Res. Lett., 49, e2021GL095629, https://doi.org/10.1029/2021GL095629, 2022. a