
the Creative Commons Attribution 4.0 License.
the Creative Commons Attribution 4.0 License.
 | 29 Sep 2026
Mediterranean cyclones from pre-industrial to future climate: changes in extreme wind, precipitation and compound precipitation–wind events

Martina Messmer
Edgar Dolores-Tesillos
Christoph C. Raible
The Mediterranean is a major extratropical cyclone hotspot and heavily impacted by climate change. The aim of this study is to investigate the impact of future climate change with respect to pre-industrial conditions on extreme cyclones (EXCs) which induce extreme wind, precipitation and compounding precipitation-wind events. Using a regional climate model simulation, we show that the mean cyclone frequency is reduced by roughly a third in the Mediterranean by the end of the 21st century under the representative concentration pathway RCP8.5. Precipitation extremes occur 6 h before the pressure minimum, while the wind extreme happens during the minimum itself. For precipitation EXCs, future projections show increased precipitation during their most intense phase in the western Mediterranean (WMED), whereas precipitation from these cyclones remains similar in the eastern Mediterranean (EMED). Moreover, precipitation EXCs in the EMED are shifted southward, whereas the latitude of precipitation EXCs in the WMED remains unchanged in the future. Wind speed EXCs become more intense in both the WMED and EMED in the future under RCP8.5. The reason for this intensification is that wind speed EXCs in the future are located on the left exit of the jet streak, the latter also being intensified in the future. The future change of compounding precipitation and wind speed cyclones is similar to the individual precipitation and wind speed EXCs, with the exception that wind speed of compounding EXCs is reduced in the EMED. Thus, we find that despite a general reduction of cyclones in the Mediterranean, precipitation and wind speed EXCs intensify in the future in some areas, which implies strong socio-economic consequences for the Mediterranean region.
- Article
(8492 KB) - Full-text XML
-
Supplement
(2411 KB) - BibTeX
- EndNote


The Mediterranean has long been recognized as one of the most active cyclogenesis regions in the world (Pettersen, 1956). Due to the unique location and topography of the Mediterranean Basin, cyclones in the Mediterranean tend to be of smaller scale, shorter lifetime, and lower intensity compared to cyclones in the main storm track regions of the Atlantic and Pacific (Trigo, 2006; Čampa and Wernli, 2012; Flaounas et al., 2014). Yet, these cyclones can have severe impacts on the Mediterranean region causing heavy precipitation events (Pfahl and Wernli, 2012; Flaounas et al., 2015a; Raveh-Rubin and Wernli, 2015), intense winds (Nissen et al., 2010; Raveh-Rubin and Wernli, 2015), and coastal floods (Lionello et al., 2019; Ferrarin et al., 2021). When these hazards co-occur as compound extremes, their combined impact can exceed what either hazard would cause individually (Martius et al., 2016; Zscheischler et al., 2018; Messmer and Simmonds, 2021; Vakrat and Hochman, 2023; Givon et al., 2024; Portal et al., 2024). Given the importance of these high impact weather systems for the Mediterranean, the purpose of this study is to investigate how Mediterranean cyclones change in the future with respect to preindustrial conditions. Thereby, we focus on cyclones, which induce extreme wind, precipitation and compounding precipitation-wind events and investigate which processes explain the changes in such cyclones.
So far, changes of Mediterranean cyclones and their characteristics due to future climate change are extensively studied in global circulation models (GCMs; e.g. Lionello et al., 2002; Raible et al., 2007; Nissen et al., 2014; Hochman et al., 2020; Doensen et al., 2025). For example, Zappa et al. (2015a) showed that CMIP5 models can realistically resolve the cyclone tracks and mean cyclone-related precipitation within the Mediterranean. GCMs also project a robust reduction in future cyclone frequency in the Mediterranean (e.g. Raible et al., 2010; Ulbrich et al., 2013; Nissen et al., 2014). Raible et al. (2010) showed evidence that this reduction is due to a decrease in baroclinicity and an increase in static stability. Nissen et al. (2014) showed that the decrease can also be attributed to a positive shift in the North Atlantic Oscillation (NAO). This decrease in cyclone frequency in winter is interpreted as one major reason for the decrease in mean precipitation in the Mediterranean (Pfahl and Wernli, 2012). This decline in precipitation has already been observed in the 20th century (Trigo et al., 2000) and the region is projected to become even drier during winter in the future (Zappa et al., 2015b). Thus, global modelling studies agree that cyclone frequency is projected to decrease, inducing a reduction in mean precipitation.
Besides the impact of cyclones on mean precipitation, also precipitation extremes are related to cyclones in the Mediterranean. Extreme precipitation events normally occur in autumn in the western Mediterranean and in winter in the eastern Mediterranean (Raveh-Rubin and Wernli, 2015). Moreover, Chericoni et al. (2025) showed that future extreme cyclone-related precipitation increases despite a reduction in total seasonal mean precipitation and the number of extreme cyclones. As for precipitation extremes, wind extremes are linked to cyclone activity and occur in winter for both the western and eastern Mediterranean (Raveh-Rubin and Wernli, 2015). Most climate model projections show a decrease in cyclone-related wind speed for the Mediterranean in the future (Zappa et al., 2013; Reale et al., 2022; Dolores-Tesillos et al., 2022), however the confidence of the projections on the impact of climate change on extratropical cyclone wind speeds is low (Catto et al., 2019). Thus, consensus on cyclone-related extremes in precipitation and wind is still not achieved in climate modelling studies.
One reason for the discrepancies in global modelling studies is the representation of relevant processes leading to cyclone-related extreme events. An important process is the intrusion of stratospheric high potential vorticity (PV) air, which is a primary trigger for cyclogenesis in the Mediterranean (Raveh-Rubin and Flaounas, 2017; Scherrmann et al., 2024). Moreover, diabatic processes substantially enhance the cyclonic circulation in extratropical cyclones by low-level PV production (Davis and Emanuel, 1991). As a result, Mediterranean cyclones are dominantly the result of an interplay between baroclinicity and diabatically produced PV (Homar et al., 2002; Fita et al., 2006; Flaounas et al., 2021). Nevertheless, Mediterranean cyclones are less deep than extratropical cyclones in the main storm track regions and only develop PV anomalies of moderate intensity (Čampa and Wernli, 2012). Diabatically produced PV close to the cyclone centre is the dominant source of low-level PV in Mediterranean cyclones (Scherrmann et al., 2023). Hence, increased latent heating in a warmer climate can lead to cyclone intensification due to increased low-level diabatic PV production as shown in idealized simulations under aquaplanet configurations (Büeler and Pfahl, 2019). This intensification process is responsible for enhanced wind speeds in the warm sector of a cyclone (Dolores-Tesillos et al., 2022; Dolores-Tesillos and Pfahl, 2024). Moreover, Zhang and Colle (2018) suggested in an analysis of the East Coast of North America that future extratropical cyclones are less intense in their initial phase due to lower baroclinicity in the atmosphere, but more intense in their mature phase due to increased diabatically produced PV.
Another key process is the orographic deformation of the flow of baroclinic waves from the Atlantic generated by the Alps leading to explosive Mediterranean cyclones in the northwestern Mediterranean (Carniel et al., 2024). Raveh-Rubin and Flaounas (2017) found that the 200 most intense Mediterranean cyclones are often related to fast-intensifying cyclones in the Atlantic and are precursed by Rossby wave breaking. Additionally, cyclones associated with extreme wind speeds in the eastern Mediterranean are frequently located north of a jet streak related to the subtropical jet or a merging of the midlatitude and subtropical jet (Flaounas et al., 2015b; Raveh-Rubin and Wernli, 2015). This process is illustrated in a case study where a cyclone rapidly re-intensifies in heavy rain and wind speed after entering the left exit region of the subtropical jet and the right entrance region of the midlatitude jet (Prezerakos et al., 2005).
The processes of cyclone intensification, which generate cyclone-related extremes in precipitation and wind speed, involve a wide range of scales. GCM resolutions are often too coarse to fully represent these processes and to resolve the complex topography of the Mediterranean (Flaounas et al., 2013). Using regional climate models, Reale et al. (2022) showed in contrast to GCM results by Zappa et al. (2015a) that mean cyclone-related precipitation is projected to increase in the northern part of the western Mediterranean and decrease in the eastern Mediterranean, indicating a regional dependence of the response of these events. Schemm (2023) demonstrated that the use of high resolution in climate models is essential for accurately representing diabatic processes in cyclones to produce more realistic cyclone tracks. Hence, studying Mediterranean cyclones within high-resolution regional climate models (RCM) is beneficial. For example, Chericoni et al. (2025) showed that the ability to reproduce higher moisture fluxes in their RCM with a 12 km horizontal resolution, lead to higher cyclone-related extreme precipitation.
Thus, we build on the knowledge discussed above and investigate the impact of future climate change on extreme Mediterranean cyclones and their characteristics utilizing a high-resolution simulation produced by the Weather Research and Forecasting (WRF) model (Skamarock et al., 2021). WRF is used to dynamically downscale the Community Earth System Model (CESM; Hurrell et al., 2013) simulation from 1821 to 2100 (Doensen et al., 2025) to a 20 km horizontal and a 1 h temporal resolution. The analysis is focussed on wind, precipitation and compounding precipitation-wind extreme cyclones (EXC) in the western and eastern Mediterranean. The future climate change signal is extracted by comparing the last 60 years of the 21st century under representative concentration pathway (RCP) 8.5 conditions to the first 60 years of the simulation, representative for pre-industrial conditions.
This study is structured as follows. Section 2 describes the models, simulations and methods used. Section 3 presents the results, focussing on extreme precipitation, wind, and compounding cyclones. Then, we discuss the results in a broader context and end with final conclusions in Sect. 4.
2.1 Global and regional climate modelling
To quantify the behaviour of Mediterranean cyclones, we use a model chain from global to regional scales. The global model delivers the initial and boundary conditions for the regional model. The Community Earth System Model (CESM version 1.2.2; Hurrell et al., 2013) serves as global model. Kim et al. (2021) used this model to perform a late Holocene simulation, spanning 3600 years from 1500 BCE until 2100 CE (using the representative concentration pathway RCP8.5 scenario from 2012 to 2100). The output of this simulation has a temporal resolution of 6 h and a spatial resolution of 1.9° (latitude) × 2.5° (longitude) in the atmosphere and over land, and a nominal 1.0° × 1.0° resolution for the ocean and sea ice. The CESM simulation contains 30 vertical levels. In this study, we focus on the period from 1821 CE to 2100 CE (280 years) to capture both the pre-industrial and the future climate.
As RCM, we use the Weather Research and Forecasting (WRF) model version 4.3 (Skamarock et al., 2021) for dynamical downscaling. WRF is a mesoscale model that is based on the non-hydrostatic equations and a set of parameterizations to represent sub-grid-scale processes. We used the set of parameterization schemes listed in Table 1. For the Noah-MP land surface model, the phase change of glaciers is turned off, since this option causes numerical instabilities in our simulation.
(Thompson et al., 2008)(Dudhia, 1989)(Mlawer et al., 1997)(Jiménez et al., 2012)(Niu et al., 2011)(Hong et al., 2006)(Kain, 2004)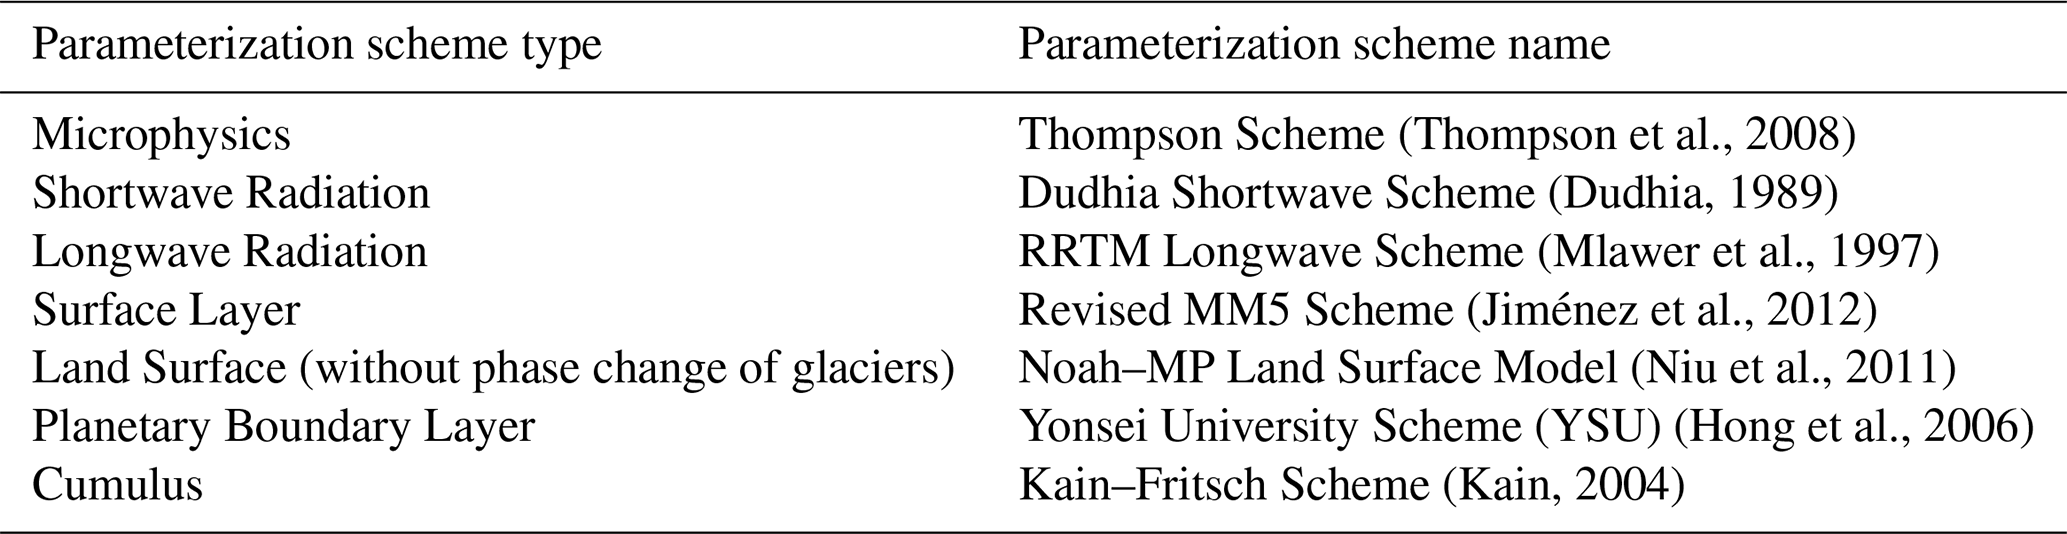
The 280 years of the CESM simulation are dynamically downscaled to a horizontal resolution of 20 km and 49 vertical levels. A fixed time step of 120 s is used, and the data is stored with an hourly temporal resolution. To save time, we split up the 280 years in roughly 35 year chunks that always overlap for 2 years in time. The 2-year overlap is used as spin-up time for each chunk. Note that the land and atmosphere usually reach equilibrium after 6 to 12 months (Jerez et al., 2020). We use a single-domain setup covering the Euro-Atlantic area (Fig. 1). Nudging to the large scale circulation of the CESM simulation is switched off, as the main cyclogenesis regions for Mediterranean cyclones are within this domain, and cyclones forming within this domain could develop their own dynamics independent of CESM input data. Although a horizontal resolution of 20 km is insufficient to numerically resolve convective processes, it is sufficient to accurately represent cloud-diabatic processes in fronts and conveyor belts that are crucial features in extratropical cyclones (Willison et al., 2013; Catto et al., 2019).
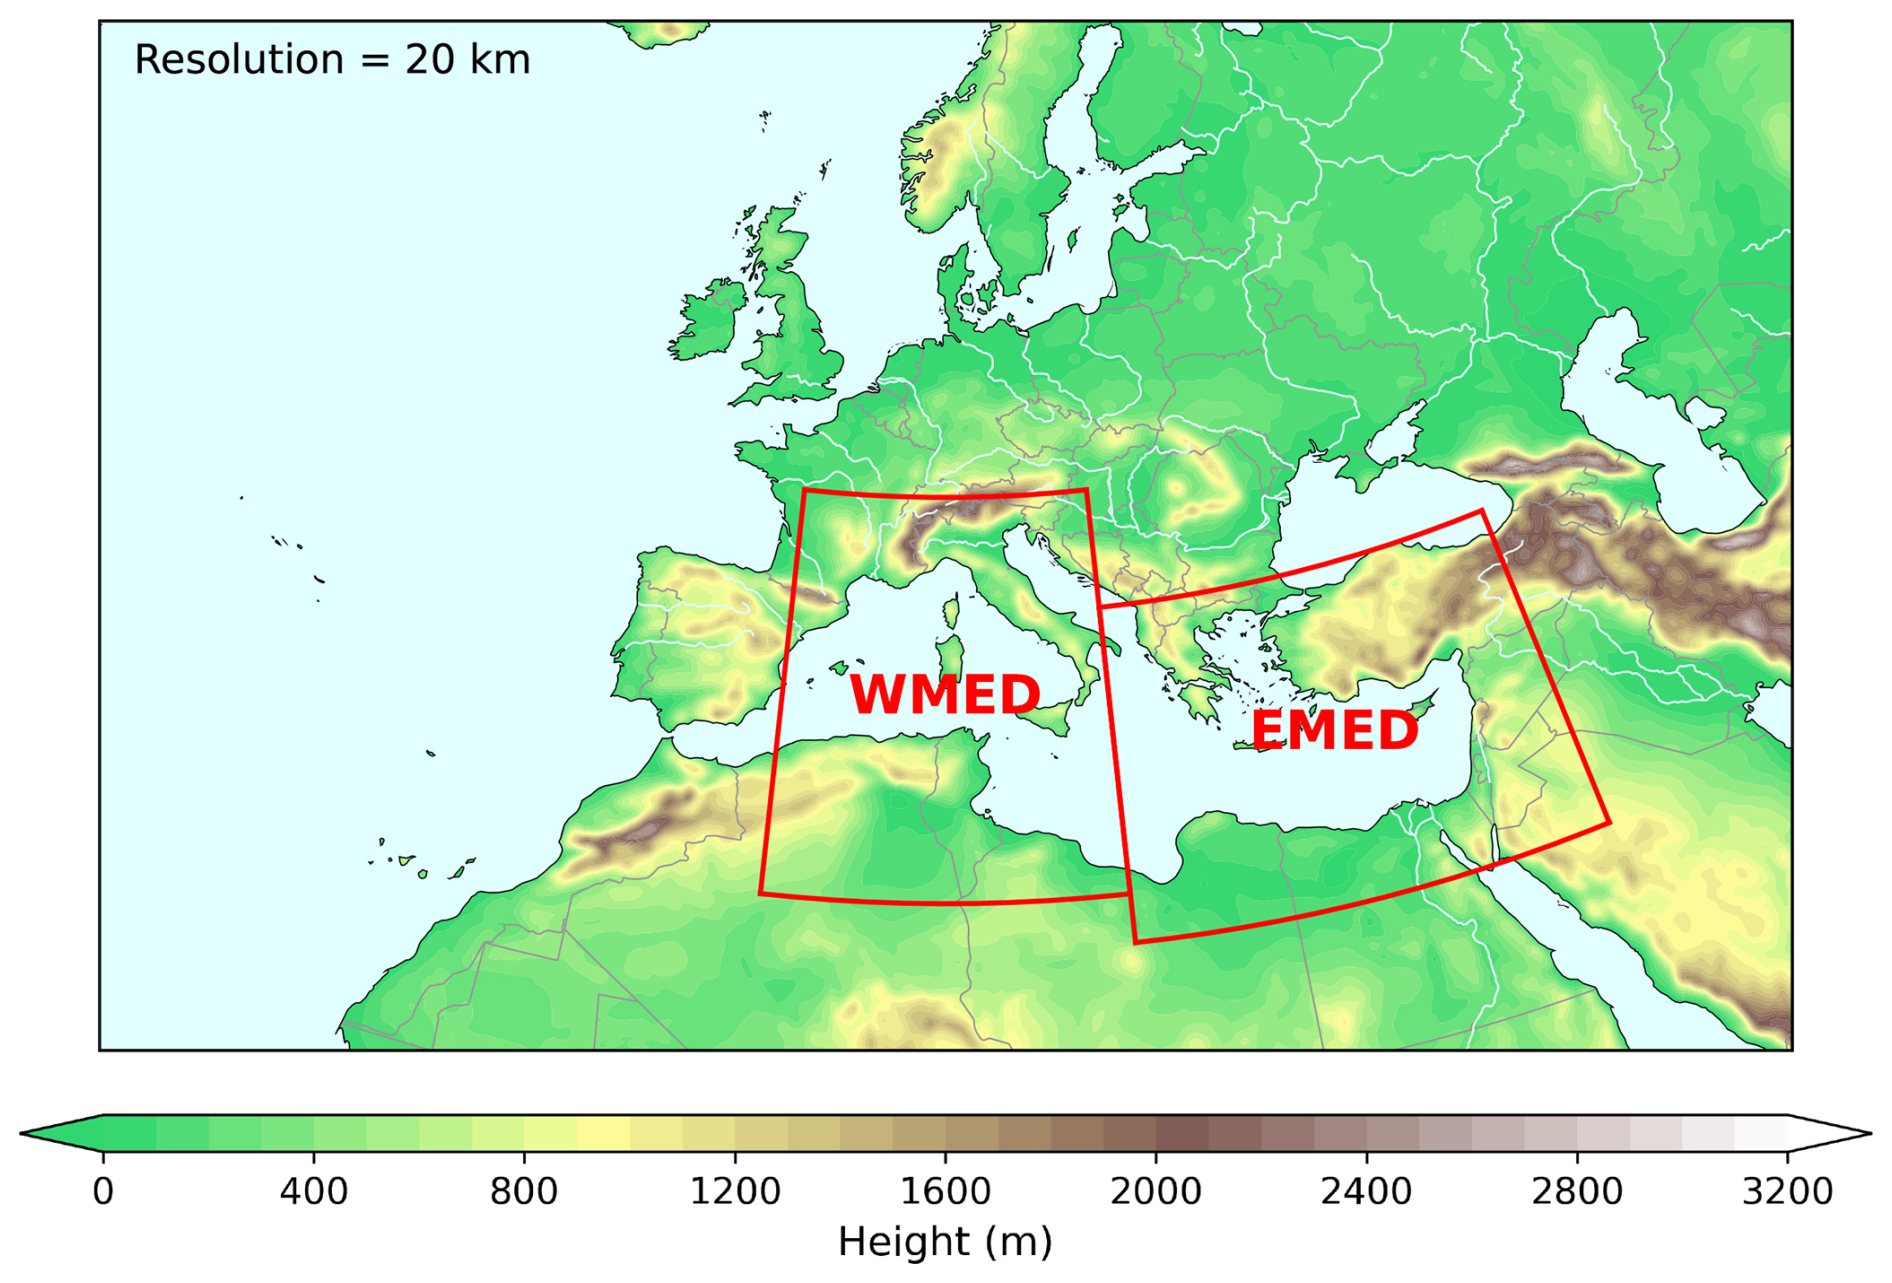
Figure 1The domain used for the WRF simulation. The two subdomains used for the analysis are highlighted in red: Western (WMED) and eastern Mediterranean (EMED). Shading indicates the height of the model orography in meters above sea level using the WRF topography Global Multi-resolution Terrain Elevation Data (GMTED2010) provided by the United States Geological Survey (Danielson and Gesch, 2011).
2.2 Cyclone tracking algorithm
Extratropical cyclones are tracked with the cyclone tracking algorithm developed by Blender et al. (1997), which is extended by Schneidereit et al. (2010) and Raible et al. (2018). It has been shown that this algorithm can represent cyclones realistically (Raible et al., 2008; Neu et al., 2013; Doensen et al., 2025).
The algorithm tracks minima in the geopotential height field, and we apply it to the hourly 850 hPa geopotential height (Z850) field in WRF. Since tracking cyclones in the lower atmosphere at higher resolution is difficult, due to the complex Mediterranean topography, we regrid the Z850 field of the WRF simulation to 1° × 1° resolution (roughly 100 km). The regridding excludes weak and unphysical lows. Additionally, we apply a linear smoothing of all grid cells within 2° of one grid cell. With this, we prevent cyclone tracks from being split into multiple tracks. To further limit the number cyclones, the following criteria of identified local minima must be met:
-
A minimum mean gradient of at least 20 geopotential meters (gpm) per 1000 km.
-
A minimum mean gradient of 75 gpm per 1000 km at least once during the lifetime of the cyclone.
-
Local minima over grid cells with an orography higher than 1000 m above sea level are excluded.
-
To connect all the minima of a cyclone track together, a minimum in the following time step is identified with a next-neighbour search. The new minimum of the cyclone 1 h later had to be within roughly 40 km of the previous cyclone minimum.
-
The minimal lifetime of a cyclone is at least 12 h.
Since the cyclones are tracked on the 1° × 1° Z850 field, the location of the cyclones often does not match the actual Z850 minimum in the higher 20 km resolution data. Therefore, for every point within the cyclone track, we search for the actual Z850 minimum in the higher resolution Z850 field within a 100 km radius of the original cyclone track point. Next, we assume a cyclone radius of 500 km which corresponds to the average radius found for Mediterranean cyclones (Trigo et al., 1999). We use this cyclone radius to exclude wind speed and precipitation that are not cyclone-related.
2.3 Definition of cyclone-related extremes
To compute how extreme each cyclone track is, we perform the following procedure for the WMED and EMED respectively:
-
To select the most intense wind speed EXCs, we only consider the 95th-percentile 850 hPa wind speed (WS850) of all grid cells within the predefined 500 km cyclone radius. This is only done at the time the cyclone reaches its minimal sea level pressure. The time of minimum core pressure, defined as tslp, is a solid indication of when a cyclone reaches its highest wind speed (Pfahl and Sprenger, 2016).
-
Precipitation generated by Mediterranean cyclones often peaks a few hours before the cyclone reaches its minimum core pressure (Flaounas et al., 2018). Thus, for 6 h accumulated precipitation (precip6 h) we compute the 95th-percentile within the cyclone radius. We define precip6 h as the sum 3 h before and 2 h after each time point within the cyclone track. Eventually, we only retain the highest precip6 h within the cyclone track and define the time at which this occurs as tprecip.
-
Each track is only considered if at least one point of the track crosses the WMED or EMED, respectively. Also, we ignore all WS850 and precip6 h values that lie outside the predefined coordinates of the WMED and EMED regions. Thus, the cyclone at tslp or tprecip is always located within the WMED and EMED box.
-
Next, we consider all precip6 h values at tprecip, and all WS850 values at tslp of the tracks that meet the criteria of the previous point for the whole 280 year period. These values are then normalized by their standard deviation. This step provides a measure of extremeness for precip6 h and WS850 expressed in how many standard deviations they deviate from the mean of all the tracks. Since the distribution of precip6 h values is highly skewed, we use a power-law transformation after normalization to make the precip6 h distribution Gaussian. Technically, we use the two-thirds power transformation, which is equivalent to taking the cube root of the squared precip6 h data. A Gaussian distribution is needed to determine the joint distribution for the compounding EXCs.
-
Lastly, cyclones are ranked by their extremeness, measured in standard deviation from the mean. We also do this for the joint distribution of precip6 h and WS850 to quantify the extremeness of precipitation-wind compounding cyclones.
2.4 Definition of regions and study periods
To highlight the climatological differences within the Mediterranean, we split up the Mediterranean into two regions (two red boxes in Fig. 1), namely the western Mediterranean (“WMED”, between 0–17.5° E and 30–47° N), and the eastern Mediterranean (“EMED”, between 17.5–40° E and 28–42° N). All analyses are performed for each region separately.
To assess the effect of climate change on Mediterranean cyclones, we use two 60-year periods. The first period is defined as all winter half-years (ONDJFM) starting in October 1821 until March 1881 and roughly representing the pre-industrial climate. The second period is defined as all winter half-years from October 2039 until March 2099 representing the future climate under the RCP8.5 scenario. These periods and the EXCs within these periods will be referred to as past and future, respectively.
We apply a Kolmogorov–Smirnov (KS) test (Kolmogorov, 1933) in the analyses to test statistical significnace at the 5 % level. For the location, we use KS test to see if the median latitude and longitude of the future EXC changes. For the seasonality, we use the KS test to examine whether future EXCs occur at different times. This is done by analysing the median day-of-year of each EXC type changed for each region and time period.
2.5 Composite analysis
Finally, a cyclone-centred composite analysis is performed on the 50 most extreme EXCs found in the WMED and EMED, respectively. We identify roughly 1000 cyclones per period and region. For the composite analysis, we select the 50 most extreme cyclones, defined with respect to the 95th percentile of precipitation, wind speed, and wind-precipitation compound EXCs. The analysis is performed for cyclones associated with cyclone-related precipitation, wind, and compound extremes, separately.
-
For each cyclone track, we set the reference at time tslp for wind EXCs and tprecip for precipitation EXCs. Every track timestep after tslp or tprecip receives a positive index, and the track timesteps before tslp or tprecip a negative index.
-
For each of the hourly time steps of the cyclone track, all fields are centred at the location of the cyclone, given by its minimum Z850 (which we use for the tracking). With this approach, the model data for each cyclone track point is independent of its geographical location.
-
We are only interested in the 12 h before and after tslp or tprecip for each cyclone to capture the intensification and mature phase of the cyclone.
-
Within this time period, we compute spatial averages of the 50 most extreme EXCs.
We perform the above analysis for the WS850, precip6 h, and the 200 hPa wind speed (WS200) field. Note that some EXC tracks may initialize later than 12 h before tslp or tprecip, and may also disappear earlier than 12 h after tslp or tprecip. Hence, the composites shown at 12 h before and after tprecip or tslp consists of slightly less than 50 EXCs. To compute whether the differences in spatial means for past and future cyclones are statistically significant we apply a Welch's t-test (Welch, 1947) to the spatial composite.
Furthermore, we compute vertical cross-sections for the 50 most extreme precipitation EXCs along an east–west plane through the cyclone core spanning 1600 km in total. For these vertical cross-sections, we compute PV anomalies, potential temperature (θ) and equivalent potential temperature (θe) for 21 pressure levels up to 100 hPa (50 hPa intervals from 100 to 900 hPa and 25 hPa intervals from 900 to 1000 hPa). PV anomalies are computed by subtracting the daily PV climatology, calculated separately for the past and future period, from the instantaneous PV fields. The climatology is derived by averaging PV for each calendar day and applying a centred 31 d running mean.
We also compare some analyses in WRF to ERA5 reanalysis data (Hersbach et al., 2020) for the period October 1981 to March 2011 to capture 30 winter half years. Like in WRF, we track cyclones on 1° resolution in ERA5, but for the EXC composite analysis we use the highest available ERA5 resolution of 0.25°, and regrid the WRF data to the ERA5 resolution for a fair comparison.
3.1 Climatology of mean and extreme cyclones
First, we characterize the preferred regions of all cyclones in the Mediterranean. Therefore, we use the cyclone frequency, defined by how often a grid cell is located within the 500 km radius of a cyclone in the original WRF grid. The comparison of WRF with ERA5 for the time period 1981 to 2010 shows that WRF overestimates the number of cyclones for most of the domain (Fig. S1 in the Supplement). This is to some extent expected as WRF is higher resolved. Regionally, the main cyclone hotspots extend from Italy towards the Levant in WRF (Fig. S1a), whereas in ERA5 this is more confined to the region around Italy (Fig. S1b). Thus, biases in cyclone frequency are evident over the eastern Mediterranean and eastern Europe (Fig. S1c), whereas biases over the western Mediterranean are small.
Regions of high cyclone frequency exhibit the highest cyclone frequencies in both the past (up to 0.09 cyclones d−1; Fig. 2a) and the future (up to 0.07 cyclones d−1; Fig. 2b). Comparing the future with the past period, a decrease in cyclone frequency is evident (Fig. 2c). Apart from a few regions in northern Africa, all regions in the Mediterranean show a decline in mean cyclone frequency. This is particularly true for the hotspot over Italy and the Anatolian Plateau, which show the largest absolute decrease in cyclone frequency (up to 0.02 cyclones d−1), which in relative terms indicates a decrease of roughly one-third.
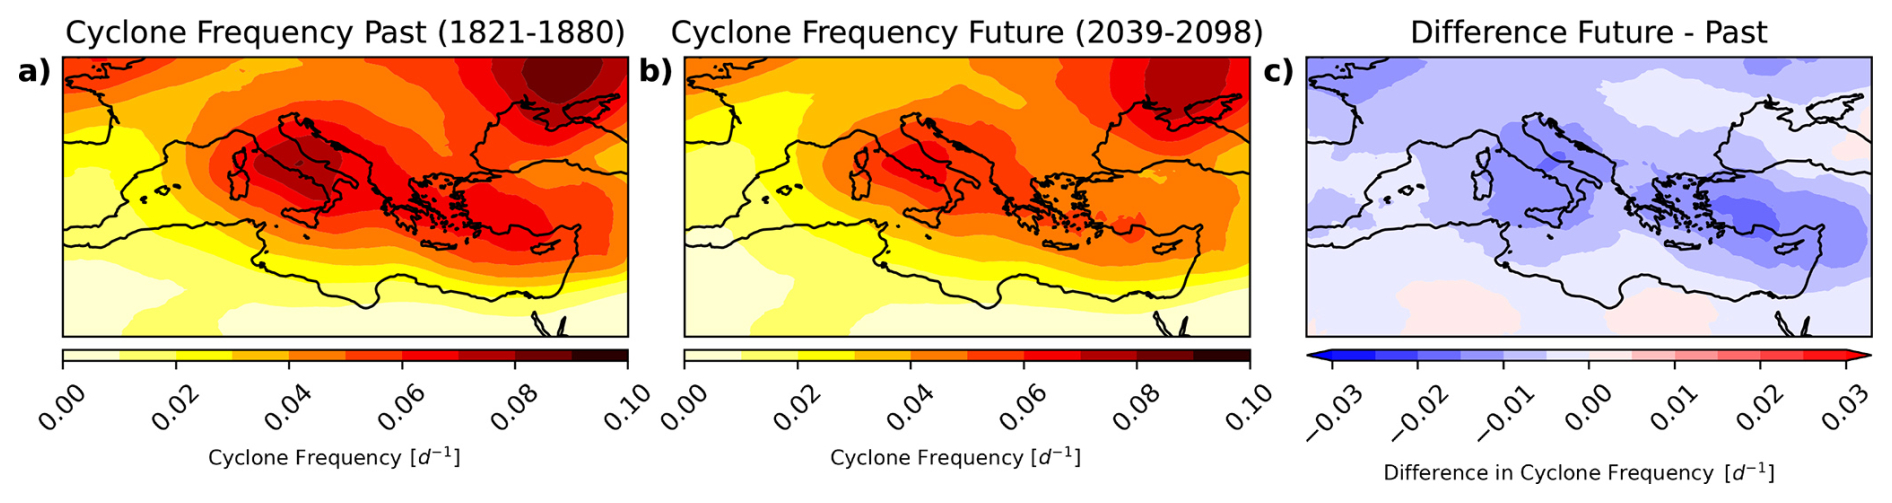
Figure 2Mean cyclone frequency in the Mediterranean for the past (a; 1821–1880), the future (b; 2039–2098) and the absolute difference between the future and the past (c). Shading shows the number of times (d−1) where a grid cell is within the 500 km radius around a cyclone centre.
Besides the mean cyclone frequency, also the spatial distribution of the 50 most extreme EXCs is analysed. In Fig. 3 the locations of past and future EXCs for each region and each category are shown. In the WMED (Fig. 3a–c), wind speed EXCs are distributed over the entire domain, whereas precipitation and compound EXCs cluster over the warm waters of the Tyrrhenian and Adriatic Sea, and over Northern Italy. Future precipitation EXCs in the WMED (Fig. 3b) occur less often over the Mediterranean and Ligurian Sea. In the EMED (Fig. 3d–f), all EXC types cluster in the Ionian and Aegean Sea, and over northern Greece and the Anatolian Plateau. Future precipitation and compound EXCs (Fig. 3e and f) shift south towards the Mediterranean Sea.

Figure 3Location of 50 most extreme EXCs in WMED (a–c), and EMED (d–f). Shown are locations of wind EXCs (left column), precipitation EXCs (middle column), and compound EXCs (right column) at tslp. Black circles indicate past EXCs, red triangles indicate future EXCs. The bars indicate the number of cyclones binned in groups of 10 for each longitude and latitude. Green, blue and orange bars show wind, precipitation and compounding EXCs, respectively. The lighter shaded bars indicate past EXCs, whereas darker shaded bars indicate future EXCs. Hatched bars show a statistically significant change (5 % level) in longitude or latitude.
Additionally, we show histograms of the longitudes and latitudes (Fig. 3) to investigate whether the median location of EXCs changes as a result in the future. The southward shift of precipitation and compound EXCs in the EMED in the future is statistically significant at the 5 % level. We also find a significant eastward shift of compound EXCs in the WMED in the future (Fig. 3c), and of wind EXCs in the EMED (Fig. 3d). The latter is caused by the cluster appearing in the Levant in the future.
Besides the spatial changes, we also investigate changes in the seasonality of EXCs during the extended winter season. In Fig. 4, we show the number of EXCs that occur every month of the winter half-year for the WMED (Fig. 4a) and EMED (Fig. 4b) in the past and the future. Wind and compounding EXCs occur evenly over the entire winter half-year in both regions. Yet, wind EXCs occur more frequently in the second and colder part of the winter half year, whereas compounding EXCs are more frequent during the beginning of the winter half-year. The occurrence of precipitation EXCs (blue bars) peaks in autumn when the Mediterranean Sea is still warm and able to provide moisture to the atmosphere. In the second half of the winter half year precipitation EXCs become rare in both regions. The decrease in precipitation EXCs is very abrupt in the WMED, and more gradual in the EMED. Comparing the past with the future EXC distribution, we do not find a statistically significant change in the median time of occurrence of any EXC type in any region. Thus, the seasonality of extreme cyclones remains unchanged under future RCP8.5 conditions.

Figure 4Number of Mediterranean EXCs per month in the WMED (a) and EMED (b). Green, blue and orange bars show the number of wind, precipitation and compounding EXCs, respectively. Plain bars indicate the number of EXCs in the past (1821–1880), and semi-transparent coloured bars indicate the number of EXCs in the future (2039–2098).
3.2 Cyclones associated with extreme precipitation
In this section, we assess the life cycle of precipitation EXCs using a composite analysis. In Fig. 5, the 50 most extreme precipitation EXCs are shown for the WMED and EMED, assessing past and future EXCs before, at and after their most intense precipitation phase tprecip. In all composites, we see the structure of a cyclone with a clear minimum in sea level pressure and precipitation bands north and southeast of the EXC centre.
First, we analyse the life cycle of past precipitation EXCs (Fig. 5a–c and j–l). 12 h before tprecip (left column), the highest precipitation is located north of the EXC centre in both regions, with the highest precip6 h values located very close to the EXC centre (Fig. 5a, j). This is in agreement with ERA5 as the comparison for the period 1981–2010 shows, although WRF overestimates precip6 h 12 h before tprecip (Fig. S2). In the EMED, a precipitation band southeast of the EXC centre is present, which indicates the development of frontal structures (Fig. 5j). At tprecip (Fig. 5b, k), precipitation further intensifies and the development of frontal structures southeast of the cyclone core is evident. Highest precip6 h values are still located north of the EXC centre, with precip6 h values up to and exceeding 25 mm 6 h−1 for past (Fig. 5b) and future (Fig. 5e) EXCs in the WMED, respectively. Again WRF agrees with ERA5, but overestimates precip6 h at tprecip (Fig. S2). In the composites 12 h after tprecip, precip6 h significantly decreases in both regions (Fig. 5c, l). Close to the EXC centre, precip6 h has fallen by 10 to 15 mm 6 h−1. Nevertheless, frontal structures are still apparent in both regions. The decay process is well simulated as the comparison to ERA5 shows (Fig. S2). The life cycle of precipitation follows a general intensification of the pressure field. The core pressure of precipitation EXCs falls by 5 hPa between 12 h before tprecip and tprecip. 12 h after tprecip, the core pressure is still low, which is due to the fact that precipitation peaks before core pressure reaches its minimum.

Figure 5A composite of the 50 most extreme precipitation EXCs in the WMED (a–i) and EMED (j–r) showing 6-hourly accumulated precipitation (precip6 h) in shading. Panels (a)–(c) and (j)–(l) show composites for the past (1821–1880), panels (d)–(f) and (m)–(o) show composites for the future (2039–2098), and panels (g)–(i) and (p)–(r) show the differences between the past and future, where stippling indicates that differences are statistically significant (5 % level). Contour lines indicate the mean sea level pressure. The left column shows composites 12 h before tprecip, the middle column at tprecip and the right column 12 h after tprecip.
The life cycle of future precipitation EXCs shows a similar intensification process for precip6 h and core pressure for both regions (Fig. 5d–f and m–o). To illustrate the climate change signal in the life cycle, we focus on the difference between past and future EXCs in both regions (Fig. 5g–i and p–r). First, we consider the composites 12 h before tprecip. A future decrease of precip6 h around the EXC centre in both regions appears. In the WMED, this decrease is rather minor, and not significant (Fig. 5g). In the EMED (Fig. 5p), precip6 h decreases up to 8 mm 6 h−1, i.e., a decrease of almost half. Notably, precipitation increases significantly further away from the EXC centre in the EMED. The reduction in precipitation is less at tprecip. For precipitation EXCs in the WMED (Fig. 5h), a dipole pattern forms with a significant increase in precip6 h just north of the EXC centre and within the frontal zones southeast of the EXC centre. A significant decrease in precipitation just south of the EXC centre appears. The areas where precip6 h increases also overlap with the areas where precip6 h is highest already (Fig. 5b and e), thus indicating an increase in the impact of future precipitation EXCs at tprecip in the WMED. In the EMED, a decrease in precip6 h is still apparent around the EXC centre at tprecip (Fig. 5q), although the magnitude of the decrease is smaller and the signal is not statistical significance. Thus, the results suggest that at tprecip, precip6 h increases in precipitation EXCs in the WMED and stays roughly the same in the EMED. The difference between the regions remains in the composites 12 h after tprecip. In the WMED, we find a significant precip6 h increase of roughly 5 mm 6 h−1 north of the EXC centre (Fig. 5i). This is a doubling compared to past precipitation EXCs (Fig. 5c).
At 12 h before tprecip, future extreme precipitation EXCs are slightly less deep in terms of core pressure compared to past precipitation EXCs in both the WMED and the EMED. This suggests that future precipitation EXCs are less intense with respect to pressure before their mature stage, providing a partial answer to why future precip6 h decreases compared to the past in both regions. At tprecip, precipitation EXCs are equally deep for the past and future in the WMED where future precipitation EXCs deepen more quickly in 12 h (Fig. 5a–b vs. Fig. 5d–e). In the meantime, the higher core pressure for future precipitation EXCs persists in the EMED (Fig. 5k vs. Fig. 5n). This could explain why precip6 h in the WMED increases, in contrast to the EMED. Also 12 h after tprecip, the difference in core pressure between the WMED and EMED persists.
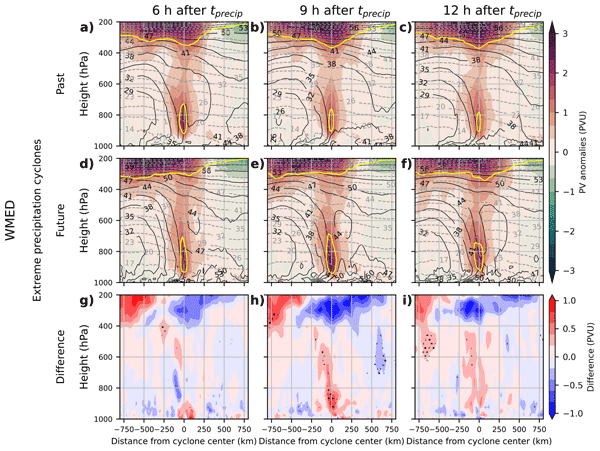
To further explain why future precipitation WMED EXCs are stronger in their mature phase, we show vertical cross-sections of PV anomalies, potential temperature (θ) and equivalent potential temperature (θe) within the composites of Fig. 5. We focus on 6, 9 and 12 h after tprecip, as differences in PV between past and future EXCs only emerge in the mature phase of the cyclone.

Figure 6Vertical cross-section of WMED precipitation EXCs ranging from 800 km west to 800 km east of the EXC centre, right through the EXC centre. Shading shows PV anomalies [PVU], continuous contour lines show equivalent potential temperature (θe) [°C] and dashed contour lines show potential temperature (θ) [°C]. Shown are past precipitation EXCs (a–c), future precipitation EXCs (d–f) and the difference between the future and past for 6 (left column), 9 (middle column) and 12 h (right column) after tprecip. Stippling indicates a statistically significant difference (5 % level). The yellow line indicates the 2 PVU contour of instantaneous PV.
In all sub-panels of Fig. 6, we find higher θ and θe values in the right half of the vertical cross-sections and lower values in the left half, highlighting the warm and cold sector of the EXCs, respectively. In the warm sector, θ and θe differ more than in the cold sector, indicating the greater moisture content of the warm sector . Besides, the negative vertical gradients in θe in the lower part of the troposphere (e.g. in the right-hand side of Fig. 6e) points to convective instability, which can contribute to precip6 h that we observe in Fig. 5. Both θ and θe increase for future EXCs (Fig. 6a–c) vs. Fig. 6d–f), but θe in the warm sector increases up to 9 °C, showing a combined increase in temperature and moisture in the atmosphere in the future, which further explains the increase in precipitation of EXCs in WMED.
Looking at PV anomalies, we also find future changes in the vertical structure of PV (Fig. 6). In all composites around 300 hPa, we identify high PV air in excess of 2 PVU (indicated by the yellow line) indicating the stratospheric air masses. The high PV anomalies above the yellow line indicate a lowering of the tropopause in the vicinity of precipitation EXC. This is in contrast to the upper atmosphere east of the cyclone centre, which is dominated by negative PV anomalies indicating a higher than usual tropopause. Additionally, so-called PV towers extend though the entire troposphere are present in the cyclone centre (Fig. 6). These PV towers consist of high-PV stratospheric air intruding into the top of the PV tower, and diabatically produced PV in the lower troposphere. The lower part of the PV towers exhibit sufficiently large PV values such that the 2 PVU line appears in all composites. Overall, we see the same structures also for precipitation EXCs in the EMED (Fig. S6a–f).
Considering the future differences in Fig. 6g–i, we see a decrease of PV near the tropopause in the warm sector, indicating the lifting of the tropopause. In the cold sector, PV increases near the tropopause, which indicates stronger PV advection from the stratosphere and is also indicative of a more intense baroclinic cyclone. Interpretations should be taken with care, though, as the changes observed near the tropopause are at most marginally statistically significant (at the 5 % level). Still, this enhanced advection of high PV air for precipitation EXCs is not found in the EMED (Fig. S6g–i). The PV values within the lower part of the PV tower increase for future precipitation EXCs (Fig. 6g–i). This is particularly apparent at 9 h and to a lesser extent at 12 h after tprecip (Fig. 6h and i) with increases up to 1 PVU. Although the increase is marginally significant, this still indicates an increase of up to 50 % in instantaneous PV in Fig. 6h. This is most likely due to an increase in diabatically produced low-level PV as a result of more moisture and hence higher latent heat realease in future WMED precipitation EXCs. This may enhance the cyclonic circulation and provide a mechanism of why future WMED precipitation EXCs exhibit a stronger intensification and stay more intense in their mature phase. We also see an increase of PV in the PV towers associated with future precipitation EXCs in the EMED, but this increase is clearly less robust (Fig. S6g–i).
3.3 Cyclones associated with wind extremes
In this section, we investigate the life cycle of the wind EXCs, following a similar strategy as with precipitation EXCs. In Fig. 7, we find that the highest WS850 values are generally located just south or southeast of the EXC centre with WS850 values of up to 25 m s−1. Minimum core pressure falls below 990 hPa in most composites, and core pressures are generally up to 10 hPa lower than for precipitation EXCs. Also, the isobar spacing is wider, indicating a weaker pressure gradient.
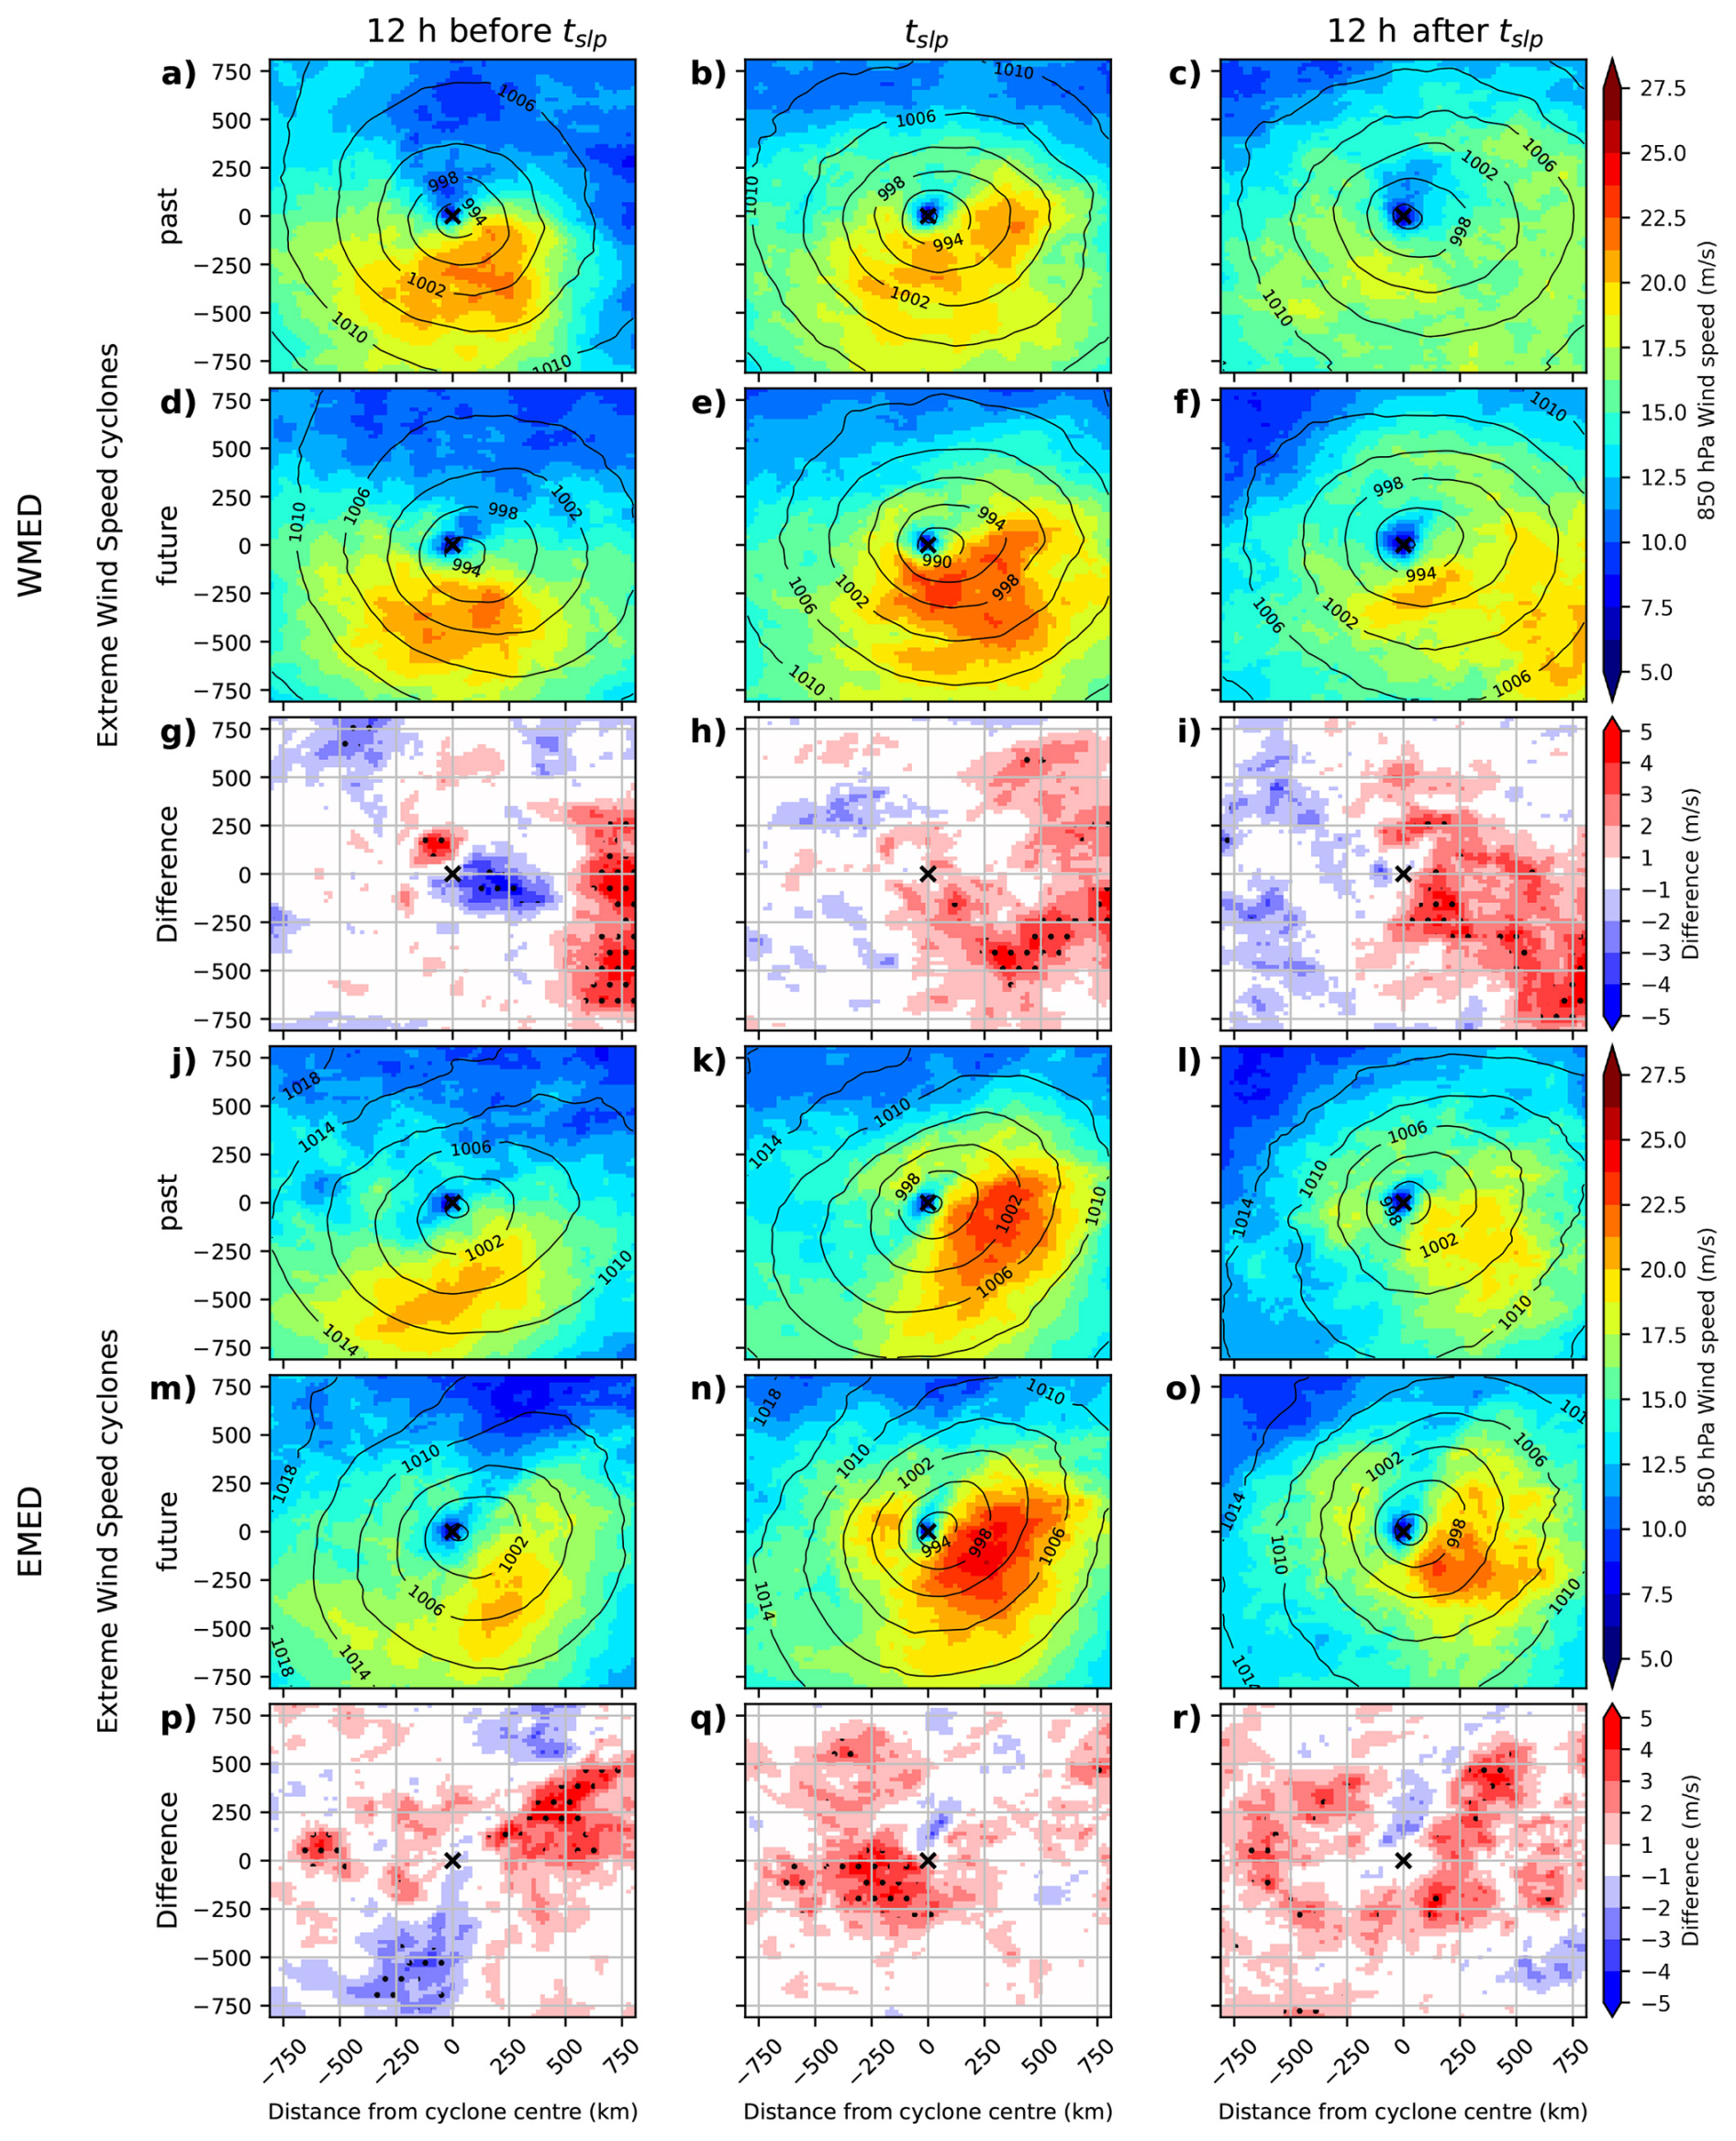
Figure 7Same as Fig. 5, but now for 850 hPa wind speed (WS850). The left column now indicates 12 h before tslp, the middle column at tslp, and the right columns 12 h after tslp.
The life cycle of past wind EXCs and its associated wind field is shown in Fig. 7a–c and j–l. 12 h before tslp (left column), the wind EXCs is already substantially deep, and the wind field is strongest south and southeast of the core. The comparison with ERA5 for the period 1981–2010 shows that WRF represents this state but overestimates WS850 in wind speed EXCs (Fig. S3). EXCs in the WMED (Fig. 7a and d) are slightly deeper and more intense than wind EXCs in the EMED (Fig. 7j and m). At tslp (middle column), the wind EXCs has deepened around 4 hPa in all composites. The wind field has clearly intensified and expanded, especially in the EMED. Wind EXCs in the WMED are slightly deeper than in the EMED (roughly by 4 hPa), and achieve higher WS850 values in the EMED. A difference between the two regions is that wind EXCs in the EMED have a much more southwest-northeast orientation than in the WMED. WRF agrees with ERA5 but shows an even stronger overestimation of WS850 in wind speed EXCs by up to 6–8 m s−1 than hours before tslp (Fig. S3). 12 h after tslp (right column), the core pressure of the EXC has increased, and the wind field has shrunk in size and intensity. We also see a general shift of the remaining wind field towards the east relative to the EXC centre compared to the composites 12 h before tslp, especially in the WMED. WS850 in the EMED (Fig. 7l and o), is slightly higher than in the WMED (Fig. 7c and f) by about 2–3 m s−1 at tslp. Again the general decay behaviour of WRF is resembling ERA5 but the overestimation of WS850 in wind speed EXCs persists (Fig. S3).
The life cycle of future wind EXCs intensifies in a similar way as the one of past wind EXCs (Fig. 7). To extract the future climate change signal, we show the difference between the past and the future (Fig. 7g–i and p–r). 12 h before tslp (left column), in the WMED (Fig. 7g) we find a complex pattern of WS850 changes near the EXC center, with opposing anomalies largely offsetting each other. 750 km east of the EXC center, the wind speed is signifcantly increased by up to 4 m s−1 in the future. In the EMED, we also find a complex pattern in wind speed differences between the past and future (Fig. 7p) which is different to the WMED. The EMED wind cyclones show an increase in wind speed west and east of the cyclone core and a decrease south of the cyclone core. This is mainly due to differences in wind field orientation, as the analysis of the shape of past and future EXCs (Fig. 7j, m) suggests.
At tslp (middle column), we see a more axisymmetric pattern in wind speed differences. In the WMED, an increase in WS850 appears (Fig. 7h) that is consistent along the composite, with a significant increase in WS850 in the southeastern quadrant of the composite, which is also the quadrant with the highest WS850 overall. Only in the western half of the EXC do we observe a decrease in WS850, but this decrease is not statistically significant. Unlike the WMED, in the EMED we observe a statistically significant increase in wind speed in the western half of the EXC composite (Fig. 7q). Comparing the shape of the wind field between past and future EXCs (Fig. 7k, n), this increase is mainly induced by a small wind field just west of the core for future EXCs. Apart from that, the wind fields stay similar in size and intensity.
12 h after tslp (right column), the differences are similar to the ones at tslp. Again, we see a significant increase in WS850 in the southeastern quadrant in the WMED and a non-significant decrease in the western half of the composite in the WMED (Fig. 7i). In the EMED, we see a significant increase just south of the EXC centre (Fig. 7r). Note that the magnitude of these differences is equal to the ones at tslp (Fig.7h and q) but occur at lower overall WS850 values, so the relative difference between past and future wind EXCs 12 h after tslp is greater compared to tslp.
At 12 h before tslp, past and future EXCs in both regions have roughly the same core pressure. At tslp, future cyclones deepen more and core pressure for EXCs in both regions is lower than for past cyclones (roughly 4 hPa). This difference persists 12 h after tslp, where the differences in core pressure increase further. This provides a partial explanation of why wind speed EXCs are stronger in their mature phase.
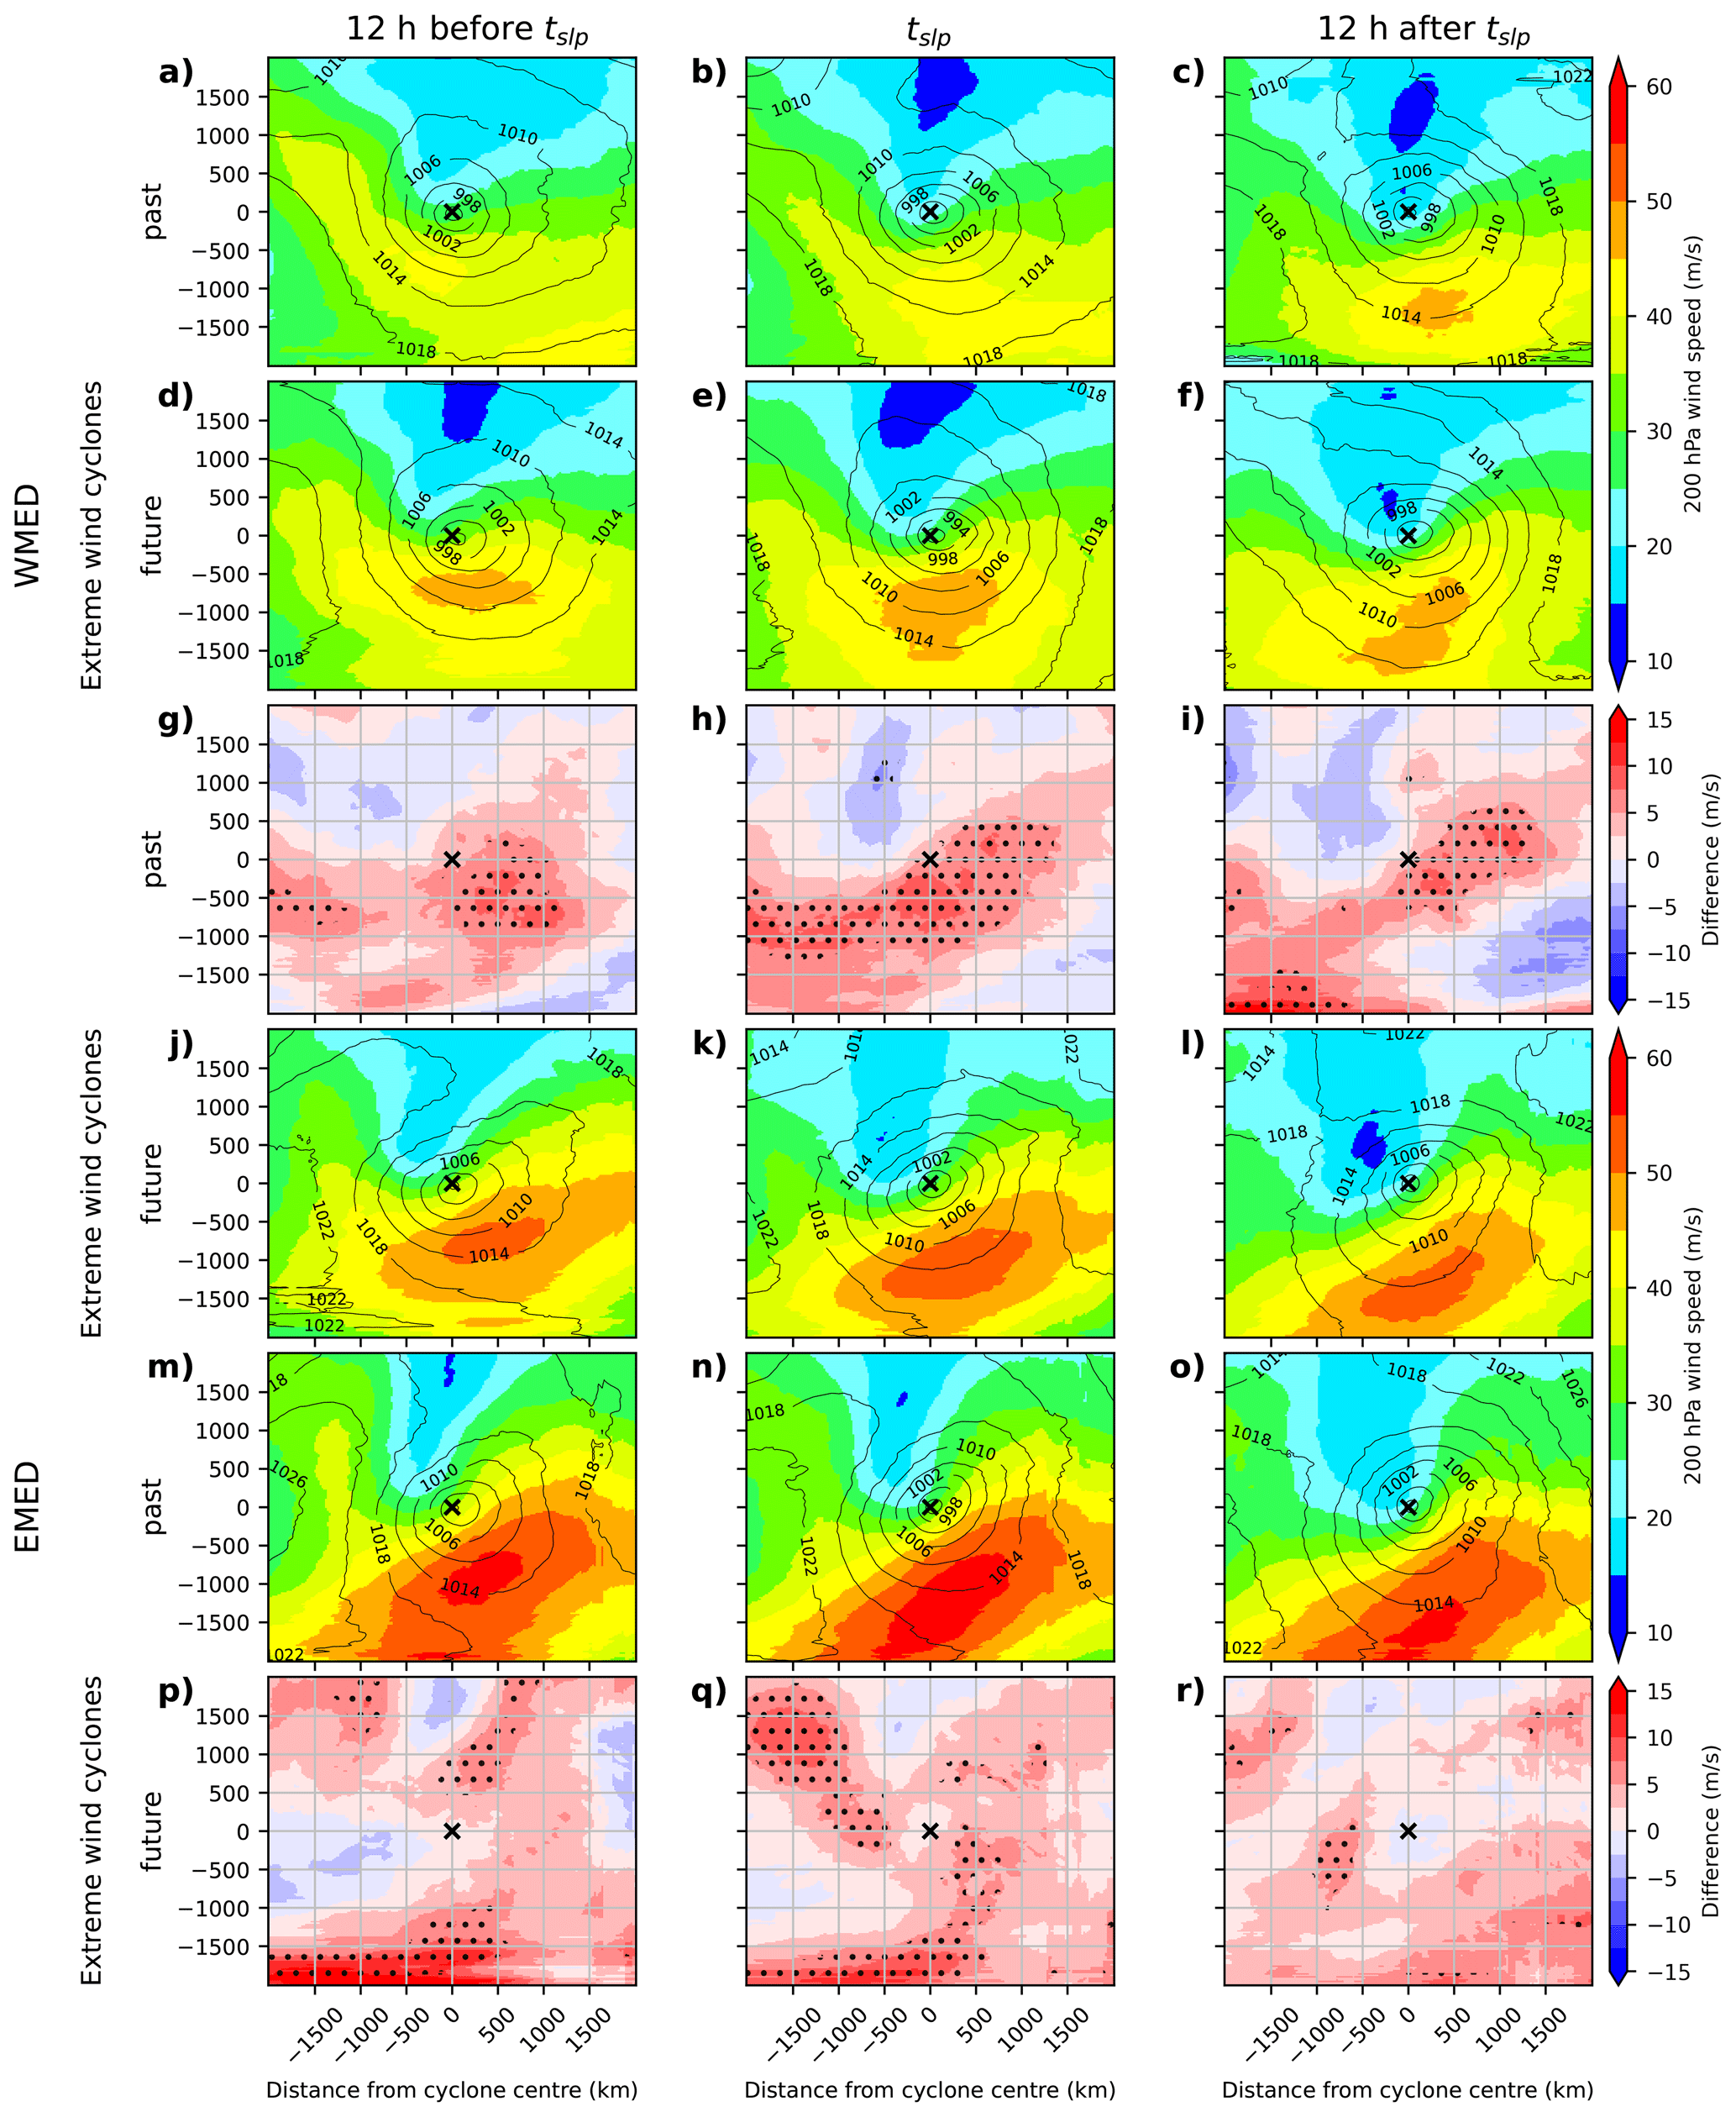
Figure 8Same as Fig. 7, but now for 200 hPa wind speed (WS200). Note that the domain of the composites has expanded from 750 to 2000 km.
For wind EXCs we do not find a significant increase in low-level PV that could explain the future intensification observed in Fig. 7 (not shown). To further understand why wind EXCs in the future are stronger in their most intense and mature phase, we investigate the jet stream as a potential driver. In Fig. 8, we apply the same composite analysis as in Fig. 7, but now to wind speed at 200 hPa (WS200) characterizing the strength and location of the jet stream relative to the wind EXCs. The analysis shows that WS200 values are the highest about 1000 km south of the EXC centre, indicating that wind EXCs are usually located on the northern edge of the jet. Furthermore, another branch of high WS200 values is present west of the EXC centre, especially 12 h before tslp and at tslp. This likely reflects the polar jet merging with the subtropical jet. Generally, WS200 is higher in the EMED (exceeding 60 m s−1) compared to the WMED (up to 50 m s−1). This is most likely caused by the more southern location of the EMED region (Fig. 3) and thus EXCs tend to be located closer to the subtropical jet.
Considering all composites, a maximum in WS200 is located just south of the EXC centre, which has the typical shape a jet streak. 12 h before tslp, the EXC is located right above the jet streak maximum, where the jet streak neither aids nor inhibits EXC development at this stage. At tslp, the EXC moves towards the left exit of the jet streak, which is the region where upper air divergence leads to rising air motions and hence can provide favourable conditions for a cyclone. 12 h after tslp, the EXC has moved further east relative to the jet streak and is now clearly positioned in the left-exit region of the jet streak. This is especially evident for wind EXCs in the EMED (Fig. 7j–o).
In the future, we see an increase in WS200 for both regions at all time steps (Fig. 7g–i). Consequentially, for wind EXCs in the WMED the jet streak clearly appears at all time steps in the future (Fig. 8d–f) in contrast to the past (Fig. 8a–c). The jet streak maximum wind speed is up to 10 m s−1 higher compared to past wind EXCs in the WMED and mostly statistically significant across all time steps (Fig. 8g–i). This eventually leads to future conditions where a wind EXC is located in the left exit of a stronger jet streak in its mature phase (Fig. 8e–f).
In the EMED, we also identify an increase in WS200 within the jet stream across all time steps in Fig. 8p–r of up to 10 m s−1. In this region, we also see a significant increase in WS200 northwest of the EXC centre, indicating an increase in strength of the polar jet, especially at tslp (Fig. 8q). However, this increase is only significant at tslp (Fig. 8q). Nevertheless, we find future mature wind speed EXCs in the EMED in the left exit of a stronger jet streak. This means that future EXCs in the EMED would also benefit from a more favourable position in the jet streak.
3.4 Cyclones associated with compound precipitation and wind extremes
Lastly, we investigate the life cycle of precipitation and wind speed in compounding EXCs. For precip6 h within compounding EXCs (Fig. S4), we largely see the same patterns as for precipitation EXCs (Fig. 5). precip6 h increases as the cyclone intensifies and decreases strongly again in its mature stage. precip6 h is slightly less intense than for precipitation EXCs and compounding EXCs have a lower core pressure (in the order of 4 hPa) consistent with higher wind speeds. Also, future precip6 h changes for compound EXCs are very similar to precipitation EXCs. However, compound EXCs in the EMED get even drier than precipitation EXCs in the future (Fig. S4p–r).
Wind speeds in compounding EXCs (Fig. S5) are of similar intensity at tslp compared to wind speed EXCs in Fig. 7. The wind field is slightly smaller though. 12 h before tslp, WS850 of compounding EXCs is lower compared to wind speed EXCs in both regions (left column of Fig. S5). 12 h after tslp, WS850 is significantly lower than in EMED wind speed EXCs, but of similar intensity in the WMED (left column of Fig. S5). Compound EXC core pressure is very similar to wind speed EXCs at tslp and 12 h after tslp, but slightly higher 12 h before tslp. The increase in WS850 in future compound EXCs is less in the WMED compared to wind speed EXCs in the WMED (Fig. S5g–i). However, for compound EXCs in the EMED we see a large future decrease in wind speed (Fig. S5p–r), which is contrary to what we observe for future wind speed EXCs (Fig. 7p–r).
The aim of this study is to assess changes in wind, precipitation and compounding extreme cyclone characteristics in the Mediterranean by comparing pre-industrial with future conditions under RCP8.5. Thereby, we dynamically downscale an existing global model simulation to a resolution of 20 km with WRF for the period 1821 CE to 2100 CE.
We find that WRF reproduces the main cyclone hotspots and these results are in line with previous studies (Homar et al., 2007; Raible et al., 2010; Campins et al., 2011). We also find that WRF reproduces cyclone frequency in the western Mediterranean well compared to ERA5, whereas it is overestimated in the eastern Mediterranean. Future cyclone frequency in the Mediterranean is reduced by roughly one-third under RCP8.5 conditions. Such a decrease in cyclone frequency in the Mediterranean is also evident in earlier implemented GCMs (Lionello et al., 2002; Bengtsson et al., 2006; Raible et al., 2010; Ulbrich et al., 2013), CMIP5 (Zappa et al., 2015a; Hochman et al., 2017), and CMIP6 model simulations (Priestley and Catto, 2022) as well as RCM simulations (Reale et al., 2022).
Besides mean changes, this study focuses on changes in extremes associated with Mediterranean cyclones. WRF captures the structure of both precipitation and wind EXCs seen in ERA5 but systematically overestimates their intensity, especially in the EMED, while reproducing core pressure well. A further possible contributor to the overestimation of precip6 h and WS850 in the EMED is that WRF produces more cyclones there. In a previous study, we found that wind EXCs are less extreme in the EMED compared to the WMED in the driving CESM model (Doensen et al., 2025). However, CESM strongly underestimates cyclone frequency in the Mediterranean, which WRF captures considerably better. By improving both the frequency and the structural representation of these systems, the dynamical downscaling enables us to study extreme Mediterranean cyclones in much more detail, demonstrating that it substantially improves their representation.
The location and seasonality of the EXCs are consistent with previous literature. We find that precipitation EXCs occur predominantly over the Mediterranean Sea, whereas wind speed EXCs also occur frequently over land. This agrees with Raveh-Rubin and Wernli (2015), who found that precipitation extremes in the Mediterranean are most likely located over the sea while gust extremes are more likely over land. Similarly, the precipitation–wind compound EXCs occur mainly over the sea, in agreement with Portal et al. (2024). The seasonality is likewise consistent with earlier work. Khodayar et al. (2025) showed that precipitation-related damages peak in autumn, plausibly reflecting cyclone-related precipitation, although we do not observe the peak in precipitation extremes in winter in the eastern Mediterranean as shown by Raveh-Rubin and Wernli (2015). Doiteau et al. (2024) found that deep Mediterranean cyclones, capable of producing intense winds, are distributed evenly from November to March. The latter matches the even distribution of wind speed EXCs we detect across the winter half year. Despite no significant change in EXC seasonality, precipitation and compound EXCs in the EMED are shifted southward over the warmer Mediterranean Sea in the future, whereas the average latitude of precipitation EXCs in the WMED shows no significant change.
Our findings show that cyclones associated with extreme precipitation respond differently in the future in the two subregions, with an increase in extreme precipitation in the WMED and no significant difference in the EMED. This is remarkable, since CMIP5 simulations project a significant future decrease in mean winter-time precipitation over most of the Mediterranean (Zappa et al., 2015b). Yet, the increase in precipitation we find for EXCs in the WMED matches the findings by Reale et al. (2022) who also found an increase in mean cyclone-related precipitation for the northern Mediterranean. However, in our work the precipitation EXCs in the EMED show no significant change in precipitation. This does not coincide with the decrease in mean cyclone-related precipitation found by Zappa et al. (2015a) and Reale et al. (2022). Nevertheless, extreme cyclone-related precipitation in the Mediterranean responds differently to climate change than mean seasonal precipitation (Chericoni et al., 2025). The EMED most likely reflects this decoupling of extreme from mean precipitation. Chericoni et al. (2025) further showed that RCMs more realistically represent wind patterns and air–sea fluxes. This results in higher extreme cyclone-related precipitation compared to CMIP6 models and thus illustrates the necessity to use high spatial resolution to understand the impact of future climate change on Mediterranean cyclones and the associated extremes as done in this study.
The increase in PV for WMED precipitation EXCs during their mature phase is marginally significant. The increase in PV near the tropopause west of the cyclone core indicates a lowering of the tropopause and thus a more intense baroclinic cyclone, through the interaction of the upper-level PV anomaly with the low-level circulation (Hoskins et al., 1985). The increase in low-level PV is most likely caused by increased latent heating, and is also found for cyclones in warmer climates in idealized simulations (Pfahl et al., 2015; Sinclair et al., 2020). Precipitation and wind EXCs in our work become more intense at their peak intensity and in their mature phase, whereas we detect little change or a decrease in intensity before their peak intensity. This behaviour is similar to Zhang and Colle (2018), who used WRF to study future extratropical cyclones over eastern North America and the western Atlantic at a similar resolution to our simulation (0.2°). They also found that cyclones in their initial phase are weaker in a warmer climate, whereas future cyclones develop more rapidly and eventually become more intense due to increased latent heating.
We find that wind EXCs in the WMED and EMED are equally intense in our simulation, and we find a significant increase in wind speed of extreme cyclones in the entire Mediterranean, also during the mature phase of the EXCs. Reale et al. (2022) found an increase in mean cyclone-related wind speed around Italy, and a decrease in the rest of the Mediterranean. However, Chericoni et al. (2025), found an increase in mean cyclone-related wind speed for intense cyclones for almost all regions in the Mediterranean, which agrees with our results. Yet, confidence in future climate projections for cyclone-related wind speed is low (Catto et al., 2019) and thus should be interpreted with care. Note also, that most of the existing literature discusses mean changes in Mediterranean cyclones, whereas the focus of this study is on extreme cyclones. In the future the subtropical jet intensifies, and consequently future wind EXCs are located in the left-exit of an intensified jet streak. In particular, this is found in the mature phase of wind EXCs in the WMED and EMED. Flaounas et al. (2015b) suggested that extreme Mediterranean wind cyclones often co-occur with a strong jet streak south of the cyclone. They also suggested that barotropic shear provided by the subtropical jet aids the baroclinic life cycle of a cyclone. Moreover, Raveh-Rubin and Wernli (2015) showed that precipitation extremes in the eastern Mediterranean often co-occur with the merging of the midlatitude and subtropical jet in this region, causing cyclogenesis or cyclone intensification. Prezerakos et al. (2005) performed a detailed case-study analysis of the mechanisms behind this cyclone–jet co-occurrence, showing that an extreme cyclone over the eastern Mediterranean underwent a resurgence in intensity when located in the left exit of the subtropical jet and the right entrance of the midlatitude jet. However, Flaounas et al. (2022) acknowledged that this cyclone-jet co-occurrence has not been studied extensively. Thus, our study contributes to fill this gap by highlighting the importance of the jet position and strength in intensifying extreme wind cyclones in the Mediterranean.
Furthermore, we investigate the behaviour of cyclones associated with compound extreme precipitation and wind. The location of the highest precipitation agrees well with the results of Rousseau-Rizzi et al. (2024), although the location of the most intense winds in WRF is shifted to the east compared to their work. We find that precipitation associated with compound EXCs resembles the climate change signal of precipitation EXCs in both regions of the Mediterranean. However, the wind speed of compound EXCs in the EMED shows a future reduction in intensity. This is in contrast to the intensification of wind speed EXCs in the future.
To conclude, this work offers a comprehensive analysis on the impact of climate change on extreme cyclones and their characteristics in the Mediterranean utilizing a 280-year long dynamically downscaled regional simulation. Our results show evidence that future extreme cyclones will intensify with respect to precipitation and wind speed (most notably in the western Mediterranean) despite a projected reduction in cyclone frequency. Future extreme cyclones tend to be weaker in their initial phase, but intensify more rapidly and remain stronger in their peak and mature phase. Such developments could exacerbate the socioeconomic impacts of cyclones, compounding the effects of climate change. Still, one shortcoming is that we only use a single member simulation. Future work using RCM ensemble simulations or km-scale GCMs could further solidify our understanding of future extreme cyclones in the Mediterranean.
The cyclone tracking was performed with the detection and tracking scheme of Blender et al. (1997) and is available on request. The other analysis steps were performed with python scripts. As they are standard methods, they are not uploaded to a repository. These scripts are available on request.
Post-processed WRF data used for the study are available at https://doi.org/10.5281/zenodo.17965187 (Doensen, 2025). Complete WRF data are locally stored and are available upon request.
The supplement related to this article is available online at https://doi.org/10.5194/wcd-7-1899-2026-supplement.
OD, MM, and CCR contributed to the design of the study. OD carried out the WRF simulations. OD performed the principal analysis and wrote the manuscript under the supervision of CCR. MM, EDT and CCR provided critical feedback on the results and drafted the manuscript together with OD. All authors contributed to the writing and scientific discussion.
The contact author has declared that none of the authors has any competing interests.
Publisher's note: Copernicus Publications remains neutral with regard to jurisdictional claims made in the text, published maps, institutional affiliations, or any other geographical representation in this paper. The authors bear the ultimate responsibility for providing appropriate place names. Views expressed in the text are those of the authors and do not necessarily reflect the views of the publisher.
We acknowledge the Swiss National Supercomputing Centre (CSCS) in Lugano, Switzerland, for providing the necessary computational resources and supercomputing architecture to perform the simulations under project IDs 482 and 615. OD and CCR received funding from the Swiss National Science Foundation (grant no. IZCOZ0_205416). Onno Doensen thanks Shira Raveh-Rubin for helpful discussions and ideas that contributed to this study.
This research has been supported by the Schweizerischer Nationalfonds zur Förderung der Wissenschaftlichen Forschung (grant no. IZCOZ0_205416).
This paper was edited by Shira Raveh-Rubin and reviewed by two anonymous referees.
Bengtsson, L., Hodges, K. I., and Roeckner, E.: Storm Tracks and Climate Change, J. Climate, 19, 3518–3543, https://doi.org/10.1175/jcli3815.1, 2006. a
Blender, R., Fraedrich, K., and Lunkeit, F.: Identification of cyclone-track regimes in the North Atlantic, Q. J. Roy. Meteor. Soc., 123, 727–741, https://doi.org/10.1002/qj.49712353910, 1997. a, b
Büeler, D. and Pfahl, S.: Potential Vorticity Diagnostics to Quantify Effects of Latent Heating in Extratropical Cyclones. Part II: Application to Idealized Climate Change Simulations, J. Atmos. Sci., 76, 1885–1902, https://doi.org/10.1175/jas-d-18-0342.1, 2019. a
Čampa, J. and Wernli, H.: A PV Perspective on the Vertical Structure of Mature Midlatitude Cyclones in the Northern Hemisphere, J. Atmos. Sci., 69, 725–740, https://doi.org/10.1175/jas-d-11-050.1, 2012. a, b
Campins, J., Genovés, A., Picornell, M., and Jansà, A.: Climatology of Mediterranean cyclones using the ERA-40 dataset, Int. J. Climatol., 31, 1596–1614, https://doi.org/10.1002/joc.2183, 2011. a
Carniel, C. E., Ricchi, A., Ferretti, R., Curci, G., Miglietta, M. M., Reale, M., Serafini, P., Wellmeyer, E. D., Davolio, S., Zardi, D., and Kantha, L.: A high‐resolution climatological study of explosive cyclones in the Mediterranean region: Frequency, intensity and synoptic drivers, Q. J. Roy. Meteor. Soc., 150, 5561–5582, https://doi.org/10.1002/qj.4889, 2024. a
Catto, J. L., Ackerley, D., Booth, J. F., Champion, A. J., Colle, B. A., Pfahl, S., Pinto, J. G., Quinting, J. F., and Seiler, C.: The future of midlatitude cyclones, Current Climate Change Reports, 5, 407–420, https://doi.org/10.1007/s40641-019-00149-4, 2019. a, b, c
Chericoni, M., Fosser, G., Flaounas, E., Gaetani, M., and Anav, A.: Unravelling drivers of the future Mediterranean precipitation paradox during cyclones, npj Clim. Atmos. Sci., 8, https://doi.org/10.1038/s41612-025-01121-w, 2025. a, b, c, d, e
Danielson, J. J. and Gesch, D. B.: Global multi-resolution terrain elevation data 2010 (GMTED2010), U.S. Geological Survey, Open-File Report 2011-1073, https://doi.org/10.3133/ofr20111073, 2011. a
Davis, C. A. and Emanuel, K. A.: Potential Vorticity Diagnostics of Cyclogenesis, Mon. Weather Rev., 119, 1929–1953, https://doi.org/10.1175/1520-0493(1991)119<1929:pvdoc>2.0.co;2, 1991. a
Doensen, O.: Mediterranean cyclones from pre-industrial to future climate: changes in extreme wind, precipitation and compound precipitation–wind events, Version v1, Zenodo [data set], https://doi.org/10.5281/zenodo.17965187, 2025. a
Doensen, O., Messmer, M., Kim, W. M., and Raible, C. C.: Characterization of the mean and extreme Mediterranean cyclones and their variability during the period 1500 BCE to 1850 CE, Clim. Past, 21, 1305–1322, https://doi.org/10.5194/cp-21-1305-2025, 2025. a, b, c, d
Doiteau, B., Pantillon, F., Plu, M., Descamps, L., and Rieutord, T.: Systematic evaluation of the predictability of different Mediterranean cyclone categories, Weather Clim. Dynam., 5, 1409–1427, https://doi.org/10.5194/wcd-5-1409-2024, 2024. a
Dolores-Tesillos, E. and Pfahl, S.: Future changes in North Atlantic winter cyclones in CESM-LE – Part 2: A Lagrangian analysis, Weather Clim. Dynam., 5, 163–179, https://doi.org/10.5194/wcd-5-163-2024, 2024. a
Dolores-Tesillos, E., Teubler, F., and Pfahl, S.: Future changes in North Atlantic winter cyclones in CESM-LE – Part 1: Cyclone intensity, potential vorticity anomalies, and horizontal wind speed, Weather Clim. Dynam., 3, 429–448, https://doi.org/10.5194/wcd-3-429-2022, 2022. a, b
Dudhia, J.: Numerical Study of Convection Observed during the Winter Monsoon Experiment Using a Mesoscale Two-Dimensional Model, J. Atmos. Sci., 46, 3077–3107, https://doi.org/10.1175/1520-0469(1989)046<3077:nsocod>2.0.co;2, 1989. a
Ferrarin, C., Bajo, M., Benetazzo, A., Cavaleri, L., Chiggiato, J., Davison, S., Davolio, S., Lionello, P., Orlić, M., and Umgiesser, G.: Local and large-scale controls of the exceptional Venice floods of November 2019, Prog. Oceanogr., 197, 102628, https://doi.org/10.1016/j.pocean.2021.102628, 2021. a
Fita, Ll., Romero, R., and Ramis, C.: Intercomparison of intense cyclogenesis events over the Mediterranean basin based on baroclinic and diabatic influences, Adv. Geosci., 7, 333–342, https://doi.org/10.5194/adgeo-7-333-2006, 2006. a
Flaounas, E., Drobinski, P., and Bastin, S.: Dynamical downscaling of IPSL-CM5 CMIP5 historical simulations over the Mediterranean: benefits on the representation of regional surface winds and cyclogenesis, Clim. Dynam., 40, 2497–2513, https://doi.org/10.1007/s00382-012-1606-7, 2013. a
Flaounas, E., Kotroni, V., Lagouvardos, K., and Flaounas, I.: CycloTRACK (v1.0) – tracking winter extratropical cyclones based on relative vorticity: sensitivity to data filtering and other relevant parameters, Geosci. Model Dev., 7, 1841–1853, https://doi.org/10.5194/gmd-7-1841-2014, 2014. a
Flaounas, E., Lagouvardos, K., Kotroni, V., Claud, C., Delanoë, J., Flamant, C., Madonna, E., and Wernli, H.: Processes leading to heavy precipitation associated with two Mediterranean cyclones observed during the HYMEX SOP1, Q. J. Roy. Meteor. Soc., 142, 275–286, https://doi.org/10.1002/qj.2618, 2015a. a
Flaounas, E., Raveh-Rubin, S., Wernli, H., Drobinski, P., and Bastin, S.: The dynamical structure of intense Mediterranean cyclones, Clim. Dynam., 44, 2411–2427, https://doi.org/10.1007/s00382-014-2330-2, 2015b. a, b
Flaounas, E., Kotroni, V., Lagouvardos, K., Gray, S. L., Rysman, J.-F., and Claud, C.: Heavy rainfall in Mediterranean cyclones. Part I: contribution of deep convection and warm conveyor belt, Clim. Dynam., 50, 2935–2949, https://doi.org/10.1007/s00382-017-3783-x, 2018. a
Flaounas, E., Gray, S. L., and Teubler, F.: A process-based anatomy of Mediterranean cyclones: from baroclinic lows to tropical-like systems, Weather Clim. Dynam., 2, 255–279, https://doi.org/10.5194/wcd-2-255-2021, 2021. a
Flaounas, E., Davolio, S., Raveh-Rubin, S., Pantillon, F., Miglietta, M. M., Gaertner, M. A., Hatzaki, M., Homar, V., Khodayar, S., Korres, G., Kotroni, V., Kushta, J., Reale, M., and Ricard, D.: Mediterranean cyclones: current knowledge and open questions on dynamics, prediction, climatology and impacts, Weather Clim. Dynam., 3, 173–208, https://doi.org/10.5194/wcd-3-173-2022, 2022. a
Givon, Y., Hess, O., Flaounas, E., Catto, J. L., Sprenger, M., and Raveh-Rubin, S.: Process-based classification of Mediterranean cyclones using potential vorticity, Weather Clim. Dynam., 5, 133–162, https://doi.org/10.5194/wcd-5-133-2024, 2024. a
Hersbach, H., Bell, B., Berrisford, P., Hirahara, S., Horányi, A., Muñoz-Sabater, J., Nicolas, J., Peubey, C., Radu, R., Schepers, D., Simmons, A., Soci, C., Abdalla, S., Abellan, X., Balsamo, G., Bechtold, P., Biavati, G., Bidlot, J., Bonavita, M., De Chiara, G., Dahlgren, P., Dee, D., Diamantakis, M., Dragani, R., Flemming, J., Forbes, R., Fuentes, M., Geer, A., Haimberger, L., Healy, S., Hogan, R. J., Hólm, E., Janisková, M., Keeley, S., Laloyaux, P., Lopez, P., Lupu, C., Radnoti, G., de Rosnay, P., Rozum, I., Vamborg, F., Villaume, S., and Thépaut, J.-N.: The ERA5 global reanalysis, Q. J. Roy. Meteor. Soc., 146, 1999–2049, https://doi.org/10.1002/qj.3803, 2020. a
Hochman, A., Harpaz, T., Saaroni, H., and Alpert, P.: Synoptic classification in 21st century CMIP5 predictions over the Eastern Mediterranean with focus on cyclones, Int. J. Climatol., 38, 1476–1483, https://doi.org/10.1002/joc.5260, 2017. a
Hochman, A., Alpert, P., Kunin, P., Rostkier-Edelstein, D., Harpaz, T., Saaroni, H., and Messori, G.: The dynamics of cyclones in the twentyfirst century: the Eastern Mediterranean as an example, Clim. Dynam., 54, 561–574, https://doi.org/10.1007/s00382-019-05017-3, 2020. a
Homar, V., Ramis, C., and Alonso, S.: A deep cyclone of African origin over the Western Mediterranean: diagnosis and numerical simulation, Ann. Geophys., 20, 93–106, https://doi.org/10.5194/angeo-20-93-2002, 2002. a
Homar, V., Jansà, A., Campins, J., Genovés, A., and Ramis, C.: Towards a systematic climatology of sensitivities of Mediterranean high impact weather: a contribution based on intense cyclones, Nat. Hazards Earth Syst. Sci., 7, 445–454, https://doi.org/10.5194/nhess-7-445-2007, 2007. a
Hong, S.-Y., Noh, Y., and Dudhia, J.: A New Vertical Diffusion Package with an Explicit Treatment of Entrainment Processes, Mon. Weather Rev., 134, 2318–2341, https://doi.org/10.1175/mwr3199.1, 2006. a
Hoskins, B. J., McIntyre, M. E., and Robertson, A. W.: On the use and significance of isentropic potential vorticity maps, Q. J. Roy. Meteor. Soc., 111, 877–946, https://doi.org/10.1002/qj.49711147002, 1985. a
Hurrell, J. W., Holland, M. M., Gent, P. R., Ghan, S., Kay, J. E., Kushner, P. J., Lamarque, J.-F., Large, W. G., Lawrence, D., Lindsay, K., Lipscomb, W. H., Long, M. C., Mahowald, N., Marsh, D. R., Neale, R. B., Rasch, P., Vavrus, S., Vertenstein, M., Bader, D., Collins, W. D., Hack, J. J., Kiehl, J., and Marshall, S.: The community earth system model: a framework for collaborative research, B. Am. Meteorol. Soc., 94, 1339–1360, https://doi.org/10.1175/BAMS-D-12-00121.1, 2013. a, b
Jerez, S., López‐Romero, J. M., Turco, M., Lorente‐Plazas, R., Gómez‐Navarro, J. J., Jiménez‐Guerrero, P., and Montávez, J. P.: On the Spin‐Up Period in WRF Simulations Over Europe: Trade‐Offs Between Length and Seasonality, J. Adv. Model. Earth Sy., 12, https://doi.org/10.1029/2019ms001945, 2020. a
Jiménez, P. A., Dudhia, J., González-Rouco, J. F., Navarro, J., Montávez, J. P., and García-Bustamante, E.: A Revised Scheme for the WRF Surface Layer Formulation, Mon. Weather Rev., 140, 898–918, https://doi.org/10.1175/mwr-d-11-00056.1, 2012. a
Kain, J. S.: The Kain–Fritsch Convective Parameterization: An Update, J. Appl. Meteorol., 43, 170–181, https://doi.org/10.1175/1520-0450(2004)043<0170:tkcpau>2.0.co;2, 2004. a
Khodayar, S., Kushta, J., Catto, J. L., Dafis, S., Davolio, S., Ferrarin, C., Flaounas, E., Groenemeijer, P., Hatzaki, M., Hochman, A., Kotroni, V., Landa, J., Láng‐Ritter, I., Lazoglou, G., Liberato, M. L. R., Miglietta, M. M., Papagiannaki, K., Patlakas, P., Stojanov, R., and Zittis, G.: Mediterranean Cyclones in a Changing Climate: A Review on Their Socio‐Economic Impacts, Rev. Geophys., 63, https://doi.org/10.1029/2024rg000853, 2025. a
Kolmogorov, A. N.: Sulla determinazione empirica di una legge di distribuzione, Giorn. Dell'Inst. Ital. Degli Att., 4, 83–91, 1933. a
Kim, W. M., Blender, R., Sigl, M., Messmer, M., and Raible, C. C.: Statistical characteristics of extreme daily precipitation during 1501 BCE–1849 CE in the Community Earth System Model, Clim. Past, 17, 2031–2053, https://doi.org/10.5194/cp-17-2031-2021, 2021. a
Lionello, P., Dalan, F., and Elvini, E.: Cyclones in the Mediterranean region: the present and the doubled CO2 climate scenarios, Clim. Res., 22, 147–159, https://doi.org/10.3354/cr022147, 2002. a, b
Lionello, P., Conte, D., and Reale, M.: The effect of cyclones crossing the Mediterranean region on sea level anomalies on the Mediterranean Sea coast, Nat. Hazards Earth Syst. Sci., 19, 1541–1564, https://doi.org/10.5194/nhess-19-1541-2019, 2019. a
Martius, O., Pfahl, S., and Chevalier, C.: A global quantification of compound precipitation and wind extremes, Geophys. Res. Lett., 43, 7709–7717, https://doi.org/10.1002/2016gl070017, 2016. a
Messmer, M. and Simmonds, I.: Global analysis of cyclone-induced compound precipitation and wind extreme events, Weather and Climate Extremes, 32, 100324, https://doi.org/10.1016/j.wace.2021.100324, 2021. a
Mlawer, E. J., Taubman, S. J., Brown, P. D., Iacono, M. J., and Clough, S. A.: Radiative transfer for inhomogeneous atmospheres: RRTM, a validated correlated‐k model for the longwave, J. Geophys. Res.-Atmos., 102, 16663–16682, https://doi.org/10.1029/97jd00237, 1997. a
Neu, U., Akperov, M. G., Bellenbaum, N., Benestad, R., Blender, R., Caballero, R., Cocozza, A., Dacre, H. F., Feng, Y., Fraedrich, K., Grieger, J., Gulev, S., Hanley, J., Hewson, T., Inatsu, M., Keay, K., Kew, S. F., Kindem, I., Leckebusch, G. C., Liberato, M. L. R., Lionello, P., Mokhov, I. I., Pinto, J. G., Raible, C. C., Reale, M., Rudeva, I., Schuster, M., Simmonds, I., Sinclair, M., Sprenger, M., Tilinina, N. D., Trigo, I. F., Ulbrich, S., Ulbrich, U., Wang, X. L., and Wernli, H.: IMILAST: A Community Effort to Intercompare Extratropical Cyclone Detection and Tracking Algorithms, B. Am. Meteorol. Soc., 94, 529–547, https://doi.org/10.1175/bams-d-11-00154.1, 2013. a
Nissen, K. M., Leckebusch, G. C., Pinto, J. G., Renggli, D., Ulbrich, S., and Ulbrich, U.: Cyclones causing wind storms in the Mediterranean: characteristics, trends and links to large-scale patterns, Nat. Hazards Earth Syst. Sci., 10, 1379–1391, https://doi.org/10.5194/nhess-10-1379-2010, 2010. a
Nissen, K. M., Leckebusch, G. C., Pinto, J. G., and Ulbrich, U.: Mediterranean cyclones and windstorms in a changing climate, Reg. Environ. Change, 14, 1873–1890, https://doi.org/10.1007/s10113-012-0400-8, 2014. a, b, c
Niu, G.-Y., Yang, Z.-L., Mitchell, K. E., Chen, F., Ek, M. B., Barlage, M., Kumar, A., Manning, K., Niyogi, D., Rosero, E., Tewari, M., and Xia, Y.: The community Noah land surface model with multiparameterization options (Noah-MP): 1. Model description and evaluation with local-scale measurements, J. Geophys. Res., 116, https://doi.org/10.1029/2010jd015139, 2011. a
Pettersen, S.: Weather Analysis and Forecasting: Volume I: Motion and Motion Systems, McGraw-Hill, New York, USA, 1956. a
Pfahl, S. and Sprenger, M.: On the relationship between extratropical cyclone precipitation and intensity, Geophys. Res. Lett., 43, 1752–1758, https://doi.org/10.1002/2016GL068018, 2016. a
Pfahl, S. and Wernli, H.: Quantifying the relevance of cyclones for precipitation extremes, J. Climate, 25, 6770–6780, https://doi.org/10.1175/JCLI-D-11-00705.1, 2012. a, b
Pfahl, S., O'Gorman, P. A., and Singh, M. S.: Extratropical Cyclones in Idealized Simulations of Changed Climates, J. Climate, 28, 9373–9392, https://doi.org/10.1175/jcli-d-14-00816.1, 2015. a
Portal, A., Raveh-Rubin, S., Catto, J. L., Givon, Y., and Martius, O.: Linking compound weather extremes to Mediterranean cyclones, fronts, and airstreams, Weather Clim. Dynam., 5, 1043–1060, https://doi.org/10.5194/wcd-5-1043-2024, 2024. a, b
Prezerakos, N. G., Flocas, H. A., and Brikas, D.: The role of the interaction between polar and subtropical jet in a case of depression rejuvenation over the Eastern Mediterranean, Meteorol. Atmos. Phys., 92, 139–151, https://doi.org/10.1007/s00703-005-0142-y, 2005. a, b
Priestley, M. D. K. and Catto, J. L.: Future changes in the extratropical storm tracks and cyclone intensity, wind speed, and structure, Weather Clim. Dynam., 3, 337–360, https://doi.org/10.5194/wcd-3-337-2022, 2022. a
Raible, C., Yoshimori, M., Stocker, T., and Casty, C.: Extreme midlatitude cyclones and their implications for precipitation and wind speed extremes in simulations of the Maunder Minimum versus present day conditions, Clim. Dynam., 28, 409–423, https://doi.org/10.1007/s00382-006-0188-7, 2007. a
Raible, C. C., Della-Marta, P. M., Schwierz, C., Wernli, H., and Blender, R.: Northern Hemisphere Extratropical Cyclones: A Comparison of Detection and Tracking Methods and Different Reanalyses, Mon. Weather Rev., 136, 880–897, https://doi.org/10.1175/2007mwr2143.1, 2008. a
Raible, C. C., Ziv, B., Saaroni, H., and Wild, M.: Winter synoptic-scale variability over the Mediterranean Basin under future climate conditions as simulated by the ECHAM5, Clim. Dynam., 35, 473–488, https://doi.org/10.1007/s00382-009-0678-5, 2010. a, b, c, d
Raible, C. C., Messmer, M., Lehner, F., Stocker, T. F., and Blender, R.: Extratropical cyclone statistics during the last millennium and the 21st century, Clim. Past, 14, 1499–1514, https://doi.org/10.5194/cp-14-1499-2018, 2018. a
Raveh-Rubin, S. and Flaounas, E.: A dynamical link between deep Atlantic extratropical cyclones and intense Mediterranean cyclones, Atmos. Sci. Lett., 18, 215–221, https://doi.org/10.1002/asl.745, 2017. a, b
Raveh-Rubin, S. and Wernli, H.: Large-scale wind and precipitation extremes in the Mediterranean: a climatological analysis for 1979–2012, Q. J. Roy. Meteor. Soc., 141, 2404–2417, https://doi.org/10.1002/qj.2531, 2015. a, b, c, d, e, f, g, h
Reale, M., Cabos Narvaez, W. D., Cavicchia, L., Conte, D., Coppola, E., Flaounas, E., Giorgi, F., Gualdi, S., Hochman, A., Li, L., Lionello, P., Podrascanin, Z., Salon, S., Sanchez-Gomez, E., Scoccimarro, E., Sein, D. V., and Somot, S.: Future projections of Mediterranean cyclone characteristics using the Med-CORDEX ensemble of coupled regional climate system models, Clim. Dynam., 58, 2501–2524, https://doi.org/10.1007/s00382-021-06018-x, 2022. a, b, c, d, e, f
Rousseau-Rizzi, R., Raveh-Rubin, S., Catto, J. L., Portal, A., Givon, Y., and Martius, O.: A storm-relative climatology of compound hazards in Mediterranean cyclones, Weather Clim. Dynam., 5, 1079–1101, https://doi.org/10.5194/wcd-5-1079-2024, 2024. a
Schemm, S.: Toward Eliminating the Decades‐Old “Too Zonal and Too Equatorward” Storm‐Track Bias in Climate Models, J. Adv. Model. Earth Sy., 15, https://doi.org/10.1029/2022ms003482, 2023. a
Scherrmann, A., Wernli, H., and Flaounas, E.: Origin of low-tropospheric potential vorticity in Mediterranean cyclones, Weather Clim. Dynam., 4, 157–173, https://doi.org/10.5194/wcd-4-157-2023, 2023. a
Scherrmann, A., Wernli, H., and Flaounas, E.: The upstream–downstream connection of North Atlantic and Mediterranean cyclones in semi-idealized simulations, Weather Clim. Dynam., 5, 419–438, https://doi.org/10.5194/wcd-5-419-2024, 2024. a
Schneidereit, A., Blender, R., and Fraedrich, K.: A radius–depth model for midlatitude cyclones in reanalysis data and simulations, Q. J. Roy. Meteor. Soc., 136, 50–60, https://doi.org/10.1002/qj.523, 2010. a
Sinclair, V. A., Rantanen, M., Haapanala, P., Räisänen, J., and Järvinen, H.: The characteristics and structure of extra-tropical cyclones in a warmer climate, Weather Clim. Dynam., 1, 1–25, https://doi.org/10.5194/wcd-1-1-2020, 2020. a
Skamarock, C., Klemp, B., Dudhia, J., Gill, O., Liu, Z., Berner, J., Wang, W., Powers, G., Duda, G., Barker, D., and Huang, X.-y.: A Description of the Advanced Research WRF Model Version 4.3, NCAR Technical Notes, NCAR/TN-556+STR, https://doi.org/10.5065/1dfh-6p97, 2021. a, b
Thompson, G., Field, P. R., Rasmussen, R. M., and Hall, W. D.: Explicit Forecasts of Winter Precipitation Using an Improved Bulk Microphysics Scheme. Part II: Implementation of a New Snow Parameterization, Mon. Weather Rev., 136, 5095–5115, https://doi.org/10.1175/2008mwr2387.1, 2008. a
Trigo, I. F.: Climatology and interannual variability of storm-tracks in the Euro-Atlantic sector: a comparison between ERA-40 and NCEP/NCAR reanalyses, Clim. Dynam., 26, 127–143, https://doi.org/10.1007/s00382-005-0065-9, 2006. a
Trigo, I. F., Davies, T. D., and Bigg, G. R.: Objective Climatology of Cyclones in the Mediterranean Region, J. Climate, 12, 1685–1696, https://doi.org/10.1175/1520-0442(1999)012<1685:ococit>2.0.co;2, 1999. a
Trigo, I. F., Davies, T. D., and Bigg, G. R.: Decline in Mediterranean rainfall caused by weakening of Mediterranean cyclones, Geophys. Res. Lett., 27, 2913–2916, https://doi.org/10.1029/2000GL011526, 2000. a
Ulbrich, U., Leckebusch, G. C., Grieger, J., Schuster, M., Akperov, M., Bardin, M. Y., Feng, Y., Gulev, S., Inatsu, M., Keay, K., Kew, S. F., Liberato, M. L., Lionello, P., Mokhov, I. I., Neu, U., Pinto, J. G., Raible, C. C., Reale, M., Rudeva, I., Simmonds, I., Tilinina, N. D., Trigo, I. F., Ulbrich, S., and Wang: Are Greenhouse Gas Signals of Northern Hemisphere winter extra-tropical cyclone activity dependent on the identification and tracking algorithm?, Meteorol. Z., 22, 61–68, https://doi.org/10.1127/0941-2948/2013/0420, 2013. a, b
Vakrat, E. and Hochman, A.: Dynamical systems insights on cyclonic compound “wet” and “windy” extremes in the Eastern Mediterranean, Q. J. Roy. Meteor. Soc., 149, 3593–3606, https://doi.org/10.1002/qj.4575, 2023. a
Welch, B. L.: The generalization of 'STUDENT'S' problem when several different population varlances are involved, Biometrika, 34, 28–35, https://doi.org/10.2307/2332510, 1947. a
Willison, J., Robinson, W. A., and Lackmann, G. M.: The importance of resolving mesoscale latent heating in the North Atlantic storm track, J. Atmos. Sci., 70, 2234–2250, https://doi.org/10.1175/JAS-D-12-0226.1, 2013. a
Zappa, G., Shaffrey, L. C., Hodges, K. I., Sansom, P. G., and Stephenson, D. B.: A Multimodel Assessment of Future Projections of North Atlantic and European Extratropical Cyclones in the CMIP5 Climate Models, J. Climate, 26, 5846–5862, https://doi.org/10.1175/jcli-d-12-00573.1, 2013. a
Zappa, G., Hawcroft, M. K., Shaffrey, L., Black, E., and Brayshaw, D. J.: Extratropical cyclones and the projected decline of winter Mediterranean precipitation in the CMIP5 models, Clim. Dynam., 45, 1727–1738, https://doi.org/10.1007/s00382-014-2426-8, 2015a. a, b, c, d
Zappa, G., Hoskins, B. J., and Shepherd, T. G.: The dependence of wintertime Mediterranean precipitation on the atmospheric circulation response to climate change, Environ. Res. Lett., 10, 104012, https://doi.org/10.1088/1748-9326/10/10/104012, 2015b. a, b
Zhang, Z. and Colle, B. A.: Impact of Dynamically Downscaling Two CMIP5 Models on the Historical and Future Changes in Winter Extratropical Cyclones along the East Coast of North America, J. Climate, 31, 8499–8525, https://doi.org/10.1175/jcli-d-18-0178.1, 2018. a, b
Zscheischler, J., Westra, S., Van Den Hurk, B. J., Seneviratne, S. I., Ward, P. J., Pitman, A., AghaKouchak, A., Bresch, D. N., Leonard, M., Wahl, T., and Zhang, X.: Future climate risk from compound events, Nat. Clim. Change, 8, 469–477, https://doi.org/10.1038/s41558-018-0156-3, 2018. a