the Creative Commons Attribution 4.0 License.
the Creative Commons Attribution 4.0 License.
 | 06 Mar 2026
Concurrent heat waves and their linkage to large-scale meridional heat transports through planetary-scale waves
Gabriele Messori
Davide Faranda
Vera Melinda Galfi
Rune Grand Graversen
Flavio Emanuele Pons
We investigate concurrent heatwaves across the Northern Hemisphere through the linkage between extremes in Meridional Heat Transport (MHT) and in hemispheric land surface temperature (LST). MHT provides fundamental insight on how large-scale thermodynamics links to atmospheric large-scale dynamics, especially through the action of the eddy planetary-scale circulation in the mid-latitudes. The phase and amplitude of these waves can in fact favor the simultaneous occurrence of heatwaves in remote regions, but how this relates to the amount of heat carried by them has not yet been discussed. In this work, we find that the conditional occurrence of extremely weak MHT and extremely warm hemispheric LSTs is significantly more frequent than other conditional occurrences, both in Summer (JJA) and in Winter (DJF). We argue that the combination of extremely weak, in some cases equatorward, MHTs and warm LSTs in JJA are associated with the reversal of the MHT contribution by zonal wavenumber 3, which is in turn associated with the frequency of atmospheric blocking in western Eurasia and the intensity of blockings and jet stream over the Northwestern Pacific. In DJF, the weak, albeit never equatorward, MHT – warm LST events are characterized by a suppression of the climatologically dominant wavenumber 2, which weakens the overall MHT. The flow is anomalously zonal across much of North America and Eurasia, with reduced frequency of atmospheric blockings and downstream displacement of the jet stream, advecting moist and mild air eastward into the continents. Overall, such dynamical pattern correspond to abnormally warm and widespread temperatures in North America, Eastern Europe, and China. The conditional occurrence of extremely weak MHTs and warm hemispheric LSTs is found to be related to between 30 % and over 40 % of extremely warm hemispheric LST days in both seasons.
- Article
(13255 KB) - Full-text XML
-
Supplement
(48564 KB) - BibTeX
- EndNote


A growing body of literature provides evidence of the hemispheric signature of regional heatwaves (cfr. Van Loon and Thompson, 2023). In other words, heatwaves often do not occur in isolation, but rather multiple heatwaves co-occur in geographically remote regions – also referred to as spatially compounding. The interest in these events is motivated by their socio-economic implications: in a highly interconnected world, their impacts can be larger than those of isolated extremes, notably for actors with correlated exposure (Mills, 2005; Tigchelaar et al., 2018; Kornhuber et al., 2020; Vogel et al., 2019; Gaupp et al., 2020). Moreover, co-occurring heatwaves are increasing at a faster pace than all heatwaves (Messori et al., 2024).
The large-scale atmospheric circulation plays a key role in synchronising occurrence of heatwaves across large distances. The literature has specifically highlighted the role of Rossby wave patterns with specific zonal wavenumbers (Petoukhov et al., 2013; Kornhuber et al., 2017, 2020; Strigunova et al., 2022; White et al., 2023). Kornhuber et al. (2020) identifies two specific wave configurations (wave-5 and wave-7) that are responsible for locked, high-amplitude meanders in the jet stream, leading to persistent hot and dry conditions in regions far apart. Wave resonance has been suggested as a triggering mechanism for the formation and amplification of such quasi-stationary wave patterns, especially in boreal Summer (Petoukhov et al., 2013; Kornhuber et al., 2017). The resonant amplification of planetary-scale waves is forced by underlying conditions, such as land-sea contrast, orography and sea-surface temperature anomalies. Quasi-stationary large-scale wave patterns have also been discussed in the context of recurrent Rossby wave packets (Röthlisberger et al., 2019), and have been identified through local wave activity (e.g. Chen et al., 2015; Huang and Nakamura, 2016), or lowpass-filtered mean meridional wind speed at 250 hPa (Röthlisberger et al., 2016a, b; Bartusek et al., 2022). Diagnostics of the waveguidability of the upper tropospheric jet stream (Wirth et al., 2018) have been used to investigate the co-occurrence of surface extremes, such as the heatwaves (Wirth and Polster, 2021; White et al., 2022). Related work has used the notion of quasi-resonant amplification (Petoukhov et al., 2013). The choice of waveguidability definition plays an important role. Ray tracing and the associated “turning latitudes” present multiple limitations when applied to transient waves, and analyses with barotropic flow models showed that the strength of the meridional gradient of potential vorticity better reflects how the jet stream serves as a waveguide for the zonal propagation of such waves (Wirth, 2020; Wirth and Polster, 2021; Segalini et al., 2024).
Several works have emphasized the role of blocking for the occurrence of heatwaves (cfr. Schaller et al., 2018), distinguishing among the different reasons for heatwave development, such as adiabatic, diabatic heating, advection (Röthlisberger and Papritz, 2023). However, the different response of summer blockings and heatwaves to climate change, the latter increasing in frequency (e.g. Christidis et al., 2015; Vogel et al., 2019), while the former remaining mainly unchanged (e.g. Woollings et al., 2018), suggests that the linkage between blockings and heatwaves is not trivial, and that thermodynamic factors should be also taken into account (e.g. Spensberger et al., 2020), especially concerning concurrent heatwaves.
The literature on large-scale heatwaves and their concurrence has therefore primarily focused on large-scale atmospheric dynamical drivers (Lembo et al., 2024). The study of thermodynamics has focussed on local aspects such as subsidence and diabatic heating, overlooking potential large-scale thermodynamic processes. Atmospheric meridional heat transports (MHT) in the mid-latitudes exhibit an intermittent behavior (Swanson and Pierrehumbert, 1997; Messori and Czaja, 2013, 2014, 2015; Messori et al., 2017; Lembo et al., 2019), and sporadic episodes of very strong or weak transport at hemispheric scale are associated with the occurrence of distinct regional and hemispheric weather regimes (Lembo et al., 2022). There is thus a direct link between extremes in the MHT and the atmospheric circulation at multiple spatial scales, which in turn modulates surface temperature extremes. Consistently with this picture, Lembo et al. (2019) and Messori et al. (2017) demonstrated that MHT extremes result from the interplay of waves at both planetary and synoptic scales, with the relative importance of the different scales varying between boreal Summer and Winter.
Here, we hypothesise that concurrent heatwaves correspond to an anomalous meridional temperature distribution on a hemispheric scale, and thus are reflected in the variability of large-scale MHT. This perspective complements that of the large-scale circulation dominating the literature, and for the first time provides a robust dynamic and thermodynamic context for concurrent heatwave episodes. To test the above hypothesis, we analyse concurrent heatwaves in terms of hemispheric land-surface temperature (LST) anomalies, and use the MHT to link their occurrence to the large-scale atmospheric circulation. We focus on both boreal Summer (June–August; JJA) and Winter (December–February; DJF).
The paper is structured as follows: in Sect. 2 data and methods are described. Methodologies for blocking and jet stream detection are outlined in Sect. 2.2.1. Subsequently, the MHT wavenumber decomposition (Sect. 2.2.2), the selection of extremes (Sect. 2.2.3) and significance tests (Sect. 2.2.4) are outlined. Results are presented in Sect. 3. In Sect. 3.1, the different frequency of unconditional and conditional occurrences are described, while in Sect. 3.2 conditional occurrences of extremely weak MHT and extremely warm LST anomalies in boreal Summer are presented. Similar occurrences for boreal Winter are described in Sect. 3.3. An interpretation of what our results imply in terms of linkages between concurrent heatwaves and the general atmospheric circulation is given in Sect. 4, while a summary and key conclusions are drawn in Sect. 5.
2.1 Data
We use ERA5 reanalysis data (Hersbach et al., 2020) over 1979–2022, at a 6-hourly time resolution for the computation of MHT and at daily time resolution for LST anomalies. MHT is computed for the 30–60° latitudinal band (hereafter “mid-latitude channel”), using three-dimensional fields of air temperature (T), specific humidity (q), geopotential height (z), and zonal and meridional velocities (u and v, respectively). The fields originally produced on a Gaussian grid have been retrieved from the Copernicus Climate Change Service with an interpolated longitude per latitude rectangular grid having 0.5×0.5° horizontal resolution and 137 model vertical levels. We also analyse composite anomalies of the 2-dimensional fields: sea-level pressure (SLP), LST, sea-surface temperature (SST), total precipitation, geopotential height at 500 hPa (z500) and zonal velocity at 250 hPa (u250).
2.2 Methods
2.2.1 Blocking and jet stream diagnostics
For the computation of blocking diagnostics, we refer to the classic Tibaldi-Molteni index (Tibaldi and Molteni, 1990) with slight modifications introduced in Scherrer et al. (2006), as described in Davini et al. (2012). The meridional gradient reversals are computed at every gridpoint as:
where ϕ0 is set to be ranging between 30 and 75° N, whereas and . At every latitude λ0 a blocking event is counted if at any latitude ϕ0 between 30 and 75° N there is at least a latitude point for which the following conditions are satisfied:
The frequency of blocking as a function of longitude is therefore the ratio between the number of blocking events and the total days within a season.
The blocking intensity follows from Wiedenmann et al. (2002) and is closely related to the aforementioned definition of the blocking frequency. Following the Davini et al. (2012) formulation, once a blocking event is detected at gridpoint (λ0,ϕ0) we first define RC(λ0,ϕ0) as:
where and , so that RC denotes the average of the geopotential height 60° of longitude upstream and downstream of the blocking. The blocking intensity BI(λ0,ϕ0) is then the adimensional value:
It shall be noted that the precondition to have non-zero BI is that a blocking event is actually detected, according to the Tibaldi-Molteni methodology.
For the jet stream intensity, we follow the procedure outlined in Parker et al. (2019). First, we low-pass filter the u250 fields over time at every gridpoint with a 10 d Lanczos filter (Duchon, 1979). Then, a zonal average is computed within NH. The jet speed intensity and location at each longitude λ is defined as the maximum velocity detected among all latitude gridpoints and the associated latitude ϕ.
The rationale behind adopting blocking frequency/intensity and jet speed as diagnostics of the hemispheric scale atmospheric circulation follows from the arguments by Dorrington and Strommen (2020), evidencing that the jet stream variability projects on the weather regimes. A proper consideration of this aspect allows to consider additional types of blockings that complete addressing the modes of variability of the large-scale atmospheric circulation accomplished through the traditional weather regimes classification (e.g. Fabiano et al., 2021; Dorrington et al., 2022). Accordingly, we complement the regime analysis of the MHT extremes outlined in Lembo et al. (2022) by introducing blockings and jet maximum speed, relating hemispheric heatwaves to MHT extremes through planetary-scale waves.
2.2.2 Computation of MHT and wavenumber decomposition
The derivation of the MHTs and the zonal wavenumber decomposition follows Graversen and Burtu (2016); Lembo et al. (2019, 2022). We hereby briefly summarize their methodology.
First, at every vertical level, the total energy E is computed as the sum of the kinetic energy, , and the moist static energy, H:
where q is specific humidity; T is air temperature; z is geopotential height; and the constants Lv, cp and g are the latent heat of vaporization, the specific heat capacity at constant pressure and the gravity acceleration, respectively.
The meridional transport of E is integrated across a given circle of latitude and over the vertical extent of the atmosphere:
where ps is the surface pressure. The transport is positive when directed northwards.
Following Graversen and Burtu (2016), at every timestep and for every latitude, the zonal wavenumber decomposition is performed as:
where the sum is over all M hybrid model levels, i is the hybrid-level index, and a and b are the Fourier coefficients defined as:
Here Ψ is either the mass flux between two hybrid half levels or E, is the pressure difference between hybrid half levels, D=2πRcos (ϕ) with R being the Earth’s radius, k being the zonal wavenumber, and t, ϕ, λ the time, latitude and longitude, respectively, and d=360°. N, i.e. the highest considered zonal wavenumber, is taken to be 20, following Lembo et al. (2022). A correction for the k=0 wavenumber accounting for the zonal- and vertical-mean meridional mass-flux variability is applied following Liang et al. (2018): the zonal mean meridional heat transport is obtained by removing from the zonal mean transport for k=0 a term accounting for energy transport associated with the “instantaneous” total meridional mass flux. This term is averaged out in the long-term mean and dependent on a zero-energy reference level. A detailed explanation of this procedure is provided in Lembo et al. (2019).
2.2.3 Selection of extremes
The selection of MHT extremes follows Lembo et al. (2022) with a few additional details explained in Faranda et al. (2024) and references therein. It is based on the Peak over Threshold approach of Extreme Value Theory (EVT, Pickands, 1975; Coles et al., 2001), after deseasonalization (subtracting the long-term daily mean), and detrending (removing a linear trend) of the data and declustering of extremes. We use an objective declustering method based on the “extremal index”. We first estimate the extremal index, the inverse of the mean cluster size, with the intervals method (Ferro and Segers, 2003). Then we treat threshold exceedances that are separated by less than r below threshold values as belonging to the same cluster. r is the ncth largest inter-exceedance time, where nc is the number of clusters estimated based on the extremal index. The MHT extremes are defined on a daily timescales for 1° wide latitude bands within the mid-latitude channel. An EVT-based convergence algorithm is then used to determine suitable percentile thresholds for the selection of extremes in each latitudinal band. This algorithm displays the GPD (Generalised Pareto Distribution) shape parameter as a function of increasing threshold values. The optimal threshold value is then the one at which the shape parameter is already stable against further increasing threshold values and has the lowest uncertainty (Coles et al., 2001; Galfi et al., 2017; Lembo et al., 2022; Faranda et al., 2024). For the declustering and estimation of the GPD shape parameter, we use the “ismev” (Heffernan, 2025) and “extRemes” (Gilleland and Katz, 2016) R packages.
Table 1Percentage of days for which at least one latitude within each 10° wide latitudinal range displays an extreme MHT. The different columns show separately positive and negative MHT extremes in DJF and JJA. The bottom row shows the percentage of days featuring an extreme anywhere in the mid-latitude channel.
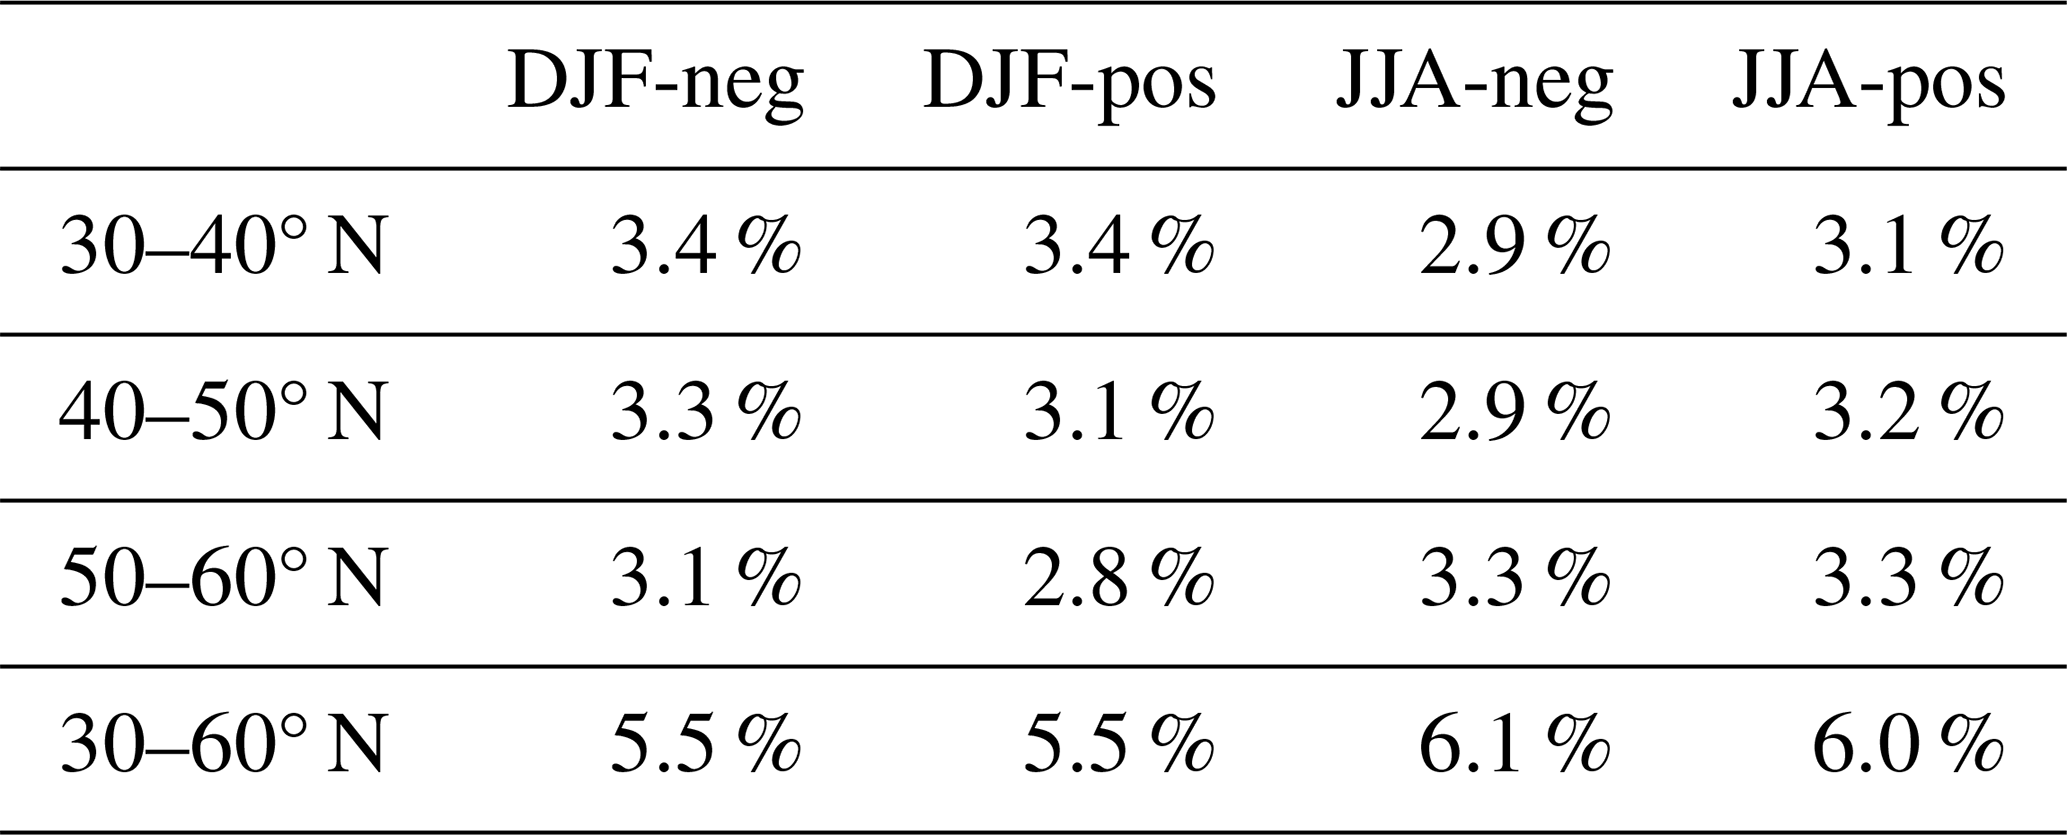
Table 1 displays the percentage of days characterized by the occurrence of a total (i.e. including all wavenumbers) MHT extreme in at least one latitudinal band within three 10° wide latitudinal ranges. These percentage values are remarkably homogeneous across latitudes, although there is a somewhat larger variation when comparing extremely strong and weak MHTs. This is possibly related to the different properties of the extreme MHT distributions, whose skewness has a more pronounced latitudinal variations for strong than for weak extremes (cfr. Lembo et al., 2022).
We compute LST extremes by spatially averaging daily fields across the 20–70° N domain. We remove the linear trend from the field at each gridpoint and deseasonalize, considering DJF and JJA separately. Hemispheric warm and cold extremes are then defined as all values beyond the 95th and 5th percentiles, yielding 202 and 198 d for JJA and DJF, respectively.
In each 10°-wide latitudinal band between 30 and 60° N, co-occurring extreme MHT and hemispheric-mean LST are defined as the set of days during which hemispheric LST extremes co-occur with an extreme MHT.
2.2.4 Significance tests
To assess the role of MHT extremes in the occurrence of LST extremes, we compare at each grid point the distribution along time of LST, SST, SLP, z500 and u250 during co-occurring hemispheric LST and MHT extremes (LST|MHT) with their distribution during LST extremes without concurrent MHT extremes (). We test whether the difference between the composite mean of LST|MHT occurrences and the composite mean of is random or reflects an emerging pattern related to these events by applying a statistical significance test. The same test is also applied to the difference between composite means of the same variables in correspondence of the strongest 5 % hemispheric heatwaves and of their general distribution, i.e. without any conditioning to MHT or selecting days corresponding to extreme hemispheric heatwaves. In all cases, the null hypothesis is that the two means are equal. The testing procedure consists of three steps: first, grid points showing a sizeable deviation from the mean in correspondence of co-occurring LST and MHT extremes are selected; secondly, neighboring grid points are clustered and sufficiently large clusters are retained; the chosen statistical test is applied to the cluster-averaged observable, with a correction to manage false discovery rate due to multiple testing over clusters. The procedure is described in detail in Appendix A. As an output, a mask is provided for each composite map, highlighting regions where the composite mean of anomalies conditioned to MHT is significantly larger or smaller than that of anomalies conditioned to no MHT, or the composite mean of anomalies corresponding to extreme hemispheric heatwaves are significantly different from the mean of the general distribution of anomalies.
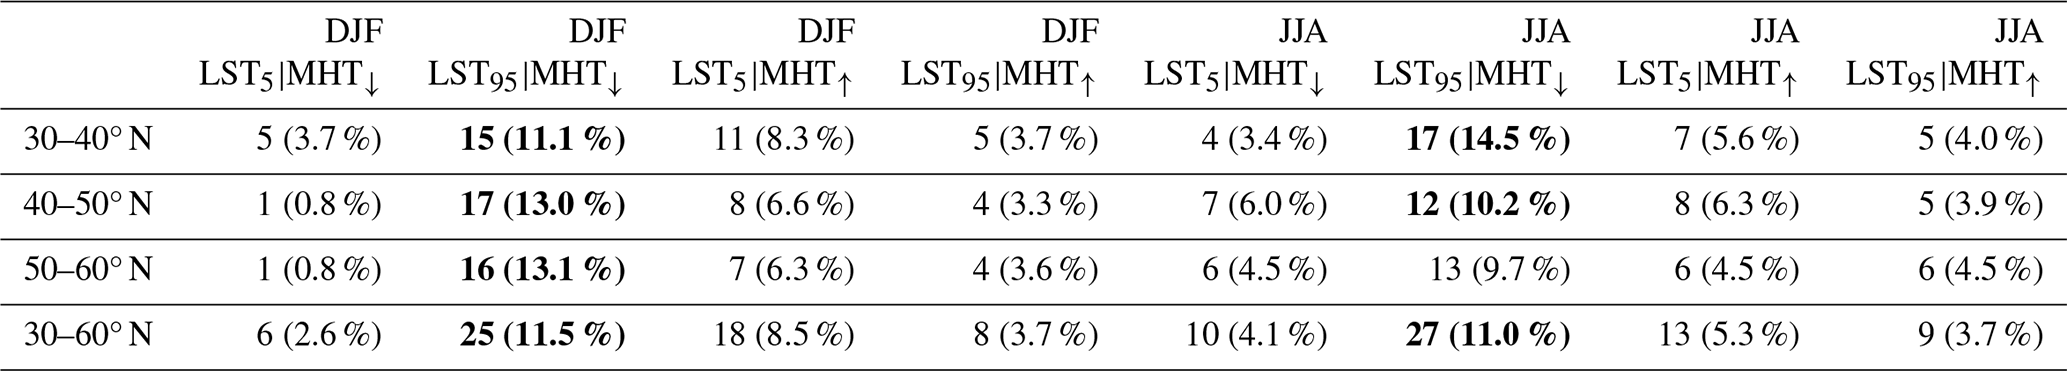
Table 2 shows counts of LST|MHT events in each 10° latitudinal band. The combination of extremely weak MHTs and warm hemispheric LST extremes (hereafter ) is preferred in both JJA and DJF, with 25 events found for DJF, and 27 for JJA. The lower third of the mid-latitude channel features a smaller number of such days than the other latitudinal bands, with all days recorded there being detected also in the 40–50° N latitudinal band.
Table 2Number of days featuring co-occurring LST|MHT events for all combinations of type and season, within different latitudinal ranges. The percentages of joint occurrences relative to the total number of MHT extreme events are given in brackets. Frequencies exceeding 10 % are highlighted in bold. For the relative frequency of occurrences in the full 30–60° N latitudinal band, numbers are highlighted in bold when 10 % threshold is exceeded in at least one 10-degrees-wide latitudinal band.
3.1 Unconditioned extremely weak MHTs
Given that conditioned events occur more often than other conditional occurrences, as shown in Table 2, we first aim to consider the relevance of these cases with respect to all MHT↓ occurrences.
Despite emerging among other combinations, the frequency of occurrences in the two seasons is relatively marginal with respect to unconditional MHT↓ and LST95 occurrences. However, the numbers displayed in Table 2 refer to single-day occurrences. While the persistence of MHT extremes is mostly limited to one or a few days (cfr. Lembo et al., 2019), hemispheric LST extremes in many cases span over consecutive days. 16 out of the 27 combined weak MHT-warm LST events in JJA exceed the threshold for extremely warm temperatures for at least 5 consecutive days – a widely used definition for heatwaves (Solomon, 2007; Radinović and Ćurić, 2012; Coughlan de Perez et al., 2023). If the full length of these 16 heatwave events is taken into account, a total of 81 heatwave days would be counted, which are at least partly associated with MHT↓ extreme occurrences. This represents 40.1 % of all LST95 days. In DJF, this frequency amounts to 50 d, representing 25.3 % of all LST95, with 11 out of 25 events belonging to heatwaves lasting more than 5 d. If heatwaves of any duration were taken into account, 55.0 % (37.8 %) extremely warm days would be associated with heatwaves featuring at least one event day in JJA (DJF). This hints at a different seasonal behavior of hemispheric heatwaves, compared to regional heatwaves (cfr. Tuel and Martius, 2024). We interpret this as the wintertime dynamics being more efficient in mixing the low-level atmosphere at the synoptic timescales whereby temperature extremes are less likely to occur. For the sake of consistency between seasons, we consider daily occurrences of extremes associated with LST95 events of any duration and focus on occurrences in boreal Summer and Winter.
In order to highlight the common features of combined occurrences, it is also informative to investigate whether MHT↓ has a signature in large-scale patterns of circulation and temperature, hinting to a relation between the thermodynamics and the dynamics of the system. Therefore, we show SST, LST, SLP and u250 composite means of MHT↓ events. We separately considered MHT↓ events in the 50–60° N (Fig. 1) and in 40–50° N (Fig. B1) latitudinal bands. We focus mostly on the former most northerly band, as this shows the largest effects on the considered fields. Maps for extreme events in the 30–40° N latitudinal band are not shown since they follow those of the neighboring 40–50° N, coherently with findings from previous works (Lembo et al., 2019, 2022).
Considerable differences emerge between the two seasons, regarding the extent of regions showing statistical significant patterns. Mostly, SST and LST anomalies are non-significant in JJA (Fig. 1a, c), with the exception of the southern coast of Alaska, where significant negative anomalies emerge, and scattered regions across Northeastern America, where positive significant anomalies are found. However, both seasons show a general pattern of warming over land in the southern part of the mid-latitudes and cooling in the northern part (Fig. 1a, e), which is consistent with negative mid-latitude MHT anomalies bringing less heat from south to north; the associated warming in southern mid-latitudes may contribute to extreme warming events there. The SLP composites (Fig. 1f) are mostly non significant; positive anomalies are found across most of the Northern Pacific, possibly hinting at the recurrence of a Pacific-North American positive phase (PNA+) (cfr. Lembo et al., 2022), but these are only significant across small parts of the basin close to the coast of North America.
DJF (Fig. 1b, d, f, h) is characterized by mostly positive LST anomalies spreading across eastern Europe, north China, and central North America. Remarkably, no widespread SST anomalies (at least being significant) appear associated with the MHT↓. The SLP anomalies (Fig. 1f) highlight a northeastward displacement of the Icelandic low towards Scandinavia and Russia, as well as a weakening of the area of low pressure covering the Northern Pacific. Accordingly , the zonal gradients in the fields of z500 anomalies (Fig. 1g) evidence an overall decrease, especially across the Pacific and the western Atlantic. This reflects a suppression of meridional heat exchanges by planetary-scale waves, coherently with Lembo et al. (2019) and somewhat counterintuitively matches with hemispherically spread of warm LST anomalies.
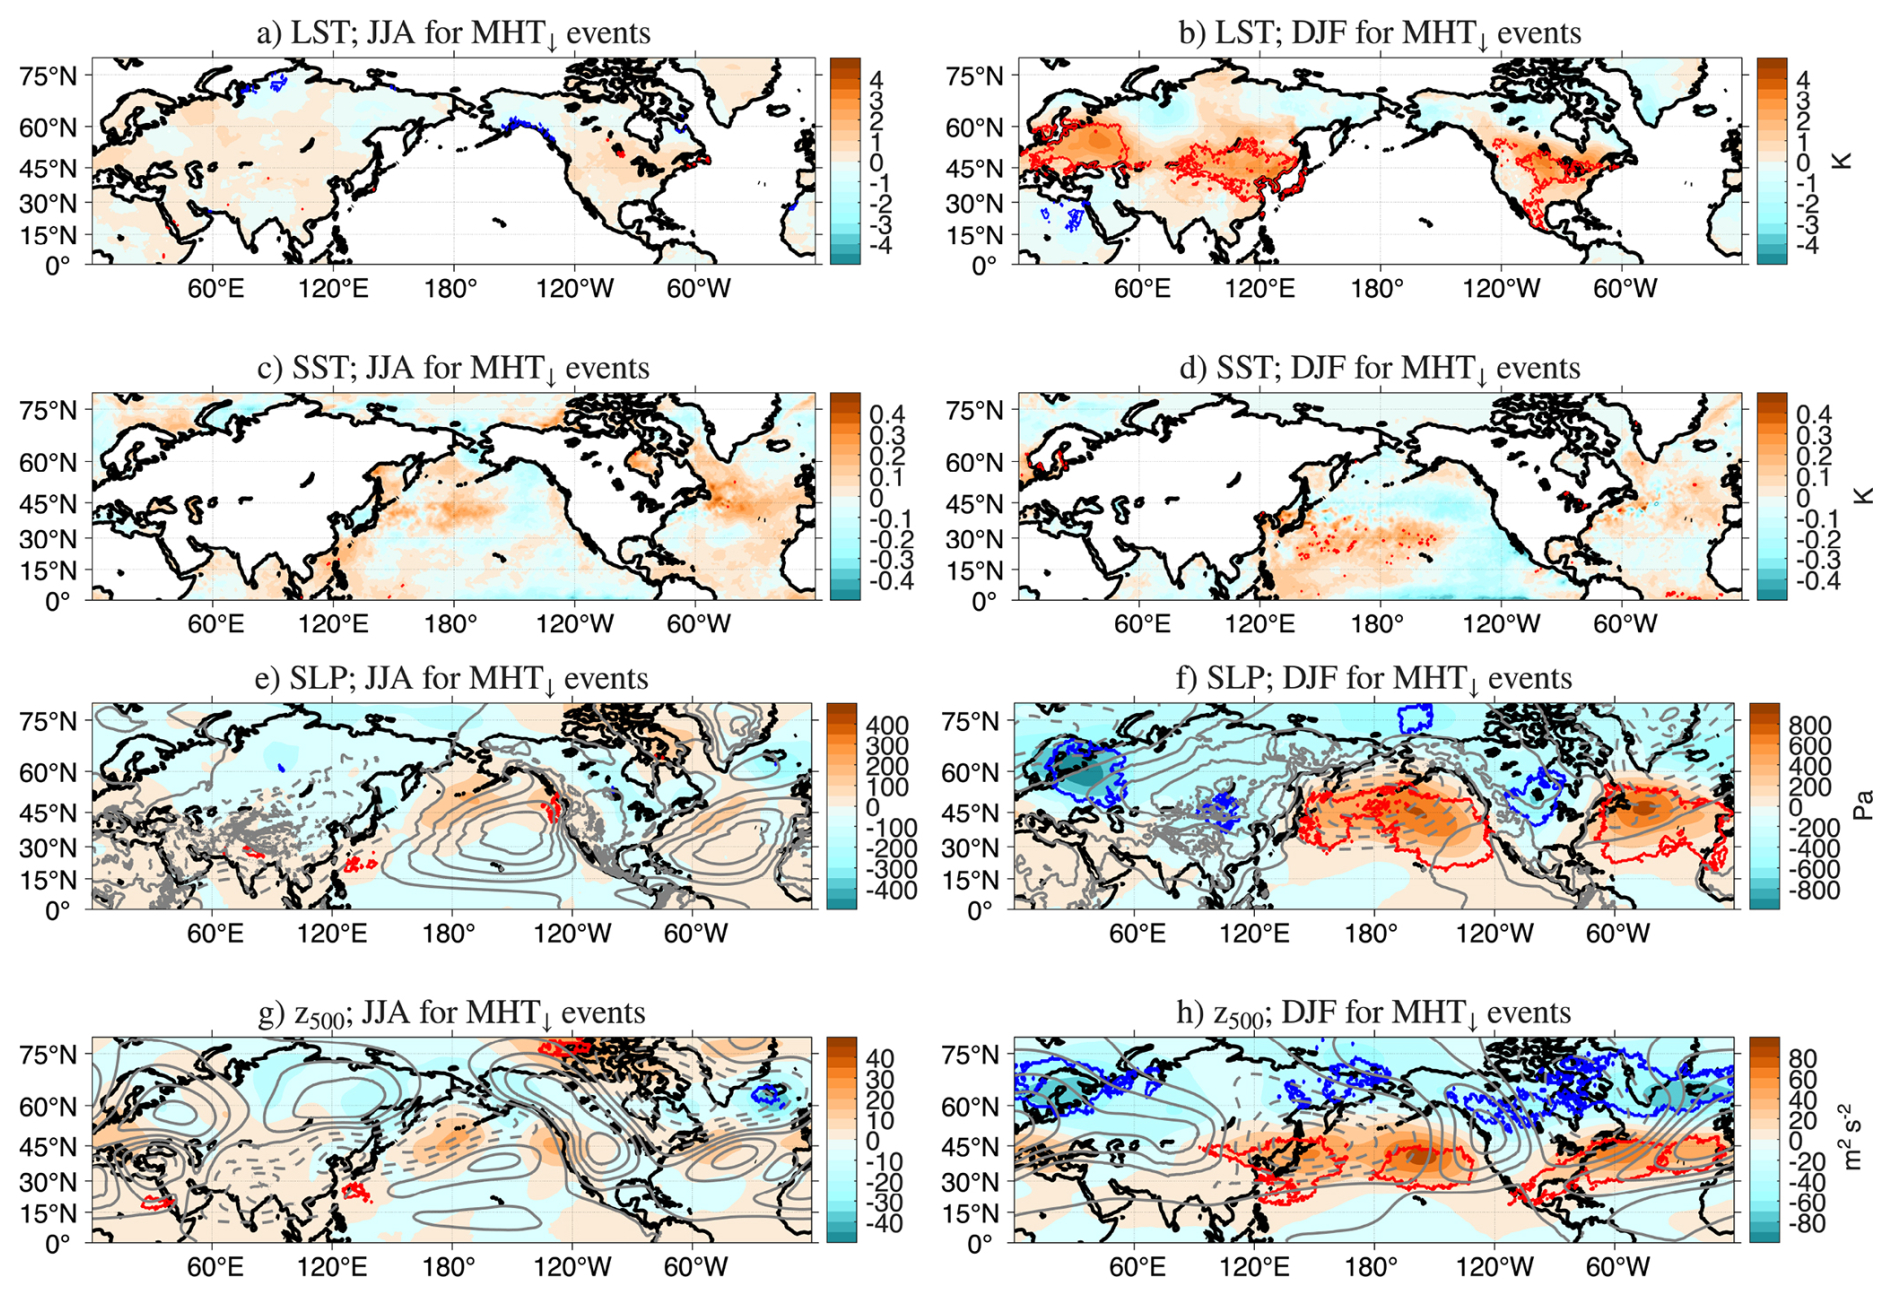
Figure 1Composite over MHT negative extremes within the 50–60° N band of detrended-deseasonalized LST, SLP, SST and z500 anomalies with respect to the 1979–2022 baseline period in JJA (a, c, e, g) and DJF (b, d, f, h). The red/blue contours denote significant anomalies with respect to the full statistics of the field over time (see Sect. 2.2.4). Grey lines in (e), (f), (g), and (h) denote the climatological mean after removal of the zonal mean at each latitude for SLP (e, f) and z500 (g, h). Dotted lines denote negative values, solid lines positive values. Isolines for z500 are equally spaced every 35 m2 s−2 for positive values, and 45 m2 s−2 for negative values. Isolines for z500 are equally spaced every 410 Pa for positive values, and 350 Pa for negative values.
3.2 Extremely Weak MHTs conditioned to extremely warm hemispheric LSTs in boreal Summer
We now shift our attention to the composite maps of events during JJA, averaging across the 34 d satisfying these conditions, as outlined in Table 2. First of all, it is worth noticing that the majority of these occurrences are associated with MHT↓ events spanning a broad latitudinal range in the mid-latitudes. This justifies our choice to consider all events occurring in at least one of the three 10-degrees-wide latitudinal bands.
The LST anomalies (Fig. 2a) are found to be largest over central Asia, amounting to up to 6 K warmer than the climatology. Other significant regions are Eastern Europe, the Middle East, parts of east Asia and the western coast of North America. Maps of LST anomalies for each occurrence are shown in the Supplement (Fig. S2), highlighting regions that feature extremely warm LST values. Remarkably, regions more often affected by warm LST are central Eurasia, Northwestern and Northeastern America, consistently with Fig. 2a.
SST anomalies (Fig. 2c) are mainly found to be significant in the North Atlantic sector, exhibiting a positive-phased tripole structure (similarly to what is found for unconditioned LST95 events in Fig. 6c and discussed later in this section) that mimics to some extent the positive phase of the renowned leading Empirical Orthogonal Function (EOF) of SST anomalies in the North Atlantic (cfr. Watanabe et al., 1999; Yu et al., 2024). One could hypothesize that this pattern is reflecting an influence of SST patterns on heatwave occurrences in the European region. In fact, it has been previously assessed that the SST anomalies and tendencies in the North Atlantic have an influence on the Summer atmospheric circulation, and as such influence near-surface temperatures over Europe (Krüger et al., 2023). In addition, it is relatively well understood that the two leading EOF modes of Summer atmospheric circulation in the North Atlantic-European (NEA) sector, i.e. the Summer North Atlantic Oscillation (SNAO) and the Summer Eastern Atlantic (SEA) patterns, are closely related to the SST tripole mode (cfr. Folland et al., 2009; Osborne et al., 2020).
The SLP composites in Fig. 2b suggest that could be associated with a SNAO+ phase, with the expansion of a ridge from the Atlantic ocean into Northern Europe (consistently with unconditioned LST95 events in Fig. 6e). Extratropical SST anomalies in the Pacific are thought to be less related to the atmospheric circulation, unlike tropical Pacific anomalies (Thomson and Vallis, 2018). This is well reflected in Fig. 2c. SLP composites in the Pacific-North American sector closely align to the patterns of anomalies projected onto the leading mode of North American heatwave variability (Yu et al., 2023, cfr. also Fig. 4a), hinting at a recurrent pattern pairing the large-scale atmospheric dynamics to heatwaves occurring in the region. The dipole pattern featuring high pressure systems in the western part of North America, and low pressure system over the eastern part is also a typical occurrence associated with heatwaves, as recently outlined in Chapman et al. (2025). An in-depth analysis of a notable example of these combined occurrences (namely, the concurrent heatwave associated with the Northwestern Pacific heatwave in late June 2021) is provided in the Supplementary material (Sect. S2).
Composite mean of U250 anomalies (Fig. 2b) hints at an overall increase of the subtropical jet stream maximum speed in the Pacific and Atlantic domains. This is reflected in the probability distribution functions (PDF) of the jet stream intensity over the two basins (Fig. 3a, c) as compared to the climatological distribution, to the distributions within MHT↓ samples and within LST95 samples. The distribution associated with occurrences exhibits a significant tail towards extremely intense jet stream in the Pacific, that is coherent with the climatological distribution and the distribution for MHT↓ and LST95. However, the median value is set to be significantly larger than the climatology, although smaller than the median value for LST95 events. Similarly in the Atlantic, the distribution is peculiarly asymmetric towards weak jet stream, while having larger median value than the climatology and than the MHT↓ distribution.
Given the relevance of atmospheric blocking for the development of heatwaves in Summer, we separately consider composites of geopotential fields in the free atmosphere. To this aim, Fig. 4a shows composite maps of detrended z500, while Fig. 5a, c shows the blocking frequencies as a function of longitude and the instantaneous measure of blocking intensity (see Wiedenmann et al., 2002; Davini et al., 2012) for the occurrences in JJA. z500 anomalies evidence a strengthening of the ridges characterizing the azonal climatological fields over western North America, the central Atlantic and western Eurasia. On the other hand the troughs across east Asia and the central Pacific are weakened. The longitudinal section of blocking frequencies highlights that the western Eurasian ridge indeed signals the presence of blockings when hemispheric heatwaves and weak MHT co-occur. To a lesser extent, these combined events also feature increased occurrence of blockings in Eastern Eurasia and in the eastern Atlantic, features that are shared with other unconditioned LST95 events (cfr. Figs. 5a and 6g). The composite mean map of instantaneous BI, although relatively patchy, denotes that the ridge over western North America stands out during episodes of intense blocking, though not associated with a significant increase in frequency.
The comparison of LST95 (Fig. 6a, c, e, g) and conditioned composites highlights some peculiar features of the latter occurrences of hemispheric heatwaves, distinguishing them from other hemispheric heatwaves. The Eurasian warming is to a great extent unchanged in the two cases. This is not unexpected; in fact (cfr. Röthlisberger and Papritz, 2023) diabatic heating dominates heatwave occurrences over continental and dry regions, where the solar warming related to cloud-free conditions and consequently the absence of local cooling due to evaporation play a major role into the heating of continental masses. On the other hand, adiabatic warming and the role of advection are important where storm tracks are climatologically located. This is the case of the Northwestern America, where orography through downsloping winds and the advection of previously heated warm and humid masses from the oceans are crucial, and to a lesser extent of southeastern Europe, where subsidence embedded in the climatologically dominating Summer anticyclones, play a major role. Therefore, dynamics are important in shaping the occurrence and intensity of heatwaves in this region through concurrent events, as it is evident from the differing patterns compared to Fig. 6. These patterns have been found to be somehow typical of concurrent heatwave occurrences, as argued in Chapman et al. (2025). However, the 2021 case (see Supplement, Sect. S2) highlights that such dynamic features combine with local thermodynamic conditions in enhancing the LST warm anomalies, through diabatic heating and subsidence.
We finally complement the analysis of conditioned by looking at the spectrum of MHT anomalies as a function of zonal wavenumber and latitude for all days related to a heatwave with a occurrence (Fig. 7a). The climatological spectrum is superimposed on the spectrum of anomalies to show whether the magnitude of the changes are sufficient to revert the sign of the transport. In the high latitudes, wavenumbers k=2 and k=3 feature strong negative (southward) anomalies (up to −0.25 PW), that indeed revert the MHT from positive to negative, i.e. determining a southward heat transport for these scales. At higher wavenumbers, however, the positive k=5 anomaly north of 50° N enforces the poleward transport by 50 %, adding 0.15 PW to a baseline climatological 0.3 PW. The climatological maxima of the JJA spectrum are confined at the tropical edge of the k=2 meridional section, where negative anomalies are also found, peaking at about 1 PW. We finally notice that the positive anomaly at k=5 can be understood as a stretching of the sloping maxima of MHT anomalies in the k=5–8 range as seen in the climatology, with maxima going from higher to lower latitudes for increasing wavenumber. We interpret these as the signature of the planetary-scale amplification of the Rossby part of the wave spectrum, peaking at k=5–7 in JJA, in response to heatwave occurrence, as found in Kornhuber et al. (2020) and coherently with what found in Lembo et al. (2022).
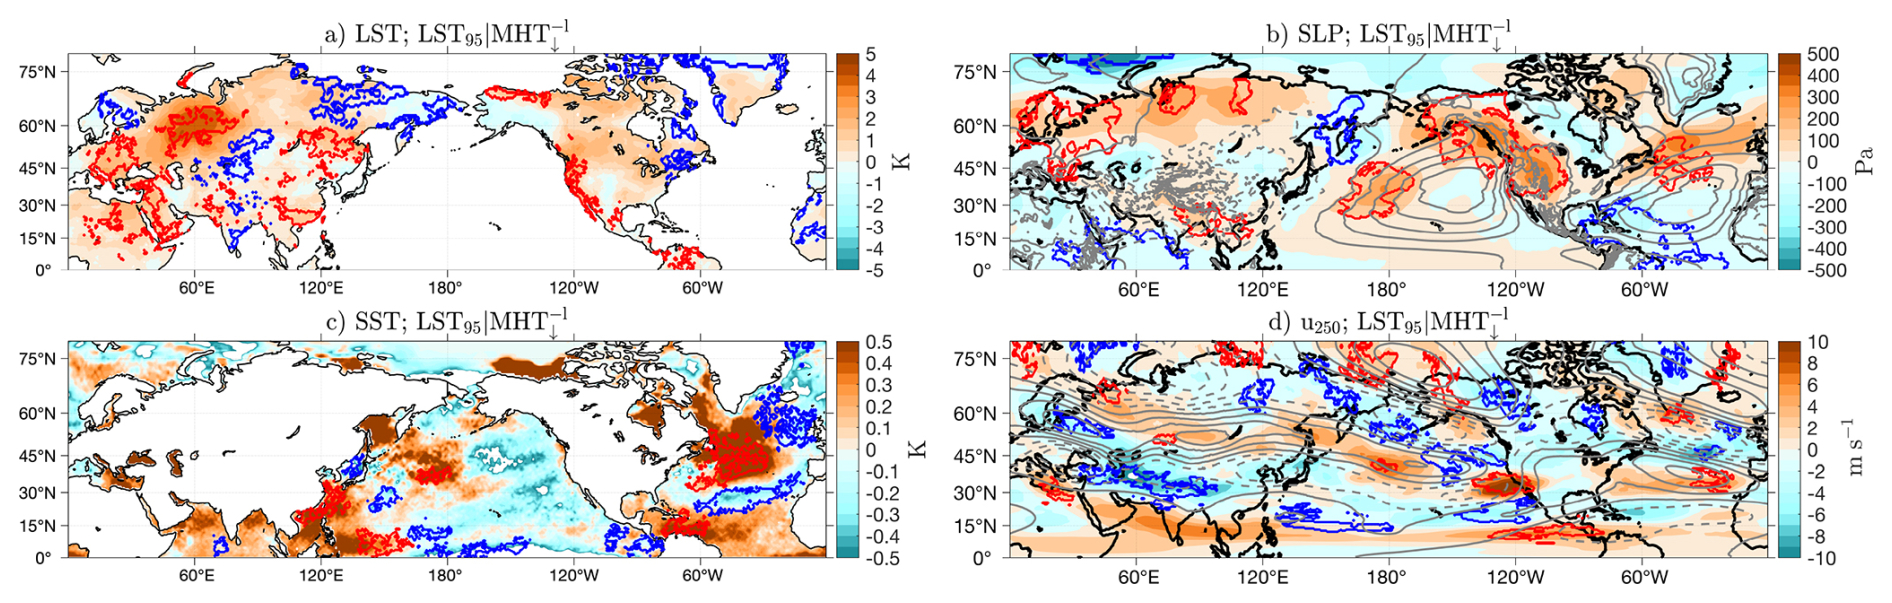
Figure 2Composite mean anomaly maps of (a) LST, (b) SLP, (c) SST and (d) u250, averaged across all days featuring an extremely weak MHT and an extremely warm hemispheric LST anomaly in JJA. The red/blue contours denote significant anomalies with respect to the statistics of all LST95 daily events. Grey lines in (b), (d) denote the climatological mean after removal of the zonal mean at each latitude for SLP (b, f) and u250 (d, h) Dotted lines denote negative values, solid lines positive values. Isolines for SLP are equally spaced every 410 Pa for positive values, every 350 Pa for negative values. For u250 isolines are every 10 m s−1 for negative and positive values.
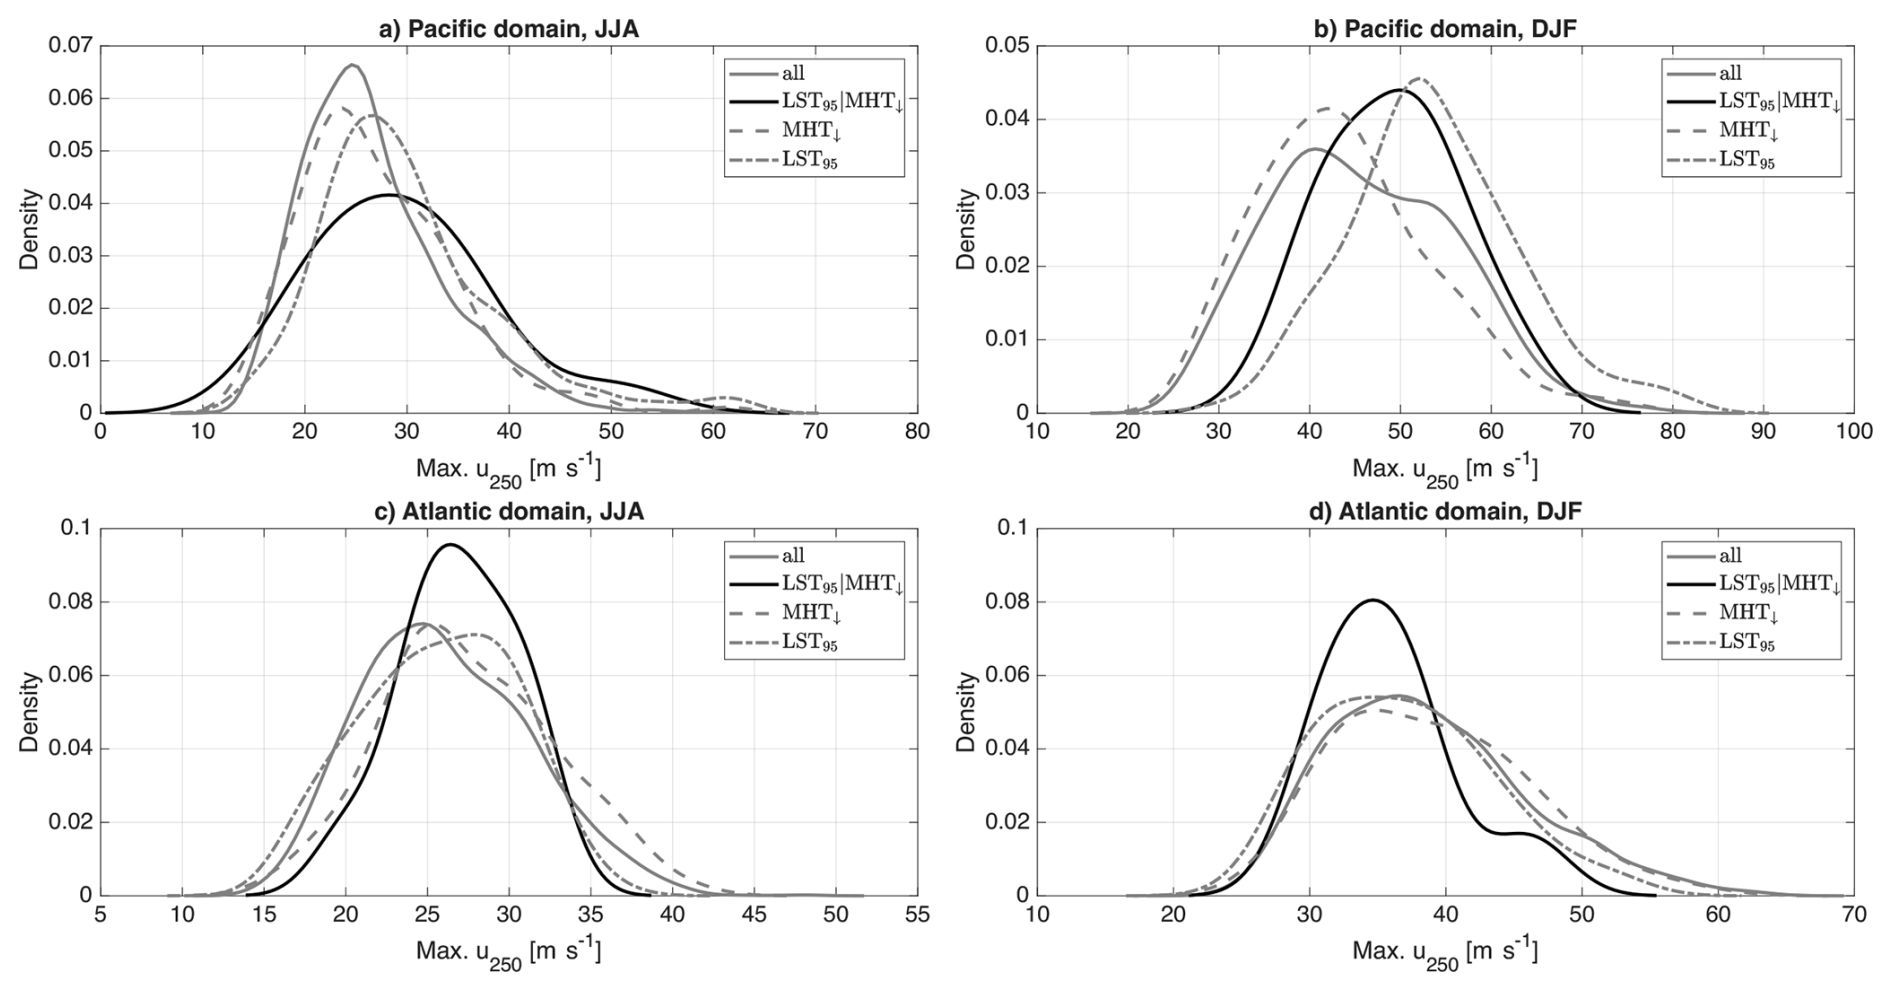
Figure 3PDFs of maximum jet speed intensity over specified domains in the Northern Hemisphere for (a) the Pacific basin in JJA, (b) the Pacific basin in DJF, (c) the Atlantic ocean in JJA, (d) the Atlantic ocean in DJF. The Pacific region is comprised in the (160–240) longitudinal range, the Atlantic region in the (280–360) longitudinal range. The PDFs are standardized and obtained via kernel smoothing function at 100 equally spaced points in the range of jet speed intensities computed as described in Sect. 2.1. Grey solid lines refer to the population of all events, black solid lines to the occurrences, grey dashed and dashed-dotted lines to MHT↓ and LST95 occurrences, respectively.
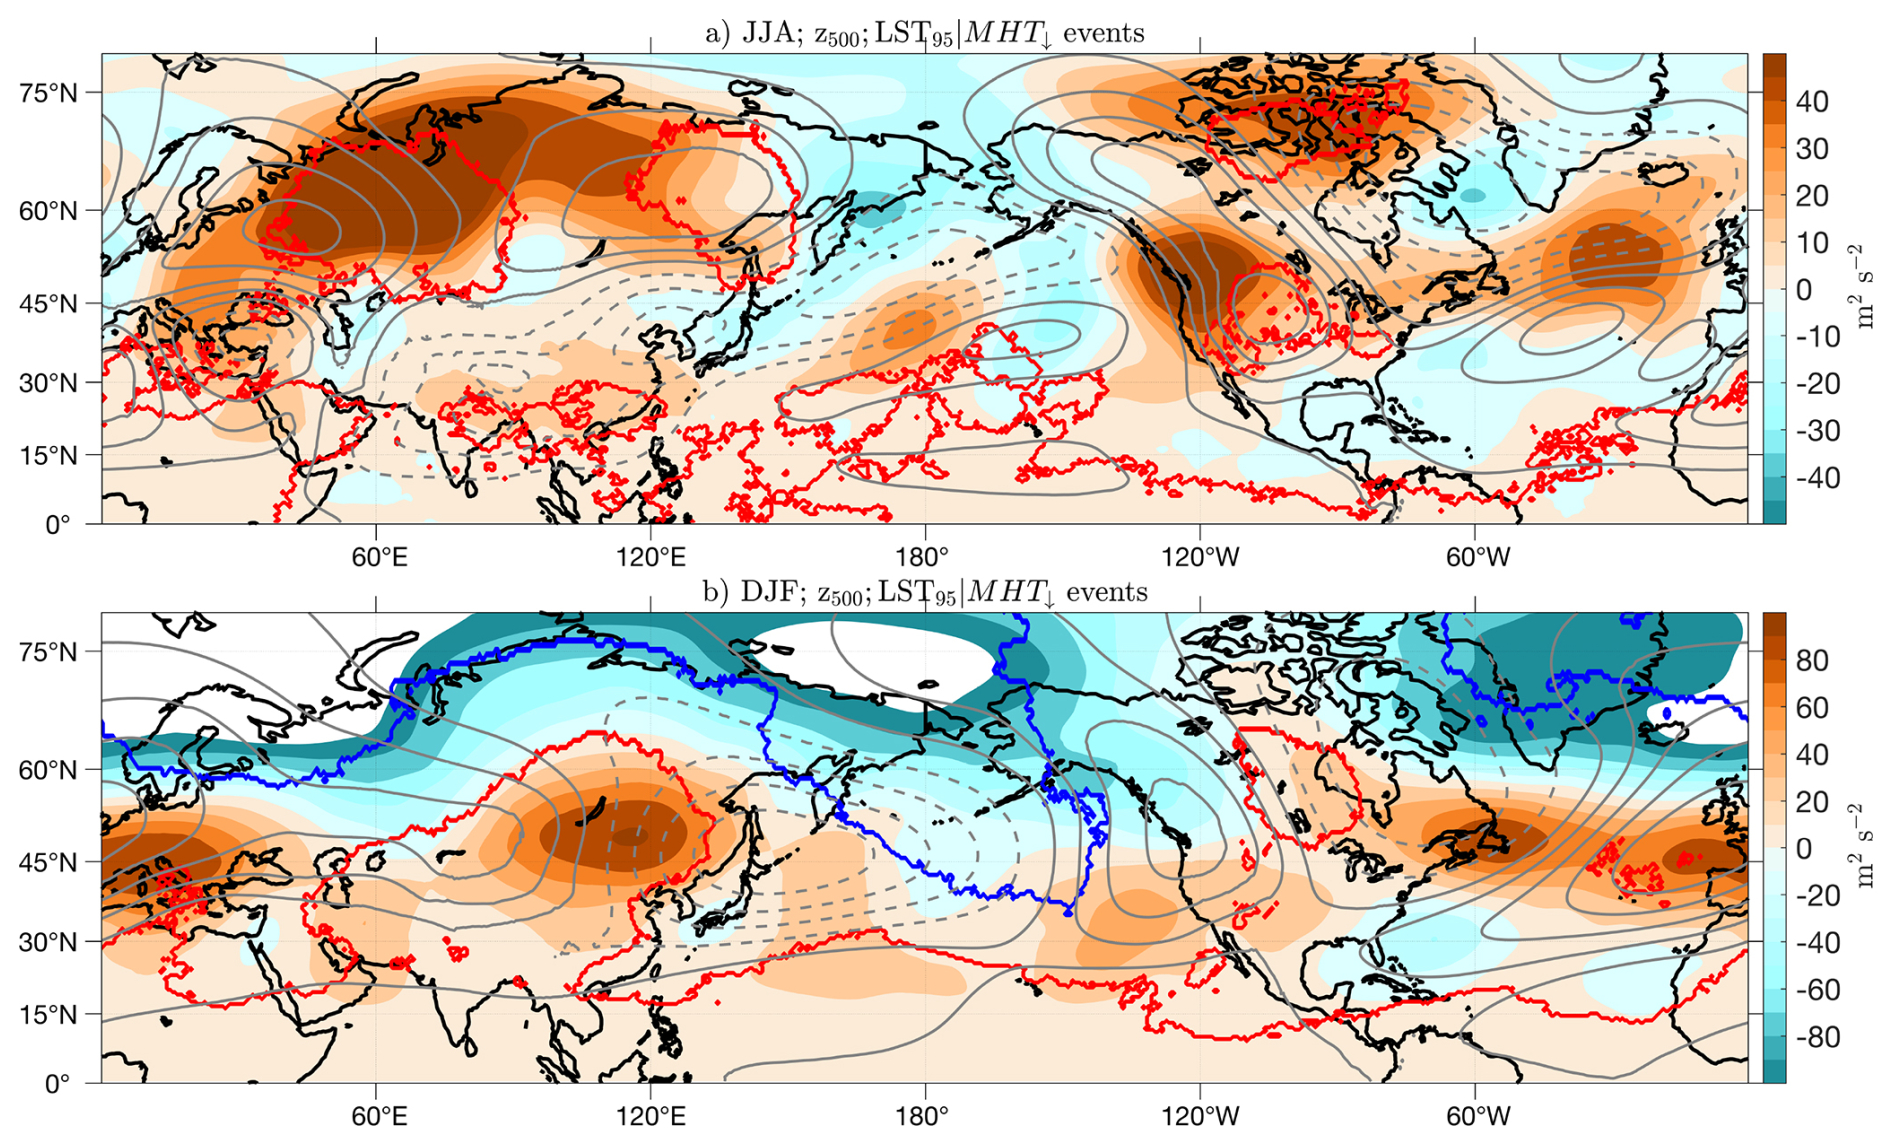
Figure 4Composite mean anomaly maps of z500 detrended-deseasonalized anomalies for conditioned to the occurrence of in (a) JJA and (b) DJF. The red/blue contours denote significant anomalies with respect to the statistics of all LST95 daily events. Grey lines denote the climatological mean z500 after removal of the zonal mean z500 at each latitude. Dotted lines denote negative values, solid lines positive values. Isolines are equally spaced every 35 m2 s−2 for positive values, every 45 m2 s−2 for negative values. Blank areas denote anomalies that are larger than the color range.
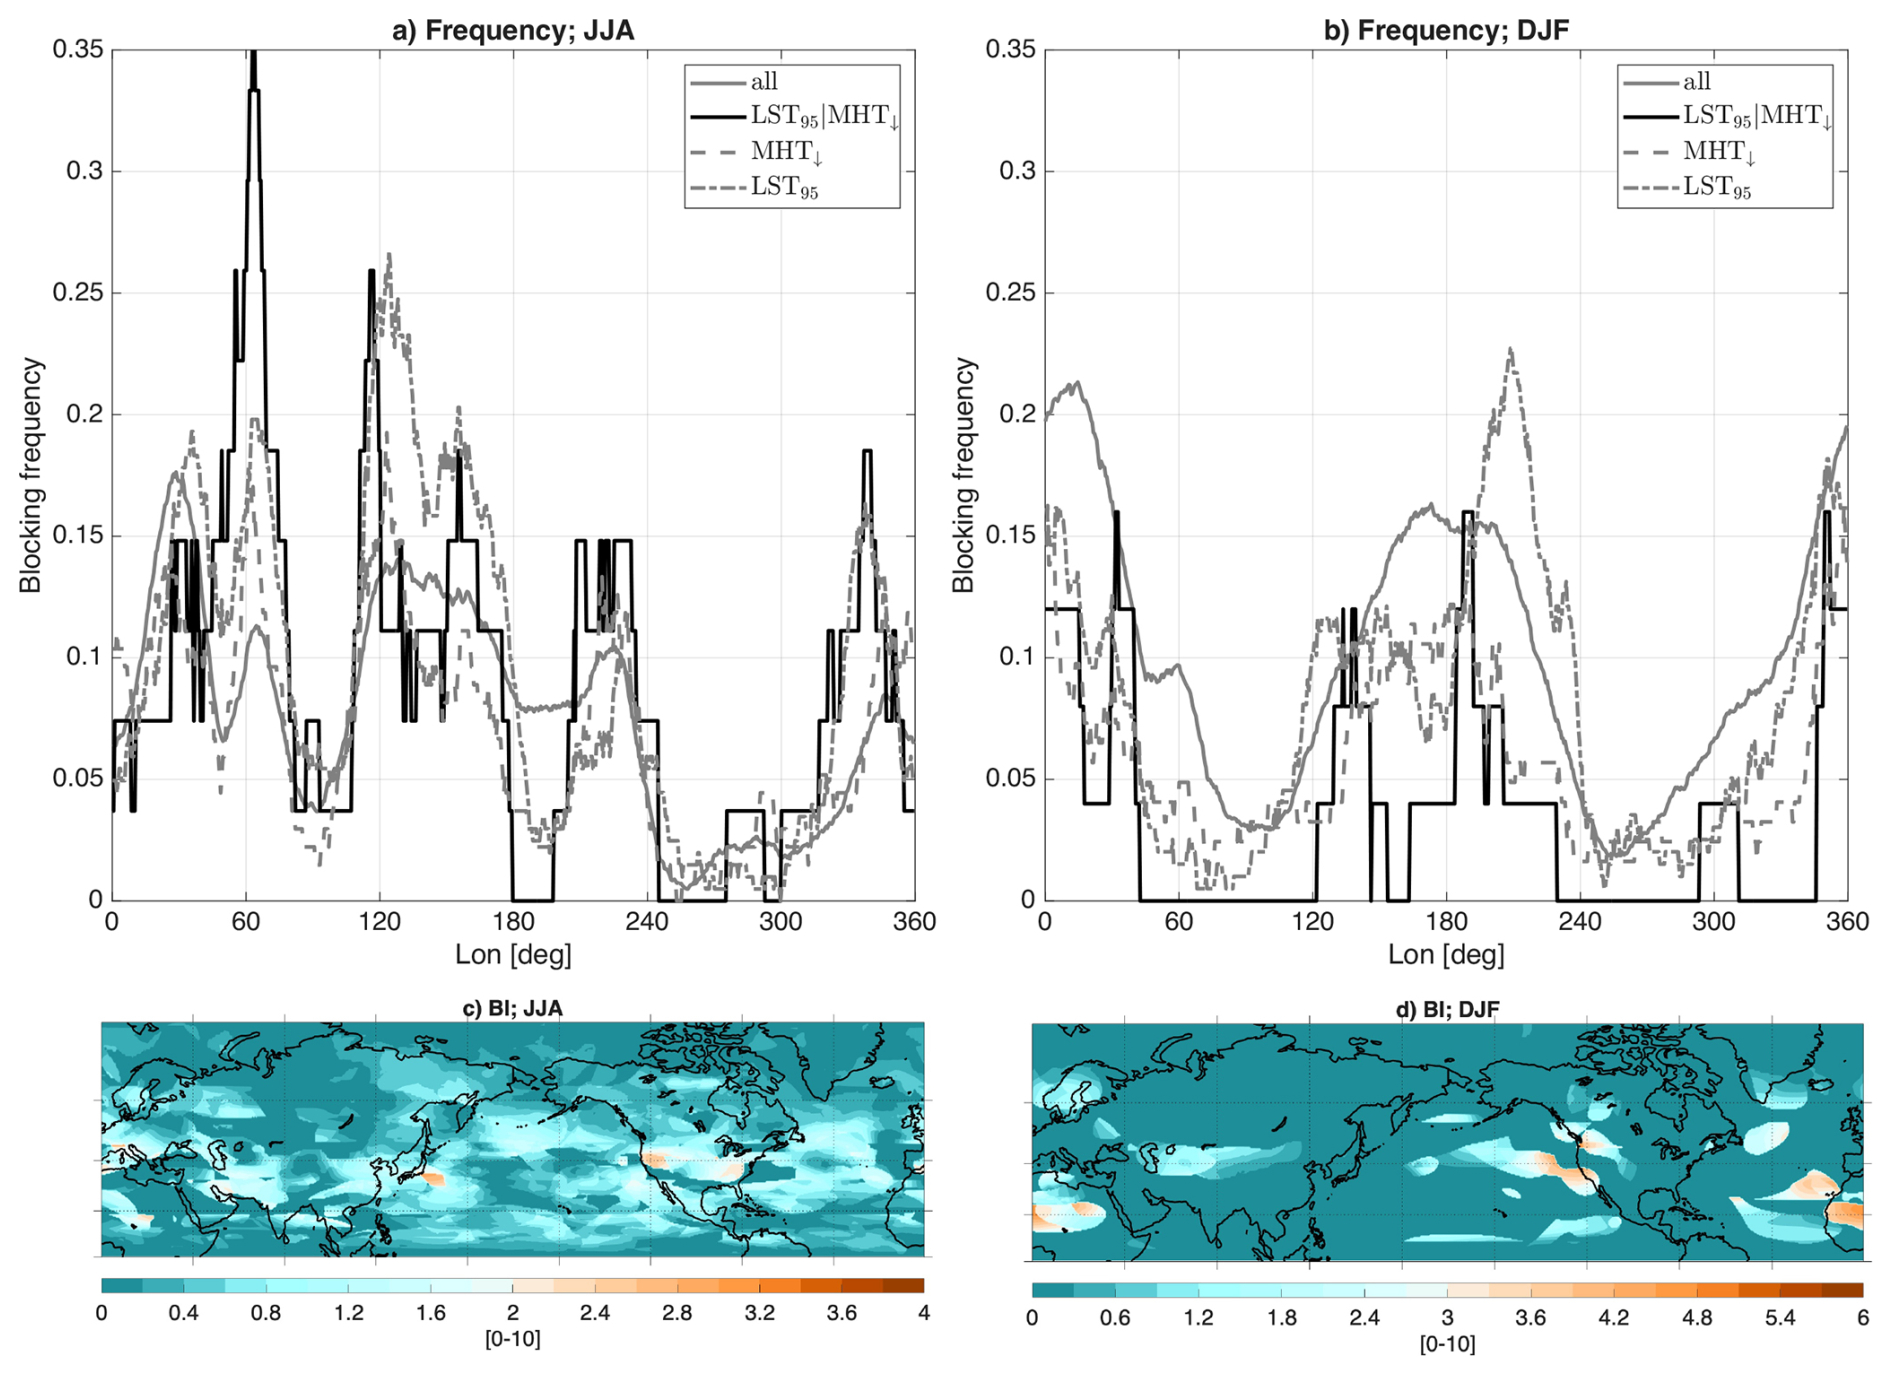
Figure 5Longitudinal sections of blocking frequencies for (a) JJA, (b) DJF. Grey and black solid lines represent longitudinal sections for all events and for occurrences, respectively, while Grey dashed and dashed-dotted lines denote MHT↓ and LST95 occurrences, respectively. Composite mean maps of BI index for days featuring occurrences in c) JJA and d) DJF. Non-negative values are only displayed in gridpoints where at least one day of occurrence exhibits a blocking. BI is a non-dimensional index ranging between 0 and 10 (cfr. Wiedenmann et al., 2002; Davini et al., 2012).
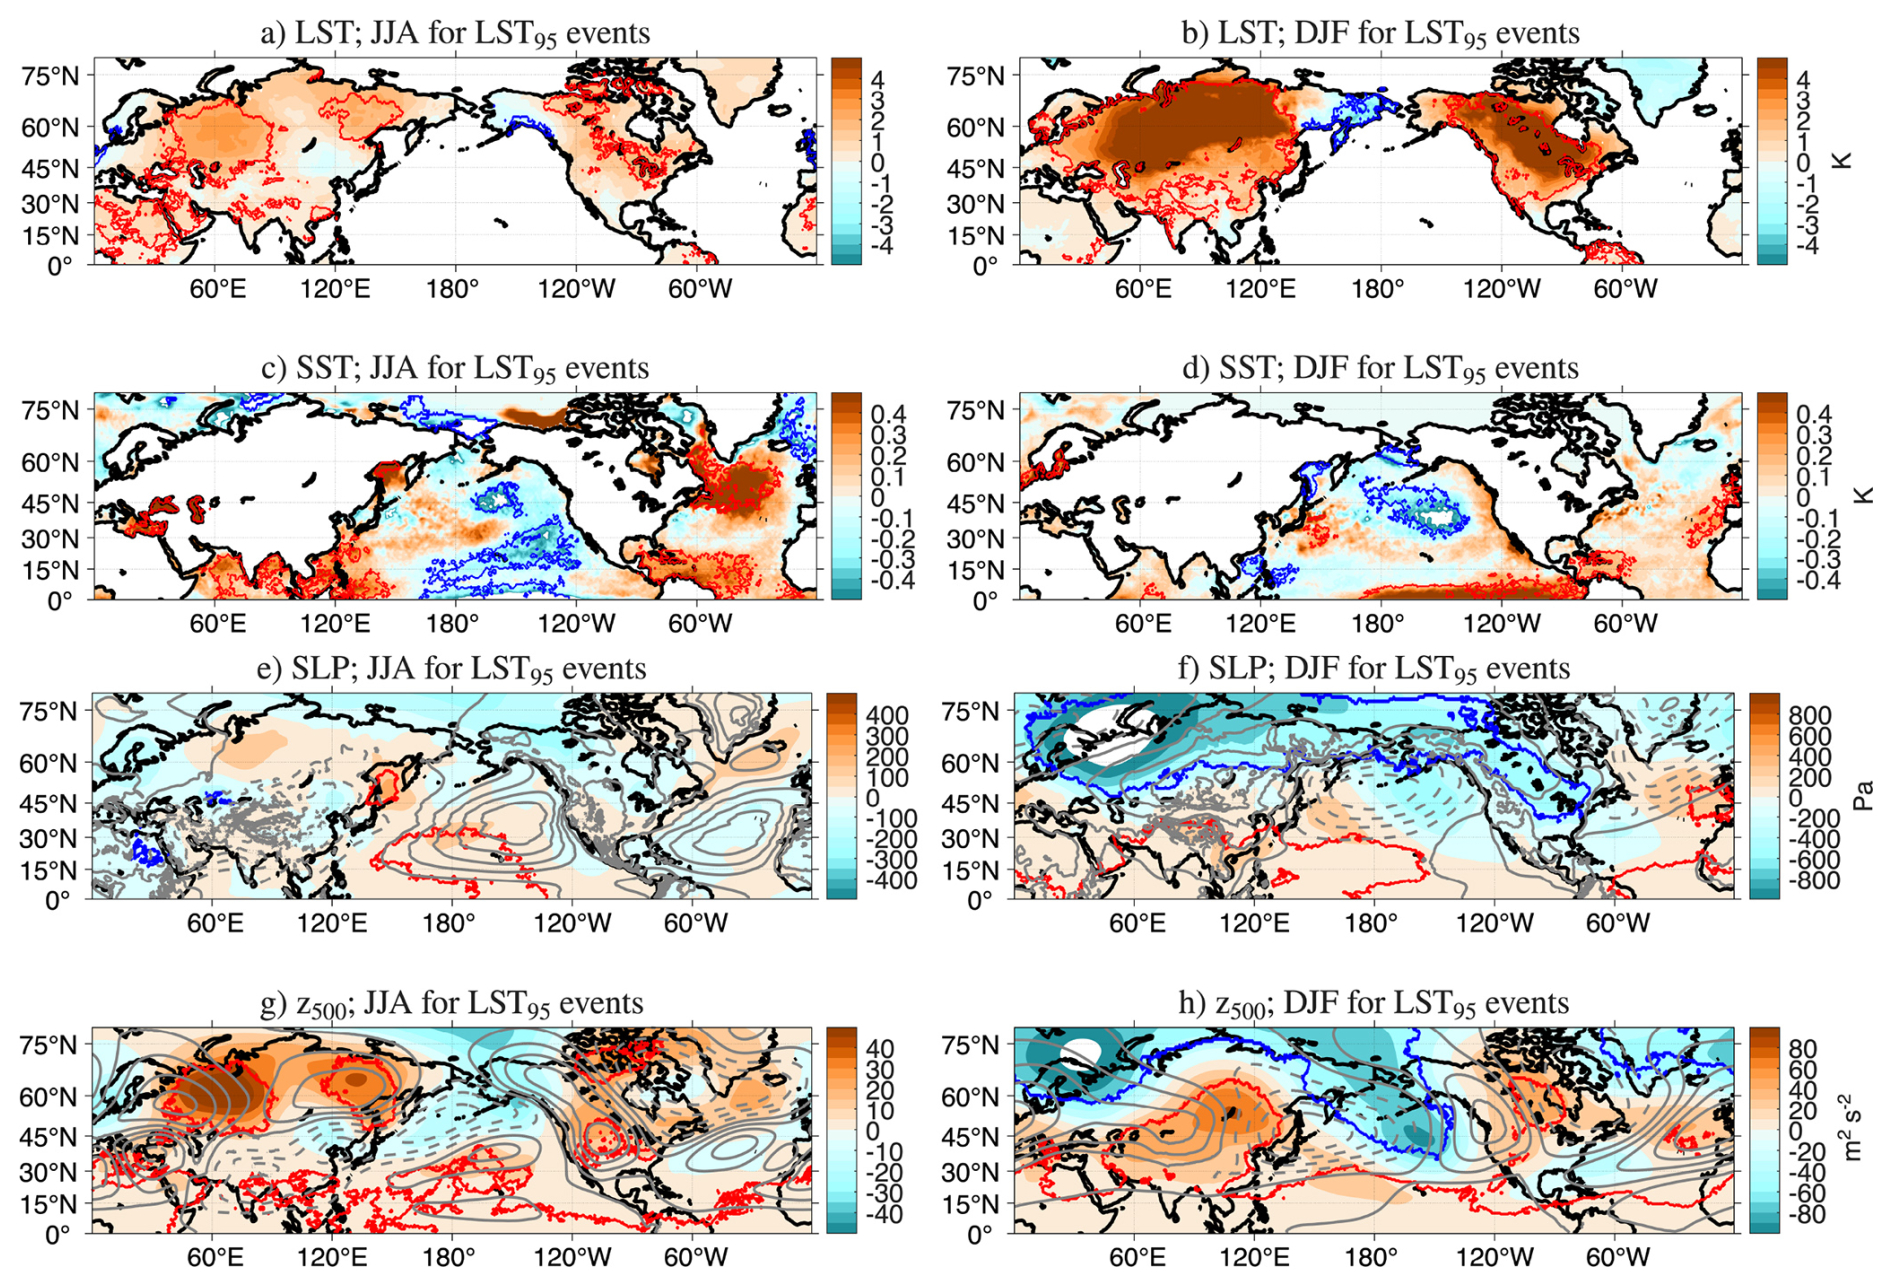
Figure 6Same as Fig. 1 for all days featuring LST95 occurrences.
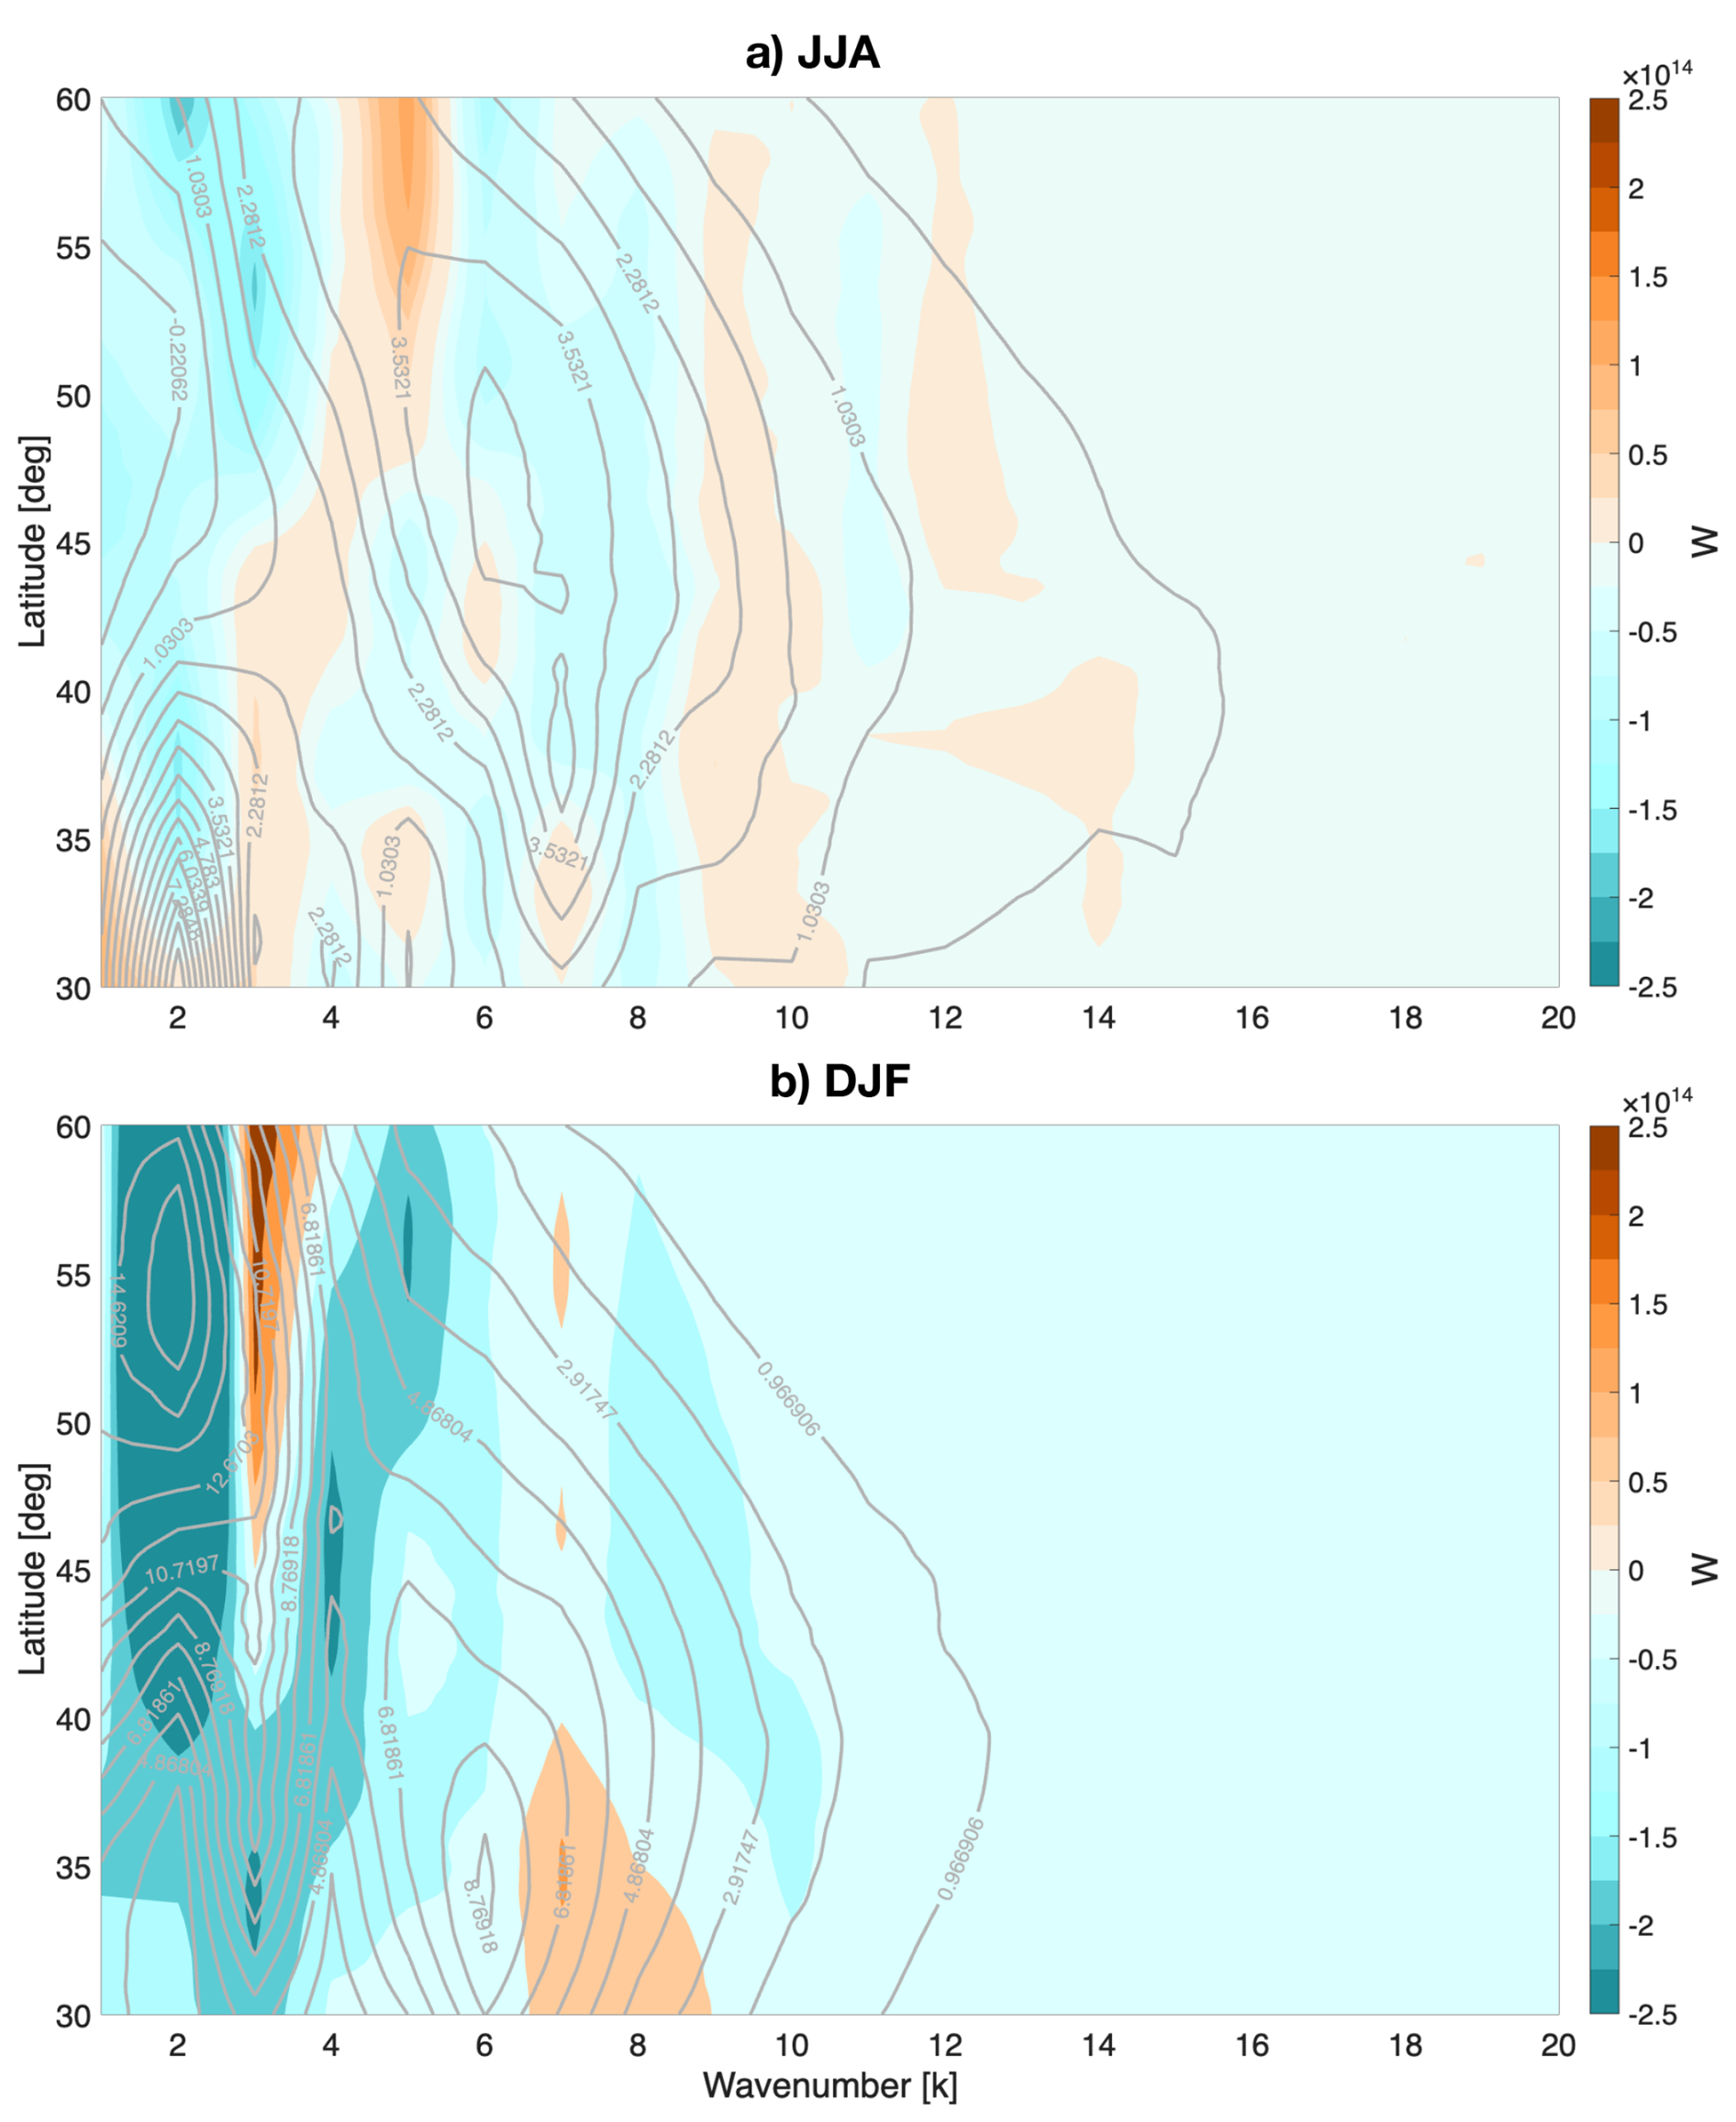
Figure 7Spectrum of MHT anomalies (W) averaged in JJA (a) and DJF (b) across all days featuring a event, as a function of wavenumber k and latitude. Solid contours denote the climatological mean spectrum; isolines are labeled in 1014 W.
3.3 Extremely weak MHTs conditioned to extremely warm hemispheric LSTs in boreal Winter
We now turn our attention to events in the boreal Winter (DJF). Figure 8, analogously to Fig. 2, displays composite mean anomaly maps of LST, SLP, SST and u250 for such daily occurrences in DJF. We identify several salient features:
-
The LST anomalies span the majority of continental regions, peaking in the high latitudes, i.e. central Siberia and Canada;
-
Scattered cold SST anomalies are present over the central Atlantic, while the western tropical Pacific exhibits large positive anomalies;
-
SLP anomalies display extended low pressure systems over the continents, coherently with a combined AR/PNA- pattern (cfr. Lembo et al., 2022);
-
u250 anomalies show a weakening of the jet stream at the eastern edge of North America and possibly a strengthening downstream over North Africa and the Iberian peninsula. Similarly, the jet stream at the eastern edge of Eurasia is found to be weakened, whereas it is stronger off the western coast of North America;
Unlike in JJA, we do not find a clear signature of prominent extratropical SST anomalies related to events, especially in the Atlantic. The warm anomaly in the tropical Pacific hints at a possible role of El Niño through the mediation of a westerly QBO phase (cfr. Kumar et al., 2022), but we did not find a significant correlation between our combined occurrences and these indices (not shown). The prominent feature emerging from the SLP composites is the excessive zonality over the high latitudes of Eurasia and North America, interrupted by a weakening of the Pacific and Atlantic climatological troughs. The situation is better elucidated by the composite maps of z500 anomalies (Fig. 4b), showing that the ridges over the Rockies and western Europe are strengthened, but at the same time confined towards the midlatitudes, coherently with the downstream displacement of the jet. The PDFs of the jet stream maximum velocity for the Atlantic and Pacific domains (Fig. 3b, d) coherently describe a pronouncedly larger median jet speed peak than the climatological average in the Pacific, which is also consistent with the same PDF for LST95 occurrences; the signal, though, is less clear for the Atlantic domain. The frequency and intensity of blockings is described in Fig. 5b, d. We notice that almost all longitudes blockings are less prone to develop compared to climatology, and that this is in line with what occurs in MHT↓ events. On the contrary, a significant increase in blocking frequency over the eastern Pacific is found in LST95 events, amounting to a 25 % increase. Regarding BI, the most notable feature is that only few regions exhibit at least one blocking occurrence; these are the eastern Pacific, parts of the Atlantic and the adjacent North African regions. Note that in the Atlantic domain there is a clear increase in jet intensity, which is consistent with z500 in Fig. 4b and with positive LST over Europe and further into Asia in Fig. 8a. This zonal flow brings weather systems eastward into the Eurasia causing warm anomalies and hampering development of blockings consistently with Fig. 5b. The described pattern is also consistent with the maps of individual displayed in Fig. S2 of the Supplement. In most cases, large parts of central Eurasia are found to be affected by extremely warm LSTs, while North America features LST extremes either in the western or eastern half of the continent.
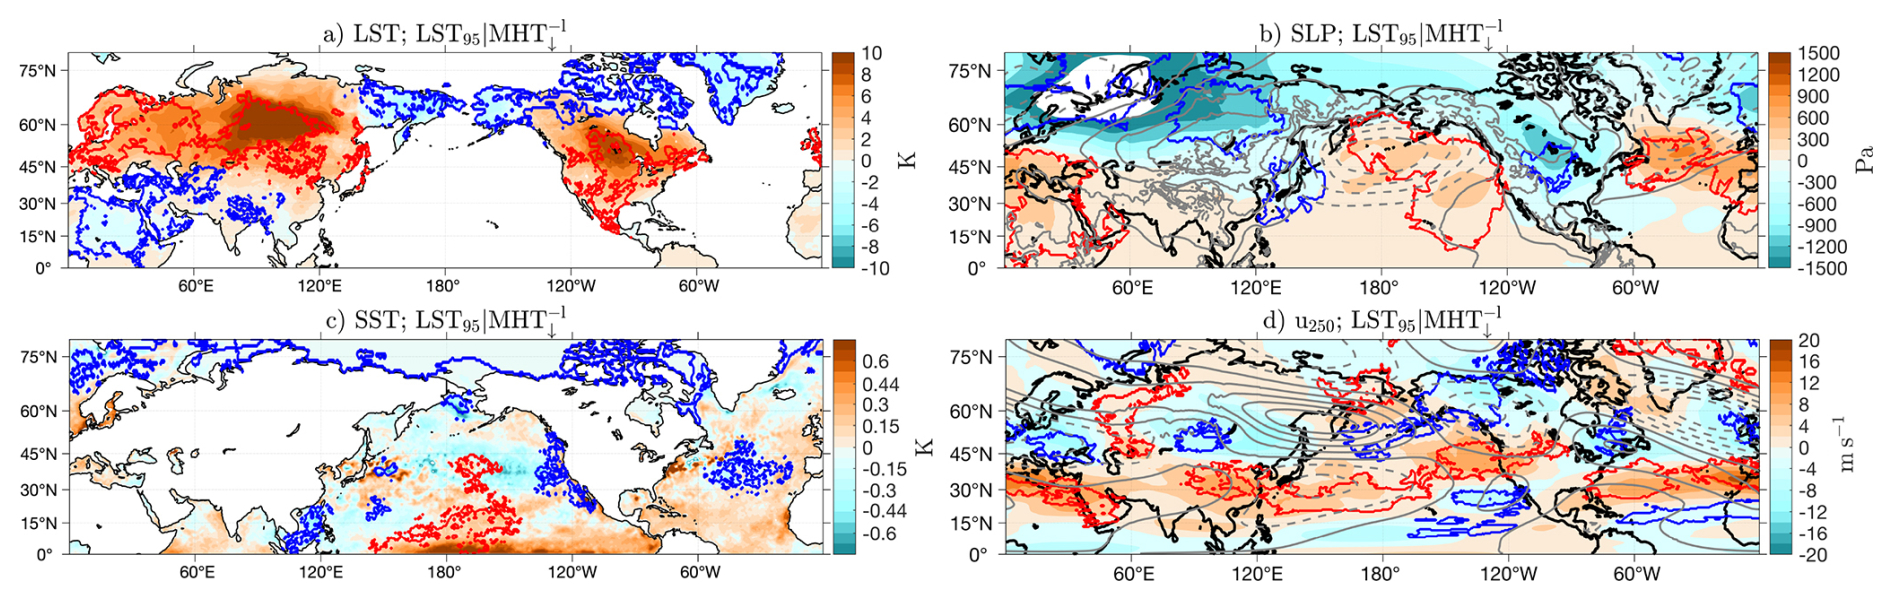
Figure 8Same as Fig. 2 for all days featuring combined occurrences in DJF.
Comparison of composites for LST95 (Fig. 6b, d, f, h) and conditioned events highlights that the large troughs spanning most of Eurasia and central North America are a common feature of hemispheric heatwaves, although the pattern of SLP is somewhat reversed over the Pacific region. As a result, the Western half of North America is less prone to extreme warming in the combined case. The jet stream is in fact in both cases displaced downstream, but in the combined case it peaks southward with respect to the concurrent heatwave occurrences. Possibly, a role in this different behavior is played by the strong negative SST anomalies that are found in Fig. 6d, but an interpretation of this would require additional investigation. The expansion of the Atlantic ridge towards Europe, that is peculiar of occurrences, might also be related to the larger warming of western Europe compared to the other concurrent heatwave events.
Finally, the distribution of MHT across the spectrum of different zonal wavenumbers (Fig. 7b) highlights a dominant anomalously negative k=2 contribution in the middle and high latitudes (up to more than −0.5 PW, i.e. a 40 % increase with respect to its climatological value). Unlike in JJA, this is neither sufficient to revert the sign of the transport in that specific wavenumber, nor to determine a total negative MHT. The main outcome of this anomaly is rather a significant reduction in the meridional gradient of MHT at k=2 wavenumber. On the contrary, the meridional gradient is increased for k=3, with positive anomalies at latitudes higher than 45° N. Overall, the combination of k=2 and k=5 negative anomalies leads to an almost vanishing but not negative total MHT (not shown). Note again that the strong MHT reduction is consistent with a general mid-latitude warming and cooling of the high latitudes, as reflected in the z500 increase at low and increase at high latitudes (Fig. 4b), and mid-latitude surface warming patterns (Fig. 8a). The role of k=2 waves in shaping the total transport is coherent with what mentioned above regarding the displacement of troughs and ridges, the former ones overstretched along continents at high latitudes, the latter ones confined towards the midlatitudes. The second order effect of the k=3 also has a signature in the circulation, as seen in particular for the z500 patterns of anomaly (Fig. 4b), with the strengthening of the western Pacific, European and east Asian ridges.
Despite the differences between Summer and Winter boreal seasons in the wavenumber-decomposed MHTs and the associated atmospheric circulation (cfr. Lembo et al., 2019, 2022), the scales of the transport related to spatially compounding extremely warm events, namely concurrent heatwaves, are similar (k=3, k=2, and to some extent k=5). These involve a sometimes negative (i.e. equatorward) transport, counteracting an overall positive transport at other scales. However, since the wavenumber-decomposed transports only provide hemispherically-aggregated information, we are not able to identify the regions where the transport is negative or positive for specific wavenumbers. The composite analysis provided in the previous section allows to discern the local thermodynamic factors characterizing concurrent heatwaves from those associated with planetary-scale waves through the action of large-scale atmospheric dynamics.
In particular, the analysis highlights that it is not only the decreasing intensity of the MHT associated with the planetary-scale wave, but also the phase of the k=3 wave in Summer that favors the emergence of hemispheric heatwaves. In fact, the westward displacement of ridges over continents and the northward tilting of the upstream jet at the same time favors unusual warming in the high latitude continental regions and prompts advection of heat southwards towards mid-latitudes on the continents’ eastern edge. As mentioned before, this is not surprising, especially in Summer, given the localized warming of continental regions due to diabatic heating, most notably in dry environments (Black et al., 2004; Bieli et al., 2015). Changes in frequencies of blockings over Eurasia, and more intense blockings over western North America support this argument, but also the previous analysis of dominant weather regimes (Lembo et al., 2022) suggests the recurrence of ridges over the Western North America, and co-occurring Scandinavian and Siberian blockings being recognized as defining features of MHT↓ occurrences, that under certain thermodynamic conditions favor the development of concurrent heatwaves. A case study analysis for a notable occurrence (the Northwestern Pacific heatwave in June–July 2021) is provided in the Supplement. The study highlights the role of the negative k=3 contribution in propagating the MHT anomaly southwards; we hypothesize that this propagation occurs downgradient along the Rossby wave spectrum towards higher wavenumbers, and we leave for future study to analyse in-depth how this portion of the spectrum evolves in time during the development of a concurrent heatwave.
In Winter, it is mostly the weakening of the MHT by the k=2 that prompts the enhanced zonality over Eurasia. However, this is a common feature of unconditioned MHT↓ (Fig. 1f, h; also compare dominant NAO+ and AO weather regimes in Lembo et al., 2022) and LST95 events. The climatological k=2 wave is typically associated with the thermal land-sea contrast, therefore it is not surprising that its phase its geographically locked. The intensification of the k=3 contribution is due to the strengthening of the eastern Pacific and Euro-Atlantic ridges, on one hand damping the warming over the western North America, on the other hand amplifying it over most of Europe. In other words, the combined occurrence of extremely weak MHTs and hemispheric LST warm extremes corresponds to a pattern of hemispheric-wide enhanced zonal circulation, associated with a vanishing heat exchange between low and high latitudes. Temperature anomalies suggest that zonal gradients between land and oceans are damped by this zonal circulation, and at the same time that meridional temperature gradients are to some extent amplified between the Poles and mid-latitudes.
In this work, we deliberately chose to avoid temporal aggregations, therefore we only considered concurrent LST extremes at the daily timescale. In fact, we did not aim here to distinguish the temporal scales at which hemispheric extremes occur from the background conditions that favor their propagation, turning localized extremes into “circum-global teleconnections”. However, while leaving for future study a focused investigation on different temporal aggregations of concurrent heatwaves and on how these reflect on combined occurrences with MHT extremes, we provide here a lagged analysis of combined weak MHT extremes and warm hemispheric LST extreme occurrences. Figure 9 shows counts of MHT extremes as a function of the lag from any LST event, separately for boreal Winter and Summer, for strong and weak MHT extremes. According to a hypothesis test based on a Monte Carlo resampling, for weak MHT extremes (Fig. 9a, c) most of the lags exceeding the significance level are located around lag 0. We also notice, though, that for DJF a few significant lags point towards MHT weak extremes lagging LST extremes by about 25 d. This qualitative analysis generally confirms that the coincident selection of weak MHT extremes and warm hemispheric LST extremes is justified. However, it is also interesting to look at strong MHT extremes (Fig. 9b, d), for which coincident occurrences are rarer than lagged occurrences, and with MHT extremes either leading warm LST occurrences in Summer (Fig. 9b) or lagging them in Winter, in both cases with a 12 d lag. In Summer, this finding is consistent with recent works, relating diabatic heating embedded in moisture transport through synoptic-scale baroclinic perturbations to the downstream development of blocking systems (Pfahl et al., 2015; Steinfeld and Pfahl, 2019; Hauser et al., 2024). We argued here (Sect. 3.2) that occurrences feature high-latitudinal blockings; it is possible that preceding strong MHT extremes are instrumental in advecting the heat favoring the development of such blockings. We leave for future study to investigate how weak and strong MHT extremes interact through ultra-long (k=2, 3) modes of atmospheric dynamics, favoring the development and propagation of heatwaves along the mid-latitudes.
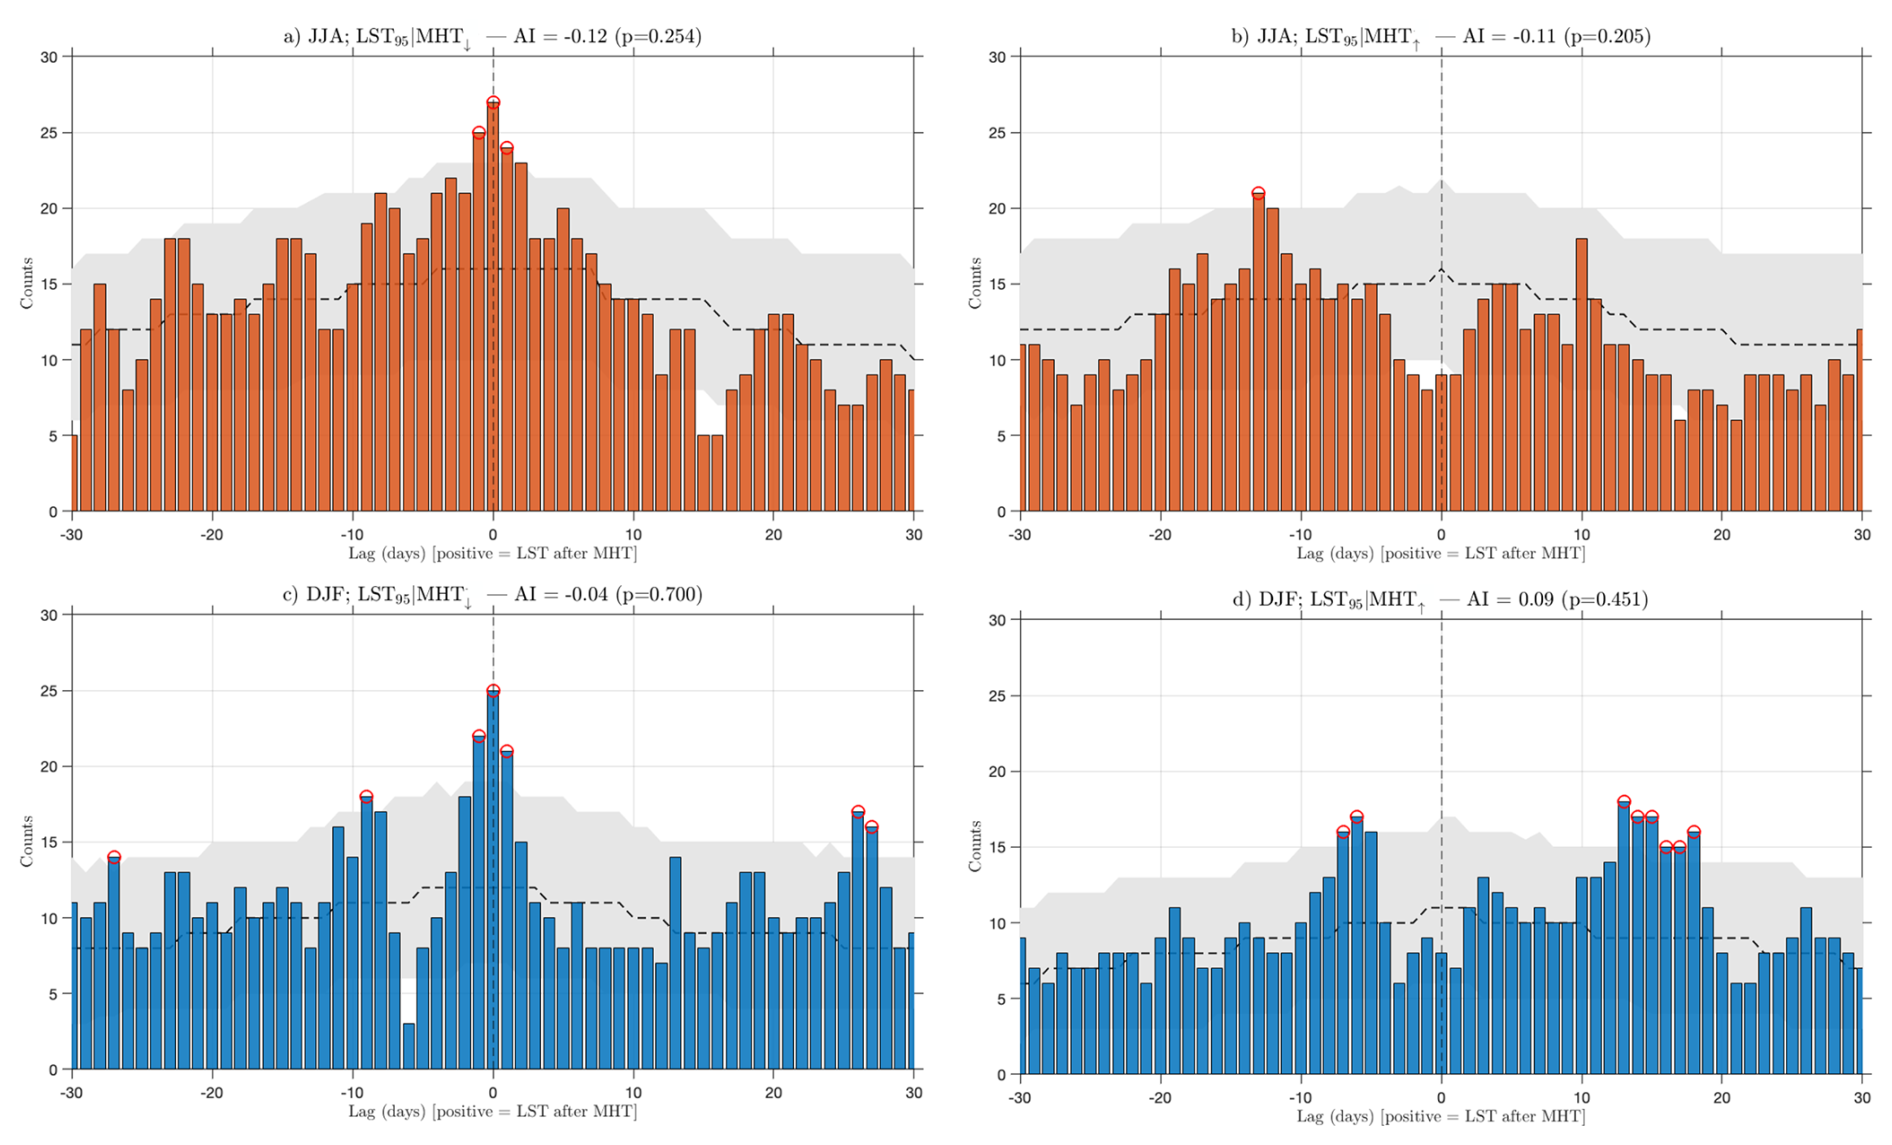
Figure 9Counts of days with hemispheric warm LST extremes as a function of lags (in days) with respect to extremely weak MHT days in (a) JJA and (c) DJF, and strong MHT in (b) JJA and (d) DJF. Positive lags mean that MHT extremes lead LST extremes, whereas the opposite holds for negative lags. A dashed thick line denotes the median of counts for random reshuffling with a 3000-iterations Monte Carlo method that preserves clustering and seasonality. The confidence interval at a 90 % significance level is provided in gray. Red markings denote lags for which the number of dots significantly exceed the confidence interval for random reshuffling. An asymmetry index is provided in the subtitle, retrieved as with N+ being the sum of all counts for each positive lag, N− the sum of all counts for each negative lag. A Monte Carlo two-sided p-value is also provided to denote the significant of the observed asymmetry index.
To our best knowledge, it is the first time hemispheric-scale warm anomalies in Winter are associated with thermodynamic features of the planetary-scale general circulation. Previous works have often linked warm spells in boreal Winter to an excessively zonal flow (Slonosky and Yiou, 2002; Holmberg et al., 2023) or wetter-than-normal conditions (Tuel and Martius, 2024), but a circumpolar extension of these arguments was still missing. Assuming that the Arctic amplification in the future will permanently reduce the meridional temperature gradient, we could hypothesize that this will result in a gradual shift of the k=2 role for MHT extremes from a DJF-like situation, in which enhanced zonal circulation will bring mild air towards the continents, towards a JJA-like situation, with advection of diabatically heated air from the oceans towards the western boundaries of the continents mediated by k=3 suppression or reversal, especially over the Pacific. In this respect, the examination of the notable January 2007 case study (outlined in the Supplement, Sect. S3) highlights that a focused examination of the tropical intrusions and atmospheric rivers toward the western sides of the continents will be crucial in order to disentangle the thermodynamic and dynamic contributions to the MHT extremes. On one hand, diabatic flow is known to be crucial for nonlinear Rossby waves amplification (cfr. Grams and Archambault, 2016). On the other hand, moist processes are fundamental for the development of upstream blocking systems, especially at high latitudes (Pfahl et al., 2015), not only in boreal Summer (Hauser et al., 2024). Heat and latent energy convergence between mid-latitudes and the polar regions is predicted to change significantly with global warming (e.g. Steinfeld and Pfahl, 2019), and therefore a mean state change in the meridional temperature gradient with implications for planetary-scale waves is expected. Understanding how this reverberates on transport and temperature extremes including hemispheric heatwaves is a challenging issue, that is left for a future study.
Finally, our results support previous findings on the typicality in the development of concurrent heatwaves, as highlighted for DJF European heatwaves by Galfi and Messori (2023) and for the 2021 NW Pacific heatwave by Lucarini et al. (2023). That is, that record-breaking events need not result from unprecedented physical drivers, and they can be “typical” with respect to other extremes of comparable intensity. We extend here these arguments about typical concurrent heatwaves to the dominant patterns of the hemispheric circulation.
We investigated the relationship between co-occurring heatwaves in the Northern Hemisphere mid-latitudes and meridional heat transport (MHT). We hereby summarize the main results:
-
Extremely weak (in some cases equatorward) MHT and extremely warm hemispheric LST are a more frequent occurrence than other combined occurrences, both in boreal Summer and Winter. The inter-seasonal aspect indicates fundamental physical properties: a weak meridional heat transport leaves more energy for heating in the mid latitudes;
-
The combined occurrence of extremely weak MHT and extremely warm hemispheric LSTs has a 11.0 % and 11.5 % relative frequency compared to all weak MHT extreme occurrences in boreal Summer and Winter, respectively. These events are associated with 42.3 % and 30.4 % of extremely warm hemispheric LST days, respectively;
-
The combined occurrence of extremely weak MHT and extremely warm hemispheric LSTs in boreal Summer is associated with the reversal of MHT contribution by wavenumber 3, that reverts the sign of the total MHT. An increasing frequency of western Eurasian blocking and intensity of Northwestern Pacific blocking, as well as an increasing intensity of the jet stream in the Pacific region is found to be associated with such occurrences.
-
The combined occurrence of extremely weak MHT and extremely warm hemispheric LSTs in boreal Winter is associated with the suppression of the MHT contribution by wavenumber 2. The phase of this wave in fact promotes an enhanced meridional geopotential height gradient, poleward shifted and intensified jet stream, anomalous shift of the low pressure activity towards Scandinavia in the European domain, and a downstream displacement of the jet stream elsewhere, facilitating an overall anomalously zonalised flow, increasing eastward advection of warm and moist air masses across the continents.
The pattern associated with the wavenumber 3 MHT reversal in boreal Summer has been recognized as a typical pattern related to simultaneous heatwave occurrence (Chapman et al., 2025), and it was also found to be related to the renowned record-breaking 2021 Northwestern Pacific heatwave. We argue that the zonality of the atmospheric circulation in boreal Winter, related to the extremely weak MHT, favors an unusual warming of continental regions through the advection of moist and mild oceanic air. Coherently, the blocking frequency at mostly all longitudes is decreased, and the jet stream peak is displaced downstream.
Overall, this work has shown that co-occurring heatwaves at hemispheric scale and the general circulation of the atmosphere under certain conditions can be related to each other by means of the strength of the heat exchanges between the Poles and the Tropics, carried out in the mid-latitudes through planetary-scale eddies. Such eddies are in this respect crucial, and we highlighted that wavenumbers 2 and 3 and their modulation are often instrumental in shaping the simultaneous occurrence of circulation patterns that favor the development of heatwaves at the regional scale. These findings suggest that a careful evaluation of anomalies in such planetary-scale waves may improve our capability to understand concurrent heatwaves, both in boreal Summer and Winter.
In principle, a statistical test could be performed at every grid point of a two dimensional field, applying a correction for the false discovery rate (Wilks, 2016). However, in cases involving a large number of simultaneous tests (approximately 130 000 in this study), such corrections result in a substantial loss of statistical power, i.e., the ability of the test to reject the null hypothesis when it is false. Since our primary goal is to identify regions of significant change without requiring fine spatial resolution, we aggregate grid boxes into clusters and perform a single statistical test for each cluster. This approach improves statistical power at the cost of spatial detail.
The clustering methodology can be summarized as follows:
-
grid points for which at least 66 % of the time steps within the LST|MHT events sample exceed or fall below the time-averaged observable for the corresponding grid point are selected;
-
a density-based methodology (Ester et al., 1996) is adopted to cluster neighboring grid points;
-
clusters that are within a radius of ϵ grid points from each other are grouped and considered as a single cluster;
-
only clusters exceeding a given size gmin (in grid points) are selected;
-
a spatial average is performed over each selected cluster or cluster group to obtain time series;
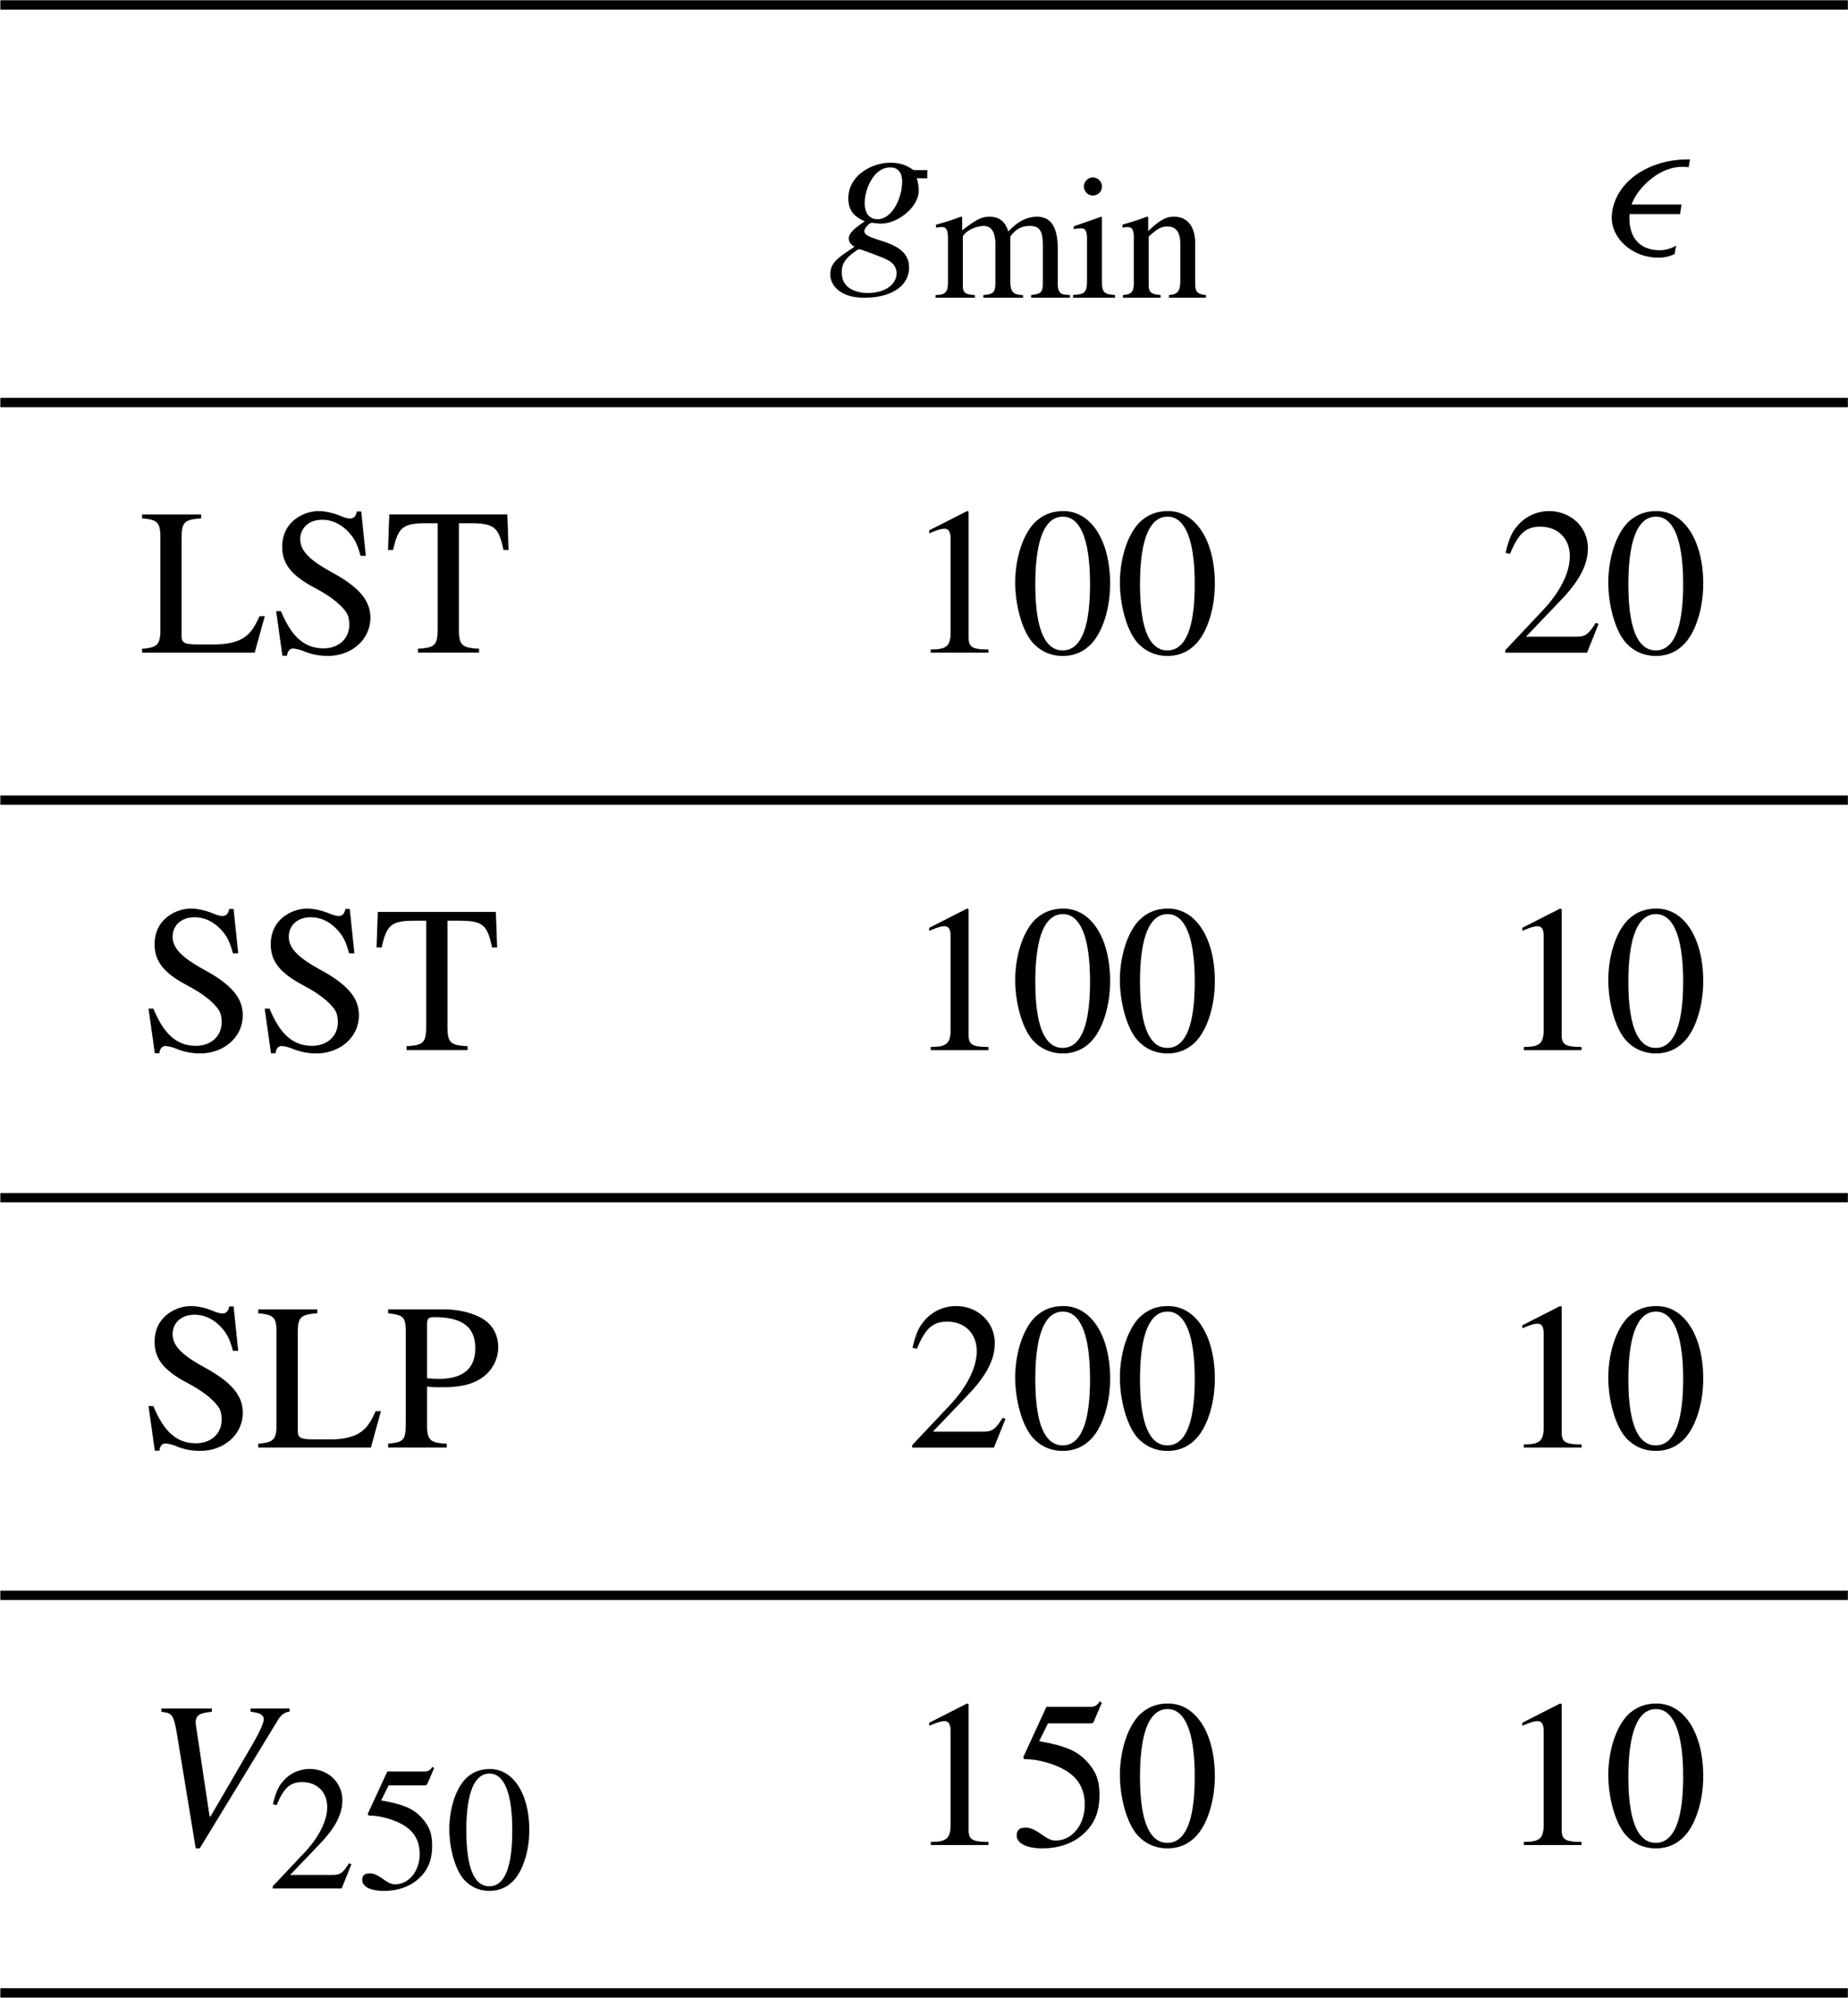
Parameters ϵ and gmin for each observable are given in Table A1. The choice of the parameters is motivated by the different underlying dynamics that we aim to highlight. For instance, surface temperatures are more prone to be affected by complex topography, orography and coastlines than V250, hence the smaller gmin and larger ϵ to preserve the spatial structure. Mean values of the time series derived from the LST|MHT and samples are compared using a two-sided Student’s t test at a α=0.05 significance level, applying Welch’s modification to account for unequal variances in the two samples. The null hypothesis is that the composite mean of the field in the LST|MHT sample is equal to that of , while the alternative hypothesis posits that the conditional occurrence of extreme MHT and hemispheric LST events significantly alters the value of the field. The case of V250 requires a different procedure: to assess changes in the jet stream, we consider possible differences in the sample 95th percentile of V250, which cannot be compared using a Student's t test. To address this, we rely on a non-parametric bootstrap test instead. For each cluster, N=5000 random samples of size n (n being equal to the number of time steps in the LST|MHT sample) are drawn from the full time series. For each bootstrap sample, the empirical 75th percentile is computed. Then, the 75th percentile of V250 in the LST|MHT sample is compared to the distribution of the N bootstrap replicates of the same quantity under the null hypothesis. If the LST|MHT value falls in either of the or tails of the distribution, we reject the null hypothesis, implying that MHT have a significant effect on V250 within the cluster.
Table A1Parameters for the density-based clustering algorithm.
Since the MHT extremes were selected using declustering (cfr. Lembo et al., 2022, and Sect. 2.2.3), no pre-whitening or other corrections are applied to address serial correlation. However, since the significance test is repeated for each cluster, and the number of clusters can be of the order of a few dozens, the Benjamini-Hochberg (BH) correction (Benjamini and Hochberg, 1995) with a 0.1 significance level is adopted to control the false discovery rate. This correction is appropriate under the assumption of independent or positively correlated tests, a condition generally satisfied by atmospheric data (Wilks, 2016).
Although a method that allows for generally dependent tests is available, known as Benjamini–Yekutieli correction (Benjamini and Yekutieli, 2001), the latter has been shown to drastically reduce the power of the test in the case of spatially extended climatological data, for which the BH version performs best (Cortés et al., 2020).
Figure B1 displays composite mean maps of extremely weak MHTs located in the 40–50° N band, similarly to Fig. 1 for the 50–60° N band.
In JJA, no significant anomalies emerge, although the spatial anomaly patterns broadly match those shown in Fig. 1a, c, e, g. Particularly, we notice negative LST anomalies over the southern coast of Alaska, and positive SLP anomalies across the northeastern portion of the Pacific ocean.
In DJF, there is a degree of overlap between significant regions highlighted in Fig. 1b, d, f, h and those shown in Fig. B1e–h. Positive LST anomalies span wide parts of Eastern Europe, China and central North America. SLP anomalies differ from Fig. 1f concerning the latitude of the highest SLP in oceanic ridges, with only the Canadian trough appearing to significantly differ from climatological variability, while the Scandinavian lobe of the circulation having less relevance. Besides that, a trough over eastern Asia appears to be significant, while it is not present in Fig. 1f.
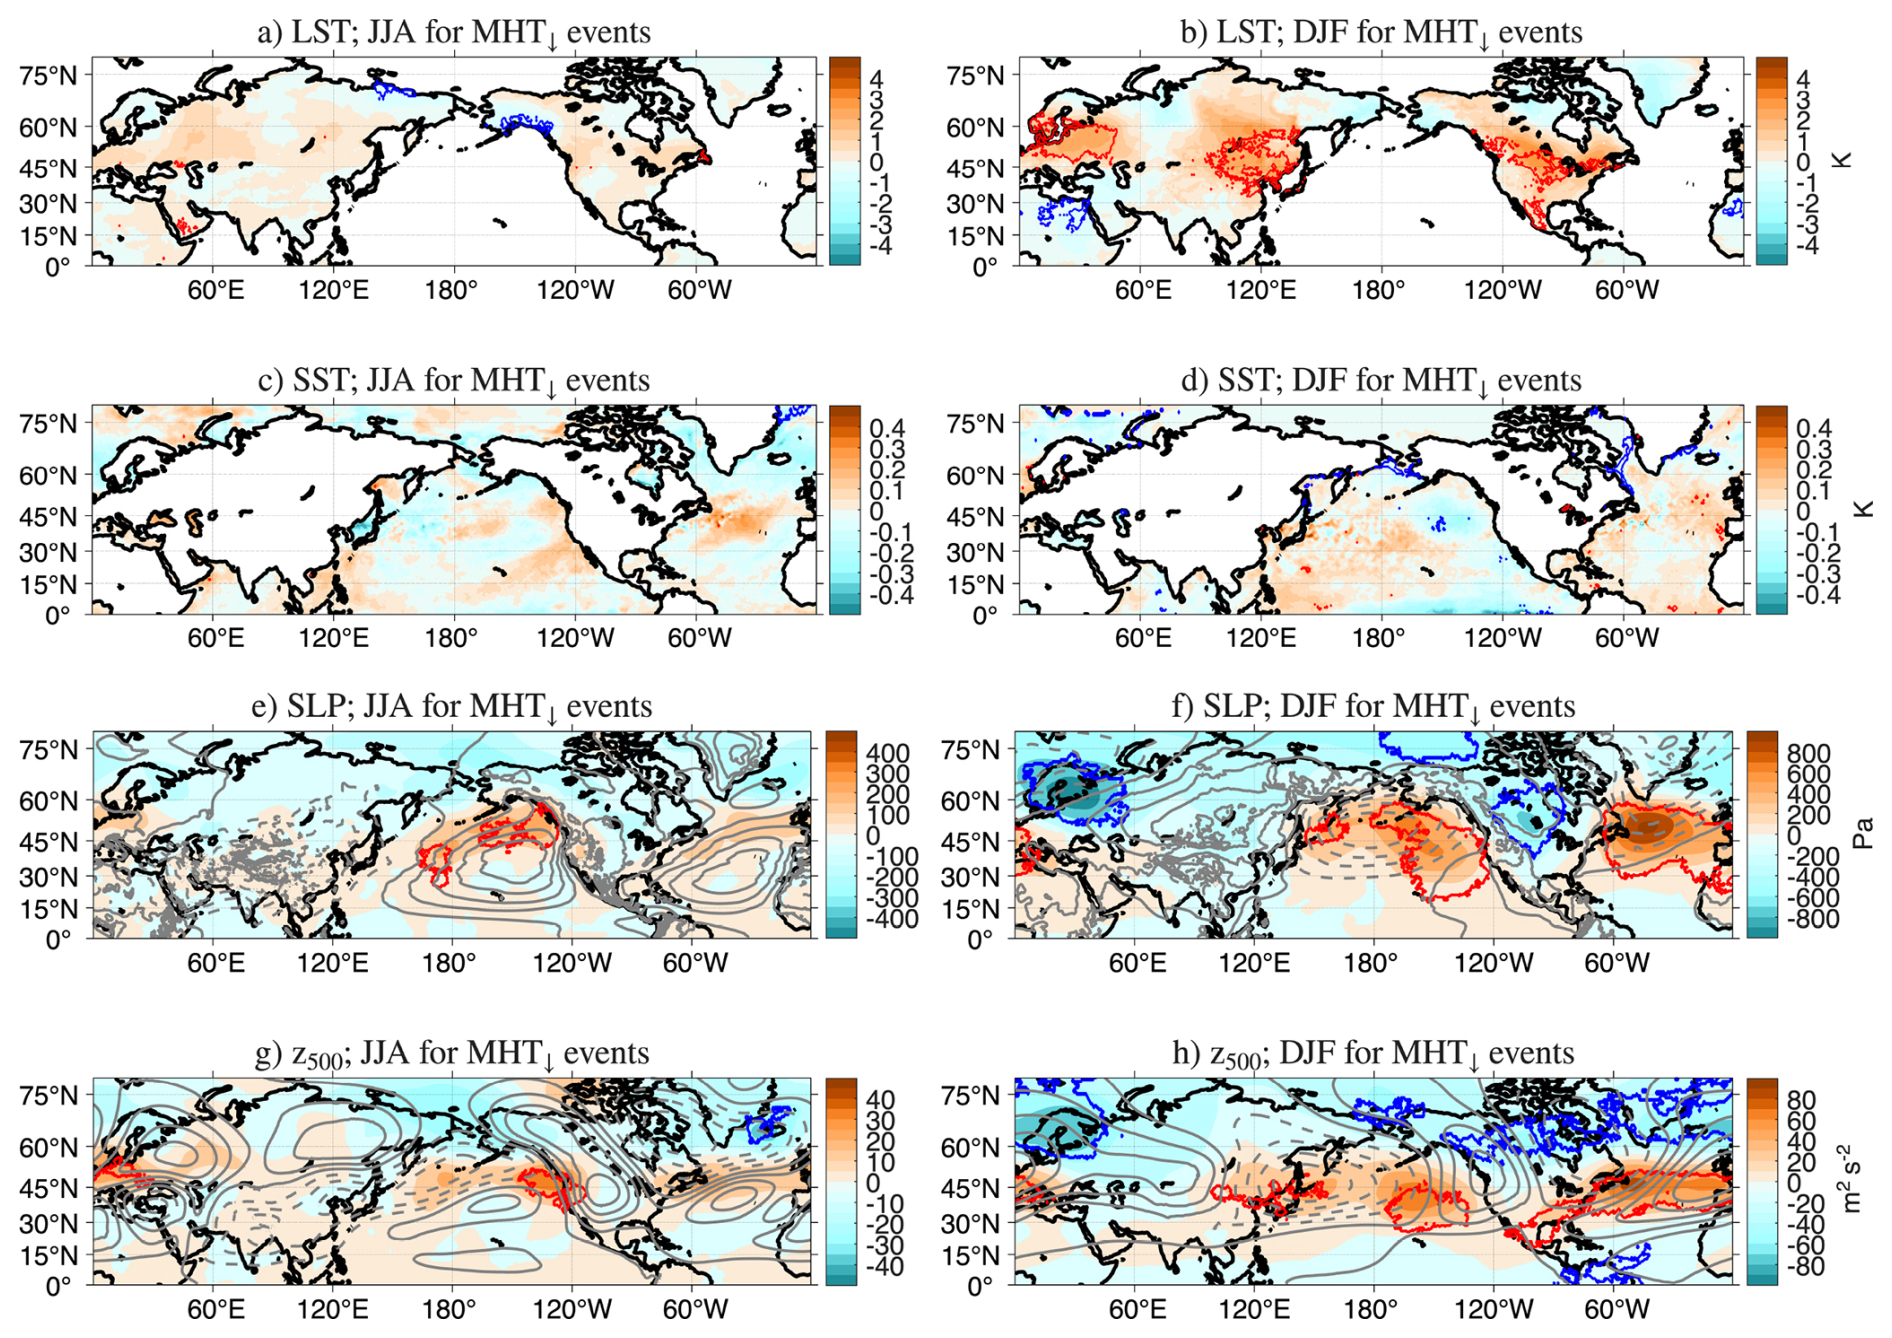
Figure B1Same as in Fig. 1, for extremely weak MHTs located in the 40–50° N latitudinal band.
ERA5 (Hersbach et al., 2020) was downloaded from the Copernicus Climate Change Service (2023). The results contain modified Copernicus Climate Change Service information 2020. Neither the European Commission nor ECMWF is responsible for any use that may be made of the Copernicus information or data it contains.
The supplement related to this article is available online at https://doi.org/10.5194/wcd-7-453-2026-supplement.
VL, GM and DF designed the analysis, VL carried out the main coding work and wrote most of the manuscript, VMG performed the extreme value detection and clustering, RGG performed the spectral decomposition, FEP designed the statistical significance tests and supervised the statistical analysis.
The contact author has declared that none of the authors has any competing interests.
Publisher's note: Copernicus Publications remains neutral with regard to jurisdictional claims made in the text, published maps, institutional affiliations, or any other geographical representation in this paper. The authors bear the ultimate responsibility for providing appropriate place names. Views expressed in the text are those of the authors and do not necessarily reflect the views of the publisher.
We thank two anonymous Reviewers, Aspen Morgan and Christian Grams for their input towards revising and improving the manuscript.
VL received funding from the Italian Ministry of Education, University and Research (MIUR) (project MEDHEX “Mediterranean Heat budget and EXtreme transports: From the heat budget to extreme events in the Mediterranean region”, CUP B53C24007120006), and from the European Union's Horizon Europe research and innovation programme (OptimESM, Grant No. 101081193). GM acknowledges support from from the Swedish Research Council Vetenskapsrådet (Grant no. 2022-06599) and from the European Union's H2020 research and innovation programme under the European Research Council (CENÆ, Grant no. 948309). Davide Faranda acknowledges support from COST (European Cooperation in Science and Technology) (COST Action FutureMed, CA22162), an INSU-CNRS-LEFE-MANU grant (project CROIRE), state aid managed by the National Research Agency under France 2030 (TRACCS-PC4-EXTENDING project bearing the reference ANR-22-EXTR-0005), and the European Union's Horizon 2020 research and innovation programme (XAIDA, Grant no. 101003469). High-performance computing and storage resources were provided by Sigma2 – the National Infrastructure for High Performance Computing and Data Storage in Norway through projects NS9063k and NN9348k.
This paper was edited by Christian Grams and reviewed by two anonymous referees.
Bartusek, S., Kornhuber, K., and Ting, M.: 2021 North American heatwave amplified by climate change-driven nonlinear interactions, Nat. Clim. Change, 12, 1143–1150, 2022. a
Benjamini, Y. and Hochberg, Y.: Controlling the false discovery rate: a practical and powerful approach to multiple testing, J. R. Stat. Soc. B, 57, 289–300, 1995. a
Benjamini, Y. and Yekutieli, D.: The control of the false discovery rate in multiple testing under dependency, Ann. Stat., 1165–1188, https://doi.org/10.1214/aos/1013699998, 2001. a
Bieli, M., Pfahl, S., and Wernli, H.: A Lagrangian investigation of hot and cold temperature extremes in Europe, Q. J. Roy. Meteor. Soc., 141, 98–108, https://doi.org/10.1002/qj.2339, 2015. a
Black, E., Blackburn, M., Harrison, G., Hoskins, B., and Methven, J.: Factors contributing to the summer 2003 European heatwave, Weather, 59, 217–223, https://doi.org/10.1256/wea.74.04, 2004. a
Chapman, C. C., Monselesan, D. P., Risbey, J. S., Hannachi, A., Lucarini, V., and Matear, R.: The Typicality of Regimes Associated with Northern Hemisphere Heatwaves, J. Climate, 38, 3729–3750, https://doi.org/10.1175/JCLI-D-24-0548.1, 2025. a, b, c
Chen, G., Lu, J., Burrows, D. A., and Leung, L. R.: Local finite-amplitude wave activity as an objective diagnostic of midlatitude extreme weather, Geophys. Res. Lett., 42, 10–952, 2015. a
Christidis, N., Jones, G. S., and Stott, P. A.: Dramatically increasing chance of extremely hot summers since the 2003 European heatwave, Nat. Clim. Change, 5, 46–50, 2015. a
Coles, S., Bawa, J., Trenner, L., and Dorazio, P.: An introduction to statistical modeling of extreme values, vol. 208, Springer, https://doi.org/10.1007/978-1-4471-3675-0, 2001. a, b
Cortés, J., Mahecha, M., Reichstein, M., and Brenning, A.: Accounting for multiple testing in the analysis of spatio-temporal environmental data, Environ. Ecol. Stat., 27, 293–318, 2020. a
Coughlan de Perez, E., Arrighi, J., and Marunye, J.: Challenging the universality of heatwave definitions: gridded temperature discrepancies across climate regions, Climatic Change, 176, 167, https://doi.org/10.1007/s10584-023-03641-x, 2023. a
Davini, P., Cagnazzo, C., Gualdi, S., and Navarra, A.: Bidimensional Diagnostics, Variability, and Trends of Northern Hemisphere Blocking, J. Climate, 25, 6496–6509, https://doi.org/10.1175/JCLI-D-12-00032.1, 2012. a, b, c, d
Dorrington, J. and Strommen, K. J.: Jet Speed Variability Obscures Euro-Atlantic Regime Structure, Geophys. Res. Lett., 47, e2020GL087907, https://doi.org/10.1029/2020GL087907, 2020. a
Dorrington, J., Strommen, K., and Fabiano, F.: Quantifying climate model representation of the wintertime Euro-Atlantic circulation using geopotential-jet regimes, Weather Clim. Dynam., 3, 505–533, https://doi.org/10.5194/wcd-3-505-2022, 2022. a
Duchon, C. E.: Lanczos Filtering in One and Two Dimensions, J. Appl. Meteorol. Clim., 18, 1016–1022, https://doi.org/10.1175/1520-0450(1979)018<1016:LFIOAT>2.0.CO;2, 1979. a
Ester, M., Kriegel, H.-P., Sander, J., and Xu, X.: A density-based algorithm for discovering clusters in large spatial databases with noise, in: Proceedings of the Second International Conference on Knowledge Discovery and Data Mining, KDD'96, AAAI Press, 226–231, https://api.semanticscholar.org/CorpusID:355163 (last access: 4 March 2026), 1996. a
Fabiano, F., Meccia, V. L., Davini, P., Ghinassi, P., and Corti, S.: A regime view of future atmospheric circulation changes in northern mid-latitudes, Weather Clim. Dynam., 2, 163–180, https://doi.org/10.5194/wcd-2-163-2021, 2021. a
Faranda, D., Messori, G., Alberti, T., Alvarez-Castro, C., Caby, T., Cavicchia, L., Coppola, E., Donner, R. V., Dubrulle, B., Galfi, V. M., Holmberg, E., Lembo, V., Noyelle, R., Yiou, P., Spagnolo, B., Valenti, D., Vaienti, S., and Wormell, C.: Statistical physics and dynamical systems perspectives on geophysical extreme events, Phys. Rev. E, 110, 041001, https://doi.org/10.1103/PhysRevE.110.041001, 2024. a, b
Ferro, C. A. and Segers, J.: Inference for clusters of extreme values, J. R. Stat. Soc. B, 65, 545–556, 2003. a
Folland, C. K., Knight, J., Linderholm, H. W., Fereday, D., Ineson, S., and Hurrell, J. W.: The Summer North Atlantic Oscillation: Past, Present, and Future, J. Climate, 22, 1082–1103, https://doi.org/10.1175/2008JCLI2459.1, 2009. a
Galfi, V. M. and Messori, G.: Persistent anomalies of the North Atlantic jet stream and associated surface extremes over Europe, Environ. Res. Lett., 18, 024017, https://doi.org/10.1088/1748-9326/acaedf, 2023. a
Galfi, V. M., Bódai, T., and Lucarini, V.: Convergence of Extreme Value Statistics in a Two-Layer Quasi-Geostrophic Atmospheric Model, Complexity, 2017, 5340858, https://doi.org/10.1155/2017/5340858, 2017. a
Gaupp, F., Hall, J., Hochrainer-Stigler, S., and Dadson, S.: Changing risks of simultaneous global breadbasket failure, Nat. Clim. Change, 10, 54–57, 2020. a
Gilleland, E. and Katz, R. W.: extRemes 2.0: An Extreme Value Analysis Package in R, J. Stat. Softw., 72, 1–39, https://doi.org/10.18637/jss.v072.i08, 2016. a
Grams, C. M. and Archambault, H. M.: The key role of diabatic outflow in amplifying the midlatitude flow: A representative case study of weather systems surrounding western North Pacific extratropical transition, Mon. Weather Rev., 144, 3847–3869, 2016. a
Graversen, R. G. and Burtu, M.: Arctic amplification enhanced by latent energy transport of atmospheric planetary waves, Q. J. Roy. Meteor. Soc., 142, 2046–2054, https://doi.org/10.1002/qj.2802, 2016. a, b
Hauser, S., Teubler, F., Riemer, M., Knippertz, P., and Grams, C. M.: Life cycle dynamics of Greenland blocking from a potential vorticity perspective, Weather Clim. Dynam., 5, 633–658, https://doi.org/10.5194/wcd-5-633-2024, 2024. a, b
Heffernan, J. E.: ismev: An Introduction to Statistical Modeling of Extreme Values, r package version 1.43, CRAN [code], https://CRAN.R-project.org/package=ismev (last access: 15 March 2021), 2025. a
Hersbach, H., Bell, B., Berrisford, P., Hirahara, S., Horányi, A., Muñoz-Sabater, J., Nicolas, J., Peubey, C., Radu, R., Schepers, D., Simmons, A., Soci, C., Abdalla, S., Abellan, X., Balsamo, G., Bechtold, P., Biavati, G., Bidlot, J., Bonavita, M., De Chiara, G., Dahlgren, P., Dee, D., Diamantakis, M., Dragani, R., Flemming, J., Forbes, R., Fuentes, M., Geer, A., Haimberger, L., Healy, S., Hogan, R. J., Hólm, E., Janisková, M., Keeley, S., Laloyaux, P., Lopez, P., Lupu, C., Radnoti, G., de Rosnay, P., Rozum, I., Vamborg, F., Villaume, S., and Thépaut, J. N.: The ERA5 global reanalysis, Q. J. Roy. Meteor. Soc., 146, 1999–2049, https://doi.org/10.1002/qj.3803, 2020. a, b
Holmberg, E., Messori, G., Caballero, R., and Faranda, D.: The link between European warm-temperature extremes and atmospheric persistence, Earth Syst. Dynam., 14, 737–765, https://doi.org/10.5194/esd-14-737-2023, 2023. a
Huang, C. S. Y. and Nakamura, N.: Local Finite-Amplitude Wave Activity as a Diagnostic of Anomalous Weather Events, J. Atmos. Sci., 73, 211–229, https://doi.org/10.1175/JAS-D-15-0194.1, 2016. a
Kornhuber, K., Petoukhov, V., Petri, S., Rahmstorf, S., and Coumou, D.: Evidence for wave resonance as a key mechanism for generating high-amplitude quasi-stationary waves in boreal summer, Clim. Dynam., 49, 1961–1979, 2017. a, b
Kornhuber, K., Coumou, D., Vogel, E., Lesk, C., Donges, J. F., Lehmann, J., and Horton, R. M.: Amplified Rossby waves enhance risk of concurrent heatwaves in major breadbasket regions, Nat. Clim. Change, 10, 48–53, 2020. a, b, c, d
Krüger, J., Kjellsson, J., Kedzierski, R. P., and Claus, M.: Connecting North Atlantic SST variability to European heat events over the past decades, Tellus A, 75, 358–374, 2023. a
Kumar, V., Yoden, S., and Hitchman, M. H.: QBO and ENSO Effects on the Mean Meridional Circulation, Polar Vortex, Subtropical Westerly Jets, and Wave Patterns During Boreal Winter, J. Geophys. Res.-Atmos., 127, e2022JD036691, https://doi.org/10.1029/2022JD036691, 2022. a
Lembo, V., Messori, G., Graversen, R. G., and Lucarini, V.: Spectral Decomposition and Extremes of Atmospheric Meridional Energy Transport in the Northern Hemisphere Midlatitudes, Geophys. Res. Lett., 46, 2019GL082105, https://doi.org/10.1029/2019GL082105, 2019. a, b, c, d, e, f, g, h
Lembo, V., Fabiano, F., Galfi, V. M., Graversen, R. G., Lucarini, V., and Messori, G.: Meridional-energy-transport extremes and the general circulation of Northern Hemisphere mid-latitudes: dominant weather regimes and preferred zonal wavenumbers, Weather Clim. Dynam., 3, 1037–1062, https://doi.org/10.5194/wcd-3-1037-2022, 2022. a, b, c, d, e, f, g, h, i, j, k, l, m, n, o
Lembo, V., Bordoni, S., Bevacqua, E., Domeisen, D. I. V., Franzke, C. L. E., Galfi, V. M., Garfinkel, C. I., Grams, C. M., Hochman, A., Jha, R., Kornhuber, K., Kwasniok, F., Lucarini, V., Messori, G., Pappert, D., Perez-Fernandez, I., Riboldi, J., Russo, E., Shaw, T. A., Strigunova, I., Strnad, F., Yiou, P., and Zagar, N.: Dynamics, Statistics, and Predictability of Rossby Waves, Heat Waves, and Spatially Compounding Extreme Events, B. Am. Meteorol. Soc., 105, E2283–E2293, https://doi.org/10.1175/BAMS-D-24-0145.1, 2024. a
Liang, M., Czaja, A., Graversen, R., and Tailleux, R.: Poleward energy transport: is the standard definition physically relevant at all time scales?, Clim. Dynam., 50, 1785–1797, 2018. a
Lucarini, V., Melinda Galfi, V., Riboldi, J., and Messori, G.: Typicality of the 2021 Western North America summer heatwave, Environ. Res. Lett., 18, 015004, https://doi.org/10.1088/1748-9326/acab77, 2023. a
Messori, G. and Czaja, A.: On the sporadic nature of meridional heat transport by transient eddies, Q. J. Roy. Meteor. Soc., 139, 999–1008, 2013. a
Messori, G. and Czaja, A.: Some considerations on the spectral features of meridional heat transport by transient eddies, Q. J. Roy. Meteor. Soc., 140, 1377–1386, 2014. a
Messori, G. and Czaja, A.: On local and zonal pulses of atmospheric heat transport in reanalysis data, Q. J. Roy. Meteor. Soc., 141, 2376–2389, 2015. a
Messori, G., Geen, R., and Czaja, A.: On the Spatial and Temporal Variability of Atmospheric Heat Transport in a Hierarchy of Models, J. Atmos. Sci., 74, 2163–2189, https://doi.org/10.1175/JAS-D-16-0360.1, 2017. a, b
Messori, G., Segalini, A., and Ramos, A. M.: Climatology and trends of concurrent temperature extremes in the global extratropics, Earth Syst. Dynam., 15, 1207–1225, https://doi.org/10.5194/esd-15-1207-2024, 2024. a
Mills, E.: Insurance in a Climate of Change, Science, 309, 1040–1044, https://doi.org/10.1126/science.1112121, 2005. a
Osborne, J. M., Collins, M., Screen, J. A., Thomson, S. I., and Dunstone, N.: The North Atlantic as a Driver of Summer Atmospheric Circulation, J. Climate, 33, 7335–7351, https://doi.org/10.1175/JCLI-D-19-0423.1, 2020. a
Parker, T., Woollings, T., Weisheimer, A., O'Reilly, C., Baker, L., and Shaffrey, L.: Seasonal Predictability of the Winter North Atlantic Oscillation From a Jet Stream Perspective, Geophys. Res. Lett., 46, 10159–10167, https://doi.org/10.1029/2019GL084402, 2019. a
Petoukhov, V., Rahmstorf, S., Petri, S., and Schellnhuber, H. J.: Quasiresonant amplification of planetary waves and recent Northern Hemisphere weather extremes, P. Natl. Acad. Sci. USA, 110, 5336–5341, https://doi.org/10.1073/pnas.1222000110, 2013. a, b, c
Pfahl, S., Schwierz, C., Croci-Maspoli, M., Grams, C. M., and Wernli, H.: Importance of latent heat release in ascending air streams for atmospheric blocking, Nat. Geosci., 8, 610–614, 2015. a, b
Pickands III, J.: Statistical Inference Using Extreme Order Statistics, Ann. Stat., 3, 119–131, https://doi.org/10.1214/aos/1176343003, 1975. a
Radinović, D. and Ćurić, M.: Criteria for heat and cold wave duration indexes, Theor. Appl. Climatol., 107, 505–510, https://doi.org/10.1007/s00704-011-0495-8, 2012. a
Röthlisberger, M. and Papritz, L.: Quantifying the physical processes leading to atmospheric hot extremes at a global scale, Nat. Geosci., 16, 210–216, 2023. a, b
Röthlisberger, M., Martius, O., and Wernli, H.: An algorithm for identifying the initiation of synoptic-scale Rossby waves on potential vorticity waveguides, Q. J. Roy. Meteor. Soc., 142, 889–900, https://doi.org/10.1002/qj.2690, 2016a. a
Röthlisberger, M., Pfahl, S., and Martius, O.: Regional-scale jet waviness modulates the occurrence of midlatitude weather extremes, Geophys. Res. Lett., 43, 10989–10997, https://doi.org/10.1002/2016GL070944, 2016b. a
Röthlisberger, M., Frossard, L., Bosart, L. F., Keyser, D., and Martius, O.: Recurrent Synoptic-Scale Rossby Wave Patterns and Their Effect on the Persistence of Cold and Hot Spells, J. Climate, 32, 3207–3226, https://doi.org/10.1175/JCLI-D-18-0664.1, 2019. a
Schaller, N., Sillmann, J., Anstey, J., Fischer, E. M., Grams, C. M., and Russo, S.: Influence of blocking on Northern European and Western Russian heatwaves in large climate model ensembles, Environ. Res. Letters, 13, 054015, https://doi.org/10.1088/1748-9326/aaba55, 2018. a
Scherrer, S. C., Croci-Maspoli, M., Schwierz, C., and Appenzeller, C.: Two-dimensional indices of atmospheric blocking and their statistical relationship with winter climate patterns in the Euro-Atlantic region, Int. J. Climatol., 26, 233–250, 2006. a
Segalini, A., Riboldi, J., Wirth, V., and Messori, G.: A linear assessment of barotropic Rossby wave propagation in different background flow configurations, Weather Clim. Dynam., 5, 997–1012, https://doi.org/10.5194/wcd-5-997-2024, 2024. a
Slonosky, V. and Yiou, P.: Does the NAO index represent zonal flow? The influence of the NAO on North Atlantic surface temperature, Clim. Dynam., 19, 17–30, 2002. a
Solomon, S.: Climate change 2007-the physical science basis: Working group I contribution to the fourth assessment report of the IPCC, vol. 4, Cambridge University Press, ISBN 978 0521 88009-1, 2007. a
Spensberger, C., Madonna, E., Boettcher, M., Grams, C. M., Papritz, L., Quinting, J. F., Röthlisberger, M., Sprenger, M., and Zschenderlein, P.: Dynamics of concurrent and sequential Central European and Scandinavian heatwaves, Q. J. Roy. Meteor. Soc., 146, 2998–3013, 2020. a
Steinfeld, D. and Pfahl, S.: The role of latent heating in atmospheric blocking dynamics: a global climatology, Clim. Dynam., 53, 6159–6180, 2019. a, b
Strigunova, I., Blender, R., Lunkeit, F., and Žagar, N.: Signatures of Eurasian heat waves in global Rossby wave spectra, Weather Clim. Dynam., 3, 1399–1414, https://doi.org/10.5194/wcd-3-1399-2022, 2022. a
Swanson, K. L. and Pierrehumbert, R. T.: Lower-tropospheric heat transport in the Pacific storm track, J. Atmos. Sci., 54, 1533–1543, 1997. a
Thomson, S. I. and Vallis, G. K.: Atmospheric Response to SST Anomalies. Part II: Background-State Dependence, Teleconnections, and Local Effects in Summer, J. Atmos. Sci., 75, 4125–4138, https://doi.org/10.1175/JAS-D-17-0298.1, 2018. a
Tibaldi, S. and Molteni, F.: On the operational predictability of blocking, Tellus A, 42, 343–365, https://doi.org/10.1034/j.1600-0870.1990.t01-2-00003.x, 1990. a
Tigchelaar, M., Battisti, D. S., Naylor, R. L., and Ray, D. K.: Future warming increases probability of globally synchronized maize production shocks, P. Natl. Acad. Sci. USA, 115, 6644–6649, https://doi.org/10.1073/pnas.1718031115, 2018. a
Tuel, A. and Martius, O.: Persistent warm and cold spells in the Northern Hemisphere extratropics: regionalisation, synoptic-scale dynamics and temperature budget, Weather Clim. Dynam., 5, 263–292, https://doi.org/10.5194/wcd-5-263-2024, 2024. a, b
Van Loon, S. and Thompson, D. W. J.: Comparing Local Versus Hemispheric Perspectives of Extreme Heat Events, Geophys. Res. Lett., 50, e2023GL105246, https://doi.org/10.1029/2023GL105246, 2023. a
Vogel, M. M., Zscheischler, J., Wartenburger, R., Dee, D., and Seneviratne, S. I.: Concurrent 2018 Hot Extremes Across Northern Hemisphere Due to Human-Induced Climate Change, Earth's Future, 7, 692–703, https://doi.org/10.1029/2019EF001189, 2019. a, b
Watanabe, M., Kimoto, M., Nitta, T., and Kachi, M.: A Comparison of Decadal Climate Oscillations in the North Atlantic Detected in Observations and a Coupled GCM, J. Climate, 12, 2920–2940, https://doi.org/10.1175/1520-0442(1999)012<2920:ACODCO>2.0.CO;2, 1999. a
White, R. H., Kornhuber, K., Martius, O., and Wirth, V.: From Atmospheric Waves to Heatwaves: A Waveguide Perspective for Understanding and Predicting Concurrent, Persistent, and Extreme Extratropical Weather, B. Am. Meteorol. Soc., 103, E923–E935, https://doi.org/10.1175/BAMS-D-21-0170.1, 2022. a
White, R. H., Anderson, S., Booth, J. F., Braich, G., Draeger, C., Fei, C., Harley, C. D. G., Henderson, S. B., Jakob, M., Lau, C.-A., Mareshet Admasu, L., Narinesingh, V., Rodell, C., Roocroft, E., Weinberger, K. R., and West, G.: The unprecedented Pacific Northwest heatwave of June 2021, Nat. Commun., 14, 727, https://doi.org/10.1038/s41467-023-36289-3, 2023. a
Wiedenmann, J. M., Lupo, A. R., Mokhov, I. I., and Tikhonova, E. A.: The climatology of blocking anticyclones for the Northern and Southern Hemispheres: Block intensity as a diagnostic, J. Climate, 15, 3459–3473, 2002. a, b, c
Wilks, D. S.: The stippling shows statistically significant grid points: How research results are routinely overstated and overinterpreted, and what to do about it, B. Am. Meteorol. Soc., 97, 2263–2273, 2016. a, b
Wirth, V.: Waveguidability of idealized midlatitude jets and the limitations of ray tracing theory, Weather Clim. Dynam., 1, 111–125, https://doi.org/10.5194/wcd-1-111-2020, 2020. a
Wirth, V. and Polster, C.: The Problem of Diagnosing Jet Waveguidability in the Presence of Large-Amplitude Eddies, J. Atmos. Sci., 78, 3137–3151, https://doi.org/10.1175/JAS-D-20-0292.1, 2021. a, b
Wirth, V., Riemer, M., Chang, E. K. M., and Martius, O.: Rossby Wave Packets on the Midlatitude Waveguide – A Review, Mon. Weather Rev., 146, 1965– 2001, https://doi.org/10.1175/MWR-D-16-0483.1, 2018. a
Woollings, T., Barriopedro, D., Methven, J., Son, S.-W., Martius, O., Harvey, B., Sillmann, J., Lupo, A. R., and Seneviratne, S.: Blocking and its response to climate change, Current Climate Change Reports, 4, 287–300, 2018. a
Yu, B., Lin, H., Mo, R., and Li, G.: A physical analysis of summertime North American heatwaves, Clim. Dynam., 61, 1551–1565, 2023. a
Yu, H., Cheng, S., Huang, J., Hu, Z., Wu, H., and Wang, X.: Seasonal phase change of the North Atlantic Tripole Sea surface temperature predicted by air-sea coupling, npj Climate and Atmospheric Science, 7, 322, https://doi.org/10.1038/s41612-024-00882-0, 2024. a
- Abstract
- Introduction
- Data and Methods
- Results
- Discussion
- Summary and Conclusions
- Appendix A: Statistical tests for the significance of composite mean anomalies
- Appendix B: Composite mean anomalies related to extremely weak MHT in the 40–50° N latitudinal band
- Data availability
- Author contributions
- Competing interests
- Disclaimer
- Acknowledgements
- Financial support
- Review statement
- References
- Supplement