the Creative Commons Attribution 4.0 License.
the Creative Commons Attribution 4.0 License.
 | 16 Apr 2026
A combined storyline-statistical approach for conditional extreme event attribution
Alexander Lemburg
Andreas H. Fink
Joaquim G. Pinto
Frauke Feser
Quantifying the influence of anthropogenic global warming on extreme events requires both physical and statistical understanding. We present a framework combining two complementary conditional attribution methods: spectrally nudged storylines and flow-analogues. Applied to the 2018 Central European heatwave, storylines project an area-mean intensification of 1.7 °C per degree of global warming. Despite no detected changes in terms of atmospheric blocking by the flow-analogue approach, the combined framework further indicates that heatwaves under similar atmospheric conditions, and exceeding the storyline-projected intensities, may become more frequent and extreme at their corresponding warming levels than the factual 2018 event was under present conditions. Our study shows that the 2018 heatwave, with an intensity of 2.2 °C and a return period of 1-in-277 years today, becomes a 6.6 °C event with a 1-in-26 year probability in a +4 K world in the absence of other dynamical trends. This behavior reveals the importance of other physical mechanisms and interactions beyond the atmospheric circulation pattern and thermodynamic conditions influencing the occurrence and intensification of heatwaves. We conclude that this combined framework is promising for climate change attribution of individual extreme events, offering both a physical assessment of anthropogenic warming and its associated likelihood while accounting for potential shifts in atmospheric dynamics.
- Article
(5200 KB) - Full-text XML
-
Supplement
(4366 KB) - BibTeX
- EndNote


The number of heat-related extreme weather and climate events has increased in recent decades (IPCC, 2021). This is particularly the case for heatwaves, whose intensity, frequency, and length have increased in many parts of the world (IPCC, 2021; Barriopedro et al., 2023; Rousi et al., 2023; Russo et al., 2015). Heatwaves – periods of high temperature over multiple consecutive days – pose a severe threat to ecosystems, agriculture, other economic activities, and human health (Zuo et al., 2015). In the mid-latitudes, the development of heatwaves is typically associated with the occurrence of atmospheric blocking (Kautz et al., 2022). The question arises as to how far these observed changes are related to human activity. Indeed, extreme event attribution to human-induced (anthropogenic) global warming (Trenberth et al., 2015; Otto, 2023) is crucial for informing and motivating policies aimed at mitigating climate change. The main idea of extreme weather attribution is to identify the role of external forcings on the change of occurrence and characteristics of the event under study (Hegerl et al., 2010). Many attribution studies clearly state that human activities are affecting the frequency and intensity of extreme events (e.g., Eyring et al., 2021; Seneviratne et al., 2021; León-FonFay et al., 2024). However, the confidence of such a statement depends on the type of event. Temperature-related extremes, such as heatwaves, are strongly linked to long-term warming trends and offer higher attribution confidence due to the clear human footprint (National Academies of Sciences, Engineering, and Medicine, 2016). In contrast, events like windstorms shaped by complex dynamical processes – particularly when associated with modification of the large-scale atmospheric circulation – imply greater challenges for attribution, due to higher internal variability and a lower signal-to-noise ratio (Shepherd, 2014), where conditional attribution methodologies play an important role in understanding the event under similar atmospheric dynamics (van Garderen and León-FonFay, 2026).
Shepherd (2016) divides attribution methods into “storyline-based” and “risk-based” approaches. The former consists of examining a plausible physical unfolding of a specific event of study in an alternative thermodynamic background (either cooler or warmer conditions) compared to the observed one. The latter consists of identifying the change in the probability of occurrence of an event of a certain magnitude in samples representing a factual (observed) world, a counterfactual (no global warming), or future warmer conditions. From the storyline approach, one usually addresses questions like, “How would this specific event change in the absence of, or under an intensified, global warming?”, while the risk-based approach aims to reply: “How likely is this type of event now compared to a counterfactual past or possible futures?”. Because each approach captures different aspects of human influence, multi-method attribution is necessary for a comprehensive assessment (Thompson et al., 2026; Barriopedro et al., 2025). Other studies have aimed to merge these approaches by deriving storylines from flow-analogue reconstruction and parallelly applying unconditional risk-based attribution (World Weather Attribution-style, Philip et al., 2020) (e.g., Qian et al., 2023; Ye et al., 2025), considering classes of similar extreme events, but not a specific historic extreme event. In this article, we present a combined attribution approach conditioned on the atmospheric circulation of a specific, high-impact extreme event, focusing on the thermodynamical aspect of anthropogenic global warming. For the storyline approach, we use spectrally nudged storylines (van Garderen et al., 2021), which are highly conditioned to the specific large-scale pattern that shapes an extreme event. For the statistical approach, we use the flow-analogue method (e.g., Zorita and Von Storch, 1999; Yiou et al., 2017) which allows to identify a subset of events conditioned on similar circulation patterns such that the dynamical uncertainty is also reduced, focusing on the thermodynamic aspects. In that way, one can extend the key research question to: To what extent has human influence altered both the magnitude and the likelihood of an extreme event beyond natural variability, and how might this event evolve under future warming scenarios? (Trenberth et al., 2015). This framework represents a first step towards a conditional physical-statistical extreme event attribution.
The Spectrally Nudged Storylines approach (van Garderen et al., 2021) isolates the thermodynamic influence of global warming on specific extreme events, while minimizing uncertainties related to dynamical variability (Shepherd, 2014; Trenberth et al., 2015; Feser and Shepherd, 2025). This methodology simulates different storylines of the same event by constraining large-scale atmospheric circulation to resemble observed dynamical conditions (spectral nudging) (von Storch et al., 2000), under the assumption that such circulation patterns could also occur in different climates. The thermodynamic conditions are then modified to represent the event under counterfactual, factual, and future global warming levels (Shepherd et al., 2018; van Garderen et al., 2021). This allows the role of anthropogenic global warming to be attributed independently of dynamical variability, which is often a source of uncertainty in climate model simulations (Shepherd, 2014). While the method successfully evaluates changes in the characteristics of individual events (e.g., intensity, spatial distribution, and duration) under different warming scenarios (e.g., Feser et al., 2024; Sánchez-Benítez et al., 2022; Klimiuk et al., 2025), it may not account for events that remain dynamically consistent with a warmer climate, in which the background atmospheric circulation may shift (Thompson et al., 2026). This raises a fundamental question within this combined framework: How likely is this weather situation, and how plausible are the projected storylines under warmer climate conditions?
The flow-analogue method (Zorita and Von Storch, 1999; Vautard et al., 2016; Yiou et al., 2017) seeks to disentangle the dynamics from thermodynamics and attribute their contribution to an extreme event, but using a probabilistic approach. Instead of isolating a specific event, it identifies similar large-scale circulation patterns to the one of the extreme event to be analyzed across a large ensemble of simulations, assessing thus how such a class of events changes in present and alternative climates (e.g., Jézéquel et al., 2018; Vautard et al., 2016). For instance, Yiou et al. (2008) applied the flow-analogue method to study extreme temperature and precipitation events in Europe, demonstrating how changes in weather regimes could influence the occurrence of such extremes under climate change scenarios. Similarly, this approach has been used to examine the dynamics of European heatwaves, highlighting shifts in circulation patterns that contribute to their increased frequency (Jézéquel et al., 2018). In our case, we use it to identify dynamical changes by quantifying shifts in the frequency of good analogues with global warming, and to assess the probability of comparable events. While this method is less suited to attributing the precise influence of anthropogenic warming on a single event, it provides robust estimates of the likelihood of similar events occurring under varying climate conditions, important for risk assessments (Trenberth et al., 2015).
When combined, these two methods provide complementary insights into extreme event attribution and projection. The storyline approach offers a physically detailed narrative of how a specific event evolves under alternative levels of global warming, but is limited in its ability to assess probabilities due to the small number of simulated events (Feser and Shepherd, 2025). Conversely, the flow-analogue method, based on large ensembles, offers probabilistic estimates of risk while lacking the event-specific physical detail of the storyline approach. By conditioning both methods on the observed circulation pattern, this framework enhances causal inference by isolating the thermodynamic influence of anthropogenic warming while quantifying changes in the likelihood of dynamically comparable events. Together, they enable both a physical understanding of event intensification and a probabilistic assessment of how its likelihood changes with global warming for a given dynamical system.
We illustrate this framework using the July 2018 Central European heatwave, one of the strongest European heatwaves on record in terms of magnitude, spatial extent, and legacy effects (Rousi et al., 2023; Knutzen et al., 2025; Xoplaki et al., 2025). The event was marked by persistent atmospheric blocking over Scandinavia and Central Europe, exceptionally high sea surface temperatures, and low soil moisture in Spring, which contributed to sustained heat and drought conditions across large parts of Europe (Lhotka and Kyselỳ, 2022; Yiou et al., 2020; Rousi et al., 2023; Knutzen et al., 2025). The heatwave was exceptional in the sense of its long duration, prolonged drought, and prevalence (Rousi et al., 2023; Sagen, 2020). In Germany, summer temperatures set meteorological records as it was the hottest one over the Northern and Eastern part and the driest one in the middle of Germany at the time (Imbery et al., 2018; Rousi et al., 2023). Overall, the 2018 summer was very hot and dry, more than 2.5 °C warmer than average in many regions, leading to severe agricultural and ecological impacts in the following years, including widespread drought-induced tree mortality in Central Europe (Schuldt et al., 2020; Knutzen et al., 2025).
In this study, we apply both the storyline and flow-analogue methods to this event to evaluate the potential of a combined attribution framework (schematic in Fig. 1). Using spectrally nudged storylines, we (1) quantify the thermodynamic response of the 2018 heatwave to anthropogenic global warming under alternative climate conditions. In parallel, we apply the flow-analogue method to the MPI-ESM-LR Grand Ensemble (50 members) (Olonscheck et al., 2023) to (2) diagnose dynamical shifts by assessing changes in the frequency of good circulation analogues and to estimate the likelihood of heatwaves comparable to the observed one with global warming. Finally, we integrate these methods to (3) estimate the likelihood of storyline-projected intensities developing under analogue atmospheric circulation patterns in future warming levels. In this way, this framework aims to complement the individual strengths of each method by jointly addressing thermodynamic event intensification and circulation-dependent probability changes with global warming. A description of each dataset and method used can be found in Sects. 2 and 3. In the Results Sect. 4, we show an application of the methodology to the attribution of the influence of global warming on heatwave intensity.
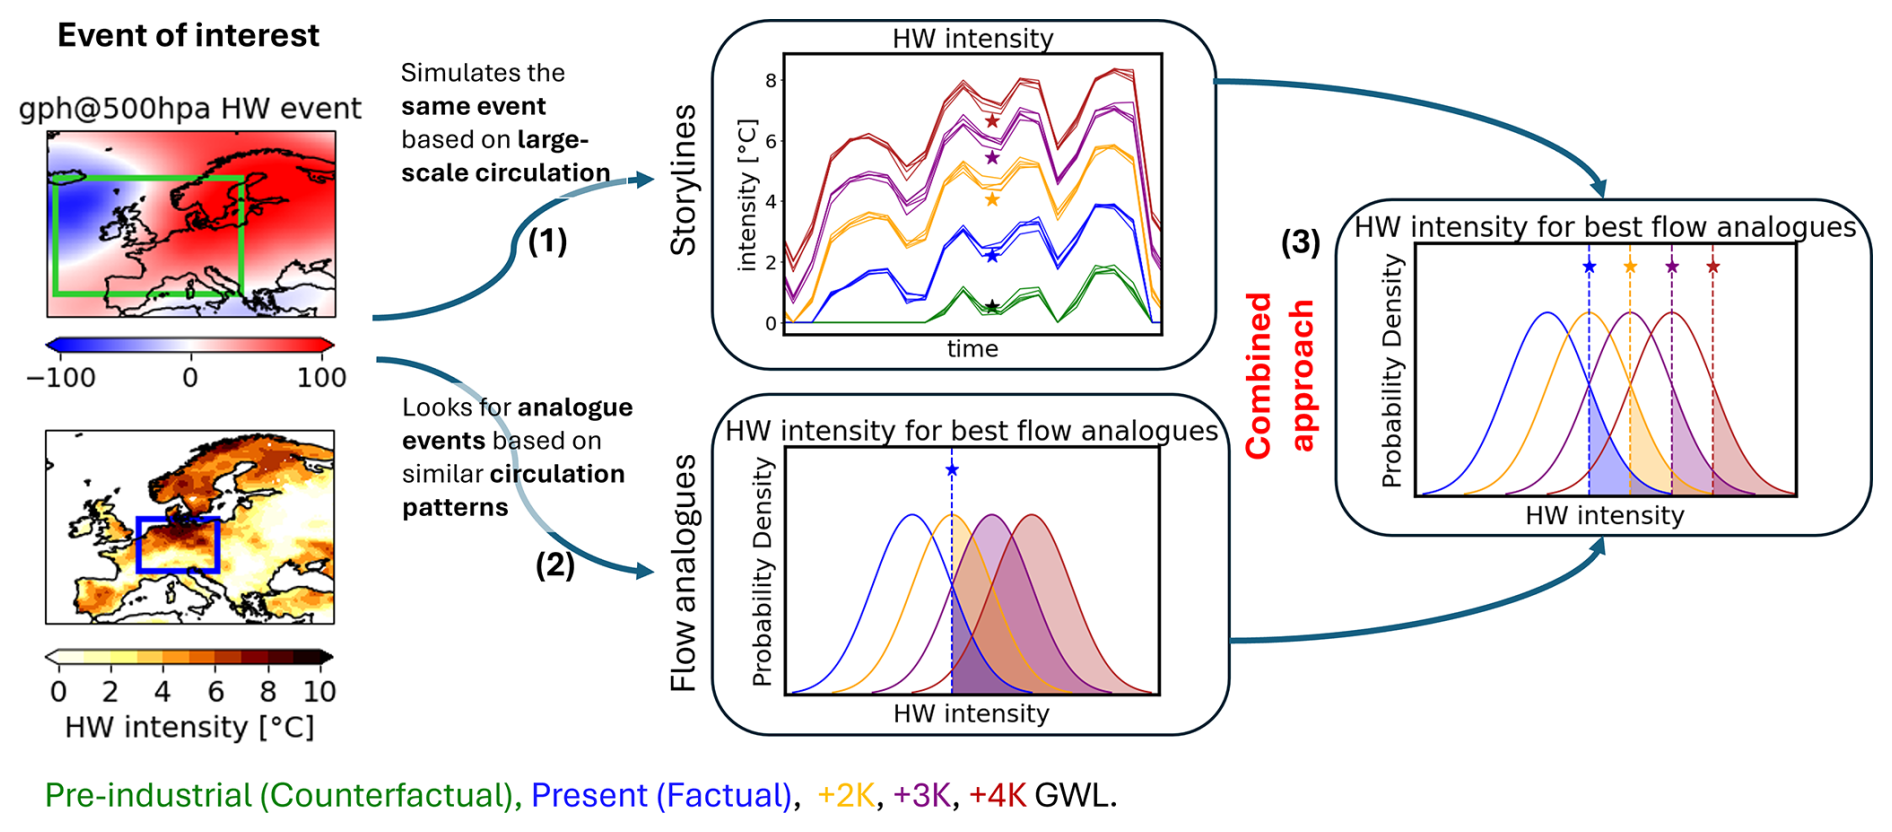
Figure 1Framework schematic: Given an extreme event of interest, the spectrally nudged storyline (1) and flow-analogue (2) approaches are applied in parallel. The storyline approach generates physically consistent versions of the event to assess changes in its magnitude due to global warming. The stars represent the mean intensity of the event across storylines. The flow-analogue method constructs probability distributions of heatwave mean intensity associated with circulation analogues, capturing both changes in the frequency of the flow pattern and the likelihood of similar events occurring at future warming levels. The combined application (3) involves taking the projected magnitudes from the storyline approach and evaluating their probability of occurrence using the distributions derived from the flow-analogue method. This allows for an assessment of how likely the projected event magnitudes are under their corresponding level of global warming.
2.1 ERA5
As a reference dataset, we use ERA5 (Hersbach et al., 2020), the latest generation of a global reanalysis product provided by the European Centre for Medium-Range Weather Forecasts (ECMWF). This dataset provides a gridded best possible estimate of the state of the atmosphere by combining short forecasts from ECMWF's Integrated Forecasting System (IFS) Cycle 41r2 and the so-called 4D-Var data assimilation scheme fed by numerous observations. For characterizing the observed 2018 heatwave in terms of near-surface temperature as well as the large-scale atmospheric flow, we used 2 m maximum temperature as well as 500 hPa geopotential at a daily temporal resolution on a spatial grid of 0.25° × 0.25° from the ERA5 post-processed daily statistics on single levels dataset (Hersbach et al., 2023).
2.2 Global spectrally nudged storylines
In this study, we first use a storyline approach to estimate the impact of climate change on the July 2018 event. The dataset consists of 5 storylines, namely:
-
Counterfactual: a world without the influence of anthropogenic global warming, corresponding to pre-industrial times (1850–1920).
-
Factual: the world under the present level of global warming (2015–2025).
-
+2, +3, +4 K: the world under +X K degrees of global warming with respect to pre-industrial times (1850–1920).
Each storyline represents a physically consistent, plausible scenario in which the event could have developed under an alternative thermodynamic background while holding the circulation fixed. The storylines were simulated as described in detail in van Garderen et al. (2021) using the atmospheric general circulation model ECHAM6.0 – atmospheric component of the MPI-ESM model – (Stevens et al., 2013; Giorgetta et al., 2013) (T255, 95 levels), which integrates the land vegetation model JSBACH for land processes. The spectral nudging of vorticity and divergence (nudged for wave numbers n<38, >750 hPa) towards NCEP-NCAR reanalysis (Kalnay et al., 1996; Kistler et al., 2001) ensures that the large-scale weather pattern stays close to the observed one in all storylines. The storylines then mostly differ in their thermodynamics, diminishing the influence of internal variability. To impose different levels of global warming for each storyline, sea surface temperatures (SSTs) and greenhouse gases (GHGs) are prescribed according to the desired level of global warming (since these variables are influenced by anthropogenic forcing with a high level of certainty, Eyring et al., 2021; van Garderen et al., 2021). As a result, all 5 storylines listed above are available for the same period, running from 2015 to the present day under different warming conditions. This means that each storyline contains the historical events occurring globally during this time period (at least those reproducible at this resolution). Each storyline has 5 members, such that the spin-up simulations for each member per storyline were started at different dates, in consecutive weeks, to account for model and initial condition uncertainty. We use the long-term simulation (ECHAM_SN) also spectrally nudged towards NCEP reanalysis data (Schubert-Frisius et al., 2017) as a climatological period (1985–2014) consistent with our simulations.
Finally, the chosen model setup nudges the model to reproduce the observed evolution of the synoptic-scale flow (e.g, atmospheric ridges, troughs, and blockings), being able to react to imposed thermodynamic changes and allowing changes to realistic local weather events.
2.3 MPI-ESM-LR Grand Ensemble
For the statistical analysis, we use transient simulations from the MPI-ESM-LR Grand Ensemble (50 members) (Olonscheck et al., 2023) climate model under the SSP5-8.5 emission pathway and historical run. The grand ensemble is simulated using the Max Planck Institute Earth System Model version 1.2 (MPI-ESM1.2), in the low resolution (LR) setup (T63, 1.8° atmosphere; GR15, 1.5° ocean) (Mauritsen et al., 2019). Due to the availability of 50 ensemble members at a sub-daily resolution, the model provides a sample size large enough to work with flow-analogues and extreme events.
The dataset for each degree of global warming is defined as the 20 years centered around the year where the 20 year running average of global mean temperature surpasses the desired temperature anomaly above pre-industrial times (1850–1920). For example, if +2 K is reached in 2033, the period 2023–2043 is taken. This is done for each ensemble member, such that, in total, each global warming level has 1000 years (20 years × 50 members) of data.
3.1 Attribution using Spectrally Nudged Storylines
As described Sect. 2.2, the spectrally nudged storylines reproduce a specific event of interest under different warming levels, in our case, the July 2018 heatwave. Since the only differences between them are given by the background thermodynamic conditions induced by anthropogenic global warming, all differences between them can be directly attributed to human-induced global warming. More specifically, all changes between the present (factual) or future (+2, +3, +4 K) storylines with respect to the counterfactual storyline address: What is the influence of anthropogenic global warming on the extreme event of study? This approach thus exploits communication of the consequences of global warming through historical events that are linked to personal experience (Feser and Shepherd, 2025).
3.2 Flow-analogues
To characterize the large-scale circulation pattern associated with the 2018 heatwave over Central Europe (24 July–10 August), we use ERA5 geopotential height (GPH) anomalies at 500 hPa (with respect to the 1985–2014 mean climatology). A 5 d sequence (31 July–4 August) preceding the heatwave peak is extracted from ERA5 as the reference pattern (see Figs. S1–S2 in the Supplement). Analogous circulation patterns are identified at different global warming levels from the MPI-ESM-LR Grand Ensemble under SSP5-8.5. For each member and warming level, GPH anomalies are computed relative to the 1985–2014 mean climatology, linearly detrended within the warming level period, and restricted to summer months (June–August). Following Vautard et al. (2016) recommendations to take an appropriate region for the flow-analogues, the reference flow pattern used is taken over an extended region (20° W, 20° E, 40, 65° N) surrounding the region of the event of interest (Central Europe: 3, 18° E, 44, 55° N). The region is large enough to capture either the synoptic-scale ridge and trough pattern or blocking anticyclones, which are mainly responsible for heatwave formation. On the other hand, it is not too large to ensure that the analogues are representative of Central European heatwave conditions. We further decided not to center the box around the Central European focus region, but to shift it by some degrees westward, as the important synoptic-scale features and high gradients in the geopotential field tend to be located further upstream (see Sect. S1.2 in the Supplement).
Analogue candidates are selected based on the smallest Euclidean distance calculated from every possible 5 d sequence within the MPI-ESM data that matches the reference 5 d flow pattern. To avoid using shifted time windows of the same flow-analogues, the N closest matches are taken with a minimum 15 d separation between events. From the N closest matches, only those with a spatial correlation greater than 0.8 compared to the time-averaged reference pattern are retained (See Fig. S4 for correlation matrices between analogues and ERA5). Conceptually, our approach asks: given this sequence and mean structure of the large-scale circulation, what is the spectrum of heatwaves that can occur?.
The analogue selection process is applied to subsets of the MPI-ESM-LR Grand Ensemble, grouped by global warming level (counterfactual, factual, +2, +3, +4 K), where each subset consists of 20 year time slices per ensemble member. With 50 ensemble members, a total of 1000 years of data is available per warming level, providing a large and robust sample for analogue selection. An analysis of the analogue detection performance and quality is provided in Figs. S3–S6.
3.3 Heatwave definition
We define a heatwave as an event in which the daily maximum temperature (TX) exceeds the climatology's 95th percentile (TX95) of the given calendar day for more than three consecutive days. The 95th percentile threshold is computed for each calendar day using a 15 d centered moving window over the 1985–2014 climatological period. This definition holds for both field-averaged and local analyses.
The heatwave intensity is defined as the temperature anomaly exceeding the 95th percentile of the climatology during the heatwave days (n) (Barriopedro et al., 2023).
3.4 Return periods
To attribute the likelihood of the event occurring under present and alternative warming levels, we calculate the return periods of the July 2018 heatwave using subsets of analogue events identified under different warming levels with the flow-analogue approach (Sect. 3.2). The return period represents the inverse probability of an event surpassing a specific magnitude (return level). In our study, we are interested in the probability that a heatwave of magnitude M co-occurs with the circulation pattern of interest (flow-analogues) in the dataset representing a given global warming level.
To calculate this probability, we use the conditional probability definition , where E is the heatwave of interest of magnitude M, and D is the circulation pattern related to the event. Each term provides valuable information in our assessment:
-
P(D): Is the probability that we find an analogue of the circulation pattern (D) in the dataset. Example: D= “blocking over Scandinavia”. If the blocking occurs 25 % of the years, then P(D)=0.25.
-
P(E|D): Is the probability of finding the event of interest (E), given that the circulation pattern D is present. Example: E= “Heatwave in Germany of magnitude M”. When blocking occurs (analogues), 10 % of them surpass the event’s E magnitude, then . This is the probability that a heatwave exceeds the magnitude M within the flow-analogues subset.
-
P(E,D): Represents the total fraction in the dataset on which both the circulation pattern and the extreme event co-occur. Ex: . Following this example, there is a 2.5 % probability that Germany experiences a heatwave and a blocking simultaneously that resemble the conditions we are interested in for this specific global warming level. For simplicity, we refer to this probability as PM,GWL.
Finally, to better represent return values within a 95 % confidence interval, the distribution of temperatures related to the flow-analogues are fitted using a generalized extreme value distribution and performing 1000 samples with bootstrap-resampling. Even though the analogues dataset is large enough for deriving empirical return periods, the generalized extreme value distribution provides a smooth interpolation and confidence intervals. The adequacy of the fit is supported by the agreement between empirical and fitted return levels (Fig. 7), indicating a good representation of the upper tail with no systematic deviations.
4.1 Storyline attribution of the influence of anthropogenic global warming on the 2018 heatwave.
We analyse the features of the 2018 heatwave over Central Europe (blue box in Fig. 2b: [3, 18° E, 44, 55° N]) focusing on the core period of 24 July to 10 August (Fig. 2). The flow-pattern for the entire event can be found in Fig. S7. In agreement with the literature, this event is characterized by persistent atmospheric blocking, strong geopotential height (GPH) anomalies, and thus an enduring disruption of the westerly zonal flow over Scandinavia and Northern Germany (Lhotka and Kyselỳ, 2022; Rousi et al., 2023) (Fig. 2a). These are the regions where the heatwave peaked in July, leading to high temperature anomalies compared to mean climatological values (Fig. 2b). Averaged over the heatwave duration, these anomalies reached up to 10 °C in Germany and up to 8 °C in some regions in Scandinavia. The time series in Fig. 2c corresponds to the field-averaged maximum near-surface temperatures over Central Europe (blue box) per storyline, which shows an increase in temperature and duration of the heatwave with global warming. The corresponding ERA5 temperatures for the region (black solid line) coincide with the factual storyline, showing an accurate representation of the observed event. The climatological period (1985–2014) was also simulated with spectral nudging as in the factual storyline for consistency. We limit most of our analysis to this region for two main reasons: the first one being to perform a regional study focused on Germany due to its large local impacts, and the other reason is methodological rather than impact-based; the use of a smaller region allows for a better chance to find close analogues of high quality over an extended region (green box in Fig. 2a) that captures the large-scale circulation pattern behind the heatwave event (Jézéquel et al., 2018).
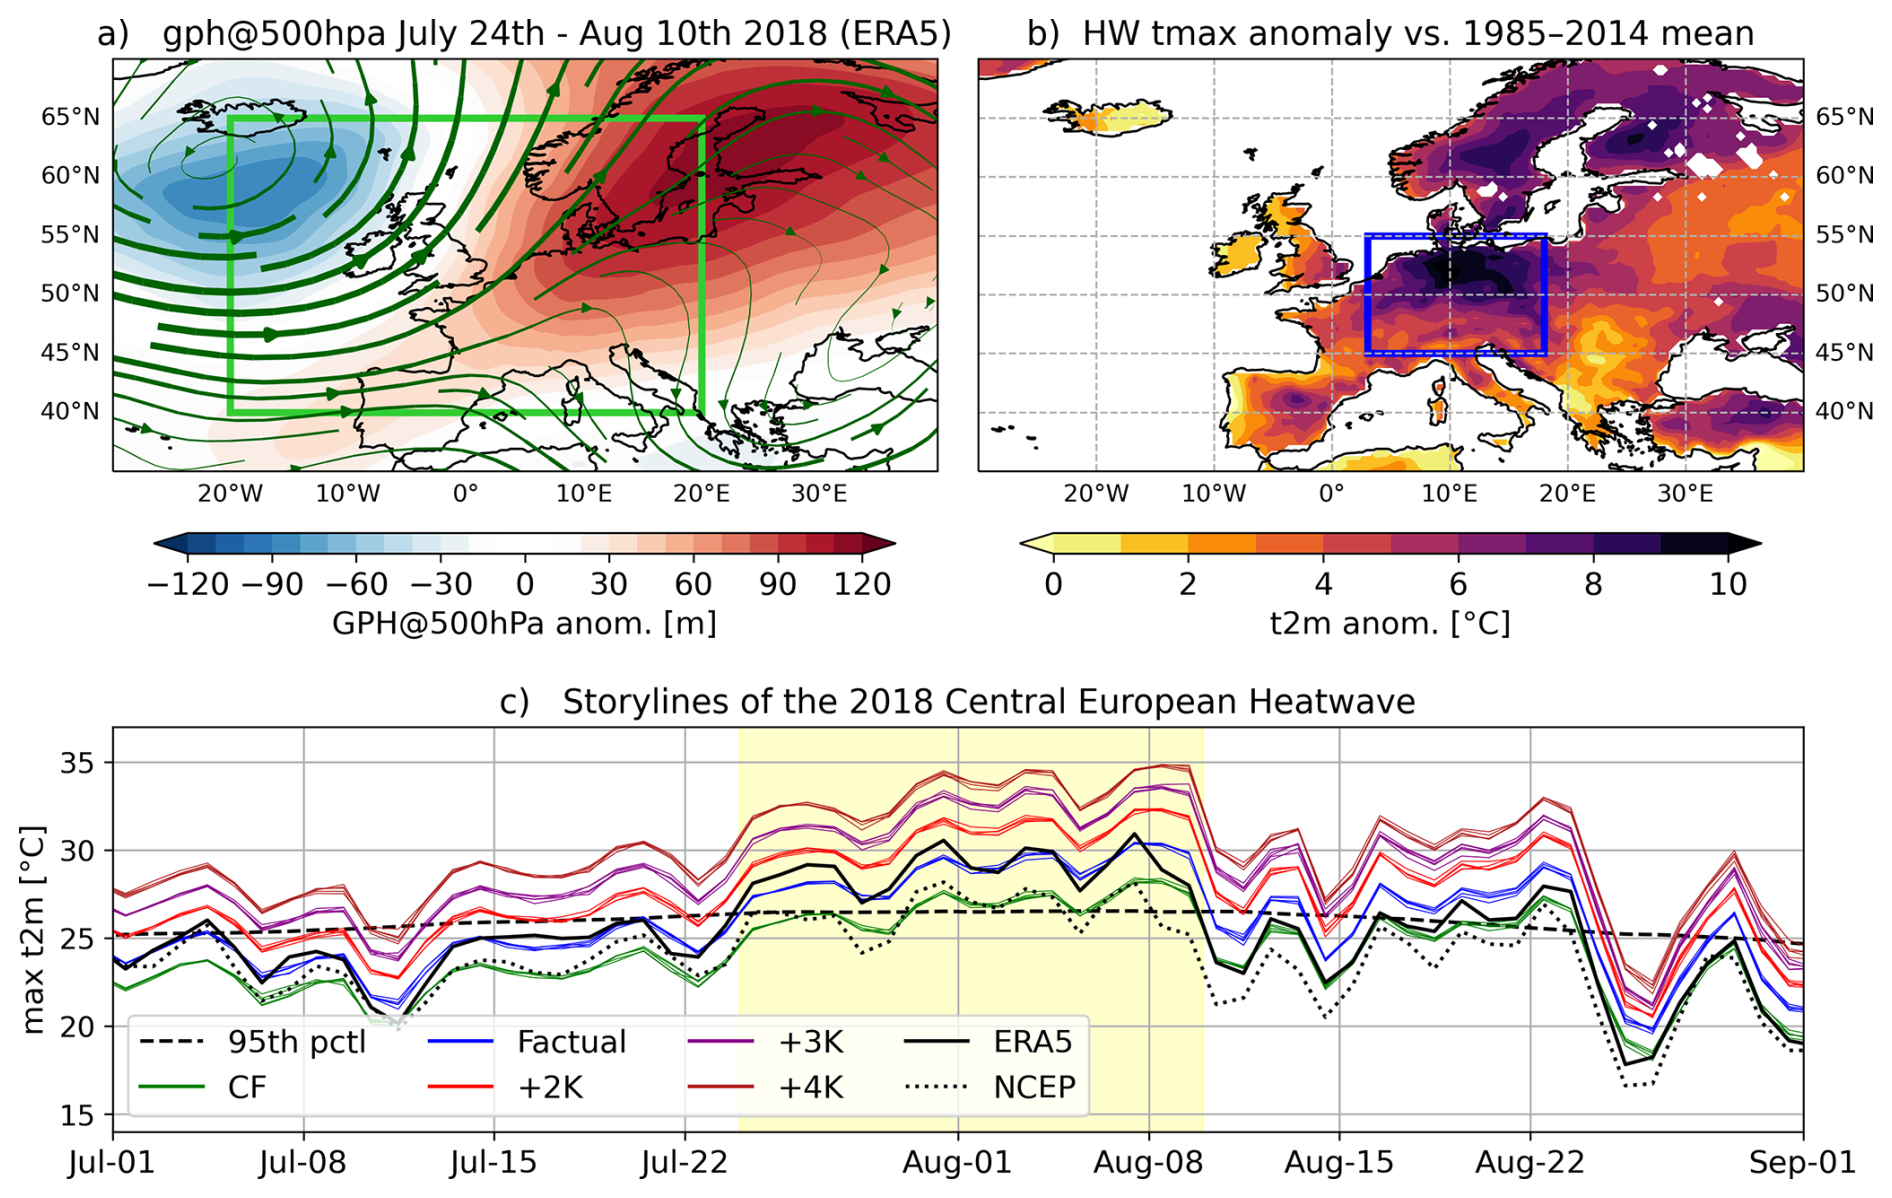
Figure 2The 2018 Central European heatwave: (a) Mean geopotential height anomaly (gph@500 hPa) and streamlines based on 500 hPa mean wind components during the event of interest (24 July–10 August). The green box encloses the region (20° W, 20° E, 40, 65° N) used for flow-analogue detection. (b) Maximum near-surface temperature anomaly with respect to mean climatology during the heatwave event. The blue box encloses the region of interest (Central Europe: 3, 18° E, 44, 55° N). (c) Daily maximum temperature time series spatially averaged over Central Europe for each storyline (CF: counterfactual, factual, +2, +3, +4 K), counting on 5 members each (thin lines). The dashed line corresponds to the 95th percentile of the 1985–2014 climatology. The black solid line corresponds to ERA5 data for comparison to the factual world. The yellow shaded region encloses the length of the event in the factual world (24 July–10 August).
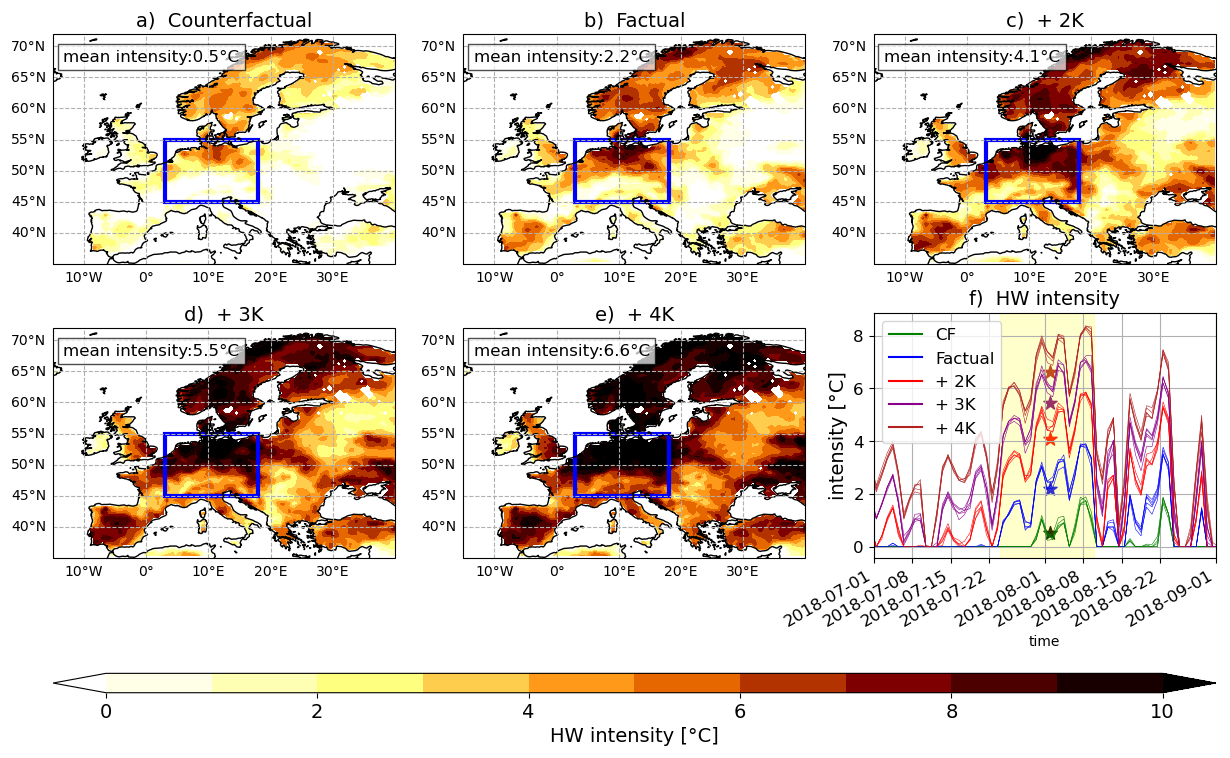
Figure 3Heatwave intensity: (a)–(e) Local maximum heatwave intensity during the heatwave event for each storyline. (f) Time series of daily heatwave intensity over the region of interest (Central Europe) enclosed in blue boxes. The stars in the time series plot are the heatwave mean intensity per storyline (magnitudes shown in the upper left corner of the maps).
Even though the heatwave was particularly extreme over Central Europe and Scandinavia, it also affected other regions in Europe with less intensity. In Fig. 3b, it can be seen how in a factual world, the highest heatwave intensities occurred in Northern Germany. Here we define intensity as the exceedance (in °C) of the local 95th percentile of the climatological (factual 1985–2014) daily maximum temperature (see Sect. 3.3). Local maximum intensities of around +9 °C (Fig. 3b), and a mean intensity of 2.2 °C (Fig. 3f) were reached over the region of interest during the days of the observed (factual) event. In the absence of anthropogenic global warming, the counterfactual storyline also shows the presence of a heatwave over a less extended region (Fig. 3a) and period of time (Fig. 3f). This counterfactual event would have also affected Northern Germany and Scandinavia, but the heatwave's mean intensity would be limited to 0.5 °C (Fig. 3f), and local maxima would have reached at most a 5 °C intensity (Fig. 3a). Hence, human activity amplified the observed heatwave's characteristics, but the heatwave would have still developed under pre-industrial conditions. As global mean temperature increases, the heatwave mean intensity increases from 0.5 °C in a counterfactual world to 6.6 °C under a +4 K level of global warming (Fig. 3a–e). The heatwave also expands from mainly affecting Northern Europe to affecting the entire European region, starting from a +2 K level.
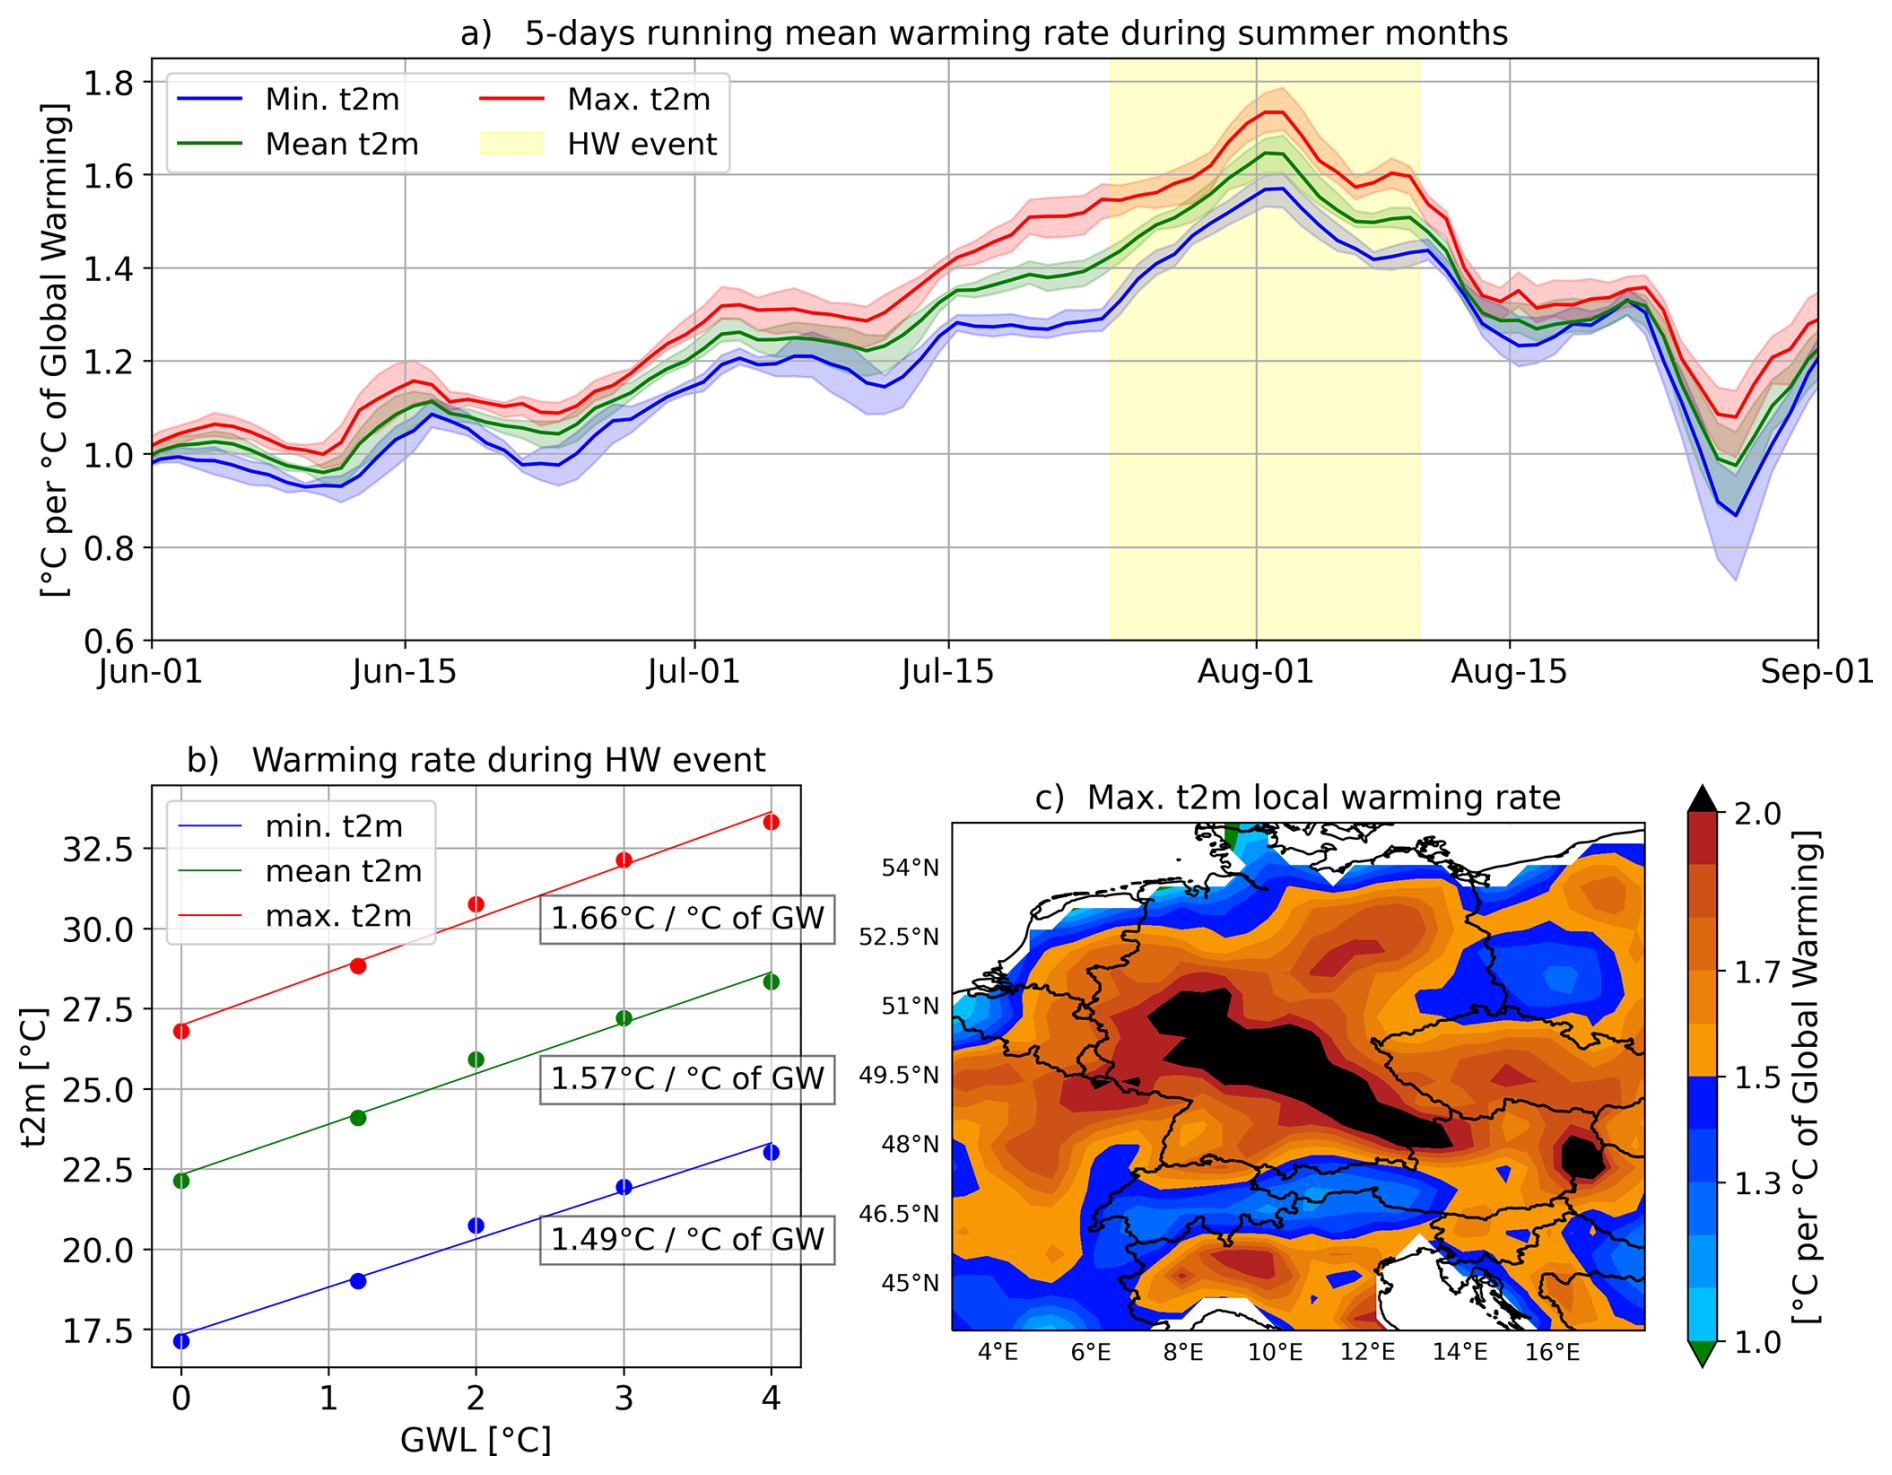
Figure 4Warming rate: 2 m temperature increase per degree of global warming. (a) 5 d running average warming rate for minimum (blue), mean (green), and maximum (red) near-surface temperature spatially averaged over Central Europe. Color shading corresponds to the range covered by the 5 available members. (b) Mean warming rate during the July 2018 heatwave event per degree of global warming spatially-averaged over Central Europe. (c) Local warming rate of the event's mean maximum temperature over the region of interest (Central Europe).
The main contribution of anthropogenic global warming to temperature increase over the region of interest can be evidenced in Fig. 4 using warming rates (t2m increase per degree of global warming, computed as the linear trend across the storyline simulations). The 5 d running mean warming rate for maximum, mean, and minimum temperature increases towards the heatwave event, reaching values of ∼ +1.7 °C per degree of global warming at the center of the heatwave event for maximum near-surface temperature (Fig. 4a). The mean maximum temperature of the event (Fig. 4b) in a counterfactual world would be 26.7 °C, while the observed heatwave (factual world) had an average maximum temperature of 28.8 °C. This indicates a +2.1 °C increase in maximum temperature in the observed heatwave compared to the counterfactual, which can be directly attributed to anthropogenic global warming. Temperatures rise to 33.3 °C in a +4 K world, under a warming rate of 1.66 °C per degree of global warming. The local warming rate in maximum temperature (Fig. 4c) corresponds to the local trend per grid cell of the mean maximum temperature during the heatwave event for each storyline. Even if Northern Germany was the most affected region by the heatwave, Central and Southeastern Germany show the largest local warming rate for maximum temperatures, scaling by 2 °C per degree of global warming (Fig. 4b). In general, we find an amplified warming rate response to increased global mean temperature, meaning that the local trends are at least 1 °C per degree of global warming and more (blueish colors), with most of the region affected by a warming rate of 1.5 °C per degree of global warming or more (orange-redish colors). A similar behavior is seen for the 5 d running warming rate during summer months (Fig. 4a), an overall amplified response is seen for minimum, mean, and maximum near surface temperature for most time windows.
The storyline method enables specific, strong arguments about the absolute contribution of the thermodynamic influence of anthropogenic global warming to changing magnitudes of an extreme event's characteristics. Here, it indicates that the dynamical pathway leading to the 2018 heatwave with a mean intensity of 2.2 °C would have produced an event that was 6 d shorter and with a 0.5 °C mean intensity in the absence of human-induced global warming (Fig. 3a). Regarding future warming scenarios, an event developing under the same atmospheric conditions would result in a heatwave 1.9 °C more intense than in present times in a +2 K world, up to 4.4 °C more intense in a +4 K world, where average maximum 2 m-temperatures could reach 33.3 °C for the heatwave event. However, as compelling as these event-based narratives are, it is important to recognize that every heatwave is unique. While we may never witness the exact same event twice, we can search for analogue events with similar atmospheric conditions under future warming levels. In this way, the analogue approach aims to bridge the gap between storyline-driven projections and real-world probabilities.
4.2 Dynamical comparability between approaches
Studies argue that it is challenging to find good analogues when the event is too intense (Qian et al., 2023), or due to changing dynamics in the future (Thompson et al., 2024; Vautard et al., 2023). This limitation of the analogue approach is particularly evident when used in the conventional way (e.g., Wang et al., 2023; Yiou et al., 2017), where the analogues aim to reproduce not only the flow pattern of interest but also the pattern of the variable of interest to reconstruct the observed event. In our case, we are interested in the resemblance of the large-scale flow only, featuring temperature fields that do not necessarily reproduce the observed one. We deliberately let the associated variable vary to be able to construct a distribution function out of all the possible temperatures fields related to the given circulation pattern, similar to Noyelle et al. (2025).
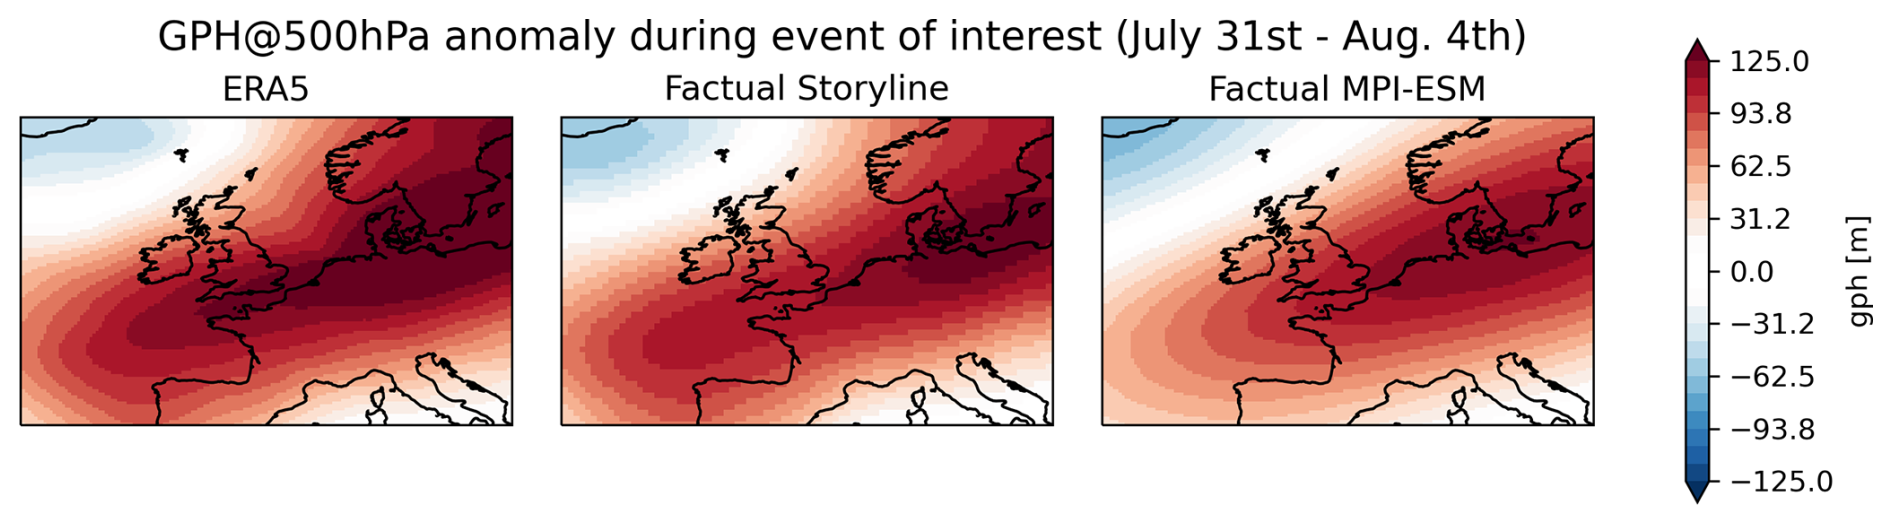
Figure 5Comparison of observed (ERA5), storyline (factual), and analogue-derived (factual period MPI-ESM-LR GE) circulation pattern. All three plots are based on the 5 d mean (31 July–4 August) GPH anomaly at 500 hPa with respect to the mean climatology 1985–2014.
In Fig. 5, we illustrate the similarity of the circulation pattern of interest across the storyline and flow-analogue approaches, relative to the observed pattern (based on ERA5). Both the simulated pattern in the storyline approach under present conditions and the mean of all analogues identified during the equivalent factual period across the 50 members of the MPI-ESM-LR GE using the analogue selection process described in Sect. 3.2 accurately represent the flow pattern of interest. Given the comparable dynamics in both approaches, we can attribute changes in the July 2018 heatwave more confidently to the thermodynamic component of anthropogenic global warming. In Figs. S3–S6, we further evaluate the quality of the identified analogues and their mean behavior at different levels of global warming, relative to the reference circulation. These results demonstrate the recurrence and robustness of the analogues, as well as their similarity to the reference flow, regardless of the warming level.
4.3 Likelihood of analogue events in present and warmer worlds.
Based on the flow-analogue selection process described in Sect. 3.2, we built subsets of N best analogues for each level of global warming comparable to the ones in the storyline approach. These analogues represent events which feature a similar large-scale flow evolution during the 5 d preceding the heatwave peak (31 July–4 August) (See Figs. S1–S2). From the 1000 years (50 members × 20 years) dataset for each global warming level in the MPI-ESM-LR GE (see Sect. 2.3), roughly N≈250 flow-analogues are consistently identified across all warming levels (Fig. 6: see label). This suggests that the circulation pattern linked to the 2018 heatwave remains roughly equally likely to occur in a warmer climate, regardless of increases in global mean surface temperature, in agreement with previously documented literature (e.g., Yiou et al., 2020; Davini and d'Andrea, 2020). A common critique of the storyline method is its assumption that the same large-scale atmospheric circulation patterns will occur in future climate scenarios, even though studies project dynamical changes in the atmosphere (Vautard et al., 2023), which could challenge the validity of such assumptions. However, our results provide evidence that, in this specific case study, the circulation pattern in question could be expected to occur with a ∼1-in-4 year probability (P(D)) regardless of the change in global mean surface temperature. In cases where the circulation pattern of a given case study can no longer be identified in future scenarios, this should not be regarded as a drawback of the method. Rather, it provides valuable information, allowing us to reject the possibility of a warmer storyline of the event occurring under future conditions.
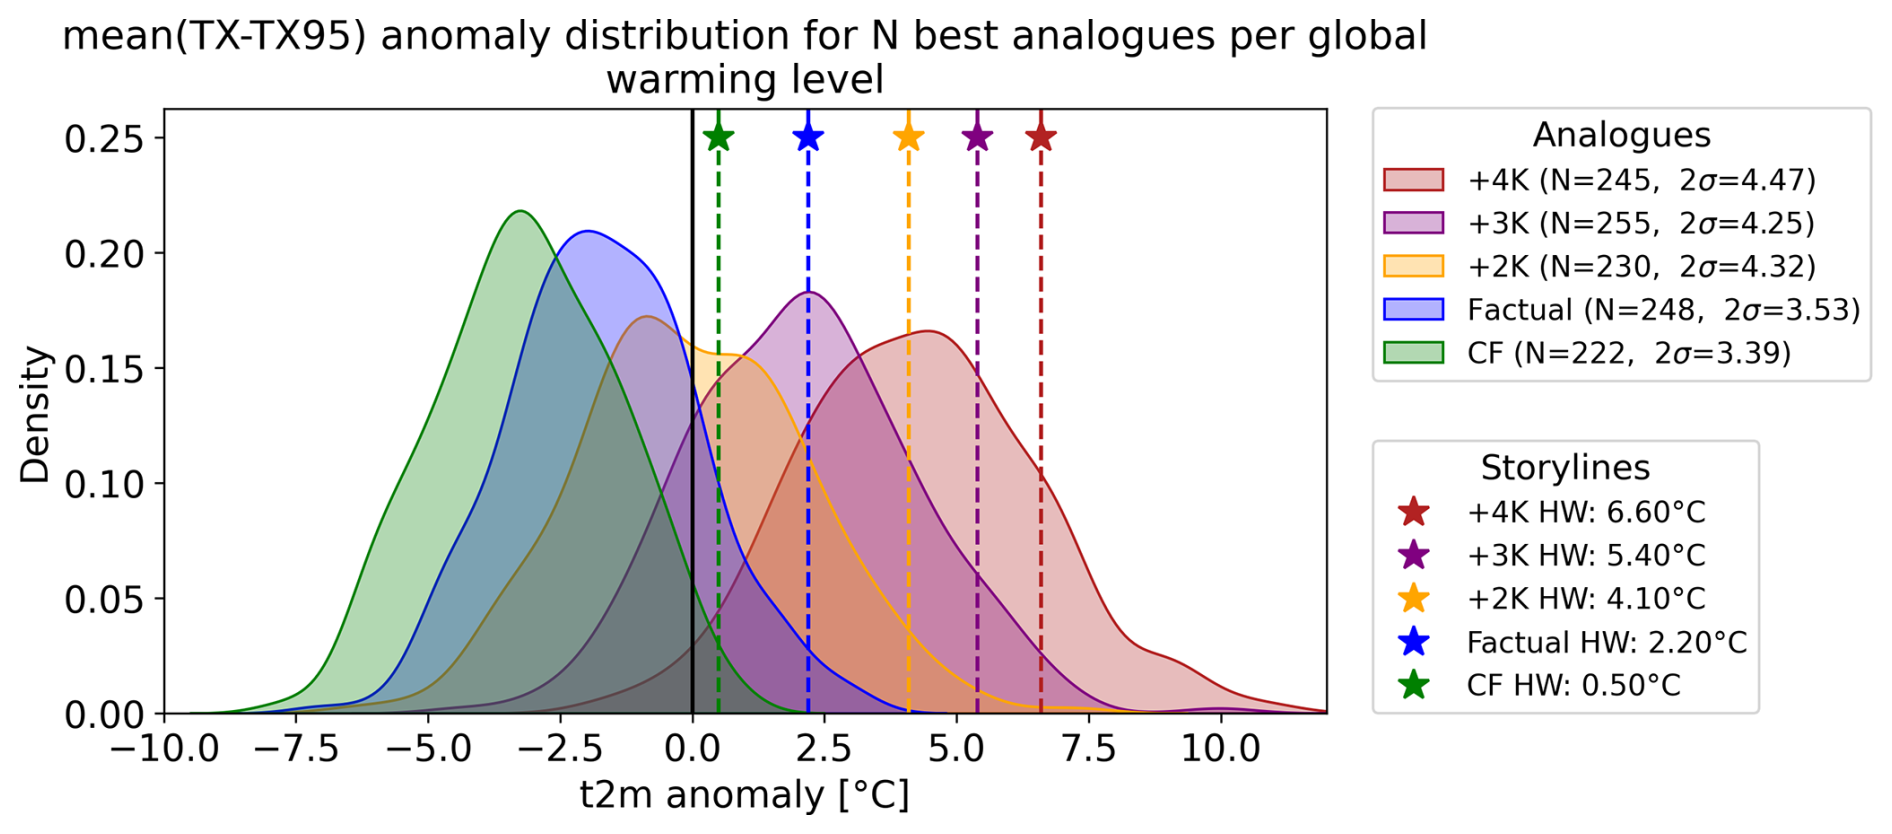
Figure 6Temperature anomaly distribution for best flow-analogues of the 2018 HW. Each distribution curve corresponds to a different level of global warming, accordingly to the nomenclature in the storyline method (counterfactual, factual, +2, +3, +4 K). The values portrayed correspond to the 5 d mean temperature anomaly (relative to the 95th percentile of the 1985–2014 climatology) for each analogue identified. The sample size N (see label) refers to the number of best analogues (closest Euclidean distance and mean spatial correlation >0.8) found in these global warming levels out of the 1000 years dataset from the MPI-ESM-LR GE. The width of the distributions is represented by two standard deviations (2σ)(see label).The stars show the mean intensity of the heatwaves projected by the storyline method (as in Fig. 3).
Figure 6 shows the distribution of 5 d mean temperature anomalies of the analogues, defined as the field averaged daily maximum temperatures relative to the climatological (factual 1985–2014) 95th percentile (mean(TXi−TX95i)) for Central Europe. We refer to these values as t2m anomalies rather than heatwave intensities (although they share the same definition; see Sect. 3.3), since not all identified flow-analogues develop into a heatwave. In Fig. 6, the black line defines the limit between analogues that evolve into a heatwave (anomalies >0), and those that do not (anomalies ). As expected, the temperature distributions shift towards higher temperature anomalies as the global mean temperature increases. Compared to an alternative counterfactual climate where a heatwave has only a 1.8 % probability to emerge from such a circulation pattern, in a factual world, the probability rises to 16.5 %, in a +2 K world 48.7 %, in a +3 K world 87.3 %, and in a +4 K world 97.1 %. This suggests that the atmospheric blocking system enabling the 2018 heatwave shifts from being a necessary but insufficient factor to an becoming an increasingly sufficient condition for heatwaves to occur under global warming. By +3 K, the thermodynamic background alone would be likely enough to trigger a heatwave when such a circulation pattern appears, regardless of additional contributing factors (Shepherd, 2016; Hannart et al., 2016). Therefore, in +3 and +4 K worlds, under such atmospheric circulation pattern, what is currently considered a heatwave would merely represent a regular day, while the absence of a heatwave would become increasingly rare under these large-scale atmospheric circulation conditions.
The stars in Fig. 6 denote the magnitudes of the heatwave mean intensities projected in the storyline approach (as in Fig. 3). The area of the distributions surpassing one of these thresholds corresponds to its probability of occurrence in the given global warming level. Hence, it is evident how the probability of an analogue to exceed the intensity of the factual 2018 heatwave (2.2 °C) increases with global mean temperature. Similarly, there is an increase in the probability of a flow-analogue to surpass the magnitude of projected heatwaves in future levels of global warming. These values correspond to the probability of the event of interest occurring within the atmospheric circulation pattern of interest for a given global warming level, denoted as P(E|D)GWL. The overall probability of the analogue events to occur in each level of global warming has to be scaled by the probability of the atmospheric circulation pattern to occur P(D), resulting in PM,GWL (see Sect. 3.4), presented in Fig. 7 in terms of return periods.
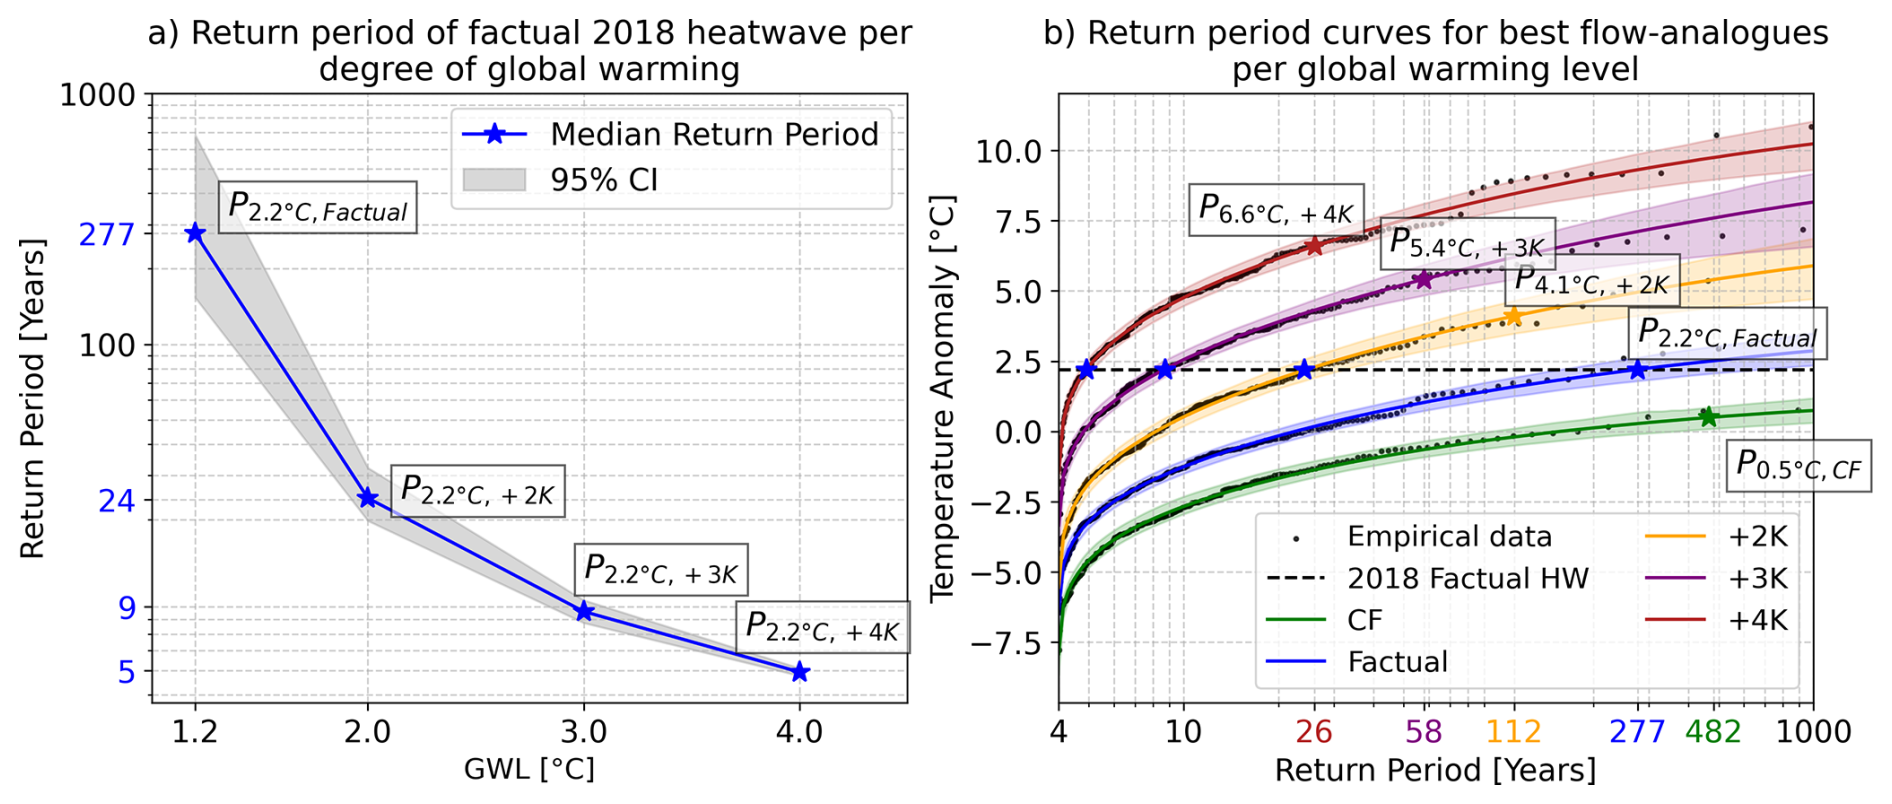
Figure 7Heatwave intensity's return periods: (a) Return period of the factual 2018 HW per degree of global warming. (b) Return periods of heatwave intensity for each global warming level (counterfactual, factual, +2, +3, +4 K). Solid lines show return levels obtained through GEV fitting of 250 analogue events scaled by their 1-in-4 years occurrence out of the 1000 years sampled (50 members ×20 years). Black dots show the flow-analogues' data before fitting. Shaded regions enclose the 95 % confidence interval (lower bound: 2.5th percentile, upper bound: 97.5th percentile) obtained by a 1000-sample bootstrap resampling. Stars show the return period equivalent to the projected intensity by the storyline approach.
The key question in statistical attribution methods is to assess the change in the likelihood of the observed event, in this case, the 2018 heatwave, occurring in the present climate compared to counterfactual or future warming scenarios. We denote the probability of the factual heatwave of magnitude 2.2 °C to occur in a given global warming level as P2.2 °C,GWL. In Fig. 7, the blue star markers provide the answer to such a question; the counterfactual world has been omitted in Fig. 7a since a heatwave of such magnitude was not identified (see Fig. 6). This is also evidenced in Fig. 7b, where the counterfactual dataset does not reach the observed magnitude, meaning that it was not possible to occur in the absence of human-induced warming. In a factual climate, roughly ∼25 % of years exhibit a similar blocking pattern (P(D)), and only ∼1.6 % of these analogues exceed the observed mean heatwave intensity of 2.2 °C (P(E|D)) (Fig. 6). Hence, in the factual period, the 2018 heatwave conditioned on this atmospheric circulation pattern was a rare event, occurring with a probability of about 1-in-277 years () according to the fitted value (Fig. 7). Under continued global warming, the return period of a heatwave with the same intensity would decrease exponentially (Fig. 7a), eventually becoming a common 1-in-5-year event in a +4 K world.
The added value of this combined approach lies in its ability to quantify the likelihood that an alternative, physically consistent storyline of the heatwave would emerge under its corresponding level of global warming (Fig. 7b). Based on the combined storyline-statistical analysis, the 2018 heatwave would have a mean intensity of 4.1 °C in a +2 K world, with a 1-in-112 years probability to occur (). In a +3 K world, the mean intensity would increase to 5.4 °C, with a return period of 1-in-58 years (). Finally, in a +4 K world, the heatwave's mean intensity would reach 6.6 °C, with a return period of just 1-in-26 years (). Since we are using a fixed climatology (1985–2014) as a baseline to define present and future heatwaves, it is no surprise that the 2018 heatwave, as experienced in the present, undergoes an exponential increase in likelihood until it becomes a common event in a +4 K world. However, one might initially assume that the warmer storylines simulated for future climates would remain as unlikely in their respective levels of global warming as the original heatwave was in the present. Instead, the results indicate that these projected events also become more common at their corresponding global warming levels, following an exponential trend. These return periods already take into account the probability of the atmospheric circulation pattern occurring under future climate conditions, whose frequency stays roughly constant with increasing global mean surface temperature. This indicates that due to dynamical conditions, future heatwaves have the same chance to occur. Despite that, anthropogenic global warming seems to intensify rare heatwave events in warming scenarios at a higher rate than expected and projected by the storyline approach.
4.4 Increased probability of extreme heatwaves in warmer worlds.
We hypothesize that the increase in extreme heatwaves could come from a combination of several factors: (1) the conservative definition of global warming in the storyline approach (which only imposes changes in SST and GHGs, as they are certain to have a human-induced contribution) may restrict the heatwave intensities. (2) the integration of more complex interactions in the MPI-ESM GE (coupled earth system model) used for the flow-analogue analysis, compared to the nudged storylines simulated with ECHAM (atmospheric model with an integrated land component JSBACH). (3) The role of soil moisture as a source of variance in the temperature distributions for future warming levels (Fischer et al., 2012).
The 2018 heatwave was very extreme not only because of its atmospheric circulation but also because of the exceptionally dry conditions that preceded it (Rousi et al., 2023). In Fig. 8, we explore the role of soil moisture in both approaches. In Fig. 8a, we see how soil moisture is also affected by global warming in the storylines, decreasing at a faster rate in future warming levels. The counterfactual storyline had a mean soil moisture of 62.9 kg m−2 during the main heatwave event, while in a +4 K storyline, the soil moisture dropped to 54.9 kg m−2. In Fig. 8b, we show the bivariate distribution of soil moisture (SM) and temperature anomaly (T) associated with the flow-analogues. The lines in this plot show the corresponding magnitudes in the storyline approach per global warming level. The bivariate comparison demonstrates that the analogues at each warming level occupy temperature (T)-soil moisture (SM) states consistent with the corresponding storylines and that also their number of extreme heatwaves increases in their own warming levels when soil moisture is included as an additional condition in the analogue attribution (area of bivariate (SM-T) threshold exceedance shown as darker dots in Fig. 8b). Here, we can provide evidence that despite having similar atmospheric circulation patterns, the analogues do portray a larger spectrum of events that could emerge due to other underlying conditions, like enhanced soil moisture deficit. It is possible that due to the increasing thermodynamic drying of the future simulations, the role of the atmospheric circulation becomes less important, as more and more of the analogues also have drought conditions.
Furthermore, the increase of extreme heatwaves in the upper tail of the temperature (Fig. 6) and bivariate SM-T (Fig. 8) distributions does not come only from the shift in the mean of the distributions towards warmer temperatures due to global warming but also from an increase in variance in future warming levels (see label Fig. 6), which could be associated to a strengthened feedback with soil moisture in the analogue catalogue. If one could condition the temperature distributions on the soil moisture of a storyline (i.e. p(SM =60, T)), the variance would be largely reduced. This would lead unfortunately also to a smaller sample size, too small to perform significant attribution.
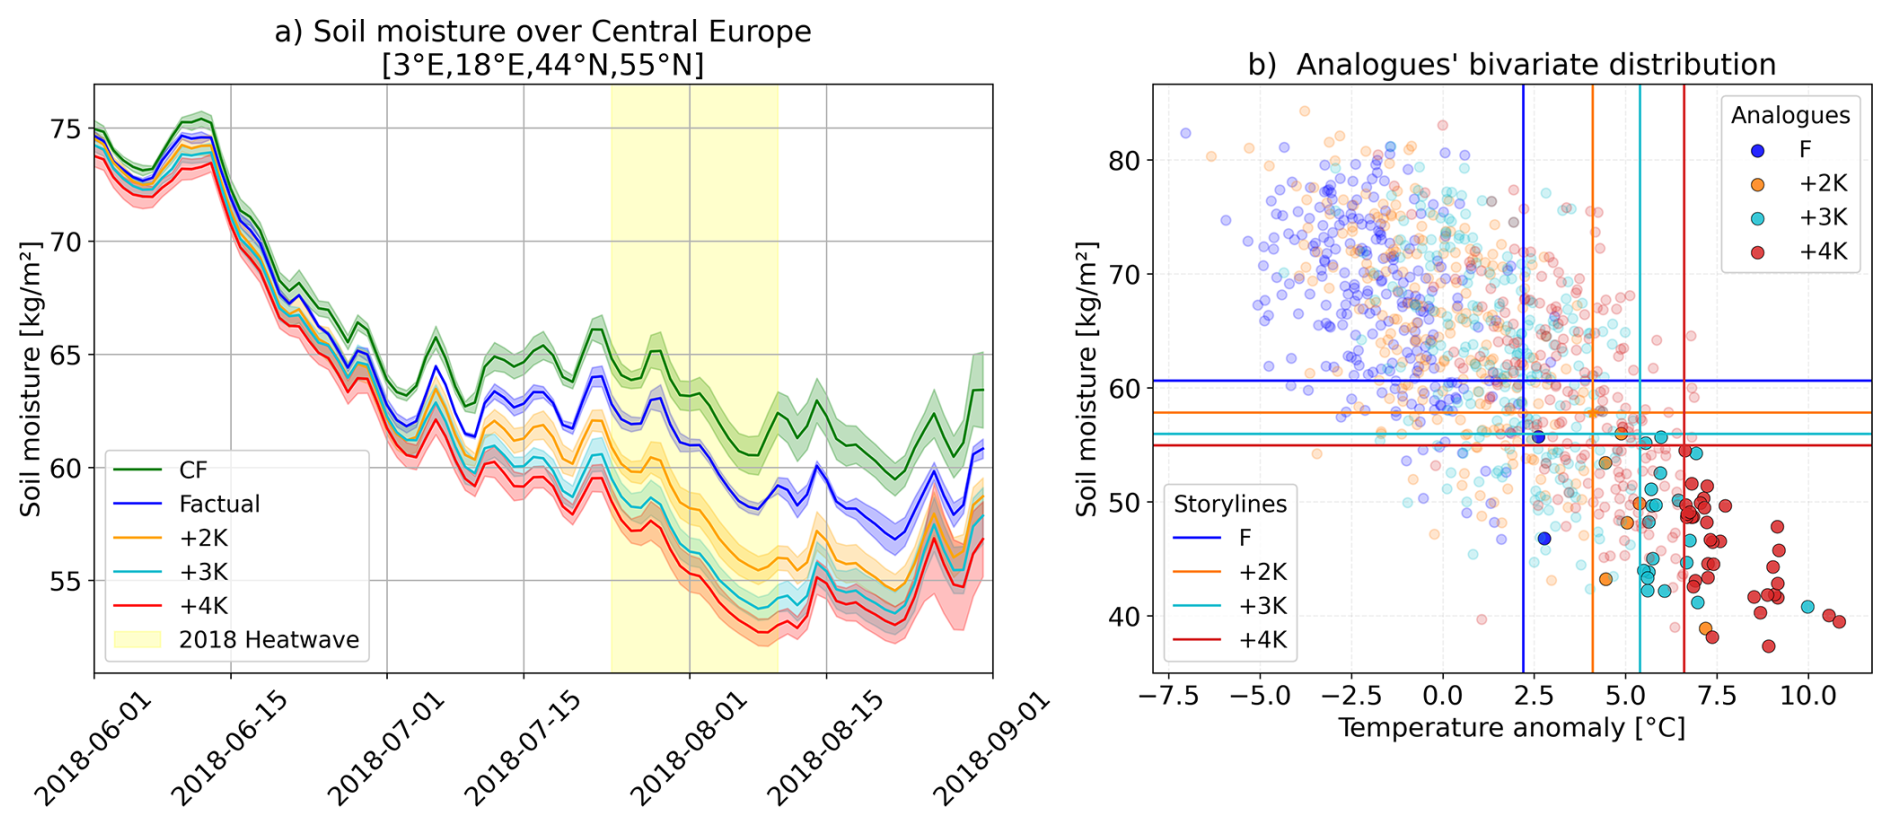
Figure 8Soil moisture (0–20 cm depth): (a) Time series of daily soil moisture anomalies over Central Europe for each storyline. Solid lines show the ensemble mean, and shaded bands indicate the ±2 SD range across the five ensemble members for each storyline. (b) Bivariate distribution of analogue events, displaying soil moisture (y axis) versus temperature anomaly (x axis). Colored lines show the projected soil moisture-temperature values from each storyline. Scatter points represent analogue-derived values, with the darker points indicating analogue events that exceed the soil moisture and temperature thresholds projected by the corresponding storyline.
In sum, both attribution methods are conditioned on the observed dynamics and were made as comparable as possible. The storyline approach provides a representation of how this single event would change in response to anthropogenic thermodynamic forcing (SSTs and GHGs). The flow-analogue approach includes a wider range of heatwaves developing under similar dynamics but different interacting processes, including more extreme heatwaves, probably resulting from a reduced soil moisture availability. Even though these results may be model-dependent, it is worth emphasizing that both approaches rely on the same atmospheric model. The storylines are simulated with ECHAM6, the atmospheric component of the MPI-ESM model, while the flow-analogues are extracted from scenario simulations of MPI-ESM. Including additional models for comparison in future work could provide more detailed insights on this matter.
Our study brings together physical and statistical narratives in conditional extreme event attribution. We used the July 2018 heatwave over Central Europe to contextualize the proposed storyline-statistical attribution approach. The storyline approach was conducted using a global spectrally nudged storyline dataset resembling the event of interest unfolding in a counterfactual, present, and future warming scenarios. The statistical approach was performed through the flow-analogues method, which conditions the analysis to the circulation pattern related to the event of study. It was applied to the MPI-ESM-LR Grand Ensemble (50 members) for equivalent counterfactual, present and future warming scenarios. Our results show that:
-
There is an amplified mean warming rate during summer days, which intensifies during the heatwave event, reaching a rate of increase in maximum temperature of 1.7 °C per degree of global warming.
-
Locally, Central Europe is projected to experience amplified warming, with Central and Southeast Germany showing warming rates exceeding 2 °C per degree of global mean temperature increase.
-
No dynamical trends were identified for the atmospheric circulation pattern associated with the 2018 heatwave. The blocking system remains roughly equally likely to occur in present and future levels of global warming, with a probability of approximately 1-in-4 years.
-
The atmospheric blocking system enabling the 2018 heatwave changes from being a merely necessary factor under current climate conditions to becoming an increasingly sufficient condition (e.g., 97.1 % probability in a +4 K world) for the occurrence of a heatwave.
-
The factual Central European heatwave of July 2018 becomes exponentially more common with global warming. The observed heatwave goes from being a 1-in-277 years event in the present, increasing in frequency until becoming a 1-in-5 years event in a +4 K degree world.
-
Heatwaves occurring under analogous atmospheric circulation, and with equal or greater intensity than those projected by future storylines, increase in frequency with global warming. According to our study, the observed 2018 heatwave had a 2.2 °C intensity with a return period of 1-in-277 years in the present time, intensifying to 6.6 °C with a return period of 1-in-26 years in a +4 K world.
Former studies attributed the anomalous intensity and high persistence of the 2018 European heatwave to anthropogenic climate change. Using Earth system models, Vogel et al. (2019) concluded that concurrent hot extremes of the Northern Hemisphere in 2018 would not have been possible without human impact. In another study, Yiou et al. (2020) performed unconditional and conditional attribution to the 2018 heatwave, concluding that its likelihood and intensity increased due to anthropogenic global warming. Using a probabilistic attribution approach, Rousi et al. (2023) provided evidence that such events have already become more likely in recent decades, and are expected to occur virtually every single year in a +2 K warmer world. Moreover, Wehrli et al. (2020) used storylines to attribute the 2018 heatwave and found that under similar atmospheric weather patterns, the heatwave would reach potentially health-impacting temperatures of more than 40 °C for future climate conditions of +2 K.
Regarding the warming rate behavior, our results agree well with an earlier storyline-based study by Klimiuk et al. (2025). Using a different storyline set-up, they report similarly high amplified warming rates for the late July 2019 heatwave in a similar region. In their study, they conclude that summer months show an overall amplification in warming rates, with further intensification during heatwave events, reaching up to 1.9 °C per degree of global warming. Locally, warming rates for maximum temperature exhibit a comparable behavior, with most land areas in the region of interest experiencing at least a 1 °C increase per degree of global warming. These findings highlight that, even within the highly conditional nature of the storyline approach applied to individual case studies, Central Europe exhibits consistent thermodynamic responses across different extreme heatwave events.
About the recurrence of the 2018 heatwave circulation pattern under present and future levels of global warming, our results are consistent with Yiou et al. (2020), who identified no dynamical trends for good analogues of the 2018 heatwave in CMIP5 RCP4.5 and RCP8.5 simulations. Using the analogue method for an extreme precipitation event in July 2021, Thompson et al. (2024) found that the analogue catalog of comparable Central European cut-off lows shows a systematic eastward shift in future projections. However, our 2018 heatwave analogues do not show any systematic shifts in the positioning of the atmospheric blockings (see Fig. S6). We only detect a general tendency toward slightly weaker GPH anomalies across all future warming scenarios, which should not have major implications for the overall large-scale atmospheric flow. Hence, we are confident that the statistics of the respective analogue samples are not affected by systematic changes in the large-scale flow. Recent studies have shown that nearly all CMIP6 model simulations fail to fully capture the accelerated trend in heat in western European heat extremes, mostly by underestimating the circulation-induced contribution related to more frequent southerly flow anomalies (Singh et al., 2023; Kornhuber et al., 2024; Vautard et al., 2023). It should be kept in mind that our combined attribution is designed to assess the impact of climate change on individual observed extreme events. While we account for possible dynamical changes in the future, we only do so by estimating the future probability of an event that is dynamically similar to the observed one. Therefore, our method cannot provide more general inferences about expected changes in the dynamical contribution – either forced or from internal variability – that may dampen or amplify future heat extremes.
Concerning the increased probability of occurrence of the observed 2018 heatwave in future climate conditions, other researchers also report an increased likelihood due to global warming. In a study based on cumulative heat (defined as the integrated temperature exceedance above a threshold), Rousi et al. (2023) estimated a 96 % probability of exceeding the 2018 heatwave in a +2 K world. In another study, Felsche et al. (2024) suggests a four-fold increase in exceedance probability of the 2018 heatwave based on a multivariate analysis, such that it becomes a 1-in-10-year event in a +2 K world. These results differ in magnitude from ours, given that their results correspond to the probability of any heatwave to emerge in this region with similar characteristics -ex: cumulative heat, intensity, or multivariate analysis-, regardless of the dynamical conditions. On the other hand, our analysis estimates the probability of a heatwave comparable to the one experienced in 2018, conditioned on the occurrence of an atmospheric blocking over Scandinavia (which remains very likely in future warmer worlds). These results highlight the dependence of attribution methodologies on the event's definition and remark on the different messages provided by attribution methodologies. Overall, the key message is shared: extreme events like the 2018 heatwave will eventually become normal, starting from a +2 K global mean temperature anomaly.
Our results suggest that, for the 2018 heatwave, heatwaves exhibiting circulation patterns and intensities comparable to the storyline-based projections become increasingly frequent in the analogue catalogue under global warming. For example, while the factual 2018 heatwave has an estimated return period of 1-in-277 years in the present climate, the +4 K storyline version of the event corresponds to a 1-in-26 year event under +4 K conditions, indicating a tenfold increase in probability. In Sect. 4.4 we discuss the possible reasons for this increase in probability. Given that in the storyline approach we deliberately focus on a single dynamical pathway, even if it would not happen in the same way in alternative climates, we obtain the thermodynamical response on a single event. With the flow-analogue method, we identify that even more extreme heatwaves could emerge under similar atmospheric circulation but different preceding and prevailing conditions to the 2018 heatwave in a warmer climate. This result must be interpreted considering the distinct purposes of the two approaches. Because storylines are hypothetical experiments, they cannot be regarded as projections or claimed to happen exactly as projected in the future. However, flow-analogues provide the statistical and dynamical context to address the plausibility of similar large-scale circulation and events emerging with comparable intensity under future climate states.
Together, these two perspectives provide complementary insights. The storyline method provides a quantification of changes in heatwaves' characteristics due to global warming. For instance, stating how much warmer the event would be if it developed under warmer background conditions. These statements help in terms of communication, where the public can relate to past experiences and connect them to the severity of future scenarios under the concept: “The 2018 heatwave was already extreme, imagine it in a warmer world”. The flow-analogue method assesses the likelihood of similar atmospheric dynamics, and the heatwaves derived from them, in present and alternative climates. We have demonstrated that a more complete story arises when both methods are combined. For the 2018 heatwave over Central Europe, we provided evidence that the large-scale atmospheric circulation pattern related to the extreme event does not change with increasing global warming, so that it is as likely to occur as in present times. Even within the recurrence of a blocking over Scandinavia, a heatwave as intense as the 2018 heatwave in a factual world was still very unlikely in present times. Naturally, it is not only the atmospheric circulation pattern and global warming that define the characteristics of a heatwave. For such reason, not all flow-analogues evolve into a heatwave, and others get much more intense than the observed one. Many other factors and interactions play a role, like preceding drought conditions. This synthesis allows us to state that future events with a similar blocking system to the 2018 heatwave might become more extreme and more frequent in future climates than the 2018 event was in the present, highlighting a critical shift in environmental risks as global temperatures rise. Importantly, this conclusion is event-specific. For other cases, future dynamics could diverge sufficiently so that warmer versions of a historical event may become physically implausible. Using both approaches in combination allows us to identify when this is the case. To conclude, combining the spectrally nudged storylines with the flow-analogue method provides a complementary physical-statistical framework for extreme event attribution that simultaneously explores the thermodynamic role of anthropogenic global warming, potential dynamical trends, and the changing likelihood of event occurrence, aiming to enhance communication and adaptation to climate extremes.
Further research using this combined methodology could be extended to other types of extreme events shaped by specific dynamical conditions, including cold spells, compound events such as heat/drought, or heavy precipitation and flood episodes. For events related to precipitation, higher-resolution datasets are recommended to more accurately capture the relevant processes in both storyline simulations and large ensembles. A limiting factor is the challenge that models face in reproducing precipitation events, which may be overcome in the future by implementing AI-enhanced simulations of very high resolution. Additional constraints, similar to those used in Bayesian event attribution, could also be introduced to refine the event definition. For example, attributing not just a heatwave with a 2 °C anomaly under a given circulation pattern, but a heatwave accompanied by concurrent soil moisture deficits in compound events. This would allow for a more precise attribution of the event of interest. Moreover, causal inference could be explored within this framework by identifying, through the flow-analogue approach, the specific conditions under which the projected storylines tend to occur at different levels of global warming.
All custom codes are implementations of standard methods in Python. The code used to produce the figures in this paper is available from the corresponding author upon request. The MPI-ESM-LR Grand Ensemble dataset is publicly available at https://esgf-data.dkrz.de/search/cmip6-dkrz/?mip_era=CMIP6&activity_id=RFMIP&institution_id=MPI-M&source_id=MPI-ESM1-2-LR (last access: 10 April 2026). The ERA5 reanalysis dataset is available at the Copernicus Climate Data Store https://climate.copernicus.eu/ (last access: 10 April 2026). The global spectrally nudged storyline dataset is available upon request.
The supplement related to this article is available online at https://doi.org/10.5194/wcd-7-597-2026-supplement.
DLFF designed the study, methodology, performed analysis, data processing, visualization, wrote the first draft of the manuscript, reviewing and editing. AL and JGP contributed to methodology, supported result interpretation, manuscript reviewing, and editing. AHF supported result interpretation, manuscript reviewing, and editing. FF supervised the research, contributed to the study design, supported result interpretation, manuscript reviewing, and editing.
The contact author has declared that none of the authors has any competing interests.
Publisher's note: Copernicus Publications remains neutral with regard to jurisdictional claims made in the text, published maps, institutional affiliations, or any other geographical representation in this paper. The authors bear the ultimate responsibility for providing appropriate place names. Views expressed in the text are those of the authors and do not necessarily reflect the views of the publisher.
This research was supported by the German Federal Ministry of Research, Technology and Space (BMFTR) research program ClimXtreme II: A5 DesAttHeat (grant nos. 01LP2322A, 01LP2332B) and the European Union H2020 Project “CLIMATE INTELLIGENCE Extreme events detection, attribution and adaptation design using machine learning (CLINT)” [grant no. 101003876-CLINT]. JGP thanks the AXA Research Fund for support. We thank Eduardo Zorita for his guidance on the development of the flow-analogue algorithm, and István Dunkl and the anonymous reviewer, whose comments contributed to improving the manuscript.
The article processing charges for this open-access publication were covered by the Helmholtz-Zentrum Hereon.
This paper was edited by Camille Li and reviewed by István Dunkl and one anonymous referee.
Barriopedro, D., García-Herrera, R., Ordoñez, C., Miralles, D. G., and Salcedo-Sanz, S.: Heat Waves: Physical Understanding and Scientific Challenges, Rev. Geophys., 61, e2022RG000780, https://doi.org/10.1029/2022RG000780, 2023. a, b
Barriopedro, D., Jiménez-Esteve, B., Collazo, S., Garrido-Perez, J. M., Johnson, J. E., and García-Herrera, R.: A Multimethod Attribution Analysis of Spain's 2024 Extreme Precipitation Event, B. Am. Meteorol. Soc., 106, E2440–E2460, https://doi.org/10.1175/BAMS-D-25-0049.1, 2025. a
Davini, P. and d'Andrea, F.: From CMIP3 to CMIP6: Northern Hemisphere atmospheric blocking simulation in present and future climate, J. Climate, 33, 10021–10038, https://doi.org/10.1175/JCLI-D-19-0862.1, 2020. a
Eyring, V., Gillett, N. P., Achuta Rao, K. M., Barimalala, R., Barreiro Parrillo, M., Bellouin, N., Cassou, C., Durack, P. J., Kosaka, Y., McGregor, S., Min, S., Morgenstern, O., and Sun, Y.: Human Influence on the Climate System, in: Climate Change 2021: The Physical Science Basis. Contribution of Working Group I to the Sixth Assessment Report of the Intergovernmental Panel on Climate Change, edited by: Masson-Delmotte, V., Zhai, P., Pirani, A., Connors, S. L., Péan, C., Berger, S., Caud, N., Chen, Y., Goldfarb, L., Gomis, M. I., Huang, M., Leitzell, K., Lonnoy, E., Matthews, J. B. R., Maycock, T. K., Waterfield, T., Yelekçi, O., Yu, R., and Zhou, B., pp. 423–552, Cambridge University Press, Cambridge, United Kingdom and New York, NY, USA, https://doi.org/10.1017/9781009157896.005, 2021. a, b
Felsche, E., Böhnisch, A., Poschlod, B., and Ludwig, R.: European hot and dry summers are projected to become more frequent and expand northwards, Commun. Earth Environ., 5, 410, https://doi.org/10.1038/s43247-024-01575-5, 2024. a
Feser, F. and Shepherd, T. G.: The concept of spectrally nudged storylines for extreme event attribution, Commun. Earth Environ., 6, 677, https://doi.org/10.1038/s43247-025-02659-6, 2025. a, b, c
Feser, F., van Garderen, L., and Hansen, F.: The Summer Heatwave 2022 over Western Europe: An Attribution to Anthropogenic Climate Change, B. Am. Meteorol. Soc., 105, E2175–E2179, https://doi.org/10.1175/BAMS-D-24-0017.1, 2024. a
Fischer, E. M., Rajczak, J., and Schär, C.: Changes in European summer temperature variability revisited, Geophys. Res. Lett., 39, https://doi.org/10.1029/2012GL052730, 2012. a
Giorgetta, M. A., Roeckner, E., Mauritsen, T., Bader, J., Crueger, T., Esch, M., Rast, S., Kornblueh, L., Schmidt, H., Kinne, S., Hohenegger, C., Möbis, B., Krismer, T., Wieners, K.-H., and Stevens, B.: The atmospheric general circulation model ECHAM6 – model description, Berichte zur Erdsystemforschung, Max-Planck-Institut für Meteorologie, 135, https://doi.org/10.17617/2.1810480, 2013. a
Hannart, A., Pearl, J., Otto, F., Naveau, P., and Ghil, M.: Causal counterfactual theory for the attribution of weather and climate-related events, B. Am. Meteorol. Soc., 97, 99–110, https://doi.org/10.1175/BAMS-D-14-00034.1, 2016. a
Hegerl, G. C., Hoegh-Guldberg, O., Casassa, G., Hoerling, M., Kovats, S., Parmesan, C., Pierce, D., and Stott, P.: Good Practice Guidance Paper on Detection and Attribution Related to Anthropogenic Climate Change, in: Meeting Report of the Intergovernmental Panel on Climate Change Expert Meeting on Detection and Attribution of Anthropogenic Climate Change, edited by: Stocker, T., Field, C., Qin, D., Barros, V., Plattner, G.-K., Tignor, M., Midgley, P., and Ebi, K., IPCC Working Group I Technical Support Unit, University of Bern, Bern, Switzerland, https://www.researchgate.net/profile/ Kristie-Ebi/publication/265027321_IPCC_Expert_Meeting_on _Detection_and_Attribution_Related_to_Anthropogenic_Clima te_Change/links/54d389430cf2501791823e8b/IPCC-Expert-Me eting-on-Detection-and-Attribution-Related-to-Anthropogenic-Climate-Change.pdf (last access: 10 April 2026), 2010. a
Hersbach, H., Bell, B., Berrisford, P., Hirahara, S., Horányi, A., Muñoz-Sabater, J., Nicolas, J., Peubey, C., Radu, R., Schepers, D., Simmons, A., Soci, C., Abdalla, S., Abellan, X., Balsamo, G., Bechtold, P., Biavati, G., Bidlot, J., Bonavita, M., De Chiara, G., Dahlgren, P., Dee, D., Diamantakis, M., Dragani, R., Flemming, J., Forbes, R., Fuentes, M., Geer, A., Haimberger, L., Healy, S., Hogan, R. J., Hólm, E., Janisková, M., Keeley, S., Laloyaux, P., Lopez, P., Lupu, C., Radnoti, G., de Rosnay, P., Rozum, I., Vamborg, F., Villaume, S., and Thépaut, J.-N.: The ERA5 global reanalysis, Q. J. Roy. Meteorol. Soc., 146, 1999–2049, https://doi.org/10.1002/qj.3803, 2020. a
Hersbach, H., Comyn-Platt, E., Bell, B., Berrisford, P., Biavati, G., Hoányi, A., Muñoz Sabater, J., Nicolas, J., Peubey, C., Radu, R., Rozum, I., Schepers, D., Simmons, A., Soci, C., Dee, D., Thépaut, J.-N., Cagnazo, C., and Cucchi, M.: ERA5 post-processed daily-statistics on pressure levels from 1940 to present, Copernicus Climate Change Service (C3S) Climate Data Store (CDS) [data set], https://doi.org/10.24381/cds.4991cf48, 2023. a
Imbery, F., Friedrich, K., Koppe, C., Janssen, W., Pfeifroth, U., Daßler, J., and Bissolli, P.: 2018 wärmster Sommer im Norden und Osten Deutschlands, https://www.dwd.de/DE/leistungen/besondereereignisse/temperatur/20180906_waermstersommer_nordenosten2018.pdf;jsessionid=794F701745200CF2245555C45667D2DD.live21072?__blob=publicationFile&v=7 (last access: 10 April 2026), 2018. a
IPCC: Summary for Policymakers, in: Climate Change 2021: The Physical Science Basis. Contribution of Working Group I to the Sixth Assessment Report of the Intergovernmental Panel on Climate Change, edited by: Masson-Delmotte, V., Zhai, P., Pirani, A., Connors, S., Péan, C., Berger, S., Caud, N., Chen, Y., Goldfarb, L., Gomis, M., Huang, M., Leitzell, K., Lonnoy, E., Matthews, J., Maycock, T., Waterfield, T., Yelekçi, O., Yu, R., and Zhou, B., p. 3–32, Cambridge University Press, Cambridge, United Kingdom and New York, NY, USA, Book Section, https://doi.org/10.1017/9781009157896.001, 2021. a, b
Jézéquel, A., Yiou, P., and Radanovics, S.: Role of circulation in European heatwaves using flow analogues, Clim. Dynam., 50, 1145–1159, https://doi.org/10.1007/s00382-017-3667-0, 2018. a, b, c
Kalnay, E., Kanamitsu, M., Kistler, R., Collins, W., Deaven, D., Gandin, L., Iredell, M., Saha, S., White, G., Woollen, J., Zhu, Y., Chelliah, M., Ebisuzaki, W., Higgins, W., Janowiak, J., Mo, K. C., Ropelewski, C., Wang, J., Leetmaa, A., Reynolds, R., Jenne, R., and Joseph, D.: The NCEP/NCAR 40-Year Reanalysis Project, B. Am. Meteorol. Soc., 77, 437–472, https://doi.org/10.1175/1520-0477(1996)0772.0.CO;2, 1996. a
Kautz, L.-A., Martius, O., Pfahl, S., Pinto, J. G., Ramos, A. M., Sousa, P. M., and Woollings, T.: Atmospheric blocking and weather extremes over the Euro-Atlantic sector – a review, Weather Clim. Dynam., 3, 305–336, https://doi.org/10.5194/wcd-3-305-2022, 2022. a
Kistler, R., Kalnay, E., Collins, W., Saha, S., White, G., Woollen, J., Chelliah, M., Ebisuzaki, W., Kanamitsu, M., Kousky, V., van den Dool, H., Jenne, R., and Fiorino, M.: The NCEP–NCAR 50-year reanalysis: monthly means CD-ROM and documentation, B. Am. Meteorol. Soc., 82, 247–268, https://doi.org/10.1175/1520-0477(2001)082<0247:TNNYRM>2.3.CO;2, 2001. a
Klimiuk, T., Ludwig, P., Sanchez-Benitez, A., Goessling, H. F., Braesicke, P., and Pinto, J. G.: The European summer heatwave of 2019 – a regional storyline perspective, Earth Syst. Dynam., 16, 239–255, https://doi.org/10.5194/esd-16-239-2025, 2025. a, b
Knutzen, F., Averbeck, P., Barrasso, C., Bouwer, L. M., Gardiner, B., Grünzweig, J. M., Hänel, S., Haustein, K., Johannessen, M. R., Kollet, S., Müller, M. M., Pietikäinen, J.-P., Pietras-Couffignal, K., Pinto, J. G., Rechid, D., Rousi, E., Russo, A., Suarez-Gutierrez, L., Veit, S., Wendler, J., Xoplaki, E., and Gliksman, D.: Impacts on and damage to European forests from the 2018–2022 heat and drought events, Nat. Hazards Earth Syst. Sci., 25, 77–117, https://doi.org/10.5194/nhess-25-77-2025, 2025. a, b, c
Kornhuber, K., Bartusek, S., Seager, R., Schellnhuber, H. J., and Ting, M.: Global emergence of regional heatwave hotspots outpaces climate model simulations, P. Natl. Acad. Sci. USA, 121, e2411258121, https://doi.org/10.1073/pnas.2411258121, 2024. a
León-FonFay, D., Barkhordarian, A., Feser, F., and Baehr, J.: Sensitivity of Arctic marine heatwaves to half-a-degree increase in global warming: 10-fold frequency increase and 15-fold extreme intensity likelihood, Environ. Res. Lett., 20, 014049, https://doi.org/10.1088/1748-9326/ada029, 2024. a
Lhotka, O. and Kyselỳ, J.: The 2021 European heat wave in the context of past major heat waves, Earth Space Sci., 9, e2022EA002567, https://doi.org/10.1029/2022EA002567, 2022. a, b
Mauritsen, T., Bader, J., Becker, T., Behrens, J., Bittner, M., Brokopf, R., Brovkin, V., Claussen, M., Crueger, T., Esch, M., Fast, I., Fiedler, S., Fläschner, D., Gayler, V., Giorgetta, M., Goll, D. S., Haak, H., Hagemann, S., Hedemann, C., Hohenegger, C., Ilyina, T., Jahns, T., Jimenéz-de-la Cuesta, D., Jungclaus, J., Kleinen, T., Kloster, S., Kracher, D., Kinne, S., Kleberg, D., Lasslop, G., Kornblueh, L., Marotzke, J., Matei, D., Meraner, K., Mikolajewicz, U., Modali, K., Möbis, B., Müller, W. A., Nabel, J. E. M. S., Nam, C. C. W., Notz, D., Nyawira, S.-S., Paulsen, H., Peters, K., Pincus, R., Pohlmann, H., Pongratz, J., Popp, M., Raddatz, T. J., Rast, S., Redler, R., Reick, C. H., Rohrschneider, T., Schemann, V., Schmidt, H., Schnur, R., Schulzweida, U., Six, K. D., Stein, L., Stemmler, I., Stevens, B., von Storch, J.-S., Tian, F., Voigt, A., Vrese, P., Wieners, K.-H., Wilkenskjeld, S., Winkler, A., and Roeckner, E.: Developments in the MPI-M Earth System Model version 1.2 (MPI-ESM1. 2) and its response to increasing CO2, J. Adv. Model. Earth Syst., 11, 998–1038, https://doi.org/10.1029/2018MS001400, 2019. a
National Academies of Sciences, Engineering, and Medicine: Attribution of Extreme Weather Events in the Context of Climate Change, National Academies Press, Washington, D.C., https://doi.org/10.17226/21852, 2016. a
Noyelle, R., Faranda, D., Robin, Y., Vrac, M., and Yiou, P.: Attributing the occurrence and intensity of extreme events with the flow analogue method, Weather Clim. Dynam., 6, 817–839, https://doi.org/10.5194/wcd-6-817-2025, 2025. a
Olonscheck, D., Suarez-Gutierrez, L., Milinski, S., Beobide-Arsuaga, G., Baehr, J., Fröb, F., Ilyina, T., Kadow, C., Krieger, D., Li, H., Marotzke, J., Plésiat, É., Schupfner, M., Wachsmann, F., Wallberg, L., Wieners, K.-H., and Brune, S.: The New Max Planck Institute Grand Ensemble With CMIP6 Forcing and High-Frequency Model Output, J. Adv. Model. Earth Syst., 15, e2023MS003790, https://doi.org/10.1029/2023MS003790, 2023. a, b
Otto, F. E.: Attribution of Extreme Events to Climate Change, Annu. Rev. Environ. Resour., 48, 813–828, https://doi.org/10.1146/annurev-environ-112621-083538, 2023. a
Philip, S., Kew, S., van Oldenborgh, G. J., Otto, F., Vautard, R., van der Wiel, K., King, A., Lott, F., Arrighi, J., Singh, R., and van Aalst, M.: A protocol for probabilistic extreme event attribution analyses, Adv. Stat. Clim. Meteorol. Oceanogr., 6, 177–203, https://doi.org/10.5194/ascmo-6-177-2020, 2020. a
Qian, C., Ye, Y., Bevacqua, E., and Zscheischler, J.: Human influences on spatially compounding flooding and heatwave events in China and future increasing risks, Weather Clim. Extrem., 42, 100616, https://doi.org/10.1016/j.wace.2023.100616, 2023. a, b
Rousi, E., Fink, A. H., Andersen, L. S., Becker, F. N., Beobide-Arsuaga, G., Breil, M., Cozzi, G., Heinke, J., Jach, L., Niermann, D., Petrovic, D., Richling, A., Riebold, J., Steidl, S., Suarez-Gutierrez, L., Tradowsky, J. S., Coumou, D., Düsterhus, A., Ellsäßer, F., Fragkoulidis, G., Gliksman, D., Handorf, D., Haustein, K., Kornhuber, K., Kunstmann, H., Pinto, J. G., Warrach-Sagi, K., and Xoplaki, E.: The extremely hot and dry 2018 summer in central and northern Europe from a multi-faceted weather and climate perspective, Nat. Hazards Earth Syst. Sci., 23, 1699–1718, https://doi.org/10.5194/nhess-23-1699-2023, 2023. a, b, c, d, e, f, g, h, i
Russo, S., Sillmann, J., and Fischer, E. M.: Top ten European heatwaves since 1950 and their occurrence in the coming decades, Environ. Res. Lett., 10, 124003, https://doi.org/10.1088/1748-9326/10/12/124003, 2015. a
Sagen, S.: Evolution of the 2018 European heatwave, Master's thesis, University of Oslo, Norway, https://hdl.handle.net/10852/79642 (last access: 10 April 2026), 2020. a
Sánchez-Benítez, A., Goessling, H., Pithan, F., Semmler, T., and Jung, T.: The July 2019 European heat wave in a warmer climate: Storyline scenarios with a coupled model using spectral nudging, J. Climate, 35, 2373–2390, https://doi.org/10.1175/JCLI-D-21-0573.1, 2022. a
Schubert-Frisius, M., Feser, F., von Storch, H., and Rast, S.: Optimal Spectral Nudging for Global Dynamic Downscaling, Mon. Weather Rev., 145, 909–927, https://doi.org/10.1175/MWR-D-16-0036.1, 2017. a
Schuldt, B., Buras, A., Arend, M., Vitasse, Y., Beierkuhnlein, C., Damm, A., Gharun, M., Grams, T. E., Hauck, M., Hajek, P., Hartmann, H., Hiltbrunner, E., Hoch, G., Holloway-Phillips, M., Körner, C., Larysch, E., Lübbe, T., Nelson, D. B., Rammig, A., Rigling, A., Rose, L., Ruehr, N. K., Schumann, K., Weiser, F., Werner, C., Wohlgemuth, T., Zang, C. S., and Kahmen, A.: A first assessment of the impact of the extreme 2018 summer drought on Central European forests, Basic Appl. Ecol., 45, 86–103, https://doi.org/10.1016/j.baae.2020.04.003, 2020. a
Seneviratne, S. I., Zhang, X., Adnan, M., Badi, W., Dereczynski, C., Di Luca, A., Ghosh, S., Iskandar, I., Kossin, J., Lewis, S., Otto, F., Pinto, I., Satoh, M., Vicente-Serrano, S. M., Wehner, M., and Zhou, B.: Weather and Climate Extreme Events in a Changing Climate, in: Climate Change 2021: The Physical Science Basis. Contribution of Working Group I to the Sixth Assessment Report of the Intergovernmental Panel on Climate Change, edited by: Masson-Delmotte, V., Zhai, P., Pirani, A., Connors, S. L., Péan, C., Berger, S., Caud, N., Chen, Y., Goldfarb, L., Gomis, M. I., Huang, M., Leitzell, K., Lonnoy, E., Matthews, J. B. R., Maycock, T. K., Waterfield, T., Yelekçi, O., Yu, R., and Zhou, B., pp. 1513–1766, Cambridge University Press, Cambridge, United Kingdom and New York, NY, USA, https://doi.org/10.1017/9781009157896.013, 2021. a
Shepherd, T. G.: Atmospheric circulation as a source of uncertainty in climate change projections, Nat. Geosci., 7, 703–708, https://doi.org/10.1038/ngeo2253, 2014. a, b, c
Shepherd, T. G.: A common framework for approaches to extreme event attribution, Current Clim. Change Rep., 2, 28–38, https://doi.org/10.1007/s40641-016-0033-y, 2016. a, b
Shepherd, T. G., Boyd, E., Calel, R. A., Chapman, S. C., Dessai, S., Dima-West, I. M., Fowler, H. J., James, R., Maraun, D., Martius, O., Senior, C. A., Sobel, A. H., Stainforth, D. A., Tett, S. F. B., Trenberth, K. E., van den Hurk, B. J. J. M., Watkins, N. W., Wilby, R. L., and Zenghelis, D. A.: Storylines: an alternative approach to representing uncertainty in physical aspects of climate change, Clim. Change, 151, 555–571, https://doi.org/10.1007/s10584-018-2317-9, 2018. a
Singh, J., Sippel, S., and Fischer, E. M.: Circulation dampened heat extremes intensification over the Midwest USA and amplified over Western Europe, Commun. Earth Environ., 4, 432, https://doi.org/10.1038/s43247-023-01096-7, 2023. a
Stevens, B., Giorgetta, M., Esch, M., Mauritsen, T., Crueger, T., Rast, S., Salzmann, M., Schmidt, H., Bader, J., Block, K., Brokopf, R., Fast, I., Kinne, S., Kornblueh, L., Lohmann, U., Pincus, R., Reichler, T., and Roeckner, E.: Atmospheric component of the MPI-M Earth system model: ECHAM6, J. Adv. Model. Earth Syst., 5, 146–172, https://doi.org/10.1002/jame.20015, 2013. a
Thompson, V., Coumou, D., Galfi, V. M., Happé, T., Kew, S., Pinto, I., Philip, S., de Vries, H., and van der Wiel, K.: Changing dynamics of Western European summertime cut-off lows: A case study of the July 2021 flood event, Atmos. Sci. Lett., 25, e1260, https://doi.org/10.1002/asl.1260, 2024. a, b
Thompson, V., Ermis, S., and Athanase, M.: The need for multi-method extreme event attribution, Weather, 81, 40–45, https://doi.org/10.1002/wea.7779, 2026. a, b
Trenberth, K. E., Fasullo, J. T., and Shepherd, T. G.: Attribution of climate extreme events, Nat. Clim. Change, 5, 725–730, https://doi.org/10.1038/nclimate2657, 2015. a, b, c, d
van Garderen, L. and León-FonFay, D.: The essential role of conditional attribution in understanding complex extreme weather, Nat. Commun., 17, 1539, https://doi.org/10.1038/s41467-026-69056-1, 2026. a
van Garderen, L., Feser, F., and Shepherd, T. G.: A methodology for attributing the role of climate change in extreme events: a global spectrally nudged storyline, Nat. Hazards Earth Syst. Sci., 21, 171–186, https://doi.org/10.5194/nhess-21-171-2021, 2021. a, b, c, d, e
Vautard, R., Yiou, P., Otto, F., Stott, P., Christidis, N., Van Oldenborgh, G. J., and Schaller, N.: Attribution of human-induced dynamical and thermodynamical contributions in extreme weather events, Environ. Res. Lett., 11, 114009, https://doi.org/10.1088/1748-9326/11/11/114009, 2016. a, b, c
Vautard, R., Cattiaux, J., Happé, T., Singh, J., Bonnet, R., Cassou, C., Coumou, D., D'andrea, F., Faranda, D., Fischer, E., Ribes, A., Sippel, S., and Yiou, P.: Heat extremes in Western Europe increasing faster than simulated due to atmospheric circulation trends, Nat. Commun., 14, 6803, https://doi.org/10.1038/s41467-023-42143-3, 2023. a, b, c
Vogel, M. M., Zscheischler, J., Wartenburger, R., Dee, D., and Seneviratne, S. I.: Concurrent 2018 hot extremes across Northern Hemisphere due to human-induced climate change, Earth's Future, 7, 692–703, https://doi.org/10.1029/2019EF001189, 2019. a
von Storch, H., Langenberg, H., and Feser, F.: A spectral nudging technique for dynamical downscaling purposes, Mon. Weather Rev., 128, 3664–3673, https://doi.org/10.1175/1520-0493(2000)128<3664:ASNTFD>2.0.CO;2, 2000. a
Wang, J., Chen, Y., Tett, S. F. B., Stone, D., Nie, J., Feng, J., Yan, Z., Zhai, P., and Ge, Q.: Storyline attribution of human influence on a record-breaking spatially compounding flood-heat event, Sci. Adv., 9, eadi2714, https://doi.org/10.1126/sciadv.adi2714, 2023. a
Wehrli, K., Hauser, M., and Seneviratne, S. I.: Storylines of the 2018 Northern Hemisphere heatwave at pre-industrial and higher global warming levels, Earth Syst. Dynam., 11, 855–873, https://doi.org/10.5194/esd-11-855-2020, 2020. a
Xoplaki, E., Ellsäßer, F., Grieger, J., Nissen, K. M., Pinto, J. G., Augenstein, M., Chen, T.-C., Feldmann, H., Friederichs, P., Gliksman, D., Goulier, L., Haustein, K., Heinke, J., Jach, L., Knutzen, F., Kollet, S., Luterbacher, J., Luther, N., Mohr, S., Mudersbach, C., Müller, C., Rousi, E., Simon, F., Suarez-Gutierrez, L., Szemkus, S., Vallejo-Bernal, S. M., Vlachopoulos, O., and Wolf, F.: Compound events in Germany in 2018: drivers and case studies, Nat. Hazards Earth Syst. Sci., 25, 541–564, https://doi.org/10.5194/nhess-25-541-2025, 2025. a
Ye, Y., Qian, C., Dai, A., Zhang, Y., Jiang, J., and Zhang, X.: Attribution of a record-breaking cold event in the historically warmest year of 2023 and assessing future risks, npj Clim. Atmos. Sci., 8, 14, https://doi.org/10.1038/s41612-024-00886-w, 2025. a
Yiou, P., Goubanova, K., Li, Z. X., and Nogaj, M.: Weather regime dependence of extreme value statistics for summer temperature and precipitation, Nonlin. Processes Geophys., 15, 365–378, https://doi.org/10.5194/npg-15-365-2008, 2008. a
Yiou, P., Jézéquel, A., Naveau, P., Otto, F. E. L., Vautard, R., and Vrac, M.: A statistical framework for conditional extreme event attribution, Adv. Stat. Clim. Meteorol. Oceanogr., 3, 17–31, https://doi.org/10.5194/ascmo-3-17-2017, 2017. a, b, c
Yiou, P., Cattiaux, J., Faranda, D., Kadygrov, N., Jézéquel, A., Naveau, P., Ribes, A., Robin, Y., Thao, S., van Oldenborgh, G. J., and Vrac, M.: Analyses of the Northern European summer heatwave of 2018, B. Am. Meteorol. Soc., 101, S35–S40, https://doi.org/10.1175/BAMS-D-19-0170.1, 2020. a, b, c, d
Zorita, E. and Von Storch, H.: The analog method as a simple statistical downscaling technique: comparison with more complicated methods, J. Climate, 12, 2474–2489, https://doi.org/10.1175/1520-0442(1999)012<2474:TAMAAS>2.0.CO;2, 1999. a, b
Zuo, J., Pullen, S., Palmer, J., Bennetts, H., Chileshe, N., and Ma, T.: Impacts of heat waves and corresponding measures: a review, J. Clean. Product., 92, 1–12, https://doi.org/10.1016/j.jclepro.2014.12.078, 2015. a