
the Creative Commons Attribution 4.0 License.
the Creative Commons Attribution 4.0 License.
 | 29 May 2026
The role of Rossby wave breaking in the formation and maintenance of tropical-extratropical cloud bands over the South Pacific
Andries Jan De Vries
Daniela I. V. Domeisen
Tropical-extratropical cloud bands are elongated cloud structures bridging tropical and midlatitude regions that act as a primary source of regional precipitation. While the role of Rossby wave breaking in the formation of cloud bands is established, the extent to which this dynamic forcing governs cloud band characteristics, their entire lifecycle, their spatial distribution and seasonality has not yet been systematically quantified. In this study, we apply an object-based approach to reanalysis data to investigate how stratospheric potential vorticity (PV) structures, as indicators of Rossby wave breaking, influence cloud band formation and persistence over the South Pacific region. Our climatological analysis confirms a robust statistical link in which cyclonic PV structures steer tropical moisture poleward and eastward, shaping the diagonal orientation of the cloud bands. We also find that cloud band duration is modulated by the properties of PV structures: long-lived cloud bands are distinguished by a systematically higher frequency of upstream PV structures and are sustained by persistent PV structures throughout their lifecycle, which favour a more zonal orientation of the cloud systems. Categorizing by cloud band duration reveals distinct seasonal regimes: while short-lived events occur year-round, persistent cloud bands are strictly confined to the austral warm season. Furthermore, long-lived cloud bands are associated with PV structures that reside significantly farther equatorward prior to genesis compared to those of short-lived events. These findings highlight that breaking Rossby waves create a tropospheric environment favouring not only the formation but also the maintenance of these cloud bands. Consequently, accurately representing Rossby wave dynamics in weather and climate models is critical for simulating cloud band characteristics and their influence on climate variability.
- Article
(9252 KB) - Full-text XML
- BibTeX
- EndNote


The South Pacific Convergence Zone (SPCZ) is the most prominent rain band in the Southern Hemisphere and a dominant feature of the global climate system. Together with the South Atlantic Convergence Zone (SACZ) and the South Indian Convergence Zone (SICZ), it forms one of the three primary diagonal convective bands in the Southern Hemisphere (Kodama, 1992; van der Wiel et al., 2015). Extending southeastward from the tropical western Pacific into the central subtropical Pacific, the SPCZ comprises a zonally orientated tropical component and a diagonally orientated subtropical segment (Vincent, 1994; Brown et al., 2020). Climatologically, the SPCZ represents the aggregation of recurring, synoptic-scale precipitating cloud bands. These cloud bands play a critical dual role in the regional hydroclimate. On one hand, they act as the primary freshwater source for many Pacific Island nations, supporting agriculture and local economies (Griffiths et al., 2003; Kumar et al., 2006). On the other hand, they are frequently associated with hydro-meteorological extremes; their variability – particularly when events become stationary or intense – is a primary driver of both droughts and devastating flooding (Lorrey et al., 2012; Brown et al., 2020; Sagero et al., 2024). Given the impact of these systems on the atmospheric and hydroclimatic conditions in the South Pacific, it is crucial to understand the dynamic factors governing not only their formation, lifetime, spatial and seasonal distribution but also their evolution and intensity.
The existence and position of the SPCZ are largely controlled by the distribution of sea surface temperatures and the zonal asymmetry of the atmospheric background flow (Takahashi and Battisti, 2007; Widlansky et al., 2011). This background state varies on intraseasonal to interannual timescales due to the influence of the MJO and ENSO (Matthews et al., 1996; Brown et al., 2020). Furthermore, the characteristic diagonal orientation of the SPCZ is shaped by the propagation of Rossby waves from the extratropics; idealized dynamical frameworks have demonstrated that these waves are refracted toward the equatorial westerly duct, a process that organizes convection into the distinct northwest–southeast tilt observed in the climatology (Matthews, 2012; van der Wiel et al., 2015, 2016). Consequently, the variability of the SPCZ, particularly in its southern extent, is strongly modulated by the breaking of these midlatitude Rossby waves and the resulting tropical–extratropical interactions (Kiladis, 1998; Allen et al., 2009; Niznik et al., 2015).
Rossby wave breaking (RWB) is dynamically defined by the rapid, irreversible overturning of potential vorticity (PV) contours on isentropic surfaces (McIntyre and Palmer, 1983). The specific morphology of this overturning – often referred to as anticyclonic and cyclonic, and equatorward and poleward wave breaking archetypes – exerts a strong influence on local jet streak dynamics and transverse circulations (Thorncroft et al., 1993; Peters and Waugh, 1996; Barnes et al., 2025). Although different archetypes provide valuable dynamic context, the present study focuses on the general presence of the dynamic forcing without distinguishing between these archetypes. Accordingly, we represent RWB by elongated intrusions of stratospheric high-PV air – known as PV streamers (Appenzeller and Davies, 1992) – that penetrate the tropical upper troposphere and may detach to form isolated PV cut-offs (Wernli and Sprenger, 2007). These PV intrusions destabilize the lower atmosphere and induce ascent, thereby facilitating deep convection (Funatsu and Waugh, 2008; Waugh and Funatsu, 2003; Allen et al., 2009). Simultaneously, the cyclonic circulation associated with PV intrusions transports tropical moisture poleward and eastward along their downstream flank, often contributing to the formation of atmospheric rivers and to the development of tropical–extratropical cloud bands (Knippertz and Martin, 2005; de Vries et al., 2018), particularly in regions of westerly flow (Knippertz, 2007; Stan et al., 2017).
Cloud bands resulting from such interactions – also referred to in the literature as tropical plumes – have been identified in various regions, including South America (Rosa et al., 2020; Zilli and Hart, 2021; Zilli et al., 2023), Southern Africa (Hart et al., 2013), northwestern Africa (Knippertz and Martin, 2005), Australia (Telcik and Pattiaratchi, 2014; Black et al., 2021), and the Middle East (Tubi and Dayan, 2014). Among these regions, the South Pacific stands out: global objective climatologies identify it as hosting the highest frequency and most spatially extensive tropical plumes on Earth (Fröhlich et al., 2013). Despite this prominence, the factors governing the lifecycle and duration of South Pacific cloud bands remain less characterized than those of their South Atlantic counterparts. For the SACZ, recent object-based studies have explicitly distinguished between transient and persistent events, demonstrating that long-lived cloud bands are actively sustained by amplified, recurrent Rossby wave trains (Zilli and Hart, 2021).
In the South Pacific, while the fundamental role of Rossby waves in organizing the diagonal SPCZ is established through case studies and idealized experiments (Kiladis, 1998; Knippertz, 2007; van der Wiel et al., 2015, 2016), and its broad variability is well-documented (Brown et al., 2020), the specific dependency of cloud band lifetime on the properties of upstream wave forcing remains unquantified. Most existing climatological assessments rely on instantaneous co-occurrence statistics or fixed-grid analyses (e.g., Kiladis, 1998; Fröhlich et al., 2013; Brown et al., 2020), leaving the coupled lifecycle evolution of these systems unresolved. Consequently, it remains an open question whether the lifetime of these cloud bands is primarily dictated by the large-scale background flow, or if it is actively modulated by the properties of the triggering PV intrusions, such as their vertical depth and meridional extent.
To address this gap, we quantify the climatological statistics of the coupling between PV intrusions and cloud bands in the South Pacific and characterize their spatial and temporal variability. Furthermore, we hypothesize that the duration of these cloud bands is influenced by the properties of their dynamic drivers; for instance, that sustained and vertically extensive (deep) PV structures provide a more favourable environment for moisture transport and enhanced convection, thereby supporting longer-lived cloud bands. To test this hypothesis, we employ a cloud band tracking algorithm to follow events through their full lifecycle. This object-based approach allows for a robust climatological analysis of the connection between cloud band events and their dynamic drivers, providing insights into the drivers of cloudiness over the SPCZ.
We use the ERA5 global reanalysis dataset (Hersbach et al., 2020) from the European Centre for Medium-Range Weather Forecasts (ECMWF) for the period 1979–2021, on a 0.5° regular grid, to identify cloud bands and PV structures. Specifically, we use outgoing longwave radiation (OLR), geopotential height at 500 hPa (Z500), vertical velocity (ω), and potential vorticity (PV). The three-dimensional fields are extracted at 100 hPa intervals between 800 and 300 hPa, and at 50 hPa intervals above 300 hPa and below 800 hPa. For PV structures and their identification, see Sect. 2.2.
2.1 Identification and Tracking of Tropical-Extratropical Cloud Bands and PV Structures
2.1.1 Identification of Cloud Bands
Tropical-extratropical cloud bands in the South Pacific are identified using the detection algorithm of Pilon and Domeisen (2024), which applies an image segmentation approach to OLR fields using a threshold of 210 W m−2. Contiguous regions with OLR values below this threshold are defined as distinct cloud objects. To isolate tropical-extratropical interactions, the algorithm filters for objects satisfying specific geometric criteria: cloud bands must cross 23.5° north or south, must exhibit a diagonal orientation and extend from tropical latitudes (equatorward of 20° S) into the mid-latitudes (poleward of 27° S).
The detection is restricted to a domain encompassing the SPCZ (130° E–70° W, 5° N–50° S). This spatial constraint is critical to minimize the identification of artefacts; otherwise, the algorithm risks erroneously merging the SPCZ with the intertropical convergence zone or with mid-latitude cold clouds, resulting in the false detection of extensive cloud bands (Pilon and Domeisen, 2024). For this study, the detection is performed on daily mean OLR fields derived from the 3-hourly ERA5 data. This temporal averaging acts as a smoothing procedure that improves the connectivity between low-OLR regions, thereby preventing the over-segmentation of cloud systems.
2.1.2 Spatio-temporal Tracking of Cloud Bands
To facilitate the climatological analysis of transient cloud bands and their precursors, an event-based tracking algorithm is developed. This approach extends the daily detection and frame-to-frame inheritance tracking of Pilon and Domeisen (2024). This framework allows us to perform composite analyses centred on specific lifecycle stages (e.g., genesis) and quantify event characteristics, such as duration, for correlation with upstream PV structures.
The genesis of a new cloud band event is defined when a cloud band is detected at a time t without a spatially overlapping structure at the previous time step (t−1). Temporal continuity is maintained when a cloud band corresponds to a single antecedent structure that, in turn, evolves into only that single subsequent structure. When a single cloud band at a time t is found to have spatial overlap with multiple distinct antecedent structures at a day t−1 (as it can occur when a tropical moisture plume and a mid-latitude front merge), the cloud band inherits the event identification of the oldest (longest-lived) antecedent event. Conversely, when a single antecedent structure evolves into multiple distinct cloud bands – for instance, when cloud systems associated with a front detach from the tropical part of the SPCZ – this defines the end of the event. This criterion is critical for isolating coherent structures, as each resulting structure subsequently initiates a new, independent event, thereby avoiding the ambiguity of defining a single entity through complex evolutions.
This event-based framework yields a dataset of discrete cloud band events, each with a defined genesis, end, and duration.
2.1.3 Categorization of Cloud Band Duration
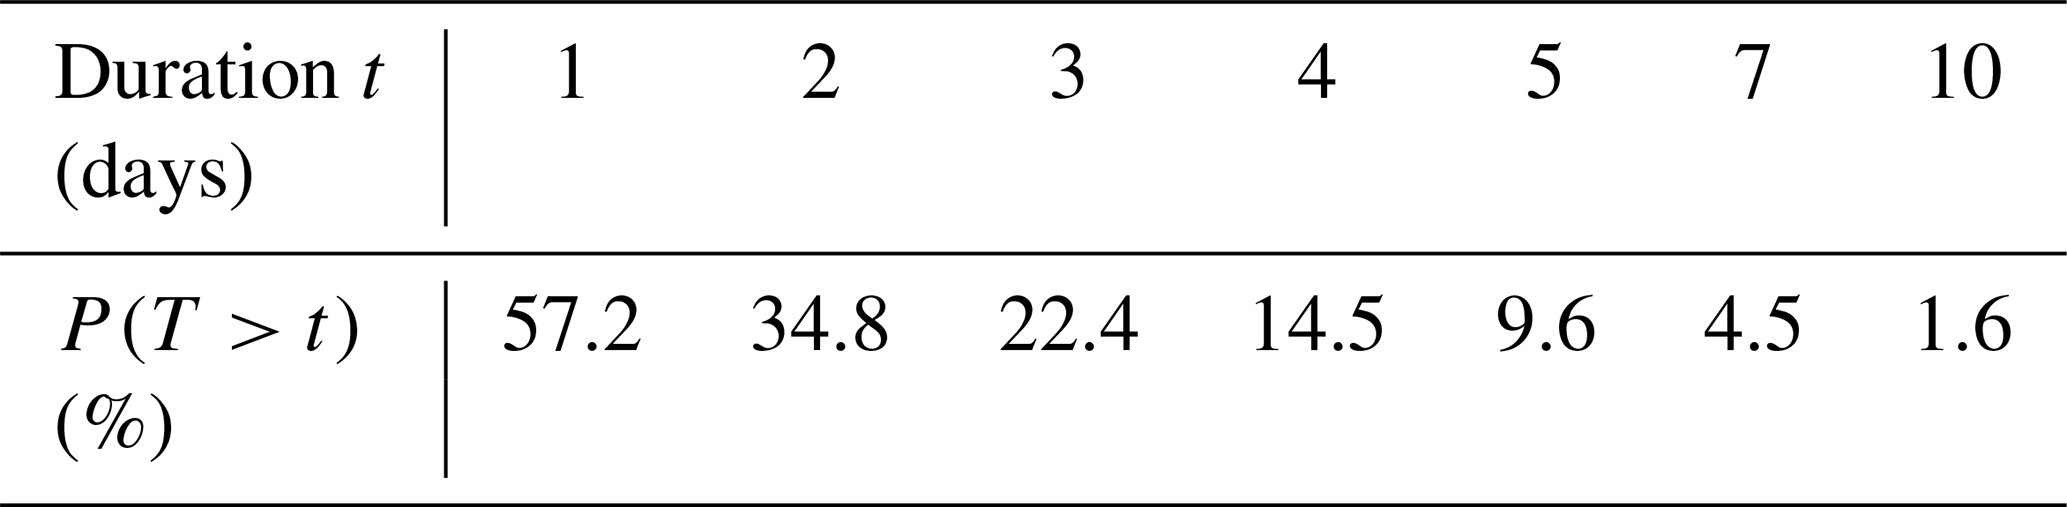
Based on the tracking output, the duration T of a cloud band event is defined as the number of consecutive days between its genesis and end. To characterize the typical lifecycles of these systems, we compute the empirical survival function, which estimates the probability that a cloud band's duration T exceeds a specific number of t days. For a total population of N events, this is calculated as:
where di is the duration of the i-th event and 𝟙(⋅) is the indicator function (taking the value of 1 if the condition is met and 0 otherwise). Table 1 presents these survival probabilities for the 1979–2021 period. The distribution is highly skewed towards short-duration events; approximately 42 % of cloud bands last for only 1 d, and only 10 % persist for longer than 5 d.
To differentiate the dynamic environments driving these lifecycles, we stratify cloud bands into three categories based on these survival probabilities: transient (1–2 d; representing ∼65 % of the population), “transitional” (3 d), and long-lived (≥4 d; representing the top ∼15 % of lifetime). This 4 d threshold for persistence is consistent with the methodology used for South American cloud bands by Zilli and Hart (2021). As the 3 d events represent a transition zone with mixed dynamic characteristics, the following comparative analysis focuses on the contrast between the distinct transient and persistent regimes.
Table 1Empirical survival probabilities for cloud band lifetimes for the period 1979–2021. The values indicate the percentage of events with a duration (T) strictly exceeding t days.
2.2 Identification of Stratospheric Potential Vorticity Structures
We use PV structures as indicators of Rossby wave breaking using the algorithm of de Vries et al. (2018, 2024), adapted from Wernli and Sprenger (2007). PV is computed from 6-hourly data on ERA5 model levels and then linearly interpolated onto isentropic levels between 275 and 360 K at 5 K intervals. The method uses 2 potential vorticity unit (PVU; where K kg−1 m2 s−1) contours, representing the dynamical tropopause, which separates stratospheric and tropospheric air masses, to identify PV streamers and cut-off lows, hereafter referred to as PV structures. Here, we only use stratospheric PV structures with . To ensure temporal consistency with the cloud band dataset, we aggregate these 6-hourly PV features onto a daily timescale. Furthermore, we specifically define “deep PV structures” as grid points having PV structures for at least three consecutive time steps (i.e., 18 h) and spanning at least two isentropic levels. These deep PV structures are illustrated in Fig. 1 as the number of isentropic levels with such detected features.
2.3 Connection Between PV Structures and Cloud Bands
2.3.1 Collocation Methodology
To quantify how many cloud bands are associated with PV structures and to assess their spatial relationship, we use a collocation method based on the geometrical bounding boxes and centroids (which are here the weighted centre of mass) of both features (details are provided in Appendix A1). Both cloud bands and PV structures are analysed on a daily timescale. To prevent over-attribution of cloud bands to PV structures, given their relatively high frequency and large spatial extents, we select only the deep PV structures defined in Sect. 2.2 (i.e., those that are both sufficiently deep and persistent). A cloud band is considered connected to a deep PV structure if their bounding boxes overlap and the centroid of the PV structure lies south-west of the cloud band's diagonal transect (Fig. A1). This geometric constraint is applied to capture the specific dynamical configuration of tropical-extratropical interactions, in which the forcing upper-level trough is positioned at the upstream flank of the cloud band. This geometric constraint is deliberately applied to capture the specific dynamical configuration of tropical-extratropical interactions, in which the upper-level trough is positioned at the upstream flank of the cloud band (e.g., Kiladis, 1998; Knippertz, 2007).
2.3.2 Composite Analysis
To characterize atmospheric conditions throughout the cloud band lifecycle, we construct spatial composites within a 6000 km × 6000 km domain. Depending on the specific analysis, we employ two distinct spatial reference frames. Firstly, to evaluate the local atmospheric evolution in relation to the onset location (see Figs. 3 and 4), a static reference frame is employed in which the composite domain remains fixed in space to the centroid of the cloud band at the time of formation (day 0) for all lags. This analysis focuses on PV structure depth (defined as the mean number of isentropic levels with PV structures), OLR, integrated water vapour transport (IVT), and anomalies of Z500. Secondly, we use a dynamic reference frame where the composite domain follows the tracked cloud band centroid to evaluate the spatial co-evolution of the dynamic environment alongside the system (see Figs. 7 and 8). These tracked composites focus on absolute PV depth anomalies and the relative frequency of cloud band occurrence. For both composite types, anomalies are computed relative to a long-term (1979–2021) climatology based on a 21 d running mean of daily averages to remove the seasonal cycle, following the methodology of Hart and Grumm (2001) and de Vries et al. (2016).
For the quantitative analysis of upstream PV structures (and the creation of lagged time series), we define a dynamic “upstream sector”. This sector is defined as the triangular area to the southwest of the cloud band, bounded by its geometric bounding box and the feature's major axis (Fig. A1). This adaptive-area approach is designed to select PV structures located near the cloud band's genesis region and poleward flank, filtering out far-upstream mid-latitude signals. For lagged analyses centred on the time of event genesis (t=0), this upstream sector is fixed relative to the genesis location for all negative lags (t≤0) and follows the tracked cloud band centroid for all positive lags (t>0). Furthermore, uncertainty in these lagged composite time series (see Sect. 3.6.1) is quantified using 95 % confidence intervals. The Wilson score interval is applied to the binomial occurrence frequency of upstream PV structures. For the median values of the PV vertical depth and latitudinal position, confidence intervals are estimated via non-parametric bootstrap resampling. Finally, in Sect. 3.6.1, we evaluate the mean orientation of cloud bands to assess structural differences between cloud bands of different lifetimes. The statistical significance of the difference in mean orientation between the different cloud band categories is calculated at each lag using a two-tailed Welch's t-test to account for the unequal variances and sample sizes.
2.3.3 Significance Testing
To assess the statistical significance of cloud band–PV connections, we perform a Monte Carlo (MC)-based significance test. We generate 5000 randomized datasets by shuffling the positions of deep PV structures in time, using random dates throughout the year without maintaining seasonality (e.g., a cloud band from October could be associated with a PV structure from May). For each MC simulation and for each grid point, we compute the fraction of cloud bands that are connected to randomized deep PV structures. We then calculate p-values as the fraction of MC simulations where the simulated connection is greater than or equal to the observed connection. A grid point is considered statistically significant if its p-value is below 0.05, indicating that the observed connection between a deep PV structure and a cloud band is unlikely to have occurred by chance.
3.1 Case studies
We first present two case studies over the South Pacific, shown in Fig. 1, to demonstrate the connection between cloud bands and PV intrusion. In both cases, the cloud bands exhibit the typical northwest–southeast tilt characteristic of tropical-extratropical interactions in this region. The first case study (Fig. 1a–d) illustrates a cloud band event over the South Pacific in January 2017, coinciding with flooding in Tahiti that had notable societal impacts. According to the EM-DAT international disaster database (Delforge et al., 2024), this event affected 5000 people and caused USD 2.559 million in damages. On 20 January, a PV cut-off is present around 30° S, 150° W, and is joined the following day by PV streamers intruding into the central South Pacific, coincident with the cloud band extending poleward. These PV streamers subsequently transform into a PV cut-off (around 35° S–150° W), associated with the further poleward elongation of the cloud band (Fig. 1c–d). This evolution is consistent with the dynamics of tropical plumes induced by upper-level troughs described by Knippertz (2007).
A second example illustrates a different interaction between PV structures and cloud bands. The case study from February 2021 (Fig. 1e–h) features a long cloud band exhibiting two sections: one zonally orientated in the tropics and the other diagonally orientated in the subtropics (Fig. 1e–f). On 27 February, the cloud band split into two segments, influenced by two co-occurring PV structures, separated by approximately 60° of longitude (located at approximately (30° S, 180° and 35° S, 120° W). This splitting, driven by multiple PV intrusions and the resulting spatial separation between cloud structures, aligns with the interaction dynamics described by Kiladis and Weickmann (1992).
In both cases, PV structures are located to the west of tropical-extratropical cloud bands. This westward offset of PV structures relative to cloud bands is typical of the interactions observed in these events, where PV intrusions precede the development of tropical-extratropical cloud bands (Knippertz, 2007) and contribute to their diagonal orientation.
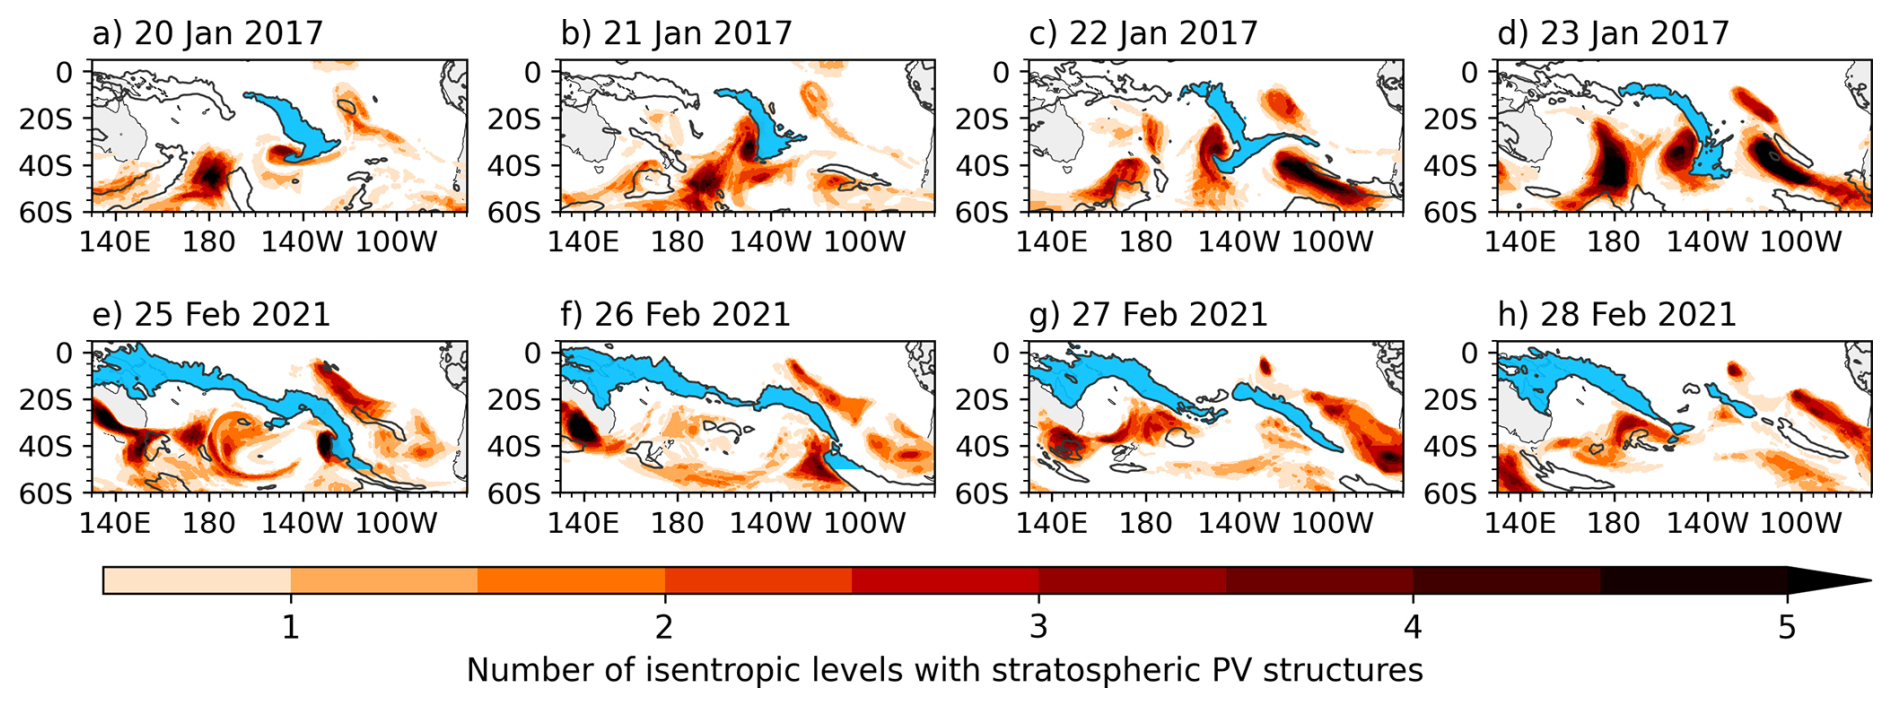
Figure 1Daily snapshots of identified tropical-extratropical cloud bands (blue shading), daily mean of OLR at 210 W m−2 (black contour), and daily mean number of isentropic levels with stratospheric PV streamers and cut-offs (red shading) over the South Pacific for two distinct events: (a)–(d) 20–23 January 2017, (e)–(h) 25–28 February 2021.
3.2 Climatologies
As a next step, to generalize beyond the case studies, we present the climatology of cloud bands and deep PV structures over the South Pacific from 1979 to 2021. Figure 2a presents the independent climatology of CBs and PV structures. The spatial distribution of cloud bands mirrors the SPCZ, being primarily concentrated in the central Pacific with a characteristic northwest–southeast orientation. This pattern resembles the climatology of tropical plumes described by Fröhlich et al. (2013). To the south, the frequency of PV structures exhibits a distinct meridional gradient, with occurrences increasing towards the extratropics. This aligns with the previously demonstrated climatology of RWB, with the highest frequency occurrences in the extratropics, reducing towards lower latitudes (Portmann et al., 2021; de Vries et al., 2024). This figure also illustrates PV structures extending further into the tropics in the eastern Pacific, where westerly ducts are located. Westerly ducts facilitate interactions between extratropical westerlies and tropical flows, allowing Rossby waves to penetrate deeper into tropical latitudes (Webster and Holton, 1982; Waugh and Polvani, 2000; Knippertz, 2007; Fröhlich and Knippertz, 2008). Throughout the seasonal cycle, the occurrence of cloud bands aligns with the latitudinal migration of PV structures (Fig. 2b), peaking when high PV structure frequencies extend equatorward during austral summer and autumn, consistent with the findings of Portmann et al. (2021). This alignment suggests that PV structures reaching farthest equatorward during the austral summer may facilitate interactions with tropical-extratropical cloud bands.
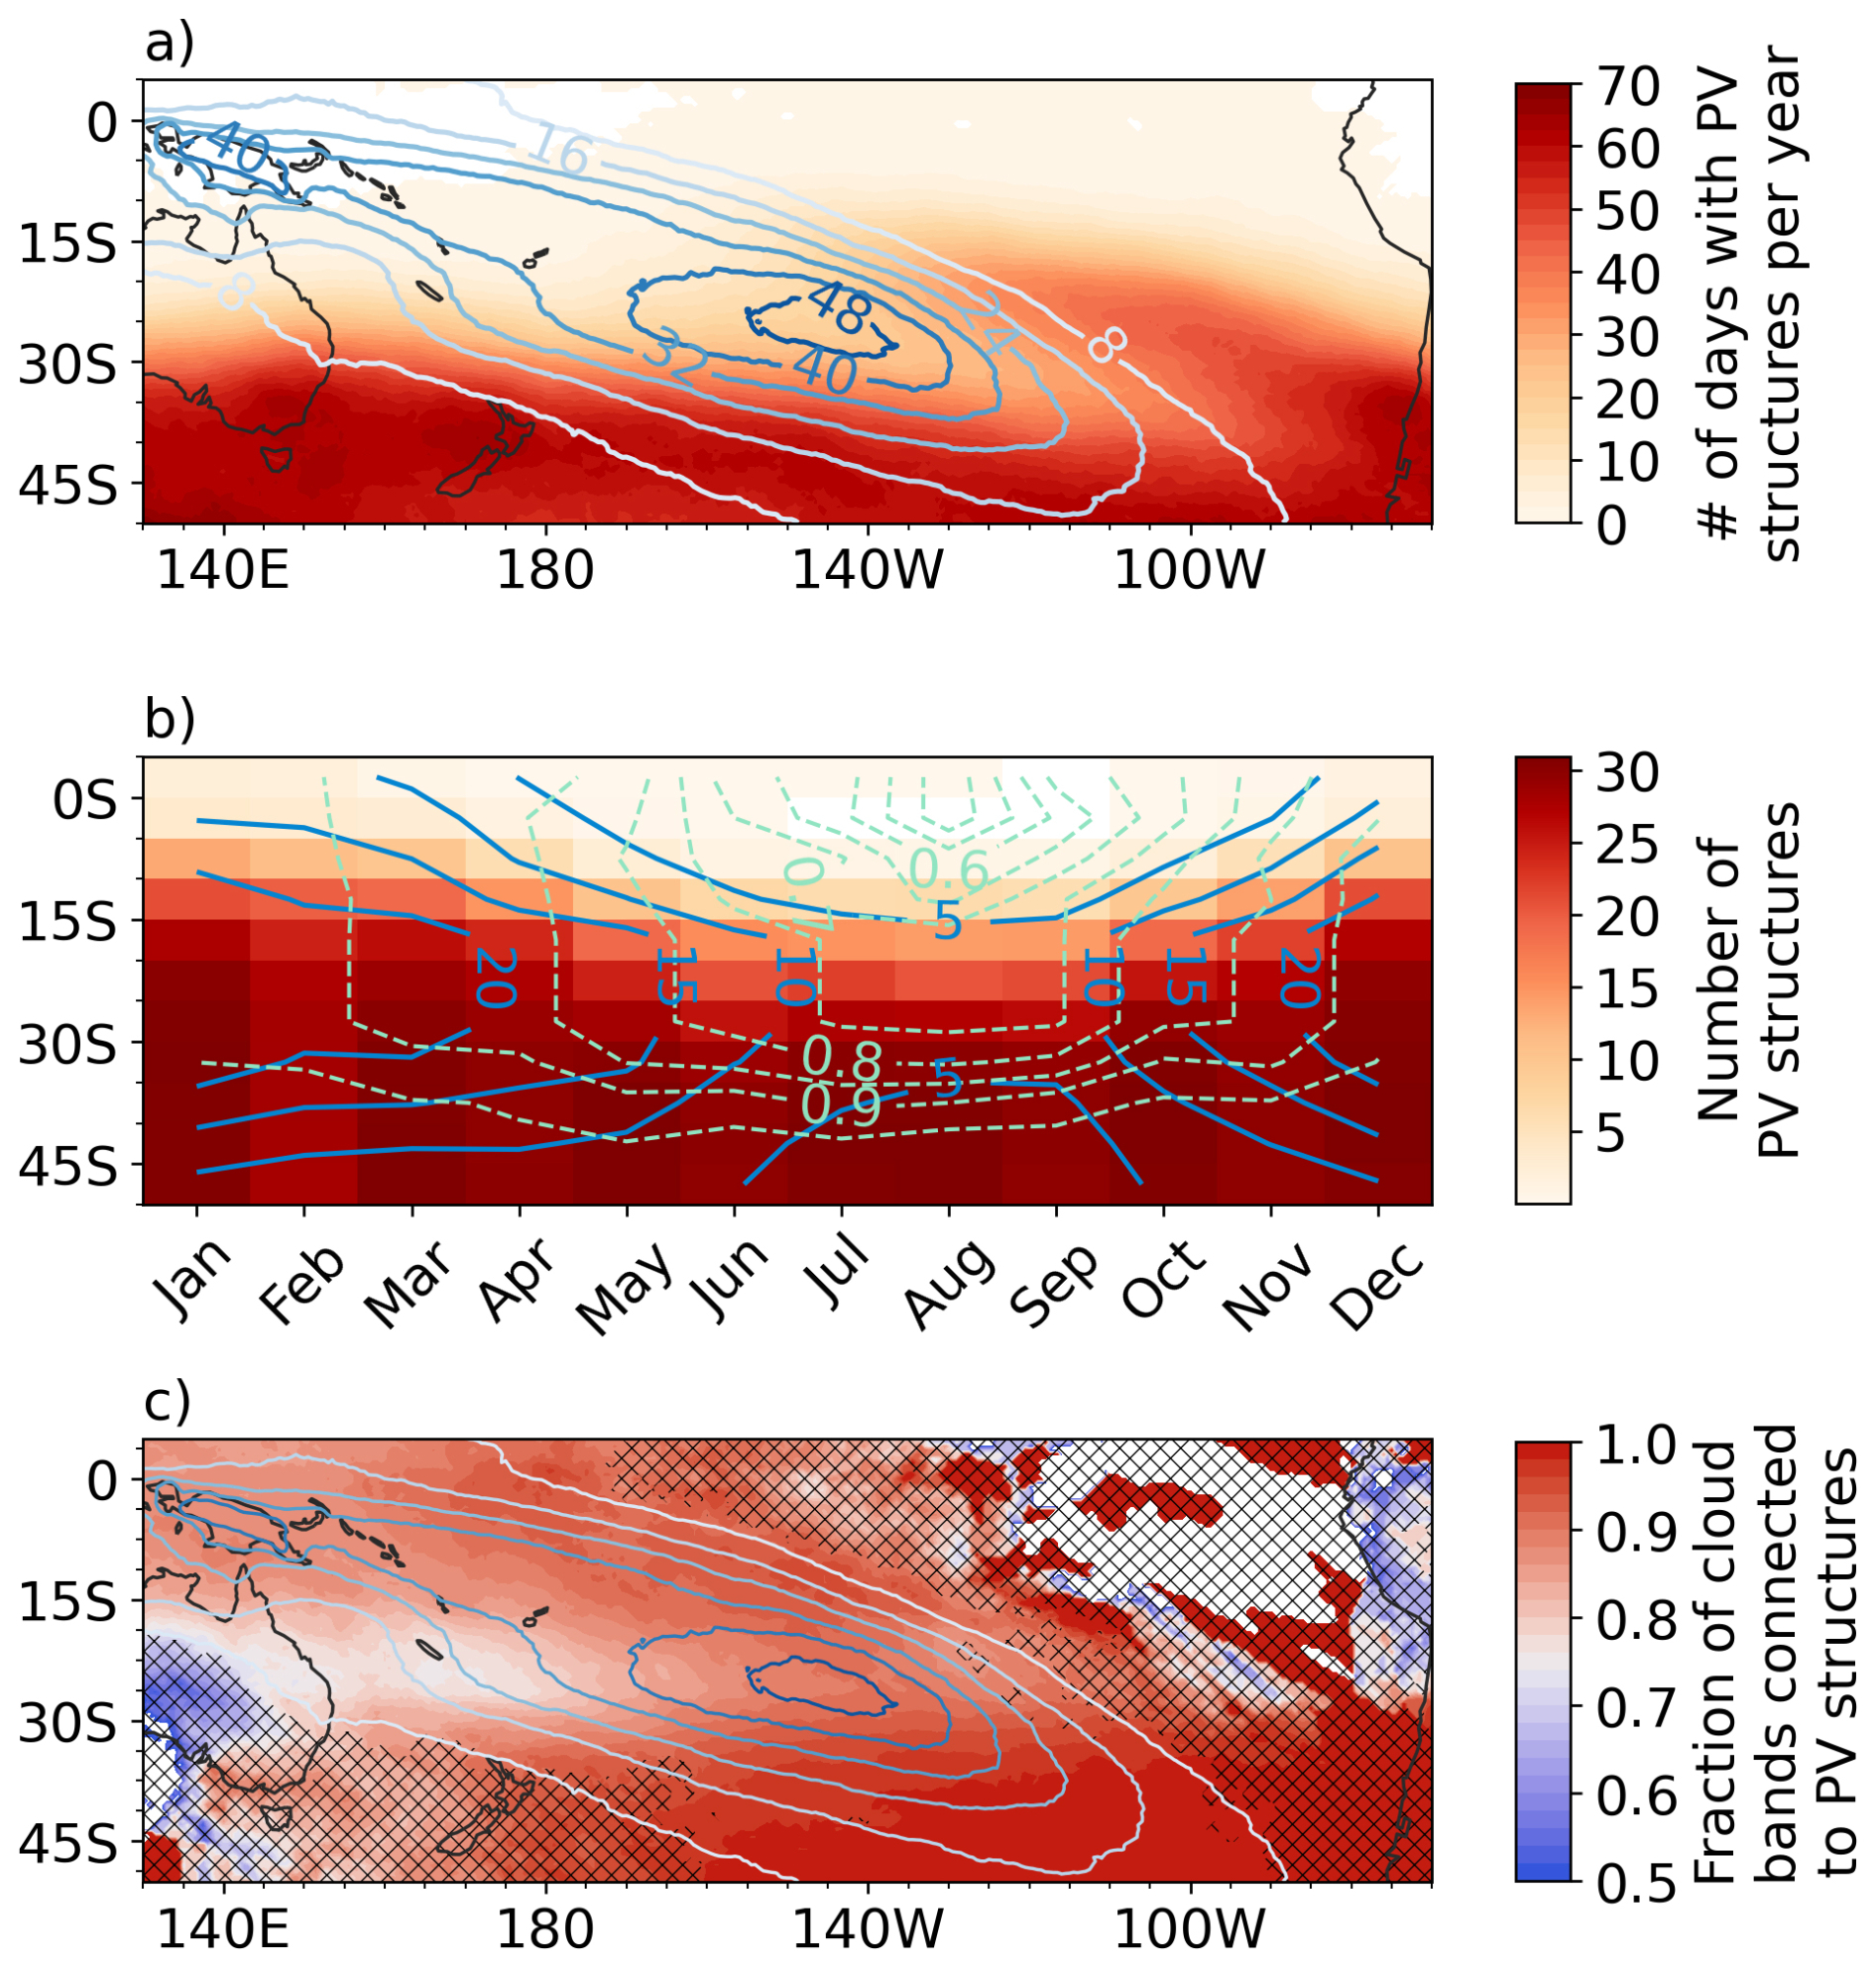
Figure 2Climatologies of cloud bands and deep PV structures averaged between 1979 and 2021 across the South Pacific. (a) Annual average frequency of PV structures (shading) and cloud bands (contours) in days per year. The contours represent the average number of days with cloud bands per year during the same period (representing local spatial density). (b) Seasonal cycle as a function of latitude, where PV structures (shading) and cloud bands (solid contours) are integrated zonally across the domain and expressed as the average number of occurrences per month. The dashed contours show the fraction of cloud bands connected to deep PV structures (interval: 0.1). (c) Annual average fraction of cloud bands connected to deep PV structures; when 0 % of cloud bands are linked to PV structures, values are masked out (white shading). Hatching indicates areas where the 5 % significance level is not met, according to a Monte Carlo test. Contours are the same as in panel (a).
To quantify the broader linkage between PV structures and cloud bands, we analyse their spatial collocation, as defined in Sect. 2.3. The spatial relationship between these features is shown in Fig. 2c, which displays the average fraction of cloud bands connected to deep PV structures. The strongest connection and significant fractions are primarily observed in the central and eastern mid-latitudes of the basin, as well as in the western and central tropical Pacific. High fractions can also be found in the eastern tropical Pacific, but are not statistically significant due to the rare occurrence of cloud bands in this part of the ocean basin. The statistical significance test confirms that the region of robust connections aligns with the SPCZ and extends into the midlatitudes, highlighting the prevalence of tropical-extratropical interactions in the South Pacific.
3.3 Atmospheric Processes Contributing To Cloud Band Formation
While the fundamental mechanisms of tropical-extratropical interactions are established (e.g., Kiladis, 1998; Funatsu and Waugh, 2008), we first characterize the synoptic evolution specifically within our object-based framework to first validate that our tracking algorithm successfully captures the coherent physical coupling between Rossby wave breaking and convection described in the literature, and second, it defines the dynamical baseline required to understand the cloud band lifecycles discussed in the next section.
Figure 3 illustrates time-lagged composites of the synoptic environment centred on the cloud band onset (day 0). The composites (panels a–c) display the spatial distribution of PV structure depth, Z500 anomalies, OLR, and IVT for all cloud bands of the period. At day −2, an amplifying upper-level trough appears to the west of the future cloud band centroid, indicated by negative Z500 anomalies (dashed contours) and increased PV structure frequency. At this precursor stage, moisture transport (IVT) is dominated by the background easterly trade wind regime, and OLR values remain relatively high at the composite centre. By day 0, the interaction matures. The PV structure deepens and shifts to the south-west of the region of deep convection (low OLR). The PV dipole (high and low PV depths) is tilted northwest–southeast, matching the cloud band orientation. This configuration is consistent with anticyclonic RWB. In the region downstream of increased PV structure frequencies, moisture transport is steered in a poleward and eastward direction, consistent with the cyclonic circulation anomaly that is induced by cyclonic PV anomalies. By day +2, the dynamic forcing wanes: the PV structure becomes thinner, and the upstream trough fills (weakening Z500 anomalies), accompanied by a decrease in poleward moisture transport and the dissipation of the cloud band.
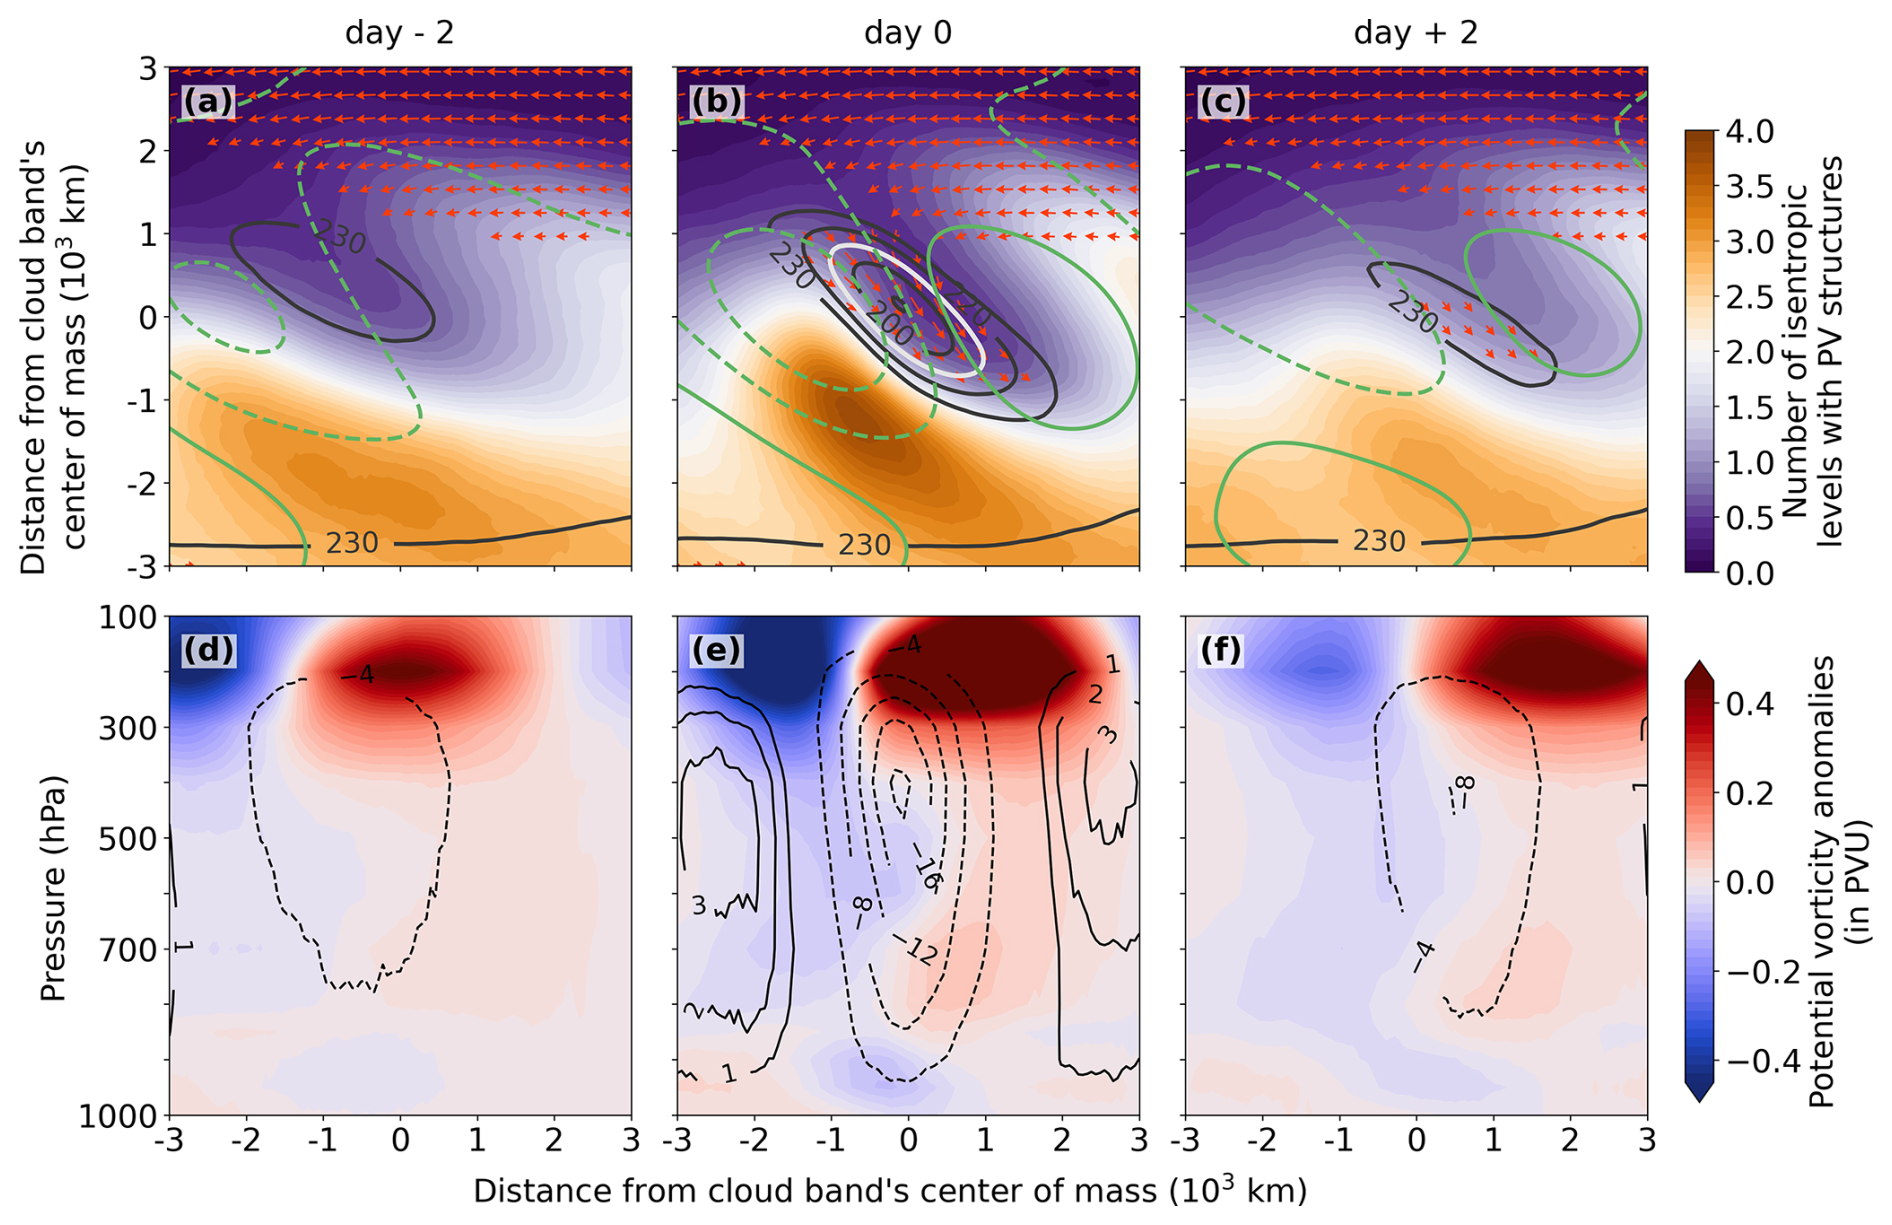
Figure 3Time-lagged composites for the period 1979–2021, spatially fixed to the cloud band centroid at genesis (day 0). All lead and lag panels (a, c, d, f) display the atmospheric conditions relative to this static genesis location. Panels (a)–(c) show the daily mean of the vertical sum of isentropic levels with stratospheric PV structures (shading), OLR (solid black contours, in W m−2), normalized 500 hPa geopotential height anomalies (green contours; dashed for negative and solid for positive values; increment of 0.2 standard deviations, zero line omitted), and IVT (red arrows). IVT vectors are derived from their zonal and meridional components and are only displayed for magnitude values exceeding 150 kg m−1 s−1. The white contour in panel (b) represents the 210 W m−2 cloud band detection threshold. Panels (d)–(f) show vertical–meridional cross-sections through the cloud band centroid, displaying vertical velocity ω (solid contours for positive values corresponding to descent, dashed contours for negative values corresponding to ascent, in 10−2 Pa s−1) and PV anomalies (shading, in PVU). Positive distances from cloud bands refer to positions north of the cloud band's centroid.
To examine the vertical structure of these interactions, we create vertical–meridional cross-sections of PV anomalies and vertical velocity (ω) centred on the centroid of cloud bands at lead and lag times relative to their onset (Fig. 3d–f). The composites reveal a strengthening dipole in the upper troposphere and lower stratosphere (300–100 hPa). A cyclonic PV anomaly (negative values, blue shading) extends into the upper troposphere poleward of the cloud band centre, while an anticyclonic anomaly (positive values, red shading) is positioned equatorward. From day −2 to day 0, this dipole intensifies. At onset (day 0), strong ascent (negative ω) is centred on the cloud band, located downstream of the cyclonic PV anomaly and along the poleward edge of the anticyclonic anomaly. This configuration is consistent with quasi-geostrophic forcing, where upper-level cyclonic PV anomalies destabilize the lower troposphere and induce upward motion ahead of the intrusion (Kiladis, 1998; Funatsu and Waugh, 2008). This structure highlights the influence of convective heating on the vertical PV distribution (Murthy and Boos, 2019): diabatic heating leads to the local destruction of PV above the heating maximum, creating or enhancing the anticyclonic anomaly (Oertel et al., 2020).
Our findings are consistent with the vorticity budget analysis of van der Wiel et al. (2015). They demonstrated that latent heat release within the SPCZ forces strong upper-tropospheric divergence, generating an anticyclonic vorticity tendency driven by this upper-level outflow. This tendency counteracts the incoming cyclonic anomaly, acting as a negative feedback which typically dissipates the transient wave. Validating this dissipation mechanism bridges the gap between the formation and evolution of these cloud bands. This suggests that the duration of persistent events is not driven by a local positive feedback loop, but is instead dynamically regulated by the interplay between synoptic forcing and local diabatic damping. Specifically, a cloud band will persist only if there is sufficient sustained extratropical forcing upstream to continuously overcome the negative feedback induced by convection.
3.4 Synoptic Controls on Cloud Band Duration
To characterize the factors influencing cloud band duration, we compare the synoptic evolution of short-lived (≤2 d) and long-lived (≥4 d) events (Fig. 4). Both the horizontal synoptic evolution and the vertical cross-sections reveal distinct differences in how the upstream forcing initiates and sustains these systems. Differences are evident as early as the precursor stage (day −2). Long-lived events are associated with existing cloudiness and an upstream trough (Fig. 4d). This finding is corroborated by the vertical cross-sections, which show that ascending motion is already established prior to genesis (Fig. 4j). In contrast, short-lived events show no precursor cloud signals and a weaker horizontal synoptic signature (Fig. 4a).
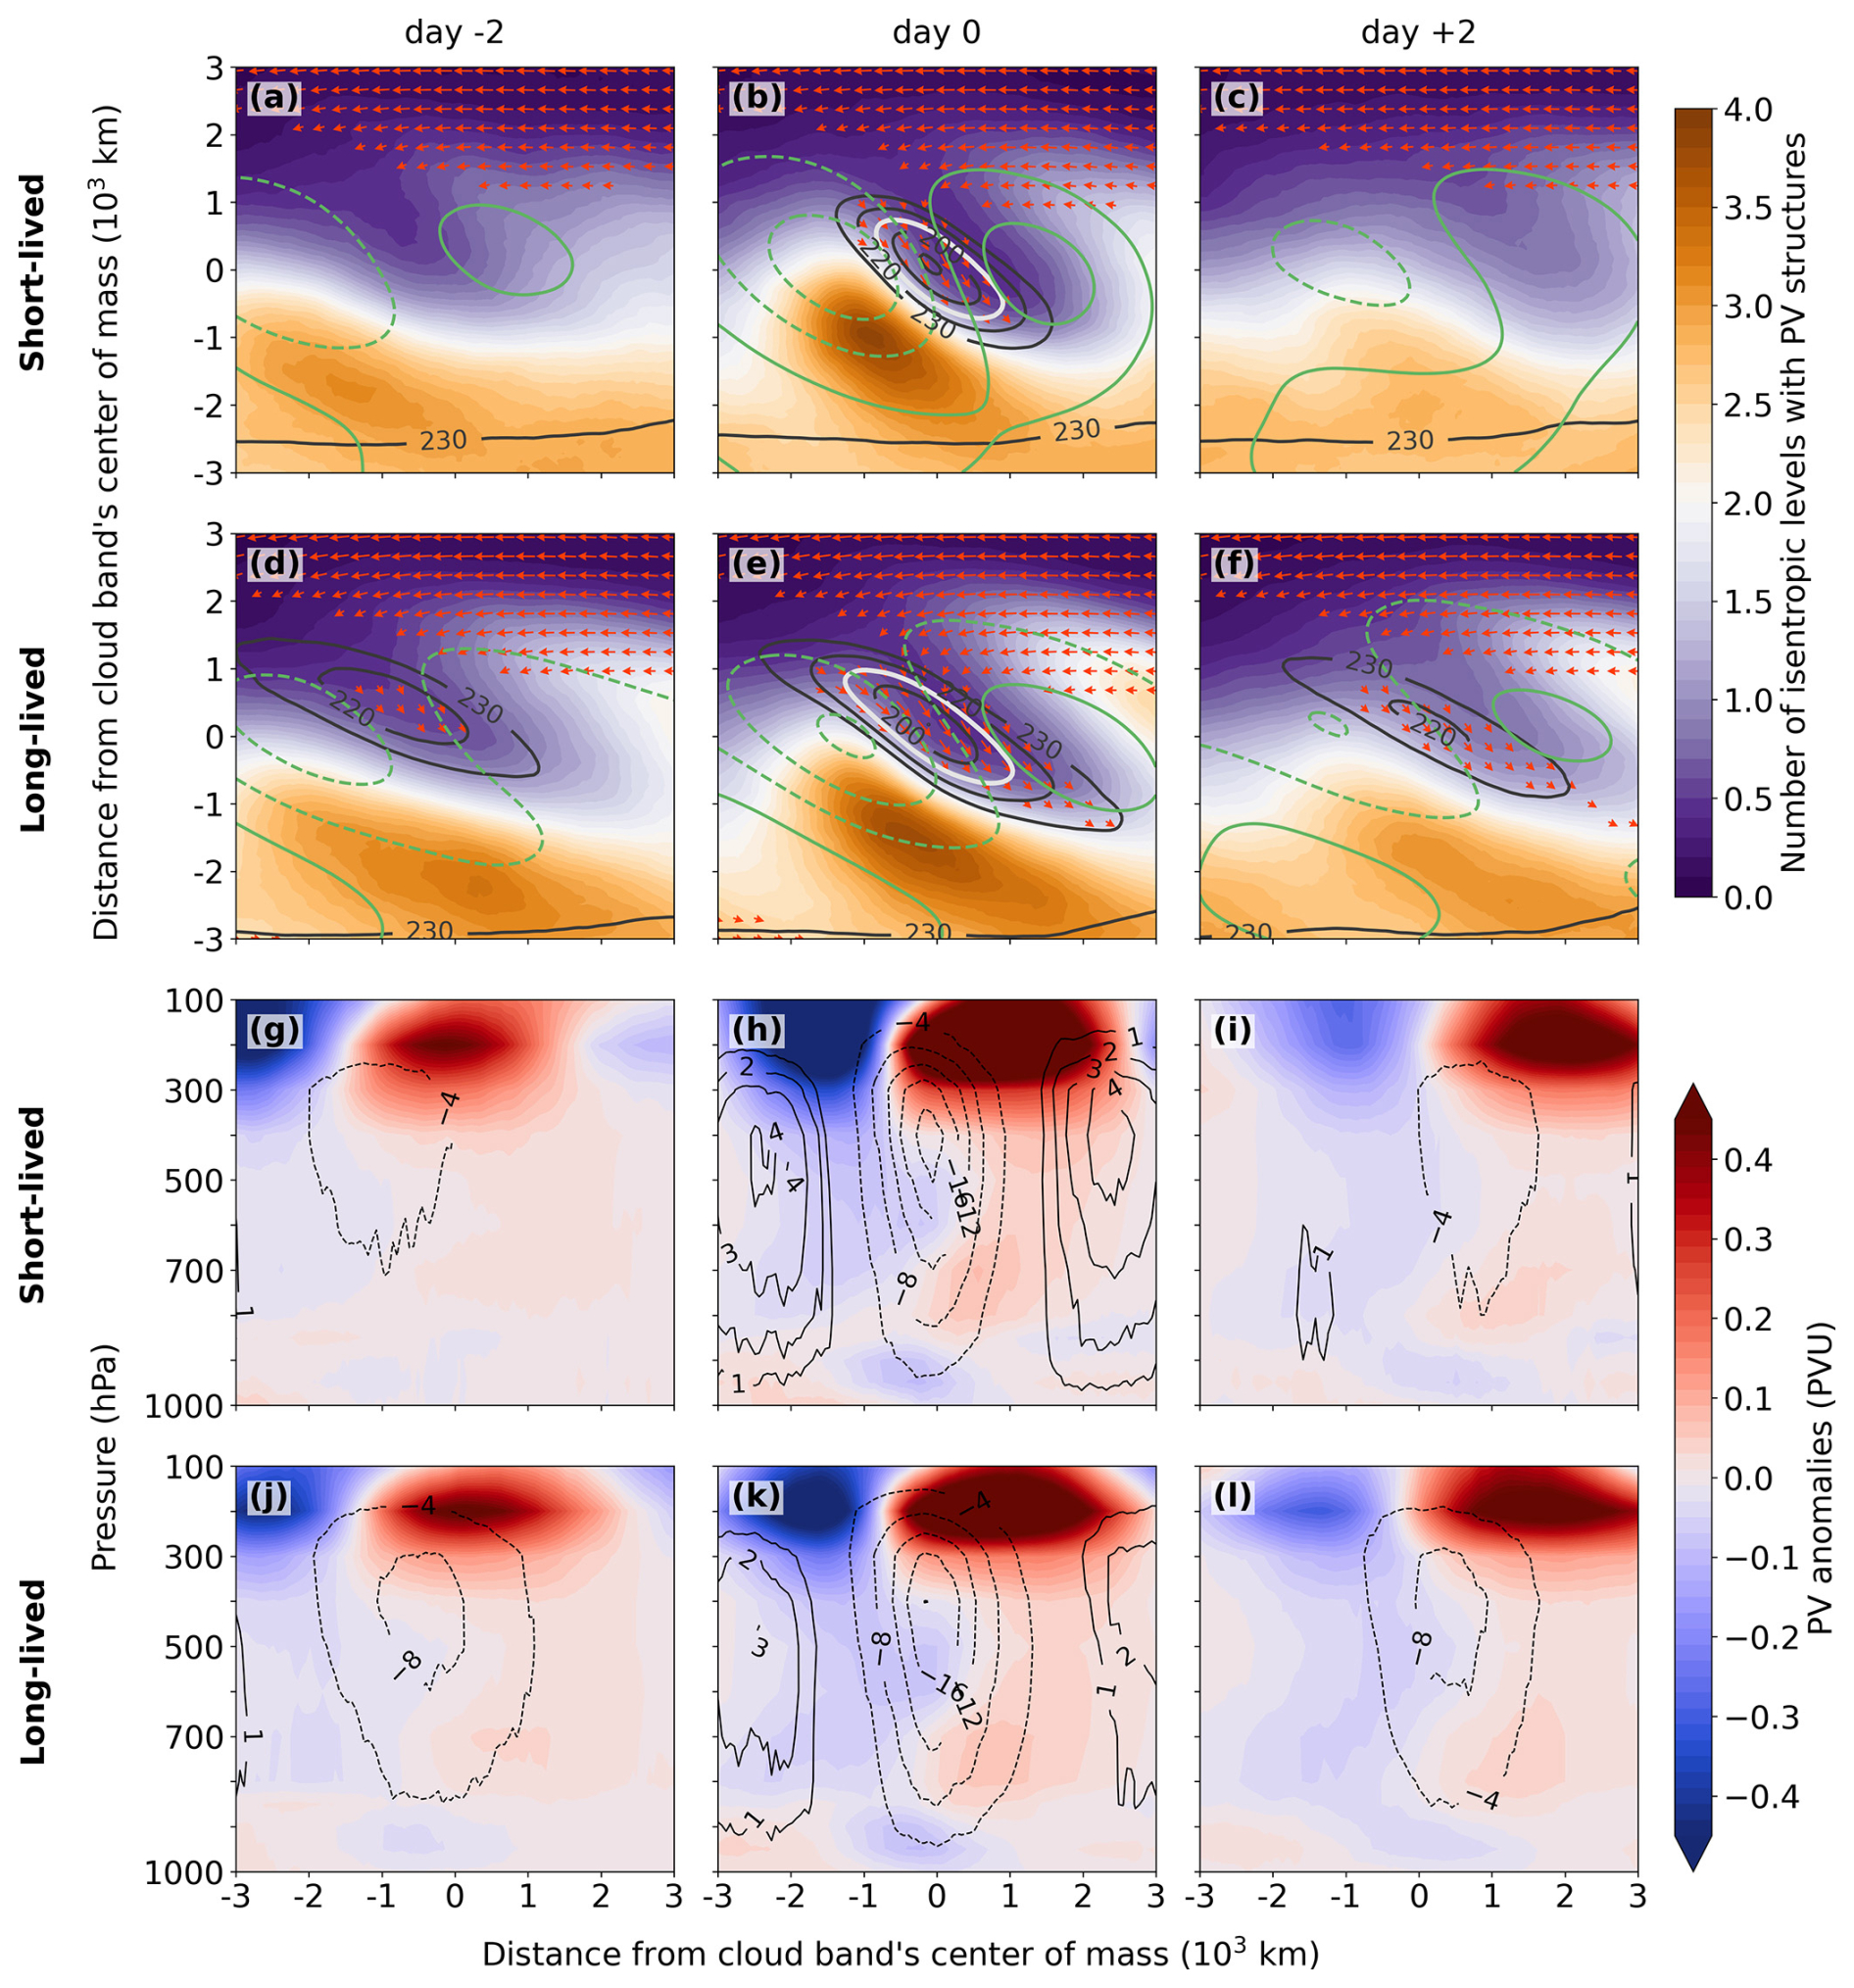
Figure 4Same as Fig. 3a–c but stratified by cloud band duration. (a)–(c) and (g)–(i): short-lived cloud bands (duration 1–2 d), and (d)–(f) and (j)–(l): long-lived cloud bands (duration ≥4 d).
At onset (day 0), the contrast amplifies: long-lived events are supported by a broad, intense upstream trough, indicated by large negative Z500 anomalies and coherent anomalies in PV structure frequencies. In contrast, short-lived events are flanked by a stronger downstream ridge (positive Z500 anomalies), which confines the cloud bands spatially. Vertically, short-lived events exhibit a slightly stronger central ascending motion flanked by more pronounced descending motion (Fig. 4h).
By day +2, the dynamic forcing decays for short-duration cloud bands, evident from the dissipation of the anomalous PV structure frequencies (Fig. 4c). The maintenance of a positive Z500 anomaly to the northeast of cloud bands suggests that the eastward propagation of the system is hindered by downstream ridging. Conversely, long-lived events display deeper and more consistent anomalous PV structure frequencies than short-lived events (Fig. 4f). Here, the circulation remains cyclonic, characterized by negative Z500 anomalies flanking the cloud band centre, providing continuous dynamical support to the system. The ascending motion for long-lived events remains in place (Fig. 4l), maintaining an intensity approximately twice as strong as the short-lived cloud band events (Fig. 4i).
3.5 Seasonality of Cloud Band Lifetime
To determine whether the lifetime of cloud bands has seasonal preferences, we analyze the seasonal cycle of short-lived versus long-lived events (Fig. 5) as a function of latitude. Previous climatological assessments have established that, unlike in other Southern Hemisphere basins where cloud bands are mainly restricted to the summer months, tropical-extratropical cloud bands in the South Pacific occur year-round, albeit with decreased frequency during the austral winter (e.g., Pilon and Domeisen, 2024, their Fig. 9). Building on this baseline, stratifying by duration reveals a clear distinction in seasonality with respect to lifetime. Short-lived events (Fig. 5a) display a broad seasonal distribution: while they exhibit a maximum in austral summer in the tropics, they occur throughout the year. This suggests that transient cloud bands can be triggered by Rossby wave breaking events throughout all seasons, having relevance to both summer tropical convection and winter transient frontal systems.
In contrast, persistent (long-lived) cloud bands (Fig. 5b) are confined to the austral warm season, with a distinct frequency peak in the tropics during January and February and a notably lower frequency in the mid-latitudes. Frequencies subsequently drop to negligible values at all latitudes during austral winter (July–September). This implies that the maintenance of long-lived, quasi-stationary systems requires a specific concurrence of conditions: the sustained dynamic forcing of an upstream PV intrusion coupled with the favourable thermodynamic environment provided by the seasonal southward excursion of the ITCZ and tropical moisture (van der Wiel et al., 2016; Brown et al., 2020).
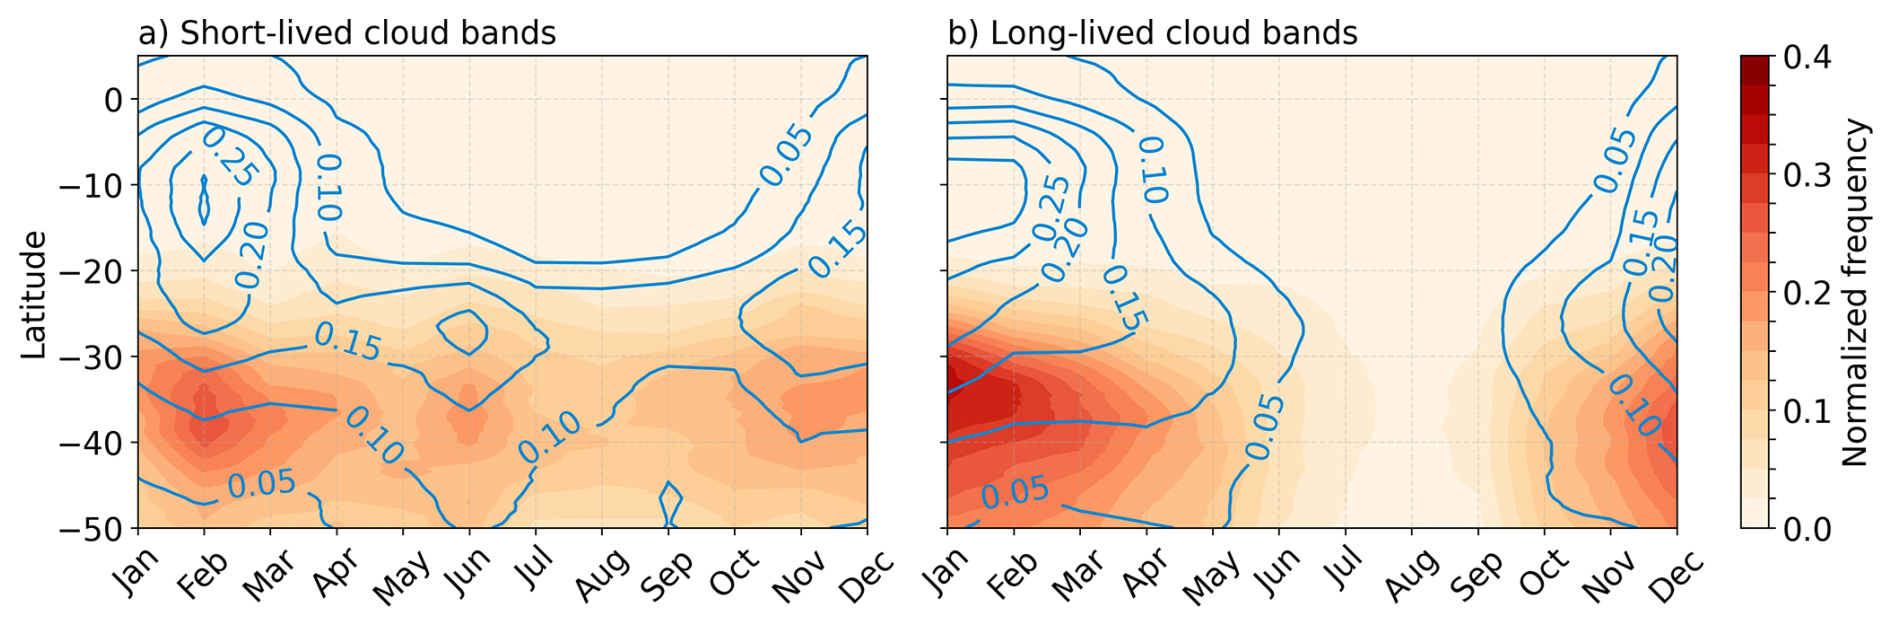
Figure 5Seasonal cycle of zonal mean frequency for (a) short-lived and (b) long-lived cloud bands (contours) and their connected PV structures (shading). Frequencies are normalized by the maximum value within each respective duration category (short-lived and long-lived, respectively) to facilitate phase comparison.
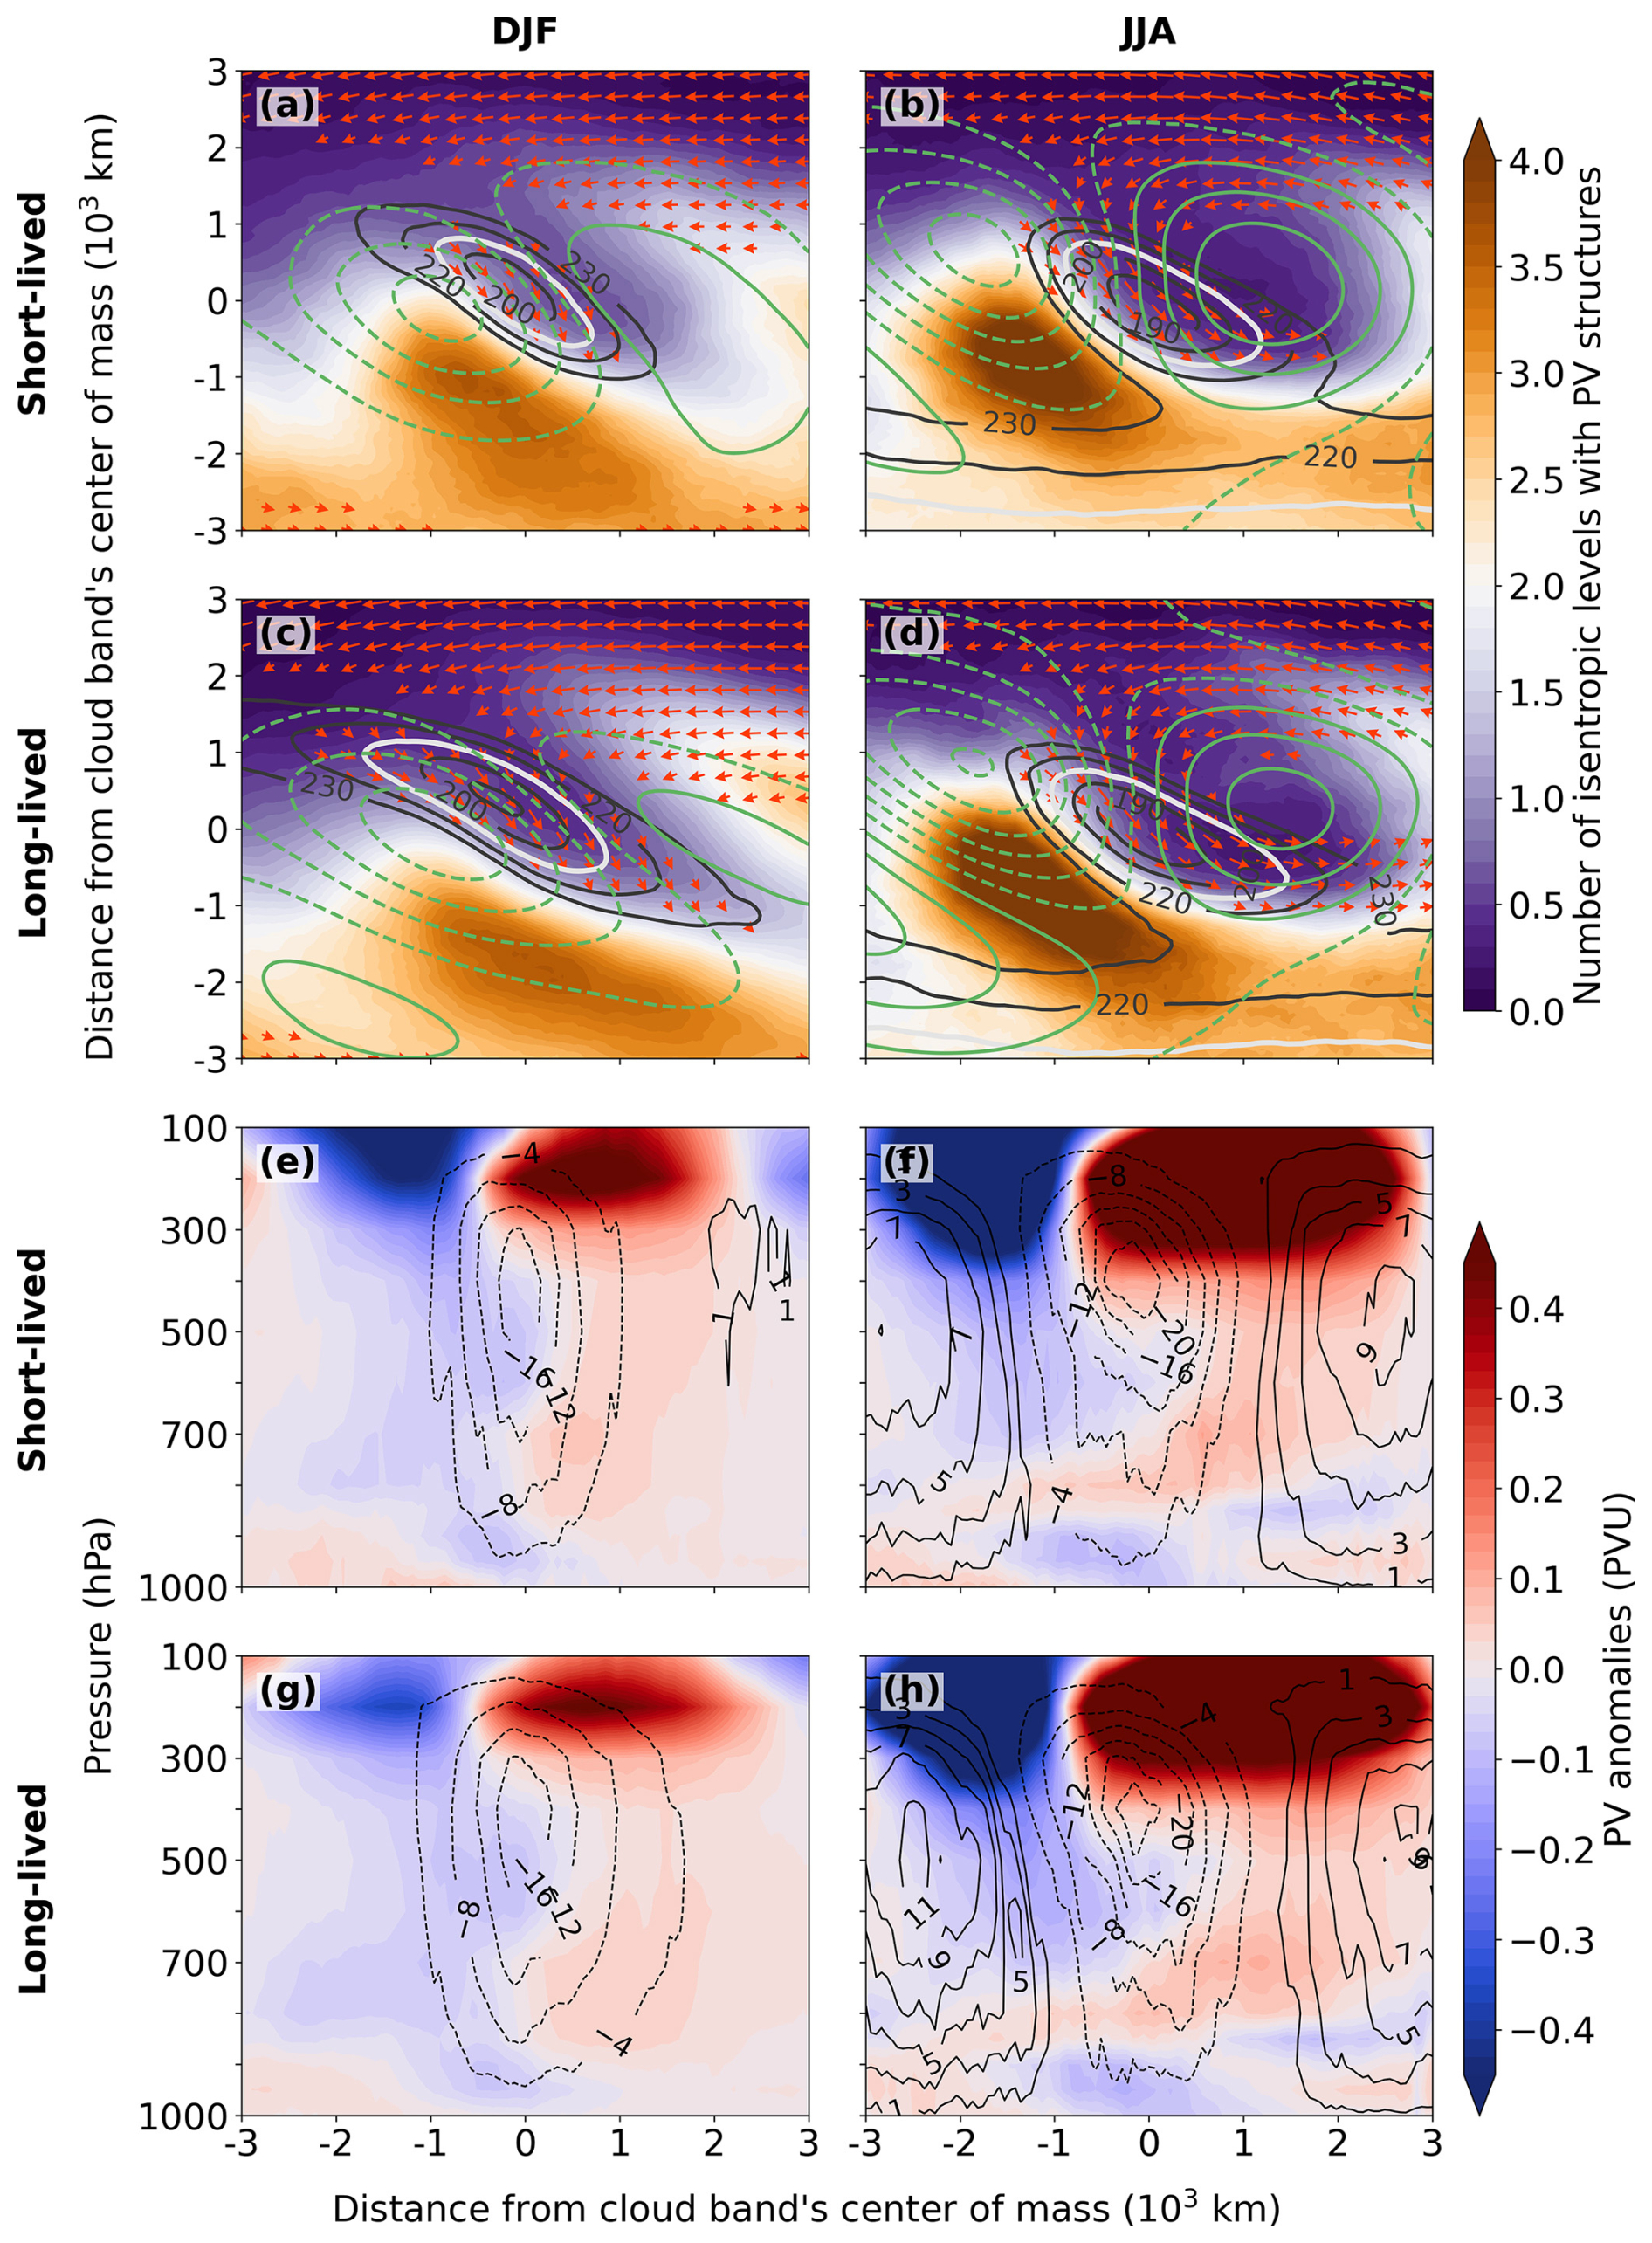
To further analyze the seasonal variation in cloud band dynamics and their local environment, cloud band-centred composites partitioned into austral summer (DJF) and winter (JJA) at genesis are presented in Fig. 6. A marked seasonal contrast can be seen in the intensity of the synoptic forcing (Fig. 6a–d). During winter, Rossby wave breaking is notably more intense, characterized by deeper PV structures spanning more than four isentropic levels and a more meridionally aligned Z500 dipole. This reflects the increased baroclinicity typical of the winter hemisphere. The vertical-meridional cross-sections (Fig. 6f, h) reveal an amplified PV dipole with intensified ascending and descending motions in JJA compared to the DJF cloud bands (Fig. 6e, g). Furthermore, the winter composites display a zonal band of reduced OLR at the bottom in the composite domain, reflecting the intersection with active mid-latitude storm tracks and cold cloud systems. Notably, the descending cyclonic PV tongue poleward of the cloud band is interrupted near 800 hPa by a localized positive PV anomaly. This is a classic indication of low-level, diabatic PV generation driven by latent heat release within the ascending draughts, consistent with the physical mechanisms detailed previously in Fig. 3.
When comparing different cloud band durations, the winter composites for short- and long-lived events appear structurally similar at genesis (despite the low number of long-lived cloud band events during the austral winter). This suggests that the baroclinic background state during JJA exerts a dominant control on the initial formation phase, yielding a uniform initial synoptic structure regardless of the cloud band's duration. Conversely, during summer (DJF), structural differences at genesis are more pronounced. Long-lived summer cloud bands – along with their associated PV structures and Z500 anomalies – exhibit a more zonal orientation and a more elongated shape compared to short-lived events. This cloud geometry is accompanied by a more zonally elongated corridor of moisture transport. Consistent with this, the vertical cross-sections show that long-lived summer cloud bands feature a broader latitudinal footprint of ascending motion, albeit with less intense anticyclonic and cyclonic anomalies compared to short-lived cloud bands. Consistent with previous frameworks emphasizing the interplay between basic-state flow and extratropical wave propagation (van der Wiel et al., 2015; Zilli and Hart, 2021), these findings suggest that the seasonal configuration of midlatitude PV structures determines cloud band morphology. Under the reduced baroclinicity of the summer season, PV structures exhibit a more zonal orientation. This orientation subsequently drives the elongated geometry of the associated cloud bands, enabling the sustained moisture convergence and continuous diabatic feedback required for their persistence.
3.6 Dynamic Drivers with Respect to Cloud Band Lifetime
To further identify the specific dynamic factors influencing cloud band lifecycles, we examine the characteristics of upstream PV structures. We focus on the contrast between the distinct short-lived and long-lived cloud band categories (as defined in Sect. 2.1.3) to identify potential differences in the specific PV structures with respect to cloud band lifetime. The transitional category (duration of 3 d) is included in the figures as a reference to illustrate the intermediate behaviour between these two categories.
3.6.1 PV Structure Characteristics Upstream of Cloud Bands
To identify whether cloud band formation is driven by specific PV structures, Fig. 7a presents a lead-lag plot of the composite fraction of cloud bands connected to a PV structure within the upstream sector relative to cloud band genesis (corresponding to lag 0). The climatological baseline is high: even one week before genesis (lag −7), approximately 85 % of future cloud band genesis locations already have a PV structure in their upstream sector. This high baseline is expected given the large spatial extent of the defined upstream sector, which naturally captures the high background frequency of Rossby wave breaking in this dynamically active region. Against this high background, the fraction of connected cloud bands rises as genesis approaches, reaching 89 % at lag 0. Following genesis, this association strengthens further, with this fraction increasing to over 95 % by lag +2 for the surviving cloud bands. This suggests that while the presence of upstream PV structures is common, the sustained occurrence of PV structures is a characteristic feature of cloud band persistence.
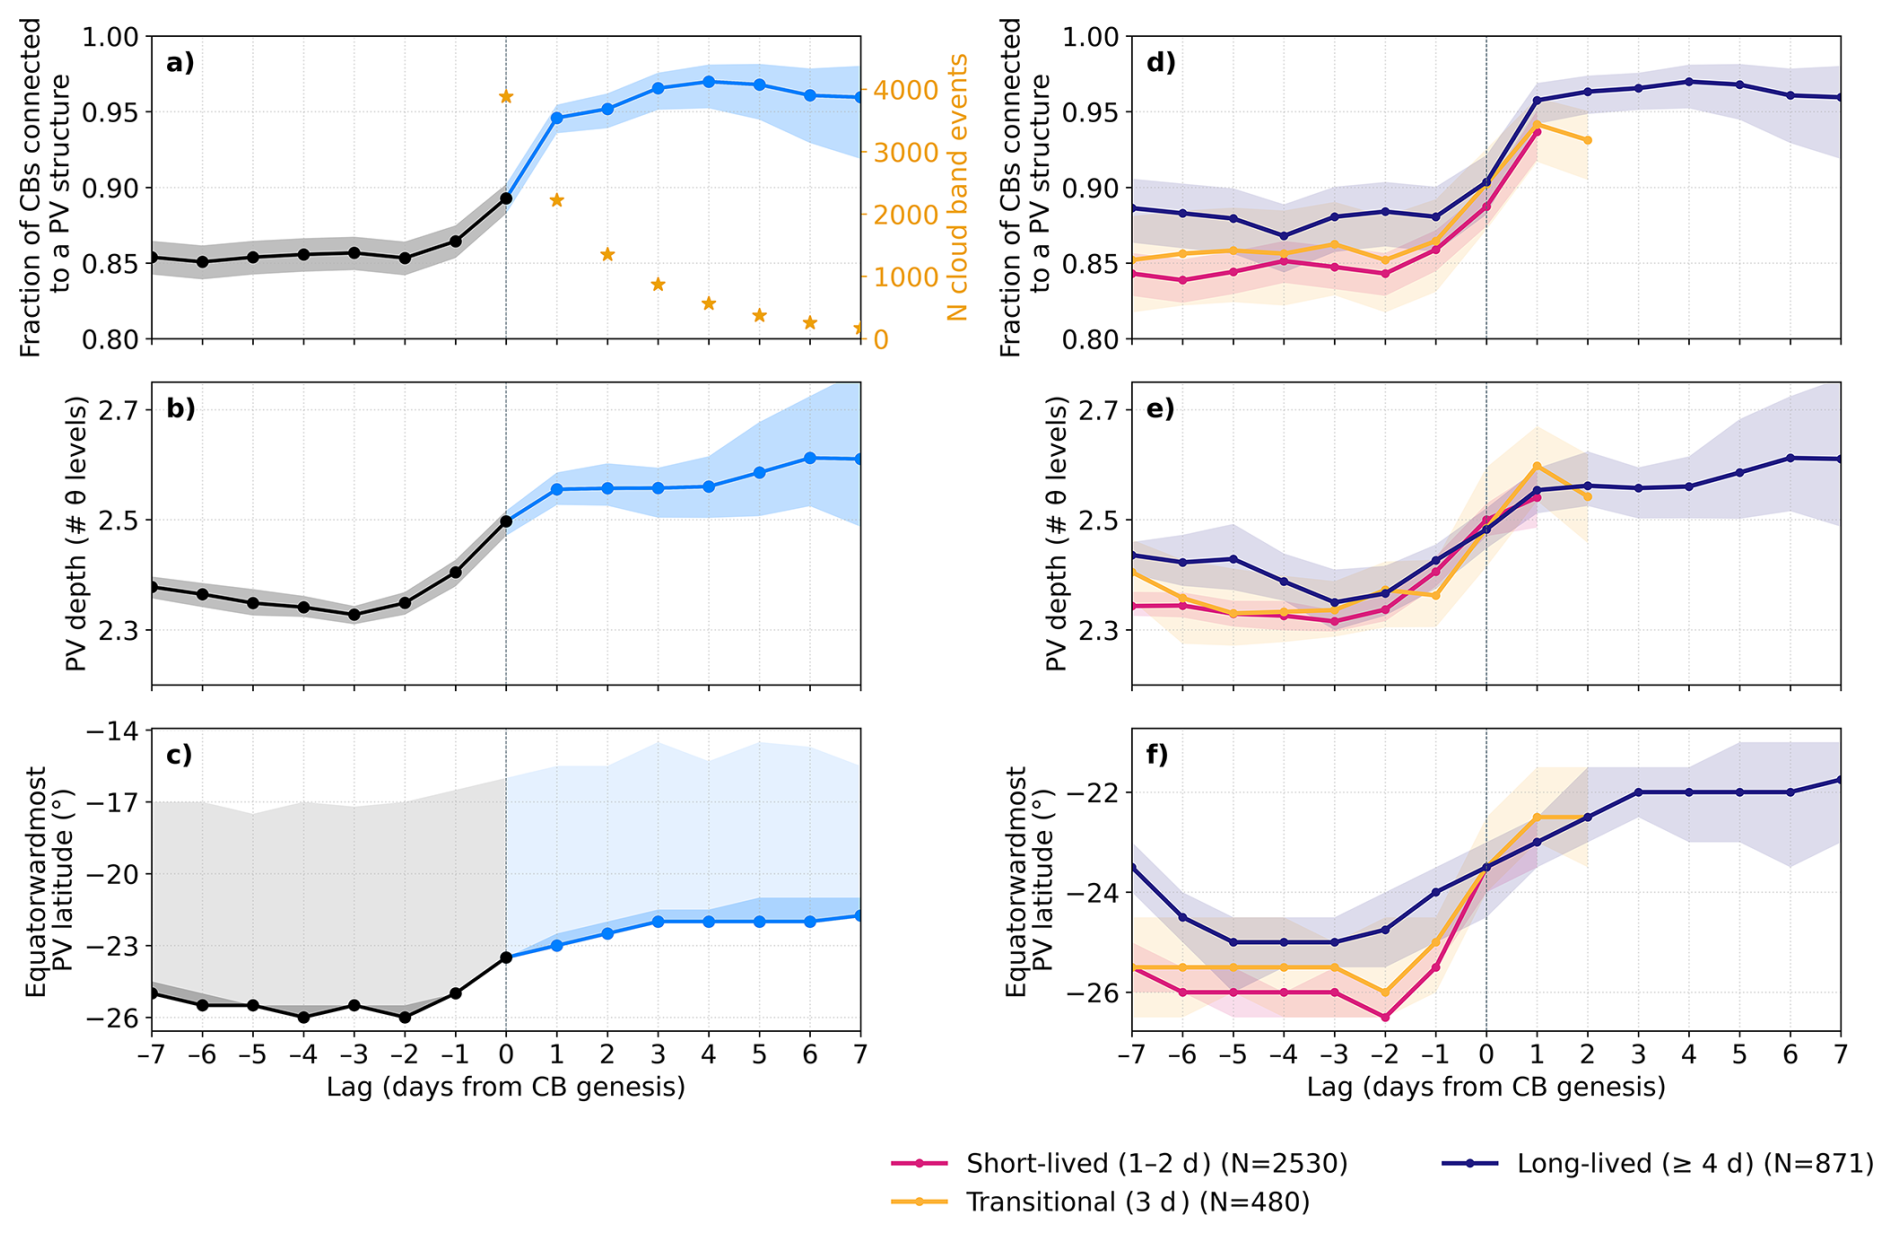
Figure 7Time-lagged composites of PV characteristics relative to cloud band genesis (lag 0). All characteristics are computed within a dynamic upstream sector located south-west of the tracked cloud band (see Sect. 2.3 for definition). The left column (a–c) shows composites for all events. The right column (d–f) stratifies these metrics by total cloud band duration, with the different line colours corresponding to the duration categories defined in the legend. The panels show: (a, d) the fraction of cloud bands with an upstream PV structure, (b, e) the median vertical depth of the PV structure in isentropic (θ) levels, and (c, f) the median of the most equatorward latitude reached by the PV structures. In panels (a)–(c), the change from black to blue lines indicates a shift in the reference frame for the upstream sector: lags ≤0 (black) use a sector fixed relative to the genesis location, while lags >0 (blue) follow the tracked cloud band centroid. The shading in these panels indicates the confidence interval: for (a, d), it is the 95 % Wilson score confidence interval; for (b)–(f), the shading is the 95 % bootstrap confidence interval for the median. Panel (c), in addition, includes light shading extending to the 90th percentile, quantifying the 10 % most equatorward-penetrating PV intrusions. The right-hand axis and markers (yellow stars) in panel (a) show the number (total summed over all years) of individual cloud band events included at each lag.
This dependence on sustained forcing by PV structures is further clarified when stratifying by cloud band duration (Fig. 7d). Long-lived (persistent) cloud band (≥4 d) exhibit a consistently higher fraction of connected upstream PV structures throughout their lifetime, including the period before genesis, compared to short-lived events (1–2 d). From lag −7 to lag −1, the upstream environment of future long-lived cloud bands is significantly more likely to contain a PV structure (a fraction of ∼0.88) than that of short-lived events (∼0.84). The transitional (3 d) category consistently falls between these values, suggesting a coherent pattern where the fraction of connected PV structures scales with cloud band duration. At genesis (lag 0), this distinction persists, with 90 % of long-lived events coinciding with a PV structure, compared to 88 % for short-lived (transient) cloud bands. Post-genesis, the PV association for long-lived cloud bands rises to and remains above 95 % for several days, supporting the hypothesis that while the summer background state provides the necessary thermodynamic environment, sustained PV forcing is integral to maintaining cloud bands.
It is important to note a potential geometric issue regarding the fraction of connected events. Long-lived cloud bands often grow and expand to a larger size than short-lived cloud bands, thereby increasing the size of their upstream sector and increasing the statistical probability of intersecting a PV structure. Nevertheless, this geometric bias is largely counteracted by the fact that long-lived cloud bands occur at more equatorward latitudes where background PV structures are climatologically rarer. To ensure that our conclusions regarding sustained dynamical forcing are valid and not artefacts of the size of the search area, we subsequently evaluate the area-independent properties of these associated PV structures, namely their vertical depth and equatorward penetration.
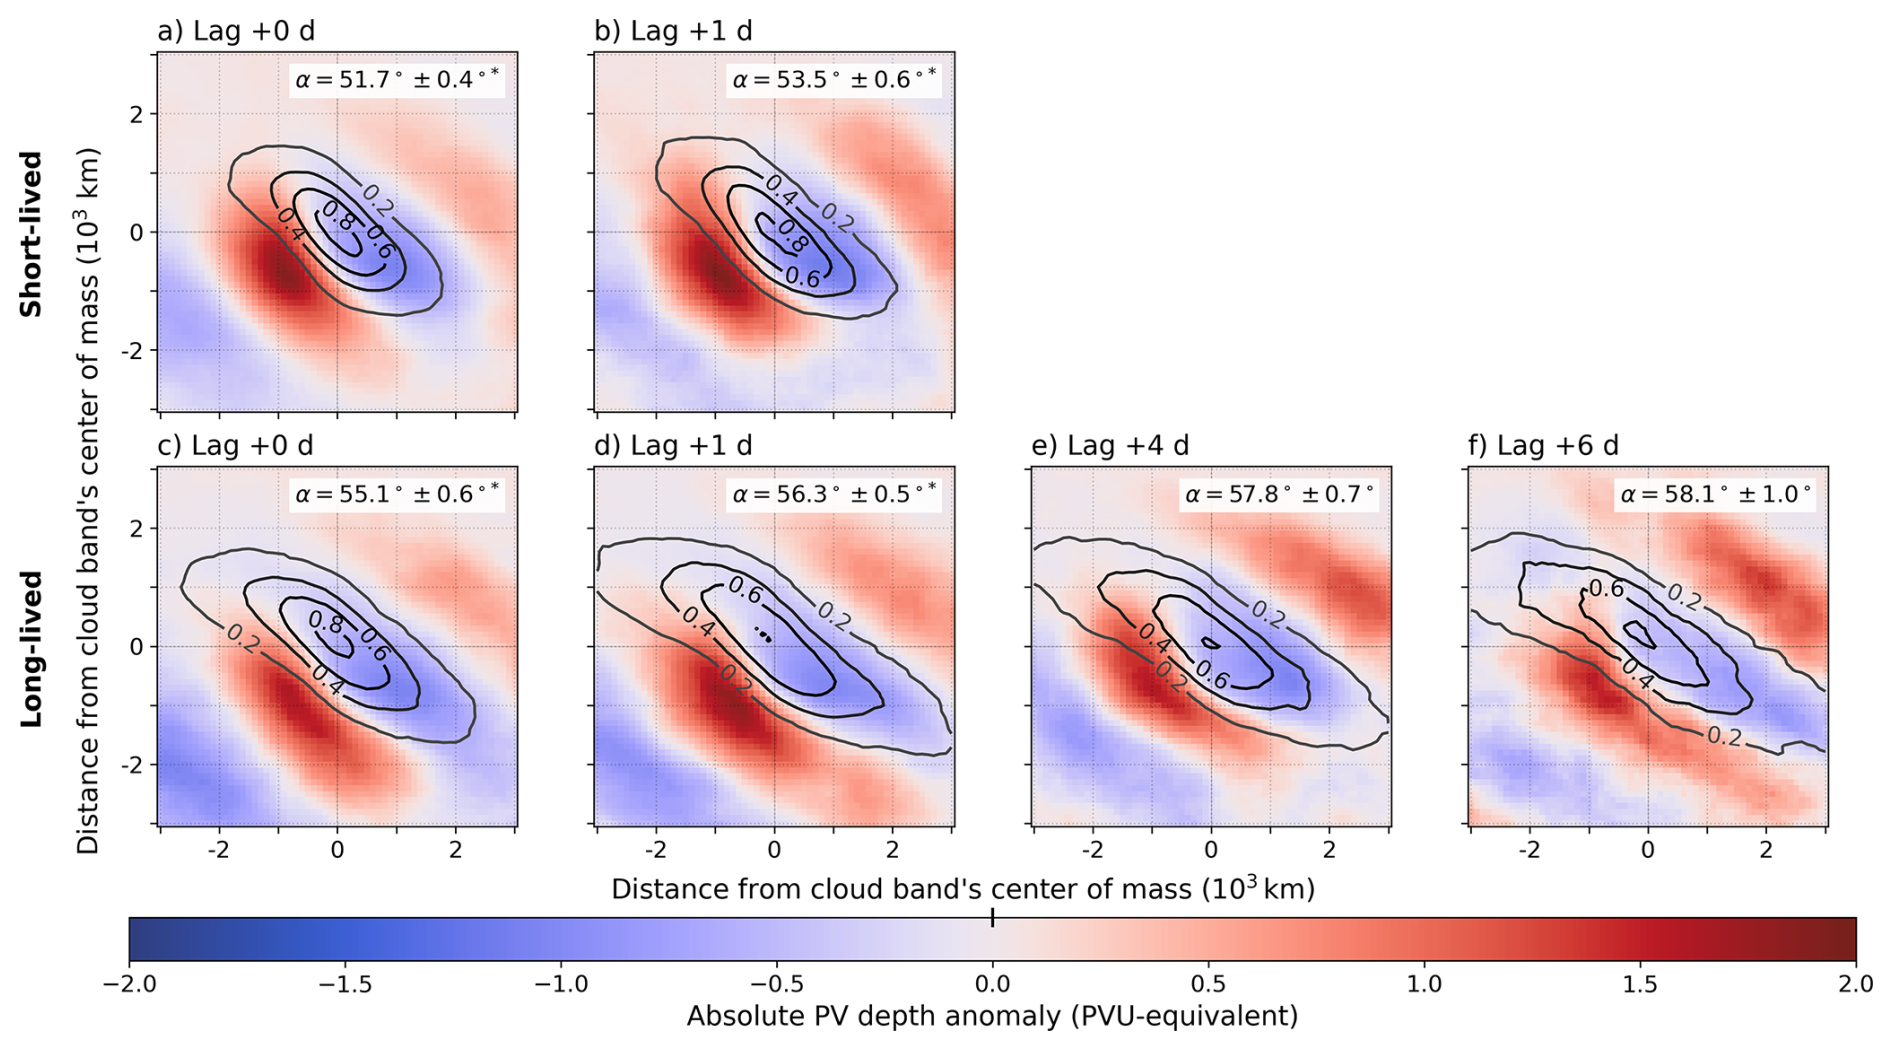
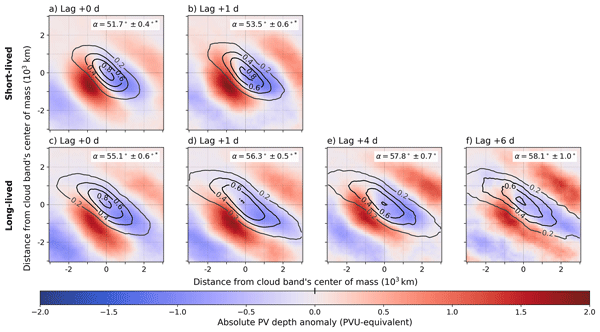
Figure 8Time-lagged horizontal composites of absolute PV depth anomalies (shading) and relative frequency of cloud band occurrence (contours) centred on the tracked cloud band centroid for positive lags and the genesis position for negative lags. The composites are stratified by cloud band duration: (a)–(b) short-lived cloud bands and (c)–(f) long-lived cloud bands. The PV anomalies are calculated as the daily PV depth minus the long-term climatological mean (1979–2021) based on a 21 d running mean of the daily average. Cloud band frequency contours are shown at intervals of 0.2, starting at 0.2. The reference frame moves with the cloud band centroid at each lag. The mean cloud band orientation angle (α) is annotated in each panel with its standard error. The angle is measured such that 90° represents a purely zonal/East-West orientation and 0° represents North-South. Asterisks (*) indicate a statistically significant difference in orientation between short- and long-lived events at the 99 % confidence level (p<0.01) using a Welch's t-test.
3.6.2 PV Depth and Latitudinal Position
Figure 7b displays the vertical depth of PV structures upstream of cloud bands. Following a period of nearly constant PV vertical depth, a deepening occurs coincident with cloud band genesis. The median depth increases at lag −1 (to 2.4 levels) and rises further to 2.55 levels at lag +1. Post-genesis, the median depth continues to increase for the surviving events, peaking at t+6 (2.63 levels). This trend suggests that while genesis is associated with a deepening PV structure, the subsequent deepening is a feature of the longest-lived events (yellow stars in Fig. 7a). Stratifying by duration (Fig. 7e) provides further context. While PV structures associated with long-lived cloud bands exhibit a higher median depth one week before genesis (2.43 levels at lag −7) compared to transient events (2.33 levels), the depths converge as genesis approaches, becoming nearly identical at onset (both ∼2.5 levels). The most notable difference is that PV structures in long-lived events maintain and increase their depth post-genesis. It is worth noting that transitional cloud bands dissipate after the peak in PV structure depth.
Regarding the meridional extent of these PV intrusions (Fig. 7c), the median of the most equatorward latitude of the upstream PV structure remains stable at approximately 25.5° S from lag −7 to lag −2. An equatorward shift begins on the day before genesis (lag −1), reaching 23.5° S at genesis (lag 0). Crucially, while short-lived events exhibit a rapid, deep intrusion immediately following genesis (reaching 22.5° S at lag +1), this forcing is transient. In contrast, the equatorward intrusion for long-lived cloud bands is sustained, progressively reaching 22.0° S by lag +3. The 90th percentile of the PV structures' most equatorward latitude ribbon further highlights the intensity of these intrusions; at genesis, 10 % of events are associated with PV structures penetrating to 16.0° S, extending to 15.5° S by lag +5. This demonstrates that an important subset of cloud bands – likely clustered in the austral summer – is driven by deep intrusions of extratropical air into the tropics. Furthermore, long-lived cloud bands (Fig. 7f) are distinguished by the latitudinal position of the PV structures. This configuration is established before genesis; at lag −2, PV structures for long-lived cloud bands are already situated equatorward (24.5° S) of the peak latitude of transient events (26.0° S). This suggests that while short-lived events are driven by rapid, deep incursions of deep PV structures, long-lived cloud bands benefit from a favourable tropospheric environment where PV structures are already present at lower latitudes prior to genesis.
3.6.3 Spatial Evolution
To visually corroborate these statistical findings (Sect. 3.6.2), spatial composites of absolute PV depth anomalies and cloud band occurrence were tracked from genesis (lag 0) through the decay phase (lag +6) in Fig. 8. At the time of genesis (lag 0) and the following day (lag +1), the magnitude of the absolute PV depth anomaly (shown in red) is similar for the two categories of cloud bands. For long-lived events, the composites show that the positive PV depth anomaly in the upstream southwest sector is not a transient feature limited to the genesis stage. Instead, it remains a coherent, phase-locked structure that evolves alongside the cloud band well into its decay. This sustained upper-level support is accompanied by a distinct spatial pattern. The cloud band orientation (α) is found to be significantly more zonal for long-lived events (α ranging from 55 to 58°, e.g., ∼58° at lag +4) than for the more meridionally tilted short-lived events (α=52° at genesis and 53.5° on the second day). This indicates that while short-lived cloud band events are associated with transient PV structures, long-lived cloud bands are associated with quasi-stationary PV structures that favour the zonally elongated shape of the cloud bands. Finally, it is worth noting that Fig. 8 captures classic Rossby wave packet dynamics, exhibiting a clear wave train signature characterised by alternating troughs and ridges.
This study applies object-based algorithms for the identification of tropical–extratropical cloud bands and stratospheric potential vorticity (PV) structures to ERA5 reanalysis to clarify the influence of Rossby wave breaking on these cloud band characteristics over the South Pacific. We extend previous work by tracking cloud bands in time and by attributing these cloud bands to PV structures to elucidate the influence of extratropical forcing on the spatial distribution, seasonality, formation and maintenance of these cloud bands.
Our climatological analysis reveals that the spatial distribution of these features is not only aligned with the SPCZ, but also exhibits a statistically significant connection, confirming the critical role of these tropical–extratropical interactions in shaping regional cloudiness. Categorizing cloud band events by duration highlights distinct seasonal regimes: while short-lived cloud bands occur year-round, driven by transient, rapid PV intrusions, long-lived cloud bands are strictly confined to the austral warm season. This seasonal confinement confirms that the maintenance of quasi-stationary tropical–extratropical cloud bands relies on the specific background state of the austral summer, characterized by the poleward excursion of the ITCZ and frequent intrusions of stratospheric PV into the tropical upper troposphere. The combination of this favourable thermodynamic environment with sustained upstream dynamic forcing allows for the maintenance of these systems over multiple days.
Mechanistically, our composites corroborate the established framework whereby cyclonic PV anomalies steer moisture poleward and eastward, facilitating convection and shaping the characteristic diagonal orientation of cloud bands in the SPCZ.
A key novel finding of this study is that the lifetime of cloud bands depends on the sustained presence of dynamic forcing. While the South Pacific is a climatologically favourable region for Rossby wave breaking, we show that long-lived cloud bands remain more consistently connected to upstream PV structures throughout their lifecycle. Furthermore, the initiation of these long-lived cloud band events requires – prior to cloud band genesis – PV structures that penetrate deep into the tropical upper troposphere. Our seasonal composites at genesis indicate that this specific structural configuration is tied to the seasonal background state. During winter (JJA), strong midlatitude forcing generates structurally similar genesis phases for both short- and long-lived cloud band events. However, under the reduced baroclinicity of austral summer (DJF), persistent, zonally oriented PV structures are instrumented for cloud bands to form. These characteristics facilitate the prolonged moisture transport and continuous diabatic feedback required to sustain the cloud band. The subsequent evolution reveals distinct dynamic regimes: short-lived events resemble rapid “bursts”, characterized by deep but transient PV structures extending into low latitudes and a significantly more meridional cloud band orientation. These cloud band events are quickly terminated by downstream ridging, which aligns closely with the wave-dissipation mechanism proposed by van der Wiel et al. (2015), wherein the intense diabatic heating of the newly formed SPCZ generates a strong anticyclonic tendency that destroys the incoming cyclonic wave. In contrast, long-lived cloud bands are maintained by quasi-stationary circulation patterns. In these persistent cases, the sustained upstream midlatitude forcing is sufficient to overcome the convection-induced negative feedback, thereby sustaining the tropical convection and maintaining the tropical-extratropical connection over multiple days. This sustained interaction favours the development of larger, significantly more zonally extended cloud systems. This demonstrates that while Rossby wave breaking events facilitate cloud band genesis, sustained midlatitude forcing is necessary for maintaining cloud band systems over multiple days.
Nevertheless, a limitation of our methodology is that while cloud bands are tracked, the associated PV structures are identified based on instantaneous spatial collocation. Explicitly tracking the PV structures would allow for a finer distinction between cloud bands sustained by a single, persistent Rossby wave breaking event versus those maintained by a succession of breaking Rossby waves. Furthermore, such an approach would allow for a quantitative analysis of the co-evolution of the PV and cloud band and their respective orientations, confirming the dynamic linkage suggested by our spatial composites.
Building on this object-orientated framework provides a pathway to further investigate the coupling between these extratropical and tropical forcings, such as equatorial Rossby or Kelvin waves. Finally, expanding this analysis to longer timescales and assessing how these life cycles are modulated by the Madden–Julian Oscillation or the Interdecadal Pacific Oscillation offers a promising avenue to improve the understanding and predictability of hydro-meteorological characteristics of extremes in the South Pacific region.
A1 Collocation Method between Deep Potential Vorticity Structures and Tropical-Extratropical Cloud Bands
The main manuscript introduces a collocation method between deep potential vorticity structures and tropical-extratropical cloud bands to find connections between the two features.
A connection between a tropical-extratropical cloud band and a PV structure is determined through the following steps. First, PV structures with bounding boxes overlapping the cloud band's bounding box are identified. Next, among these, PV structures whose centroid lies west of the cloud band's diagonal transect (see Fig. A1, area with hatching) are flagged as connected to the cloud band. If multiple PV structures meet the criterion, only one connection is counted to avoid overestimating connections.
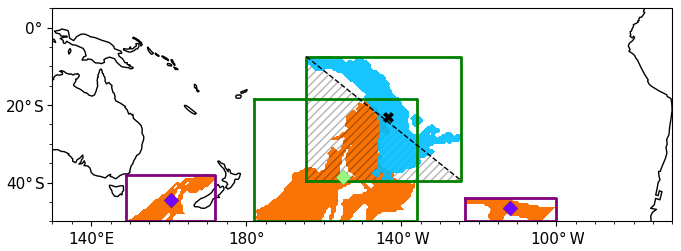
Figure A1Daily snapshot of tropical-extratropical cloud bands (blue shading) and deep PV structures (orange shading) over the South Pacific on 21 January 2017. Green bounding boxes indicate overlapping cloud band and PV structure regions, while violet boxes show non-overlapping regions. The area with hatching represents the upstream sector for collocating PV structures. Diamond markers represent PV structure centroids, and crosses mark the cloud band centroid. Green centroids denote deep PV structures that satisfy both the overlap and “west-to-cloud-band's-transect” criteria, i.e., within the cloud band upstream sector. Note that deep PV structures smaller than 10 px are omitted from this figure for visual clarity, though they are fully included in the collocation analysis.
The ERA5 reanalysis data are publicly available from the Copernicus Climate Data Store https://doi.org/10.24381/cds.adbb2d47 (Hersbach et al., 2018). The EM-DAT data are publicly available from the Emergency Events Database website https://www.emdat.be/ (last access: 21 May 2026). The cloud band detection algorithm is available under a BSD 3-Clause License at https://doi.org/10.5281/zenodo.14639920 (Pilon, 2025). The code used for the data analysis and the figures is available under an MIT license on Zenodo at https://doi.org/10.5281/zenodo.19919573 (Pilon, 2026).
RP designed the study. RP, AJDV and DD contributed to the interpretation of the results. RP performed all analyses and wrote the paper, based on discussions with and input from all co-authors; AJDV and DD provided critical feedback, reviewed and edited the manuscript until its final version. DD secured the funding.
At least one of the (co-)authors is a member of the editorial board of Weather and Climate Dynamics. The peer-review process was guided by an independent editor, and the authors also have no other competing interests to declare.
Publisher's note: Copernicus Publications remains neutral with regard to jurisdictional claims made in the text, published maps, institutional affiliations, or any other geographical representation in this paper. The authors bear the ultimate responsibility for providing appropriate place names. Views expressed in the text are those of the authors and do not necessarily reflect the views of the publisher.
Support from the Swiss National Science Foundation through project PP00P2_198896 to D.D. is gratefully acknowledged. A large language model was used for linguistic refinement and to speed up coding for plotting. We thank the two anonymous reviewers for their constructive comments, which helped improve the manuscript.
This research has been supported by the Schweizerischer Nationalfonds zur Förderung der Wissenschaftlichen Forschung (grant no. PP00P2_198896).
This paper was edited by Shira Raveh-Rubin and reviewed by two anonymous referees.
Allen, G., Vaughan, G., Brunner, D., T. May, P., Heyes, W., Minnis, P., and K. Ayers, J.: Modulation of tropical convection by breaking Rossby waves, Q. J. Roy. Meteorol. Soc., 135, 125–137, https://doi.org/10.1002/qj.349, 2009. a, b
Appenzeller, C. and Davies, H. C.: Structure of stratospheric intrusions into the troposphere, Nature, 358, 570–572, https://doi.org/10.1038/358570a0, 1992. a
Barnes, M. A., Reeder, M. J., and Ndarana, T.: Rossby Wave Breaking Morphologies on the Southern Hemisphere Dynamical Tropopause, J. Climate, 38, 4825–4844, https://doi.org/10.1175/JCLI-D-24-0461.1, 2025. a
Black, A. S., Risbey, J. S., Chapman, C. C., Monselesan, D. P., II, T. S. M., Pook, M. J., Richardson, D., Sloyan, B. M., Squire, D. T., and Tozer, C. R.: Australian Northwest Cloudbands and Their Relationship to Atmospheric Rivers and Precipitation, Mon. Weather Rev., 149, 1125–1139, https://doi.org/10.1175/MWR-D-20-0308.1, 2021. a
Brown, J. R., Lengaigne, M., Lintner, B. R., Widlansky, M. J., van der Wiel, K., Dutheil, C., Linsley, B. K., Matthews, A. J., and Renwick, J.: South Pacific Convergence Zone dynamics, variability and impacts in a changing climate, Nat. Rev. Earth Environ., 1, 530–543, https://doi.org/10.1038/s43017-020-0078-2, 2020. a, b, c, d, e, f
de Vries, A. J., Feldstein, S. B., Riemer, M., Tyrlis, E., Sprenger, M., Baumgart, M., Fnais, M., and Lelieveld, J.: Dynamics of tropical–extratropical interactions and extreme precipitation events in Saudi Arabia in autumn, winter and spring, Q. J. Roy. Meteorol. Soc., 142, 1862–1880, https://doi.org/10.1002/qj.2781, 2016. a
de Vries, A. J., Ouwersloot, H. G., Feldstein, S. B., Riemer, M., El Kenawy, A. M., McCabe, M. F., and Lelieveld, J.: Identification of Tropical-Extratropical Interactions and Extreme Precipitation Events in the Middle East Based On Potential Vorticity and Moisture Transport, J. Geophys. Res.-Atmos., 123, 861–881, https://doi.org/10.1002/2017JD027587, 2018. a, b
de Vries, A. J., Armon, M., Klingmüller, K., Portmann, R., Röthlisberger, M., and Domeisen, D. I. V.: Breaking Rossby waves drive extreme precipitation in the world's arid regions, Commun. Earth Environ., 5, 493, https://doi.org/10.1038/s43247-024-01633-y, 2024. a, b
Delforge, D., Wathelet, V., Below, R., Lanfredi Sofia, C., Tonnelier, M., van Loenhout, J. A. F., and Speybroeck, N.: The EM-DAT Emergency Events Database Archive, Open Data @ UCLouvain [data set], https://doi.org/10.14428/DVN/I0LTPH, 2024. a
Fröhlich, L. and Knippertz, P.: Identification and global climatology of upper-level troughs at low latitudes, Meteorol. Z., 17, 565–573, https://doi.org/10.1127/0941-2948/2008/0320, 2008. a
Fröhlich, L., Knippertz, P., Fink, A. H., and Hohberger, E.: An Objective Climatology of Tropical Plumes, J. Climate, 26, 5044–5060, https://doi.org/10.1175/JCLI-D-12-00351.1, 2013. a, b, c
Funatsu, B. M. and Waugh, D. W.: Connections between Potential Vorticity Intrusions and Convection in the Eastern Tropical Pacific, J. Atmos. Sci., 65, 987–1002, https://doi.org/10.1175/2007JAS2248.1, 2008. a, b, c
Griffiths, G. M., Salinger, M. J., and Leleu, I.: Trends in extreme daily rainfall across the South Pacific and relationship to the South Pacific Convergence Zone, Int. J. Climatol., 23, 847–869, https://doi.org/10.1002/joc.923, 2003. a
Hart, N. C. G., Reason, C. J. C., and Fauchereau, N.: Cloud bands over southern Africa: seasonality, contribution to rainfall variability and modulation by the MJO, Clim. Dynam., 41, 1199–1212, https://doi.org/10.1007/s00382-012-1589-4, 2013. a
Hart, R. E. and Grumm, R. H.: Using Normalized Climatological Anomalies to Rank Synoptic-Scale Events Objectively, Mon. Weather Rev., 129, 2426–2442, https://doi.org/10.1175/1520-0493(2001)129<2426:UNCATR>2.0.CO;2, 2001. a
Hersbach, H., Bell, B., Berrisford, P., Biavati, G., Horányi, A., Muñoz Sabater, J., Nicolas, J., Peubey, C., Radu, R., Rozum, I., Schepers, D., Simmons, A., Soci, C., Dee, D., and Thépaut, J.-N.: ERA5 hourly data on single levels from 1940 to present, Copernicus Climate Change Service (C3S) Climate Data Store (CDS) [data set], https://doi.org/10.24381/cds.adbb2d47, 2018. a
Hersbach, H., Bell, B., Berrisford, P., Hirahara, S., Horányi, A., Muñoz-Sabater, J., Nicolas, J., Peubey, C., Radu, R., Schepers, D., Simmons, A., Soci, C., Abdalla, S., Abellan, X., Balsamo, G., Bechtold, P., Biavati, G., Bidlot, J., Bonavita, M., De Chiara, G., Dahlgren, P., Dee, D., Diamantakis, M., Dragani, R., Flemming, J., Forbes, R., Fuentes, M., Geer, A., Haimberger, L., Healy, S., Hogan, R. J., Hólm, E., Janisková, M., Keeley, S., Laloyaux, P., Lopez, P., Lupu, C., Radnoti, G., de Rosnay, P., Rozum, I., Vamborg, F., Villaume, S., and Thépaut, J.-N.: The ERA5 global reanalysis, Q. J. Roy. Meteorol. Soc., 146, 1999–2049, https://doi.org/10.1002/qj.3803, 2020. a
Kiladis, G. N.: Observations of Rossby Waves Linked to Convection over the Eastern Tropical Pacific, J. Atmos. Sci., 55, 321–339, https://doi.org/10.1175/1520-0469(1998)055<0321:OORWLT>2.0.CO;2, 1998. a, b, c, d, e, f
Kiladis, G. N. and Weickmann, K. M.: Extratropical Forcing of Tropical Pacific Convection during Northern Winter, Mon. Weather Rev., 120, 1924–1939, https://doi.org/10.1175/1520-0493(1992)120<1924:EFOTPC>2.0.CO;2, 1992. a
Knippertz, P.: Tropical–extratropical interactions related to upper-level troughs at low latitudes, Dynam. Atmos. Oceans, 43, 36–62, https://doi.org/10.1016/j.dynatmoce.2006.06.003, 2007. a, b, c, d, e, f
Knippertz, P. and Martin, J. E.: Tropical plumes and extreme precipitation in subtropical and tropical West Africa, Q. J. Roy. Meteorol. Soc., 131, 2337–2365, https://doi.org/10.1256/qj.04.148, 2005. a, b
Kodama, Y.: Large-Scale Common Features of Subtropical Precipitation Zones (the Baiu Frontal Zone, the SPCZ, and the SACZ) Part I: Characteristics of Subtropical Frontal Zones, J. Meteorol. Soc. JPN Ser. II, 70, 813–836, https://doi.org/10.2151/jmsj1965.70.4_813, 1992. a
Kumar, V. V., Deo, R. C., and Ramachandran, V.: Total rain accumulation and rain-rate analysis for small tropical Pacific islands: a case study of Suva, Fiji, Atmos. Sci. Lett., 7, 53–58, https://doi.org/10.1002/asl.131, 2006. a
Lorrey, A., Dalu, G., Renwick, J., Diamond, H., and Gaetani, M.: Reconstructing the South Pacific Convergence Zone Position during the Presatellite Era: A La Niña Case Study, Mon. Weather Rev., 140, 3653–3668, https://doi.org/10.1175/MWR-D-11-00228.1, 2012. a
Matthews, A. J.: A multiscale framework for the origin and variability of the South Pacific Convergence Zone, Q. J. Roy. Meteorol. Soc., 138, 1165–1178, https://doi.org/10.1002/qj.1870, 2012. a
Matthews, A. J., Hoskins, B. J., Slingo, J. M., and Blackburn, M.: Development of convection along the SPCZ within a Madden-Julian oscillation, Q. J. Roy. Meteorol. Soc., 122, 669–688, https://doi.org/10.1002/qj.49712253106, 1996. a
McIntyre, M. E. and Palmer, T. N.: Breaking planetary waves in the stratosphere, Nature, 305, 593–600, https://doi.org/10.1038/305593a0, 1983. a
Murthy, V. S. and Boos, W. R.: Understanding the vertical structure of potential vorticity in tropical depressions, Q. J. Roy. Meteorol. Soc., 145, 1968–1991, https://doi.org/10.1002/qj.3539, 2019. a
Niznik, M., Lintner, B. R., Matthews, A. J., and Widlansky, M. J.: The Role of Tropical–Extratropical Interaction and Synoptic Variability in Maintaining the South Pacific Convergence Zone in CMIP5 Models, J. Climate, 28, 3353 – 3374, https://doi.org/10.1175/JCLI-D-14-00527.1, 2015. a
Oertel, A., Boettcher, M., Joos, H., Sprenger, M., and Wernli, H.: Potential vorticity structure of embedded convection in a warm conveyor belt and its relevance for large-scale dynamics, Weather Clim. Dynam., 1, 127–153, https://doi.org/10.5194/wcd-1-127-2020, 2020. a
Peters, D. and Waugh, D. W.: Influence of Barotropic Shear on the Poleward Advection of Upper-Tropospheric Air, J. Atmos. Sci., 53, 3013–3031, https://doi.org/10.1175/1520-0469(1996)053<3013:IOBSOT>2.0.CO;2, 1996. a
Pilon, R.: romainpilon/cloudbandPy: v1.2.2 - Bug Fix, Version v1.2.2, Zenodo [code], https://doi.org/10.5281/zenodo.14639920, 2025. a
Pilon, R.: Supporting Files for The Role of Rossby Wave Breaking in the Formation and Maintenance of Tropical-Extratropical Cloud Bands over the South Pacific, Zenodo [code], https://doi.org/10.5281/zenodo.19919573, 2026. a
Pilon, R. and Domeisen, D. I. V.: cloudbandPy 1.0: an automated algorithm for the detection of tropical–extratropical cloud bands, Geosci. Model Dev., 17, 2247–2264, https://doi.org/10.5194/gmd-17-2247-2024, 2024. a, b, c, d
Portmann, R., Sprenger, M., and Wernli, H.: The three-dimensional life cycles of potential vorticity cutoffs: a global and selected regional climatologies in ERA-Interim (1979–2018), Weather Clim. Dynam., 2, 507–534, https://doi.org/10.5194/wcd-2-507-2021, 2021. a, b
Rosa, E. B., Pezzi, L. P., Quadro, M. F. L. d., and Brunsell, N.: Automated Detection Algorithm for SACZ, Oceanic SACZ, and Their Climatological Features, Front. Environ. Sci., 8, https://doi.org/10.3389/fenvs.2020.00018, original Research, 2020. a
Sagero, P. O., Pratap, A., Magiri, R., Ongoma, V., and Okello, P.: Validation of ERA5 rainfall data over the South Pacific Region: case study of Fiji Islands, Meteorol. Atmos. Phys., 136, 28, https://doi.org/10.1007/s00703-024-01025-z, 2024. a
Stan, C., Straus, D. M., Frederiksen, J. S., Lin, H., Maloney, E. D., and Schumacher, C.: Review of Tropical-Extratropical Teleconnections on Intraseasonal Time Scales, Rev. Geophys., 55, 902–937, https://doi.org/10.1002/2016RG000538, 2017. a
Takahashi, K. and Battisti, D. S.: Processes Controlling the Mean Tropical Pacific Precipitation Pattern. Part II: The SPCZ and the Southeast Pacific Dry Zone, J. Climate, 20, 5696–5706, https://doi.org/10.1175/2007JCLI1656.1, 2007. a
Telcik, N. and Pattiaratchi, C.: Influence of Northwest Cloudbands on Southwest Australian Rainfall, J. Climatology (Cairo), 2014, 671394, https://doi.org/10.1155/2014/671394, 2014. a
Thorncroft, C. D., Hoskins, B. J., and McIntyre, M. E.: Two paradigms of baroclinic-wave life-cycle behaviour, Q. J. Roy. Meteorol. Soc., 119, 17–55, https://doi.org/10.1002/qj.49711950903, 1993. a
Tubi, A. and Dayan, U.: Tropical Plumes over the Middle East: Climatology and synoptic conditions, Atmos. Res., 145-146, 168–181, https://doi.org/10.1016/j.atmosres.2014.03.028, 2014. a
van der Wiel, K., Matthews, A. J., Stevens, D. P., and Joshi, M. M.: A dynamical framework for the origin of the diagonal South Pacific and South Atlantic Convergence Zones, Q. J. Roy. Meteorol. Soc., 141, 1997–2010, https://doi.org/10.1002/qj.2508, 2015. a, b, c, d, e, f
van der Wiel, K., Matthews, A. J., Joshi, M. M., and Stevens, D. P.: Why the South Pacific Convergence Zone is diagonal, Clima. Dynam., 46, 1683–1698, https://doi.org/10.1007/s00382-015-2668-0, 2016. a, b, c
Vincent, D. G.: The South Pacific Convergence Zone (SPCZ): A Review, Mon. Weather Rev., 122, 1949–1970, https://doi.org/10.1175/1520-0493(1994)122<1949:TSPCZA>2.0.CO;2, 1994. a
Waugh, D. W. and Funatsu, B. M.: Intrusions into the Tropical Upper Troposphere: Three-Dimensional Structure and Accompanying Ozone and OLR Distributions, J. Atmos. Sci., 60, 637–653, https://doi.org/10.1175/1520-0469(2003)060<0637:IITTUT>2.0.CO;2, 2003. a
Waugh, D. W. and Polvani, L. M.: Climatology of intrusions into the tropical upper troposphere, Geophys. Res. Lett., 27, 3857–3860, https://doi.org/10.1029/2000GL012250, 2000. a
Webster, P. J. and Holton, J. R.: Cross-Equatorial Response to Middle-Latitude Forcing in a Zonally Varying Basic State, J. Atmos. Sci., 39, 722–733, https://doi.org/10.1175/1520-0469(1982)039<0722:CERTML>2.0.CO;2, 1982. a
Wernli, H. and Sprenger, M.: Identification and ERA-15 Climatology of Potential Vorticity Streamers and Cutoffs near the Extratropical Tropopause, J. Atmos. Sci., 64, 1569–1586, https://doi.org/10.1175/JAS3912.1, 2007. a, b
Widlansky, M. J., Webster, P. J., and Hoyos, C. D.: On the location and orientation of the South Pacific Convergence Zone, Clim. Dynam., 36, 561–578, https://doi.org/10.1007/s00382-010-0871-6, 2011. a
Zilli, M. T. and Hart, N. C. G.: Rossby Wave Dynamics over South America Explored with Automatic Tropical–Extratropical Cloud Band Identification Framework, J. Climate, 34, 8125–8144, https://doi.org/10.1175/JCLI-D-21-0020.1, 2021. a, b, c, d
Zilli, M. T., Hart, N. C. G., Coelho, C. A. S., Chadwick, R., de Souza, D. C., Kubota, P. Y., Figueroa, S. N., and Cavalcanti, I. F. A.: Characteristics of tropical–extratropical cloud bands over tropical and subtropical South America simulated by BAM-1.2 and HadGEM3-GC3.1, Q. J. Roy. Meteorol. Soc., 149, 1498–1519, https://doi.org/10.1002/qj.4470, 2023. a