the Creative Commons Attribution 4.0 License.
the Creative Commons Attribution 4.0 License.
 | 16 Jun 2026
A climatological perspective on cyclones and surface impacts in the Eastern Mediterranean using potential vorticity-based classification
Tali Sarit Gens
Leehi Magaritz-Ronen
Shira Raveh-Rubin
The Eastern Mediterranean is a water-scarce, climate-sensitive region. Eastern-Mediterranean cyclones (EMCs) are a major contributor to precipitation totals and weather extremes, including heavy precipitation, strong winds, temperature extremes and dust storms, substantially impacting the population and natural environment. Understanding EMCs' variability and their associated impacts is essential for improving their predictability and forecasts. The large case-to-case variability of cyclone development and associated impacts calls for EMC classification that incorporates dynamical insight into EMC large-scale setting, their track characteristics and associated surface weather. Here we classify EMCs based on their associated upper-tropospheric potential vorticity (PV) structures, providing a novel process-based framework for quantifying cyclone-associated surface weather and extremes. Using the self-organising map (SOM) algorithm to categorise ERA5-based PV distributions during EMCs from 1979–2020, six distinct PV patterns highlight different governing large-scale and synoptic settings. Each EMC type involves distinct mean and extreme surface weather signatures. Two clusters with high PV anomalies over the eastern Mediterranean dominate the regional annual precipitation. A strong ridge upstream of the PV trough during Rossby wave breaking leads to enhanced precipitation, compared to a similar PV configuration with a weak ridge upstream. Temperature anomalies during the cyclone passage are strongly linked to upper-level PV patterns, with certain EMC types causing notable near-surface warm and cold temperature extremes. In transition and warm seasons, occasional extreme localised precipitation is found despite the prevalence of shallow thermal lows with weak upper-tropospheric PV anomalies and generally no/low precipitation amounts. While the annual frequency of EMCs exhibits no significant trend, some clusters show contrasting trends. A notable increase in the frequency of non-precipitating EMCs, indicates a potential shift toward drier, but occasionally more extreme conditions in the region. Through this classification approach the link between EMCs large-scale setting and their surface impacts is systematically mapped. These findings provide a framework for the evaluation of cyclones and their prediction, and may improve strategies for managing the societal and environmental impacts of EMCs at weather and climate timescales.
- Article
(13178 KB) - Full-text XML
- BibTeX
- EndNote


The Mediterranean is known as a climate change hotspot (Tuel and Eltahir, 2020; Giorgi and Lionello, 2008), with the Eastern Mediterranean region experiencing persistent hot and dry summers, and more variable temperatures and rainfall events in winter (Kushnir et al., 2017). The region is influenced by mid-latitude, subtropical, and tropical weather systems that can bring extreme weather to the region (Alpert et al., 2005), among them, notorious floods and cold spells (Dayan et al., 2021; Hochman et al., 2022b). Such storms cause tremendous damage to infrastructure and human lives in the region (Hochman et al., 2022a). While general drying is expected in the future, there is yet high uncertainty with regard to changes in extreme precipitation in the region (IPCC, 2021).
Eastern Mediterranean Cyclones (EMCs) contribute most of the annual precipitation totals in the water-scarce Eastern Mediterranean and Middle East (Saaroni et al., 2010; Givon et al., 2026). Moreover, EMCs are the major contributor to extreme weather in this region, including precipitation (Sharon and Kutiel, 1986; Alpert et al., 1990; Ziv et al., 2006), strong winds (Raveh-Rubin and Wernli, 2015, 2016; Nissen et al., 2010), cold extremes (Klaider and Raveh-Rubin, 2023), or dust storms (Nissenbaum et al., 2023; Kalkstein et al., 2020) and compound events (i.e., multiple hazards occurring together) (Portal et al., 2024). As such, there is tremendous value in accurate and timely predictions of EMCs in this densely populated area. From a climatological perspective, it has been shown that the frequency of EMCs is decreasing (Maheras et al., 2000; Zappa et al., 2015), along with a drying trend in mean precipitation over the region. However, the response of extreme rainfall events remains uncertain, with some studies suggesting an increase in intensity or frequency (Drori et al., 2021; Philandras et al., 2011; Alpert et al., 2002; IPCC, 2021). This apparent contradiction, often referred to as the 'Mediterranean precipitation paradox,' has been discussed in previous studies highlighting the complex interactions between large-scale circulation changes and regional precipitation patterns (Alpert et al., 2002; Alpert, 2004; Zappa et al., 2015; Chericoni et al., 2025; Givon et al., 2026).
To improve our understanding of present and future precipitation patterns and extreme weather events in the Eastern Mediterranean, it is therefore crucial to understand the drivers shaping EMCs and their associated spectrum of hazards, including extremes. The Mediterranean Basin is known as a cyclogenesis region (Campins et al., 2000), with multiple processes involved in the genesis and evolution of Mediterranean cyclones throughout the basin. Most cyclones form through baroclinic instability, induced by disturbances to the upper-tropospheric westerly flow (Stevens et al., 2013; Egger, 1995). Additionally, diabatic processes, air–sea heat exchange, and topographic forcing play crucial roles in cyclone formation and deepening (Avolio et al., 2024; Stathopoulos et al., 2020; Shay-El and Alpert, 1991; Mattocks and Bleck, 1986) as well as in the formation of their associated precipitation (Flaounas et al., 2022).
In the Eastern Mediterranean, various types of cyclones exist, each characterised by distinct formation and evolution processes. One prominent winter cyclone is the Cyprus low, which develops in the cyclogenesis hotspot near Cyprus, south of the Turkish Plateau and is associated with baroclinic instability (El-Fandy, 1946; Alpert and Shay-El, 1994; Goldreich, 2003). Sharav lows typically develop in spring due to surface thermal anomalies over land, usually forming in the lee of the Atlas Mountains before rapidly propagating over North Africa and the Mediterranean (Trigo et al., 1999; Alpert and Ziv, 1989; Saaroni et al., 1998; Goldreich, 2003). The Red Sea Trough, another key system, can evolve into a closed pressure minimum under favourable atmospheric conditions, such as an upper-level trough; notably contributing to regional precipitation and occasionally triggering dust storms (Goldreich, 2003; Tsvieli and Zangvil, 2007; de Vries et al., 2013; Awad and Mashat, 2019; Ziv et al., 2022). Several case studies have examined the dynamics of these systems, together highlighting the variability in the development mechanisms and impact on surface weather (Raveh-Rubin and Wernli, 2016; Buzzi and Tibaldi, 1978; Flocas, 2000; Alpert and Ziv, 1989; Alpert et al., 1999; Krichak et al., 1997). Given the differences in cyclone formation processes, it is expected that their associated impacts, such as precipitation, temperature anomalies, or dust transport, also vary systematically with cyclone type as has been shown for the Mediterranean region as a whole (Givon et al., 2024; Rousseau-Rizzi et al., 2024).
To gain a broader understanding of cyclone variability beyond individual case studies, Eastern Mediterranean cyclones have been classified based on their location, intensity, and morphology (Flocas et al., 2010; Almazroui et al., 2015; Saaroni et al., 2010; Maheras et al., 2000) mostly focusing on their surface-related features. These studies have shown that cyclones forming in different regions and experiencing different pathways exhibit distinct seasonal and interannual variability, with Cyprus Lows dominating winter precipitation, while Sharav lows and Red Sea Troughs playing a larger role in transitional seasons. Additionally, some studies have assessed cyclone predictability, revealing that forecast skill varies depending on the synoptic environment and cyclone type (Maslova et al., 2021).
While several studies have explored cyclone impacts, most have considered cyclones as a general atmospheric feature rather than differentiating between cyclone types. As a result, it is not clear how specific cyclone types influence the associated impacts in the region. More specifically, there is a lack of generalised understanding of the upper-level forcing of EMCs (Zangvil et al., 2003; Ziv et al., 2006). Here, we aim to address the gap by classifying EMCs based on their upper-level PV distribution. This classification will allow us to gain valuable insights into the development mechanism and impacts of each one of the groups of cyclones in the region. Such process-based classification is essential to gain a comprehensive understanding of the natural variability of the regional cyclone formation and characteristics, shaped by the upper-level mechanisms. Specifically, we address the following questions:
-
What are the recurring patterns of upper-level PV that govern cyclone formation in the Eastern Mediterranean? Can these patterns describe the regional variability?
-
Are the recurring PV patterns related to the observed seasonal variations of different types of EMCs?
-
Are upper-level PV patterns linked to distinct surface impacts such as precipitation and extreme temperatures and winds during EMCs?
-
Are there observed trends for PV patterns during EMCs?
To address these questions, we analyse 686 EMC tracks using ECMWF reanalysis ERA5 from 1979–2020. Upper-level PV in the eastern Mediterranean is used to classify the EMCs. Section 2 details the methodology employed in this study, including the approach and the data sources used for classifying EMCs. Section 3 presents the six identified cyclone types, their upper-level PV patterns, associated surface impacts, and observed trends. Finally, Sect. 4 discusses the broader significance of these findings, offers recommendations for future research, and concludes.
To understand the variability of EMCs, we classify cyclone tracks by the upper-level PV pattern at the time of their minimum sea-level pressure (SLP) by employing the SOM algorithm to analyse the respective precipitation, 2 m temperature and 10 m winds fields. In the following, we provide details on the data and methods used.
2.1 Atmospheric data
The fifth reanalysis generated by the European Centre for Medium-Range Weather Forecasts (ECMWF), ERA5 (Hersbach et al., 2020), uses the Integrated Forecasting System (IFS, cycle 41r2). In this study, we use ERA5 data from 1979–2020 in the Eastern Mediterranean domain (27–53° N, 7–38° E), interpolated to a horizontal resolution of 0.5°. Specifically, we analyse PV on isentropic levels between 320 and 340 K at 5 K intervals, SLP, precipitation of both convective and large-scale components, 2 m temperature and 10 m winds.
Cold and hot extremes are identified based on the 2 m temperature, averaged daily to eliminate diurnal differences as a factor in temperature variability. To identify the strongest daily deviations across all seasons, we considered at each grid point the daily 2 m temperature anomalies (deviations) from the long-term (1979–2019) monthly mean. A cold or hot daily extreme is identified as a day with a temperature anomaly outside the 5th or 95th percentile range at each grid cell (Klaider and Raveh-Rubin, 2023).
2.2 Precipitation data
We quantify precipitation of two data sources.
-
Short-term forecasts of precipitation are taken from ERA5, providing 1 h accumulated large-scale and convective precipitation from 12–18 h forecasts. Shorter lead times are avoided due to potential spinup biases.
-
Satellite-based precipitation observations are provided by the Integrated Multi-satellitE Retrievals for GPM (IMERG) (Huffman et al., 2015), which combine data from core satellites (such as the GPM Core Observatory), a microwave constellation, infrared sensors, and surface precipitation gauges from 2000–2020. IMERG provides high spatial (0.25°) and temporal (half-hourly) resolution precipitation estimates, improving accuracy and filling gaps in remote regions.
ERA5 precipitation data were validated against IMERG satellite-based observations for their common period (2000–2020) to ensure their reliability for climatological analyses conducted in this study. This validation allows us to confidently extend our analysis to a longer climatological period (1979–2020) and to analyse a larger sample of cyclones. Additionally, the ERA5 dataset enables differentiation between convective and large-scale precipitation, facilitating a detailed examination of precipitation mechanisms associated with each EMC group. We analyse ERA5 precipitation accumulated for 1 and 3 d, beginning at 06:00 UTC a.m. of the day of minimum cyclone SLP to match the daily accumulated station data.
2.3 Combined Cyclone Tracking Algorithm
Considering the variability that exists among cyclone identification and tracking methods, which lead to diverging results in the Mediterranean, here we used a robust cyclone track dataset that takes into account several methods. These composite tracks combine outputs from ten cyclone-tracking approaches (Flaounas et al., 2023) from the period 1979–2020, derived from the ERA5 reanalysis hourly intervals (Hersbach et al., 2020). We select composite tracks with a confidence level of 5, indicating that at least 5 cyclone detection methods agree on the cyclone track. This choice is a compromise between too few resulting tracks for a higher confidence level and over-representation of spurious summer cyclones for lower confidence intervals. We then select cyclone tracks that are found within the domain of 27–38° N, 27–38° E (Fig. 1b) for at least one time step, resulting in 686 cyclone tracks. The peak time of the cyclone is defined based on the minimum SLP along the track within the domain.
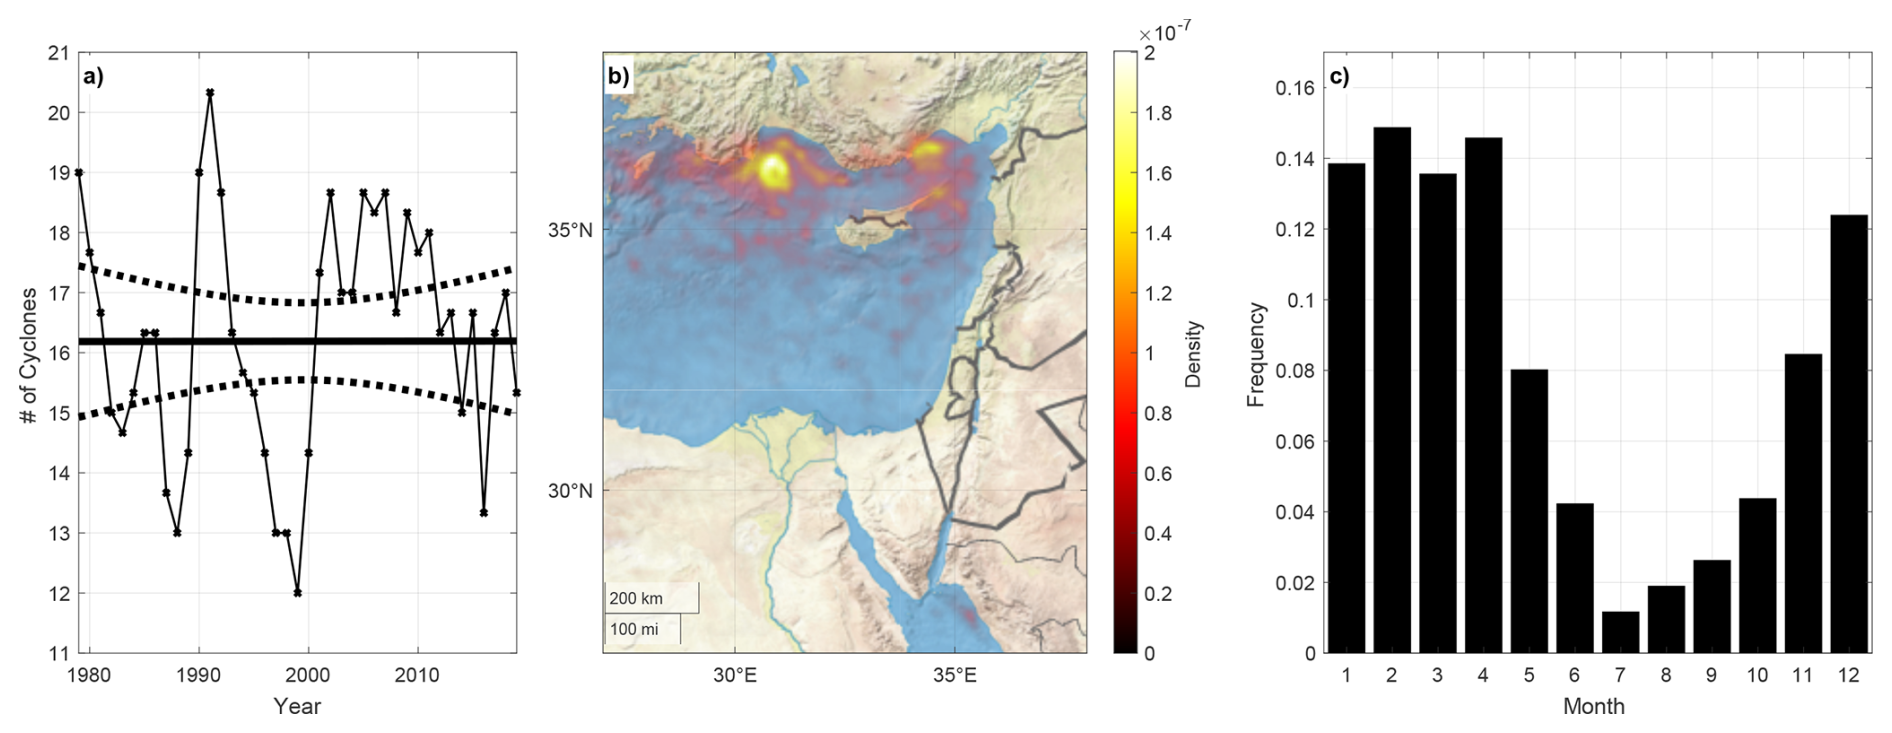
Figure 1(a) Time series of the smoothed 3 year moving mean of EMC seasonal occurrence from 1979–2020, markers indicate the total number of EMCs per year (for the precipitation season 1 August–31 July). The thin solid line connects the smoothed yearly values, and the thick solid line represents a linear trend fitted using a linear regression model. Dashed lines indicate the 95 % confidence interval of the linear fit. (b) Geographical climatological EMCs track density of all 686 EMCs (shading). (c) Monthly distribution of EMC occurrences. The relative frequency is normalised relative to the number of EMCs, i.e., sums up to one.
2.4 Self-Organising Map (SOM) algorithm
We classify EMCs during their peak intensity (minimum SLP) by analysing upper-level isentropic PV fields. We focus on the 320–340 K isentropic surfaces at 5 K intervals, vertically averaged within the fixed extended geographical region of 27–53° N and 7–38° E. This domain is more extended than the domain for the surface cyclone features, to include the extent of all upper-tropospheric large-scale PV features that can affect the cyclone domain. To categorise the PV patterns, we apply a SOM algorithm (Kohonen, 1982), an unsupervised neural-network method designed to project high-dimensional data onto a lower-dimensional lattice while preserving topological relationships. The SOM has been widely used in synoptic climatology to identify recurring large-scale atmospheric circulation patterns (e.g., Larson and Winters, 2025; Baiman et al., 2023; LaChat et al., 2024; Givon et al., 2021, 2024; Berkovic and Schloss, 2025).
Using the SOM algorithm, provided by MathWorks, we classify the PV patterns. Each EMC member is eventually attributed to one of the clusters, based on the similarity of their PV distribution.
Six clusters were selected to represent distinct recurring PV patterns, effectively representing the distinct upper-level atmospheric states. Increasing the number of clusters does not reveal new patterns; instead, it dilutes the significance of our impact analysis. Conversely, selecting a lower number of clusters may enhance the statistical significance of the results, but it fails to capture the full range of upper-level atmospheric states present in this region during EMC events.
The SOM was implemented using a 2×3 rectangular lattice (Fig. A1) with a hexagonal topology and Euclidean distance metric. The training consisted of 450 initialisation iterations followed by 550 training epochs. Each EMC is assigned to the SOM node (hereafter referred to as clusters for consistency with Mediterranean synoptic classification studies, Givon et al., 2024) by matching the EMC's PV structure to the most similar SOM cluster PV structures.
Since the upper-level PV structure associated with EMCs exhibits substantial variability, some EMCs may be assigned to different clusters in different runs of the SOM. This variability can cause individual PV patterns to shift between two clusters across different algorithm iterations. To mitigate this issue and ensure a more robust classification, we ran the SOM algorithm 100 times. The cluster assignment for each EMC was determined based on the most frequently occurring classification across these runs, requiring that the selected cluster appeared in at least 60 runs. This statistical approach reduces sensitivity to minor variations in clustering and provides a more stable and representative classification of the upper-level PV structures. Notably, only 11 EMCs changed their cluster assignments between runs, indicating a high degree of stability in our final classification.
2.5 Cyclone deepening rate
We diagnose the maximum deepening rate of EMCs using units of Bergeron (Sanders and Gyakum, 1980). This rate is normalised by the cyclone latitude and is given at time t by:
where ϕt is the latitude of the cyclone center at time t, SLPt−12 h is the sea level pressure (SLP) 12 h before time t and SLPt is the sea level pressure (SLP) at the time t.
Different from a commonly used 24 h window for cyclones over oceans, we employ a 12 h window due to the relatively short tracks (31 h on average inside the domain), less than the typical 3–3.5 d for systems forming over oceans. The window is centred around time t and moved along each cyclone track to account for the maximal deepening rate for each track. Based on this criterion, 8 EMCs with deepening rates greater than 1 Bergeron are classified as explosive cyclones.
2.6 Significance of the trends
To evaluate long-term trends of EMC frequency while reducing short-term inter-annual variability, we first smooth the data using a 3 year moving mean. The statistical significance of long-term trends is evaluated with the Mann–Kendall (MK) test for the smoothed data, using a significance level of the test, α=0.1 and resulting in a binary result of 1 indicating a significant trend, or 0 if not.
It is important to note that the trends are calculated based on a relatively small number of cyclones (order of 100). However, despite the small sample size, the trend may indicate the beginning of a pattern which may continue in the warmer future. Therefore, when interpreting the trends, this limitation should be considered, particularly regarding long-term changes and statistical significance.
The analysis uses annual periods running from 1 August–31 July rather than calendar years. Therefore, the first and last seasons in the record (e.g., the 1979 and 2020 seasons) are partially truncated, and the trend calculation does not include the calendar year 2020, as the corresponding season (1 August 2020–31 July 2021) extends beyond the dataset period.
3.1 EMC characteristics
A total of 686 EMCs were identified entering the study domain during the analysis period from 1979–2020. Figure 1 summarises the key climatological characteristics of these systems. Panel (a) shows the annual frequency of EMCs, revealing substantial inter-annual variability but no significant long-term trend according to the MK test. The climatological mean track density (Fig. 1b) highlights preferred regions for centres of EMC presence, particularly north of Cyprus and along the Turkish coast. EMC occurrence is enhanced during the winter and early spring months, with peak activity from December to April at 14 % occurrence frequency (Fig. 1c). These EMC characteristics are in line with known regional patterns (Nissen et al., 2010; Maslova et al., 2021; Alpert et al., 2004; Flocas et al., 2010), and support the applicability of our chosen EMC track data.
3.2 SOM classification
Six meaningful clusters are selected for the SOM analysis, organised into a so-called map that reflects gradual transitions between EMC types, with neighbouring clusters sharing similar PV distributions. Most clusters are characterised by high PV in the upper troposphere, typically organised in a trough-like structure upstream of the EMC centre. Each cluster is characterised by the composite mean PV and SLP of its EMC members (Fig. 2). Cluster 1 is marked by high PV values and strongly-tilted wave-breaking structure with a south-west-to-north-east-tilted trough, while the neighbouring Cluster 3 exhibits a similar PV pattern but with weaker wave-breaking and PV values and a less pronounced ridge upstream, over the central Mediterranean and Europe. In contrast, Cluster 2, which includes the largest fraction of EMCs (22 %), has local PV values comparable to values seen in Cluster 1 over the Middle East but is marked by a wide and deep trough and no wave breaking. Cluster 4 shows a more zonal PV distribution with lower PV and PV gradients compared to its neighbouring cluster 2. Clusters 5 and 6 are the least frequent, accounting for 13 % and 10 % of the EMCs, respectively. Both are characterised by relatively low PV in the eastern Mediterranean region. However, Cluster 5 remains associated with wave breaking, while Cluster 6 exhibits enhanced PV in the northwestern part of the domain, north-west of Greece and Italy.
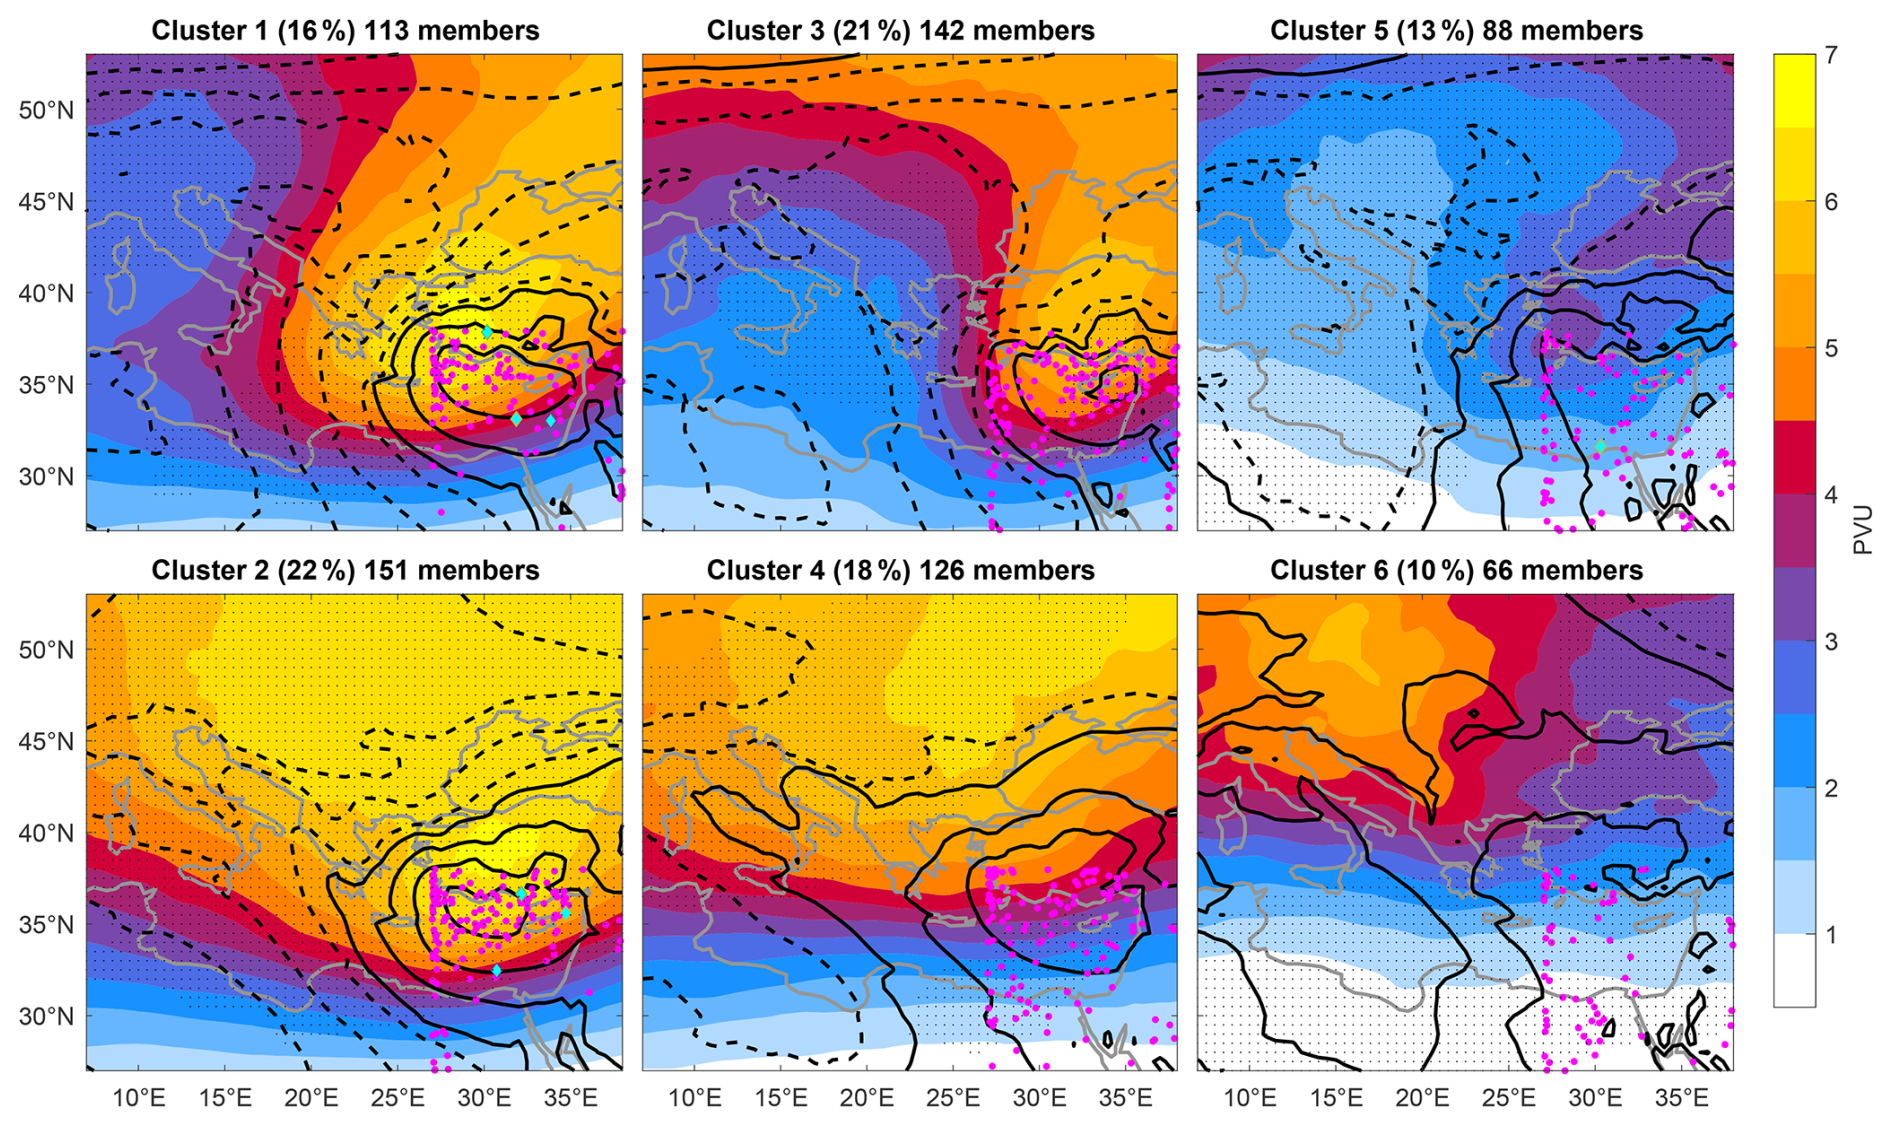
Figure 2Composite mean of upper-level (320–340 K mean) PV (PVU, shading) and SLP (black contours at 2 hPa intervals, dashed over 1015 hPa) at minimum SLP time along the track within the study domain (magenta dots, blue diamonds marking explosive EMCs). Black stippling indicates a 99 % significance level (using the Gridded Student's T-test) of the PV field concerning the total EMC average. The number of EMCs and their percentage out of the total are indicated in the title of each cluster panel (see text for details).
Considering the composite SLP distribution, Cluster 1 shows a local minimum in SLP over Cyprus, indicative of relatively deep cyclones, with a composite mean central pressure of 1008.6 hPa. Cluster 3 is similar but has, on average, a shallower (1009.7 hPa) and more northeastern cyclone centre, located between the coasts of east Cyprus and west Lebanon, with a markedly less pronounced upstream ridge. Cluster 2 has the deepest SLP minima (1007.2 hPa), located west of Cyprus, while Cluster 4, with a shallower intensity (1008 hPa), still exhibits a distinct low in the climatological cyclogenesis region near Cyprus. Differently, Clusters 5 and 6 show SLP minima in the southeast Mediterranean near the Red Sea, although without a clear closed low within the domain, suggesting more variability in the location of the cyclone centres. Indeed, Fig. 2 shows that the location of the minimum SLP of individual tracks has a larger spread in Clusters 5 and 6. The 8 explosive EMCs, highlighted in Fig. 2, can be found in Clusters 1 and 2, indicating a preference for PV structures associated with wintertime cyclone configurations, with one additional exceptional case identified in Cluster 5. In fact, most of the cyclones (55 %) are already in their weakening phase when they enter the domain, as also indicated by the clustering of minimum SLP locations near the 27 E meridian. This suggests that for a significant number of systems, the mature phase of the cyclones occurs upstream of the domain boundary, and they affect the eastern Mediterranean domain at their decay phase. The results also highlight how surface SLP features – such as the location and depth of minima – correspond closely to upper-level PV structures, particularly the positioning of the PV troughs and ridges that guide cyclogenesis in this region.
3.3 Seasonality
While regional EMCs occur mostly during the extended winter season (Fig. 1), the SOM classification highlights a more refined and distinguished seasonal signature for each of the resulting clusters. In January and December, there is a higher frequency of Clusters 1 and 3 (Fig. 3), indicating that these atmospheric patterns are more prevalent at the onset of winter. This is consistent with the typical intensification of upper-level troughs and stronger baroclinic activity during winter, favouring the development of pronounced PV anomalies. In contrast, Clusters 2 and 4 primarily comprise the late winter, with Cluster 2 occurring mostly between January to March and early spring, while Cluster 4 occurs most frequently during March and April. This suggests that there is a shift in the regional dynamical cyclone lifecycles as winter progresses into spring. As expected by their overall lower PV, Clusters 5 and 6 appear mostly during the transitional seasons of autumn and spring (respectively). These clusters appear even in summer, but with lower frequencies, highlighting their association with different atmospheric conditions typical of these periods. These findings highlight the seasonal variability of the EMCs PV patterns and underlying dynamical changes, with specific clusters associated with distinct phases of the seasonal cycle. At the same time, these results suggest that a seasonal distinction alone would not resolve the full variability of EMCs, as most clusters also occur outside of their typical season, and different EMC types occur at any given month.
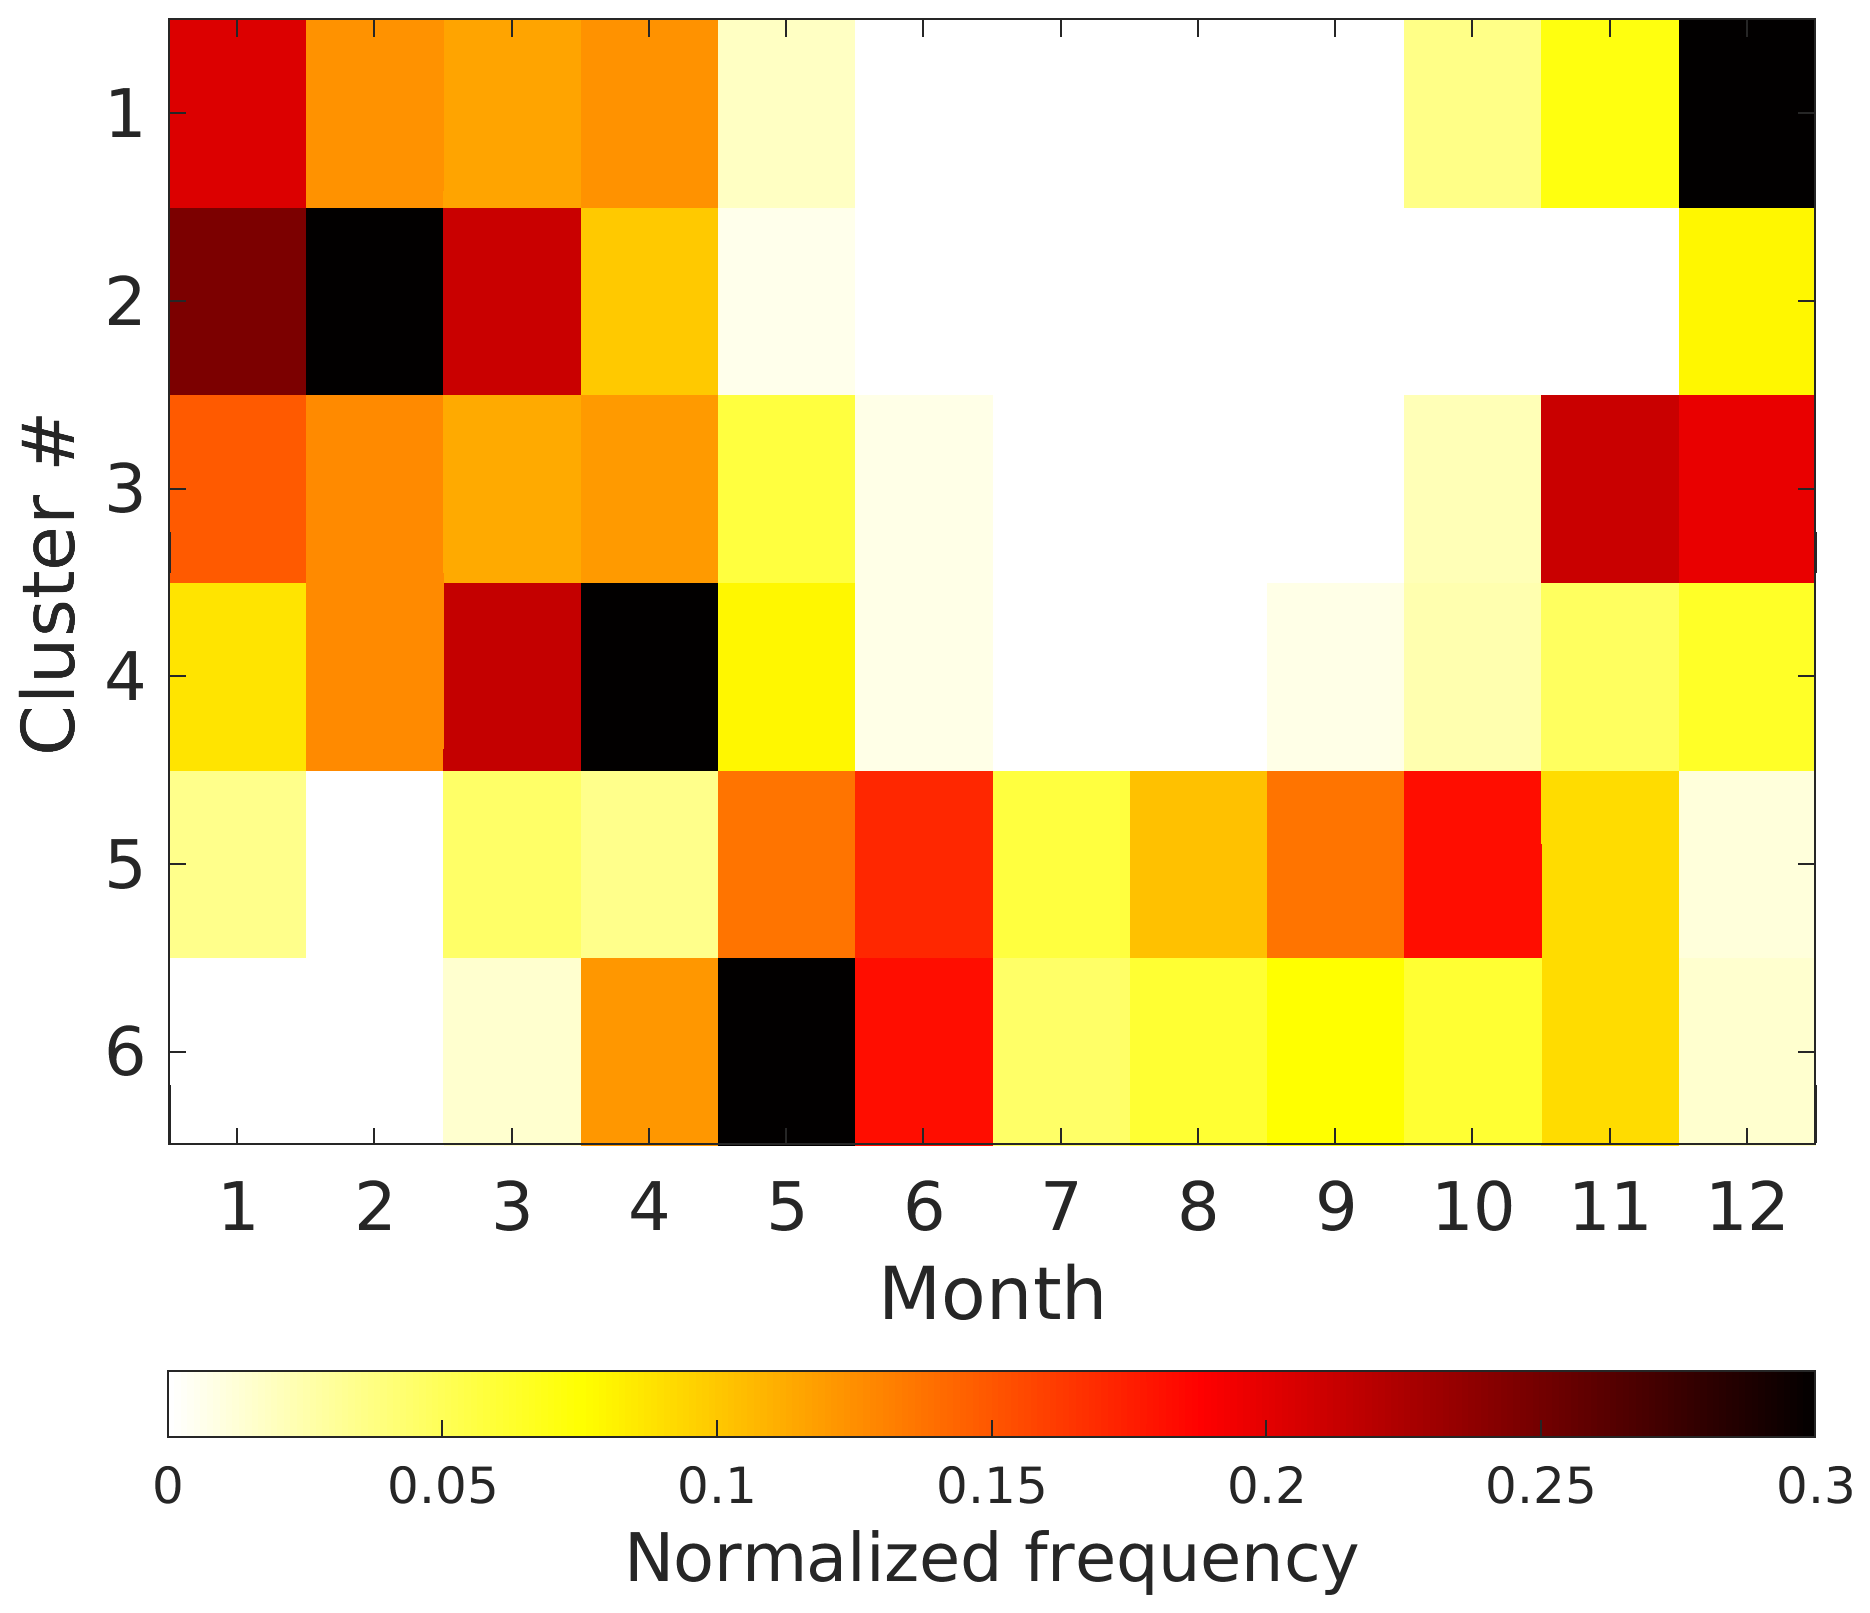
Figure 3Monthly distribution of EMC occurrences by cluster. The relative frequency (shading) is normalised relative to the cluster size, i.e., each row sums to one.
Table 1Mean and standard deviation values of key track characteristics for each EMC cluster. The values include the deepening rate over 12 h (Bergeron), minimum SLP along the track (hPa), duration of the EMC within the study domain (h), and total distance travelled (km), both inside the domain and overall the life-cycle of the EMC.
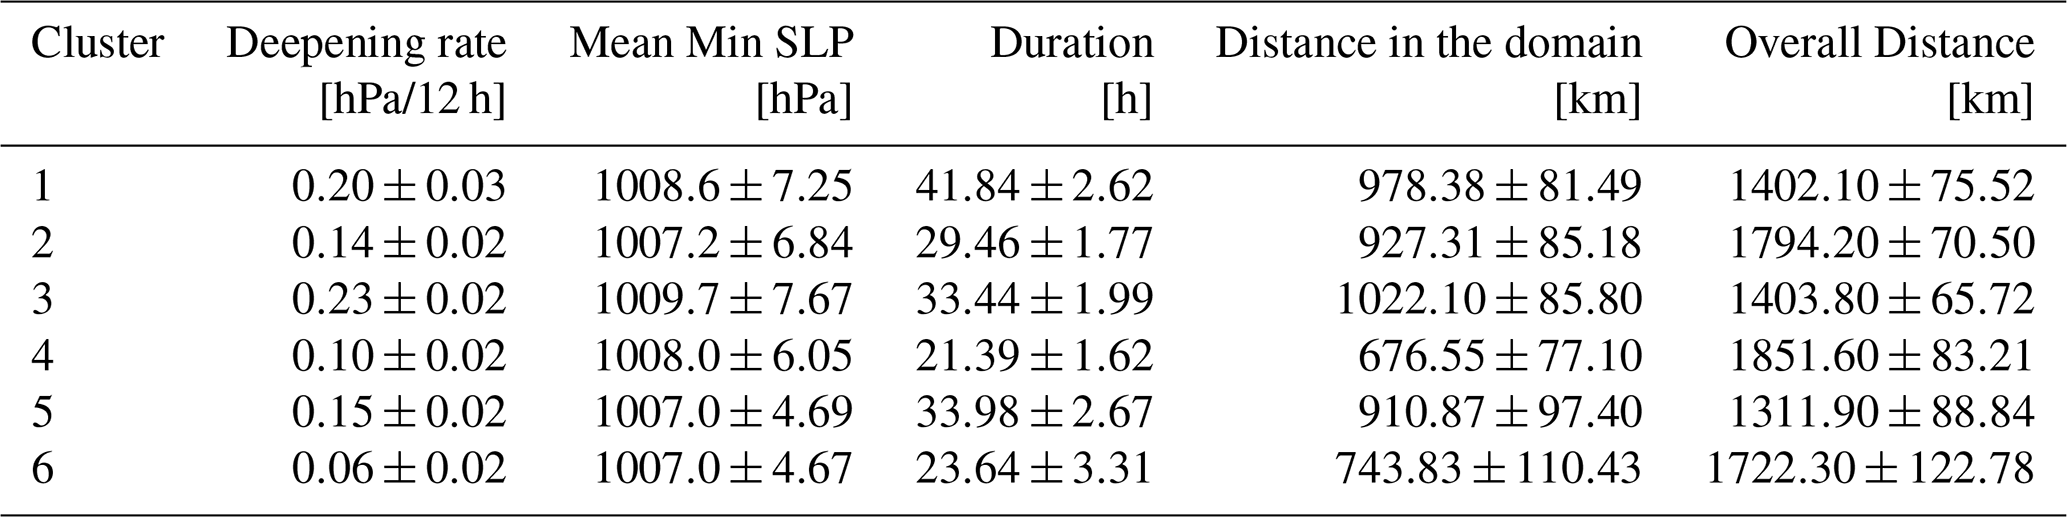
To further quantify the dynamical characteristics of each cluster, Table 1 summarises mean and standard deviation values of key EMC track properties, including deepening rate, mean minimum SLP, duration within the domain, and distance travelled both within the defined domain and along the entire cyclone track. Cluster 1 is characterised by a relatively high deepening rate and the longest duration (∼41.84 h), along with moderate distances travelled both within the domain (∼978 km) and overall (∼1402 km). This indicates long-lived, dynamically active systems that tend to remain partly stationary during their time in the research domain, particularly over the Cyprus cyclogenesis region, most likely benefiting from persistent baroclinic conditions. In contrast, Cluster 2 exhibits a lower deepening rate and shorter duration (∼29.46 h) but travels significant distances within (∼927 km) and outside the domain (∼1794 km). EMCs in Cluster 3 display the highest deepening rate, although this cluster has no explosive cyclones. They have a moderate duration (∼33.44 h) and moderate total distance (∼1404 km) but the longest distance within the domain (∼1022 km). Cluster 4 contains the shortest-lived (∼21.39 h) and weakest cyclones (lowest deepening rate), travelling shorter distances inside the domain (∼677 km) yet covering the largest total distances (∼1852 km). This indicates transient systems that quickly pass through the domain without significant intensification but continue travelling extensively to the East of the domain. Clusters 5 and 6, typical of transition seasons and summer, reflect characteristics of thermally driven or weakly baroclinic cyclones like Sharav lows, as will be shown in Sect. 3.5. The EMCs in Cluster 5 show moderate deepening rates and duration (∼33.98 h), with moderate distances travelled inside (∼911 km) but the shortest overall distances (∼1312 km), consistent with relatively stationary cyclones influenced by weak upper-level forcing and local thermal gradients. Conversely, EMCs in Cluster 6 exhibit the lowest deepening rate and short durations (∼23.64 h) but relatively large overall distances (∼1722 km). These features suggest weaker systems, likely influenced by transient upper-level disturbances or weaker baroclinicity, yet displaying notable mobility beyond the study domain. These characteristics align well with the seasonal variability observed in EMC behaviour in the region.
3.3.1 Comparison of ERA5 and IMERG Precipitation
We first compare precipitation from ERA5 and IMERG, by cluster, to assess the suitability of ERA5 precipitation forecasts for the long-term climatological comparison among clusters. Examining composites of 1 hourly precipitation at peak cyclone intensity by cluster (Fig. 4) allows a comparison in terms of geographical features and the intensity of precipitation hotspots. Generally, both the geographical distribution of precipitation and the differences among clusters agree well when comparing the IMERG and ERA5 data. The higher resolution of IMERG allows for more detailed structures of precipitation and more intense maxima compared to ERA5. Thus, while ERA5 is useful for comparative climatological studies, one should note that ERA5 precipitation likely misses some geographical hotspots, crucial for assessing surface impacts, especially over land near coastal regions (Lavers et al., 2022).
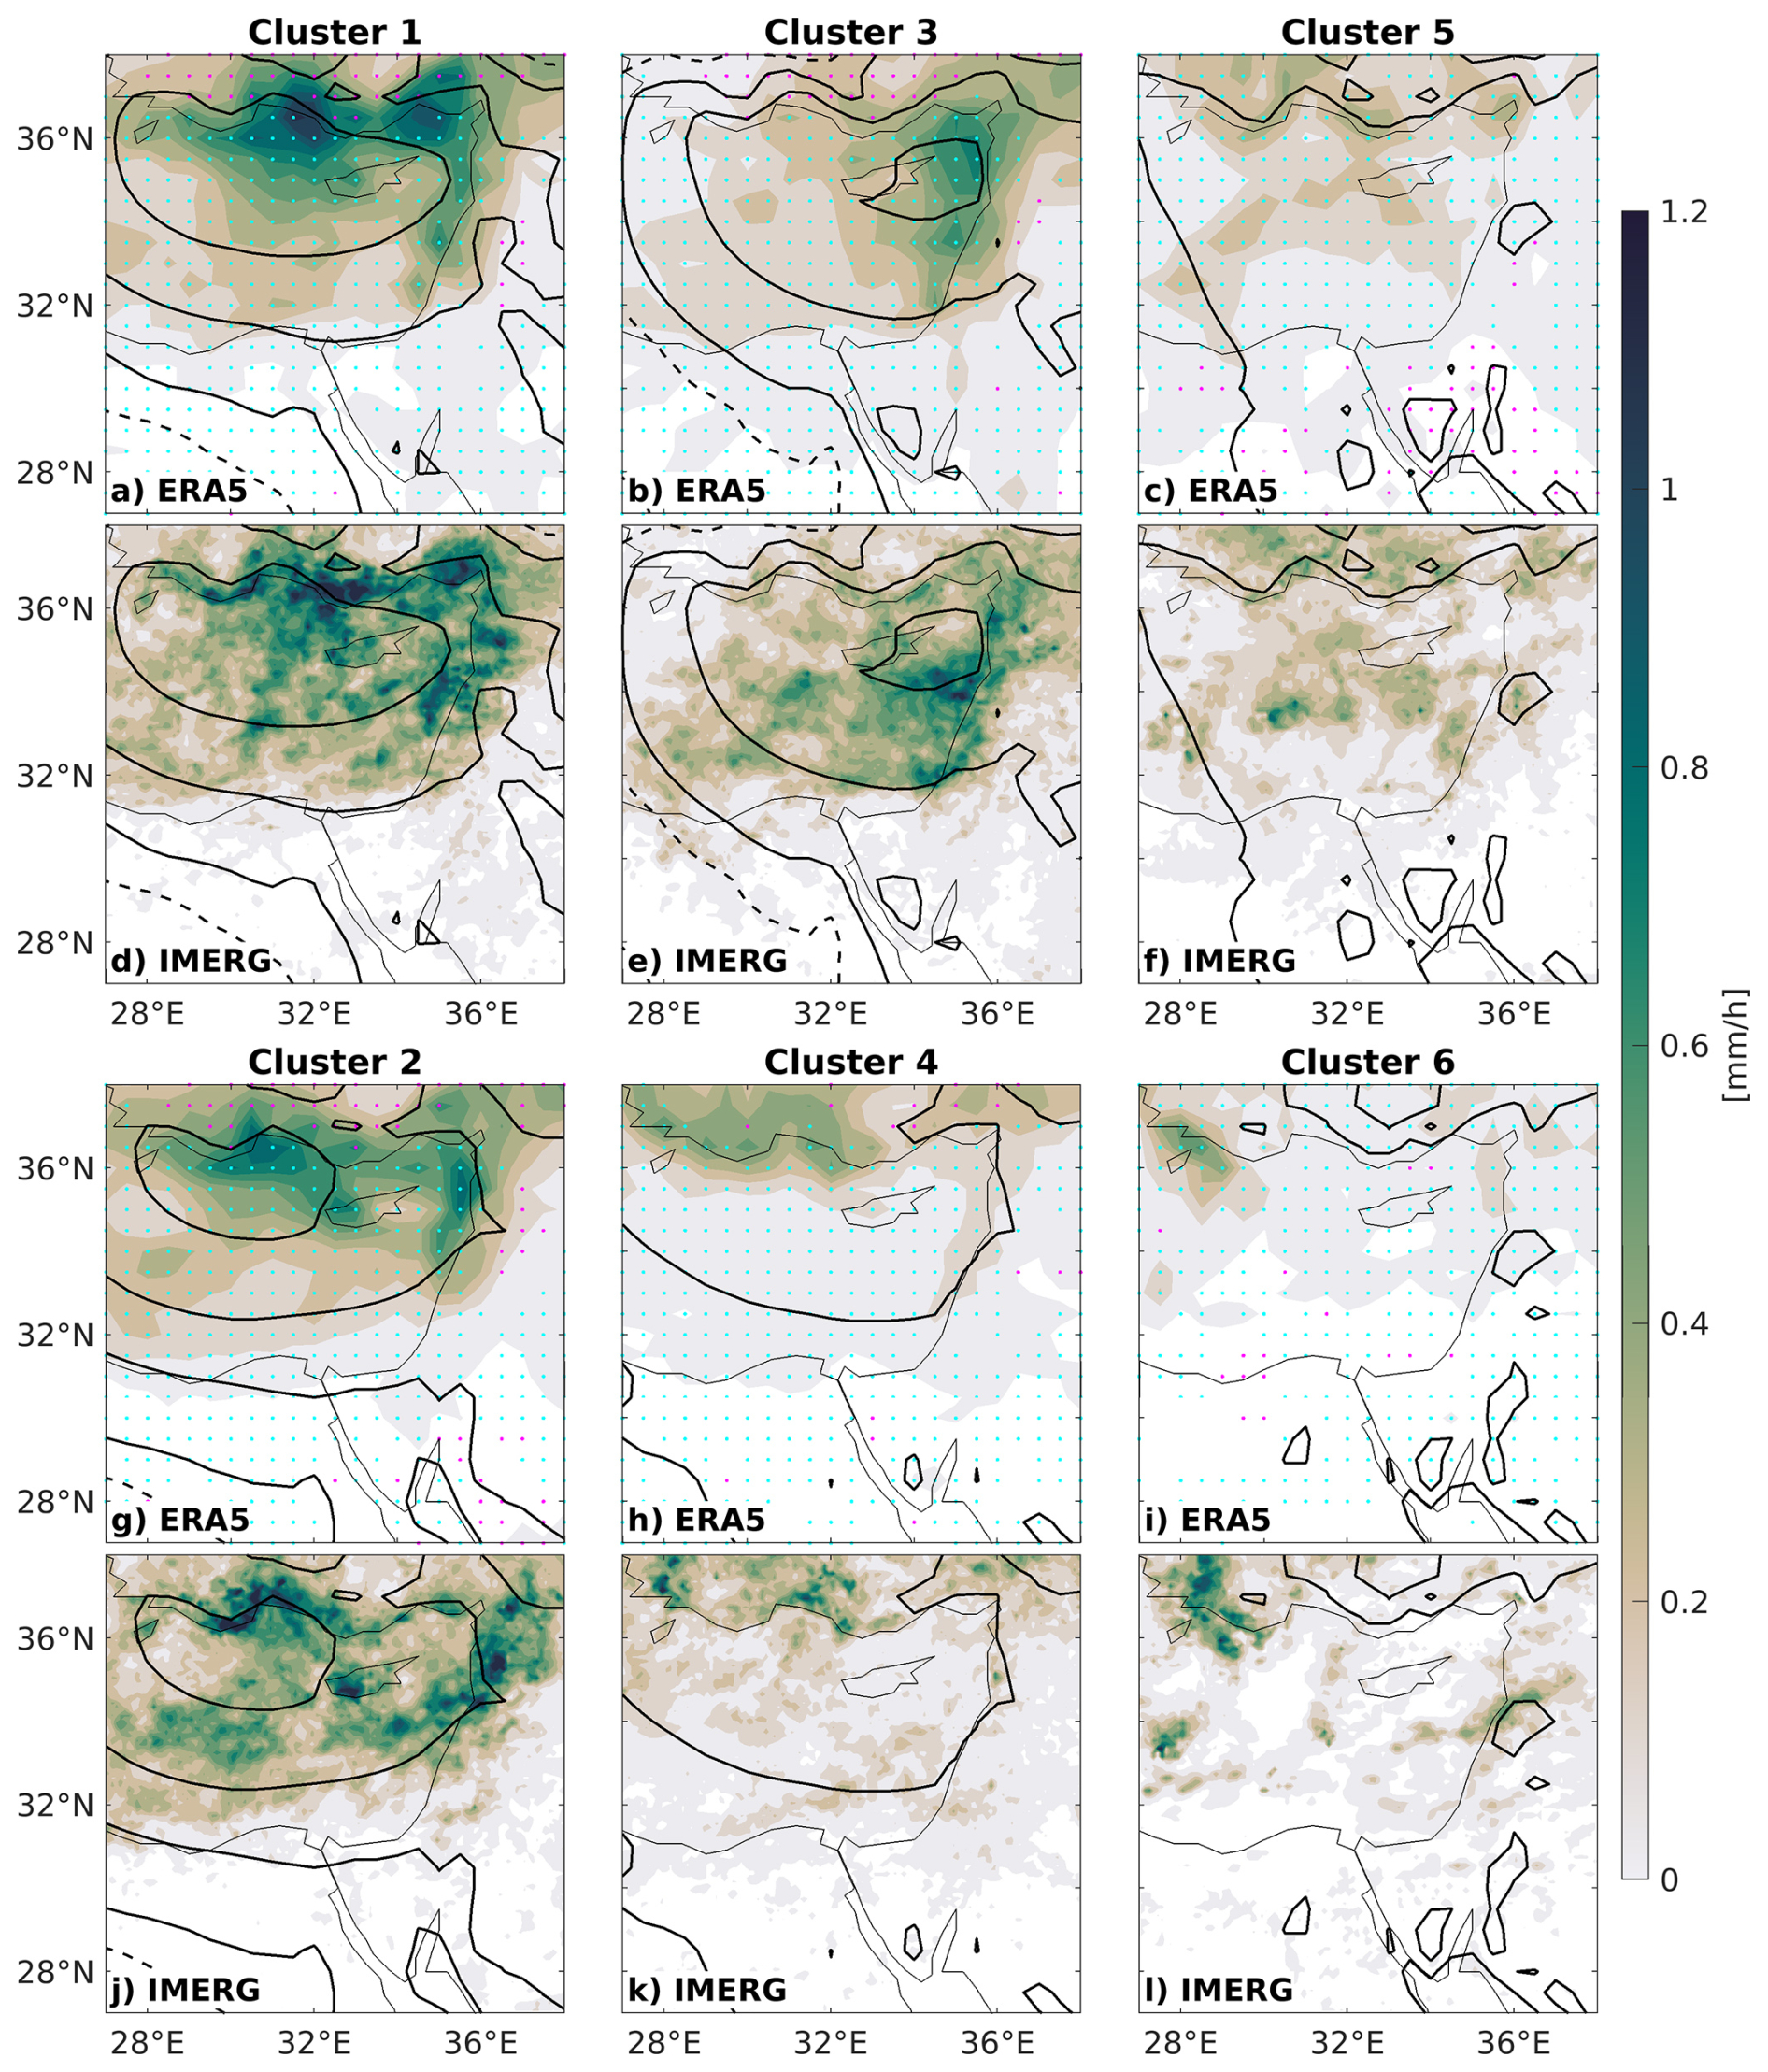
Figure 4Composite 1 h precipitation (mm h−1, shading) for ERA5 (top panels for each cluster (a–c, g–i)) and IMERG (bottom panels for each cluster (d–f, j–l)) during the hour ending at minimum SLP time, for the years 2000–2020, covered by both datasets. SLP is shown in black contours at 2 hPa intervals (dashed over 1015 hPa). In the ERA5 panels, light blue and magenta dots mark grid points dominated by (more than 60 % of the total precipitation) convective precipitation or large-scale precipitation, respectively.
Further examination of the precipitation composites reveals large differences among EMC clusters. Precipitation in the winter clusters 1–4 peaks along the east coast of the Mediterranean basin and in the lee of the Turkish mountains. Although the geographic location and pattern of precipitation impacts are similar, the intensity varies considerably between clusters. Cluster 1 shows a broad precipitation signature across the entire region, especially south of Turkey, as well as a hotspot near the eastern coastal areas, and over the Mediterranean Sea north of Egypt. Cluster 2 also has a broad precipitation signature reaching southern areas north of Egypt, but it is slightly less intense than Cluster 1. Cluster 3 presents a more limited precipitation signature compared to the previous clusters, without major precipitation along the Turkish coasts. Conversely, precipitation in Cluster 4 mainly occurs along the Turkish coast. The latter differences emerge from the very different PV signature in those clusters, with a tilted PV streamer in Cluster 3, fixing precipitation ahead near the eastern coast, compared to a zonal PV orientation in Cluster 4, with precipitation spread along the southern coast of Turkey (Fig. 2).
Clusters 5 and 6, corresponding to the transitional seasons and summer, exhibit different precipitation patterns and precipitate less on average. Cluster 5 exhibits rain signatures primarily over the sea and southern Turkey, with weaker intensities compared to the winter-associated clusters. Cluster 6 has the weakest precipitation signature overall, with a few notable areas that are mainly visible in the IMERG data. Despite the reduced precipitation, additional analysis indicates that these clusters are characterised by relatively high total column water (not shown), consistent with their occurrence during the warmer seasons. The limited precipitation in these clusters is, in fact, associated with the lack of sufficient dynamical forcing for ascent to support precipitation (not shown).
Precipitation in ERA5 is predominantly convective, indicating that model precipitation in the region is highly sensitive to the choice of parameterisation, especially over the sea and coastal regions. In locations where precipitation is dominated by convective, IMERG often captures precipitation hotspots where ERA5 shows weaker signals. Yet, the distinction by clusters shows fundamental differences in the variability of precipitation, which are consistent across datasets. We thus employ ERA5 precipitation in the next sections for its longer temporal coverage to examine precipitation climatologies across EMC types.
3.3.2 ERA5 3 d accumulated precipitation
To account for sustained precipitation during the entire event of EMC passage, we next examine the 3 d accumulation of precipitation, centred around the minimum SLP time. Figure 5 reveal strong differences in precipitation hazards among the clusters. The winter clusters contribute the most to the overall precipitation, with maxima to the east of the mean minimum SLP centre. In particular, Cluster 1 exhibits the most intense composite mean precipitation, with prominent maxima near the eastern coastal areas exceeding 42 mm. Cluster 2 also shows considerable precipitation, with a notable peak to the east of the mean minimum SLP centre. In contrast, the transition-seasons Clusters 5 and 6 are characterised by less precipitating EMCs, with only 5 mm along the eastern coast and ∼10 mm near the northern coasts. Clusters 3 and 4 show an intermediate precipitation pattern, with more limited precipitation signatures compared to Clusters 1 and 2. Similar to the 1 h precipitation, the precipitation in Cluster 4 is concentrated along the northern part of the region, compared to Cluster 3, where precipitation extends along the eastern coast of the Mediterranean.
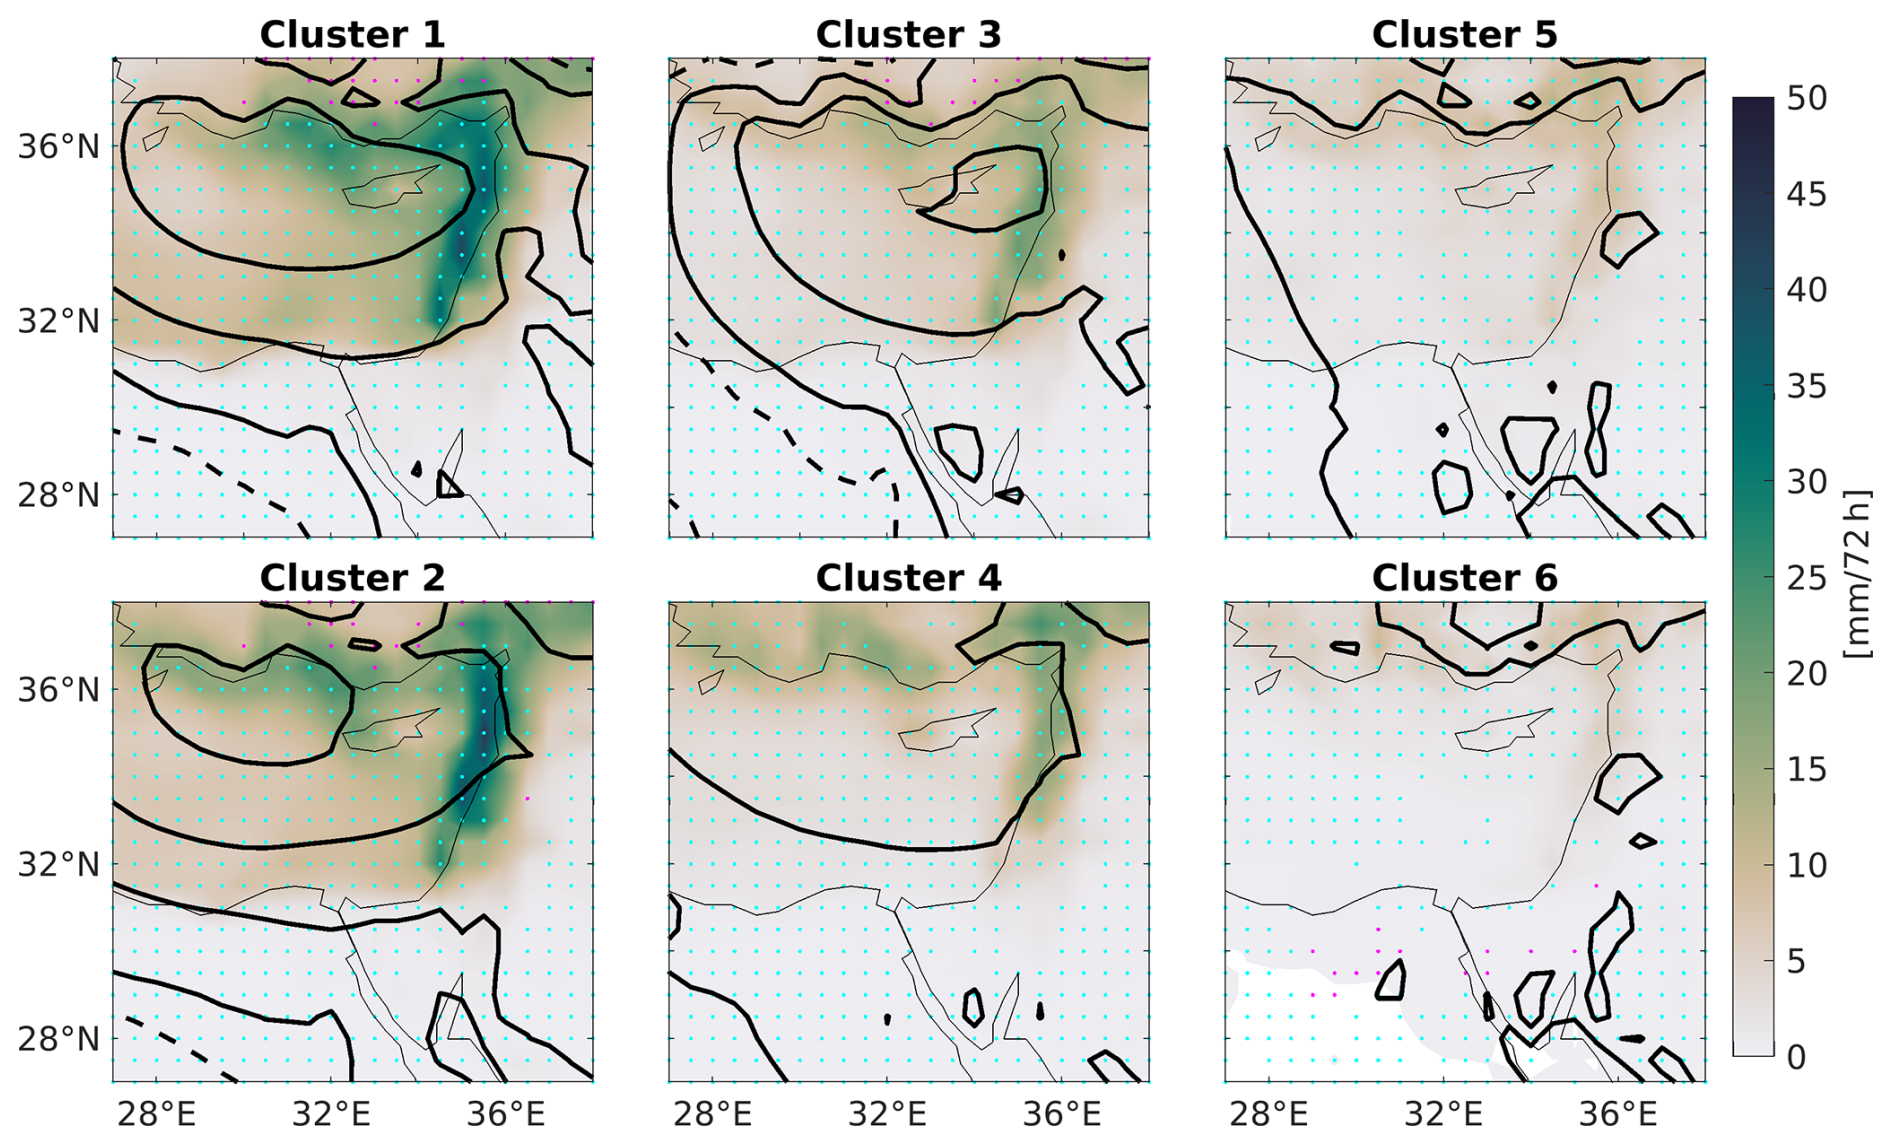
Figure 5Composite mean 3 d ERA5 accumulated precipitation (shaded, white is 0, mm/72 h), beginning at 06:00 UTC a.m. of the day of minimum cyclone SLP, by cluster. Cyan-dotted areas indicate regions where ERA5 convective-scale precipitation exceeds 60 % and magenta-dotted areas where ERA5 large-scale precipitation exceeds 60 %. SLP is shown with black contours at 2 hPa intervals, with dashed contours for values above 1015 hPa. Note the smaller domain compared to Fig. 2, covering only the cyclone-detection region.
Across the entire Mediterranean, convective precipitation is generally not dominant during winter (Raveh-Rubin and Wernli, 2015). Differently, in the Eastern Mediterranean, Fig. 5 indicates that most precipitation associated with EMC events in this area is of convective scale (cyan dots in Fig. 5), with large-scale precipitation (magenta dots in Fig. 5) dominating only over southern Turkey in the winter-dominant Clusters 1–3. The persistent dominance of convective precipitation, south of Turkey, in the southern and eastern parts of the domain, even in winter, highlights the distinctive behaviour of Eastern Mediterranean cyclones. This is consistent with Portal et al. (2025), who shows that lightning frequency – a proxy for deep convection – is enhanced over the north-eastern Mediterranean during cyclone conditions in winter. Moreover, even when increasing the threshold to 80 %, most grid points, particularly those over the sea, remain dominated by convective precipitation, underscoring the robustness of this signal.
During the transition seasons and summer, the dominance of convective precipitation remains consistent with previous findings (Portal et al., 2025). Cluster 5, which shows a strong autumnal signal and is linked to Red Sea Trough systems, exhibits convective precipitation patterns characteristic of active Red Sea Troughs (de Vries et al., 2013; Krichak et al., 2012; Ziv et al., 2022).
Cluster 6, on the other hand, shows a predominance of large-scale precipitation over the Sinai Peninsula and north Egypt, possibly enhanced by tropical moisture sources (Ciric et al., 2018; Rubin et al., 2007). Yet, the dominance of ERA5 convective precipitation, stemming from the convective parametrisation, further suggests potentially high model uncertainty during these events.
Cluster 1 has more precipitation than Cluster 2 in the Eastern Mediterranean region. Although Cluster 1 EMCs are, on average, shallower and with lower upper-tropospheric PV over the eastern Mediterranean, the accumulated precipitation over three days is comparatively higher by up to 10 mm in most regions. This highlights the importance of the regional distribution of PV, controlled by the life-cycle of the baroclinic Rossby wave. In Cluster 1, a clear signature of anticyclonic Rossby wave breaking (AWB) is prevalent, downstream of an enhanced ridge. This large-scale configuration supports different surface cyclone lifecycle and duration. Indeed, the average duration of cyclones in Cluster 1 is more than 50 % longer than in Cluster 2 (Table 1), and the mean deepening rate is stronger. This implies that Cluster 1 is associated with more stagnant and rapidly deepening EMCs than Cluster 2, controlled by the large-scale wave-breaking configuration. This prolonged duration can result in more precipitation when accumulating over longer periods. This analysis aligns with common knowledge among forecasters in this region (Goldreich, 2003; Zangvil and Druian, 1990), namely, a south-west–to–north-east–tilted trough often leads to greater precipitation impact. A similar AWB trough structure also appears in Cluster 3 and exhibits similar seasonality. However, despite these similarities, it is evident that cyclones in Cluster 3 produce considerably less precipitation compared to Cluster 1 cyclones. This difference can potentially be explained by the weaker upper-level PV and PV gradients observed in Cluster 3 compared to Cluster 1 (Fig. 2). Along the same lines, Clusters 2 and 4 also exhibit similarities in the shape and distribution of upper-level PV. Nevertheless, Cluster 4 is associated with notably lower precipitation amounts compared to Cluster 2, as well as relatively lower PV and PV gradients. Cluster 4 occurrence is shifted towards later winter and spring compared to Cluster 2, explaining its lower PV. In summary, the composite analyses reinforce the inherent relationship between the spatial distribution and gradients of upper-level PV and surface precipitation impacts.
3.4 Precipitation distribution, variability and extremes
It is important to consider the distribution of the accumulated precipitation that constructs the spatial composite mean patterns. While the mean provides a view of most cases, it may obscure information about extremes, their number and location. Moreover, relying solely on the mean values does not indicate whether these values stem from a few intense events or if the precipitation distribution is more evenly spread across the cases. Therefore, for each of the 686 EMCs we examined the distribution of ERA5 3 d accumulated precipitation within the research domain and cluster type (Fig. 6a). Clusters 1, 2, 3 and 4 are characterised by a relatively uniform distribution, indicating that precipitation events within these clusters consistently cover a wide range of intensities, and there are no isolated heavy rainfall events that dominate the distribution. Conversely, other clusters are primarily influenced by a few individual events contributing substantial rainfall amounts. Cluster 5, for instance, includes many events with little or no precipitation and a long tail of extremes, while Cluster 6 features consistently low precipitation values throughout. Notably, many of the extreme precipitation values in the distributions are associated with explosive EMCs, which are marked by the letter “b” in Fig. 6a.
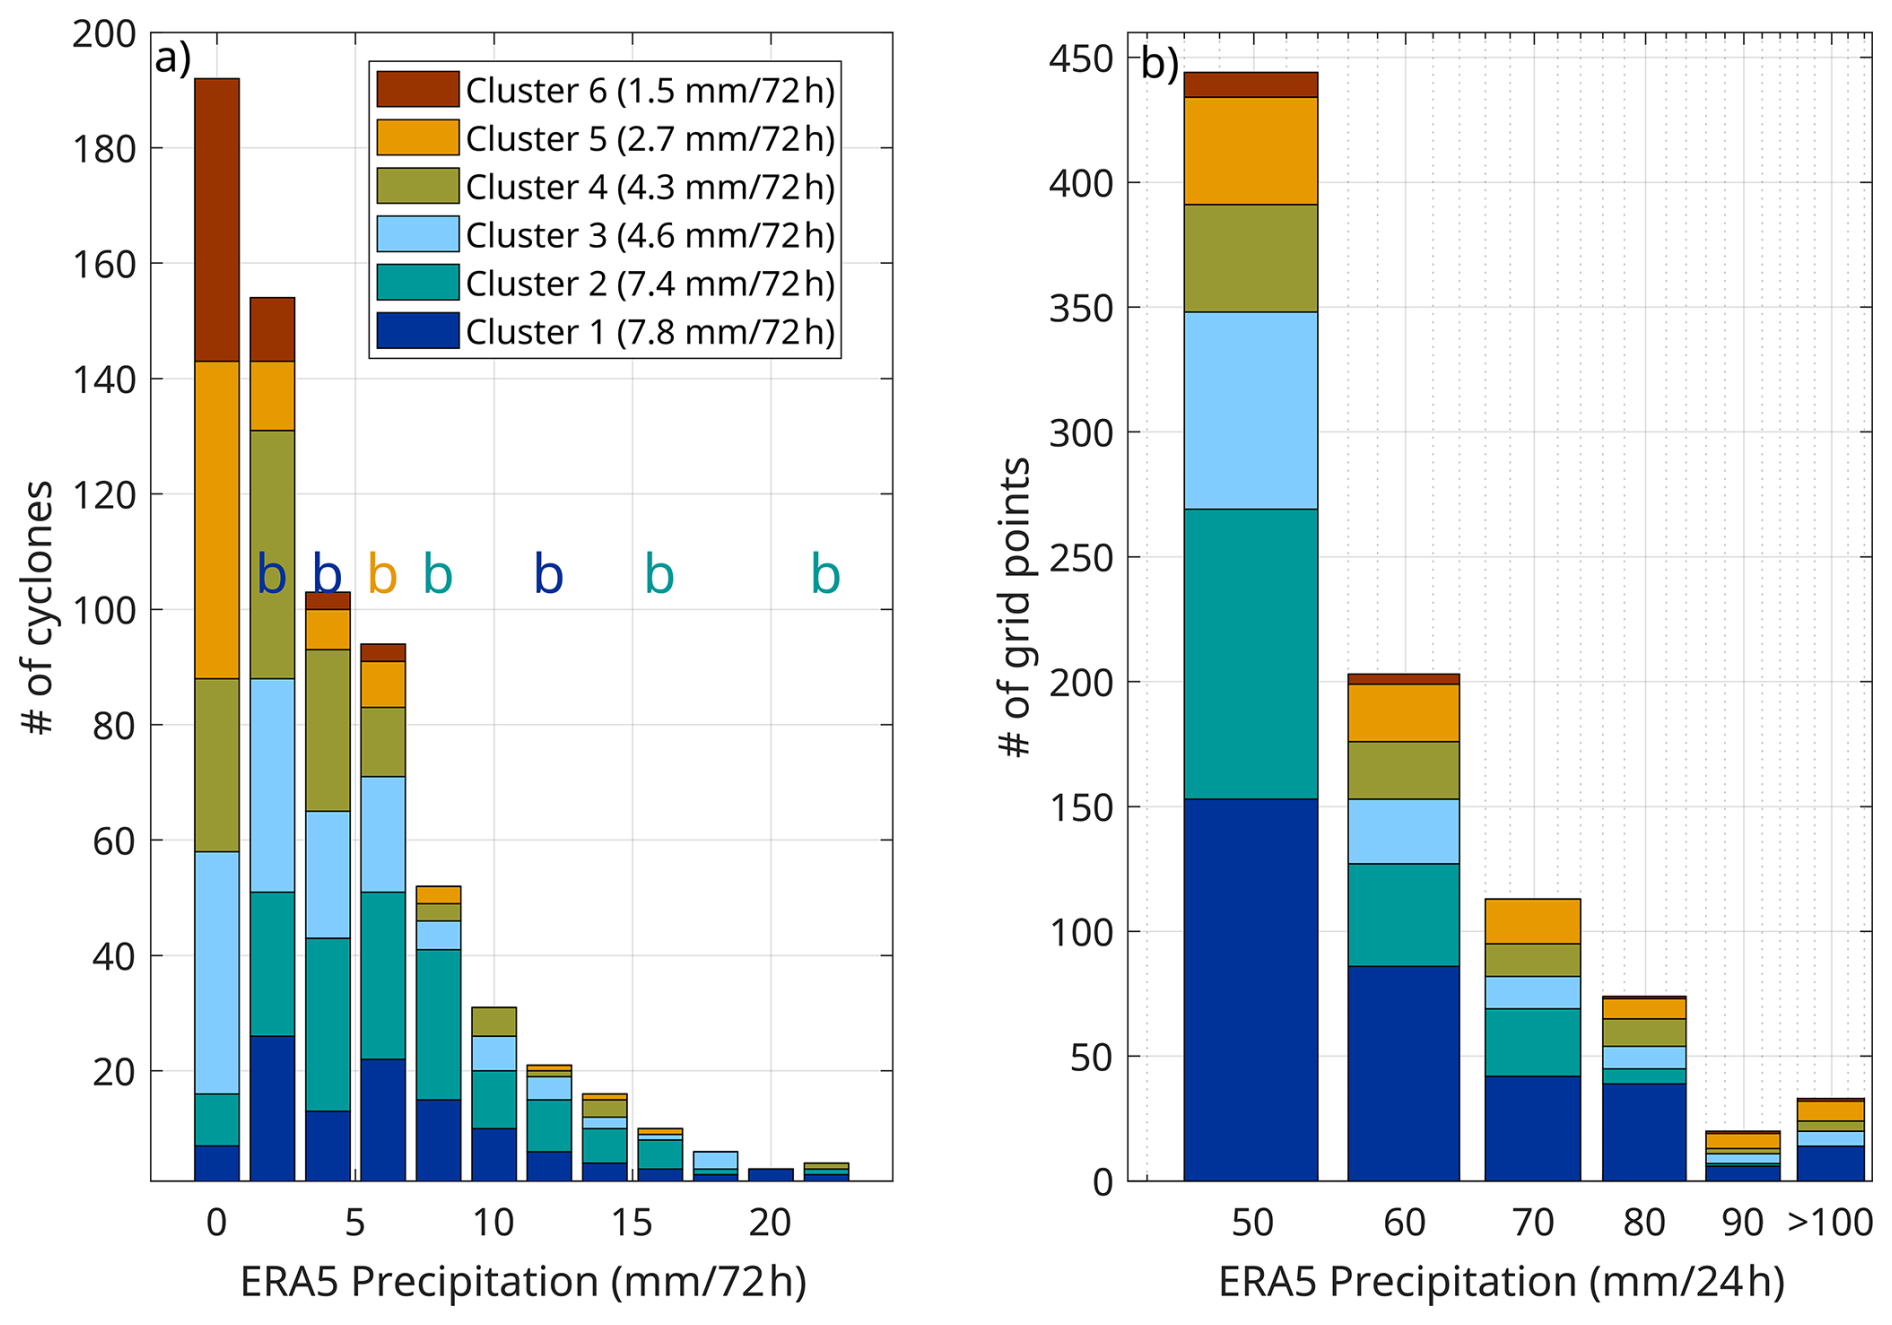
Figure 6(a) The distribution of mean 3 d ERA5 accumulated precipitation within the domain, per EMC. Bars are grouped by precipitation bins and colour-coded by cluster, with the legend indicating the cluster number and its overall mean grid-point precipitation (mm/72 h). The letter b marks explosive cyclones (Bergeron in 12 h≥1) in their corresponding bins, colored by cluster. (b) Distribution of 24 h ERA5 accumulated precipitation at the grid-point level within the domain, aggregated over all EMCs. Bars represent the number of grid points within each precipitation threshold and below the level of the following threshold. Bars are grouped by precipitation bins (10 mm/24 h intervals) and coloured by cluster. All values exceeding 100 mm/24 h are combined into a single bin.
To better capture localised extremes, we complement this analysis with a grid-point-based approach using 24 h accumulated ERA5 precipitation. For each EMC, we count the number of grid points exceeding different precipitation thresholds within the domain and construct distributions of grid-point precipitation intensities (Fig. 6b). This shorter accumulation period is more representative of local extreme events and reduces the smoothing effect inherent in longer temporal and spatial averaging.
The results show that cluster 1 EMCs host at least a third of localised extremes, followed by cluster 2 and 3 EMCs, despite the latter two occurring more often (over 20 % of the time compared to 16 % in cluster 1). While all clusters exhibit a decrease in the number of grid points with increasing precipitation intensity, Cluster 5 is characterised by a relatively higher fraction of high-intensity grid-point precipitation compared to the other clusters. This indicates that despite its generally low domain-averaged precipitation, Cluster 5 is more strongly associated with localised extreme rainfall events consistent with its summer-autumn seasonality.
Overall, the combined analyses demonstrate that spatial averages can mask important differences in the structure of precipitation extremes, and highlight the need to consider both domain-averaged and grid-point-based metrics when assessing the impact of EMCs on regional precipitation.
3.5 Temperature anomalies and extremes
To further understand surface impacts of EMCs, we examine the temperature anomalies associated with the different PV patterns. Figure 7 presents the composite mean 2 m temperature anomalies calculated from the monthly mean climatology for each cluster. Overlaid are the grid points where more than 15 % of the EMCs experienced extreme cold or warm daily temperature anomalies (below the 5th or above the 95th extreme percentile of the distribution, respectively). As either cold or warm anomalies are expected with a potential frontal passage, composites are shown for the time of minimum SLP and for 12 h after.
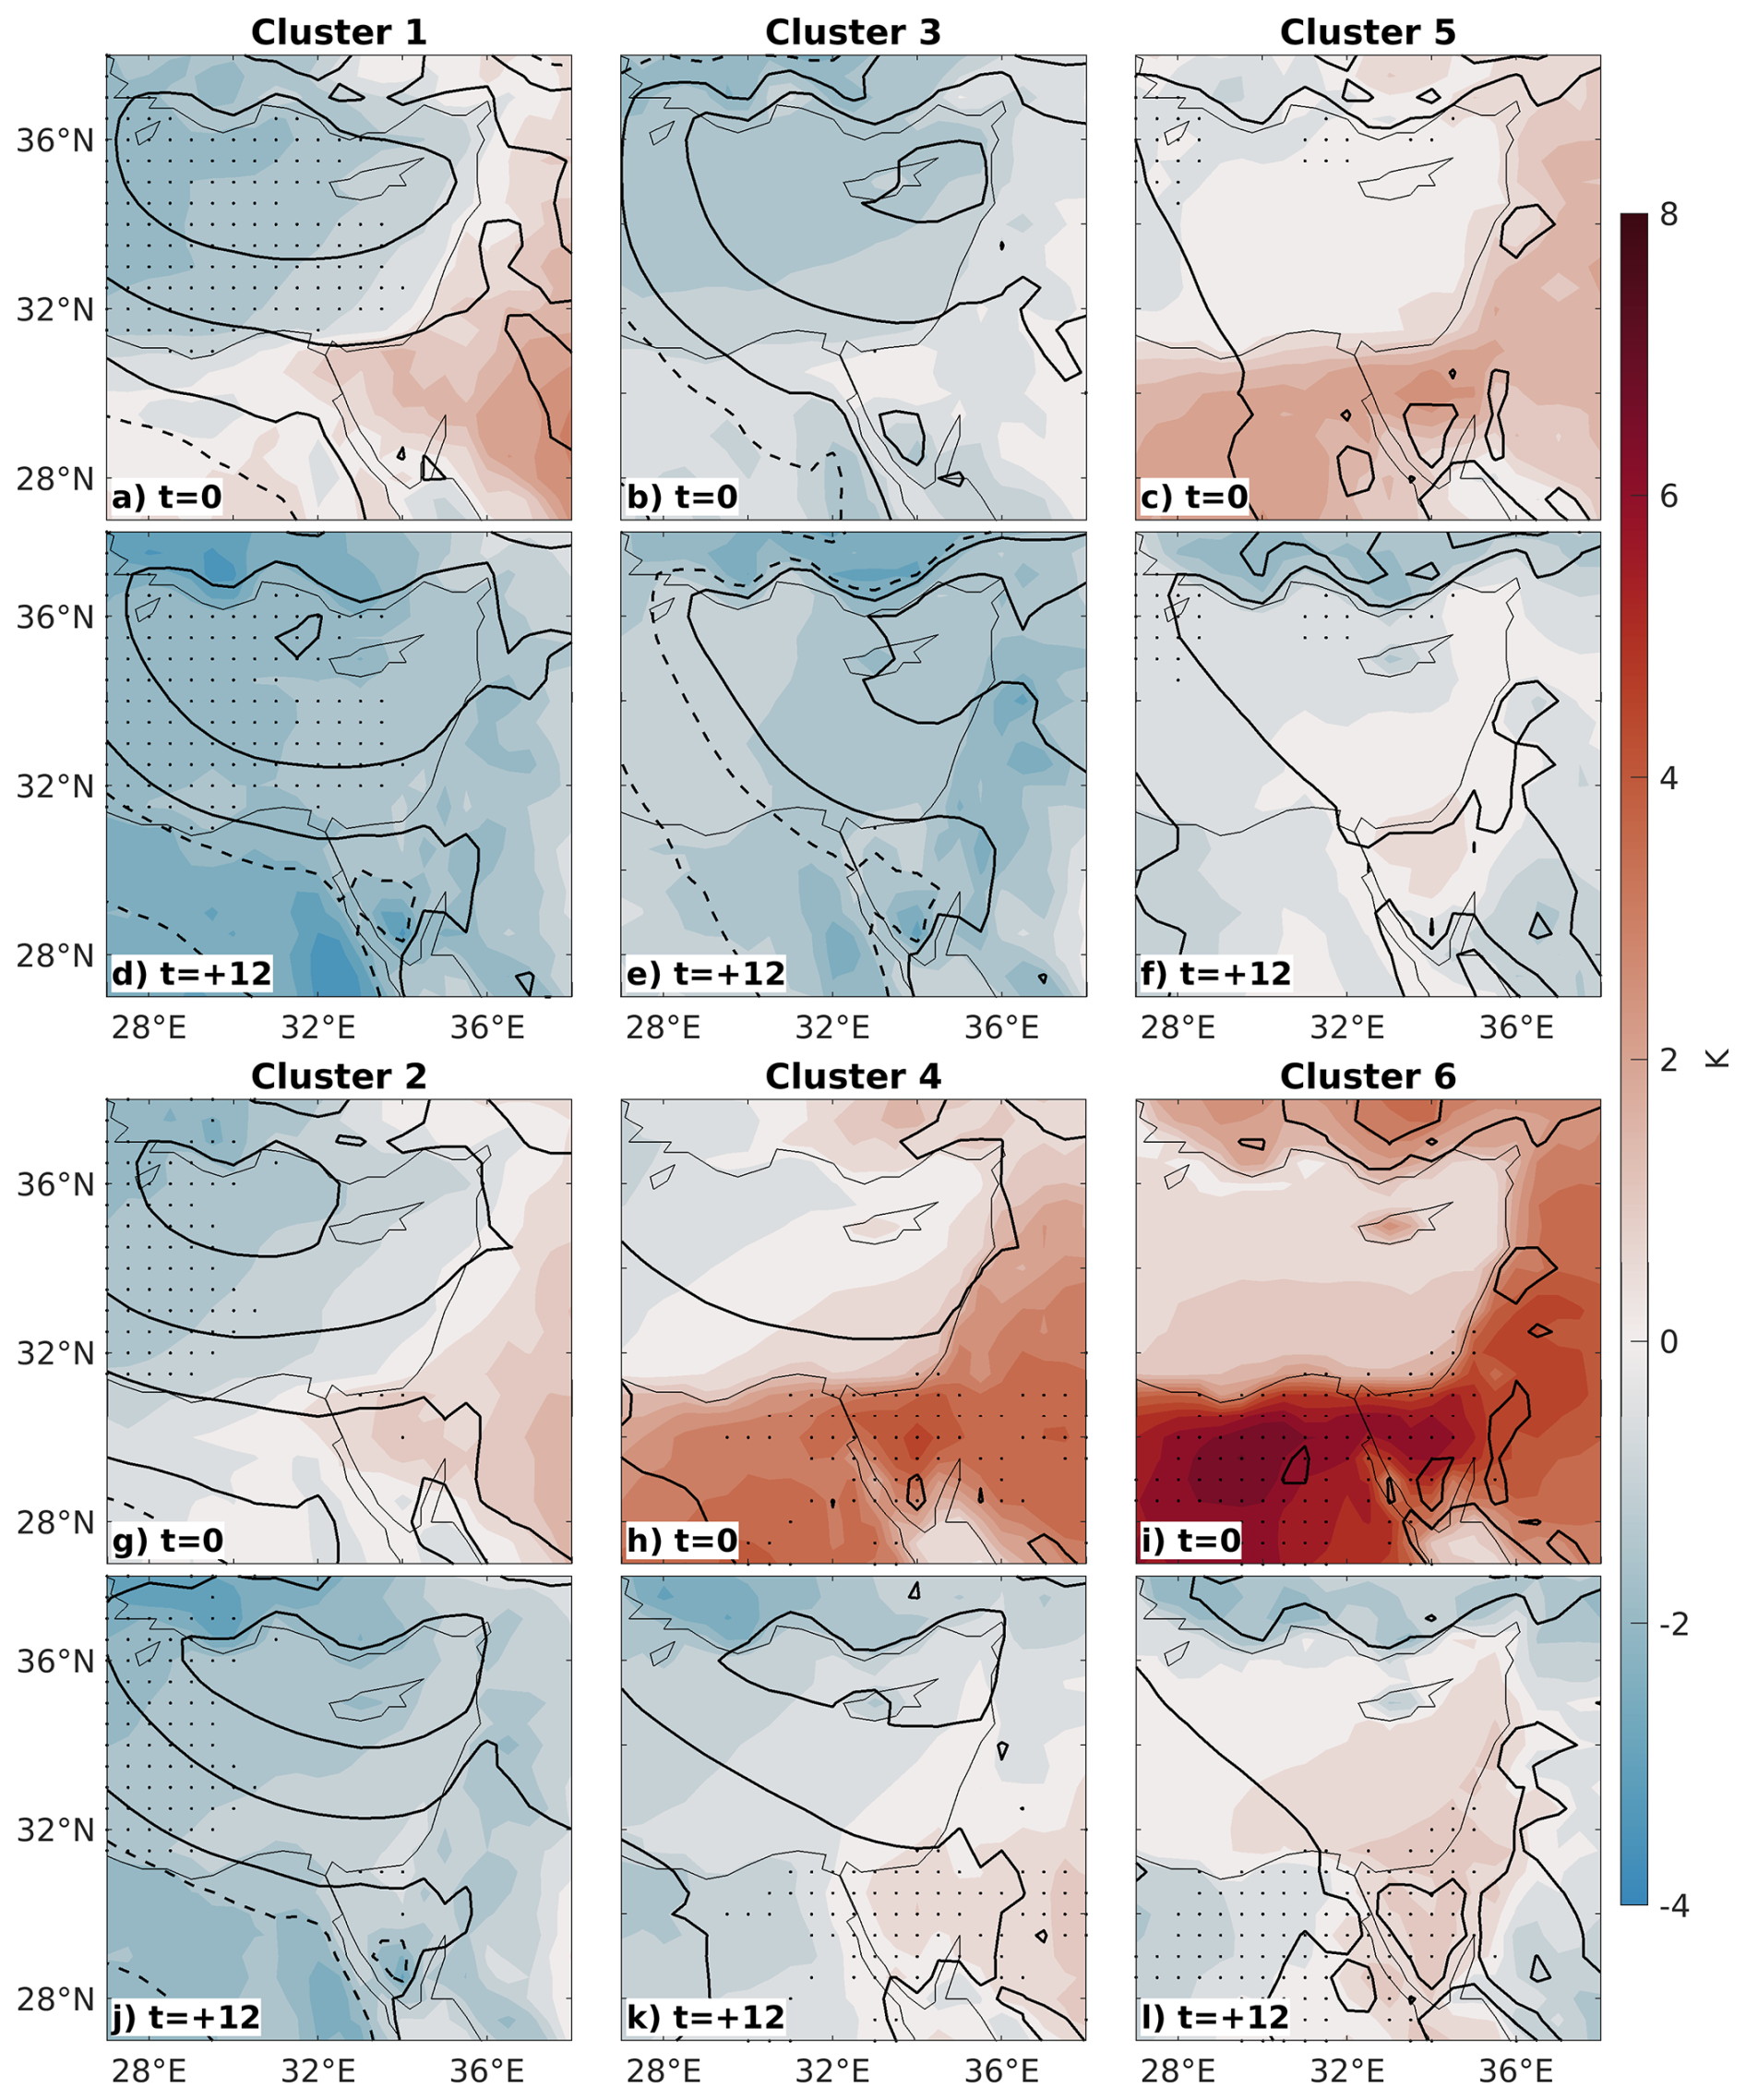
Figure 7Composite mean 2 m temperature anomalies, shown at the time of min SLP (top panel of each cluster (a–c, g–i)) and 12 h after (bottom panel of each cluster (d–f, j–l)). Anomalies are shown as a difference from the monthly mean climatology (K, shading). Composite mean SLP is shown for each time (black contours at 2 hPa intervals dashed over 1015 hPa). The dots mark grid points where more than 15 % of the cyclones induce a warm/cold extreme (within the upper/lower local 5 %, respectively).
At the time of minimum SLP, all clusters except for Cluster 3 exhibit positive anomalies in the eastern part of the domain, with a strong signature over land areas, concurrent with the warm sector of the cyclone. Clusters 4 and 6, in particular, demonstrate extremely hot temperatures in the southern part of the domain. These hot extremes are known as Sharav heat lows in the region, conductive for warm, dry, and often dusty extremes in spring (Alpert and Ziv, 1989; Dayan et al., 2008; Nissenbaum et al., 2023). At the same time, over the sea, all clusters but Cluster 6 exhibit cold anomalies. Winter Clusters 1 and 2 exhibit strong cold anomalies (compared to their respective months). In these clusters, extremely cold temperatures are seen to the west and south of the cyclone centre.
Upon the passage of the cyclones, 12 h after peak intensity, most of the domain becomes colder (Fig. 7). In Clusters 1 and 2, the warm sector associated with the cyclones traverses the domain, leading to anomalously cold temperatures throughout the region. Cluster 3, which did not exhibit any warm anomalies, shows the domain becoming even colder (at ), especially over land; this may be attributed to the upper-level PV pattern indicating strong air advection from the north. For Clusters 4–6, while the warm anomalies over land persist, their intensity diminishes. Notably, Clusters 4 and 6 maintain pronounced warm extremes over land. This analysis highlights the frontal behaviour of cyclones associated with winter seasons and the presence of a warm core in cyclones more typical of late spring and summer, particularly evident in Clusters 4 and 6. This cluster-specific analysis highlights the strong connection between upper-level PV patterns and surface temperature anomalies and extremes.
It should be noted, however, that the timing of the minimum SLP may influence the results. While the distribution of the time of the minimum SLP is generally uniform, certain times are somewhat favoured and could therefore affect the composite mean, particularly when comparing differences between two specific time steps. To assess the robustness of our findings, we also examined temperature differences using a 24 h interval (not shown). Although the magnitude of the anomalies is weaker, the overall patterns and behaviour remained consistent.
The results underscore that, on average, EMCs introduce temperature anomalies and often extremes to the region. This finding emphasises the importance of understanding the link between the upper-level atmospheric state and its impact near the surface, which could not be implied by the SLP pattern alone.
3.6 Near-surface winds
To better connect the large-scale circulation patterns with their surface impacts, the spatial distribution of 10 m wind speed anomalies is analysed for each cluster. The 10 m wind speed anomalies at the time of minimum SLP, shown in Fig. 8, reveal clear spatial differences in both magnitude and flow structure among the clusters. In the winter clusters (Clusters 1–3), extensive regions with wind speeds exceeding an anomaly of up to 7–8 m s−1 appear over the eastern Mediterranean Sea. The strongest anomalies are concentrated along the coasts of Egypt, Israel, and Cyprus, and inland over Jordan and northwestern Saudi Arabia.
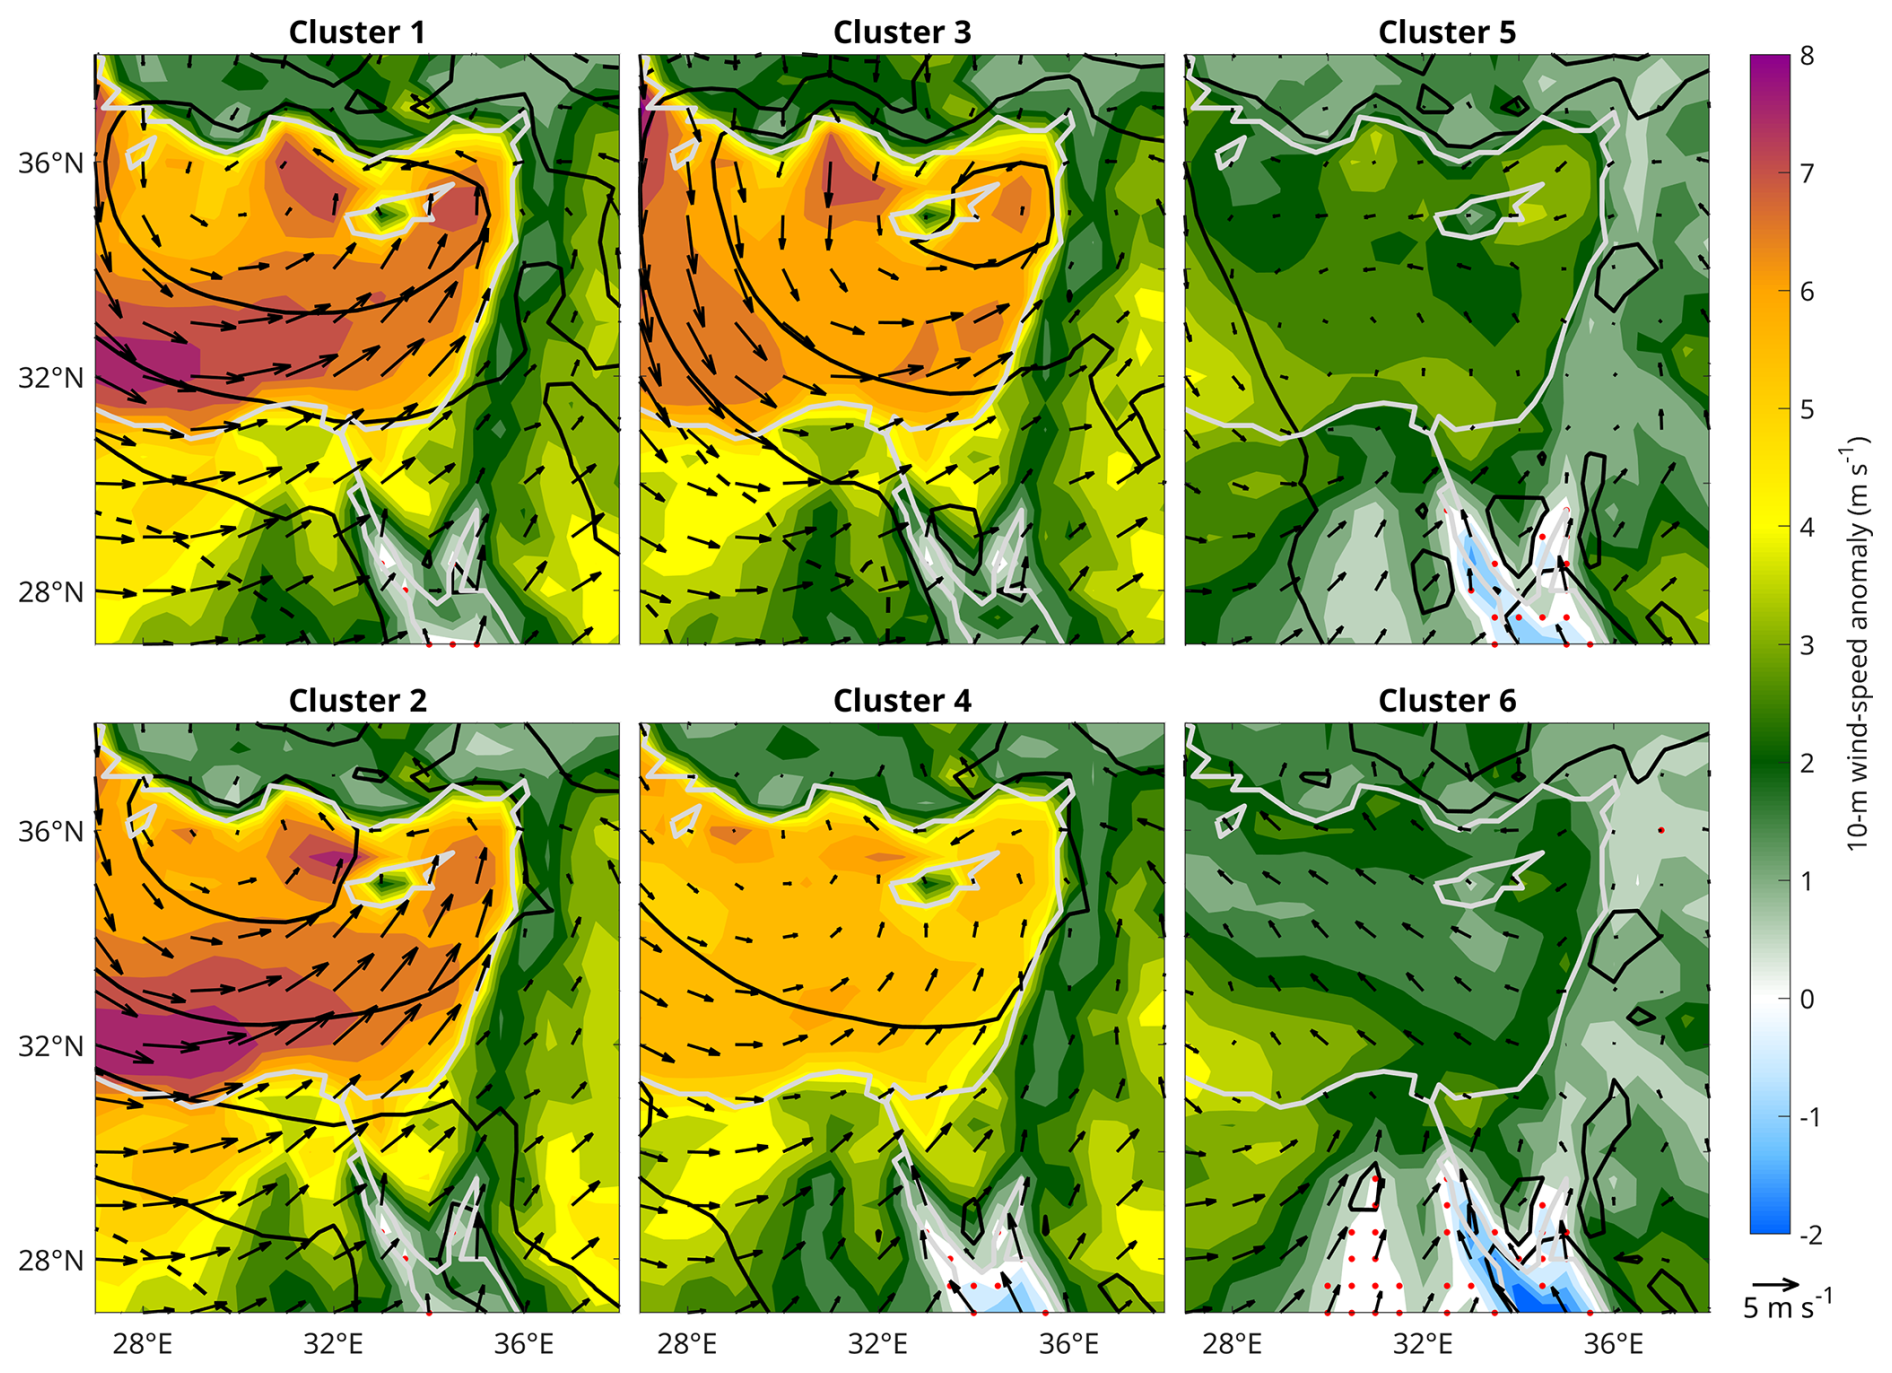
Figure 8Composite of 10 m wind speed anomalies at the time of minimum SLP (shading), computed as the cluster-mean of the differences between the wind speed and the climatological monthly mean for each EMC. Arrows indicate the composite vector wind anomalies from the monthly mean climatology in m s−1 (U and V components). SLP composites are in black contours at 2 hPa intervals. Red stippling indicates regions where anomalies are not statistically significant at the 99 % confidence level based on a bootstrap resampling test (5000 resamples).
In Cluster 1, the maximum anomaly is located north of Egypt, especially along the western edge, and to the east and west of Cyprus. The wind speed anomaly vectors, which indicate strong winds, show a coherent southwesterly-to-northwesterly flow that curves cyclonically toward the north and northeast. This curvature, together with the intensity of the anomalies, is consistent with circulation around a deep low-pressure system. Cluster 2 shows a similar pattern, with the strongest winds extending from northern Egypt and the southeastern Mediterranean toward the Israeli coast. Wind speeds are high, and the wind direction remains predominantly southwesterly, turning cyclonically toward the Levant. In Cluster 3, the area of enhanced winds is predominantly located south of Turkey. The wind speed anomalies are well aligned and display clear cyclonic curvature, with inflow from the northwest. This pattern is consistent with the upper-level PV structure, which suggests northerly flow, which then turns westerly and subsequently southerly along the Israeli, Lebanese, and Syrian coasts Cluster 4 represents a transition, with weaker and more localised positive anomalies. Wind speed anomalies are clearly weaker than in Clusters 1–3, and the flow remains cyclonic.
Clusters 5 and 6 show markedly weaker anomalies and more heterogeneous patterns of 10 m wind speed anomalies. Wind speed anomalies are mostly below 4 m s−1 across the basin. In Cluster 5, the flow is less organised, with smaller wind magnitudes and more variable directions, although a weak cyclonic circulation still seems to be present.
A consistent feature across clusters 4-6 is the southeastern part of the domain, particularly over the Sinai Peninsula and the northern Red Sea (around 27–29° N, 33–36° E), where wind speeds are significantly lower and associated with negative anomalies. However, these are not statistically significant.
Overall, the strongest and most organised wind patterns in Clusters 1–3 coincide with the regions of deepest SLP in the composites. This suggests that the enhanced cyclonic flow is driven by strong pressure gradients associated with deep cyclones. In contrast, the weaker and less coherent wind patterns in Clusters 4–6 are consistent with shallower SLP fields.
3.7 Observed EMCs frequency trends
In this section, we examine the inter-annual frequency of EMCs in each cluster. As different types of EMCs have varying impacts on the surface, their respective trend may suggest expected surface changes in the region in the future climate. When considering all clusters together, there is no significant trend in EMC frequency (Fig. 1). However, separately examining each cluster reveals that some of the clusters exhibit significant and opposing trends in the observed period (Fig. 9). Clusters 5 and 6 demonstrate a significant increase, while a decrease is seen in Cluster 4. Other clusters do not display significant trends. The significance of the trend for Cluster 5 is the strongest, increasing during the period from 1 to 3 EMCs per year on average.
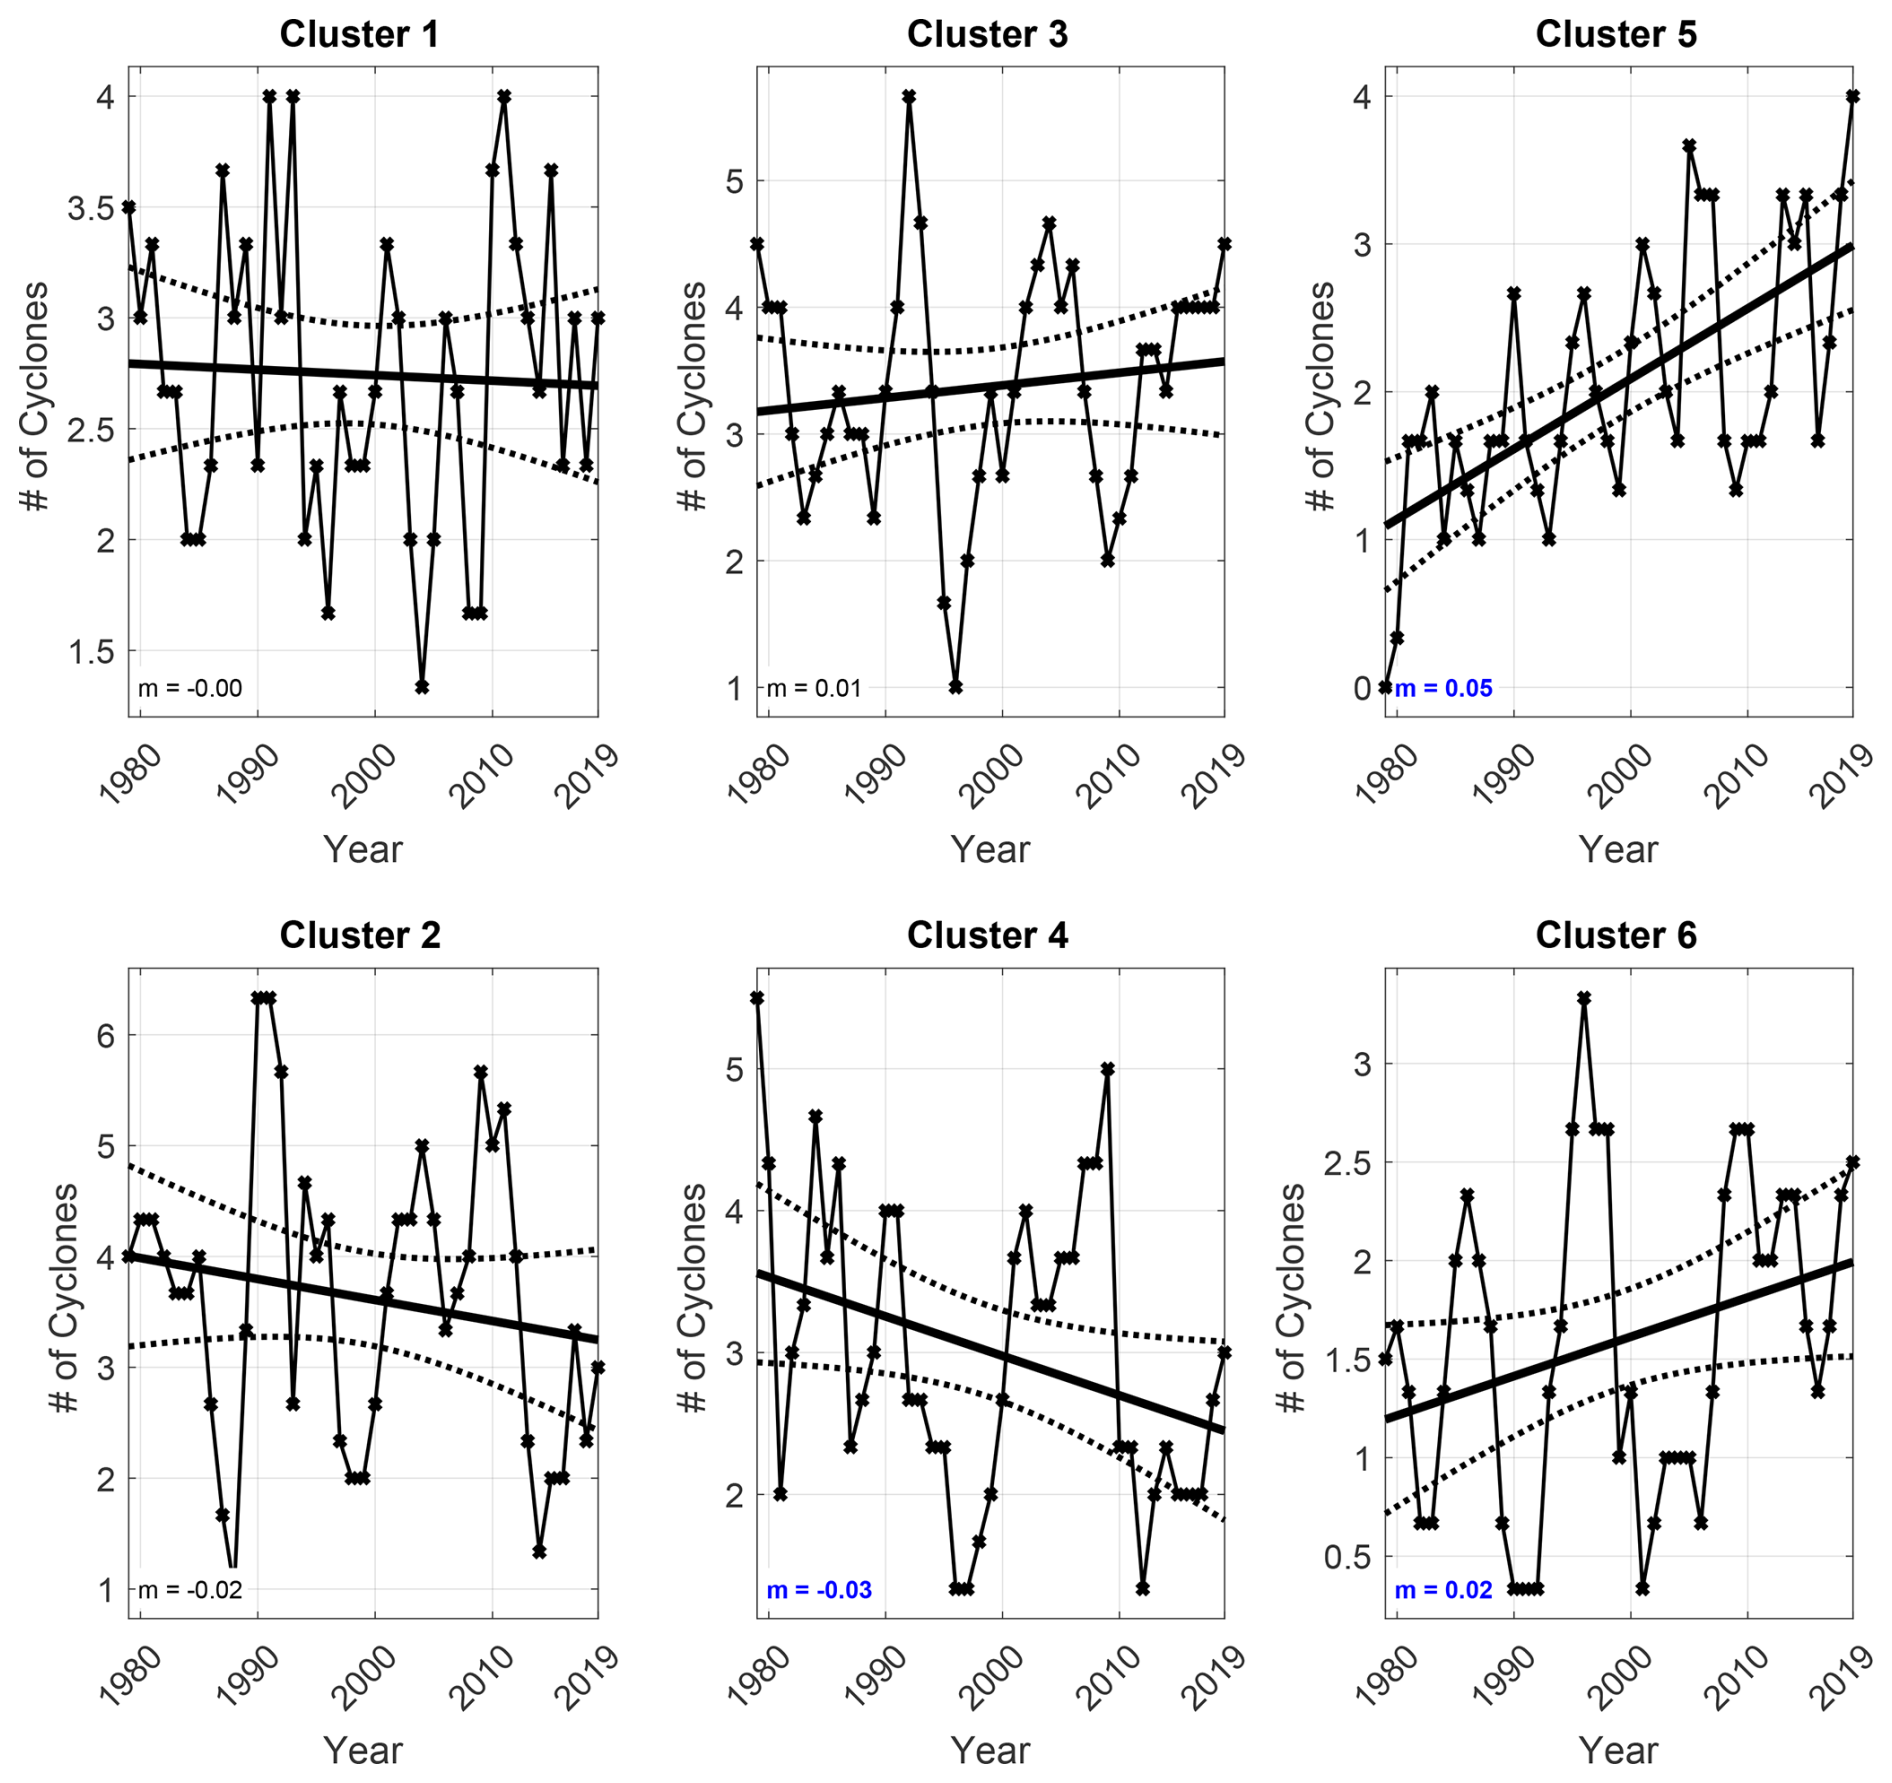
Figure 9As in Fig. 1a, but shown separately for each cluster. The slope of each linear trend is annotated as m (EMCs per year). Trends significant at the 90 % confidence level (Mann–Kendall test, α=0.1) are indicated by blue coloured m.
The compensating trends of the different clusters are especially meaningful when taking into account the surface impacts of each EMC type. As Cluster 5 is associated with low precipitation and warm anomalies with sporadic precipitation extremes, a potential shift toward drier and warmer conditions under EMCs is likely to occur if this trend continues. Thus, considering cyclone frequency as a whole is not a sufficient proxy for precipitation trends, and cluster-specific information is key for understanding long-term changes in precipitation patterns, affecting water resources, agriculture, and the health of the ecosystem in the region.
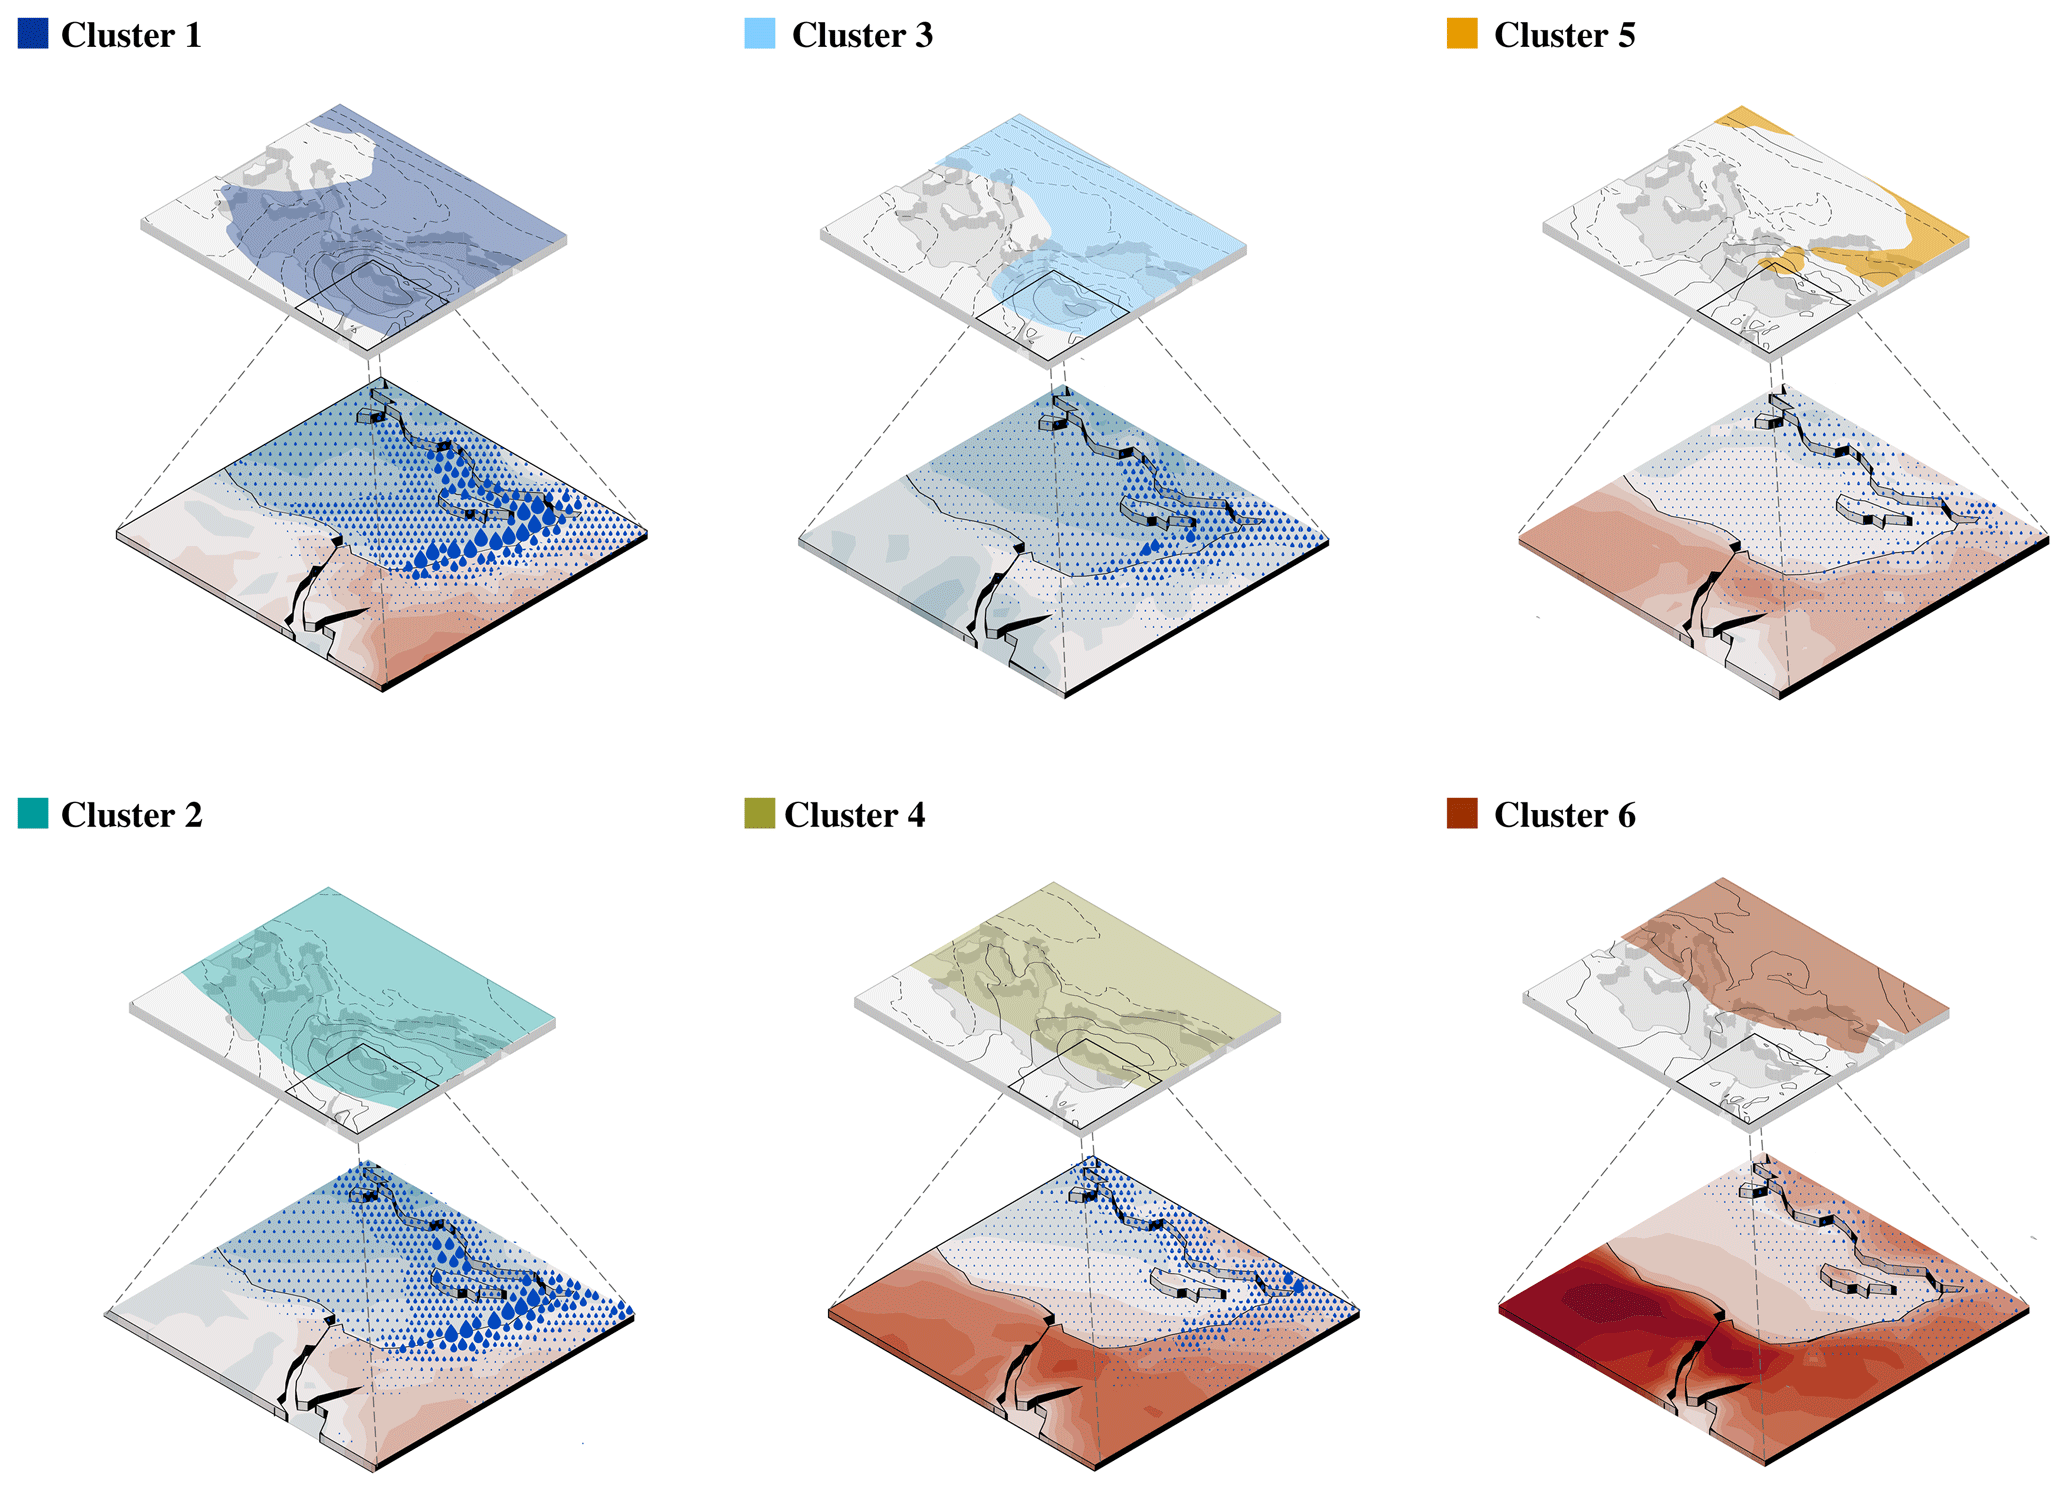
Figure 10Schematic summary of the EMC clusters. For each cluster, the upper panels show the large classification domain with the 3-PVU surface (shading) and SLP (black contours at 2 hPa intervals, dashed over 1015 hPa). The lower panels present a zoomed view over the Eastern Mediterranean, displaying temperature anomalies and accumulated precipitation.
This study aims to understand what drives the variability of Eastern Mediterranean cyclones and their associated surface weather, including extremes. To this end, we group Eastern Mediterranean cyclones according to the regional PV distribution using a SOM algorithm, resulting in six distinct EMC types, or clusters (Fig. 10).
-
Cluster 1: Characterised by anticyclonic wave breaking with high positive PV values over the region and amplified upstream ridge over central Europe. These early-winter EMCs are relatively deep with long duration inside the domain, and on average, relatively high deepening rates. Their thermal structure shows strong frontal characteristics with pronounced warm and cold anomalies. Cluster 1 contributes the most to annual precipitation and extreme wind anomalies.
-
Cluster 2: Defined by a wide trough with high PV values, typically occurring in late winter. This cluster includes the deepest EMCs in the climatological cyclogenesis zone near Cyprus. Like Cluster 1, it shows strong frontal behaviour and contributes notably to annual precipitation with the most extreme wind anomalies out of all EMCs.
-
Cluster 3: Associated with anticyclonic wave breaking and lower PV values than Cluster 1, also typical of early winter. EMCs in this cluster are shallower, with colder-than-normal temperatures and moderate precipitation impacts compared to Clusters 1 and 2, but they have the highest average deepening rate, travel the longest distance within the domain and produce relatively strong near-surface winds.
-
Cluster 4: Exhibits a zonal PV structure with a more poleward tropopause and lower PV than Cluster 2. It occurs primarily in late winter and spring. Its warm-core signature and thermal structure is associated with weaker precipitation. The EMCs in the cluster have the shortest mean duration and distance within the domain.
-
Cluster 5: Characterised by low PV values in the region, with hints of anticyclonic wave breaking. It occurs mostly in spring, autumn, and summer, with distinct peaks in June and October. This cluster is generally less precipitating, with a few extreme events contributing most of its precipitation. Interestingly, the frequency of Cluster 5 EMCs significantly increases. If this trend continues, and since no significant trend exists for overall EMC numbers, this may suggest warmer and drier cyclone surface weather in the region, with potentially sporadic extreme events.
-
Cluster 6: Defined by low PV values over the region and a high-PV signature northwest of the area. It is mainly active in spring and summer and is associated with strong warm anomalies, and has the lowest averaged deepening rate.
Together, these six EMC types capture the main modes of variability in EMC structure and evolution, each associated with distinct seasonal and dynamical characteristics. The detailed classification of EMCs into distinct clusters based on upper-level PV patterns provides a more nuanced understanding of EMC behaviour and its surface impacts. By identifying specific EMC types and their associated effects on precipitation, temperature and wind anomalies, our study offers valuable insights for improving regional climate models and forecasting systems. Importantly, the use of large-scale PV structures as the basis for classification has a practical advantage: these upper-level features are more easily detected and more reliably simulated in models compared to localised variables such as convective precipitation extremes. Therefore, understanding EMC behaviour through PV patterns not only offers physical insight but also provides a robust framework that can support improvements in future model performance and predictive skill under changing climate conditions.
While these findings provide valuable insights, several limitations should be noted. (i) The analysis was conducted within a fixed geographical domain, which can lead to noisier mean composites due to varying cyclone positions. Yet, it enables the accurate assessment of the cyclones' real impacts and their interaction with regional features such as coastlines and topography. (ii) The trend estimates are based on a relatively small number of events, which limits their statistical robustness. The detected trends should therefore be interpreted as potential emerging signals rather than definitive long-term changes. Using a lower confidence level for the tracking algorithm could increase the sample size and strengthen significance, but at the cost of reduced reliability. (iii) Finally, the use of a SOM as a classification tool also introduces uncertainty, as it is based solely on statistical similarity rather than physical constraints, potentially smoothing out case-specific details. Moreover, the method still involves subjective decisions, particularly in selecting the number of SOM nodes and defining the SOM structure, which may affect the level of detail and the representation of patterns. Nevertheless, this approach provides a reproducible framework for identifying recurring cyclone patterns compared with manual or subjective classifications.
Our study advances earlier efforts to classify EMCs by employing an objective and data-driven approach. Previous studies e.g., Alpert et al. (2004) used semi-objective classification methods relying on expert judgment to categorise regional synoptic systems into detailed classes based on SLP maps. While effective, this approach is subjective and labour-intensive. More recent studies, e.g., Flocas et al. (2010), classified Eastern Mediterranean cyclone tracks using a single tracking algorithm, focusing on track density and trends over a 40 year period. However, their classification relied on surface synoptic features and was constrained by lower resolution and older datasets. In contrast, our study employs SOM to classify EMCs into six objective clusters based on upper-level PV patterns during cyclones' peak intensity in the region. This automated method reduces subjectivity, enhances reproducibility, and provides a process-based analysis of the relationship between atmospheric conditions and surface impacts. By using state-of-the-art high-resolution data, our approach offers a more precise and accurate depiction of cyclones, improving upon the limitations of older studies and delivering a more robust framework for understanding regional climatic variability.
Our analysis suggests a possible trend towards a higher frequency of EMCs with drier impacts, consistent with projections in Reale et al. (2022). The Med-CORDEX ensemble of climate models indicates that future drier conditions in the Eastern Mediterranean could be influenced by both a decrease in the number of cyclones and a reduction in the intensity of rainy events. Our findings suggest an increase in EMCs with low precipitation, together with no change in the overall number of cyclones, which might already contribute to these anticipated changes. If the observed increase in less precipitating EMCs together with sporadic extremes continues, it will have implications for regional climate and water resources. Therefore, incorporating these possible changes into future climate adaptation strategies is key for the evaluation of future trends.
Building on these findings, future work should further refine and extend the classification approach. To enhance our understanding of cyclonic behaviour and its impacts, it is crucial to continuously update cyclone classification methods with new data and apply them to future simulated climate scenarios. This approach would offer insights into how cyclone characteristics and more diverse forms of surface impacts (including compound events, air quality and others) may change under varying climate conditions, aiding in the development of more effective adaptation and mitigation strategies.
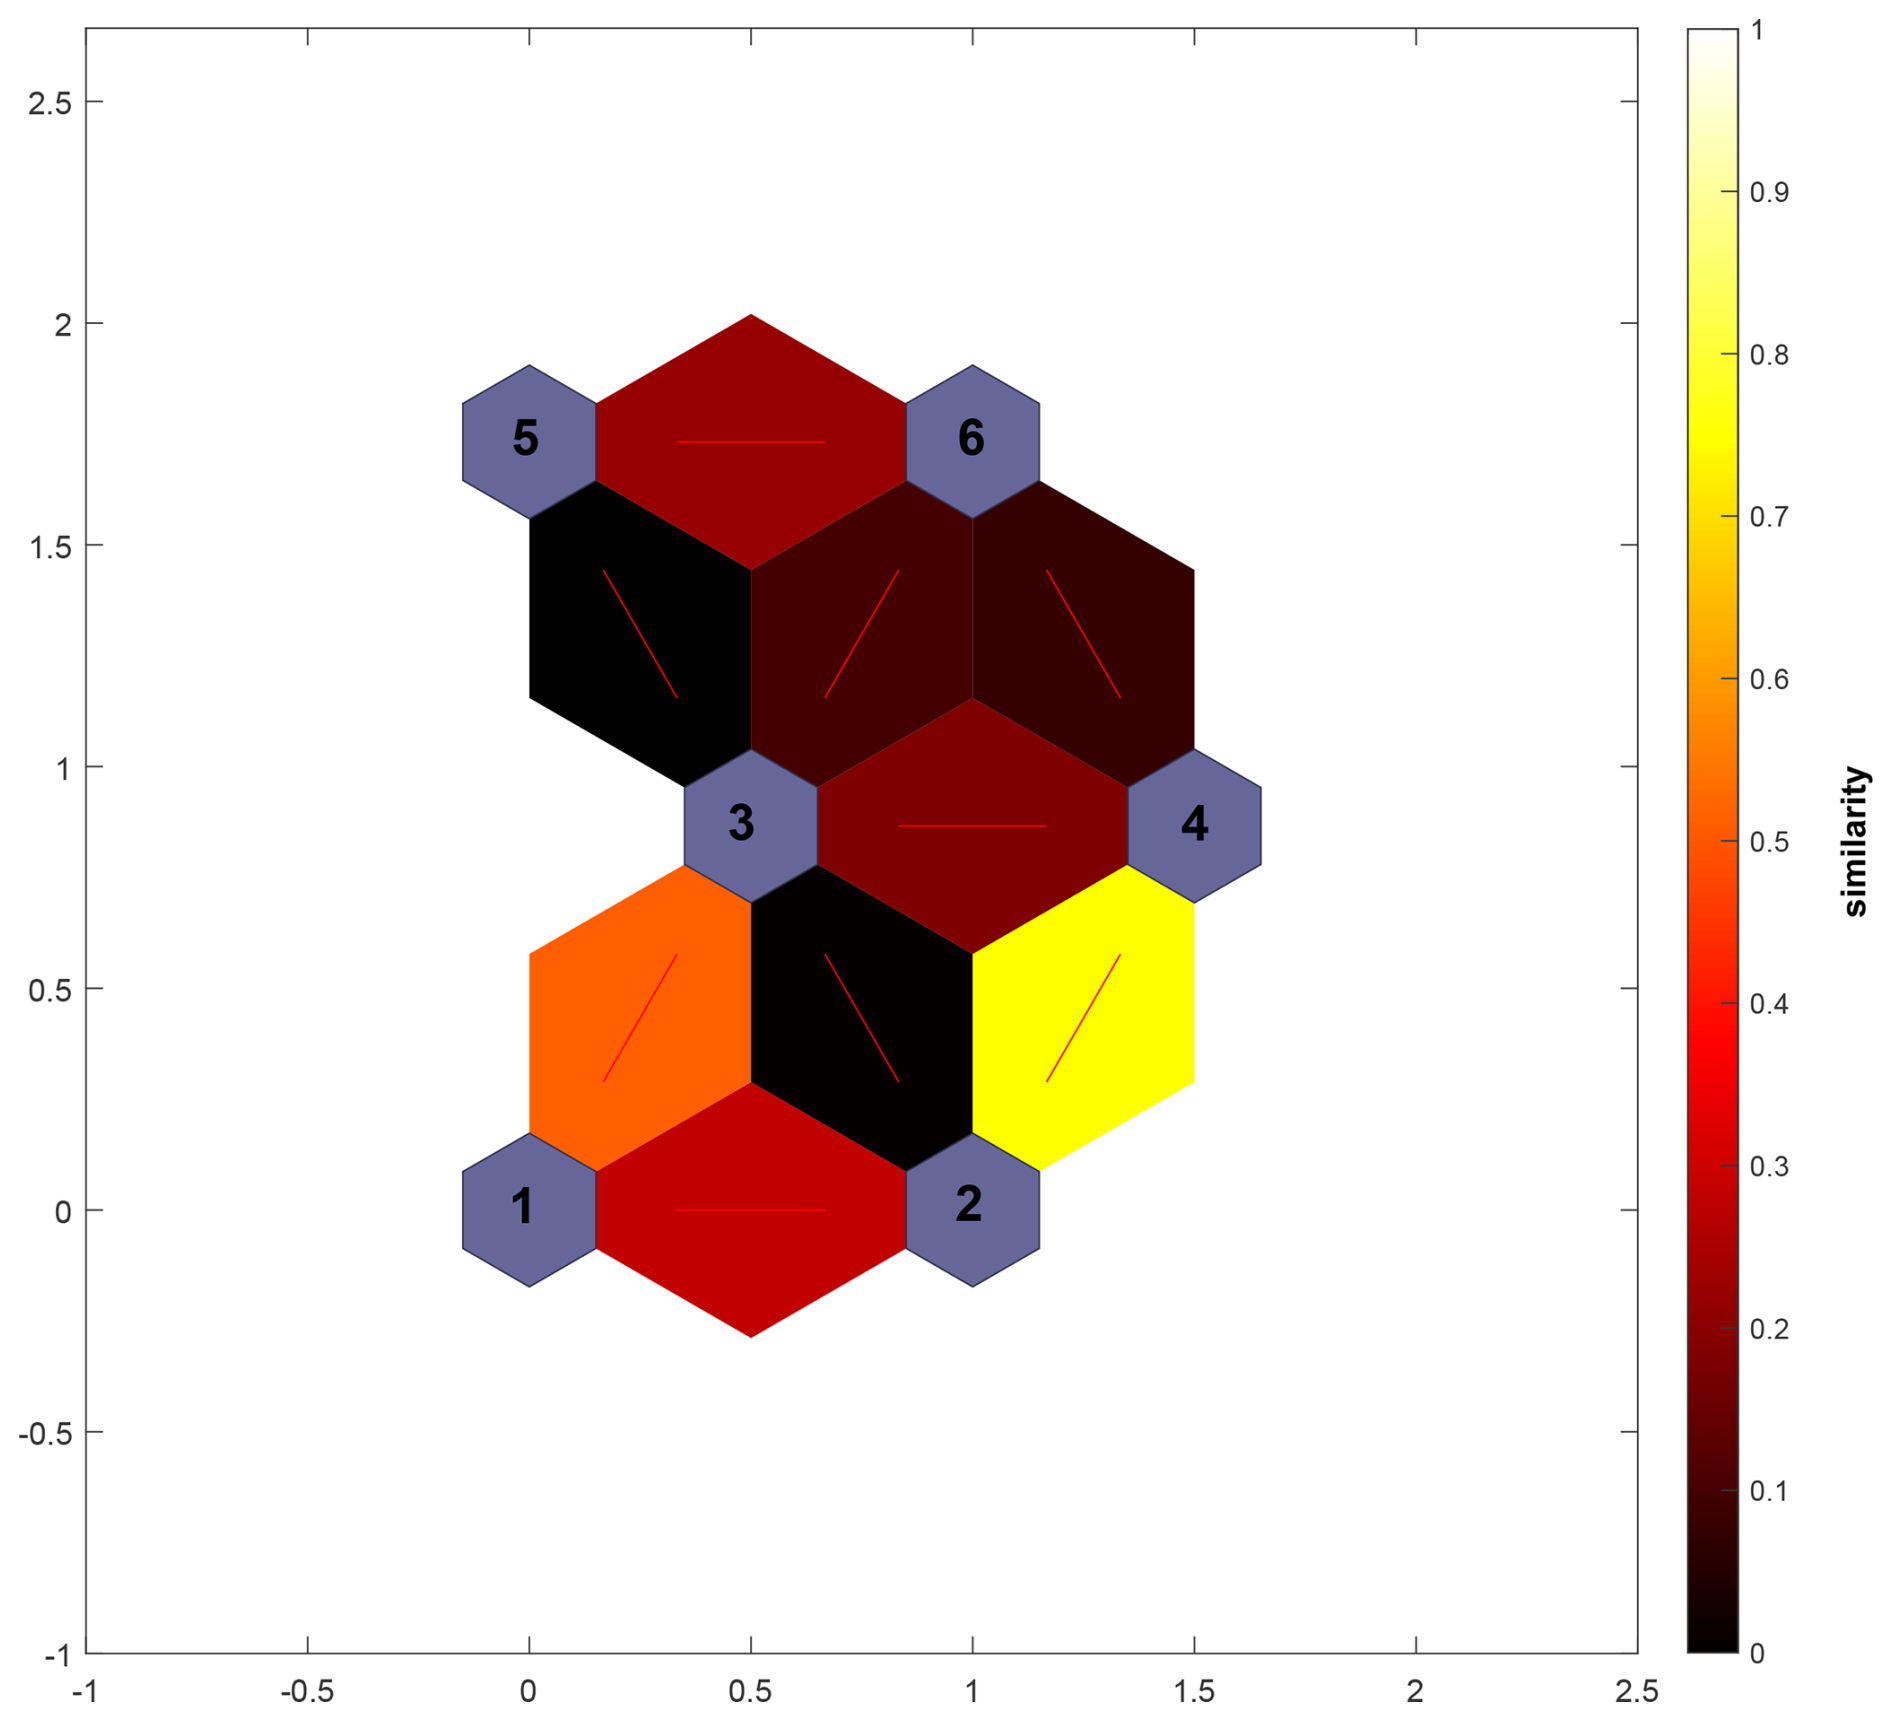
Figure A1SOM configuration with neighbour similarity, illustrating the differences between neighbouring clusters. Cluster numbers are noted in the purple nodes; note their different order compared to other figures in the paper.
The code for the SOM algorithm is openly available at https://www.mathworks.com/help/deeplearning/gs/cluster-data-with-a-self-organizingmap.html (last access: 1 December 2025).
ERA5 reanalysis data are publicly available from the Copernicus Climate Data Store (CDS; https://cds.climate.copernicus.eu/, last access: April 2026). Integrated Multi-satellitE Retrievals for GPM (IMERG) precipitation data are available from the NASA Goddard Earth Sciences Data and Information Services Centre (GES DISC; https://disc.gsfc.nasa.gov/, last access: December 2025). The cyclone classification data and derived analysis products generated during this study are available from the corresponding author upon reasonable request.
TSG led the research, analysed and visualised the data, and wrote the first draft of the manuscript. SRR conceptualised the research and acquired funding. LMR and SRR contributed input and supervised the research. All authors contributed to revising the manuscript to its final form.
At least one of the (co-)authors is a member of the editorial board of Weather and Climate Dynamics. The peer-review process was guided by an independent editor, and the authors also have no other competing interests to declare.
Publisher's note: Copernicus Publications remains neutral with regard to jurisdictional claims made in the text, published maps, institutional affiliations, or any other geographical representation in this paper. The authors bear the ultimate responsibility for providing appropriate place names. Views expressed in the text are those of the authors and do not necessarily reflect the views of the publisher.
This work contributes to the Med-World and Tuning for Deserts Consortia, funded by the Council for Higher Education in Israel. We thank Itai Raveh (Weizmann Institute of Science) for helping with the production of Fig. 10. Finally, we wish to thank the two reviewers for their highly constructive feedback. This work benefited from language suggestions provided by ChatGPT and Grammarly.
This work was funded by the Israel Science Foundation (grant-no.: 1242/23) and the De Botton Centre for Marine Science at the Weizmann Institute of Science.
This paper was edited by Ambrogio Volonté and reviewed by two anonymous referees.
Almazroui, M., Awad, A. M., Islam, M. N., and Al-Khalaf, A.: A climatological study: wet season cyclone tracks in the East Mediterranean region, Theor. Appl. Climatol., 120, 351–365, https://doi.org/10.1007/s00704-014-1178-z, 2015. a
Alpert, P.: The water crisis in the E. Mediterranean – and relation to global warming?, in: Water in the Middle East and in North Africa: Resources, Protection and Management, Springer, 55–61, https://doi.org/10.1007/978-3-662-10866-6_6, 2004. a
Alpert, P. and Shay-El, Y.: The moisture source for the winter cyclones in the EM, Israel Meteorological Research Papers, 5, 20–27, 1994. a
Alpert, P. and Ziv, B.: The Sharav cyclone: observations and some theoretical considerations, J. Geophys. Res.-Atmos., 94, 18495–18514, https://doi.org/10.1029/jd094id15p18495, 1989. a, b, c
Alpert, P., Neeman, B., and Shay-El, Y.: Climatological analysis of Mediterranean cyclones using ECMWF data, Tellus A, 42, 65–77, https://doi.org/10.3402/tellusa.v42i1.11860, 1990. a
Alpert, P., Tsidulko, M., and Itzigsohn, D.: A shallow, short-lived meso-β cyclone over the Gulf of Antalya, eastern Mediterranean, Tellus A, 51, 249–262, https://doi.org/10.3402/tellusa.v51i2.12319, 1999. a
Alpert, P., Ben-Gai, T., Baharad, A., Benjamini, Y., Yekutieli, D., Colacino, M., Diodato, L., Ramis, C., Homar, V., Romero, R., Michaelides, S., and Manes, A.: The paradoxical increase of Mediterranean extreme daily rainfall in spite of decrease in total values, Geophys. Res. Lett., 29, 31–1, https://doi.org/10.1029/2001gl013554, 2002. a, b
Alpert, P., Osetinsky, I., Ziv, B., and Shafir, H.: Semi-objective classification for daily synoptic systems: Application to the eastern Mediterranean climate change, Int. J. Climatol., 24, 1001–1011, https://doi.org/10.1002/joc.1036, 2004. a, b
Alpert, P., Price, C., Krichak, S. O., Ziv, B., Saaroni, H., Osetinsky, I., Barkan, J., and Kishcha, P.: Tropical tele-connections to the Mediterranean climate and weather, Adv. Geosci., 2, 157–160, https://doi.org/10.5194/adgeo-2-157-2005, 2005. a
Avolio, E., Fanelli, C., Pisano, A., and Miglietta, M.: Unveiling the relationship between Mediterranean tropical-like cyclones and rising Sea Surface Temperature, Geophys. Res. Lett., 51, e2024GL109921, https://doi.org/10.1029/2024gl109921, 2024. a
Awad, A. M. and Mashat, A.-W. S.: Climatology of the autumn Red Sea trough, Theor. Appl. Climatol., 135, 1545–1558, https://doi.org/10.1007/s00704-018-2453-1, 2019. a
Baiman, R., Winters, A. C., Lenaerts, J., and Shields, C. A.: Synoptic drivers of atmospheric river induced precipitation near Dronning Maud Land, Antarctica, J. Geophys. Res.-Atmos., 128, e2022JD037859, https://doi.org/10.1029/2022JD037859, 2023. a
Berkovic, S. and Schloss, R.: Potential-Vorticity Regimes Over the Eastern Mediterranean and Their Relation to Local Boundary Layer Profiles, Int. J. Climatol., 45, e70026, https://doi.org/10.5194/egusphere-egu24-13317, 2025. a
Buzzi, A. and Tibaldi, S.: Cyclogenesis in the lee of the Alps: A case study, Q. J. Roy. Meteor. Soc., 104, 271–287, https://doi.org/10.1002/qj.49710444004, 1978. a
Campins, J., Genovés, A., Jansa, A., Guijarro, J., and Ramis, C.: A catalogue and a classification of surface cyclones for the western Mediterranean, Int. J. Climatol., 20, 969–984, https://doi.org/10.1002/1097-0088(200007)20:9<969::aid-joc519>3.3.co;2-w, 2000. a
Chericoni, M., Fosser, G., Flaounas, E., Gaetani, M., and Anav, A.: Unravelling drivers of the future Mediterranean precipitation paradox during cyclones, npj Climate and Atmospheric Science, 8, 260, https://doi.org/10.5194/ems2025-29, 2025. a
Ciric, D., Nieto, R., Losada, L., Drumond, A., and Gimeno, L.: The Mediterranean Moisture contribution to climatological and extreme monthly continental precipitation, Water, 10, 519, https://doi.org/10.3390/w10040519, 2018. a
Dayan, U., Ziv, B., Shoob, T., and Enzel, Y.: Suspended dust over southeastern Mediterranean and its relation to atmospheric circulations, Int. J. Climatol., 28, 915–924, https://doi.org/10.1002/joc.1587, 2008. a
Dayan, U., Lensky, I. M., Ziv, B., and Khain, P.: Atmospheric conditions leading to an exceptional fatal flash flood in the Negev Desert, Israel, Nat. Hazards Earth Syst. Sci., 21, 1583–1597, https://doi.org/10.5194/nhess-21-1583-2021, 2021. a
de Vries, A. J., Tyrlis, E., Edry, D., Krichak, S., Steil, B., and Lelieveld, J.: Extreme precipitation events in the Middle East: dynamics of the Active Red Sea Trough, J. Geophys. Res.-Atmos., 118, 7087–7108, https://doi.org/10.1002/jgrd.50569, 2013. a, b
Drori, R., Ziv, B., Saaroni, H., Etkin, A., and Sheffer, E.: Recent changes in the rain regime over the Mediterranean climate region of Israel, Climatic Change, 167, 15, https://doi.org/10.1007/s10584-021-03161-6, 2021. a
Egger, J.: Interaction of cold-air blocking and upper-level potential vorticity anomalies during lee cyclogenesis, Tellus A, 47, 597–604, https://doi.org/10.3402/tellusa.v47i5.11550, 1995. a
El-Fandy, M.: Barometric lows of Cyprus, Q. J. Roy. Meteor. Soc., 72, 291–306, https://doi.org/10.1002/qj.49707231406, 1946. a
Flaounas, E., Davolio, S., Raveh-Rubin, S., Pantillon, F., Miglietta, M. M., Gaertner, M. A., Hatzaki, M., Homar, V., Khodayar, S., Korres, G., Kotroni, V., Kushta, J., Reale, M., and Ricard, D.: Mediterranean cyclones: current knowledge and open questions on dynamics, prediction, climatology and impacts, Weather Clim. Dynam., 3, 173–208, https://doi.org/10.5194/wcd-3-173-2022, 2022. a
Flaounas, E., Aragão, L., Bernini, L., Dafis, S., Doiteau, B., Flocas, H., Gray, S. L., Karwat, A., Kouroutzoglou, J., Lionello, P., Miglietta, M. M., Pantillon, F., Pasquero, C., Patlakas, P., Picornell, M. Á., Porcù, F., Priestley, M. D. K., Reale, M., Roberts, M. J., Saaroni, H., Sandler, D., Scoccimarro, E., Sprenger, M., and Ziv, B.: A composite approach to produce reference datasets for extratropical cyclone tracks: application to Mediterranean cyclones, Weather Clim. Dynam., 4, 639–661, https://doi.org/10.5194/wcd-4-639-2023, 2023. a
Flocas, H.: Diagnostics of cyclogenesis over the Aegean Sea using potential vorticity inversion, Meteorol. Atmos. Phys., 73, 25–33, https://doi.org/10.1007/s007030050061, 2000. a
Flocas, H. A., Simmonds, I., Kouroutzoglou, J., Keay, K., Hatzaki, M., Bricolas, V., and Asimakopoulos, D.: On cyclonic tracks over the eastern Mediterranean, J. Climate, 23, 5243–5257, https://doi.org/10.1175/2010jcli3426.1, 2010. a, b, c
Giorgi, F. and Lionello, P.: Climate change projections for the Mediterranean region, Global Planet. Change, 63, 90–104, https://doi.org/10.1016/j.gloplacha.2007.09.005, 2008. a
Givon, Y., Keller Jr., D., Silverman, V., Pennel, R., Drobinski, P., and Raveh-Rubin, S.: Large-scale drivers of the mistral wind: link to Rossby wave life cycles and seasonal variability, Weather Clim. Dynam., 2, 609–630, https://doi.org/10.5194/wcd-2-609-2021, 2021. a
Givon, Y., Hess, O., Flaounas, E., Catto, J. L., Sprenger, M., and Raveh-Rubin, S.: Process-based classification of Mediterranean cyclones using potential vorticity, Weather Clim. Dynam., 5, 133–162, https://doi.org/10.5194/wcd-5-133-2024, 2024. a, b, c
Givon, Y., Keller Jr., D., Drobinski, P., and Raveh-Rubin, S.: Contrasting impact of different Mediterranean cyclones on the hydrological cycle and ocean heat content, Weather Clim. Dynam., 7, 567–582, https://doi.org/10.5194/wcd-7-567-2026, 2026. a, b
Goldreich, Y.: The climate of Israel: observation, research and application, Springer, ISBN 978-1-4613-5200-6, https://doi.org/10.1007/978-1-4615-0697-3, 2003. a, b, c, d
Hersbach, H., Bell, B., Berrisford, P., Dahlgren, P., Horányi, A., Muñoz-Sabater, J., Nicolas, J., Radu, R., Schepers, D., Simmons, A., and Soci, C.: The ERA5 global reanalysis, Q. J. Roy. Meteor. Soc., 146, 1999–2049, https://doi.org/10.5194/egusphere-egu2020-10375, 2020. a, b
Hochman, A., Marra, F., Messori, G., Pinto, J. G., Raveh-Rubin, S., Yosef, Y., and Zittis, G.: Extreme weather and societal impacts in the eastern Mediterranean, Earth Syst. Dynam., 13, 749–777, https://doi.org/10.5194/esd-13-749-2022, 2022. a
Hochman, A., Scher, S., Quinting, J., Pinto, J. G., and Messori, G.: Dynamics and predictability of cold spells over the Eastern Mediterranean, Clim. Dynam., 58, 2047–2064, https://doi.org/10.1007/s00382-020-05465-2, 2022b. a
Huffman, G. J., Bolvin, D. T., Braithwaite, D., Hsu, K., Joyce, R., Xie, P., and Yoo, S.-H.: NASA global precipitation measurement (GPM) integrated multi-satellite retrievals for GPM (IMERG), Algorithm theoretical basis document (ATBD) version, 4, 2020-05, https://doi.org/10.1007/978-3-030-24568-9_19, 2015. a
IPCC: Observed Changes in the Climate System, in: Climate Change 2021: The Physical Science Basis. Contribution of Working Group I to the Sixth Assessment Report of the Intergovernmental Panel on Climate Change, edited by: Masson-Delmotte, V., Zhai, P., Pirani, A., Connors, S., Péan, C., Berger, S., Caud, N., Chen, Y., Goldfarb, L., Gomis, M., Huang, M., Leitzell, K., Lonnoy, E., Matthews, J., Maycock, T., Waterfield, T., Yelekçi, O., Yu, R., and Zhou, B., Cambridge University Press, Cambridge, United Kingdom and New York, NY, USA, p. 10, https://www.ipcc.ch/report/ar6/wg1/downloads/report/IPCC_AR6_WGI_SPM.pdf#page=10 (last access: May 2025), 2021. a, b
Kalkstein, A. J., Rudich, Y., Raveh-Rubin, S., Kloog, I., and Novack, V.: A closer look at the role of the cyprus low on dust events in the Negev Desert, Atmosphere, 11, 1020, https://doi.org/10.3390/atmos11101020, 2020. a
Klaider, N. and Raveh-Rubin, S.: Extended influence of midlatitude cyclones on global cold extremes, Geophys. Res. Lett., 50, e2023GL104999, https://doi.org/10.1029/2023gl104999, 2023. a, b
Kohonen, T.: Self-organized formation of topologically correct feature maps, Biol. Cybern., 43, 59–69, https://doi.org/10.1007/BF00337288, 1982. a
Krichak, S., Alpert, P., and Krishnamurti, T.: Red Sea trough/cyclone development – Numerical investigation, Meteorol. Atmos. Phys., 63, 159–169, https://doi.org/10.1007/bf01027382, 1997. a
Krichak, S. O., Breitgand, J. S., and Feldstein, S. B.: A conceptual model for the identification of active Red Sea trough synoptic events over the southeastern Mediterranean, J. Appl. Meteorol. Clim., 51, 962–971, https://doi.org/10.1175/jamc-d-11-0223.1, 2012. a
Kushnir, Y., Dayan, U., Ziv, B., Morin, E., and Enzel, Y.: Climate of the Levant: phenomena and mechanisms, Quaternary of the Levant: Environments, Climate Change, and Humans, Cambridge University Press, 31–44, https://doi.org/10.1017/9781316106754.004, 2017. a
LaChat, G., Bowley, K. A., and Gervais, M.: Diagnosing flavors of tropospheric Rossby wave breaking and their associated dynamical and sensible weather features, Mon. Weather Rev., 152, 513–530, https://doi.org/10.1175/MWR-D-23-0153.1, 2024. a
Larson, M. L. and Winters, A. C.: A Climatology of Lee Cyclones across the Central United States, 1980–2021, Mon. Weather Rev., 153, 2613–2633, https://doi.org/10.1175/MWR-D-25-0013.1, 2025. a
Lavers, D. A., Simmons, A., Vamborg, F., and Rodwell, M. J.: An evaluation of ERA5 precipitation for climate monitoring, Q. J. Roy. Meteor. Soc., 148, 3152–3165, https://doi.org/10.1002/qj.4351, 2022. a
Maheras, P., Patrikas, I., Karacostas, T., and Anagnostopoulou, C.: Automatic classification of circulation types in Greece: methodology, description, frequency, variability and trend analysis, Theor. Appl. Climatol., 67, 205–223, https://doi.org/10.1007/s007040070010, 2000. a, b
Maslova, V. N., Voskresenskaya, E. N., Lubkov, A. S., and Yurovsky, A. V.: Temporal variability and predictability of intense cyclones in the Western and Eastern Mediterranean, Atmosphere, 12, 1218, https://doi.org/10.3390/atmos12091218, 2021. a, b
Mattocks, C. and Bleck, R.: Jet streak dynamics and geostrophic adjustment processes during the initial stages of lee cyclogenesis, Mon. Weather Rev., 114, 2033–2056, https://doi.org/10.1175/1520-0493(1986)114<2033:jsdaga>2.0.co;2, 1986. a
Nissen, K. M., Leckebusch, G. C., Pinto, J. G., Renggli, D., Ulbrich, S., and Ulbrich, U.: Cyclones causing wind storms in the Mediterranean: characteristics, trends and links to large-scale patterns, Nat. Hazards Earth Syst. Sci., 10, 1379–1391, https://doi.org/10.5194/nhess-10-1379-2010, 2010. a, b
Nissenbaum, D., Sarafian, R., Rudich, Y., and Raveh-Rubin, S.: Six types of dust events in Eastern Mediterranean identified using unsupervised machine-learning classification, Atmos. Environ., 309, 119902, https://doi.org/10.1016/j.atmosenv.2023.119902, 2023. a, b
Philandras, C. M., Nastos, P. T., Kapsomenakis, J., Douvis, K. C., Tselioudis, G., and Zerefos, C. S.: Long term precipitation trends and variability within the Mediterranean region, Nat. Hazards Earth Syst. Sci., 11, 3235–3250, https://doi.org/10.5194/nhess-11-3235-2011, 2011. a
Portal, A., Raveh-Rubin, S., Catto, J. L., Givon, Y., and Martius, O.: Linking compound weather extremes to Mediterranean cyclones, fronts, and airstreams, Weather and Climate Dynamics, 5, 1043–1060, 2024. a
Portal, A., Angelidou, A., Rousseau-Rizzi, R., Raveh-Rubin, S., Givon, Y., Catto, J. L., Battaglioli, F., Taszarek, M., Flaounas, E., and Martius, O.: Convective environments within Mediterranean cyclones, Atmos. Sci. Lett., 26, e1302, https://doi.org/10.1002/asl.1302, 2025. a, b
Raveh-Rubin, S. and Wernli, H.: Large-scale wind and precipitation extremes in the Mediterranean: a climatological analysis for 1979–2012, Q. J. Roy. Meteor. Soc., 141, 2404–2417, 2015. a, b
Raveh-Rubin, S. and Wernli, H.: Large-scale wind and precipitation extremes in the Mediterranean: dynamical aspects of five selected cyclone events, Q. J. Roy. Meteor. Soc., 142, 3097–3114, 2016. a, b
Reale, M., Cabos Narvaez, W. D., Cavicchia, L., Conte, D., Coppola, E., Flaounas, E., Giorgi, F., Gualdi, S., Hochman, A., Li, L., Lionello, P., Podrascanin, Z., Salon, S., Sanchez-Gomez, E., Scoccimarro, E., Sein, D. V., and Somot, S.: Future projections of Mediterranean cyclone characteristics using the Med-CORDEX ensemble of coupled regional climate system models, Clim. Dynam., 1–24, https://doi.org/10.1007/s00382-021-06018-x, 2022. a
Rousseau-Rizzi, R., Raveh-Rubin, S., Catto, J. L., Portal, A., Givon, Y., and Martius, O.: A storm-relative climatology of compound hazards in Mediterranean cyclones, Weather Clim. Dynam., 5, 1079–1101, https://doi.org/10.5194/wcd-5-1079-2024, 2024. a
Rubin, S., Ziv, B., and Paldor, N.: Tropical plumes over eastern North Africa as a source of rain in the Middle East, Mon. Weather Rev., 135, 4135–4148, https://doi.org/10.1175/2007mwr1919.1, 2007. a
Saaroni, H., Ziv, B., Bitan, A., and Alpert, P.: Easterly wind storms over Israel, Theor. Appl. Climatol., 59, 61–77, https://doi.org/10.1007/s007040050013, 1998. a
Saaroni, H., Halfon, N., Ziv, B., Alpert, P., and Kutiel, H.: Links between the rainfall regime in Israel and location and intensity of Cyprus lows, Int. J. Climatol., 30, 1014–1025, https://doi.org/10.1002/joc.1912, 2010. a, b
Sanders, F. and Gyakum, J. R.: Synoptic-dynamic climatology of the “bomb”, Mon. Weather Rev., 108, 1589–1606, 1980. a
Sharon, D. and Kutiel, H.: The distribution of rainfall intensity in Israel, its regional and seasonal variations and its climatological evaluation, J. Climatol., 6, 277–291, https://doi.org/10.1002/joc.3370060304, 1986. a
Shay-El, Y. and Alpert, P.: A diagnostic study of winter diabatic heating in the Mediterranean in relation to cyclones, Q. J. Roy. Meteor. Soc., 117, 715–747, https://doi.org/10.1256/smsqj.50003, 1991. a
Stathopoulos, C., Patlakas, P., Tsalis, C., and Kallos, G.: The role of sea surface temperature forcing in the life-cycle of Mediterranean cyclones, Remote Sens.-Basel, 12, 825, https://doi.org/10.3390/rs12050825, 2020. a
Stevens, D. E., Zhang, L., and Crum, F.: Meteorology, Dynamic (Troposphere), Reference Module in Earth Systems and Environmental Sciences, Elsevier, ISBN 9780124095489, https://doi.org/10.1016/B978-0-12-409548-9.05371-9, 2013. a
Trigo, I. F., Davies, T. D., and Bigg, G. R.: Objective Climatology of Cyclones in the Mediterranean Region, J. Climate, 12, 1685–1696, https://doi.org/10.1175/1520-0442(1999)012<1685:OCOCIT>2.0.CO;2, 1999. a
Tsvieli, Y. and Zangvil, A.: Synoptic climatological analysis of Red Sea Trough and non-Red Sea Trough rain situations over Israel, Adv. Geosci., 12, 137–143, https://doi.org/10.5194/adgeo-12-137-2007, 2007. a
Tuel, A. and Eltahir, E. A.: Why is the Mediterranean a climate change hot spot?, J. Climate, 33, 5829–5843, https://doi.org/10.1175/jcli-d-19-0910.1, 2020. a
Zangvil, A. and Druian, P.: Upper air trough axis orientation and the spatial distribution of rainfall over Israel, Int. J. Climatol., 10, 57–62, https://doi.org/10.1002/joc.3370100107, 1990. a
Zangvil, A., Karas, S., and Sasson, A.: Connection between eastern Mediterranean seasonal mean 500 hPa height and sea-level pressure patterns and the spatial rainfall distribution over Israel, Int. J. Climatol., 23, 1567–1576, https://doi.org/10.1002/joc.955, 2003. a
Zappa, G., Hawcroft, M. K., Shaffrey, L., Black, E., and Brayshaw, D. J.: Extratropical cyclones and the projected decline of winter Mediterranean precipitation in the CMIP5 models, Clim. Dynam., 45, 1727–1738, 2015. a, b
Ziv, B., Shimer, R., Harpaz, T., Drori, R., Alpert, P., Raveh-Rubin, S., and Saaroni, H.: Identification and classification of the wet Red Sea Trough over Israel, Int. J. Climatol., 42, 10062–10082, https://doi.org/10.1002/joc.7884, 2022. a, b
Ziv, Z., Dayan, U., Kushnir, Y., Roth, C., and Enzel, Y.: Regional and global atmospheric patterns governing rainfall in the southern Levant, Int. J. Climatol, 26, 55–73, https://doi.org/10.1002/joc.1238, 2006. a, b