the Creative Commons Attribution 4.0 License.
the Creative Commons Attribution 4.0 License.
 | 16 Sep 2022
Modulation of the El Niño teleconnection to the North Atlantic by the tropical North Atlantic during boreal spring and summer
Jake W. Casselman
Bernat Jiménez-Esteve
Daniela I. V. Domeisen
Equatorial Pacific sea surface temperature anomalies (SSTAs) associated with El Niño–Southern Oscillation (ENSO) can influence the North Atlantic European (NAE) region. ENSO tends to be negatively correlated with the North Atlantic Oscillation in winter, while this connection is less clear in boreal spring and summer when the ENSO teleconnection encounters altered background conditions (i.e., a weaker subtropical jet), which can modulate the signal on the way to the NAE region. One such region that modulates the ENSO teleconnection to the NAE region is the tropical North Atlantic (TNA). While several mechanisms exist for this modulation, we center our analysis on the Caribbean region and the Walker cells. In order to isolate the relevant mechanism, we force an idealized atmospheric circulation model with three different seasonally varying sea surface temperature patterns that represent an ENSO event with or without the influence of the TNA, focusing on the decaying phase of ENSO in boreal spring and summer. We find that in boreal spring, the TNA modulates the ENSO teleconnection to the NAE primarily through a propagating Rossby wave train, while in summer, the TNA's influence tends to strengthen the ENSO influence over the NAE sector. Overall, this study offers a deeper understanding of the inter-basin interactions through the Walker cell following an ENSO event and the central role of tropical Atlantic SSTAs in modulating the teleconnection to the NAE region in boreal spring and summer.
- Article
(27996 KB) - Full-text XML
-
Supplement
(19050 KB) - BibTeX
- EndNote


El Niño–Southern Oscillation (ENSO) dominates interannual variability within the tropics, but teleconnections can also influence the extratropics, such as the North Atlantic European (NAE) region (Fraedrich and Müller, 1992; Fraedrich, 1994; Brönnimann, 2007). In boreal winter, El Niño events tend to be associated with the negative phase of the North Atlantic Oscillation (NAO) and La Nina events with the positive phase. This impacts weather over Europe (Brönnimann et al., 2007). These observed anomalies induced by ENSO can benefit long-range predictability over Europe (Domeisen et al., 2015). However, the pathways of the ENSO teleconnection to the NAE region are not yet fully understood. The complexity present in the ENSO impact over Europe results in part from several ENSO teleconnections that propagate through different geographical regions, as well as different atmospheric levels (Rodríguez-Fonseca et al., 2016). For example, teleconnections can propagate through the extratropical troposphere (Bulić and Kucharski, 2012; Jiménez-Esteve and Domeisen, 2018; Mezzina et al., 2020), the extratropical stratosphere (Butler et al., 2014; Ayarzagüena et al., 2018; Domeisen et al., 2019), or the Caribbean region (Wulff et al., 2017; Hardiman et al., 2019; Rieke et al., 2021). Furthermore, the ENSO teleconnection can be modulated by different regions and processes along its way, such as the tropical North Atlantic (Sung et al., 2013; Casselman et al., 2021) and the Indian Ocean (Zhong et al., 2005; Fletcher and Cassou, 2015; Joshi et al., 2021). While ENSO teleconnections to the NAE region have dominantly been studied for winter, the seasonality plays a key role in the robustness of the teleconnection, whereby boreal spring and summer ENSO teleconnections are weaker than the boreal winter teleconnections due to, for example, a weakened and southerly shifted subtropical jet (Ding et al., 2011). The ENSO impact on the NAE region in boreal spring and summer following a mature ENSO phase therefore remains less well understood as compared to the winter teleconnection, but some studies point towards ENSO also being negatively correlated with the summer NAO or a similar dipole structure in the North Atlantic (Wu and Lin, 2012; Mezzina et al., 2020).
A key region that can modulate boreal spring and summer ENSO teleconnections towards the NAE region is the tropical North Atlantic (TNA). The underlying mechanism for the modulation of the ENSO teleconnection by the TNA is however not fully resolved, and neither is the timing of the influence. TNA sea surface temperature (SST) anomalies (SSTAs) are positively correlated with the Niño3.4 index and peak in boreal spring (March–May, MAM) following an ENSO event (Enfield and Mayer, 1997; Lee et al., 2008). The teleconnection from the equatorial Pacific to the TNA travels through both a tropical and an extratropical pathway, influencing the TNA SSTs through either moist convection/stability processes or changes in the trade winds (Jiang and Li, 2019; Casselman et al., 2021). The TNA and the NAE regions themselves are connected through changes in the Hadley cell or the Inter-Tropical Convergence Zone (ITCZ) (Okumura et al., 2001; Michel and Rivière, 2011), resulting in the propagation of Rossby waves that can contribute to a circumglobal wave train (Toniazzo and Scaife, 2006; García-Serrano et al., 2011; Saeed et al., 2014; Scaife et al., 2017; Matsumura and Kosaka, 2019). The aforementioned circumglobal wave train can, furthermore, project onto different summertime circulation regimes over the NAE region, such as the Atlantic low (Cassou et al., 2005). Thus, the mechanisms driving the TNA–NAE teleconnection may also be responsible for communicating the ENSO-related TNA SSTAs to the NAE region.
Similar to the TNA SSTAs, the neighboring Caribbean region also plays a role in the excitation and propagation of Rossby waves to the extratropics (Wulff et al., 2017; Hardiman et al., 2019; Neddermann et al., 2019; Rieke et al., 2021). In particular, Rossby wave trains originating in the Caribbean region can influence the summer East Atlantic (SEA) pattern, which is related to European summer climate (Wulff et al., 2017). A proposed forcing for this wave train includes opposing diabatic heating anomalies over the tropical Pacific and Caribbean, referred to as the Pacific–Caribbean dipole (PCD) (Wulff et al., 2017), which is in turn related to an underlying SSTA pattern that occurs during the developing phase of an ENSO event between June and August (JJA). In addition to influencing the regional climate over Europe, a wave train launched from the tropical Atlantic or Caribbean can continue as far downstream as southwestern China (Li et al., 2018; Choi and Ahn, 2019). Similar to the PCD, the so-called East Atlantic and West Russia (EA/WR) teleconnection is also related to Rossby wave trains from the tropical Atlantic and has the potential to improve predictability in all four seasons (Lledó et al., 2020). Furthermore, since the EA/WR teleconnection may result from a westward extension of the downward branch of the Pacific Walker cell, as well as a Gill response over the eastern equatorial Pacific, the EA/WR teleconnection may relate to the PCD index (Lim, 2015; Choi and Ahn, 2019).
While it is clear that the Caribbean region and the PCD can create meaningful atmospheric impacts on interannual timescales, it remains unclear why the PCD and Caribbean Rossby wave source (RWS) are more related to the developing phase of an ENSO event than the decaying phase, as well as if the PCD is also related to the ENSO-related TNA SSTAs. Since the PCD corresponds to an SST gradient (between the Pacific and Atlantic), the PCD may be influenced by the TNA, and the TNA SSTAs may, therefore, further influence the RWS over the Caribbean. As the location of the PCD also corresponds well with the edges of the Pacific and Atlantic Walker cells, the PCD is also likely related to the climatological upwelling and downwelling branches of the two adjacent Walker cells, which can be influenced by underlying SSTs. Furthermore, there is a co-variance between the Pacific and Atlantic SSTAs (Casselman et al., 2021) – i.e., the basins often have anomalous SSTAs of the same sign – and therefore the TNA may be important for influencing the PCD following an ENSO event. It could also be hypothesized that the positive correlation between ENSO and the TNA SSTA explains why the PCD is reduced or not active during the decaying phase of an ENSO event, as an intensifying TNA SSTA in boreal spring reduces the overall SSTA gradient between the basins.
The positive correlation between the Pacific and Atlantic SSTAs also results in Matsuno Gill-type responses over South America (hereafter shortened to Gill-type response). In particular, in response to anomalously positive SSTAs and diabatic heating over the equatorial Pacific, tropical wave theory predicts that the atmosphere will be perturbed by creating a pair of symmetric upper-level anticyclones (Gill, 1980; Lee et al., 2009). Downstream, the Walker cell is also perturbed via Kelvin wave propagation from the initial Gill-type response, resulting in a secondary Gill response. This response is opposite to the initial perturbation, creating descending motion and a pair of upper-level cyclones over South America (García-Serrano et al., 2017; Casselman et al., 2021). Likewise, as the tropical Atlantic tends to exhibit positive SSTAs preceding an ENSO event, an atmospheric Gill-type response is initiated, including a pair of upper-level anticyclones. However, given that tropical Atlantic SSTAs predominantly occur north of the Equator, the TNA exhibits a stronger response as compared to the corresponding region south of the Equator, leading to an asymmetric Gill-type response (Gill, 1980). Thus there is potentially a counteracting atmospheric response between the secondary Gill response from ENSO and the asymmetric response created from the TNA SSTAs.
However, the small number of observed events in reanalysis datasets limits the possibilities to isolate the modulation mechanisms of ENSO teleconnections. As a result, several studies have turned to atmosphere–ocean coupled model experiments to generate further events. Nevertheless, these coupled models have their own set of difficulties in representing ENSO variability correctly (i.e., SST diversity and strength), which is essential for correctly representing ENSO teleconnections (Frauen et al., 2014; Bayr et al., 2019). One solution to this problem is to prescribe realistic SSTs in an atmospheric general circulation model (AGCM). By using an AGCM to isolate the influence from the TNA, this study aims to determine if and how the TNA modulates the influence on the ENSO teleconnection towards the NAE region. We consider the large-scale interactions between the tropical basins (i.e., Walker cell perturbation), as well as the more localized influence on the PCD response over the Caribbean. Furthermore, we analyze how interactions between the tropics may lead to changes in the North Atlantic, focusing on boreal spring and summer following an ENSO event. In our model experiments we force the tropical Pacific and Atlantic both simultaneously and separately to determine the importance of the ENSO-related TNA SSTAs, and we focus on both linearity and constructive/destructive interactions. Finally, while ENSO teleconnections towards the North Atlantic can travel through either the stratosphere or troposphere (Jiménez-Esteve and Domeisen, 2018), teleconnections that travel through the Caribbean are primarily tropospheric (Hardiman et al., 2019), and hence our study focuses on the tropospheric pathway only.
2.1 Data
This study utilizes monthly mean SST from the Extended Reconstructed Sea Surface Temperature (ERSST) version 4 (Huang et al., 2015a), as well as monthly mean fields (zonal/meridional winds, geopotential height, and precipitation) from the Japanese 55-year Reanalysis (JRA-55) (Kobayashi et al., 2015). We analyze the period from January 1958 until December 2019. We use a 30-year filter to remove low-frequency variability longer than 30 years for all fields, created using a fast Fourier transform (FFT). Statistical significance is calculated using a Monte Carlo test that is repeated 10 000 times to determine the significance of the atmospheric response (Buckland and Noreen, 1990). This test selects a number of samples based on a given subsampling criterion and compares the distribution to either the population from which the samples were drawn (as in reanalysis) or different model runs. We also use correlation (R) throughout and derive significance by using a confidence interval created by using a Fisher transform (Devore, 1991; Simpson and Polvani, 2016).
2.2 Model description and experiments
In addition to reanalysis data, we utilize Isca (Vallis et al., 2018), a simplified AGCM, to conduct a series of targeted forcing experiments. This model uses the Geophysical Fluid Dynamics Laboratory (GFDL) dynamical core and uses the same model configuration as Jiménez-Esteve and Domeisen (2020). The atmosphere does not have explicit liquid water content, but instead the moisture and radiative processes are considered using evaporation from the surface and a fast condensation scheme. Land–sea contrasts are created by changing the mixed layer depth, evaporative resistance, and albedo, while realistic topography is achieved by using the continental outline from ECMWF (Thomson and Vallis, 2018a, b). Finally, the model resolution includes a Gaussian grid with 50 vertical levels (up to 0.02 hPa) and T42 horizontal resolution.
We perform three different model experiments, along with a control run. The climatological SST forcing is created using the ERSSTv4 climatology from 1958 to 2019. In addition to the climatological SSTs, we perform experiments including a Pacific-only (ENSO-like, “P”) forcing, Atlantic-only (TNA SST following an ENSO event, “A”) forcing, and a combined Pacific–Atlantic forcing, where SSTAs in both basins are forced (“AP”). Over the forced regions, the SST forcing is derived by regressing the Niño3.4 index onto the SSTA field, which is then added to the background climatology. We choose to include both positive and negative SSTAs as previous studies have shown that the zonal SSTA gradient is important for influencing the Walker circulation (Zhao et al., 2021). The SST forcing is computed by regressing the October to February (ONDJF) mean Niño3.4 index onto the monthly SST field, backwards to August and forward to the following October. August to October of both the backward and forward regressions are averaged to create a smooth annual cycle. Similar to Jiménez-Esteve and Domeisen (2020), regression values are multiplied by 4, resulting in an SSTA peak of approximately 4 ∘C in the Pacific and a peak of approximately 1 ∘C in the Atlantic (for DJF and MAM, respectively; see Fig. 1 for forcing pattern and annual cycle). We chose to multiply the forcing by 4 to ensure a sufficient amplitude of the response, but it should be acknowledged that this forcing is stronger than in observations. Furthermore, the atmospheric response to the SSTA forcing may exhibit nonlinearities (i.e., the upper-level divergence responds nonlinearly to a linear change in the magnitude of Pacific SSTAs), but given our analysis is during boreal spring and summer when Pacific SSTAs are weaker than in boreal winter, any nonlinearities may also be weaker than those during boreal winter (Graham and Barnett, 1987; Sabin et al., 2013). Finally, for this study, we aim to determine the importance of the TNA following an El Niño event only, and we do not consider La Niña events.
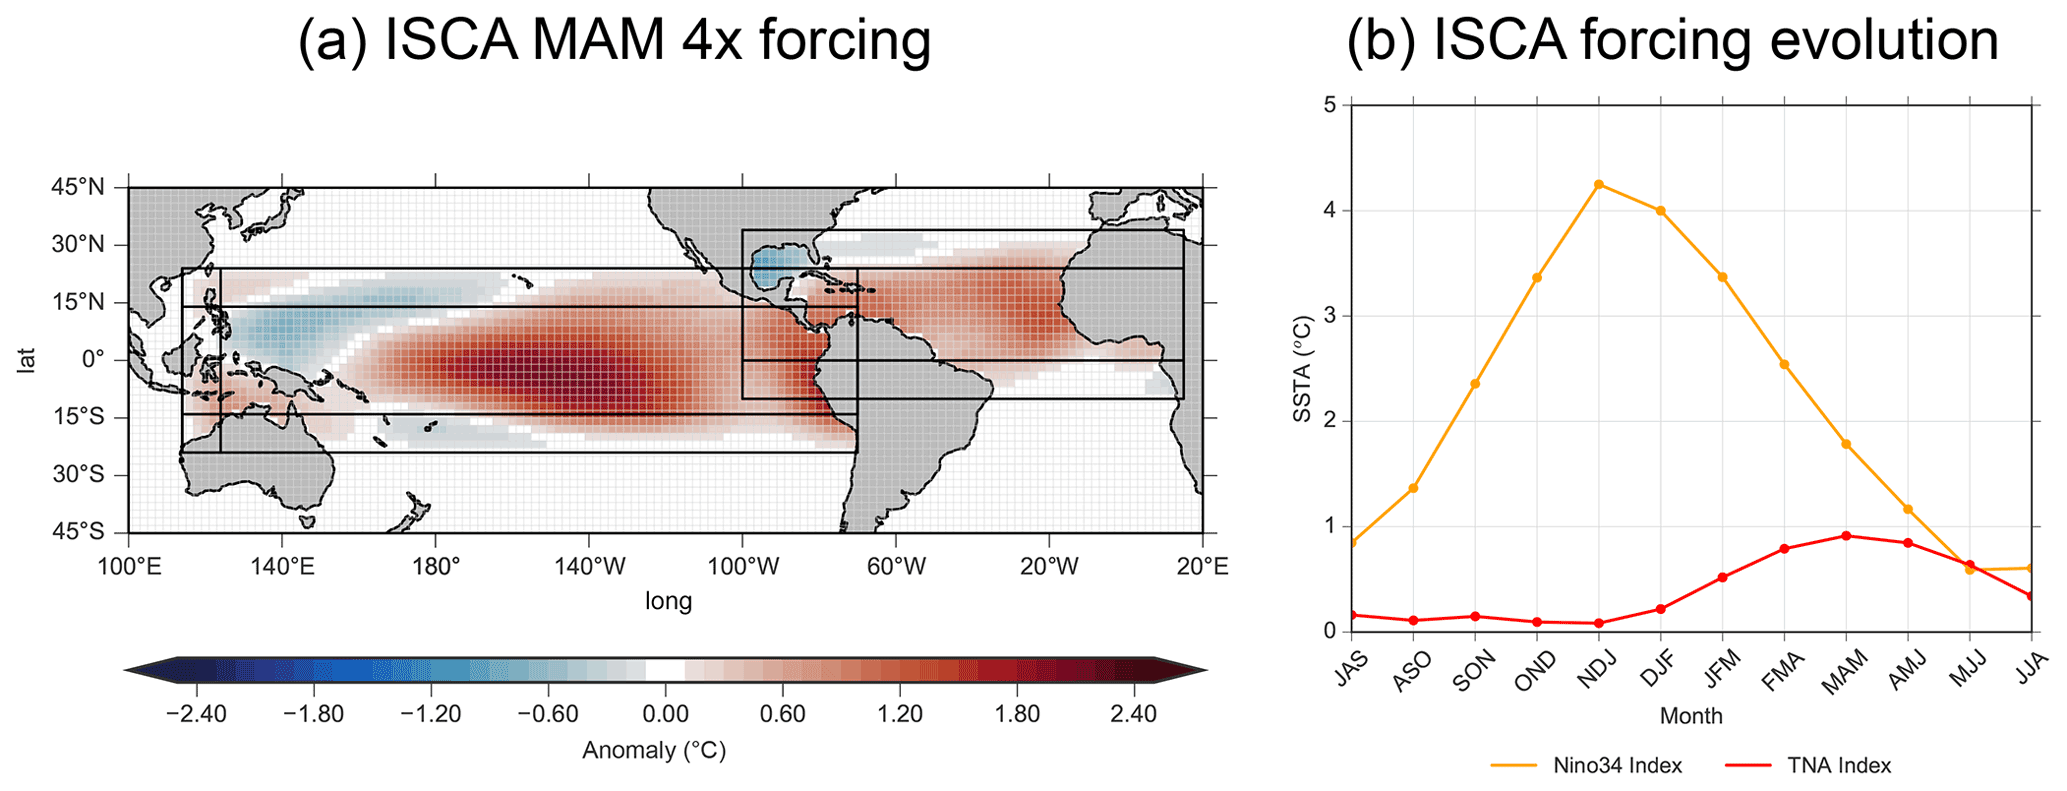
Figure 1Forcing areas and seasonal evolution used to force Isca. Panel (a) depicts March–May (MAM) SST forcing for the AP runs (combined Pacific and Atlantic forcing). Black outlines indicate areas where regression was used, with outside rectangles indicating transition areas of linear decrease (see Fig. S1 in the Supplement for percentages). Panel (b) shows the seasonal evolution of Niño3.4 (orange) and TNA (red) indices using a 3-month running mean.
The forcing region for the Pacific spans from the coastline of the Americas to 124∘ E, with a linear decrease to climatology from 124 to 114∘ E. Similarly, in the meridional direction the forcing linearly decreases to zero between 14–24∘ N and 14–24∘ S. The Atlantic forcing spans the area from the African coast to the Americas. Since the dominant SSTA following an ENSO event is located in the northern part of the tropical Atlantic (peaking around 15∘ N), we use a linear decrease to zero from 0 to 10∘ S and from 24 to 34∘ N (Czaja et al., 2002).
Climatological runs are forced with monthly SSTs averaged between 1958 and 2019. There are 50 years with a recurrent SST seasonal cycle, of which the first 20 years are removed as spin-up. The forced SST experiments (P, A, AP) continue from the 20th year of climatology for another 60 years. Removing the first year for spin up yields 59 years in total for each forced SST simulation. In order to compute the streamfunction and perform a Helmholtz decomposition, missing values of the model experiments are filled solving Poisson's equation with a tolerance of 10−4, relaxation constant of 0.6, and an iteration maximum of 89.
To remove the potential indirect influence from stratospheric variability, we relax (nudge) the zonal mean of the zonal winds above the tropopause to the daily climatology of the control simulation as in Jiménez-Esteve and Domeisen (2020). The relaxation term is computed at each model time step and applied to the zonal mean zonal wind temporal tendency. Nudging is applied for pressure levels above 0.2 times the tropopause level and includes a transition layer between 0.5 and 0.2 times the tropopause pressure level. See Jiménez-Esteve and Domeisen (2020) for the mathematical description.
2.3 Statistical methods
We use multiple linear regression (MLR) analysis to isolate the linear influence from the Atlantic and Pacific and plot the pointwise MLR coefficients following the method in Izumo et al. (2010) and Casselman et al. (2021). We also utilize partial correlation between three variables, following Wang et al. (2006). The partial correlation between variables X and Y, when removing the influence of variable Z, is calculated as follows:
where RXY represents the linear correlation coefficient between X and Y.
2.4 Index definitions and diagnostics
To evaluate Pacific SSTA, we use detrended 3-month running averages of SSTs averaged over the equatorial Pacific region bounded by 5∘ N–5∘ S, 170–120∘ W. The TNA index is defined as the area-averaged SST over the region of 5–25∘ N, 55–15∘ W, as in Taschetto et al. (2016). Finally, we utilize the Pacific–Caribbean dipole (PCD) index as defined by Wulff et al. (2017). This index is determined by the normalized area-averaged precipitation difference between the Pacific and Caribbean (Pacific box (10–20∘ N, 180–110∘ W) minus Caribbean box (10–25∘ N, 85–65∘ W)).
To analyze the upper-level circulation, we compute the streamfunction equation in Cartesian coordinates by using spherical harmonics (Dawson, 2016). This includes and , where ψ represents the streamfunction, and u (v) is the zonal (meridional) winds. The zonal mass streamfunction over the equatorial region is calculated analogously to the meridional mass streamfunction, except with a longitudinal and not latitudinal dependence, and we use the mean of winds between 5∘ N and 5∘ S. Furthermore, we utilize the Helmholtz-decomposed zonal divergence (uχ) for the streamfunction equation under the assumption that the circulation is primarily thermally driven between 5∘ N and 5∘ S (Yu et al., 2012). The zonal stream function (Ψz) is defined as
where a is the Earth's radius, g is gravitational acceleration, p is pressure, and the brackets indicate the latitude for integration. An index measuring the Walker cell gradient between the Pacific and Atlantic, the Walker gradient index (hereafter: Walker index), is defined as the upper-level (200–400 hPa) streamfunction in the Atlantic (5∘ N–5∘ S, 50–20∘ W) minus the streamfunction in the Pacific (5∘ N–5∘ S, 120–90∘ W).
The Rossby wave source (RWS) (Sardeshmukh and Hoskins, 1988) is defined as
where ζ is the absolute vorticity, and vx is the divergent meridional wind. The first term represents vortex stretching, while the second represents vorticity advection. Furthermore, a Gaussian smoothing with a Gaussian kernel standard deviation of 0.7 is applied to be able to interpret the large-scale responses. A localized Caribbean RWS index is defined as the area average of the 200 hPa RWS field bounded by 5–15∘ N, 80–60∘ W.
In the North Atlantic, we define the NAO using the index by Li and Wang (2003), which measures the difference between the zonally averaged sea level pressure (SLP) at 35 and 65∘ N from 80∘ W to 30∘ E. We define the East Atlantic pattern as an area average of the 500 hPa geopotential height between 40–60∘ N, 50–20∘ W (see Fig. S2). We chose this definition over an EOF, as the dominant modes of variability change between the different model experiments.
3.1 Inter-basin relationship between equatorial Atlantic and Pacific in reanalysis
First, we aim to identify the respective influences that each equatorial region has on the Walker circulation by applying an MLR analysis to the JRA-55 reanalysis dataset. Understanding this interplay is important as the combined influence over South America and the Caribbean region may be crucial for creating the PCD and an RWS that can lead to a Rossby wave train that influences the extratropics. The MLR analysis allows for an approximate separation of the influences from the respective equatorial basins, which is necessary since ENSO and the TNA SSTA co-vary to a high degree. Finally, we focus on boreal spring and boreal summer for all fields as we are interested in the impact on the ENSO teleconnection that the TNA SSTA peak has following an ENSO event (MAM; Casselman et al., 2021). Furthermore, we analyze boreal summer (JJA) as it corresponds to the timing of the peak in the connection between the PCD and the NAE and to the season when the Atlantic warm pool has the strongest influence on the Walker circulation (Wang et al., 2006, 2010; Rojo Hernández and Mesa, 2020). Both MAM and JJA are also related to wave trains towards the NAE region (Lim, 2015; Jung et al., 2017; Wulff et al., 2017; Li et al., 2018; Choi and Ahn, 2019; Neddermann et al., 2019; Lledó et al., 2020).
A key aspect of the Walker circulation response includes how each equatorial basin influences the vertical winds (associated with different Gill-type responses) over South America and the Caribbean. Figure 2 shows the boreal spring and summer Walker cells using an MLR with the zonal mass streamfunction and winds between 5∘ N and 5∘ S, in reference to the DJF Niño3.4 (preceding year) and MAM TNA (same year) indices. Anomalous Walker cell streamfunction and wind vectors for boreal spring and summer indicate that the influence from the Atlantic and Pacific SSTAs counteract one another during both seasons. In boreal spring (Fig. 2a–b) this counteraction includes strong upper-level divergence over the eastern Pacific (associated with a weakening El Niño event), strong westerlies over South America, and descending motion around the western Atlantic. Conversely, Atlantic SSTAs are associated with divergence over the western Atlantic and strong upper-level easterlies over South America, consistent with Wang (2002), and thus the counteraction occurs primarily over the Atlantic and South America.
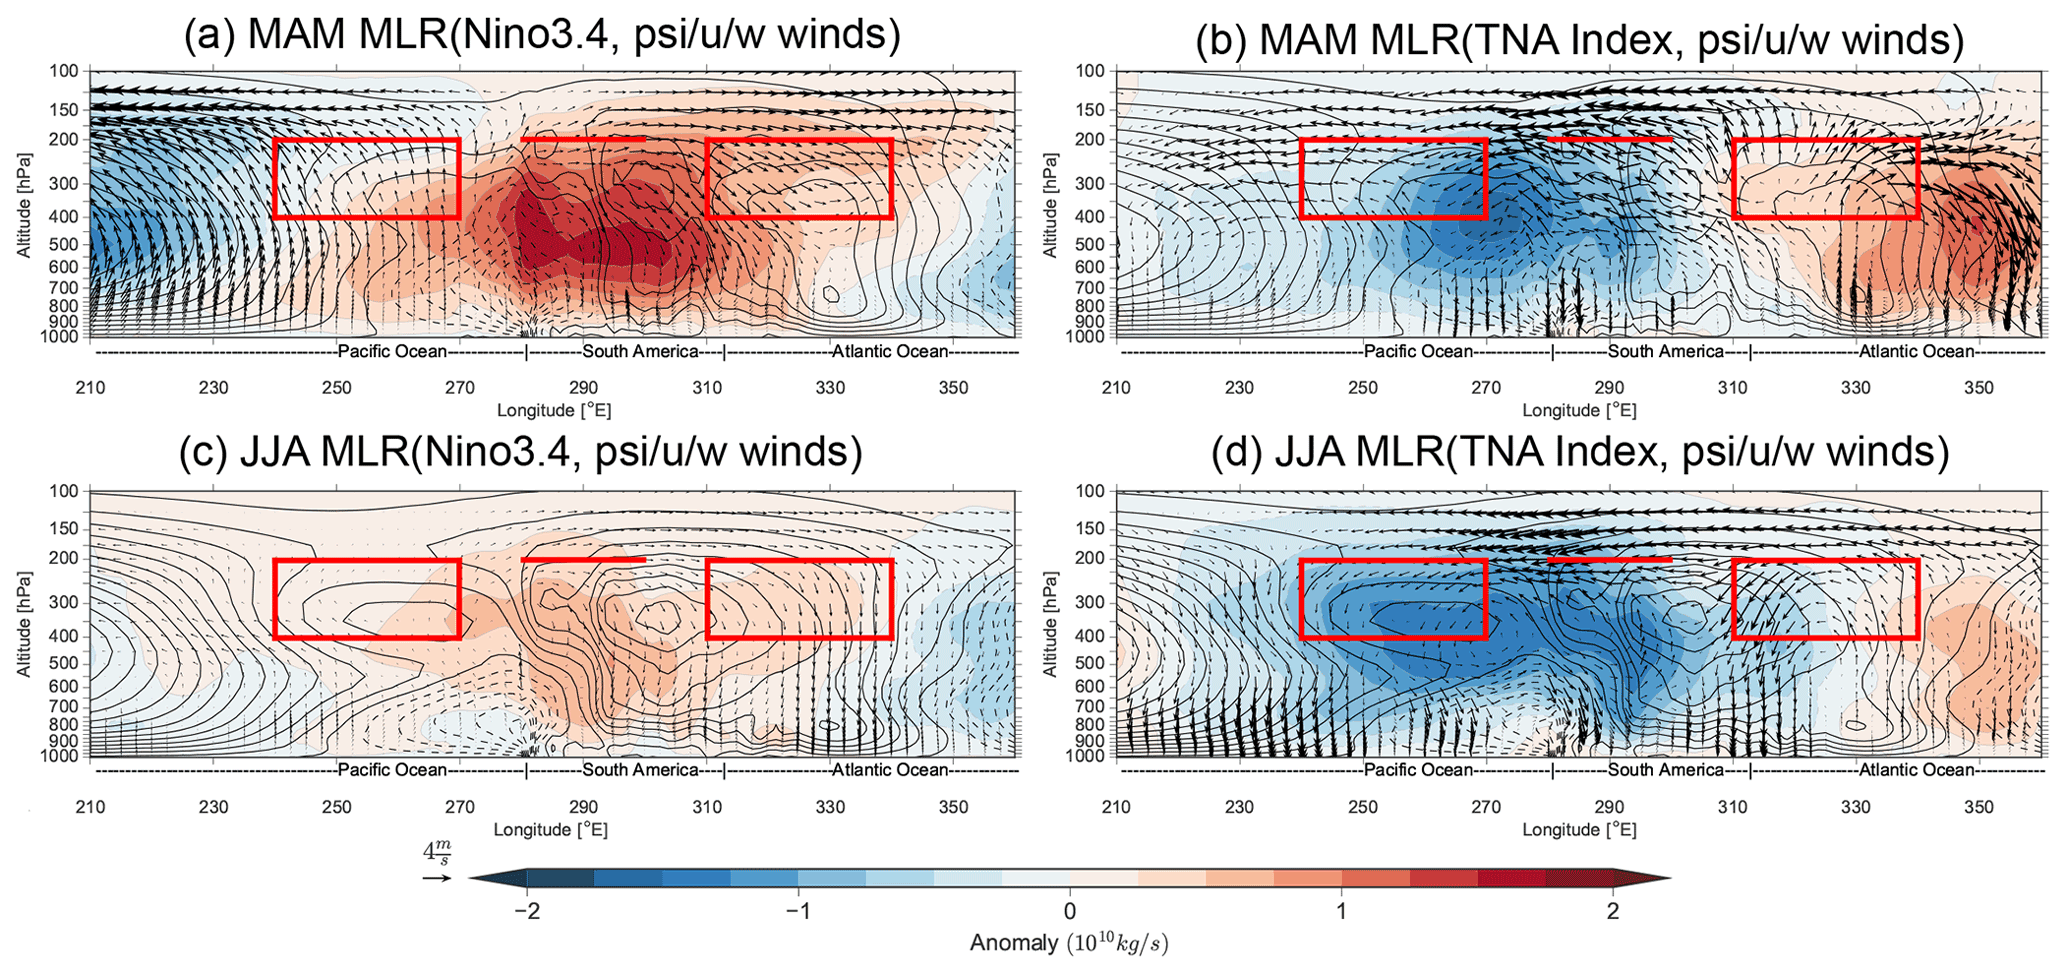
Figure 2Pointwise multiple linear regression coefficients for the MAM (a, b) and JJA (c, d) zonal mass streamfunction (shading) and u and w winds components (vectors) on the MAM TNA SSTA and DJF Niño3.4 standardized indices. Contours represent the zonal mass streamfunction climatology (in intervals of 1.5×10¹⁰ kg s−1), and winds are scaled by dividing the vertical velocity by . Red rectangles over the Pacific and Atlantic represent the Walker index, while the horizontal line at 290∘ E represents the Caribbean RWS index. Data from JRA-55.
During boreal summer, anomalies related to both the TNA and ENSO largely continue from boreal spring, except that the upper-level divergence due to Atlantic SSTAs has reduced, and vertical motion over South America has changed, whereby there is now descending motion around the western Atlantic. As a result, shifting from boreal spring to boreal summer shows a shift from destructive vertical motion to constructive vertical motion over the western Atlantic and parts of eastern South America, while over central and western South America the result continues to show destructive interactions. As boreal summer streamfunction anomalies are much higher from the Atlantic forcing when compared to the Pacific, the Atlantic likely dominates the Walker cell perturbation. In contrast, in boreal spring, both basins perturb the Walker cell to a similar degree. Thus, the influence of the TNA SSTAs varies both spatially (i.e., Pacific vs. Atlantic) and temporally (i.e., boreal spring vs. boreal summer). Furthermore, as vertical motion over South America and the Caribbean depends on both the Atlantic and Pacific Walker cells, the SSTs in both ocean basins play an important role in driving the PCD.
3.2 Lead–lag relationships of major tropical connections in reanalysis
Next, to check that MAM and JJA are the most important time periods for tropical basin interactions with the Walker cell, we use a 24-month lead–lag correlation analysis to analyze the Walker cell relationship with each tropical basin. To quantify changes in the Walker cell we create a streamfunction gradient index between the Pacific and Atlantic, centered over the Caribbean, and complement this index with a more localized RWS index over the Caribbean. Figure 3 shows the lead–lag correlation of the Walker index with the TNA, Niño3.4, PCD (precipitation dipole between Pacific and Atlantic), and the Caribbean RWS indices. We are interested in a comparison between the PCD and Walker cell gradient, as we previously hypothesized that both mechanisms are highly related. Starting with Fig. 3a, the correlation between the TNA and the Walker index is positive, peaking in boreal spring at a significance level >99 %. Furthermore, the April–June (AMJ) to JJA TNA SSTA continues to influence the Walker index at the 99 % level into the following boreal winter (DJF, 8-month lead).
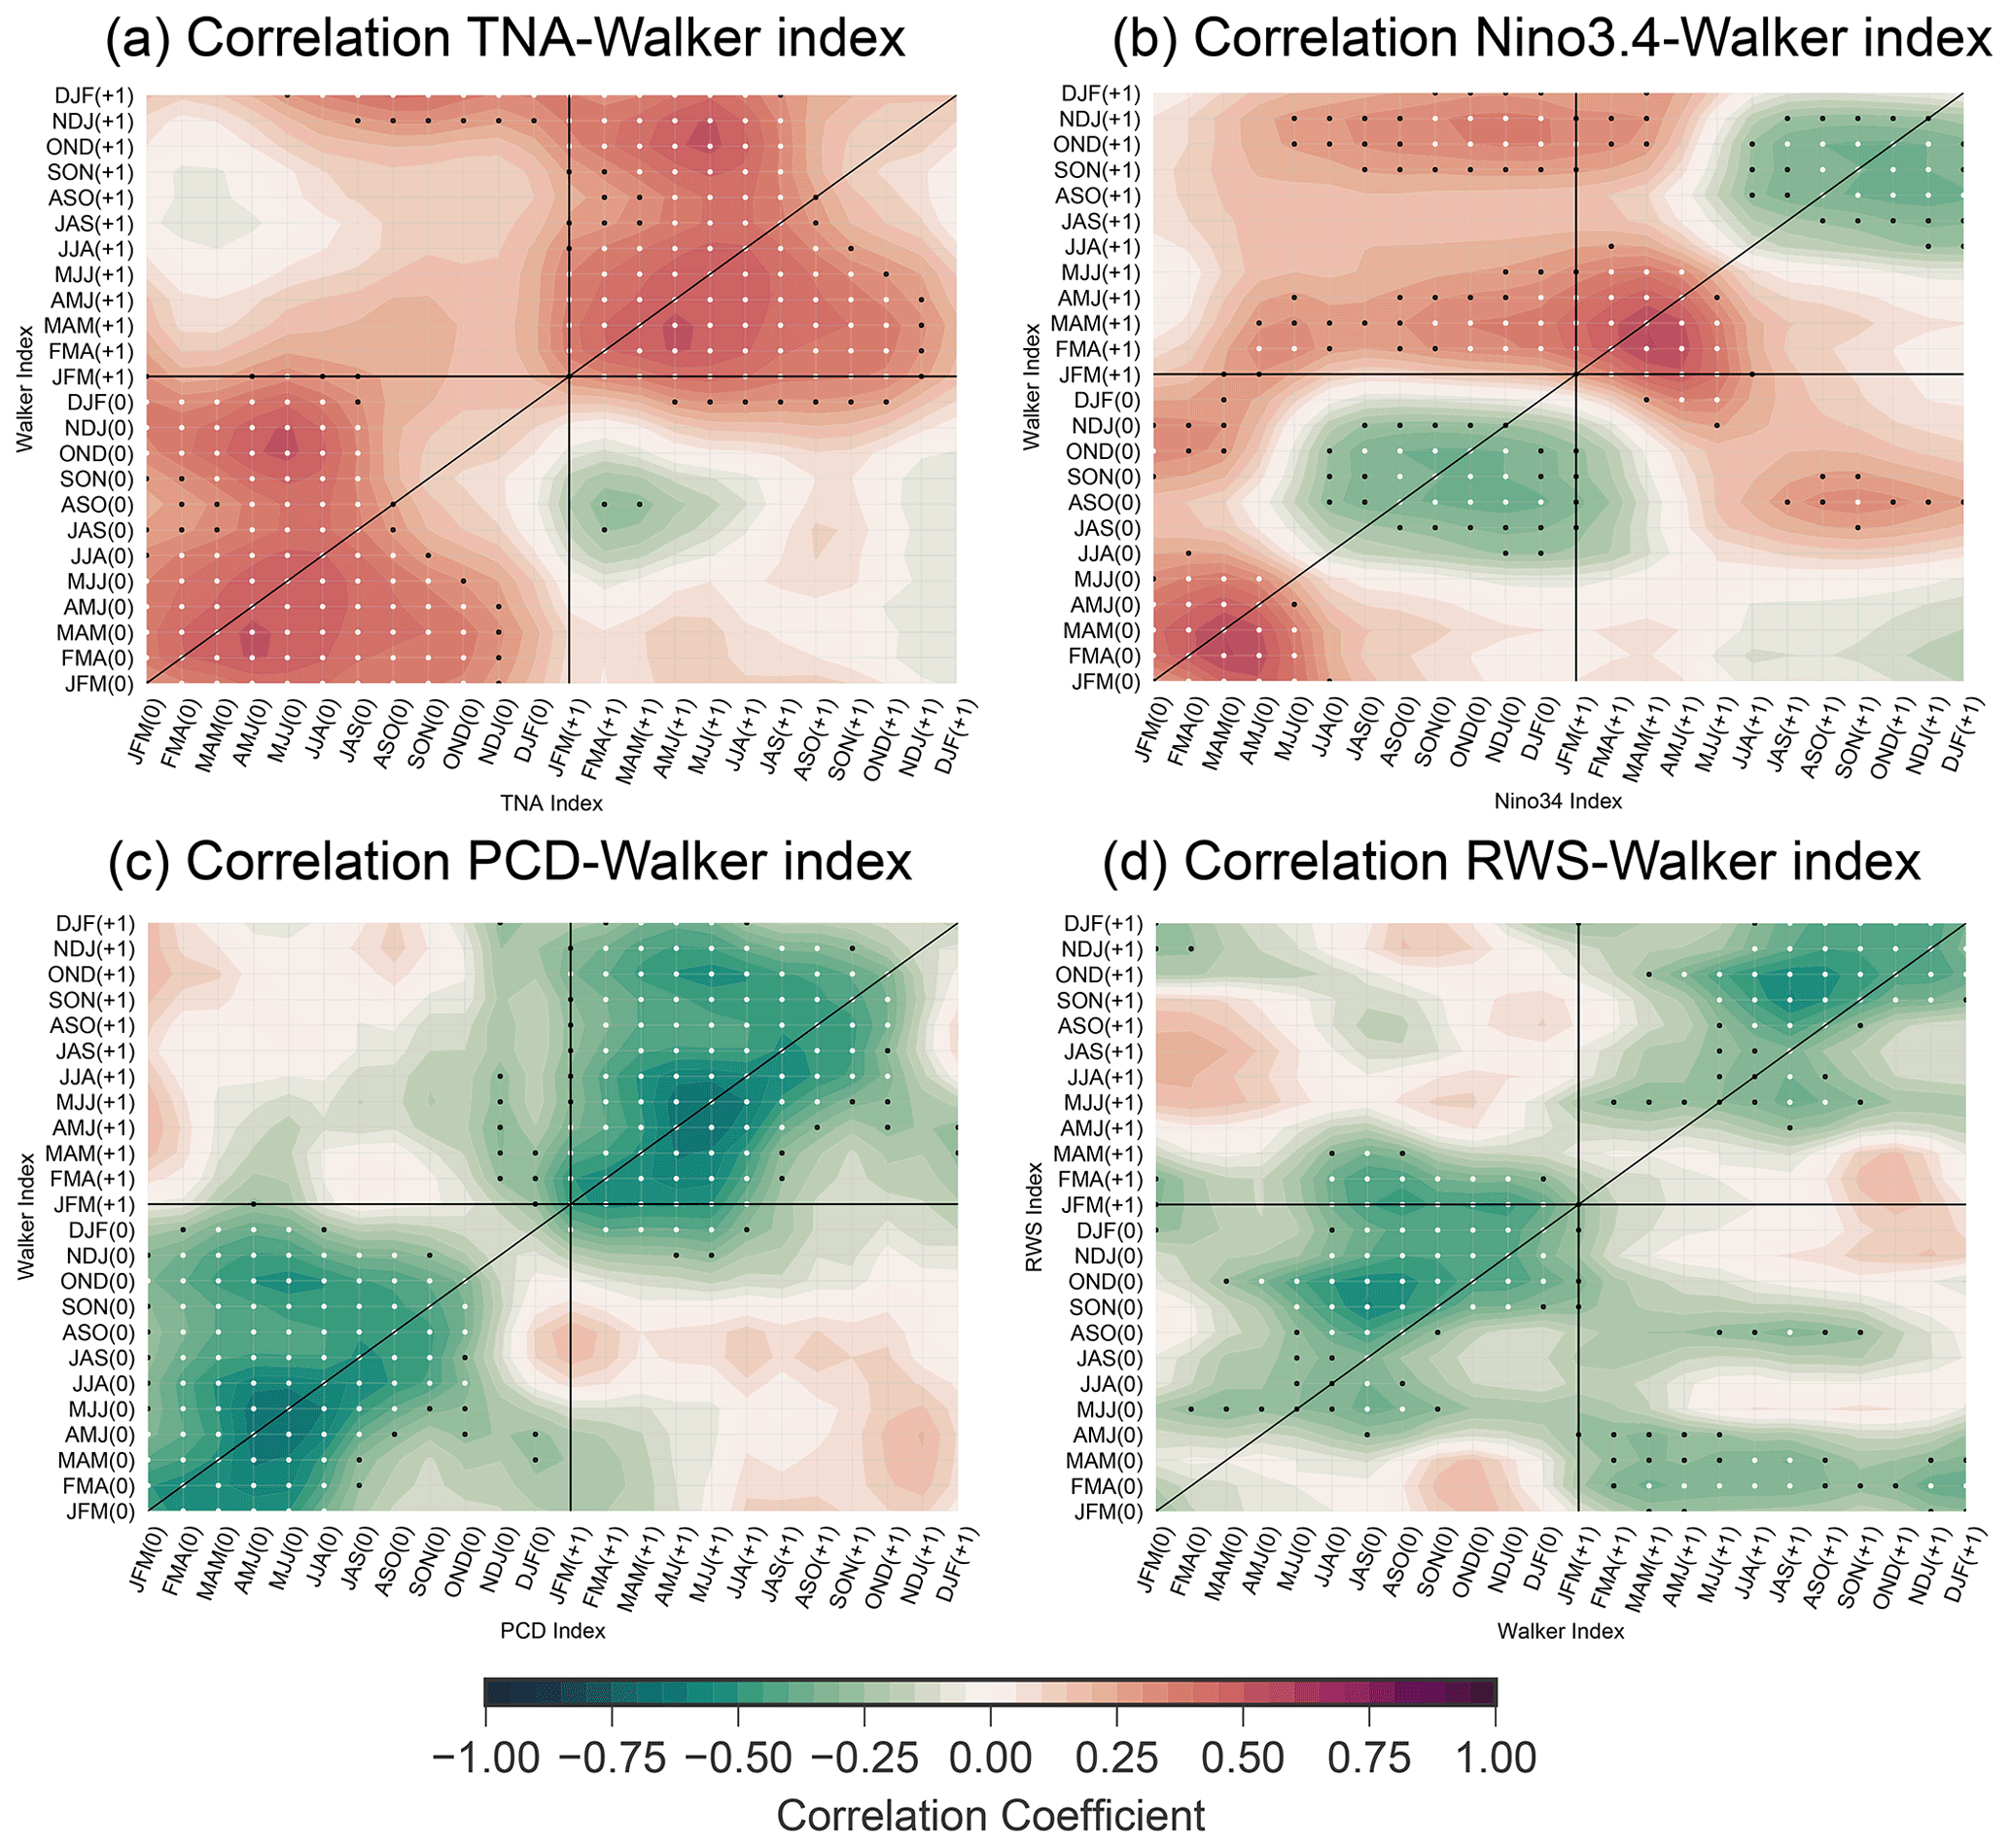
Figure 3Lead–lag correlation between (a) the Walker index and TNA, (b) the Walker and Niño3.4 indices, (c) the Walker and PCD indices, and (d) the Walker and Caribbean RWS indices. The “(0)” and “(+1)” refer to the starting year or subsequent year for each index, the diagonal line corresponds to no lag, and values above (below) the diagonal line represent a lead (lag) of the x-axis variable. The black dots represent the 95 % confidence interval, and white dots represent the 99 % confidence interval. Results are using data from JRA-55 only.
Similarly, the relationship between the Walker index and Pacific SSTA (Fig. 3b) is positive and peaks in the following boreal spring but becomes >99 % significant with a six-season lead for the Niño3.4 index (SON of previous year). The relationship between the Walker index and peak of ENSO (boreal winter Niño3.4) drops off rapidly after boreal spring, while the relationship with the peak of TNA SSTA continues until the following boreal winter. Thus, the results indicate that the TNA SSTA dominates the Walker cell influence in boreal summer and is consistent with the MLR analysis performed in the previous section. This relationship between the Walker index and DJF Niño3.4 remains when using the boreal spring Niño3.4 (same season as TNA peak, MAM), as well as when considering a 0-lag correlation.
Lastly, to summarize the PCD–Walker cell connection, boreal summer Walker index also has a negative correlation with the preceding ENSO event (Fig. 3b), similar in timing (but opposite in sign, as the PCD and walker index dipoles are reversed) to the relationship found by Wulff et al. (2017) for the PCD–ENSO relationship. This hints at the similarities between the Walker and PCD indices. Thus, we further correlate the Walker and PCD indices (Fig. 3c), showing that their relationship is significant above the 99 % level for all seasons, with the exception of early boreal winter. The peak correlation occurs in boreal spring with a lead–lag of 0. As the relationship is continuous over most seasons and the indices measure similar aspects, the Walker cell and PCD index may either be highly coupled or represent the same phenomenon. Furthermore, as the Walker cell gradient and PCD are highly coupled, for the remainder of this paper, we use only the Walker cell gradient. Finally, we relate the Walker index to the more localized Caribbean RWS index (Fig. 3d), which yields a similar relationship as the PCD index, with a negative correlation that is >95 % significant during all seasons except in late boreal winter and spring.
3.3 Tropical Pacific and Atlantic interactions in Isca
Up to this point, we applied an MLR analysis to reanalysis data to determine the relationship between the Pacific and Atlantic SSTs with the Walker circulation and the PCD. This is useful for showing that both basins play important roles and also that their relative importance may shift between boreal spring and summer. However, this method cannot fully capture the TNA's contribution to influencing the Walker cell over the Caribbean, as an MLR assumes that the effects from each basin onto the Walker cell are additive (Osborne and Waters, 2003), which is likely not true. Furthermore, due to the limited data in reanalysis and the high degree of correlation between ENSO and the TNA, it is also difficult to perform targeted experiments by subsampling based on whether the signal in the TNA SSTA is present following an ENSO event. To overcome these issues and to further test our MLR findings, we isolate the influences from both the equatorial Pacific and Atlantic using the atmospheric model Isca with a series of targeted experiments.
In order to address the sensitivity of the ENSO teleconnections to the presence of TNA SSTAs, we determine the separate and combined influence of both basins on the atmospheric circulation using separate forcings for the Atlantic (A), Pacific (P), and both basins forced simultaneously, (i.e., Atlantic plus Pacific; AP). Furthermore, we focus on linear and nonlinear aspects to better understand where MLR analysis may not be sufficient for representing the competing influences. To determine the linearity of the atmospheric response, we look at the linear addition (A+P) of the responses from each basin in comparison to the simultaneous forcing (AP) and calculate the difference between forcing each region simultaneously or separately (). Finally, we also compare forcing an El Niño event that includes the Atlantic SSTA in the subsequent boreal spring to forcing the Pacific only (AP−P), thus isolating the Atlantic influence that often follows an El Niño event. It should be noted that this change should not be interpreted as the Atlantic response only (look to A for this) but rather as the difference between AP and P, as differences in the Pacific response may occur alongside the Atlantic response.
As in reanalysis, we analyze the Walker cell between 5∘ N and 5∘ S to determine the importance of the Atlantic SSTAs and their influence on the tropical teleconnections arising from an El Niño event (i.e., the potential for constructive/destructive interference). Isca reproduces a realistic climatology (lined contours in Figs. 2 and 4), which includes strong clockwise (positive) cells over the central Pacific and Atlantic and a small counterclockwise (negative) cell over the eastern Pacific. Notably, however, the boundary directly above South America is more disordered when compared to JRA-55 (contours in Fig. 2). This difference to reanalysis over South America may result from a poor representation of the low-level flow over the Andes mountain range (i.e., a low-level Kelvin wave response) due to the comparably coarse model resolution (Rojo Hernández and Mesa, 2020).
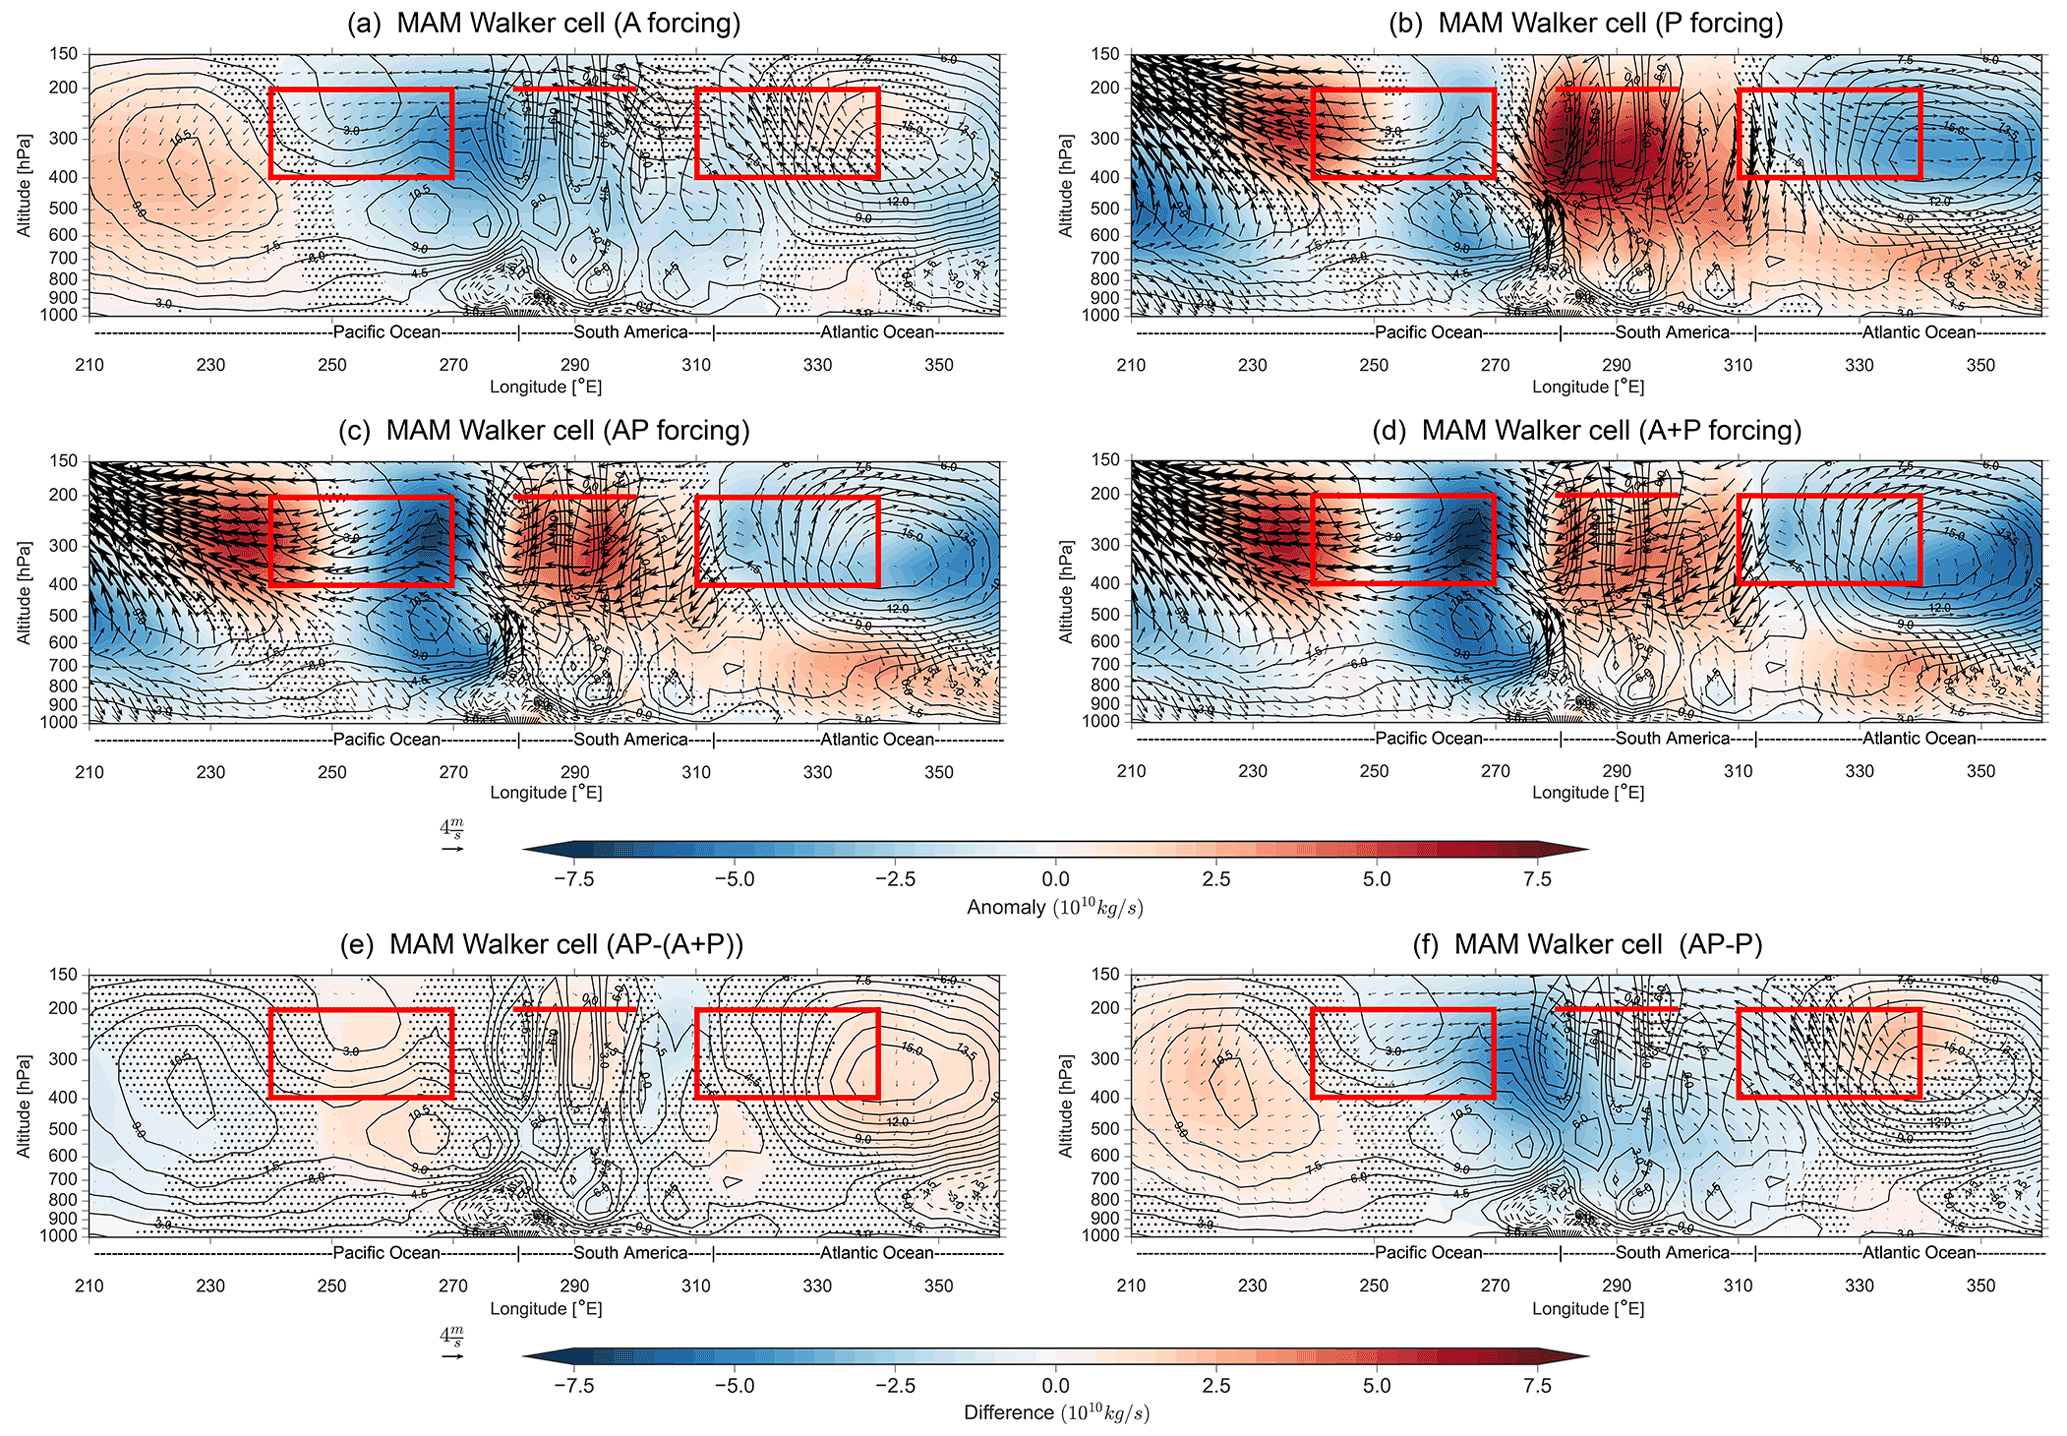
Figure 4MAM Walker cell analysis for the region connecting the Pacific and the Atlantic, averaged between 5∘ S and 5∘ N. Shading represents the streamfunction (ψ), contours represent the streamfunction climatology (in intervals of 1.5×10¹⁰ kg s−1), and vectors represent the zonal winds (u) and vertical velocity (w) response to the different forcings from the Atlantic (a), Pacific (b), and Atlantic plus Pacific combined (c), as well as the linear addition of the Pacific and Atlantic contributions (d). The contours represent the model climatology. The difference between the linearly combined response (A+P) and the combined response (AP simultaneously) is represented in panel (e), while the Atlantic contribution (f) is derived as the difference between (c, AP forcing) and (b, P forcing). Stippling in panels (a)–(c) represents anomalies that are not statistically significantly different from climatology at the 95 % level using a two-tailed Monte Carlo test. Stippling in panel (e) represents differences that are not statistically significantly different between the AP forcing (c) run and the linear combination of the Atlantic and Pacific (A+P, d) at the 95 % level using a two-tailed Monte Carlo test. Stippling in panel (f) represents differences that are not statistically significantly different from the P forcing run at the 95 % level using a two-tailed Monte Carlo test. The rectangular boxes represent the areas for computing the Walker index, while the horizontal line represents level and longitude for RWS index. Wind vectors in (e) and (f) represent statistically different winds from (A+P) and (P), respectively.
The model experiments for boreal spring show that the Atlantic forcing A (Fig. 4a) creates a response similar to the JRA-55 MLR analysis, including strong ascending motion over the Atlantic, strong upper-level easterlies over South America, and a large-scale counterclockwise streamfunction anomaly. Also similar to our MLR analysis, the response to Pacific forcing P (Fig. 4b) creates divergence over the eastern Pacific and descending motion over South America and the western Atlantic (secondary Gill response), but it lacks the strong upper-level westerlies seen in the MLR analysis (Fig. 2a). Thus, Isca is able to reproduce results similar to reanalysis. We now aim to determine the importance of the TNA SSTAs for the Walker cell. When forcing both basins simultaneously (AP, Fig. 4c), the large-scale streamfunction response matches the pattern when forcing the Pacific only (P). Thus, this similarity indicates that the Pacific is the dominant influence on the Walker cell during boreal spring for our model experiments, and that the secondary Gill response from an El Niño likely dominates over the asymmetric Gill response from the positive Atlantic SSTA.
Next, forcing the Pacific and Atlantic SSTs both simultaneously and separately (Fig. 4c–d) yields very similar responses, indicating a high linearity between the influences from each basin. One of the most distinct results from the addition of Atlantic SSTAs includes that both AP and A+P show an intensification of the upper-level westward flow over South America when compared to P. Furthermore, this highly linear response is further seen when comparing responses from forcing an El Niño only with forcing an El Niño and Atlantic SSTA (AP−P, Fig. 4f), as differences closely resemble the A response. Overall, as AP and P are statistically different throughout much of the tropical basin (stippling in Fig. 4f), the Atlantic SSTAs create a significant change in the Walker cell perturbation following an ENSO event in boreal spring.
As we are also interested in how the influence varies temporally (i.e., between boreal spring to boreal summer), Fig. 5 shows the Walker cell response to our model experiments for JJA. For A (Fig. 5a), the response for boreal summer compared to boreal spring shows similar upper-level westward flow that extends into the Pacific and descending motion over parts of South America, consistent with our MLR analysis. At the same time, the response to P (Fig. 5b) largely lacks significant descending motion over South America, showing that the secondary Gill response has likely subsided and that the TNA response begins to dominate (again, similar to our MLR analysis).
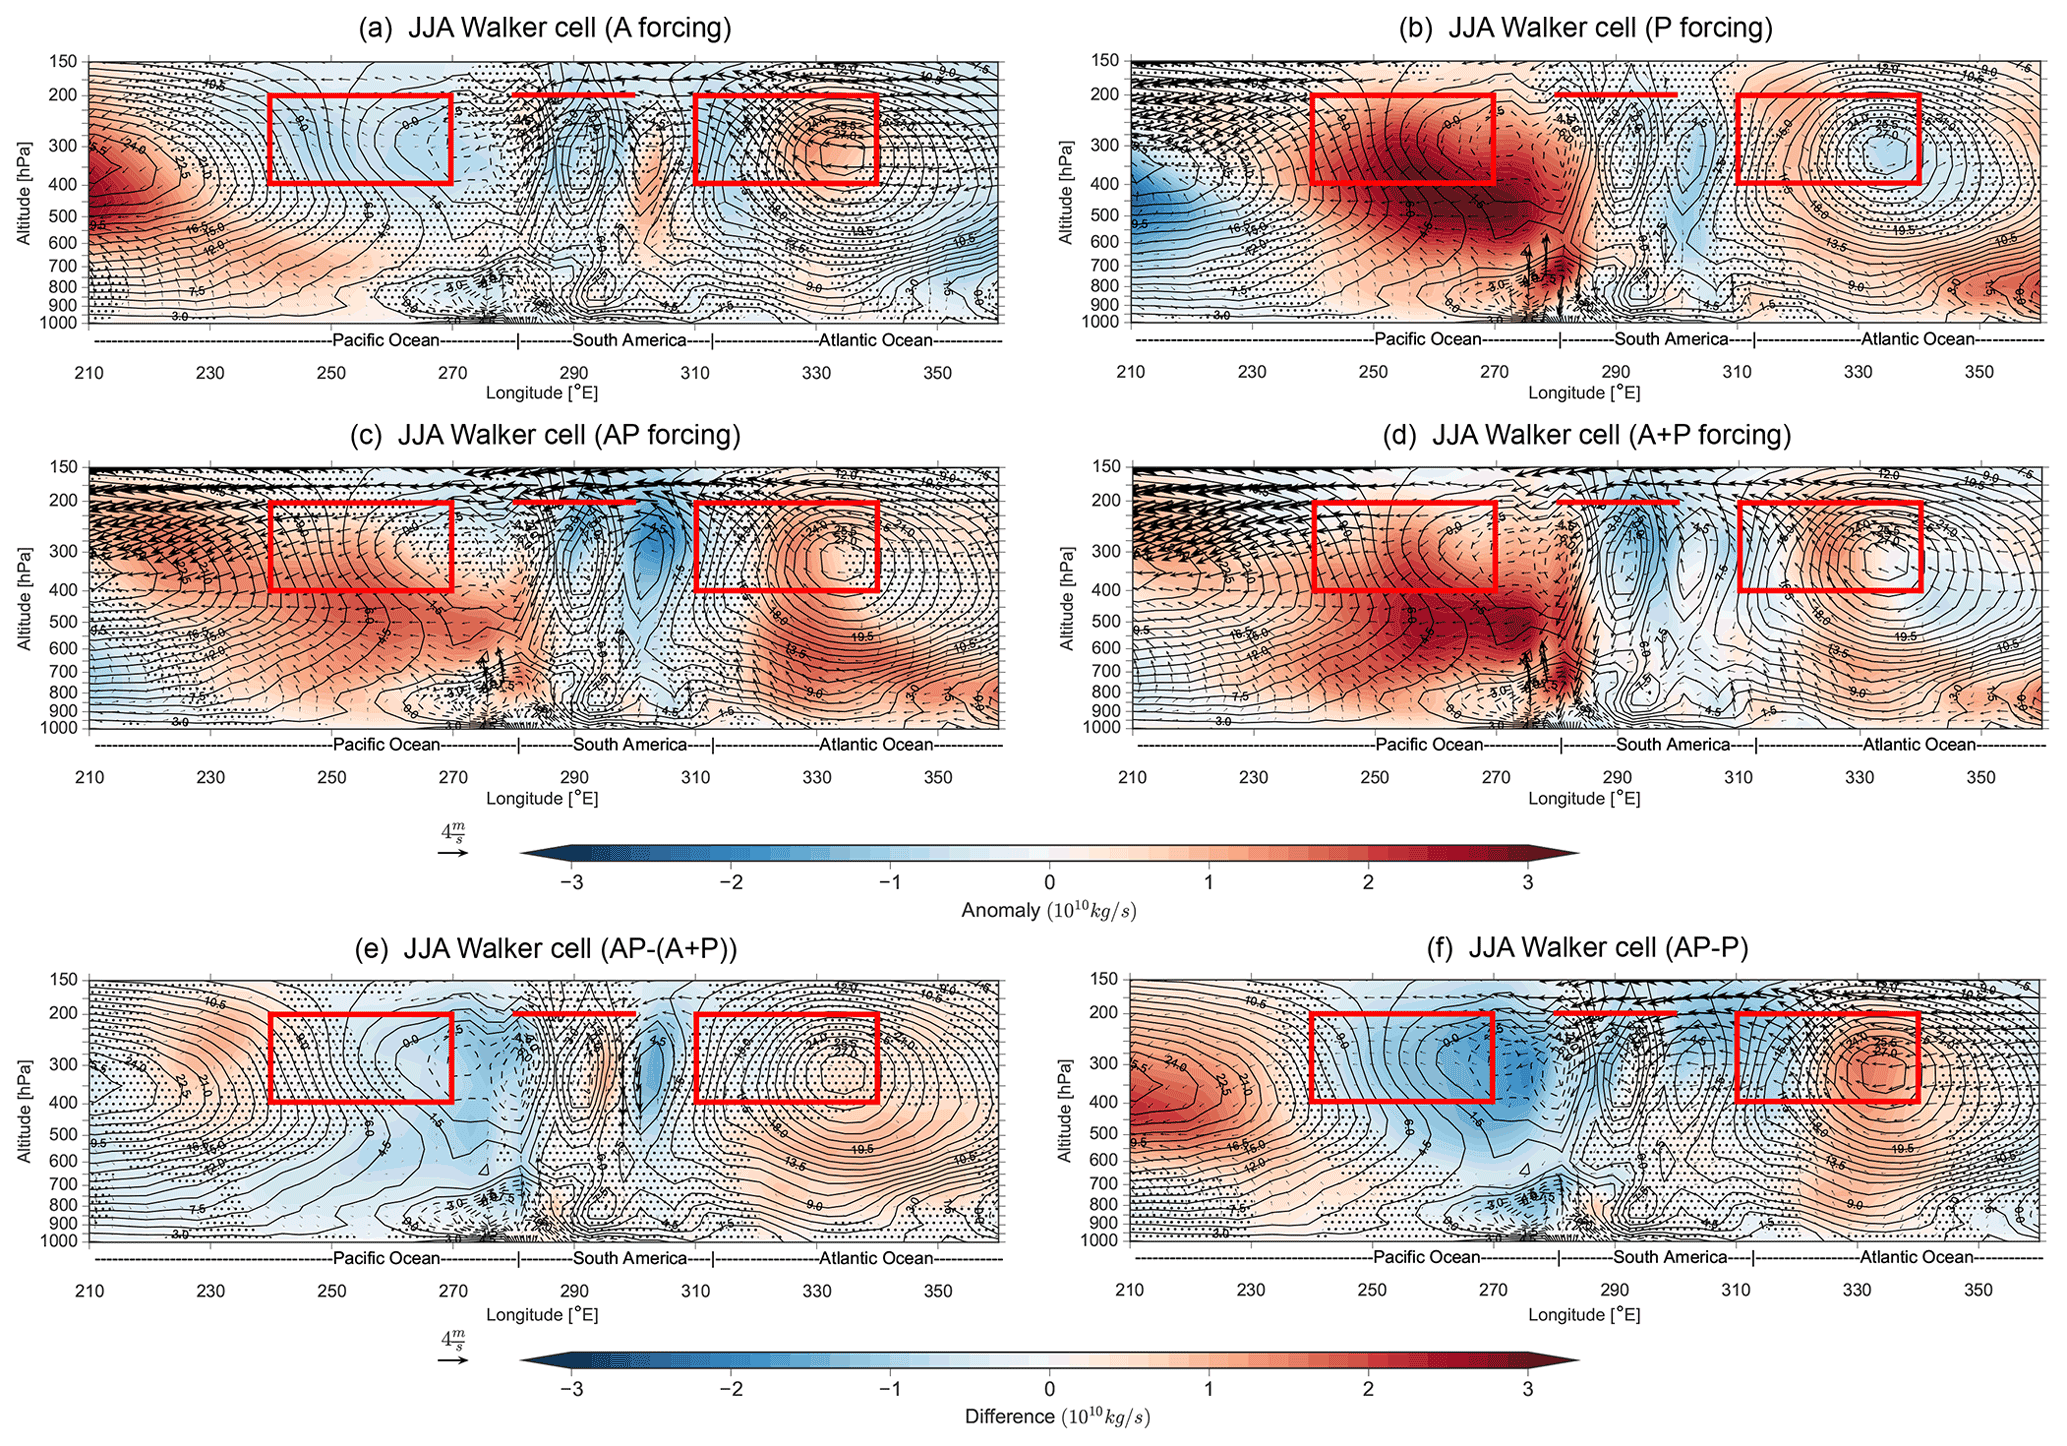
Figure 5Same as Fig. 4 but for JJA.
When forcing the regions simultaneously in JJA (AP, Fig. 5c) and comparing to P (Fig. 5f), the Pacific streamfunction response is weakened, while the South American streamfunction response is strengthened, corresponding well with the constructive/destructive areas in A and P (Fig. 5a–b). A+P (Fig. 5d) also shows that the linear addition of each basin's influence results in a much stronger Pacific streamfunction response when compared to AP (Fig. 5c), indicating that the Atlantic forcing may weaken the Pacific contribution over the Pacific. The difference between the simultaneous and separate forcing (, Fig. 5e) also shows statistically significant differences in the streamfunction response over the Pacific, while the upper-level wind response is much more linear.
To expand on the influence from adding the Atlantic SSTA, Fig. 5f shows the difference between forcing an El Niño event with and without the Atlantic forcing (AP−P). Similar to boreal spring, AP and P are statistically different throughout much of the tropical basin (stippling in Fig. 5f), further indicating that the ENSO-related TNA SSTAs have a significant influence on the Walker cells in boreal summer. Results also show a spatially similar but significantly stronger streamfunction response when compared to the A response (Figs. 5a and S3). This close resemblance in terms of spatial pattern potentially indicates that the nonlinearity arises from an intensified Atlantic influence, with respect to forcing the Atlantic independently. Overall, for the boreal summer, we find that the Atlantic contribution continues to dominate the upper-level westerlies over South America, and the overall streamfunction magnitude is significantly influenced by the Atlantic SSTA in both seasons. Furthermore, the nonlinearity likely arises from an intensified Atlantic response when coupled with the Pacific SSTA.
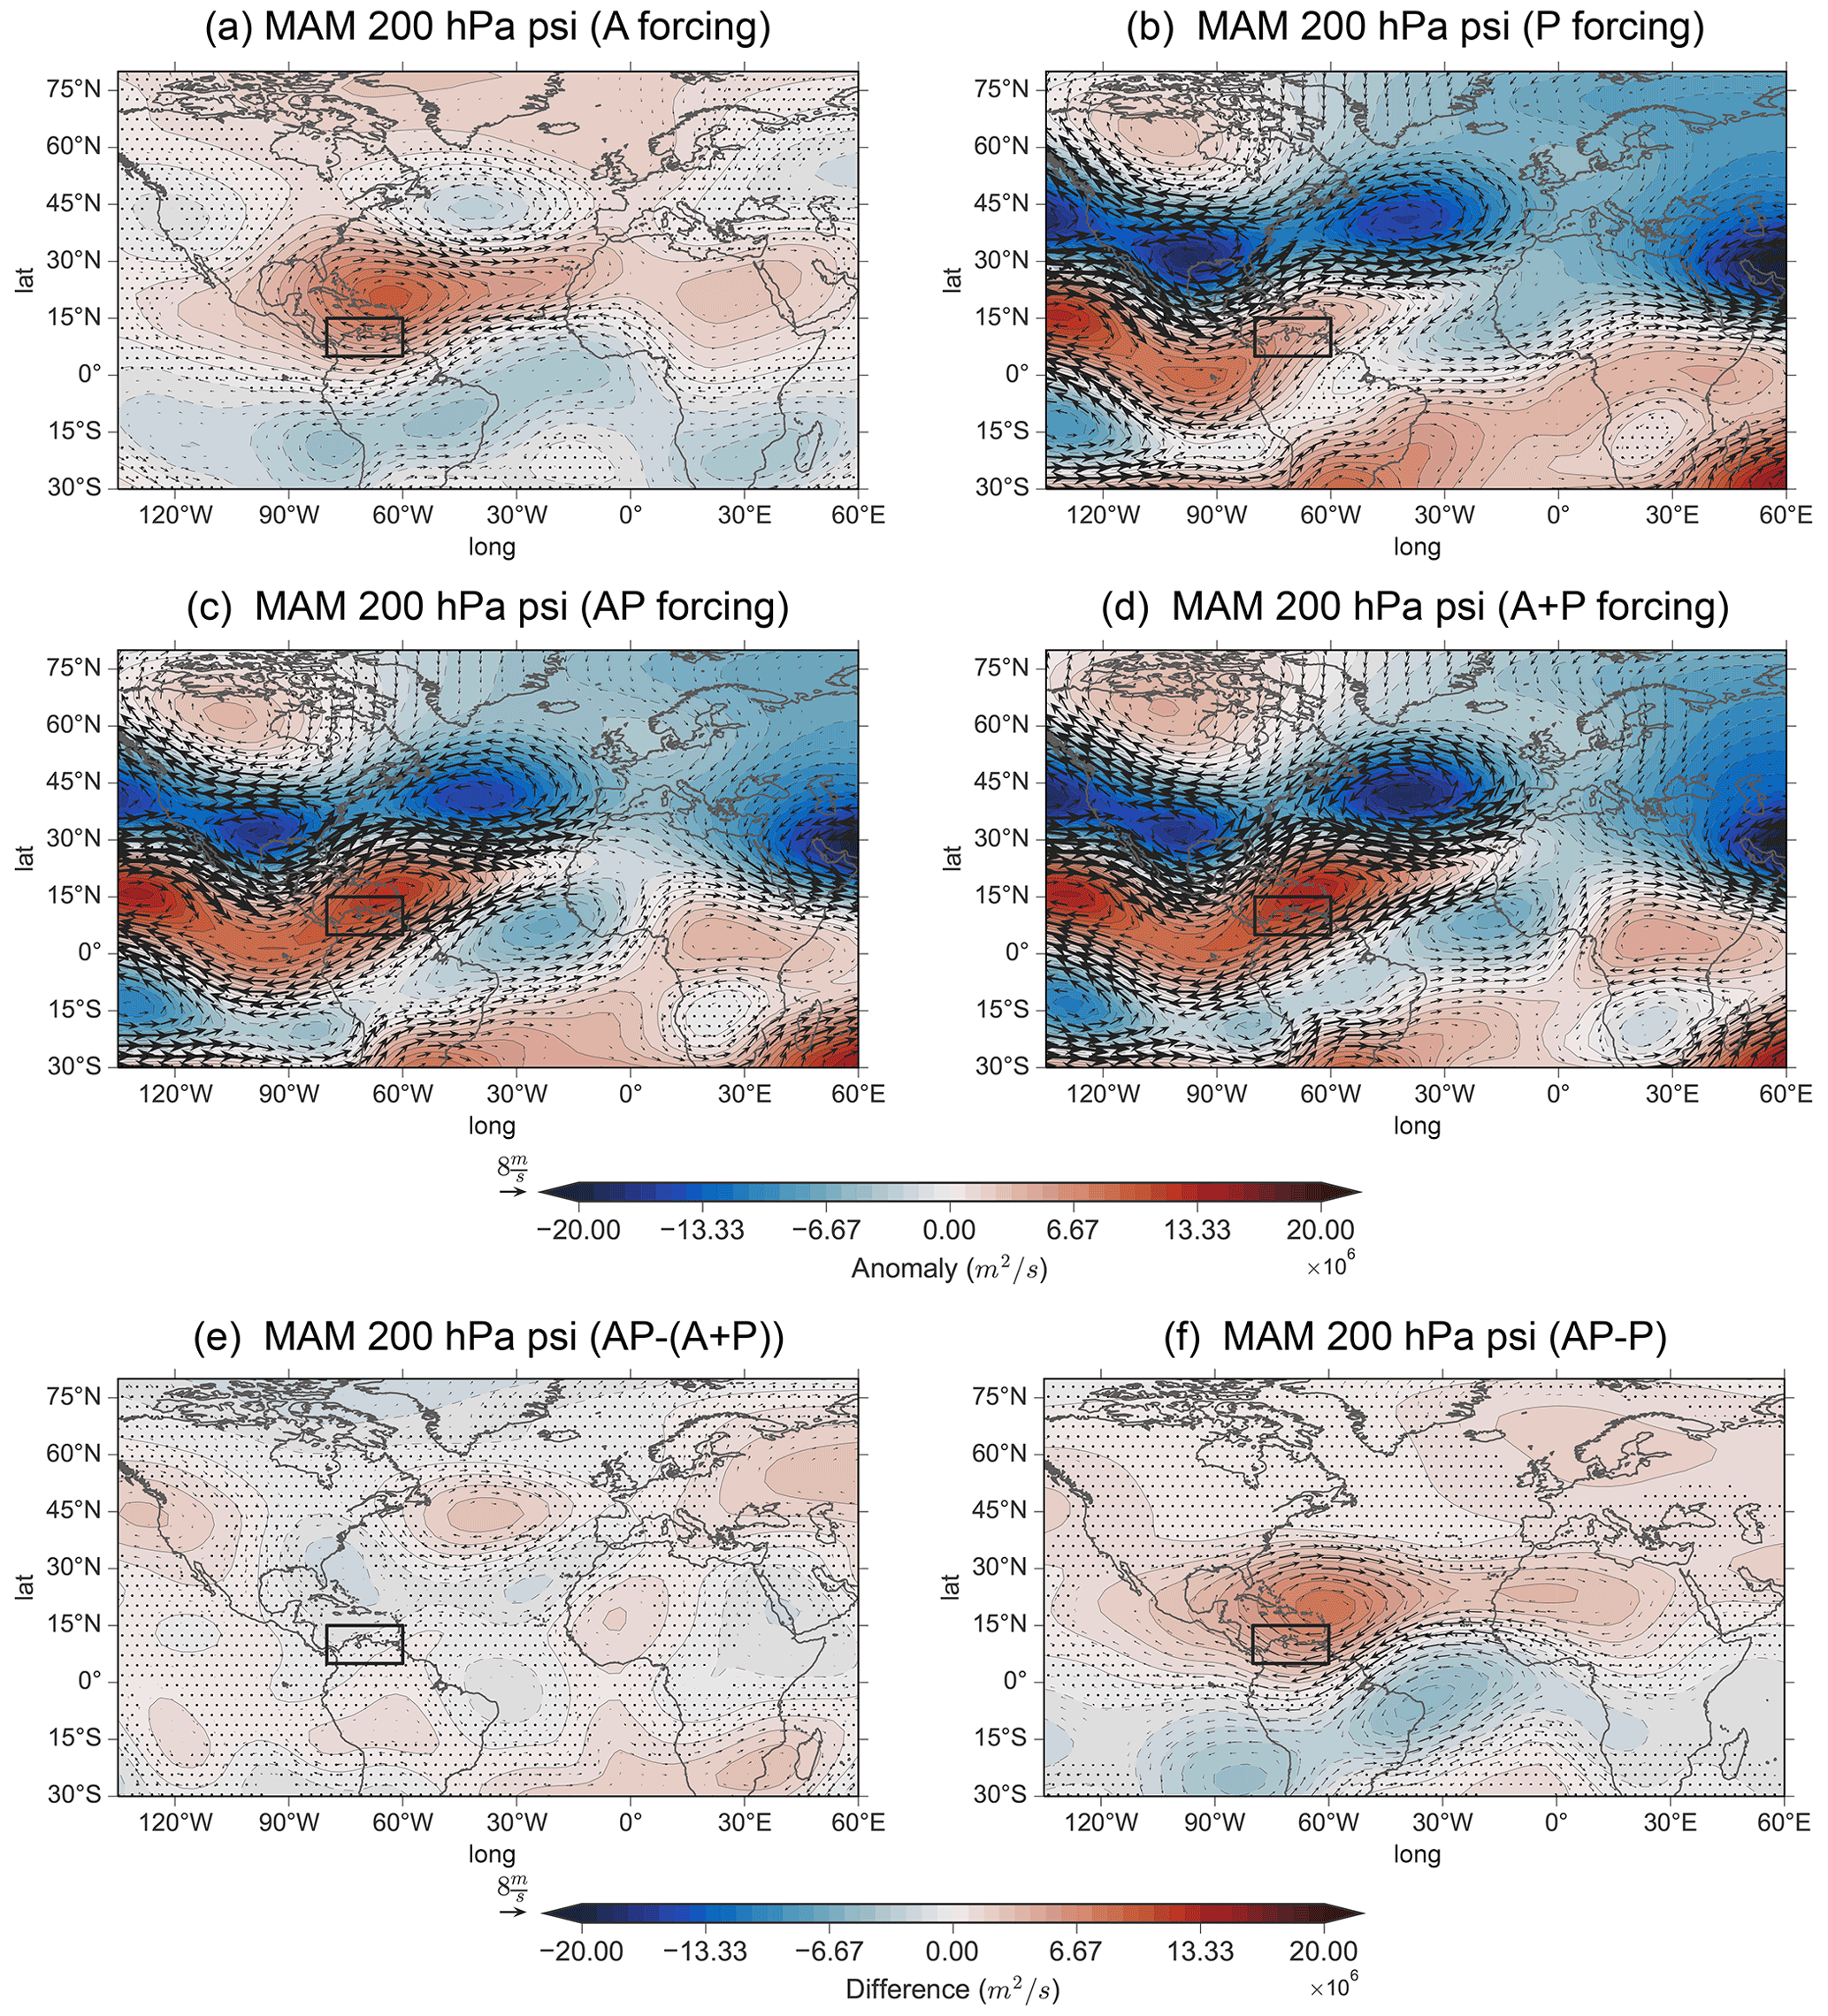
Figure 6MAM 200 hPa streamfunction (shading) and non-divergent wind (vector) analysis for the response to the different forcings from the Atlantic (a), Pacific (b), and Atlantic plus Pacific combined (c), as well as the linear addition of the Pacific and Atlantic contributions (d). The difference between the linearly forced response (A+P) and the combined response (AP simultaneously) is represented in panel (e), while the Atlantic contribution (f) is derived as the difference between (c, AP forcing) and (b, P forcing). Stippling in panels (a)–(c) represents anomalies that are not statistically significantly different from climatology, stippling in panel (e) represents differences that are not statistically significantly different between the AP forcing (c) run and the linear combination of the Atlantic and Pacific (A+P, d), and stippling in panel (f) represents differences that are not statistically significantly different from the P forcing run, all at the 95 % level using a two-tailed Monte Carlo test. The black box represents the RWS index over the Caribbean region. Wind vectors in panels (e) and (f) represent statistically significantly different winds from (A+P) and (P), respectively.
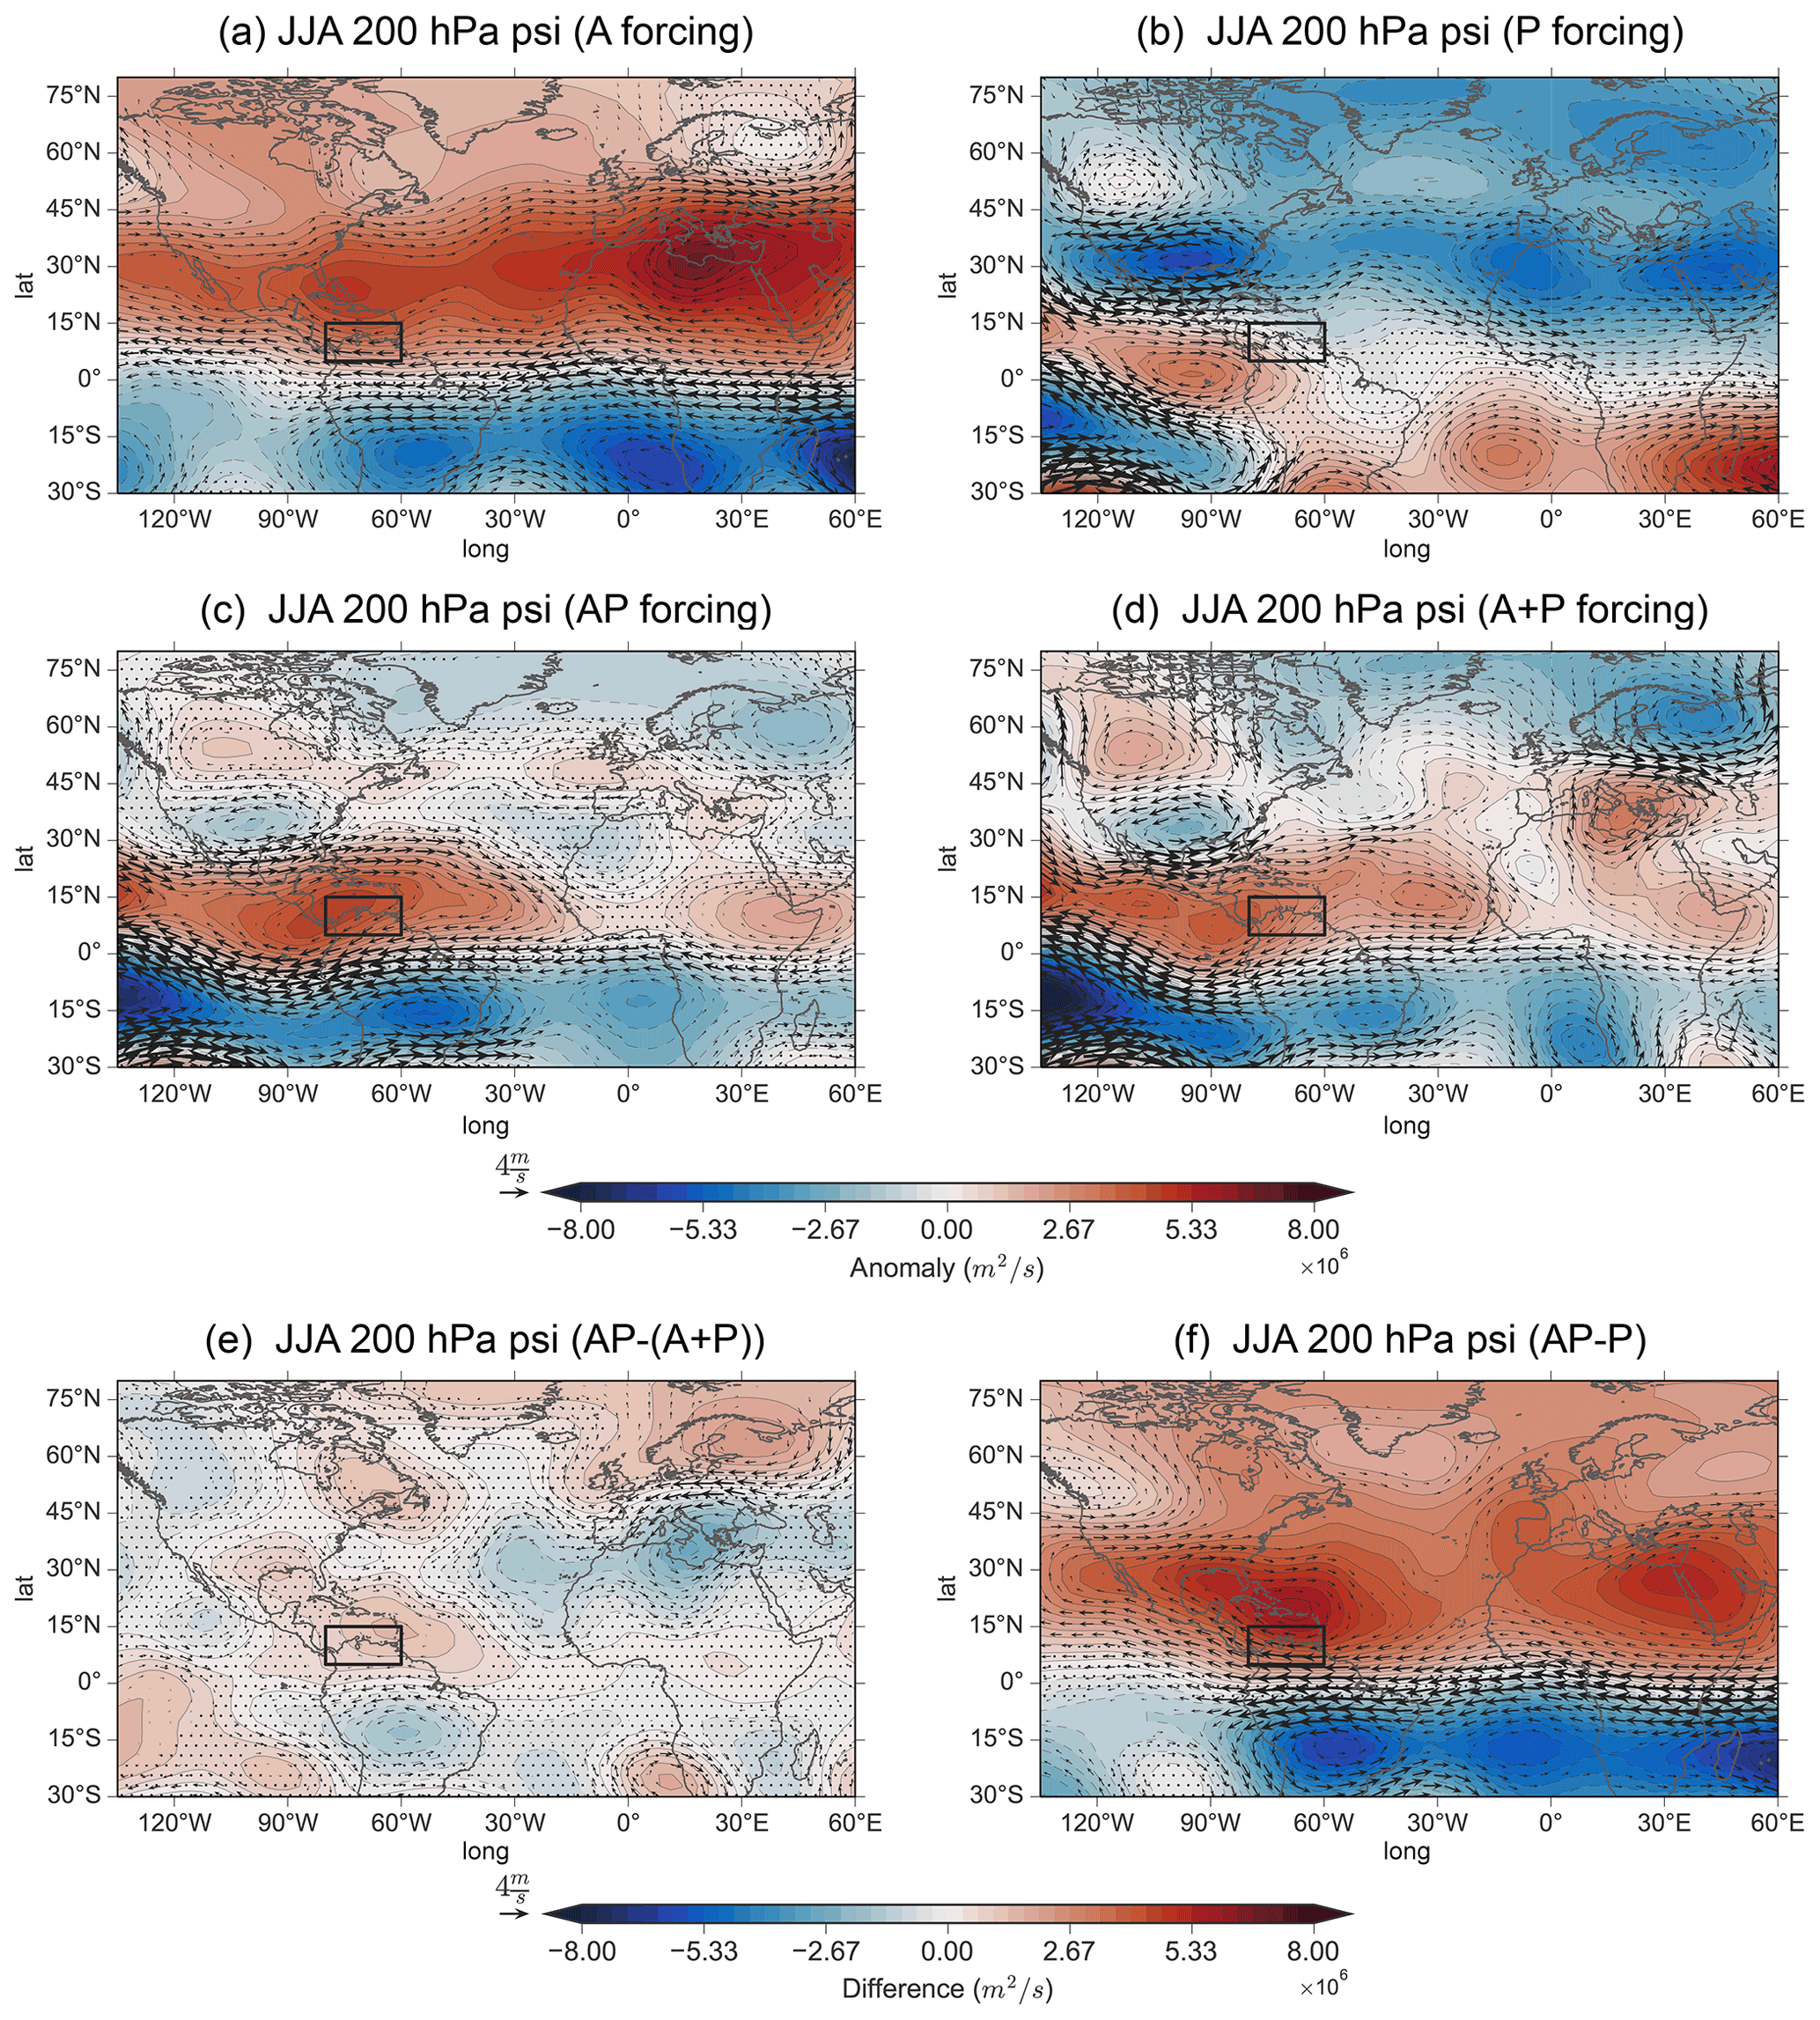
Figure 7Same as Fig. 6 but for JJA.
In addition to considering the Walker cell for understanding the competing Gill-type responses (symmetric vs. asymmetric), we utilize the 200 hPa streamfunction. As the secondary Gill and asymmetric Gill-type responses have distinct spatial patterns in streamfunction, composite analysis shows the inter-basin interaction from a different perspective than the Walker cells. Beginning in boreal spring, the response to A (Fig. 6a) shows an anti-cyclonic maximum over the Caribbean and a dipole centered about the Equator with a dominant northern section (indicative of an asymmetric Gill response, consistent with Gill, 1980). Similarly, the response to P (Fig. 6b) depicts a dipole over the deep tropical Atlantic (indicative of the secondary Gill response, consistent with García-Serrano et al., 2017), but the dipoles merge with the midlatitude response instead of forming distinct cyclones.
The response when forcing the Pacific and Atlantic simultaneously (AP, Fig. 6c) shows a strong resemblance to the P response, but for AP the anti-cyclonic activity over the Caribbean (associated with the Atlantic SSTA) is intensified, and the secondary Gill response from ENSO is more distinct from the midlatitude response. As little difference exists in comparison to the linear combination (A+P, Fig. 6d), the symmetric and asymmetric Gill responses from each basin add linearly in boreal spring. Figure 6e further shows that there is little difference in the tropics between the simultaneously and separately forced responses (), since no clear spatial patterns occur that are statistically significant. The high linearity in this relationship can also be seen in Fig. 6f, as the change in the response created by the addition of the Atlantic forcing to an El Niño event closely resembles the tropical response from A and is statistically different from P. However, this cannot be said for the extratropical response, which will be discussed in the forthcoming subsection.
Shifting to boreal summer, Fig. 7 shows that the A and P responses (Fig. 7a–b) result in generally opposite influences in the Northern Hemisphere and that when combined in AP (Fig. 7c), the asymmetric Gill response from the Atlantic dominates. By comparing the simultaneous and separate responses (AP vs. A+P), we see a nonlinearity arising, whereby the asymmetric Gill response is stronger in AP than in A+P (also see Fig. 7e). One potential reason for this change can be seen in Fig. S4, which shows that the difference in response by adding the Atlantic SSTA forcing to an El Niño event is a stronger and more confined asymmetric Gill response over the Caribbean and South America than A. Overall, this nonlinearity in the tropics is consistent with the Walker analysis (Figs. 4 and 5), in which the inter-basin relationship shifts from linear to nonlinear from boreal spring to boreal summer. As Fig. 7f also shows statistically significant differences in equatorial zonal winds between AP and P, this is also consistent with our lead–lag analysis showing that the dominant influence perturbing the Walker cell shifts from the Pacific to Atlantic SSTAs from boreal spring to summer. As AP−P represents the overall result of adding the Atlantic SSTA, this nonlinearity may arise through an intensified Atlantic response in boreal summer, a weakened Pacific response, or a combination of both. However, given the spatial pattern matches the forcing from A, it is likely an intensified Atlantic response.
3.4 Modulation of the tropical connection towards the North Atlantic European region by the Caribbean
Previously, the interaction between the tropical basins interested us, as the combined influences may create a potential RWS or alter an RWS induced by the Pacific that can influence the NAE region. As we now have a better idea of this inter-basin interaction, we next investigate how the ENSO-related Atlantic SSTAs may influence the NAE region during an ENSO event via a Caribbean RWS. To do this, we quantify the aforementioned tropical interactions using the Caribbean RWS index and Walker index, while we use the East Atlantic (EA) pattern and NAO to quantify the response in the NAE region. Consistent with previous sections, we again look at boreal spring and summer. We use changes in both the correlation and mean anomaly between P and AP to quantify how sensitive ENSO's teleconnection to the NAE region is to the inclusion of Atlantic SSTAs.
First, we begin with the relationship between the Walker cell and Caribbean RWS, as this will give us a better idea of the importance of the Atlantic SSTAs in altering the Walker cell and thus the RWS over the Caribbean. We find that the Walker and Caribbean RWS indices have a strong relationship that varies considerably when applying the different SST forcings in boreal spring (Fig. 8a). For P, the correlation is −0.28, while for A it is −0.33. When forcing both basins together (AP), the correlation increases by 57 % to −0.44 as compared to only forcing the Pacific basin (P), but we find that the difference is not statistically significant (see confidence intervals in Fig. 8a). In boreal summer (Fig. 8d), P and AP have a correlation that is similar (−0.53 and −0.55, respectively), indicating that ENSO is insensitive to Atlantic SSTAs in boreal summer and that the increased influence of Atlantic SSTAs onto the Walker circulation in boreal summer does not translate into a stronger RWS over the Caribbean.
Notably, although the Walker index and RWS have a strong relationship in boreal spring, the linear fit does not pass through the origin, whereby the P has a strongly negative Walker index but lacks an anomalous RWS. To further understand the neutral mean response for P, Fig. S5 shows the RWS field. We find that only the experiments that force the Pacific (P, AP) have a strong negative RWS over the Gulf of Mexico and that this RWS response dominates over the negative RWS over the Caribbean. This RWS may be related to the most southeastern lobe of the Pacific–North American (PNA) pattern, as it strongly overlaps with the southeastern low presented by Casselman et al. (2021). As a result, even as the Walker cell index may tend towards inducing a positive RWS when forcing the Pacific only, the influence from the southeastern low may dominate over the influence from the Walker gradient, potentially explaining why the RWS is neutral for P, as opposed to positive.

Figure 8Scatter plot for model data showing the key relationships between the Walker index, RWS index, East Atlantic index, and NAO index. Forcing areas are indicated in the legend, including red, yellow, and blue points for P, AP, and A, respectively. The correlation coefficient (R) is represented in the corner of each panel, with colors representing the forcing area. The central points of the crosses represent the means of all values in each category of the variables indicated on both axes. The extent of the crosses indicate 1 standard deviation in the x and y directions.
The relationship between the Walker index and the RWS does not change between boreal spring and summer (Fig. 8a, d), including a positive Walker gradient anomaly for A and a negative anomaly for the P responses, while for the AP experiment, the Walker index varies around 0 for both seasons. Thus, this indicates that the Atlantic SSTA can perturb El Niño's influence on the Walker gradient in boreal spring and summer with an anomaly that is approximately equal to but the opposite of the Pacific's influence, resulting in a neutral gradient for AP. Overall, even as the Walker index and RWS correlation is insignificantly different between AP and P, the mean boreal spring Caribbean RWS and Walker cell gradient anomalies for AP and P are significantly different (>95 %) (Fig. 8a). Thus, although the relationship between the Walker index and RWS following an ENSO event is insensitive to Atlantic SSTAs, the individual variables (i.e., Walker cell gradient, RWS) are sensitive to changes over the Atlantic. Furthermore, together with the fact that the mean RWS for P is neutral even with a strongly negative Walker gradient, this overall also indicates that the Walker gradient is not the sole influence on the Caribbean RWS.
Next, looking toward the NAE region, the relationship between the Walker and EA index also varies considerably between the different experiments but generally shows a stronger relationship in boreal spring (Fig. 8b, e). For boreal spring, the introduction of an Atlantic SSTA (A has an R=0.52) increases the correlation between the Walker index and EA index from 0.28 for P to 0.43 for AP (54 % increase). However, the confidence intervals between AP and P indicate that this correlation difference is not statistically significant. Thus, since the mean EA anomaly for all runs is relatively similar, at around 0 to −0.5 m, the addition of Atlantic SSTAs results in little change in the EA anomaly in boreal spring. Conversely, in boreal summer, the correlation is insignificant for both P and AP. Correlation for boreal spring and summer Walker index and NAO (Fig. 8c, f) shows that when the Atlantic SSTA is added (i.e., going from P to AP), the correlation drops. Furthermore, the correlation is insignificant in boreal spring, while in boreal summer, we see a statistically significant correlation between the Walker index and NAO. However, the changes in R between P and AP are not statistically significant.
To further explain the importance of the Caribbean RWS for influencing the NAE region, we use a partial correlation to remove the influence of the proposed mediating pathway (the Caribbean RWS) from the Walker index and EA–NAO connection for each experiment (Fig. S6). Bivariate correlation shows that the RWS connection to the EA–NAO also changes between P and AP, whereby the AP shows a notable increase in the NAO connection in boreal spring, resulting in both the RWS and EA–NAO connections being largest in boreal spring. When removing the RWS influence using a partial correlation in boreal spring for both P and AP, the Walker index and EA correlation decreases notably, while the Walker index and NAO correlation either increases slightly or has a negligible change (Fig. S6, solid vs. dashed red and green lines). Overall, this indicates that the Caribbean RWS may mediate a potential connection between the Pacific and Atlantic Walker cells and the EA during boreal spring and the NAO during boreal summer. However, as the partial correlation does not remove all correlation, other external factors may be at play.
Next, to better understand how the Atlantic SSTAs may alter the NAE regional response following an ENSO event, we use spatial anomalies in the extratropics by plotting the boreal spring MAM 200 hPa geopotential height response (Fig. 9). The influence from Atlantic SSTAs shows that the A response (Fig. 9a) is associated with a meridional wave train from the tropics to midlatitudes that curves eastwards in the extratropics. This response is similar to the EA/WR pattern found by Lim (2015), which was found to be related to Rossby wave propagation from the tropics. Other studies have also associated this pattern with Atlantic SST variability (Jung et al., 2017; Li et al., 2018; Choi and Ahn, 2019; Lledó et al., 2020).

Figure 9Same as Fig. 6 but for MAM 200 hPa geopotential height (shading) and 200 hPa irrotational winds (vectors). The black box in North Atlantic represents the East Atlantic index.
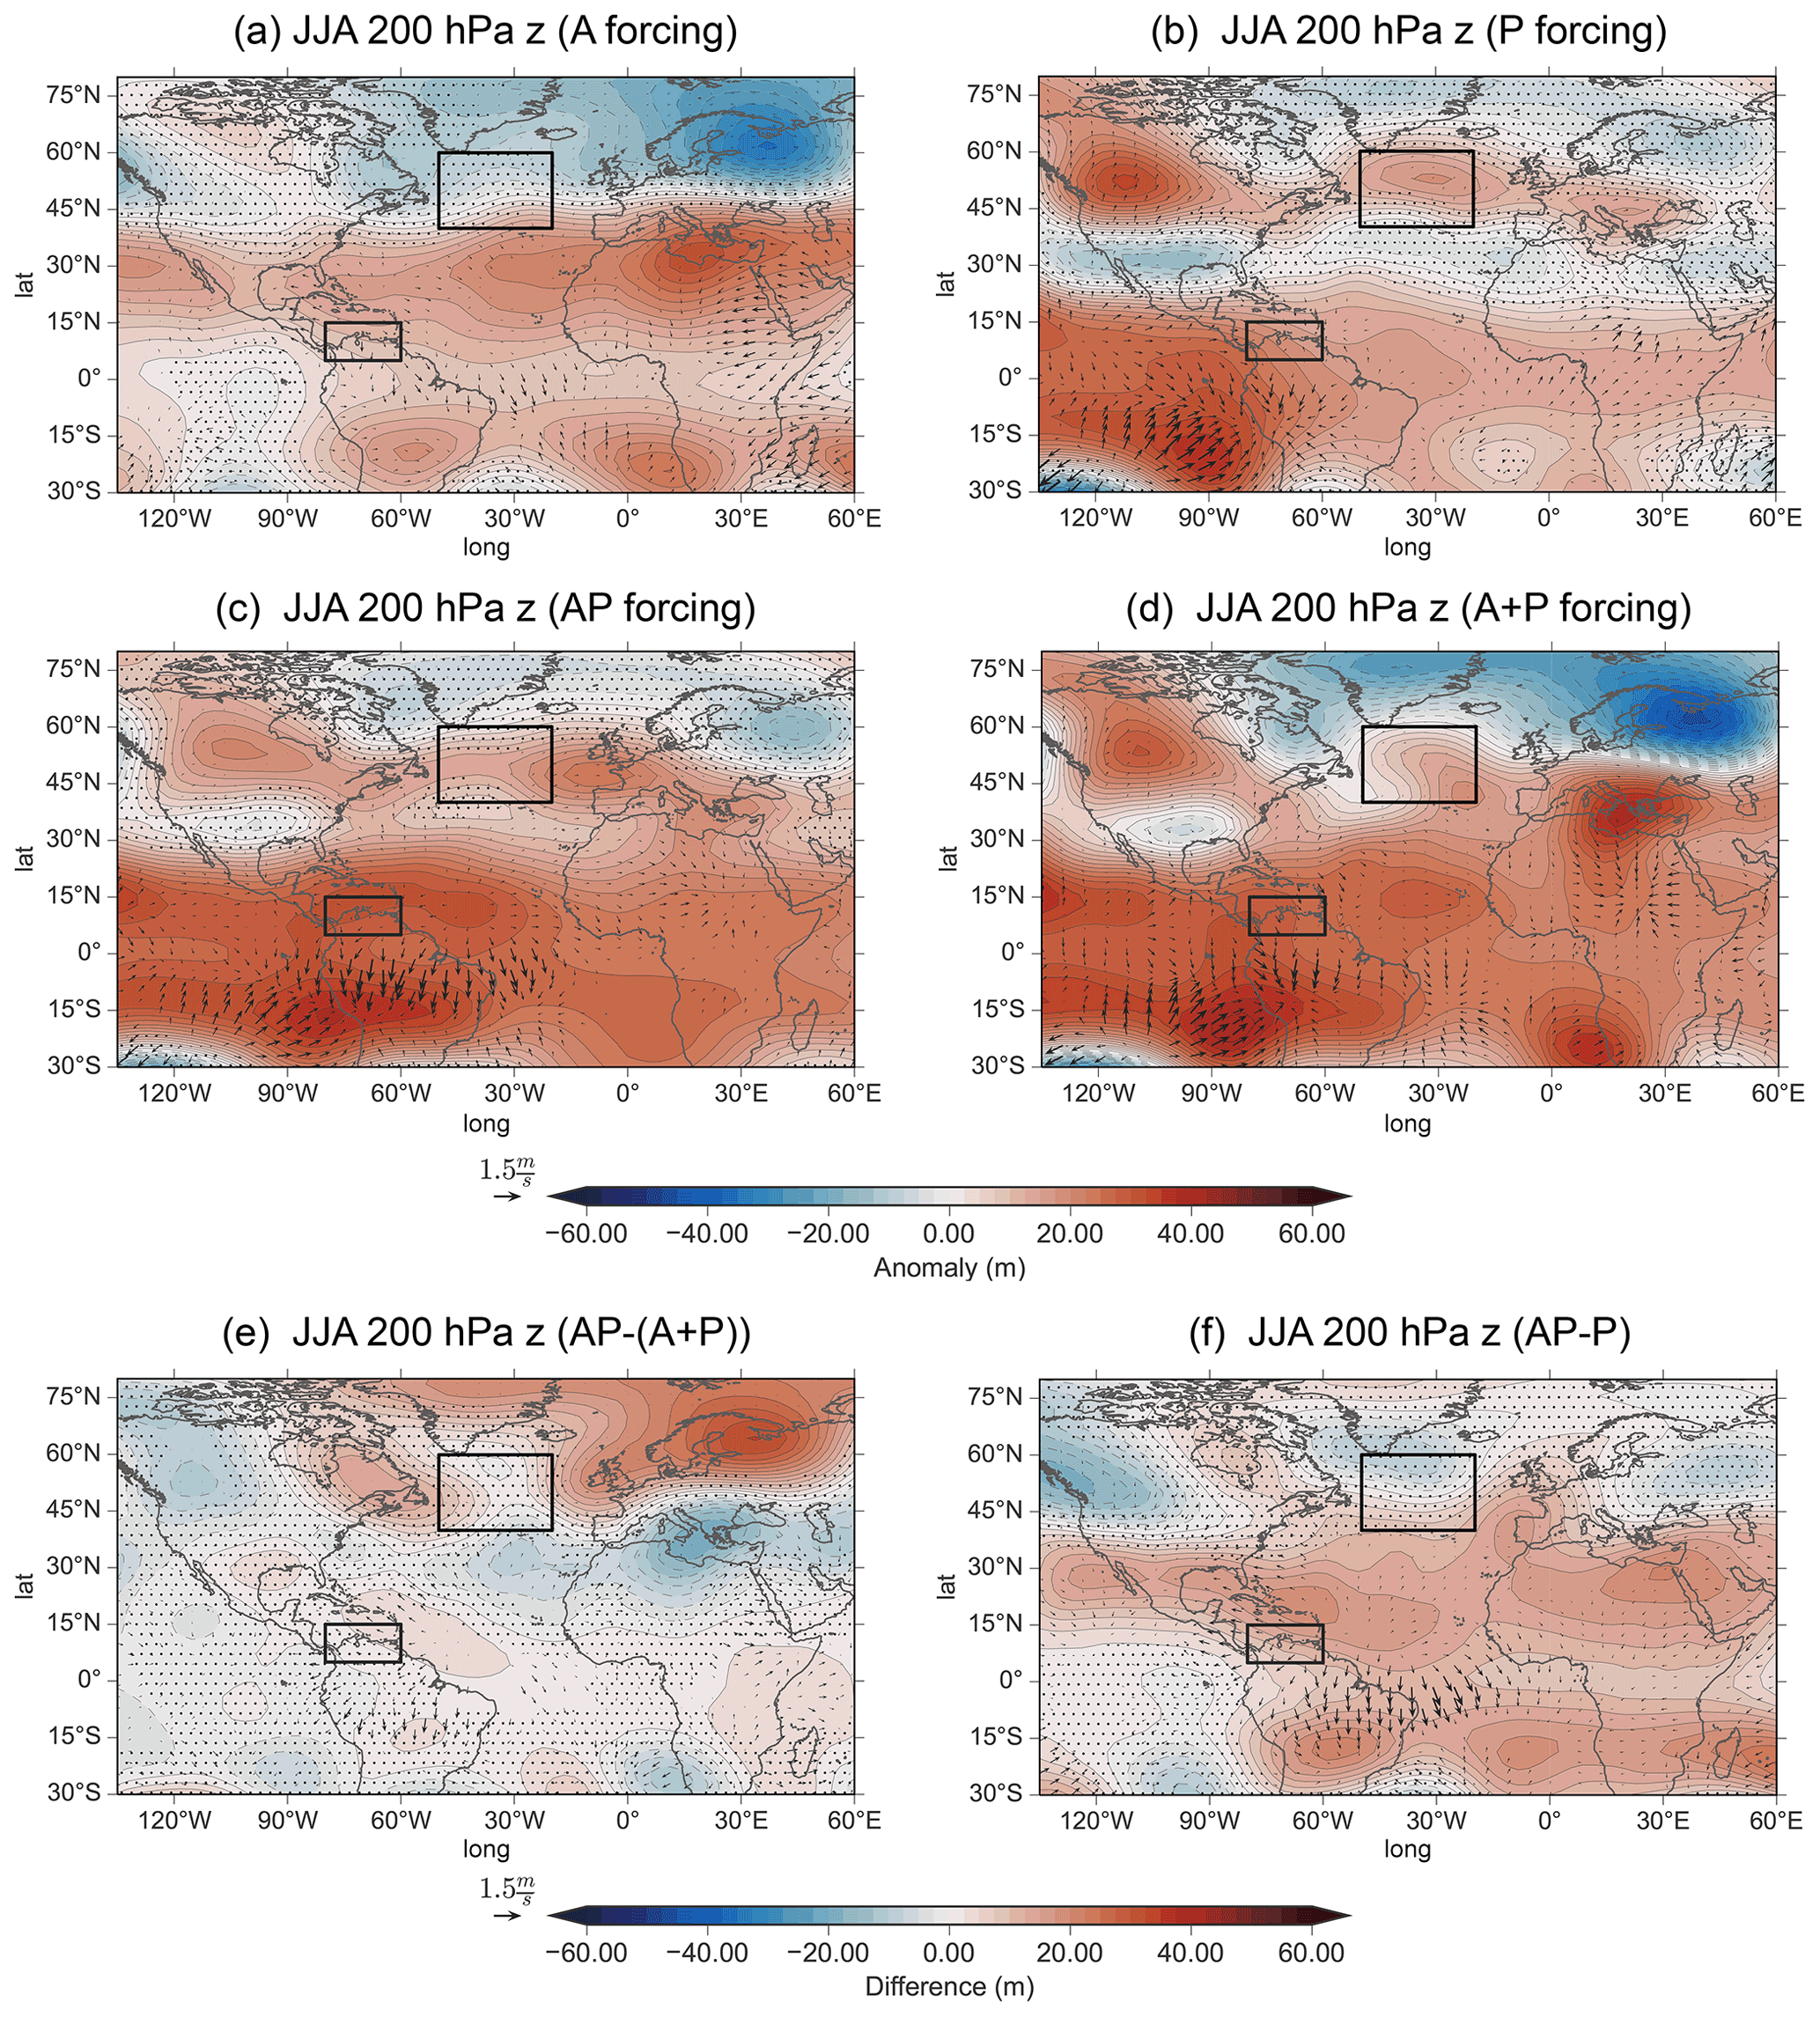
Figure 10Same as Fig. 9 but for JJA.
Forcing the Pacific only (P, Fig. 9b) yields a largely negative response over the midlatitudes (around 45∘ N, 30∘ W), which is generally constructive to the A response. Comparing AP and A+P shows that the responses appear to be relatively linear. However, when determining the difference between AP and A+P (Fig. 9e), we see a statistically significant positive EA pattern. The EA pattern in Fig. 9e indicates that when forcing the two basins simultaneously, the negative EA pattern is weaker during AP than when linearly adding the two basin forcings (A+P). As Fig. 9e also resembles the negative response from A, the nonlinearity seen in Fig. 9e is likely due to a weakened Atlantic response. Thus, we find that the Atlantic influence during an ENSO event creates a wave train towards the NAE region, but it is altered in comparison to A, as there is a more zonal-like structure in the NAE region. Overall, Atlantic SSTAs create a significant difference between AP and P (stippling in Fig. 9f).
For boreal summer (Fig. 10) the 200 hPa geopotential height response for A (Fig. 10a) lacks the wave train towards the NAE region that is seen in boreal spring. Instead, a strong meridional dipole is present between the Mediterranean and northern Europe. The lack of a wave train in boreal summer may be due to changing background conditions. Indeed, we see indications of this change in Fig. S7, which shows the background 200 hPa absolute vorticity and zonal winds and serves as a useful estimation of wave guide locations. Figure S7c–d indicate that the separation of the subtropical and eddy-driven jets changes between boreal spring and summer, whereby a clear separation is only present in boreal spring. Thus, the increased separation of the jets or intensification of the eddy-driven jet in boreal spring may create more suitable conditions for the propagation of the wave train from the Caribbean.
For P forcing in boreal summer (Fig. 10b), much of the response over the NAE region is insignificant, showing that ENSO's teleconnection has likely weakened substantially. The exception to this is a significant positive anomaly over the North Atlantic and a dipole over Europe matching the A response in polarity but with the southern lobe being the only significant area. AP (Fig. 10c) shows a response that resembles the P response much more than the A response in the extratropics. Finally, the geopotential height response in the NAE region for AP is also much more statistically significant when compared to P. Thus, the inclusion of the Atlantic SSTAs does not influence the spatial anomaly in the NAE region, but as the significance increases from P to AP, the inclusion of Atlantic SSTAs reinforces the influence of ENSO on the NAE region.
The resemblance of AP and P is in contrast to the response for the linear addition (A+P), in which the NAE response is more similar to the response from A, indicative of a nonlinear aspect. The difference between AP and A+P (Fig. 10e) shows that the NAE anomaly resembles A but with the opposite sign. Thus the difference (i.e., nonlinear aspect) between AP and A+P likely occurs due to a weakened wave propagation in boreal summer compared to boreal spring or the outcome of the weakened propagation occurring earlier in boreal spring. Here, the residual dipole in boreal summer may be the overall result following boreal spring (see Fig. S8 for the evolution of the residual). Furthermore, the AP−P difference (Fig. 10f) appears to diminish north of the subtropical region, including a significantly reduced negative anomaly over northern Europe, when compared to A (Fig. S4). Overall, independently, the Atlantic creates a robust dipole signal in the NAE region (as seen in A), but when added to an El Niño event, this influence is reduced considerably. Namely, the influence does not travel as far north, as seen by the lack of significance in the North Atlantic. Thus, the Pacific remains the dominant influence on the NAE region into the boreal summer, and Atlantic SSTA primarily modulates an El Niño's response by primarily reinforcing the dipole over Europe, as both lobes are now significant (Fig. 10b vs. Fig. 10c).
We investigate the ENSO-induced tropical Atlantic SSTA and their ability to influence the ENSO teleconnection towards the NAE region in boreal spring and summer. We find that the tropical North Atlantic modulates the ENSO teleconnection towards the NAE region through a wave train in boreal spring and an intensification of the ENSO influence in boreal summer. To explain the mechanism for how Atlantic SSTAs modulate the ENSO teleconnection towards NAE region, we first focus on breaking down the tropical interactions, analyzing the connection between the Pacific and Atlantic Walker cells and local-scale Caribbean RWS. Furthermore, we hypothesize that the underlying mechanism driving the PCD is the Walker cell, which interacts with the tropical basins and thus is an important pathway to allow the Atlantic to influence the ENSO teleconnection towards the NAE region. We find that the PCD and Walker cell gradient are highly interlinked and that they may represent the same phenomenon. However, in relating the Walker cell gradient to the Caribbean RWS, we find that the Walker cell gradient cannot fully explain the Caribbean RWS and that other external factors may be at play for driving the Caribbean RWS. Finally, as far as we are aware, studying the interrelation of responses over the tropical Atlantic following an ENSO event (i.e., asymmetric and symmetric Gill responses) is a novel consideration, building on the growing interest in inter-basin interactions and the newly discovered secondary Gill response by García-Serrano et al. (2017).
Expanding further on the targeted experiments, we show that the Pacific dominates the tropical interaction between the basins in boreal spring. The Atlantic modulation of the Walker cell following an ENSO event is found to be significant, including modulation of the upper-level winds over South America. Our analysis of the timing of this Walker cell modulation shows that when the secondary Gill response largely subsides in boreal summer, the Atlantic influences the Walker cell streamfunction more strongly, and the response for AP also begins to become nonlinear when compared to P. Thus, our results cast new light not only on how the hemispherically symmetric and asymmetric Gill responses interact temporally but also that the responses are linear in boreal spring but nonlinear in boreal summer. The source of this nonlinearity may be an intensified Atlantic response in the presence of an El Niño event, but further analysis is required to confirm this. Overall, our newly found understanding of when the Atlantic SSTAs are important can be particularly valuable for studies looking to understand other influences of the ENSO-related Atlantic SSTAs on aspects.
To understand how the tropical basin interactions between the Pacific and the Atlantic may be translated into an extratropical response, we investigate the connection between the Walker cell gradient (between the tropical Atlantic and Pacific) and key modes of variability in the NAE region, namely the EA and NAO patterns. A key finding includes that the Walker index is highly related to the EA pattern in boreal spring and the NAO pattern in boreal summer but that these relationships are insensitive to the addition of Atlantic SSTAs. Next, by using composite analysis to look further into the extratropical response, we show very different extratropical geopotential responses to the introduction of Atlantic SSTAs between boreal spring and summer. In boreal spring, a wave train from the tropical Atlantic to the North Atlantic occurs, while in boreal summer, there is a clear absence of the wave train. Furthermore, as the wave train from the tropics changes considerably (i.e., weakens and shifts) for AP (in comparison to A), the influence of Atlantic SSTAs also changes between A and AP. Finally, the fact that the wave train is only present in boreal spring may be due to changing background conditions, as we see a separation of the subtropical and eddy-driven jets over the North Atlantic only in boreal spring. In boreal summer, the impact of the Atlantic SSTAs during an ENSO event on the extratropics is reduced when forced together with the Pacific (in comparison to A only), but within the tropical Atlantic, the response is intensified when forced alongside the Pacific. As there is a contradiction in the direction of the linearity (i.e., nonlinearity being defined as when A+P is not equivalent to AP), we were unable to determine the cause, and therefore, it remains a key area for further research.
In describing the key limitations of our study, such as when determining the aforementioned inter-basin interaction on the Walker circulation, using a simplified AGCM may have inherent limitations in properly resolving the Walker circulation. For example, it could be argued that the horizontal model resolution remains a key limitation of our study. One area where this may be particularly limiting is heat balance and the atmosphere's response to SST gradients, which are important for driving the Walker circulation. One way to improve this in the future includes using models with higher resolution, which may be better able to balance the response through the transient atmospheric circulation (Parfitt et al., 2016). Another key limitation is that we utilize a moist model with fast condensation that lacks explicit liquid water, as it may limit the accurate representation of the Walker circulation. This limitation centers around properly modeling the precipitation and divergence above the tropical Pacific during an El Niño event, which influences Kelvin wave propagation. Downstream, the Kelvin wave can also be influenced by difficulties in representing South American rainfall, which is a major issue in several AGCMs, as well as many coupled models (Gudgel et al., 2001; Maher et al., 2018; King et al., 2021). As a result of an altered Kelvin wave, this may limit the accuracy of the secondary Gill response. Nonetheless, given that the location of both the secondary Gill and asymmetric Gill responses match those from reanalysis (Casselman et al., 2021), we believe that our results are representative of the observations.
There are also some key limitations present when using a series of targeted experiments in an AGCM, including atmosphere–ocean interactions in the extratropics. The first limitation is that we rely on prescribed SSTs, removing the ability of the ocean to respond to atmospheric processes and also changing thermal damping effects (Barsugli and Battisti, 1998). This simplification is essential in isolating the influence from the tropical Atlantic during an El Niño event but may create issues in the extratropical regions. Here, the NAO is the dominant mode of variability in the NAE region that may act back onto the ocean in the form of the SST tripole pattern (Peng et al., 2003). However, Baker et al. (2019) found that the tropical Atlantic SSTs are sufficient for properly predicting the NAO response and that the lack of atmosphere–ocean coupling in the North Atlantic does not impact the predictability. Another limitation includes that the intentional exclusion of ENSO teleconnections via the stratosphere through stratospheric nudging likely reduces the sensitivity of the NAO to ENSO. Jiménez-Esteve and Domeisen (2020) found that the interannual variability of the winter NAO variance decreased by 40 % when including this nudging, which may result in misrepresenting the importance of the TNA in influencing the NAE region. However, as the stratospheric pathway is likely weaker in MAM and JJA as compared to mid-winter or early spring, we do not expect that removing the stratospheric influence in our study should change the NAE response in a major way. Nonetheless, future studies should determine the importance of the TNA SSTA for modulating the full influence from ENSO through all pathways.
Overall, our results provide a basis for understanding the importance of the TNA SSTA following an ENSO event, but they also bring light to several unanswered questions. For example, by multiplying the forcing by a factor of 4, we assume that the TNA SSTA scales linearly with the strength of ENSO. However, as Casselman et al. (2021) showed, the TNA SSTA may begin to plateau in strength between strong and extreme El Niño events. As a result, one would expect any influences from the TNA SSTA to be reduced during extreme events. This interaction may also increase in importance in the future if climate change influences the strength of ENSO events (Cai et al., 2021). Also, as this study only considers El Niño events, future studies should determine if the negative TNA SSTAs that result from a La Niña interact similarly with the Walker gradient. This may be especially important if the wave activity propagates into the NAE region differently between the positive and negative phases of ENSO (Feng et al., 2017).
The the JRA-55 datasets are available at https://doi.org/10.5065/D60G3H5B (Japan Meteorological Agency, 2013) and ERSSTv4 datasets at https://doi.org/10.7289/V5KD1VVF (Huang et al., 2015b) respectively. The Isca modeling framework was accessed from the GitHub repository (https://github.com/ExeClim/Isca, last access: 1 May 2020; Vallis et al., 2018, https://doi.org/10.5194/gmd-11-843-2018).
The supplement related to this article is available online at: https://doi.org/10.5194/wcd-3-1077-2022-supplement.
JWC performed the model simulations, analysis, and writing of the manuscript. BJE contributed to the setup of the AGCM and to editing the manuscript. DIVD contributed to analysis and interpretation of the results, as well as writing the manuscript.
At least one of the (co-)authors is a member of the editorial board of Weather and Climate Dynamics. The peer-review process was guided by an independent editor, and the authors also have no other competing interests to declare.
Publisher’s note: Copernicus Publications remains neutral with regard to jurisdictional claims in published maps and institutional affiliations.
We would like to thank Andrew Dawson for creating the gridfill and windspharm python packages. The support from ETH to Jake W. Casselman and support from the Swiss National Science Foundation to Daniela I. V. Domeisen is gratefully acknowledged. The authors also thank the European Research Council (ERC) for the funding.
The work of Jake W. Casselman is funded through ETH Zürich Foundation (grant no. ETH-17 18-1). This project has received funding from the European Research Council (ERC) under the European Union's Horizon 2020 research and innovation program (grant agreement no. 847456). Daniela I. V. Domeisen has been supported by the Swiss National Science Foundation through projects PP00P2_170523 and PP00P2_198896.
This paper was edited by William Roberts and reviewed by two anonymous referees.
Ayarzagüena, B., Ineson, S., Dunstone, N. J., Baldwin, M. P., and Scaife, A. A.: Intraseasonal Effects of El Niño–Southern Oscillation on North Atlantic Climate, J. Climate, 31, 8861–8873, https://doi.org/10.1175/JCLI-D-18-0097.1, 2018. a
Baker, H. S., Woollings, T., Forest, C. E., and Allen, M. R.: The linear sensitivity of the north atlantic oscillation and eddy-driven jet to SSTs, J. Climate, 32, 6491–6511, https://doi.org/10.1175/JCLI-D-19-0038.1, 2019. a
Barsugli, J. J. and Battisti, D. S.: The basic effects of atmosphere-ocean thermal coupling on midlatitude variability, J. Atmos. Sci., 55, 477–493, https://doi.org/10.1175/1520-0469(1998)055<0477:TBEOAO>2.0.CO;2, 1998. a
Bayr, T., Domeisen, D. I., and Wengel, C.: The effect of the equatorial Pacific cold SST bias on simulated ENSO teleconnections to the North Pacific and California, Clim. Dynam., 53, 3771–3789, https://doi.org/10.1007/s00382-019-04746-9, 2019. a
Brönnimann, S.: Impact of El Niño–Southern Oscillation on European climate, Rev. Geophys., 45, RG3003, https://doi.org/10.1029/2006RG000199, 2007. a
Brönnimann, S., Xoplaki, E., Casty, C., Pauling, A., and Luterbacher, J.: ENSO influence on Europe during the last centuries, Clim. Dynam., 28, 181–197, https://doi.org/10.1007/s00382-006-0175-z, 2007. a
Buckland, S. T. and Noreen, E. W.: Computer-Intensive Methods for Testing Hypotheses, Biometrics, 46, 540–541, https://doi.org/10.2307/2531461, 1990. a
Bulić, I. H. and Kucharski, F.: Delayed ENSO impact on spring precipitation over North/Atlantic European region, Clim. Dynam., 38, 2593–2612, https://doi.org/10.1007/s00382-011-1151-9, 2012. a
Butler, A. H., Polvani, L. M., and Deser, C.: Separating the stratospheric and tropospheric pathways of El Niño–Southern Oscillation teleconnections, Environ. Res. Lett., 9, 024014, https://doi.org/10.1088/1748-9326/9/2/024014, 2014. a
Cai, W., Santoso, A., Collins, M., Dewitte, B., Karamperidou, C., Kug, J. S., Lengaigne, M., McPhaden, M. J., Stuecker, M. F., Taschetto, A. S., Timmermann, A., Wu, L., Yeh, S. W., Wang, G., Ng, B., Jia, F., Yang, Y., Ying, J., Zheng, X. T., Bayr, T., Brown, J. R., Capotondi, A., Cobb, K. M., Gan, B., Geng, T., Ham, Y. G., Jin, F. F., Jo, H. S., Li, X., Lin, X., McGregor, S., Park, J. H., Stein, K., Yang, K., Zhang, L., and Zhong, W.: Changing El Niño–Southern Oscillation in a warming climate, Nature Reviews Earth & Environment, 2, 628–644, https://doi.org/10.1038/s43017-021-00199-z, 2021. a
Casselman, J. W., Taschetto, A. S., and Domeisen, D. I.: Non-linearity in the pathway of El Niño-Southern Oscillation to the tropical North Atlantic, J. Climate, 34, 7277–7296, https://doi.org/10.1175/jcli-d-20-0952.1, 2021. a, b, c, d, e, f, g, h, i
Cassou, C., Terray, L., and Phillips, A. S.: Tropical Atlantic influence on European heat waves, J. Climate, 18, 2805–2811, https://doi.org/10.1175/JCLI3506.1, 2005. a
Choi, Y. W. and Ahn, J. B.: Possible mechanisms for the coupling between late spring sea surface temperature anomalies over tropical Atlantic and East Asian summer monsoon, Clim. Dynam., 53, 6995–7009, https://doi.org/10.1007/s00382-019-04970-3, 2019. a, b, c, d
Czaja, A., van der Vaart, P., and Marshall, J.: A diagnostic study of the role of remote forcing in tropical Atlantic variability, J. Climate, 15, 3280–3290, https://doi.org/10.1175/1520-0442(2002)015<3280:ADSOTR>2.0.CO;2, 2002. a
Dawson, A.: Windspharm: A High-Level Library for Global Wind Field Computations Using Spherical Harmonics, Journal of Open Research Software, 4, e31, https://doi.org/10.5334/jors.129, 2016. a
Devore, J. L.: Probability and Statistics for Engineering and the Sciences, Biometrics, 47, 1638–1638, https://doi.org/10.2307/2532427, 1991. a
Ding, Q., Wang, B., Wallace, J. M., and Branstator, G.: Tropical-extratropical teleconnections in boreal summer: Observed interannual variability, J. Climate, 24, 1878–1896, https://doi.org/10.1175/2011JCLI3621.1, 2011. a
Domeisen, D. I. V., Butler, A. H., Fröhlich, K., Bittner, M., Müller, W. A., and Baehr, J.: Seasonal Predictability over Europe Arising from El Niño and Stratospheric Variability in the MPI-ESM Seasonal Prediction System, J. Climate, 28, 256–271, https://doi.org/10.1175/JCLI-D-14-00207.1, 2015. a
Domeisen, D. I. V., Garfinkel, C. I., and Butler, A. H.: The Teleconnection of El Niño Southern Oscillation to the Stratosphere, Rev. Geophys., 57, 5–47, https://doi.org/10.1029/2018RG000596, 2019. a
Enfield, D. B. and Mayer, D. A.: Tropical atlantic sea surface temperature variability and its relation to El Niño-Southern Oscillation, J. Geophys. Res., 102, 929–945, https://doi.org/10.1029/96jc03296, 1997. a
Feng, J., Chen, W., and Li, Y.: Asymmetry of the winter extra-tropical teleconnections in the Northern Hemisphere associated with two types of ENSO, Clim. Dynam., 48, 2135–2151, https://doi.org/10.1007/s00382-016-3196-2, 2017. a
Fletcher, C. G. and Cassou, C.: The dynamical influence of separate teleconnections from the Pacific and Indian oceans on the northern annular mode, J. Climate, 28, 7985–8002, https://doi.org/10.1175/JCLI-D-14-00839.1, 2015. a
Fraedrich, K.: An ENSO impact on Europe?, Tellus A, 46, 541–552, https://doi.org/10.3402/tellusa.v46i4.15643, 1994. a
Fraedrich, K. and Müller, K.: Climate anomalies in Europe associated with ENSO extremes, Int. J. Climatol., 12, 25–31, https://doi.org/10.1002/joc.3370120104, 1992. a
Frauen, C., Dommenget, D., Tyrrell, N., Rezny, M., and Wales, S.: Analysis of the nonlinearity of El Niño-Southern Oscillation teleconnections, J. Climate, 27, 6225–6244, https://doi.org/10.1175/JCLI-D-13-00757.1, 2014. a
García-Serrano, J., Losada, T., and Rodríguez-Fonseca, B.: Extratropical Atmospheric Response to the Atlantic Niño Decaying Phase, J. Climate, 24, 1613–1625, https://doi.org/10.1175/2010JCLI3640.1, 2011. a
García-Serrano, J., Cassou, C., Douville, H., Giannini, A., and Doblas-Reyes, F. J.: Revisiting the ENSO teleconnection to the tropical North Atlantic, J. Climate, 30, 6945–6957, https://doi.org/10.1175/JCLI-D-16-0641.1, 2017. a, b, c
Gill, A. E.: Some simple solutions for heat-induced tropical circulation, Q. J. Roy. Meteorol. Soc., 106, 447–462, https://doi.org/10.1002/qj.49710644905, 1980. a, b, c
Graham, N. E. and Barnett, T. P.: Sea surface temperature, surface wind divergence, and convection over tropical oceans, Science, 238, 657–659, https://doi.org/10.1126/science.238.4827.657, 1987. a
Gudgel, R. G., Rosati, A., and Gordon, C. T.: The sensitivity of a coupled atmospheric-oceanic GCM to prescribed low-level clouds over the ocean and tropical landmasses, Mon. Weather Rev., 129, 2103–2115, https://doi.org/10.1175/1520-0493(2001)129<2103:TSOACA>2.0.CO;2, 2001. a
Hardiman, S. C., Dunstone, N. J., Scaife, A. A., Smith, D. M., Ineson, S., Lim, J., and Fereday, D.: The Impact of Strong El Niño and La Niña Events on the North Atlantic, Geophys. Res. Lett., 46, 2874–2883, https://doi.org/10.1029/2018GL081776, 2019. a, b, c
Huang, B., Banzon, V. F., Freeman, E., Lawrimore, J., Liu, W., Peterson, T. C., Smith, T. M., Thorne, P. W., Woodruff, S. D., and Zhang, H. M.: Extended reconstructed sea surface temperature version 4 (ERSST.v4). Part I: Upgrades and intercomparisons, J. Climate, 28, 911–930, https://doi.org/10.1175/JCLI-D-14-00006.1, 2015a. a
Huang, B., Banzon, V. F., Freeman, E., Lawrimore, J., Liu, W., Peterson, T. C., Smith, T. M., Thorne, P. W., Woodruff, S. D., and Zhang, H. M.: Extended Reconstructed Sea Surface Temperature (ERSST), Version 4, NOAA National Centers for Environmental Information [data set], https://doi.org/10.7289/V5KD1VVF, 2015b. a
Izumo, T., Vialard, J., Lengaigne, M., De Boyer Montegut, C., Behera, S. K., Luo, J. J., Cravatte, S., Masson, S., and Yamagata, T.: Influence of the state of the Indian Ocean Dipole on the following years El Niño, Nat. Geosci., 3, 168–172, https://doi.org/10.1038/ngeo760, 2010. a
Japan Meteorological Agency: JRA-55: Japanese 55-year Reanalysis, Monthly Means and Variances, Research Data Archive at the National Center for Atmospheric Research, Computational and Information Systems Laboratory [data set], Boulder, CO, https://doi.org/10.5065/D60G3H5B, 2013. a
Jiang, L. and Li, T.: Relative roles of El Niño-induced extratropical and tropical forcing in generating Tropical North Atlantic (TNA) SST anomaly, Clim. Dynam., 53, 3791–3804, https://doi.org/10.1007/s00382-019-04748-7, 2019. a
Jiménez-Esteve, B. and Domeisen, D. I. V.: The tropospheric pathway of the ENSO-North Atlantic teleconnection, J. Climate, 31, 4563–4584, https://doi.org/10.1175/JCLI-D-17-0716.1, 2018. a, b
Jiménez-Esteve, B. and Domeisen, D. I. V.: Nonlinearity in the tropospheric pathway of ENSO to the North Atlantic, Weather Clim. Dynam., 1, 225–245, https://doi.org/10.5194/wcd-1-225-2020, 2020. a, b, c, d, e
Joshi, M. K., Abid, M. A., and Kucharski, F.: The Role of an Indian Ocean Heating Dipole in the ENSO Teleconnection to the North Atlantic European Region in Early Winter during the Twentieth Century in Reanalysis and CMIP5 Simulations, J. Climate, 34, 1047–1060, https://doi.org/10.1175/JCLI-D-20-0269.1, 2021. a
Jung, O., Sung, M. K., Sato, K., Lim, Y. K., Kim, S. J., Baek, E. H., Jeong, J. H., and Kim, B. M.: How does the SST variability over the western North Atlantic Ocean control Arctic warming over the Barents-Kara Seas?, Environ. Res. Lett., 12, 034021, https://doi.org/10.1088/1748-9326/aa5f3b, 2017. a, b
King, J. A., Washington, R., and Engelstaedter, S.: Representation of the Indian Ocean Walker circulation in climate models and links to Kenyan rainfall, Int. J. Climatol., 41, E616–E643, https://doi.org/10.1002/joc.6714, 2021. a
Kobayashi, S., Ota, Y., Harada, Y., Ebita, A., Moriya, M., Onoda, H., Onogi, K., Kamahori, H., Kobayashi, C., Endo, H., Miyaoka, K., and Kiyotoshi, T.: The JRA-55 reanalysis: General specifications and basic characteristics, J. Meteorol. Soc. Jpn., 93, 5–48, https://doi.org/10.2151/jmsj.2015-001, 2015. a
Lee, S.-K., Enfield, D. B., and Wang, C.: Why do some El Niños have no impact on tropical North Atlantic SST?, Geophys. Res. Lett., 35, L16705, https://doi.org/10.1029/2008GL034734, 2008. a
Lee, S. K., Wang, C., and Mapes, B. E.: A simple atmospheric model of the local and teleconnection responses to tropical heating anomalies, J. Climate, 22, 272–284, https://doi.org/10.1175/2008JCLI2303.1, 2009. a
Li, G., Chen, J., Wang, X., Luo, X., Yang, D., Zhou, W., Tan, Y., and Yan, H.: Remote impact of North Atlantic sea surface temperature on rainfall in southwestern China during boreal spring, Clim. Dynam., 50, 541–553, https://doi.org/10.1007/s00382-017-3625-x, 2018. a, b, c
Li, J. and Wang, J. X.: A new North Atlantic Oscillation index and its variability, Adv. Atmos. Sci., 20, 661–676, https://doi.org/10.1007/bf02915394, 2003. a
Lim, Y. K.: The East Atlantic/West Russia (EA/WR) teleconnection in the North Atlantic: climate impact and relation to Rossby wave propagation, Clim. Dynam., 44, 3211–3222, https://doi.org/10.1007/s00382-014-2381-4, 2015. a, b, c
Lledó, L., Cionni, I., Torralba, V., Bretonniere, P. A., and Samsó, M.: Seasonal prediction of Euro-Atlantic teleconnections from multiple systems, Environ. Res. Lett., 15, 074009, https://doi.org/10.1088/1748-9326/ab87d2, 2020. a, b, c
Maher, P., Vallis, G. K., Sherwood, S. C., Webb, M. J., and Sansom, P. G.: The Impact of Parameterized Convection on Climatological Precipitation in Atmospheric Global Climate Models, Geophys. Res. Lett., 45, 3728–3736, https://doi.org/10.1002/2017GL076826, 2018. a
Matsumura, S. and Kosaka, Y.: Arctic–Eurasian climate linkage induced by tropical ocean variability, Nat. Commun., 10, 4–6, https://doi.org/10.1038/s41467-019-11359-7, 2019. a
Mezzina, B., García-Serrano, J., Bladé, I., and Kucharski, F.: Dynamics of the ENSO teleconnection and NAO variability in the North Atlantic–European late winter, J. Climate, 33, 907–923, https://doi.org/10.1175/JCLI-D-19-0192.1, 2020. a, b
Michel, C. and Rivière, G.: The link between rossby wave breakings and weather regime transitions, J. Atmos. Sci., 68, 1730–1748, https://doi.org/10.1175/2011JAS3635.1, 2011. a
Neddermann, N. C., Müller, W. A., Dobrynin, M., Düsterhus, A., and Baehr, J.: Seasonal predictability of European summer climate re-assessed, Clim. Dynam., 53, 3039–3056, https://doi.org/10.1007/s00382-019-04678-4, 2019. a, b
Okumura, Y., Xie, S.-P., Numaguti, A., and Tanimoto, Y.: Tropical Atlantic air-sea interaction and its influence on the NAO, Geophys. Res. Lett., 28, 1507–1510, https://doi.org/10.1029/2000GL012565, 2001. a
Osborne, J. W. and Waters, E.: Four assumptions of multiple regression that researchers should always test, Practical Assessment, Research and Evaluation, 8, 2, https://doi.org/10.7275/r222-hv23, 2003. a
Parfitt, R., Czaja, A., Minobe, S., and Kuwano-Yoshida, A.: The atmospheric frontal response to SST perturbations in the Gulf Stream region, Geophys. Res. Lett., 43, 2299–2306, https://doi.org/10.1002/2016GL067723, 2016. a
Peng, S., Robinson, W. A., and Li, S.: Mechanisms for the NAO responses to the North Atlantic SST tripole, J. Climate, 16, 1987–2004, https://doi.org/10.1175/1520-0442(2003)016<1987:MFTNRT>2.0.CO;2, 2003. a
Rieke, O., Greatbatch, R. J., and Gollan, G.: Nonstationarity of the link between the Tropics and the summer East Atlantic pattern, Atmos. Sci. Lett., 22, 1–9, https://doi.org/10.1002/asl.1026, 2021. a, b
Rodríguez-Fonseca, B., Suárez-Moreno, R., Ayarzagüena, B., López-Parages, J., Gómara, I., Villamayor, J., Mohino, E., Losada, T., and Castaño-Tierno, A.: A review of ENSO influence on the North Atlantic. A non-stationary signal, Atmosphere, 7, 87, https://doi.org/10.3390/atmos7070087, 2016. a
Rojo Hernández, J. D. and Mesa, Ó. J.: A Simple Conceptual Model for the Heat Induced Circulation over Northern South America and Meso-America, Atmosphere, 11, 1235, https://doi.org/10.3390/atmos11111235, 2020. a, b
Sabin, T. P., Babu, C. A., and Joseph, P. V.: SST-convection relation over tropical oceans, Int. J. Climatol., 33, 1424–1435, https://doi.org/10.1002/joc.3522, 2013. a
Saeed, S., Van Lipzig, N., Müller, W. A., Saeed, F., and Zanchettin, D.: Influence of the circumglobal wave-train on European summer precipitation, Clim. Dynam., 43, 503–515, https://doi.org/10.1007/s00382-013-1871-0, 2014. a
Sardeshmukh, P. D. and Hoskins, B. J.: The generation of global rotational flow by steady idealized tropical divergence, J. Atmos. Sci., 45, 1228–1251, https://doi.org/10.1175/1520-0469(1988)045<1228:TGOGRF>2.0.CO;2, 1988. a
Scaife, A. A., Comer, R. E., Dunstone, N. J., Knight, J. R., Smith, D. M., MacLachlan, C., Martin, N., Peterson, K. A., Rowlands, D., Carroll, E. B., Belcher, S., and Slingo, J.: Tropical rainfall, Rossby waves and regional winter climate predictions, Q. J. Roy. Meteor. Soc., 143, 1–11, https://doi.org/10.1002/qj.2910, 2017. a
Simpson, I. R. and Polvani, L. M.: Revisiting the relationship between jet position, forced response, and annular mode variability in the southern midlatitudes, Geophys. Res. Lett., 43, 2896–2903, https://doi.org/10.1002/2016GL067989, 2016. a
Sung, M.-K., Ham, Y.-G., Kug, J.-S., and An, S.-I.: An alterative effect by the tropical North Atlantic SST in intraseasonally varying El Niño teleconnection over the North Atlantic, Tellus A, 65, 19863, https://doi.org/10.3402/tellusa.v65i0.19863, 2013. a
Taschetto, A. S., Rodrigues, R. R., Meehl, G. A., McGregor, S., and England, M. H.: How sensitive are the Pacific–tropical North Atlantic teleconnections to the position and intensity of El Niño-related warming?, Clim. Dynam., 46, 1841–1860, https://doi.org/10.1007/s00382-015-2679-x, 2016. a
Thomson, S. I. and Vallis, G. K.: Atmospheric response to SST anomalies. Part I: Background-state dependence, teleconnections, and local effects in winter, J. Atmos. Sci., 75, 4107–4124, https://doi.org/10.1175/JAS-D-17-0297.1, 2018a. a
Thomson, S. I. and Vallis, G. K.: Atmospheric response to SST anomalies. Part II: Background-state dependence, teleconnections, and local effects in summer, J. Atmos. Sci., 75, 4125–4138, https://doi.org/10.1175/JAS-D-17-0298.1, 2018b. a
Toniazzo, T. and Scaife, A. A.: The influence of ENSO on winter North Atlantic climate, Geophys. Res. Lett., 33, 1–5, https://doi.org/10.1029/2006GL027881, 2006. a
Vallis, G. K., Colyer, G., Geen, R., Gerber, E., Jucker, M., Maher, P., Paterson, A., Pietschnig, M., Penn, J., and Thomson, S. I.: Isca, v1.0: a framework for the global modelling of the atmospheres of Earth and other planets at varying levels of complexity, Geosci. Model Dev., 11, 843–859, https://doi.org/10.5194/gmd-11-843-2018, 2018 (data available at: https://github.com/ExeClim/Isca, last access: May 2020). a, b
Wang, C.: Atlantic climate variability and its associated atmospheric circulation cells, J. Climate, 15, 1516–1536, https://doi.org/10.1175/1520-0442(2002)015<1516:ACVAIA>2.0.CO;2, 2002. a
Wang, C., Enfield, D. B., Lee, S.K., and Landsea, C. W.: Influences of the Atlantic warm pool on western hemisphere summer rainfall and Atlantic hurricanes, J. Climate, 19, 3011–3028, https://doi.org/10.1175/JCLI3770.1, 2006. a, b
Wang, C., Lee, S. K., and Mechoso, C. R.: Interhemispheric influence of the Atlantic warm pool on the Southeastern pacific, J. Climate, 23, 404–418, https://doi.org/10.1175/2009JCLI3127.1, 2010. a
Wu, Z. and Lin, H.: Interdecadal variability of the ENSO-North Atlantic Oscillation connection in boreal summer, Q. J. Roy. Meteor. Soc., 138, 1668–1675, https://doi.org/10.1002/qj.1889, 2012. a
Wulff, C. O., Greatbatch, R. J., Domeisen, D. I. V., Gollan, G., and Hansen, F.: Tropical Forcing of the Summer East Atlantic Pattern, Geophys. Res. Lett., 44, 166–11, https://doi.org/10.1002/2017GL075493, 2017. a, b, c, d, e, f, g
Yu, B., Zwiers, F. W., Boer, G. J., and Ting, M. F.: Structure and variances of equatorial zonal circulation in a multimodel ensemble, Clim. Dynam., 39, 2403–2419, https://doi.org/10.1007/s00382-012-1372-6, 2012. a
Zhao, Y., Zheng, Z., Zhi, R., Feng, G., and Cheng, J.: The zonal gradient structures of wintertime SST anomalies in the equatorial Pacific and their connection to the Walker circulation, Clim. Dynam., 58, 841–859, https://doi.org/10.1007/s00382-021-05939-x, 2021. a
Zhong, A., Hendon, H. H., and Alves, O.: Indian Ocean variability and its association with ENSO in a global coupled model, J. Climate, 18, 3634–3649, https://doi.org/10.1175/JCLI3493.1, 2005. a